Improving Organizational Risk Management Practice
19
Improving Organizational Risk Management Practice Improving Organizational Risk Management Practice Mansoor Faridi Fort Hays State University November 9, 2014 Author Note Mansoor Faridi, Department of Informatics, Fort Hays State University. Mansoor Faridi is a graduate student at Fort Hays State University specializing in Information Assurance Management. He lives in Toronto, Canada where he manages the Compliance function for a major Canadian Financial Institution. This research paper is a deliverable for Information Risk Management (INT885) course. Correspondence concerning this paper should be addressed to Mansoor Faridi. Contact: [[email protected]]
-
Upload
mansoor-faridi-cisa -
Category
Documents
-
view
267 -
download
1
Transcript of Improving Organizational Risk Management Practice

Improving Organizational Risk Management Practice
Improving Organizational Risk Management Practice
Mansoor Faridi
Fort Hays State University
November 9, 2014
Author Note
Mansoor Faridi, Department of Informatics, Fort Hays State University.
Mansoor Faridi is a graduate student at Fort Hays State University specializing in
Information Assurance Management. He lives in Toronto, Canada where he manages the
Compliance function for a major Canadian Financial Institution.
This research paper is a deliverable for Information Risk Management (INT885) course.
Correspondence concerning this paper should be addressed to Mansoor Faridi.
Contact: [[email protected]]

Improving Organizational Risk Management Practice ii
Table of Contents
Abstract .......................................................................................................................................1
Introduction ..................................................................................................................................2
Assessment Methodology ............................................................................................................3
Population and Sampling .................................................................................................4
Artifact Selection .............................................................................................................5
Tools ................................................................................................................................6
Qualitative Analysis .........................................................................................................6
Quantitative Analysis .......................................................................................................7
Results ..............................................................................................................................8
Significance for the Risk Management Professional ...................................................................8
Summary ......................................................................................................................................9
References ..................................................................................................................................11
Appendices
Appendix A – CMMI Certification
Appendix B – List of SDLC Artifacts examined
Appendix C – 2012 vs. 2013 Risk Assessment Sample
Appendix D – Risk Assessment Tools
Appendix E – 2012 vs. 2013 Risk Management Practice Implementation Level

Improving Organizational Risk Management Practice 1
Abstract
This research paper discusses the challenges faced by a Financial Institution (FI) with regard to
its risk management practice. It focuses on the assessment methodology used to perform both
qualitative and quantitative analysis in order to identify weaknesses and improve the
organizational risk management practice. Several weaknesses were identified through
compliance activities and mandatory appraisals, with risk implementation level at 48% (as of
December 2012). Management set out to address the identified weaknesses by implementing
various initiatives within a specified timeframe of twelve months. First, a baseline of the risk
implementation level was developed, a 50% improvement target set, and a plan to re-baseline in
order to determine if management’s initiatives yielded any positive results. Management’s multi-
pronged response included rolling out risk management training, improving artifacts that capture
risk, proactive staff engagement, and implementing process improvements. Resultantly, the
initiatives paid off in the form of an improved risk practice implementation level at 79%, across
the AS organization (as of December 2013).
Keywords: appraisal, assessment, artifacts, audit, baseline, cmmi, compliance, faridi, fhsu,
financial institution, information assurance, multivariate analysis, process improvement, project
management, qualitative risk, quantitative risk, risk, risk analysis, risk assessment, risk impact,
risk management, risk practice, risk taxonomy, risk trigger, sdlc, threat, vulnerability

Improving Organizational Risk Management Practice 2
Improving Organizational Risk Management Practice
Mansoor Faridi
Fort Hays State University
Introduction
This research paper discusses the challenges faced by a real-life Financial Institution (FI)
vis-à-vis its risk management practice and various actions initiated by management to improve
risk management practice. The focus of this discussion is around the assessment methodology
used for both the qualitative and the quantitative analysis of the risk management practice. It is
important to note that throughout this project, we enjoyed senior management’s support which
was imperative in ensuring that sufficient resources will be committed throughout this project,
and more importantly to set the tone at the ‘Top’; which essentially drove the perception (and
support) across the organization regarding the importance of our business critical activities.
In September 2012, as part of periodic compliance activities and Standard CMMI
Appraisal Method (SCAMPI-C) (Capability, 2014; CMMI, 2014), risk management practice was
called out as a weakness that this organization needed to address. As part of the strategy to
address this weakness, an organizational assessment of risk management practice (See Appendix
A, Note 1) was conducted and baseline developed (in December 2012) to understand strengths
and weaknesses. The risk practice implementation level was 48%. A minimum of 50%
improvement objective was laid out for 2013; that is, 72% risk practice implementation level by
Q4-2013.
In the preparation of this paper, extensive literature review was conducted and general
trends and themes highlighted relating to the assessment methodology discussed. As a result,
general trends, themes and specific research points were identified and weaved throughout the
length of this paper. Lastly, the discussion concludes by highlighting the significance that proper

Improving Organizational Risk Management Practice 3
risk management holds for current and future risk management professionals along with a brief
conclusion.
Assessment Methodology
Right tools and methodology are as essential to gauge the effectiveness of risk
management practice as the design of the risk management process itself. There are many
standard industry approaches (TIIA, 2014, p. 10) available, however, they each offer a different
perspective on the effectiveness of risk management process in an organization. Also, adoption
of more than one approach can yield the most informative and useful results. Hence, in keeping
with this philosophy, we developed a hybrid approach to assess organizational risk management
practice in a structured manner. The reason behind formalizing a hybrid approach was to better
respond to the issues specific to our organization while ensuring a holistic review of relevant
documentary evidence.
Firstly, risk taxonomy was developed and relevant key SDLC artifacts identified that
capture risk in various phases of project life cycle. This was followed by sampling a number of
projects from in-scope Business Units (BUs) to analyze relevant key artifacts for closer
examination. The analysis was both qualitative and quantitative in nature. According to Landoll
(2006, p. 427), any given method for performing a risk assessment may be ideal for one situation
but not for others, hence it was decided to customize the technique by developing a hybrid
approach that leveraged both qualitative and quantitative techniques to determine the overall risk
implementation level effectively.
Quantitative analysis was intended to capture and present an objective insight into the
risk assessment activities, whereas, qualitative analysis was performed by a panel of experts
where their expert opinions were sought on the merit of risk assessment performed after

Improving Organizational Risk Management Practice 4
analyzing key artifacts in granular detail. The qualitative analysis also helped with identifying
gaps and opportunities for improvements.
Finally, results and observations produced as a result of these analyses were tabulated,
evaluated, interpreted and reported in a summarized fashion.
Population and Sampling
According to an investigative 2002 scholarly study (Hall et al.) dealing with sampling
practices of audit professionals in public accounting, industry and government, the sampling
rationale was inconclusive. Their research involved multivariate control variables and took all
relevant factors into account. They concluded that sampling methodology is purely proprietary
and random in nature with no established industry standards; practitioners sample as per the
guidelines provided by their employers and professional practices. However, it was also noted
that a higher number of respondents with post-college education and professional experience
leaned towards statistical sampling methods when compared to their counterparts with no college
education (This finding asserts the enhanced analytical ability associated with higher learning).
Hence, keeping this research in view, the sampling methodology used in our assessment was
hybrid in nature, driven by our collective experience and systematic approach (Albandoz, 2001),
while providing adequate coverage to various criteria, such as overall coverage, in-scope BUs,
and projects of all sizes. Furthermore, based on our organizational needs, assessment team
sample @ 10% of various sized projects from in-scope BUs that were in different stages of their
life cycle, except Concept and Close (See Appendix C).
Projects from Concept and Close phases were not sampled because few artifacts have
been developed to review up until Concept phase and feedback will not mean much if a project is
in Close phase and project team disbanded. In December 2012, a total of 22 projects were
Improving Organizational Risk Management Practice 5
sampled (population = 220) and in 2013 a total of 24 projects were sampled (population = 240)
for review.
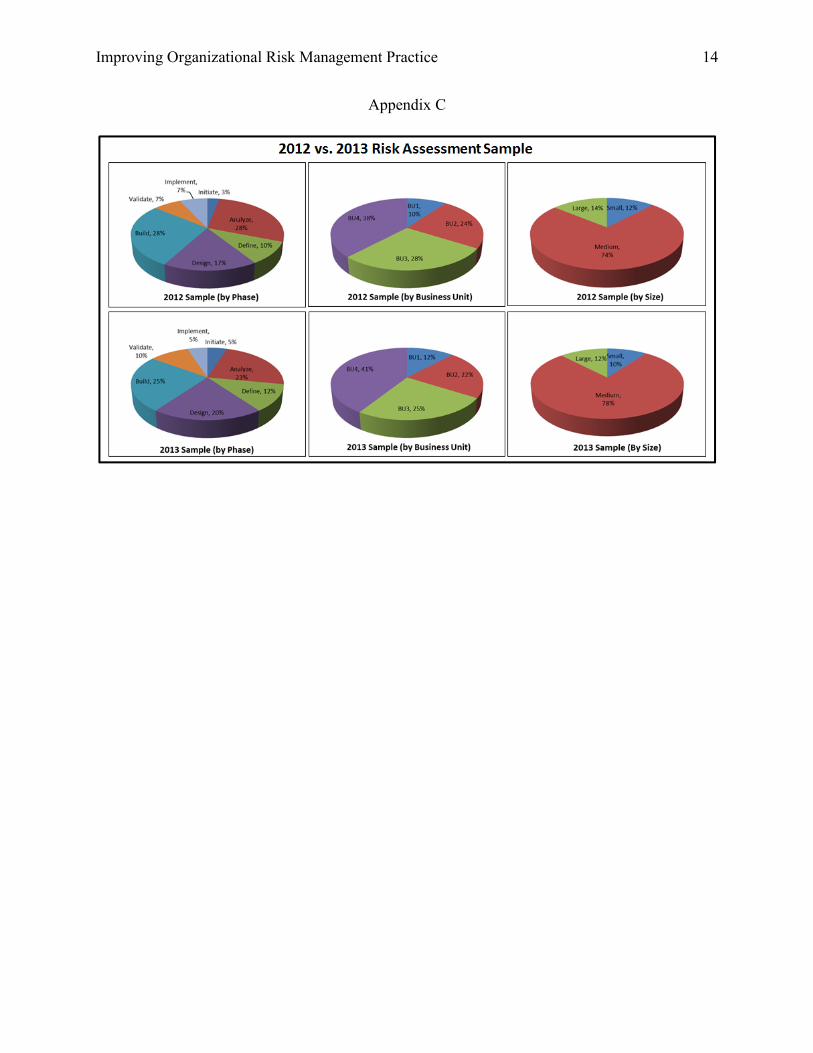
It was deemed important by the assessment team to sample at a similar rate (in both 2012
and 2013) in order to compare 'apples with apples'. As shown in Appendix C, our stratified
sample pattern highlights the similarities in the percentage of sampled projects (by Phase, by BU,
and by Size). Also, the largest proportion of sampled projects (by Size) are medium-sized
projects, which correlates with the total number of medium-sized projects in the project
population.
Artifact Selection
Specialized industry literature (TIIA, 2014, p. 13) was reviewed which emphasized the
need for a holistic approach to assess organizational risk management practice (and associated
documentary evidence). It advocated developing an integrated risk management strategy by
examining all sources of risk identification & communication, risk monitoring and controlling
procedures, and determining if adequate resources are assigned to treat risks. To keep this
assessment inclusive and holistic, a risk taxonomy was developed which identified and classified
key SDLC artifacts deemed as important ‘assets’ for project’s risk assessment activities. These
13 assets were deemed critical documents which captured risks at various stages (See Appendix
B, Note 1) of project life cycle. These key artifacts were developed and maintained by different
practices (See Appendix B, Note 2) throughout project’s life cycle. We were also able to
determine the effectiveness of risk assessment activities (by Practice), as well as opportunities
for improvements, because artifacts were mapped with the practice responsible for its delivery.
Tools

Improving Organizational Risk Management Practice 6
Custom tools were developed in MS-Excel application to record result and observations
of both qualitative and quantitative analysis (See Appendix D, Figures 1-3). Same application
was used to summarize results in the form of graphs which complemented final
recommendations. Item Nos. 1 – 17 (See Appendix D, Figure 1) were used to record the
observations during quantitative analysis and items nos. 18 – 22 (See Appendix D, Figure 1)
were used to record the observations obtained during qualitative analysis.
Qualitative Analysis
After selecting 2012 and 2013 project samples, we completed the checklist template (See
Appendix D, Figure 1) while we qualitatively analyzed each project’s in-scope artifacts. An
important decision was around which risk assessment technique (e.g. OCTAVE, CRAMM,
FRAPP) to use as listed in Landoll (2006, p. 428). We decided to leverage the industry
frameworks and technique and developed a hybrid technique that kept the quantitative results in
view while performing qualitative analysis. An important decision was to determine the mode of
this qualitative analysis. As output, we wanted to inventory expert opinion based on detailed
examination and discussion amongst the project team as results were to be expressed in
management specific language and assets were not numerical in nature, and it was not necessary
to quantify threat frequency (SANS, 2013), Therefore, for items 18-22 (See Appendix D, Figure
1) column was completed with our subjective observations, which were later collated to draw out
trends for further analysis. Item numbers 18 – 22 were analyzed in a qualitative way to
determine:
If risks are being communicated in the Weekly Status Report. This was achieved by
reviewing the quality of risks reported on the Weekly Status Report (item 18).

Improving Organizational Risk Management Practice 7
If risks are placed in the Risk Log in advance of them being reported in Project
Dashboard. This was achieved by reviewing the quality of risks reported on the Weekly
Status Report (item 18, 19, 22).
If risks are being confused with issues, or vice versa. This was achieved by reviewing the
Risk Log (item 20, 21).
If Action Plans in the Risk Log are clear. This was achieved by reviewing the Risk Log
(item 20, 21).
If Risk Log is being used effectively to describe, prioritize and track risks? This was
achieved by reviewing the Risk Log (item 21).
Timeliness and accuracy of reported risks were also determined by cross-referencing the
risk status of the constraints (i.e. time, cost and scope) displayed on the Weekly Status Report
with risks captured on the Risk Log and displayed on Project Dashboard.
Quantitative Analysis
Using the template (See Appendix D, Figure 2), items 1 – 17 were examined in a
quantitative manner to determine if the risks captured on various artifacts were transferred to the
Risk Log or not. The observations and responses captured during quantitative analysis of
artifacts for all projects were tabulated as either S (Satisfactory), U (unsatisfactory) or N (Not
applicable) – See Appendix D, Figure 2. The tabulated results were used to generate a bar chart
(See Appendix D, Figure 3).
This straight-forward approach was suitable for the purpose in question where we were
solely trying to determine if the risks recorded in corresponding artifacts and whether they were
subsequently transferred to the central Risk Log (Gregory, 2010). The risks recorded in these

Improving Organizational Risk Management Practice 8
artifacts were not examined qualitatively since artifacts Nos. 18-22 (See Appendix D, Figure 1)
were deemed more apt for the task of qualitative analysis.
Results
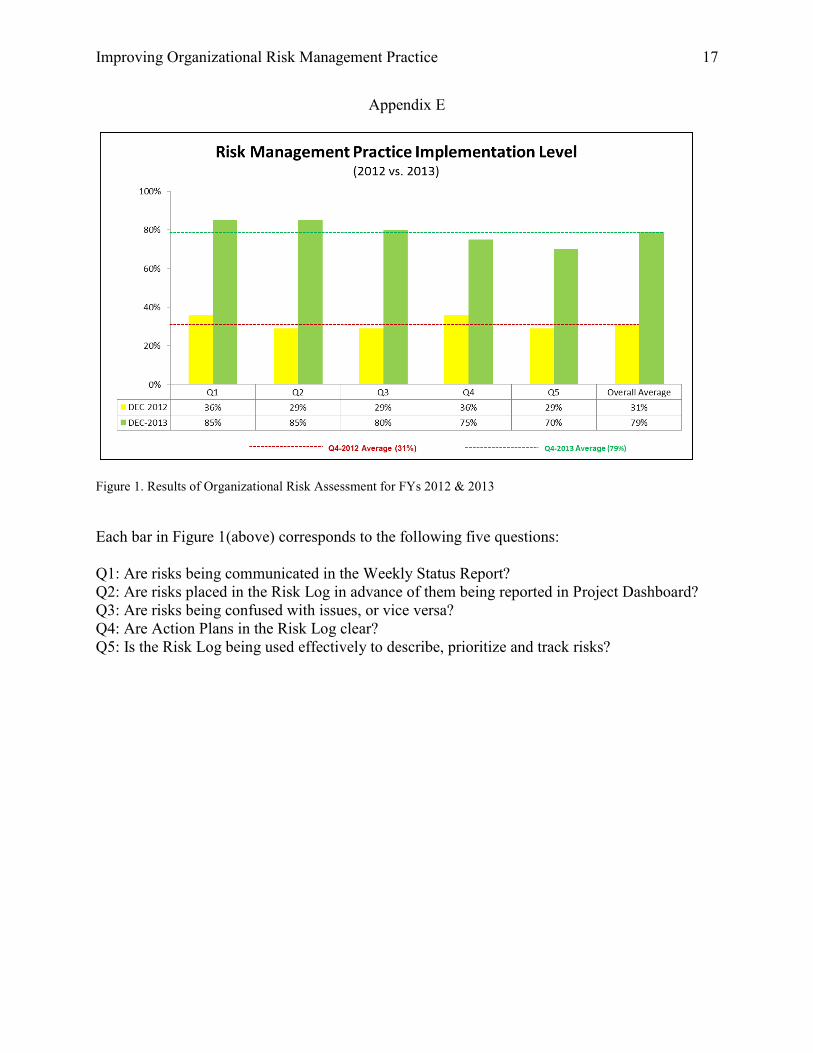
By analyzing both gaps and strengths via assessment’s qualitative observations, a bar
graph was generated summarizing overall results of Organizational Risk Assessments for both
fiscal years 2012 and 2013 (Appendix E, Figure 1).
Yellow colored bars represent the overall risk implementation level as of December 2012
in terms of percentage and Green colored bars represent the same variable with improvements
noted. By looking at Figure 1 (Appendix E), it can be determined that overall, things have
significantly improved, however, opportunities for improvement still exist in the areas of ‘Action
Plans’ (Q4) and ‘Risk Management Tracking’ (Q5).
In summary, overall risk management implementation level stood at 79 as if December
2013. This 65% improvement over the twelve month period exceeded the 50% target
improvement!
Significance for the Risk Management Professional
This organizational risk assessment carries a great deal of importance for current and
future risk management professionals (within and outside of this organization). As a result of this
assessment:
Risk Management processes and tools were improved.
Risk Management training sessions were delivered to all practices.
Focused audit activities around organizational risk management practice were conducted.
Stakeholders were engaged to assess and improve risk management practice within BUs.
Risk Management Guidelines document was published on intranet.

Improving Organizational Risk Management Practice 9
Highlighted a structured strategy to plan and execute this overall assessment.
Firstly, this exercise highlighted the fact that without any formal assessments, the risk
management practice was deemed satisfactory by all stakeholders. However, the focused
approach using both qualitative and quantitative analysis helped highlight weaknesses,
opportunities for improvements and areas that required strengthening.
Secondly, this exercise helped in reinforcing the need for continuous risk management on
an ongoing basis throughout the project life cycle. In addition, other practices can also benefit
from a similar assessment specifically tailored to examine their own key artifacts.
Thirdly, effectiveness of risk management practice is always on the management's radar.
Therefore, to provide value-add, risk management professional can extend this discussion by
considering other dimensions and perform a comparative analysis of effectiveness of risk
management practices in various other organizations. At the end of this suggested exercise, best
practices can be inventoried to be leveraged within their own organization.
Lastly, the most important and significant lesson (for both current and future risk
management professionals) is the fact that this project was completed successfully by having
senior stakeholders’ support. This support enabled the Assessment team to continue their work
unhindered, secure and retain resources as required and maintain a sustained interest across the
in-scope BUs throughout the assessment. Resultantly, we were able to deliver a successful
project with relevant and meaningful results!
Summary
This assessment of organizational risk management practice was chartered by senior
management to gauge the risk implementation level, uncover gaps, identify opportunities for

Improving Organizational Risk Management Practice 10
improvement and ultimately provide input to an action plan to strengthen the overall risk
management practice with this FI. In order to achieve the above, a methodology was developed
covering all aspects of this risk assessment from planning to reporting.
Since risk management cuts through all practices, hence stakeholders from all practices
were engaged, artifacts from all practices selected to be examined, tools developed to record and
report the results of observations that were both qualitative and quantitative in nature. In
addition, projects ensuring equal representation were sampled from all in-scope BUs, of varying
sizes and from all phases of project life cycle, with the exception of Concept and Close phases.
A follow-up organizational assessment of risk management practice was conducted and
re-baselined in December 2013. As a result of remedial actions implemented during 2013, a
significant improvement in quality was noted. Overall, risk management implementation level
stood at 79%. This 65% improvement since Q4-2012 exceeded the 50% improvement target.
Resultantly, this FI achieved and exceeded its target by improving its risk management practice
across the board.
Finally, this study concludes by highlighting the importance and relevance for both
current and future risk management professionals, provides ideas for similar future studies and
stresses the need for executive stakeholder support to deliver successful projects. Moreover, as
an extension of this discussion, risk management professionals can undertake future research
studies to compare assessment methodologies of risk management practices in similar and
different industries, identifying common denominators, challenges and even propose reasonable
solutions.
Improving Organizational Risk Management Practice 11
References
Albandoz, J., Barreiro, P. (2001). Population and Sample. Sampling Techniques. Management
Mathematics for European Schools. University of Seville. Retrieved from
http://optimierung.mathematik.unikl.de/mamaeusch/veroeffentlichungen/ver_texte/sampl
ing_en.pdf
Capability Maturity Model Integration. (2014). In Wikipedia. Retrieved from
http://en.wikipedia.org/wiki/Capability_Maturity_Model_Integration
CMMI Institute. (2014). CMMI appraisal classes. Retrieved from
http://cmmiinstitute.com/cmmi-solutions/cmmi-appraisals/cmmi-appraisal-classes/
Gregory, P. (2010). CISSP guide to security essentials. Boston, MA, USA: Cengage Learning.
Hall, T., Hunton, J., Pierce, B. (2002). Sampling Practices of Auditors in Public Accounting,
Industry, and Government. Accounting Horizons Journal, 16(2), 125-136. Retrieved
from: http://www.buec.udel.edu/kherh/Sampling_Practices_of_Auditors.pdf
Landoll, D. (2006). The security risk assessment handbook (1st ed.). Boca Raton, FL: CRC Press.
SANS. (2013). Global Information Assurance Certification Paper. Retrieved from
http://www.giac.org/paper/gsec/3287/overview-practical-risk-assessment-
methodologies/105426
TIIA. (2014). Assessing the adequacy of risk management using ISO 31000. Altamonte Springs,
FL: Foster, B., MacDonald, P., MacLeod, A., Stokka, T., Ybarra, B. Retrieved from
http://www.theiia.org/bookstore/downloads/freetomembers/0_1079.dl_pg%20adequacy.

Improving Organizational Risk Management Practice 12
Appendix A
Note 1: CMMI Certification – This Financial Institution’s (FI) holds Capability Maturity Model
Integration (CMMI) certification at Maturity Level 3. CMMI is a process improvement training
and appraisal program and service administered and marketed by Carnegie Mellon University.
This FI’s Systems Development Lifecycle (SDLC) is based on CMMI for Development Version
1.3 framework.
Note 2: Four of the six Business Units in the AS Organization are CMMI Level 3 certified. As a
result, the projects are selected from certified BUs for audit and risk assessment purposes.

Improving Organizational Risk Management Practice 13
Appendix B
List of SDLC Artifacts Examined
No. Artifact Responsible Role
1 Solution Options Architect
2 Requirements document Business Systems Analyst Lead
3 Project Charter Project Manager
4 Design documents Design & Development Lead
5 Gate & Phase Reviews Project Manager
6 Test Plans (Unit, Integration, Overall) Test Lead
7 Meeting Minutes Project Manager
8 Kick-off Presentation Project Manager
9 Project Dashboard Project Manager
10 Weekly Status Report Project Manager
11 Technical Architecture Architect
12 Implementation Plan Project Manager
13 Risk Log Project Manager
Note 1 - Project Phases
The SDLC comprised of following project phases: Concept, Initiate, Define, Design, Build,
Validate, Implement and Close.
Note 2 - Practices
Various practices delivering key artifacts were: Delivery Manager, Project Manager, Architect,
Design & Development and Test.
Improving Organizational Risk Management Practice 14
Appendix C

Improving Organizational Risk Management Practice 15
Appendix D - Risk Assessment tools
Figure 1. Organizational assessment checklist listing key SDLC artifacts
Figure 2. Tabulation of observations for items 1 – 17
No. Artifact Practice Q uestion(s)
S = Satisfactory
U =
Unsatisfactory
N = Not
applicable
O bservation(s)
1 Solution Options Architect Were the identified risks transferred to the risk log?
2 Kick-off Presentation Project Manager Were the identified risks in the kkickoff presentation transferred to the risk log?
3 Requirements document BSA Lead Were the identified risks transferred to the risk log?
4 Design documents Design & Dev. Lead Were the identified risks transferred to the risk log?
5 Project Charter Project Manager Have the critical success factors implying risk been transferred to the risk log?
6 Project Charter Project Manager Have the assumptions implying risk been transferred to the risk log?
7 Project Charter Project Manager Have the constraints implying risk been transferred to the risk log?
8 Phase Review Project Manager Were the identified risks during any of the phase reviews transferred to the risk log?
9 Phase Review Project Manager Is there evidence that key risks in the risk log were reviewed during the phase review.
10 Gate Review Project Manager Were the identified risks during any of the gate reviews transferred to the risk log?
11 Gate Review Project Manager Is there evidence that key risks in the risk log were reviewed during the gate review.
12 Test Plan - Integration Test Lead Were the identified risks in the Integration Test Plan transferred to the risk log?
13 Test Plan - Unit Test Lead Were the identified risks in the Unit Test Plan transferred to the risk log?
14 Test Plan - TCoE Test Lead Were the identified risks in TCoE Test Plan transferred to the risk log?
15 Meeting Minutes Project Manager Is there evidence in meeting minutes that risk log was referenced, or risks were reviewed/discussed during
meetings? 16 Technical Architecture Architect Were the identified risks transferred to the risk log?
17 Implementation Plan Project Manager Were the identified risks transferred to the risk log?
18 Weekly Status Report Project Manager Is there corelation between risks reported in status report and risk log?
19 Risk Log Project Manager Is there evidence that risk log was maintained through the duration of the project?
20 Risk log Project Manager Are there risks (related to Requirements and Design) logged in the risk log?
21 Risk Log Project Manager Are the risks completed appropriately with all fields completed?
22 Project Dashboard Project Manager Are the risks (cost, t ime, scope) cross-referencing with the ones captures on Risk Log and Weekly Status Report?
Assessment Name: [Name of Project goes here]
Assessment Date: [Month DD, YYYY]
No.
Artifacts Sample 1 Sample 2 . . . . . . . . . . Sample (n-1) Sample (n)
Solution Options 1 S NS S SKick-off Presentation 2 S S NS SRequirements
document 3 S S S SDes ign documents 4 NS S S NProject Charter 5 S S S S
Project Charter 6 S S N SProject Charter 7 S NS S S
Phase Review 8 S S S S
Phase Review 9 NS S S S
Gate Review 10 N S NS S
Gate Review 11 S N N STest Plan -
Integration 12 S S S NS
Test Plan - Unit 13 S S S S
Test Plan - TCoE 14 NS S S S
Meeting Minutes 15 S NS S NSTechnica l 16 N N NS SImplementation Plan 17 S S S S
Quantitative Results

Improving Organizational Risk Management Practice 16
Figure 3. Quantified results template for items 1-17
Improving Organizational Risk Management Practice 17
Appendix E
Figure 1. Results of Organizational Risk Assessment for FYs 2012 & 2013
Each bar in Figure 1(above) corresponds to the following five questions:
Q1: Are risks being communicated in the Weekly Status Report?
Q2: Are risks placed in the Risk Log in advance of them being reported in Project Dashboard?
Q3: Are risks being confused with issues, or vice versa?
Q4: Are Action Plans in the Risk Log clear?
Q5: Is the Risk Log being used effectively to describe, prioritize and track risks?