
Measure Up! Data Analytics and Libraries Alan Safer CSU Long Beach...
44
Measure Up! Data Analytics and Libraries Alan Safer CSU Long Beach [email protected] . Lesley Farmer CSU Long Beach [email protected] 1
-
Upload
esmond-heath -
Category
Documents
-
view
222 -
download
0
Transcript of Measure Up! Data Analytics and Libraries Alan Safer CSU Long Beach...
Measure Up!Data Analytics and Libraries
Alan Safer CSU Long [email protected] Farmer CSU Long [email protected]
1

Does this sound familiar? I can’t get the articles I need! The catalog says the book is there, but I
can’t find it. What does it take to get a new book on
the shelf before it becomes old? No one uses our self-check out system. Should we subscribe to ebooks? Why isn’t online reference service used?
2
What data do you collect?
3

What data do you collect?
4
Circulation figuresPatron usageFacilities usageComputer usageInternet usageReference consultations and fillLibrary guides/bibliographies useInstructional sessionsWebsite hits (including tutorials)Database usage vs costILL processing and turnaround timeOrdering, processing, cataloging, preservation, weeding workflow and timeEbook usage vs costLibrary software usage vs costStaff schedulingEquipment maintenance and repairs

What tools do you use to collect data?
5
What tools do you use to collect data? Surveys Web statistics Circulation statistics Interviews and interviews Observation LibQual / PibPAS Flowfinity Document collecting
6
What do you DO with that data? Descriptive statistics Analyze workflow for efficiency Reveal trends Benchmark efforts Control quality Do cost-benefit analysis Analyze student learning Optimize scheduling Optimize queuing
7
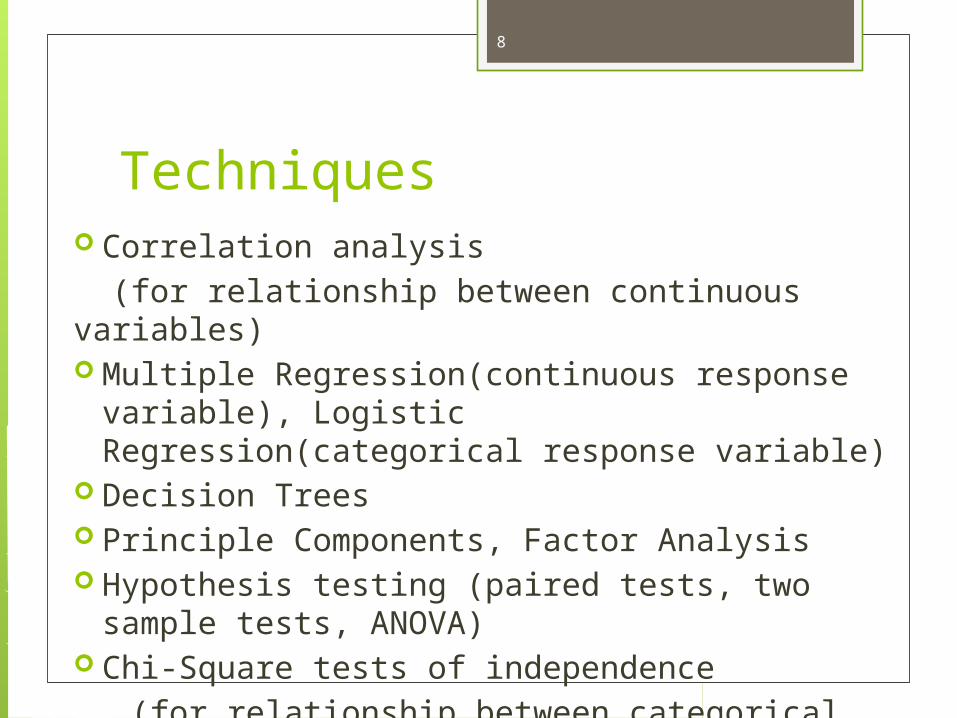
Techniques Correlation analysis (for relationship between continuous variables) Multiple Regression(continuous response
variable), Logistic Regression(categorical response variable)
Decision Trees Principle Components, Factor Analysis Hypothesis testing (paired tests, two sample
tests, ANOVA) Chi-Square tests of independence (for relationship between categorical variables)
8
Graphs Box Plots Stem and Leaf Plots Histograms/Bar Graphs Pareto Charts Pie Charts Time Series Plot Outlier assessment
9
How do the data connect with your library’s goals?
10

The Answer May Be Data Analytics >> Decisions
• Y• Dependent• Output• Effect• Symptom• Monitor• Response
Why should we test or inspect Y, if we know this relationship?
• X1 . . . XN• Independent• Input-Process• Cause• Problem• Control• Factor
To get results, should we focus our behavior on the Y or X ?
f (X)Y=
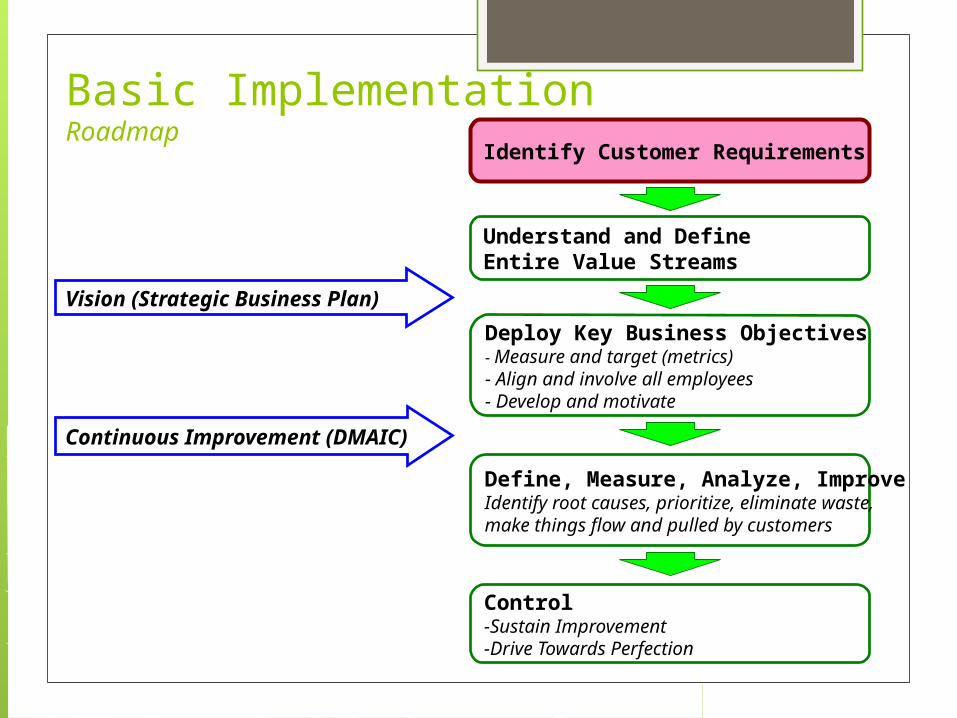
Basic ImplementationRoadmap
Understand and DefineEntire Value Streams
Deploy Key Business Objectives- Measure and target (metrics)- Align and involve all employees- Develop and motivate
Define, Measure, Analyze, ImproveIdentify root causes, prioritize, eliminate waste,make things flow and pulled by customers
Control-Sustain Improvement-Drive Towards Perfection
Identify Customer Requirements
Vision (Strategic Business Plan)
Continuous Improvement (DMAIC)
Identify Customer Requirements

13

Case Study: Arizona State University Study ILL article borrowing process Why: improve service to meet increased
demand Drivers: customer expectations, cost
reduction, leverage technology Personnel: leadership, staff involvement
Voyles, J. F., Dols, L., & Knight, E. (2009). Interlibrary Loan Meets Six Sigma: The University of Arizona Library's Success Applying Process Improvement. Journal Of Interlibrary Loan, Document Delivery & Electronic Reserves, 19(1), 75-94.
14

Define Phase Reduce costs Focus on articles (many processes
possible) ID customer expectations relative to
turnaround time, scan quality, priority value
Fill 80% of article requests within 3 days Premise: no additional staff or $
15

Measure Phase Current process capabilities through
flow charts, performance matrixes, data collection sheets
16

17

Analyze Phase ID root causes of problems in order to
eliminate or reduce them Tools: fishbone diagram, histogram,
Pareto chart, XmR chart
18

19

20

21
Improve Phase Cause: variations and delays in searching
and delivery on evenings/weekends Cause: lack of lender staff
evenings/weekends Cause: Choosing right ISSN Lags in searching difficult requests
Pilot/evaluate solutions based on impact, cost, support

Implemented Solutions Use downtime of other evening/weekend
staff Replace student workers with FT/temp staff Add staff hours on evenings/weekends Train Schedule search requests Encourage other libraries to increase
evening/weekend staff, and use ODYSSEY
23

Control Phase New quality standards Responsibility/timeline for
implementation Method to measure user satisfaction Methods to measure process control and
capability Progress reports
24

25
Lessons Learned Increased cost for document supplier
wasn’t worth it Saved $2/request (even with more
requests) Use ILL system that tracks detailed data
including processing steps Get monthly data summary
26
Over to You… Areas for improvement? Ways to incorporate data analytics?
And who are good data analytics partners?
27
Readings Agrawal, P. (2011). Application of ‘Six Sigma' in libraries for enhancing service quality. Intl. Journal
of Information Dissemination & Technology, 1(4). Bentley, W. (2010). Lean six sigma secrets for the CIO. Boca Raton, FL: CRC Press. Biranvand, A., & Khasseh, A. (2013). Evaluating the service quality in the Regional Information
Center for Science and Technology using the Six Sigma methodology. Library Management, 34(1/2), 56-67.
Chapman, J., & Lown, C. (2010). Practical ways to promote and support collaborative data analysis projects. Code4lib, 12, 12-21.
Delaware Division of Libraries. (2006). Library success: A celebration of library innovation, adaptation & problem solving, 149-153.
Dong-Suk, K. (2006). A study on introducing six sigma theory in the library for service competitiveness enhancement. IFLA Conference Proceedings, 1-16.
Huber, J. (2011). Lean library management. New York: Neal-Schuman. Jain, M. (2009). Delivering successful projects with TSP and Six Sigma. Boca Raton, FL: CRC Press. Jankowski, J. (2013). Successful Implementation of Six Sigma to Schedule Student Staffing for
Circulation Service Desks. Journal Of Access Services, 10(4), 197-216. Kastelic, M., & Peer, P. (2012). Managing IT services: Aligning best practice with a quality method.
Organizacija, 45(1), 31-37. Kumi, S., & Morrow, J. (2006). Improving self service the Six Sigma way at Newcastle University
Library. Program: Electronic Library & Information Systems, 40(2), 123-136. Kucsak, M. (2012). Bringing Six Sigma to the Library. Library Faculty Presentations & Publications
(2012). http://works.bepress.com/michael_kucsak/7/ Lientz, B., & Rea, K. (2002). Achieve lasting process improvement:.New York: Academic Press. Murphy, S. (2009). Leveraging Lean Six Sigma to culture, nurture, and sustain assessment and
change in the academic library environment. College & Research Libraries, 70(3), 215-225. Voyles, J. , Dols, L., & Knight, E. (2009). Interlibrary Loan Meets Six Sigma: The University of Arizona
Library's Success Applying Process Improvement. Journal Of Interlibrary Loan, Document Delivery & Electronic Reserves, 19(1), 75-94.
28

Sample Data Analytics Tools
29
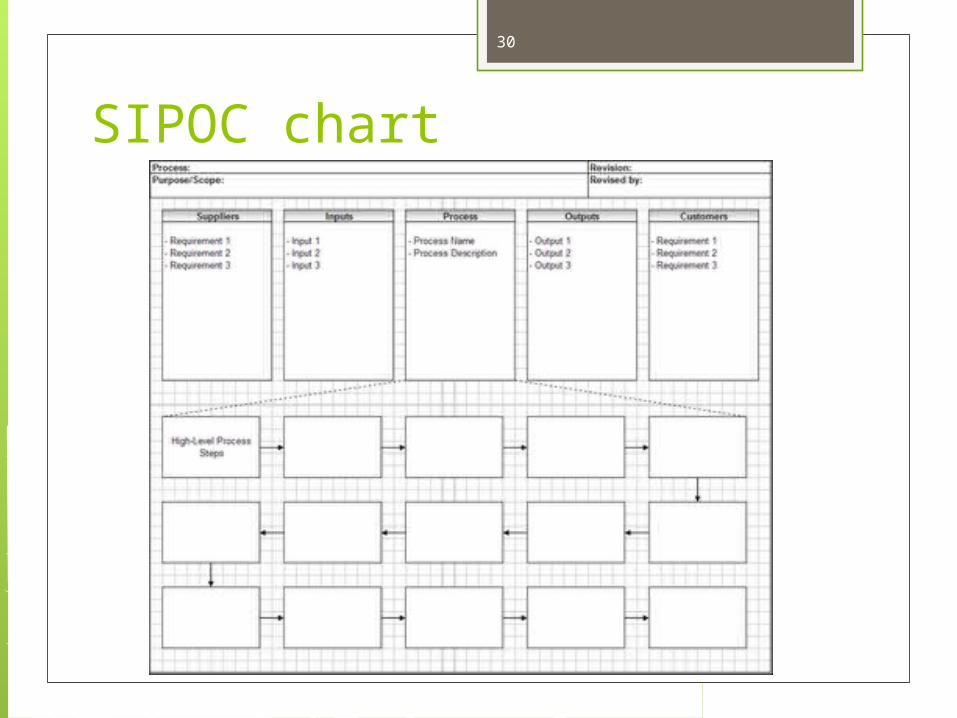
SIPOC chart
30

Balanced Scorecard
31

32

Decision Tree
33
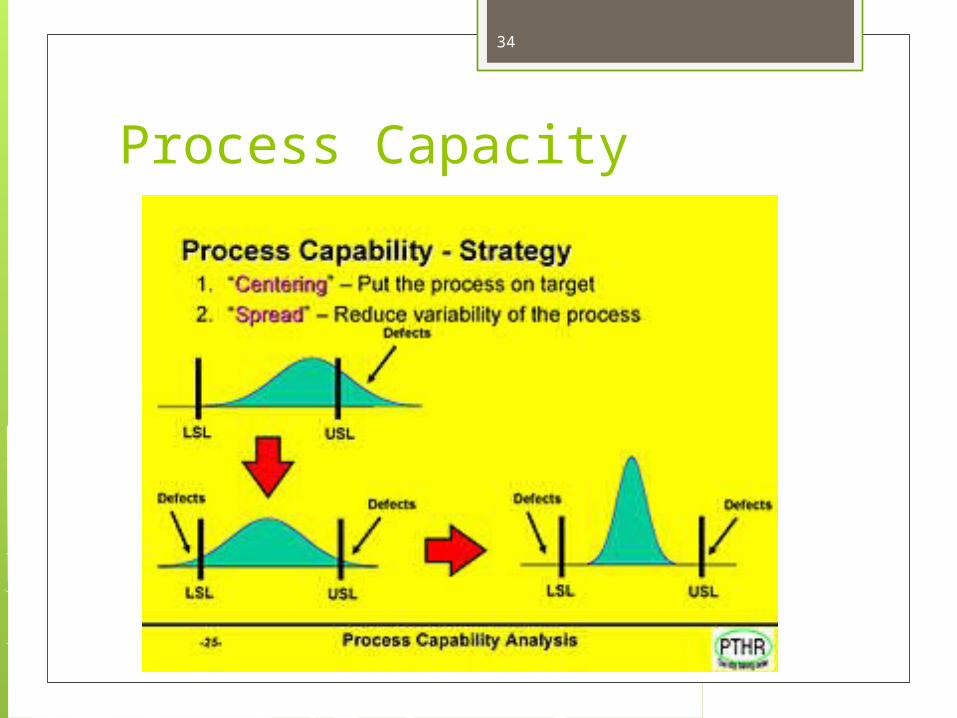
Process Capacity
34
Chapter 7
35
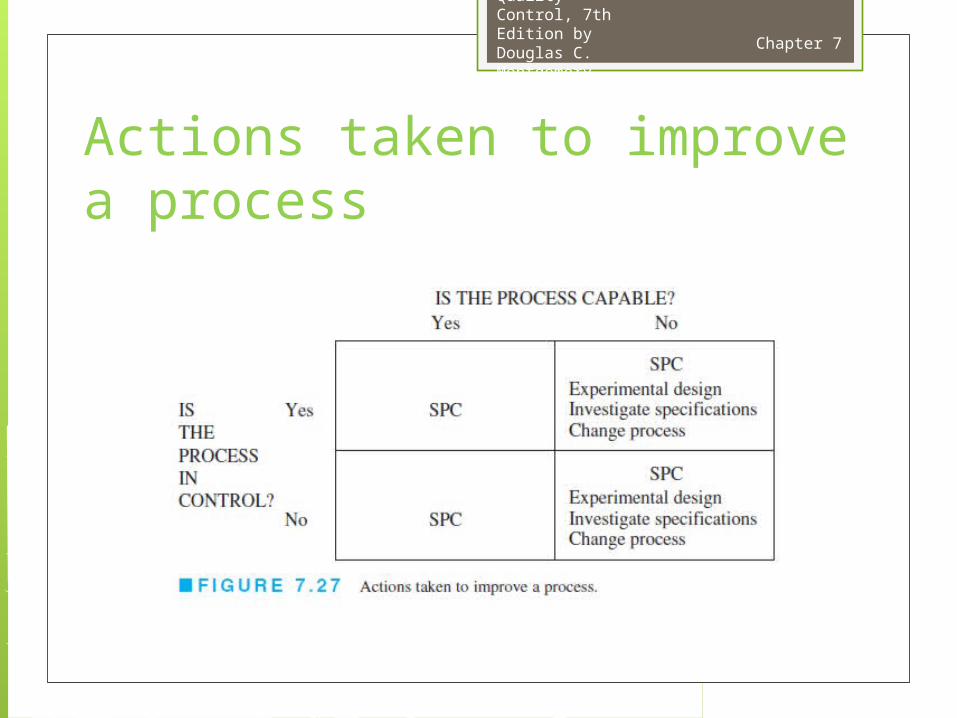
Introduction to Statistical Quality Control, 7th Edition by Douglas C. Montgomery. Copyright (c) 2012 John Wiley & Sons, Inc.Actions taken to improve a
process
Chapter 5
36
Introduction to Statistical Quality Control, 7th Edition by Douglas C. Montgomery. Copyright (c) 2012 John Wiley & Sons, Inc.
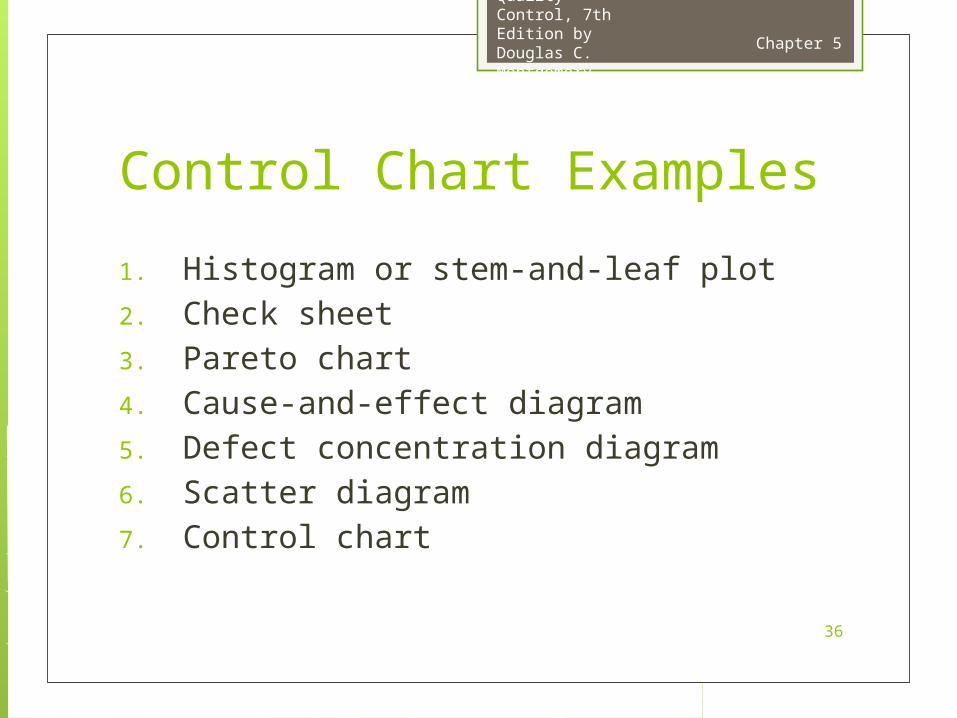
1. Histogram or stem-and-leaf plot2. Check sheet3. Pareto chart4. Cause-and-effect diagram5. Defect concentration diagram6. Scatter diagram7. Control chart
Control Chart Examples
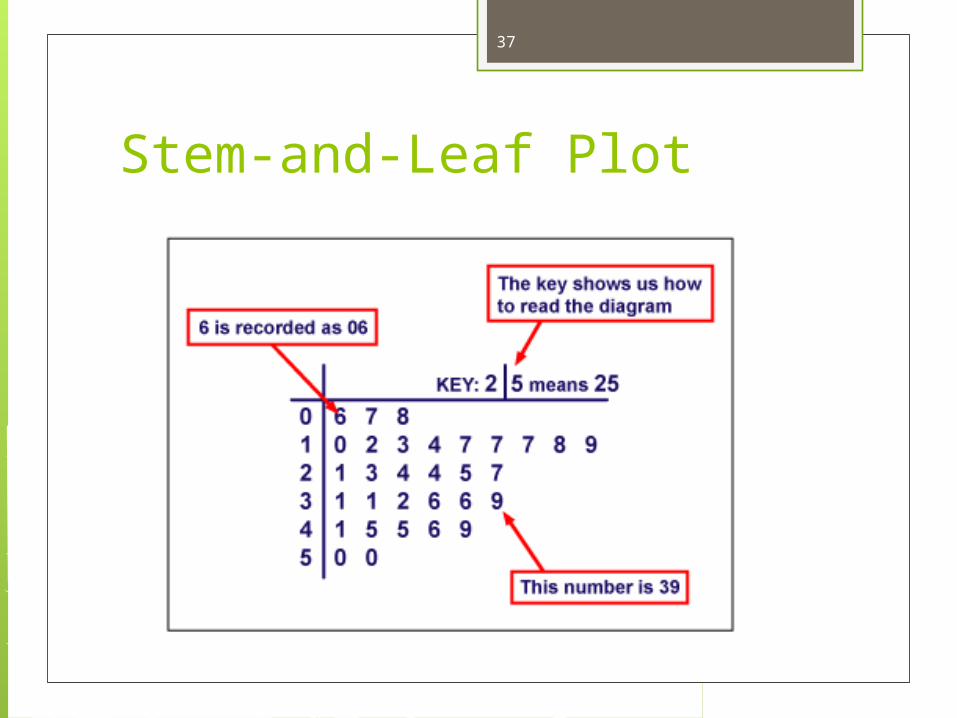
Stem-and-Leaf Plot
37
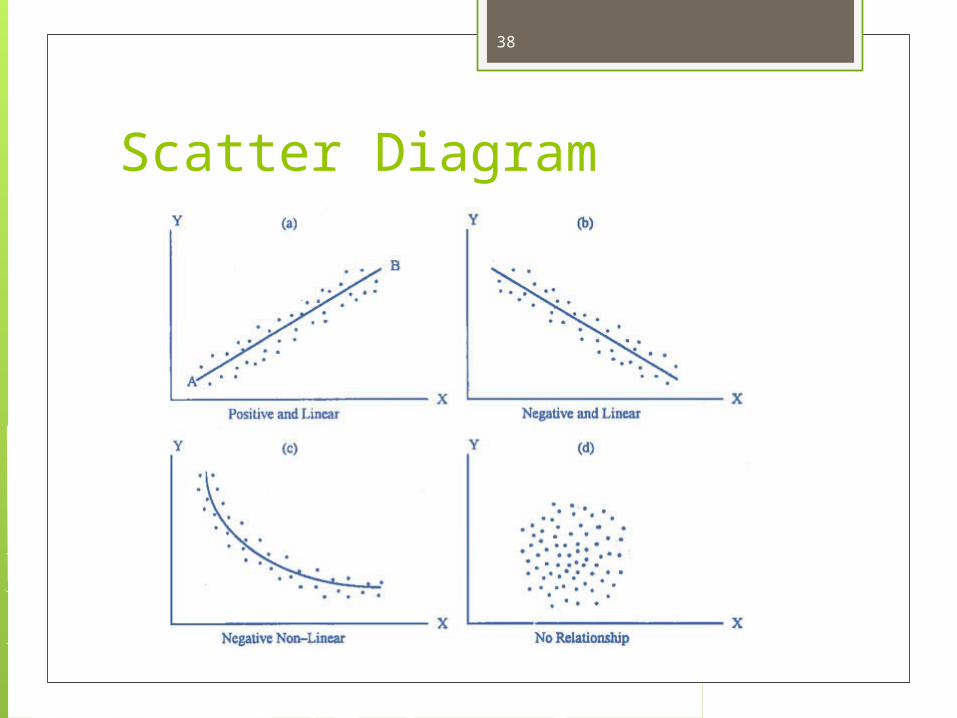
Scatter Diagram
38
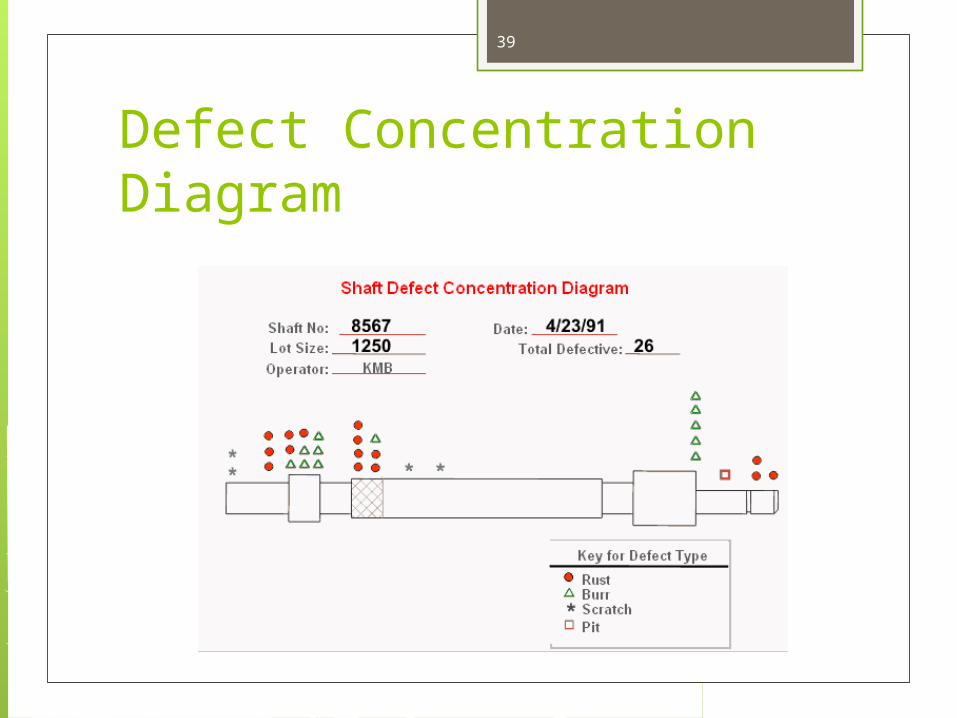
Defect Concentration Diagram
39
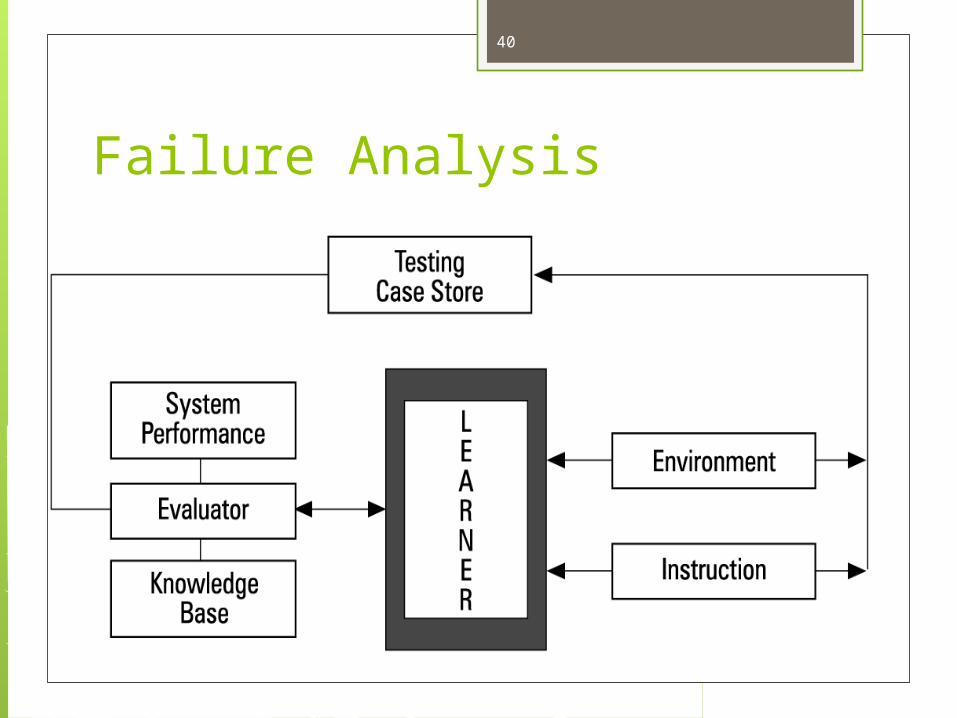
Failure Analysis
40

Chapter 1
41
Introduction to Statistical Quality Control, 7th Edition by Douglas C. Montgomery. Copyright (c) 2012 John Wiley & Sons, Inc.
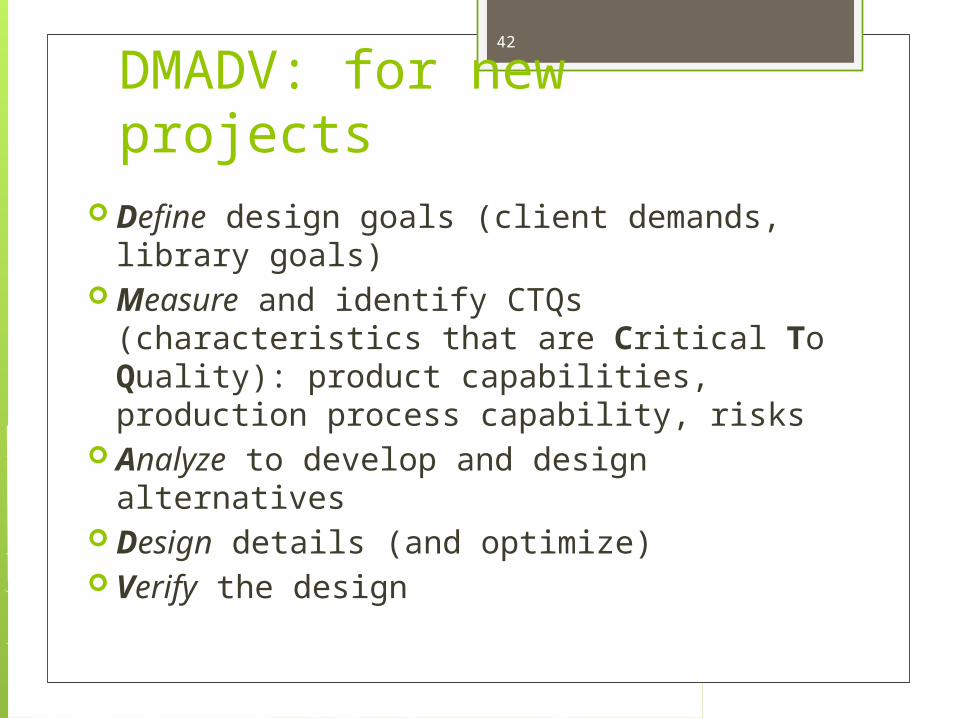
DMADV: for new projects Define design goals (client demands, library
goals) Measure and identify CTQs (characteristics
that are Critical To Quality): product capabilities, production process capability, risks
Analyze to develop and design alternatives Design details (and optimize) Verify the design
42
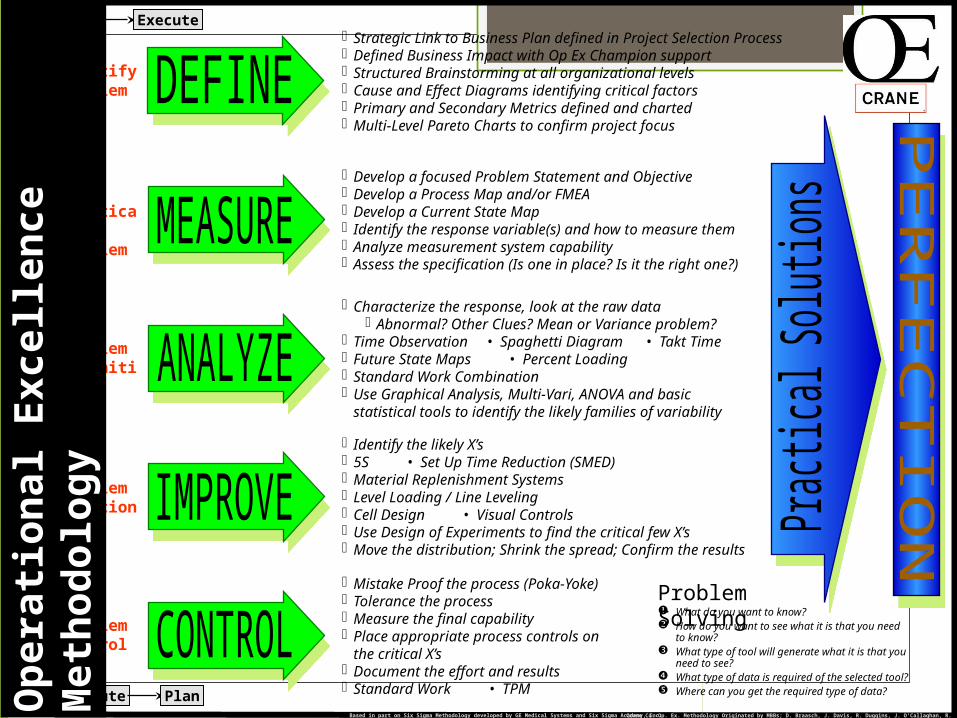
• Develop a focused Problem Statement and Objective• Develop a Process Map and/or FMEA• Develop a Current State Map• Identify the response variable(s) and how to measure them• Analyze measurement system capability• Assess the specification (Is one in place? Is it the right one?)
Practical Problem
ProblemDefinition
• Characterize the response, look at the raw data• Abnormal? Other Clues? Mean or Variance problem?
• Time Observation • Spaghetti Diagram • Takt Time• Future State Maps • Percent Loading • Standard Work Combination• Use Graphical Analysis, Multi-Vari, ANOVA and basic
statistical tools to identify the likely families of variability
ProblemSolution
• Identify the likely X’s• 5S • Set Up Time Reduction (SMED)• Material Replenishment Systems• Level Loading / Line Leveling• Cell Design • Visual Controls• Use Design of Experiments to find the critical few X’s• Move the distribution; Shrink the spread; Confirm the results
Problem Control
• Mistake Proof the process (Poka-Yoke)
• Tolerance the process• Measure the final capability• Place appropriate process controls on
the critical X’s• Document the effort and results• Standard Work • TPM
IdentifyProblem
• Strategic Link to Business Plan defined in Project Selection Process• Defined Business Impact with Op Ex Champion support• Structured Brainstorming at all organizational levels• Cause and Effect Diagrams identifying critical factors• Primary and Secondary Metrics defined and charted• Multi-Level Pareto Charts to confirm project focus
What do you want to know? How do you want to see what it is that you need
to know? What type of tool will generate what it is that you
need to see? What type of data is required of the selected tool? Where can you get the required type of data?
Problem Solving
Plan Execute
Execute PlanCrane Co. Op. Ex. Methodology Originated by MBBs; D. Braasch, J. Davis, R. Duggins, J. O’Callaghan, R. Underwood, I. Wilson
Op
era
tion
al Excellen
ce
Meth
od
olo
gy
Based in part on Six Sigma Methodology developed by GE Medical Systems and Six Sigma Academy, Inc.


![School Profile 2016-2017 draft[2] - Edl · Cal Poly Pomona Cal Poly San Luis Obispo CSU Channel Islands CSU Dominguez Hills CSU Fullerton CSU Long Beach CSU Monterey Bay CSU Northridge](https://static.fdocuments.net/doc/165x107/5b3f628a7f8b9aff118c0fa3/school-profile-2016-2017-draft2-edl-cal-poly-pomona-cal-poly-san-luis-obispo.jpg)