MDGs: Progress & Challenges in Bhutan Kunzang Norbu Planning Commission.
27
MDGs: Progress & Challenges in Bhutan Kunzang Norbu Planning Commission
-
Upload
joan-jasmine-welch -
Category
Documents
-
view
219 -
download
2
Transcript of MDGs: Progress & Challenges in Bhutan Kunzang Norbu Planning Commission.
MDGs: Progress & Challenges in Bhutan
Kunzang NorbuPlanning Commission

2
Millennium Development Goals
1. Eradicate extreme poverty and hunger
2. Achieve universal primary education
3. Promote gender equality and empower women
4. Reduce child mortality
5. Improve maternal health
6. Combat HIV/AIDS, malaria & other diseases
7. Ensure environmental sustainability
8. Develop a global partnership for development

3
Goal 1 (a): Eradicate Extreme Poverty and Hunger/Malnutrition
TARGET Halve, between 1990 and 2015, the proportion of people whose income is less than one
dollar a day
Indicators 1990 2000 2003 2015 Status of Progress
State of Supportive
Environment
Proportion of population living below national poverty line (%)
- 36.3% 31.7% 20% On track Strong
The Human Poverty Index(HPI-1)
-
33.34 33
- Insufficient
dataStrong
Source: Pilot HIES 2000, PAR 2004

4
Goal 1 (a): Challenges
– Pro-poor growth• sectors like agriculture need to grow more
rapidly and gain increased productivity
– Balanced regional development • equitable access to social services,
infrastructure and market opportunities
– Weakness in poverty data collection, monitoring and evaluation

5
Goal 1(b): Eradicate Extreme Poverty and Hunger
TARGET Halve, between 1990 and 2015, the proportion of people who suffer from
hunger
Indicators 1990 2000 2003 2015Status of
Progress State of
Supportive Environment
Percentage of population below minimum level of dietary energy consumption (2,124 Kcal)
- - 3.8% 1.9% Insufficient data
Strong
Percentage of under-weight under-five children
38(1989)
19% - 19%
Achieved Good
Percentage of under height under-five children
56%(1989)
40% - 28%
On track Strong
Source: PAR 2004, BLSS 2003

6
Goal 1 (b): Challenges
• Achieving Food Security in the light of significant agriculture constraints
• Factors of low productivity, limited arable land and small land holdings
• Nutrition of women and children – pregnant women and anemia. Poor nutritional practices

7
Goal 2: Achieve Universal Primary Education
TARGET Ensure that by 2015, children everywhere , boys and girls alike, will be able to complete a
full course of primary schooling
Indicators 1990 2000 2004 2015Status of Progress
State of Supportive
Environment
Gross Primary Enrollment Rate
55% 72% 84% 100% On track Strong
Proportion of pupils starting grade 1 who reach grade 5
73% 91% 94% 100% On track Strong
Proportion of pupils starting grade 1 who reach grade 7
35% 81% 86% 100% On track Strong
Source: General Statistics, MoE, RGoB

8
Goal 2: Challenges
• Enhancing outreach of primary education to children in rural and remote communities
• Disparities in educational enrollments and attainment between urban and rural areas
• Retention of children and reducing early school drop outs
9
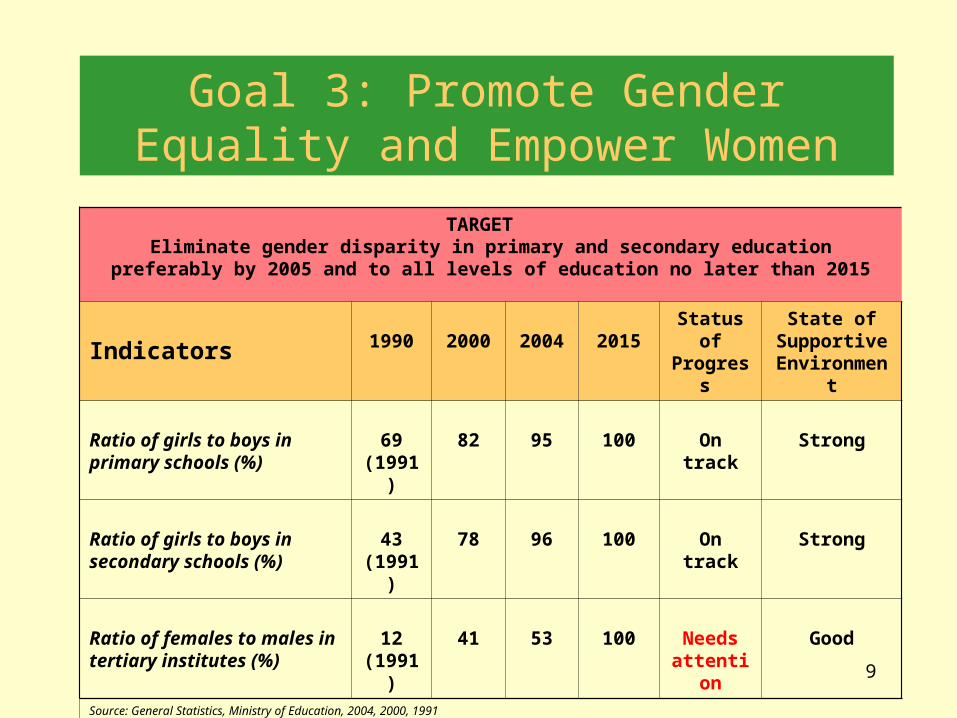
Goal 3: Promote Gender Equality and Empower Women
TARGET Eliminate gender disparity in primary and secondary education preferably by 2005 and to
all levels of education no later than 2015
Indicators 1990 2000 2004 2015Status of Progress
State of Supportive
Environment
Ratio of girls to boys in primary schools (%)
69(1991)
82 95 100 On track Strong
Ratio of girls to boys in secondary schools (%)
43(1991)
78 96 100 On track Strong
Ratio of females to males in tertiary institutes (%)
12(1991)
41 53 100 Needs attention
Good
Source: General Statistics, Ministry of Education, 2004, 2000, 1991

10
Goal 3: Challenges
• Ensuring higher levels of female enrollment in tertiary education levels including vocational training
• Raising the Low levels of female adult literacy which have been assessed at half of men
• Promoting women’s fuller engagement in the economic and political life

11
Goal 4: Reduce Child Mortality
TARGET
Reduce by two-thirds, between 1990 and 2015, the under-five mortality rate
Indicators 1990 2000 2004 2015Status of Progress
State of Supportive
Environment
Under-Five mortality Rate (per 1,000 live births)
123 84 - 41 On track Strong
Infant Mortality Rate (per 1,000 live births) 90 60.5 - 30 On track Strong
Proportion of Children covered under immunization programme
84% 85% 90%
(with card)
>95% On track Strong
Source: NHS, 1990, 1994, 2000, Bhutan National EPI Coverage Evaluation Survey 2002.

12
Goal 4: Challenges
• Improving access, utilization and quality of child health care services in rural communities

13
Goal 5: Improve Maternal Health
TARGET Reduce by three-quarters, between 1990 and 2015, the maternal mortality ratio
Indicators 1990 2000 2003 2015Status of Progress
State of Supportive
Environment
Maternal mortality rate(per 100,000 live births)
560
255
- 140
On track
Strong
Delivery by skilled health personnel (%)
15% 24%
32%
100%
Needs
attention Good
Source: NHS, 1990, 1994, 2000 Annual Health Bulletins 2003

14
Goal 5: Challenges
• Shortage of human resources and lack of obstetric equipment & facilities
• Dispersed & isolated nature of settlements
• Cultural and awareness barriers that inhibit utilization of maternal health services

15
Goal 6(a): Combat HIV/AIDS, Malaria and Other Diseases
TARGET Halt and begin to reverse the spread of HIV/AIDS
Indicators 1990 2000 2004 2015Status of Progress
State of Supportive
Environment
HIV cases detected 0 38 72(Feb 2005)
-
Insufficient data
Strong
Contraception Prevalence Rate
18.8%(1994)
30.7% - 60%(national target)
Unlikely Good
Source: NHS, 1990, 1994, 2000 Annual Health Bulletins 2003

16
Goal 6 (a): Challenges
• Lacking a national policy framework on HIV/AIDS
• Low condom usage
• Shortage of trained and qualified personnel in the treatment and care of HIV/AIDS
17
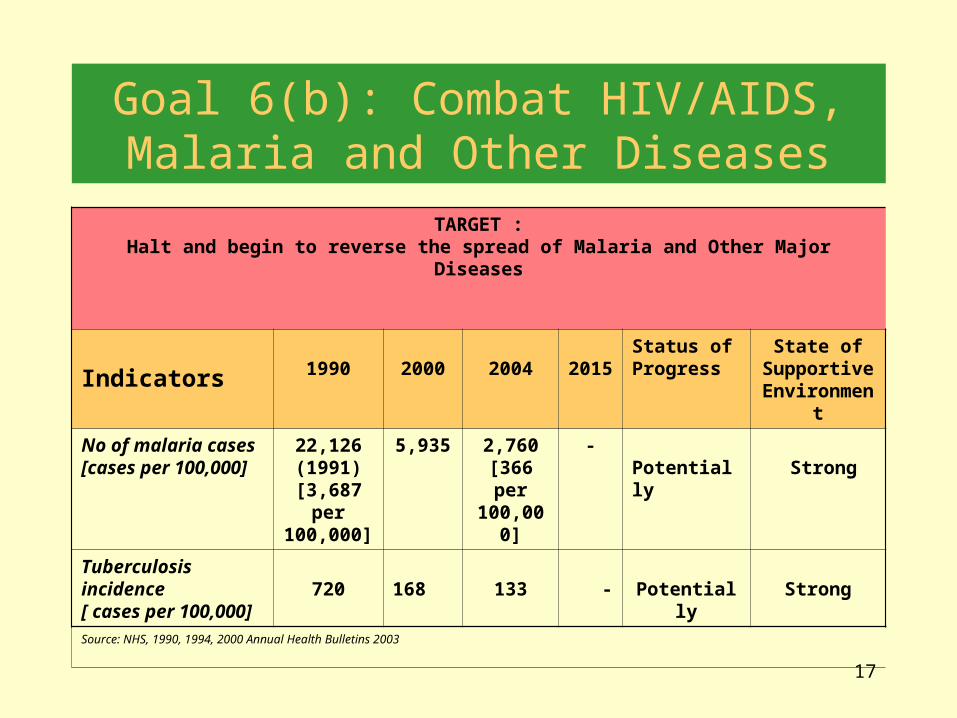
Goal 6(b): Combat HIV/AIDS, Malaria and Other Diseases
TARGET :Halt and begin to reverse the spread of Malaria and Other Major Diseases
Indicators 1990 2000 2004 2015Status of Progress
State of Supportive
Environment
No of malaria cases [cases per 100,000]
22,126(1991)
[3,687 per 100,000]
5,935 2,760[366 per 100,000]
- Potentially
Strong
Tuberculosis incidence [ cases per 100,000]
720 168 133 - Potentially Strong
Source: NHS, 1990, 1994, 2000 Annual Health Bulletins 2003

18
Goal 6 (b): Challenges
Malaria-• Control of border malaria
• Dengue and JE outbreak risks
• Inaccessibility of large tracts of mosquito breeding grounds due to dense vegetation and forests

19
Goal 6 (b): Challenges
Tuberculosis-
• To reduce TB related diseases
• Low case detection rate
• Lack and shortage of human other resources

20
Goal 7 (a): Ensure Environmental Sustainability
TARGET Integrate the principles of sustainable development into country policies and
programmes and reverse the loss of environmental resources
Indicators 1990 2000 2003 2015Status of Progress
State of Supportive
Environment
Proportion of land area covered by forest
72.5% 72.5% 72.5% - On track Strong
Ratio of protected area to surface area for maintaining biological diversity
23%
26% 29%
- On track Strong
CO2 (per capita)Emissions
- 5.89 tons
(1994)
- - -On track Strong
Proportion ofpopulation using solidfuels(i.e.wood, charcoal, dung )
- 75% 70%
- Insufficient
dataStrong
Source: State of the Environment 2001,

21
Goal 7 (a): Challenges
• Land degradation
• Biodiversity Loss
• Urban environmental degradation
22
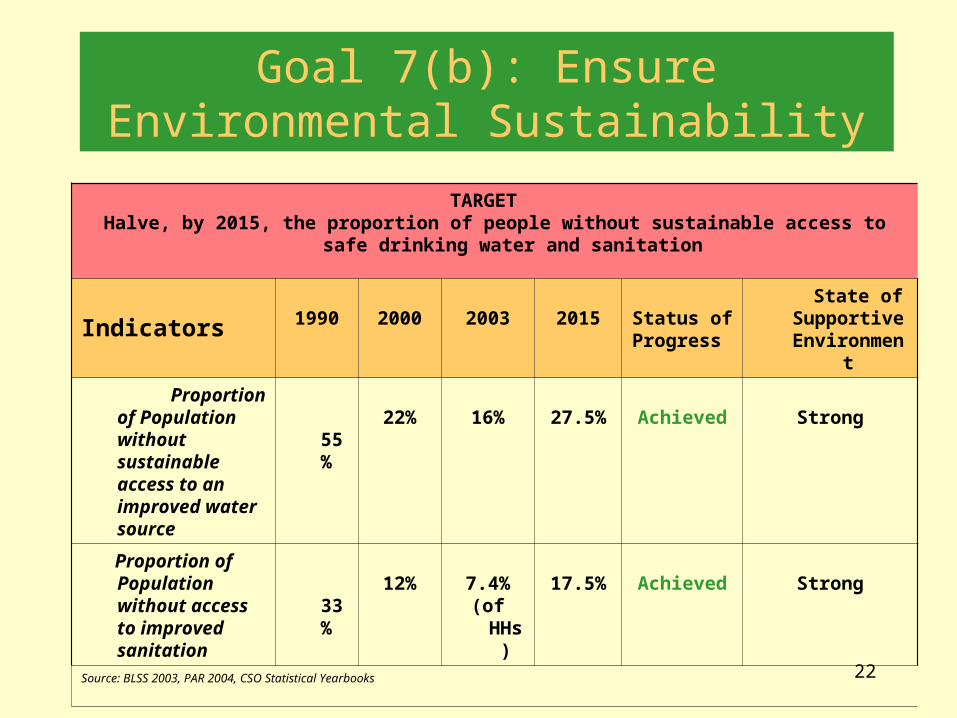
Goal 7(b): Ensure Environmental Sustainability
TARGET Halve, by 2015, the proportion of people without sustainable access to safe drinking water
and sanitation
Indicators 1990 2000 2003 2015 Status ofProgress
State of Supportive
Environment
Proportion of Population without sustainable access to an improved water source
55% 22% 16% 27.5% Achieved Strong
Proportion of Population without access to improved sanitation
33% 12% 7.4%
(of HHs)
17.5% Achieved Strong
Source: BLSS 2003, PAR 2004, CSO Statistical Yearbooks

23
Goal 7(b):Challenges
• Coverage and quality levels for water and sanitation in rural areas
• Distance from water source
• To adapt alternative

24
Goal 8 (a): Develop a Global Partnership for Development
TARGET In cooperation with developing countries, develop and implement strategies for decent and
productive work for youth
Indicators 1990 2000 2004 2015 Status ofProgress
State of Supportive
Environment
Unemployment rate (15-24)
- 1.4%(1998)
2.5% - Insufficient data
Strong
Source: NLFS, 1998, 2004

25
Goal 8 (b): Develop a Global Partnership for Development
TARGET In cooperation with the private sector make available the benefits of new technologies,
especially information and communication technology
Indicators 1990 2000 2004 2015 Status of Progress
State of Supportive
Environment
Fixed Telephone Lines in Service
4,052 16,580 30,420 -
On track Strong
Telephone density(per 100 persons)
0.68 2.4 4 -
Computers in use( per 100 persons)
- 0.58(2001)
1.0 -
Internet users (per 100 persons)
- 0.43(2001)
- -
Source: National Statistical Bureau, 1990,2000,2003, ICT Annual Report 2004-2005, ICT Survey 2001
26
Goal 8 (b): Challenges
• Financial sustainability of Rural Telecom services
• Appropriate technology that is cost effective
• Shortage of skilled human resources in ICT

27
Concluding Remarks
• Meeting the MDGs will be challenging but potentially achievable.• In 2006/2007, Planning Commission coordinated MDG Needs
Assessment exercise involving all stakeholders with UNDP and RCC’s technical guidance and support
• The Needs Assessment Report is being finalized• There is opportunity to mainstream the MDG concerns into the 10 th
Plan
» Thank You.