MDABench: Customized Benchmark Generation Using MDAlimingz/publication/JSS06.pdf · MDABench:...
16
MDABench: Customized Benchmark Generation Using MDA Liming Zhu a,b,* , Ngoc Bao Bui c , Yan Liu a,b , Ian Gorton a,b , Ross Jeffery a,b a Empirical Software Engineering Program, National ICT Australia Ltd., b School of Computer Science and Engineering, University of New South Wales, Australia c Faculty of Information Technology, University of Technology Sydney, Australia * Corresponding author. Address: Bay 15 Locomotive Workshop Australian Technology Park Garden Street Eveleigh NSW 1430; Tel: +61 2 83745523; Fax: +61 2 83745520. Email Address: [email protected] Abstract This paper describes an approach for generating customized benchmark suites from a software architecture description following a Model Driven Architecture (MDA) approach. The benchmark generation and performance data capture tool implementation (MDABench) is based on widely used open source MDA frameworks. The benchmark application is modeled in UML and generated by taking advantage of the existing community-maintained code generation “cartridges” so that the current component technology can be exploited. We have also tailored the UML 2.0 Testing Profile so architects can model the performance testing and data collecting architecture in a standards compatible way. We then extended the MDA framework to generate a load testing suite and automatic performance measurement infrastructure through a new cartridge. This greatly reduces the effort and expertise needed for benchmarking with complex component and Web service technologies while being fully MDA standard compatible. The approach complements current model-based performance prediction and analysis methods by generating the benchmark application from the same application architecture that the performance models are derived from. We illustrate the approach using two case studies based on Enterprise JavaBean component technology and Web services. Keywords: MDA; model-driven development; Performance; Testing; Code Generation 1. Introduction Software technologies such as Enterprise Java Beans (EJBs), .NET and Web services have proven successful in the construction of enterprise-scale systems. However, it remains a challenging software engineering problem to ensure that an application architecture can meet specified performance requirements. Various performance analysis models with prediction capabilities have been proposed to evaluate architecture designs during early phases of the application development cycle (Balsamo et al., 2004). Utilizing these models requires two distinct activities be carried out by the application architect. The first requires the development of specific analytical models based on the application design. The second must obtain parameter values for the performance model using measurements or simulation. Both these activities require significant additional effort and specific expertise in performance engineering methods. Hence, they are key inhibitors that have prevented performance engineering techniques from achieving wide-spread adoption in practice (Balsamo et al., 2004). With the growing interest in Model Driven Architecture (MDA) technologies, attempts to integrate performance analysis with MDA and UML have been made, aiming to reduce the performance modeling effort required. The OMG’s MDA standard defines a way of transforming business domain models into Platform Independent Models (PIM) and then Platform Specific Models (PSM), and eventually to executable code. PSMs can also include a performance analysis model specific to a performance engineering method. Consequently, recent work has attempted model transformation from UML design models to method-specific performance analysis models. A more comprehensive and elaborate theoretical basis has been discussed in (Skene and Emmerich, 2003a). This work has, to a large extent, improved on the earlier manually-oriented activities related to deriving analytical models from application designs.
Transcript of MDABench: Customized Benchmark Generation Using MDAlimingz/publication/JSS06.pdf · MDABench:...

MDABench: Customized Benchmark Generation Using MDA
Liming Zhua,b,*, Ngoc Bao Buic, Yan Liua,b, Ian Gortona,b, Ross Jefferya,b
aEmpirical Software Engineering Program, National ICT Australia Ltd., bSchool of Computer Science and Engineering, University of New South Wales, Australia
cFaculty of Information Technology, University of Technology Sydney, Australia
* Corresponding author. Address: Bay 15 Locomotive Workshop Australian Technology Park Garden Street Eveleigh NSW 1430; Tel: +61 2 83745523; Fax: +61 2 83745520. Email Address: [email protected]
Abstract This paper describes an approach for generating customized benchmark suites from a software architecture
description following a Model Driven Architecture (MDA) approach. The benchmark generation and performance data capture tool implementation (MDABench) is based on widely used open source MDA frameworks. The benchmark application is modeled in UML and generated by taking advantage of the existing community-maintained code generation “cartridges” so that the current component technology can be exploited. We have also tailored the UML 2.0 Testing Profile so architects can model the performance testing and data collecting architecture in a standards compatible way. We then extended the MDA framework to generate a load testing suite and automatic performance measurement infrastructure through a new cartridge. This greatly reduces the effort and expertise needed for benchmarking with complex component and Web service technologies while being fully MDA standard compatible. The approach complements current model-based performance prediction and analysis methods by generating the benchmark application from the same application architecture that the performance models are derived from. We illustrate the approach using two case studies based on Enterprise JavaBean component technology and Web services.
Keywords: MDA; model-driven development; Performance; Testing; Code Generation
1. Introduction Software technologies such as Enterprise Java Beans (EJBs), .NET and Web services have proven successful in the
construction of enterprise-scale systems. However, it remains a challenging software engineering problem to ensure that an application architecture can meet specified performance requirements.
Various performance analysis models with prediction capabilities have been proposed to evaluate architecture designs during early phases of the application development cycle (Balsamo et al., 2004). Utilizing these models requires two distinct activities be carried out by the application architect. The first requires the development of specific analytical models based on the application design. The second must obtain parameter values for the performance model using measurements or simulation. Both these activities require significant additional effort and specific expertise in performance engineering methods. Hence, they are key inhibitors that have prevented performance engineering techniques from achieving wide-spread adoption in practice (Balsamo et al., 2004).
With the growing interest in Model Driven Architecture (MDA) technologies, attempts to integrate performance analysis with MDA and UML have been made, aiming to reduce the performance modeling effort required. The OMG’s MDA standard defines a way of transforming business domain models into Platform Independent Models (PIM) and then Platform Specific Models (PSM), and eventually to executable code. PSMs can also include a performance analysis model specific to a performance engineering method.
Consequently, recent work has attempted model transformation from UML design models to method-specific performance analysis models. A more comprehensive and elaborate theoretical basis has been discussed in (Skene and Emmerich, 2003a). This work has, to a large extent, improved on the earlier manually-oriented activities related to deriving analytical models from application designs.

Parameter values in these performance analysis models also depend greatly on the underlying component and Web service framework used to implement the application. One method to obtain and tune these parameters is to run a benchmark application on the framework. This approach has proven to be useful (Gorton and Liu, 2003, Gorton et al., 2003, Liu, 2004) with component-based technologies. Running benchmark applications can also help in predicting and diagnosing performance problems, including identifying bottlenecks, preliminary profiling and exploring core application characteristics.
An effective benchmark suite includes a core benchmark application, a load testing suite and performance monitoring utilities. There are existing industry benchmark standards and suites (e.g. ECperf/SPECjAppServer and the TPC series), but these are not broadly suitable for performance modeling and prediction for a number of reasons. First, they are mainly designed for server vendors to showcase and improve their products, rather than reflecting a specific application’s performance characteristics. The application logic in these benchmarks is fixed and impossible to adapt to assist in predicting performance for a specific application under design. Second, these benchmark suites tend to be expensive to acquire and complex to use.
On the other hand, implementing a custom benchmark suite from scratch is also costly and tedious. This is largely due to the complexity of modern component containers and Web service frameworks. The task difficulty is exacerbated by the ad hoc ways these technologies adopt for conducting performance measurement. A benchmark implementation usually requires a large amount of container and framework infrastructure-related plumbing, even for a relatively simple benchmark design. Interestingly, this characteristic is particularly amenable to MDA-based code generation, which is efficient at generating repetitive but complicated infrastructure code. However, one capability that current MDA code generation frameworks lack is that they do not provide solutions to the generation of a load testing suite and performance data collecting utilities.
The aim of our work is to automate the generation of complete benchmark suites from a design description. The input is a UML-based set of design diagrams for the benchmark application, along with a load testing suite modeled in the UML 2.0 Testing Profile. The output is a deployable benchmark suite including the core benchmark application, load testing suite, performance data collecting utilities and configuration files for external container/framework specific monitoring and profiling utilities.
To demonstrate the approach, two platforms have been selected that represent widely used target technologies in enterprise systems. One is the Java 2 Enterprise Edition (J2EE) component framework. The other one is the Axis Web service platform (Apache, 2005). The paper illustrates how minimal changes in the benchmark suite model can generate different deployable customized benchmark applications for different platforms. Executing the generated benchmark application produces performance data in an analysis friendly format, along with automatically generated performance graphs.
This approach has a number of benefits: • The generated benchmark suite is based on a design that closely corresponds to the application of interest, and hence it
captures the unique characteristics of the application. This should lead to the benchmark producing more representative measures of the eventual application.
• Model driven code generation hides the complexities of the benchmark implementation from architects, and helps them focus on analyzing the benchmark results that are automatically produced. It also greatly reduces the complexity behind the load testing suite and framework-specific performance data collecting utilities (which in many cases can take more time to understand and develop than the benchmark application itself (Grundy et al., 2005)
• The approach derives the benchmark application from the same application model that the performance analysis model is derived. This makes it possible to use the performance measurement data for analytical model validation and tuning model parameter values. This essentially complements the performance analysis framework proposed in (Skene and Emmerich, 2003a).
• Following MDA standards, including the UML 2.0 Testing Profile, and using existing open source MDA frameworks significantly reduces the learning curve of the approach. It also takes advantage of existing code generation “cartridges” exploiting the latest component technologies. The wide range of interoperable UML modeling tools (due to the MDA/UML compatibility standard) also makes the approach more amenable to adoption in practice.
The paper discusses related work on performance analysis with MDA and benchmark suite generation. We then introduce our approach in section 3. Two case studies based on EJB component technology and Web services are presented in section 4. We briefly discuss the approach in section 5 then conclude in section 6.

2. Related Work 2.1 Performance Analysis with MDA
It has been argued that the MDA approach is a suitable for facilitating performance analysis of large scale enterprise system (Skene and Emmerich, 2003b) since it “permits natural and economical modeling of design and analysis domains and relationships between them, supporting both manual and automatic analysis.” Some researchers have used MDA in performance analysis (Yilmaz et al., 2004, Weis et al., 2004, Rutherford and Wolf, 2003b, Marco and Inverardi, 2004), and typically focus on deriving analytical models from UML design models. A UML design model with appropriate profiles applied can be transformed into a specific analytical technique based proprietary model for further analysis. Most of these model transformations are based on XSLT. This means the mapping and transformation information is tangled within the XML query and transformation language, which has limitations for representing and validating mapping relationships (Czarnecki and Helsen, 2003).
A more comprehensive framework has been proposed in (Skene and Emmerich, 2003a). It too advocates representing analytical performance models in UML using profiles. Thus, deriving analytical models from design models equates to standard model transformation in MDA. This has various standardization, validation and tooling advantages over the using of plain XSLT to transform designs into proprietary models.
Analytical model-based performance analysis can not work without data to populate the model parameters. Populating parameters must utilize techniques such as simulation or estimation based on experience or historical data. These techniques require an in-depth understanding of the behavior of the actual system components and encounter difficulties if applications use complex commercial black box frameworks, which is common for most applications running on commercial component-based application servers or Web service frameworks.
In such applications, measurements in the form of benchmarking and prototyping (Grundy et al., 2004) are used to obtain valuable information for architects. Comprehensive prototyping can however be expensive. To further exacerbate the problem, multiple benchmarking applications need to be constructed for different target platforms for comparison or deployment considerations. Industry standard benchmark results can not usually be used because the results are specific to the benchmark application itself, making it difficult to sensibly infer useful performance characteristics about the application under design. Combining model based analysis with small scale customized benchmarking has been introduced to solve this problem (Liu, 2004). This approach can work on different levels. Benchmarking and prototyping results can be combined with model-based estimation as a way of building confidence in performance predictions and ruling out potential inaccuracy. Benchmarking and prototyping data can also be directly fed into a performance model for more accurate prediction. Some recent research has produced positive results (Liu and Gorton, 2004).
We argue that deriving a customized benchmark application from the same application architecture design as the performance models are derived has great potential for validating and calibrating performance prediction models. This approach integrates customized benchmark generation and performance analysis model transformation into a single MDA-based approach. 2.2 Benchmark Generation
There are a large number of code generation techniques and generator frameworks (Czarnecki and Helsen, 2003) that can be used in benchmark suite generation. We choose a model driven approach because code can be generated from architecture designs directly. This creates semantic links between our generated benchmark suite code and performance analysis models since they derive from the same application design model. Some pioneering work has been done on generating benchmark and prototyping applications using models, as in (Grundy et al., 2001, Grundy et al., 2004) (Liu et al., 2002, Rutherford and Wolf, 2003a). However, these have several limitations: • The code generators for the chosen technologies are built from scratch by the researchers. They do not utilize any
extensible generator frameworks, or draw upon the large pool of existing code generation “cartridges” for latest technologies that are maintained by an active community. When code generation cartridges are not exploited, any change to the chosen target technology or the introduction of a new technology requires significant extra work from the researchers.
• These methods do not follow the MDA standards. Most of them are built as proprietary modeling tools. Although some have used generic UML modeling tools, they use them to model proprietary modeling concepts. The models derived in this way are very different from UML architecture models in practice, and thus become throw-away artefacts. Consequently, existing industry experience with UML and code generation is not leveraged, making the code generation tasks for performance engineering an additional activity for developers to carry out, rather than a step in an incremental development process. Not following MDA may also compromise tool interoperability and semantic model traceability between derived models.

• The load testing part of the benchmark suite can not be comprehensively modeled compared to using the UML 2.0 Testing Profile. The latter distinguishes different testing elements (e.g. test context, test cases, data pool, data partition) within a testing environment. This makes load test suite modeling more modular, reusable and modifiable. Above all, it is standards-based.
Our approach directly addresses these limitations, as the remainder of the paper explains.
2.3 Performance Measurement Performance measurement for a benchmark suite includes end to end response time, throughput measurement and
application server related performance measurement. For end to end performance data, the application needs to be instrumented or a profiler used. Both take significant software engineering effort.
In our approach, the load testing suite is modeled in the UML 2.0 Testing Profile. A deployable implementation of performance data collecting utilities for response time and throughput are automatically generated in the load testing client. Executing the application causes performance data to be collected as part of the test execution, with performance data displayed in generated graphs.
Server-side performance related data can typically only be obtained using the particular component container’s management tools. These are currently mostly proprietary. However, this is changing as containers expose performance related information through programmatically accessible management components. For example, in J2EE, JMX-based (Java Management Extension) resource monitoring is becoming widely used and standardized. A similar approach is starting to be adopted in container-based Web service technologies (e.g. Enterprise Service Bus (ESB)) and standardized through Web Service Distributed Management (WSDM) (OASIS, 2005) though they are still at very early stage. In our approach, we exploit this new capability with the J2EE WebLogic application server in one case study. We use either configuration files or scripts generated from UML design models using MDA to monitor application server related performance data.
3. Customized Benchmark Generation using MDA
The overall structure of the benchmark generation system and related process workflow is presented in the boxed area in Figure 1. It also shows on the left side of the diagram the relationship with model-based performance prediction.
An application design in UML must be transformed manually or with tool assistance into a customized benchmark UML design model. This design usually represents the core characteristics of the application that are deemed by the architect to be the most performance critical. The criteria for this transformation are beyond the scope of this paper, as they depend on specific needs and characteristics of the project and performance analysis techniques.
The benchmark UML design model is then annotated with UML profiles for code generation, and a load testing suite is modeled using the UML 2.0 Testing Profile. This UML model is then exported using XMI and becomes an input to the AndroMDA tool framework. We have extended the AndroMDA framework with a new cartridge to generate a load testing suite and associated performance monitoring functionality. A cartridge is a collection of meta-model definitions (XML files), code generation handlers (code libraries) and templates. It can process model elements that have specified stereotypes and tagged values or model elements that meet certain conditions.
Along with exploiting existing cartridges, a complete deployable customized benchmark suite can be generated that has the capability for extensive performance measurements. The same application design can also be transformed into an analytical performance model. The measurements obtained by the benchmark suite can be integrated with the performance model and used to validate or improve its results. Semantic mappings and explicit model transformation rules provided by the MDA approach make such integration straightforward and systematic. This step is beyond the scope of this paper.

Figure 1. Model Driven Benchmark Suite Generation 3.1 Development Environment
We use an open source extensible framework, AndroMDA , for MDA based code generation. The reasons for this are twofold: • The success of any code generation framework depends on the range of generation capabilities available, along with the
extensibility of the framework itself. AndroMDA satisfies both of these requirements. Existing cartridges are maintained by a community of active developers. It also has no intrinsic limitations on extending it to platforms other than the current J2EE and Web (service) platforms.
• For a model driven approach to generate deployable components, some implementation details need to be captured at the model level. This makes abstract modeling harder and models cluttered, as models should be a reasonable abstraction devoid of as many details as possible. AndroMDA separates UML and generated code from the manually provided business logic implementation in different directories. This allows us to have both a code generation capability and abstract modeling at the same time. This separation also makes iterative development possible, which is essential in practical model-driven development.
We consequently have extended AndroMDA to support a subset of the UML 2.0 Testing Profile for load test suite generation. Based on the extended AndroMDA, benchmark designers can model their own benchmark application along with a load testing suite in UML. AndroMDA takes XMI outputs representing the UML design and generates deployable code using available code generation cartridges and our cartridge extensions. 3.2 Benchmark Application Generation
The core benchmark application generation simply exploits MDA development techniques using AndroMDA. The principle behind AndroMDA is to generate as much code as possible from marked PIMs. PIMs are modeled in a UML profile with platform independent stereotypes like “Entity”, “Service” and any necessary persistence information. PIMs can also be annotated with platform specific tagged values.
After modeling, AndroMDA generates all necessary source files including business method interfaces and implementation skeletons. The implementation skeletons are stored in a separate directory so future code re-generation will not override the skeletons.

Modeling and generating the benchmark application is not therefore a distinct engineering step from normal development activities. It can be considered as one of the steps in an incremental development process instead of a throw away performance prototyping activity. One PIM model can also be used to generate different deployable applications for different platforms with little modification. This can greatly reduce the cost and consequently the hurdle of performing performance engineering in practice. 3.2 Load Test Suite Generation
We model the load testing behavior using the UML 2.0 Testing Profile. This profile is an OMG standard, representing a comprehensive superset of existing widely used testing frameworks such as JUnit. Currently however, there is no test generator available based on the UML Testing Profile1. To develop a full test generation framework according to the profile is a major effort, and beyond our available resources. Hence we focused merely on modeling load tests using a subset of the profile and producing a default implementation of the model including both test logic and test data.
To this end, we have implemented the following stereotypes in the UML 2.0 Testing Profile through extending AndroMDA: • SUT (System under Test): This represents the application to be tested. It consists of one or more objects. The SUT is
exercised via its public interface by Test Components. In our approach, the SUT is the entry point for the system (e.g. a remote session bean in J2EE) which will be exercised for load testing purposes only.
• Test Context: This is a collection of test cases. In our approach, it consists of load test cases with a default implementation of loadTestAll(), which exercises all the business methods on the SUT.
• Test Component: Test components are classes of a test system. A test component has a set of interfaces via which it communicates with the SUT. Since we provide a default implementation of load test cases, users do not have to model their own Test Components. These Test Components are manifested as default method implementations within the loadTestAll() method. Users can choose to model their own Test Components, which will be treated as any normal class communicating with the SUT.
• Data Pool: A data pool is a collection of explicit values that are used by a test context or test components during testing. We use a data pool to model the load testing data used when calling each method on the SUT. The system will automatically generate random test data based on the data type and range specified. The data pool can also be used to specify the transaction percentage mix for all business methods by using tagged values associated with the stereotype. These configuration capabilities allow users to accurately and easily model the anticipated work load.
• Data Partition: Data partitions are logical values for a method parameter used in testing. It typically defines an equivalence class for a set of values. We use a Data Partition to partition the Data Pool into specific sections for load testing. A Data Pool is general enough for other testing purposes, including functional testing.
• Test Case: A test case is a specification of one or more test cases for the system. It includes what to test with which inputs and the results expected under various conditions. Test cases are modeled within a Test Context that consists of multiple test cases. In our approach, a loadTestAll() test case is implemented by default. It exercises all public methods on the SUT using randomly generated data modeled in a Data Pool and a selected Data Partition.
Figure 2 illustrates the subset of the UML 2.0 Testing Profile modeled in MagicDraw 8.0 as metafacade extensions in AndroMDA. They all extend the existing AndroMDA metafacade to take advantage of the underlying framework. Each metafacade also includes a set of tagged values associated with it to specify detailed configurations. (We omit the details of these extensions for clarity). The UML model can be exported as a profile which can be later used in a load testing suite modeled along with the benchmark application business logic.
1 The Eclipse Hyades project, which will eventually fully support it in terms of modeling (not automatic generation), remains in a nascent state

Figure 2. Extending AndroMDA to support UML 2.0 Testing Profile
Incremental and spike load simulation The initial set of test data is modeled rather simplistically. For example, users can only indicate an average transaction mix in the Data Pool. This is usually enough for normal load scenarios. However, many performance problems occur when a sudden request spike hits the application or the request load gradually increases over a period of time. To explore such scenarios, our cartridge supports a set of tagged values to reflect the common practice and terminology used in the performance engineering community (Gomez et al., 2005, TPC, 2004). Some examples are: • config.processes: The number of processes the load generator should start. • config.threads: The number of threads that each process spawns. • configr.runs: The number of runs of the test each thread performs. • config.duration: The maximum length of time in milliseconds that each process should run for. • config.initialProcesses: The initial number of processes to start with. • config.processIncrement: The number of processes to increase or decrease for an incremental time interval. • config.processIncrementInterval: The time interval between starting up or stopping new processes. • config.stabilizationperiod: An estimated time before a steady state period is reached. How to estimate the starting time
of the steady state period is specific to the testing environment. Performance data collection only commences after the stabilization periods.
Such values are directly configured on the model through tagged values. A configuration file is then generated on the
first round of code generation. Subsequently, if only the configuration needs to be changed, it is possible to either change the configuration file directly or let the code generator re-generate the file without affecting the rest of the application.
The AndroMDA extension for load test modeling and generation results in a new cartridge that can be put into the AndroMDA cartridge repository. It works with all other existing server-side generation cartridges. Our cartridge includes some supporting facilities and a library of handlers for code generation written in Java. This facilitates the reuse of existing cartridges and framework facilities. It also enables template writers to access the metafacades in templates using tags. The separation of OO based metamodeling with template based code generation provides flexibility and ease of use.
We provide a complete template for generating a default implementation of the loadTestAll() test case with randomly generated data based on a data pool model. A database seeder is also generated to repopulate the database before a new test. These capabilities greatly reduce the extra effort involved in using the suite in load testing activities, in which performance testing is the main interests of the software engineer. 3.3 Performance Data Collection
In the above two sections, we have explained how we have used MDA principles to generate a benchmark suite including a core benchmark application and a load testing client. We also need to collect performance data for either informal analysis or to feed in to a performance analysis model. The data we need falls into two categories, namely:

Application related profiling information:
This includes end to end timings for requests and counts on method calls, CPU workload and memory status, garbage collection counts and so on. Much of this data must be obtained through running a profiler and system utilities. In our default load testing implementation, the end to end response time distribution, average response time and throughput are automatically recorded by the client. A response time distribution graph for each run is also automatically generated. This data is crucial for performance analysis, and is easy to obtain if the default implementation is used. Application server (middleware and framework) related information
This includes health indicators of the application server or framework itself and component related information that may have performance implications. For example, when testing EJBs, the component pool, runtime cache status and data source pool usage can be inspected. This information is typically collected through an EJB container-proprietary user interface and with logging and export functions, and the effort required varies immensely between different EJB platform implementations.
As mentioned in section 2.3, several J2EE containers have recently exposed container related information using JMX MBeans for both API based and scripting access. With the help of JMX based container monitoring, we can automate the container performance monitoring using script and configuration file generation. Importantly, the generation templates only need to be written once for each container and can be reused for different application designs.
In our approach, two styles of accessing the information are available for the J2EE platform: • We can use the JMX Java API to query the MBeans directly. A generic MBean information query and collection
program runs independently of the benchmark application, and reads a generated configuration file. The configuration file includes the name of the MBean providing the performance information, methods to be called and all necessary parameters. The data collecting program is J2EE container specific and needs to be developed once for each container. With MDA, this requires a generation template. The configuration file can then be automatically generated from the UML model for different application designs. Figure 3 is a snippet of such a generation template.
• A more convenient solution is to leverage the scripting shell provided by some J2EE containers. In this case, no JMX-based data collection program is involved. All that needs to be generated is appropriate scripts for collecting the measurement of interests. For example, third party applications like wlshell for Weblogic JMX and the newly integrated WLST (BEA, 2004) for Weblogic 9.0 provide a scripting shell for accessing the information in MBeans. Figure 4 is an example of the generated scripts for collecting EJBPoolRuntime performance information.
We provide both shell script and configuration file generation templates for the Weblogic platform. We assume by default the target of the performance measurement will be all the beans in the container and business methods supported. Architects can tailor this by commenting out unwanted parts in the generated files.
Figure 3. A (partial) configuration generation template
Figure 4. JMX-based server side monitoring using scripts
# methods for Session and MDB Pool <XDtMethod:forAllMethods> <XDtMethod:methodName/>:<XDtMethod:methodNameWithoutPrefix/> </XDtMethod:forAllMethods> </XDtClass:forAllClass> … <XDtEjbSession:forAllBeans> EjbPoolRuntime:<XDtEjbSession:concreteFullClassName/> </XDtEjbSession:forAllBeans>
#Get Runtime info for Session Bean and MDB ls /EJBPoolRuntime ejbpool = $LAST for $ejb in $ejbpool do sb1 = get /EJBPoolRuntime/$ejb/AccessTotalCount sb2 = get /EJBPoolRuntime/$ejb/IdleBeansCount sb3 = get /EJBPoolRuntime/$ejb/BeansInUseCurrentCount end
The Web service framework we have worked on in our case study (Apache Axis 1.3) so far do not have equivalent performance APIs for their internal state. 4. Case Studies
We use the Stock-Online system (Gorton, 2000) as a case study to illustrate our approach. The Stock-Online system is a proven benchmark for evaluating various middleware platforms. The original system was developed for different J2EE platforms. Due to platform differences, there was significant effort involved in implementing the same design for different platforms, and keeping the benchmark application in line with component technology advancements required significant ongoing effort. Hence, it makes sense to use Stock-Online as a case study to demonstrate the amount of effort that can be saved utilizing MDA development and code generation.
The case study’s aim is to generate the Stock-Online system, including a load testing suite, purely from UML models. To this end, two variations are generated using two J2EE platforms, for the WebLogic and JBoss platforms respectively, both using the same Oracle database backend. To demonstrate the effectiveness of our approach, the same UML model with minimal change is then used to generate a benchmark application for a Web services platform. The result demonstrates the amount of effort saved across vendor implementations in the same standard (two different J2EE application servers) and across totally different platforms (J2EE and web services platforms) 4.1. Benchmark Application Modeling for J2EE
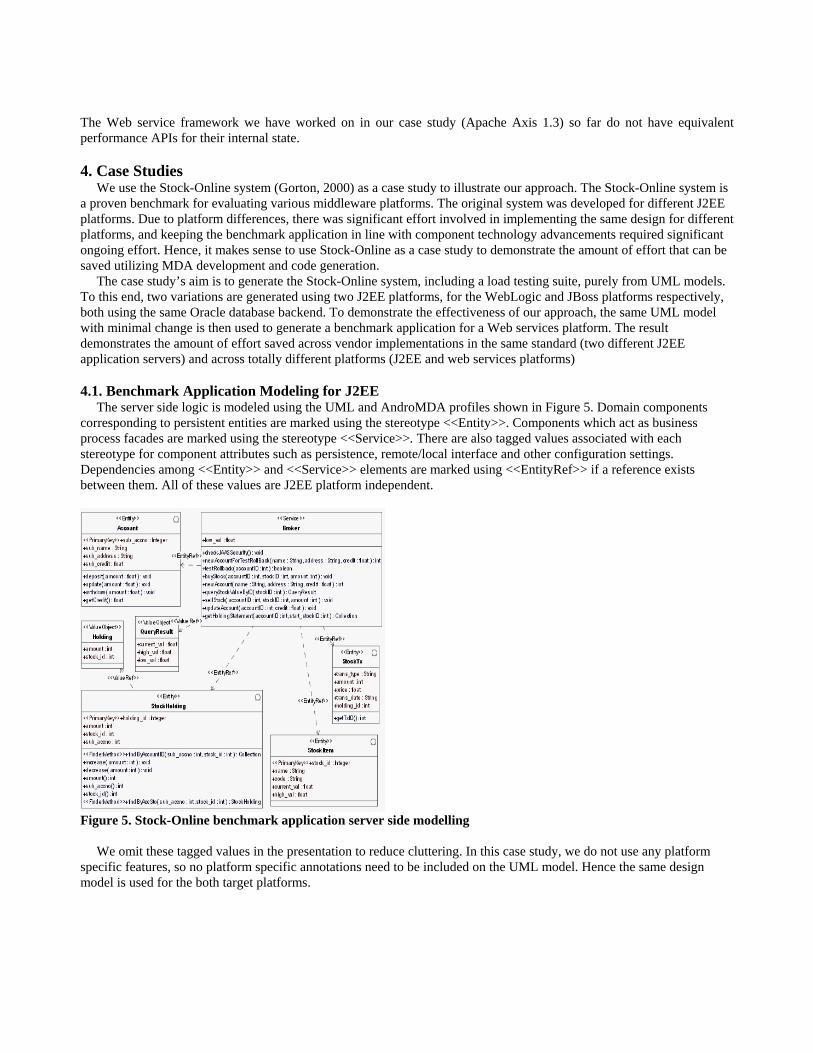
The server side logic is modeled using the UML and AndroMDA profiles shown in Figure 5. Domain components corresponding to persistent entities are marked using the stereotype <<Entity>>. Components which act as business process facades are marked using the stereotype <<Service>>. There are also tagged values associated with each stereotype for component attributes such as persistence, remote/local interface and other configuration settings. Dependencies among <<Entity>> and <<Service>> elements are marked using <<EntityRef>> if a reference exists between them. All of these values are J2EE platform independent.
Figure 5. Stock-Online benchmark application server side modelling
We omit these tagged values in the presentation to reduce cluttering. In this case study, we do not use any platform
specific features, so no platform specific annotations need to be included on the UML model. Hence the same design model is used for the both target platforms.

4.2 Modeling the Load Testing Suite for J2EE The load testing suite for Stock-Online is modeled using a subset of the UML 2.0 Testing Profile with support from
our extensions to AndroMDA. The load testing suite model for Stock-Online is shown in Figure 6.
Figure 6. Stock-Online benchmark load test model
Figure 7. Transaction type and percentage mix modeled using <<Data Pool>>
The load testing entry point is the Broker bean. It is the front end component of the system under test, which is marked using <<SUT>>. ClientDemo is the <<TestContext>> which consists of test cases. Only the default loadTestAll() test case is included with its default implementation to be generated. For simplification, all the test data is modeled in TrxnData from which <<DataPartition>> LoadTestingTrxnData is derived. In more complicated situations, several test data classes may exist. In <<DataPool>> TranDeck, we can also indicate the transaction mix percentage as tagged values shown in Figure 7. For example, queryStock represents 34.9% of all transactions and getHolding represents 11.7%. This data will be used in randomly generating test data which simulates the real work load.
We then export both the core benchmark application and load testing suite UML diagrams into XMI compatible formats. Since we are not using any application server specific modeling information in our model, the exported UML model will be used for both WebLogic and JBoss code generation. 4.3 Customized Benchmark Generation, Deployment and Execution
By running the AndroMDA wizard, two EJB project directory structures are generated for WebLogic and JBoss respectively. These consist of a MDA directory for storing the exported UML model, and directories for storing source code and the future deployable application. Project property files for specifying dependencies on the targeted platforms and other deployment configurations are also generated. We then copy the exported UML model into the designated MDA directory and run the code generation engine.

Source code is generated based on the UML model. For the client side, the complete load testing suite is generated without the need for further modification. The load testing logic and random test data is derived from the load testing UML model and method signatures of the server-side component interface.
The server-side component code is generated following EJB best practices, including value objects. Business logic inside each component method needs to be manually added by placing implementation code into a separate directory. This prevents overriding manual modification by subsequent code generation iterations. It also separates the implementation from the specifications (interfaces) which derive from the UML design. After adding the server side business logic code, the AndroMDA framework generates the deployable package. The generated application is almost a carbon copy of the manually written Stock-Online system (Gorton, 2000).The application is then deployed in the following environment: Table 1. Hardware and Software Configuration Machine Hardware Software Client Pentium 4 CPU 2.80 GHz,
512M RAM Windows XP, JDK1.4
Application and database server
Xeon Dual Processors, 2.66 GHz, HyperThreading enabled, 2G RAM
WindowsXP Prof. JDK1.4 with settings –hotspot, –Xms512m and –Xmx1024m, Oracle 9i and thin JDBC driver
4.4 Performance Output for Two J2EE Platforms
The benchmark test workload, defined by the number of concurrent requests, is specified in the workload generator. We then run load tests and obtain the following performance results automatically: • Response time distributions in both log files and chart based graphs • Average response time for each request • Application throughput in terms of transactions per second.
Figure 8 shows example response time distribution charts for two application servers under a workload of 100 concurrent clients.
Figure 8. Samples of response time distribution on two J2EE application servers
By utilizing the JMX-based monitoring and data collection techniques described in section 3.3, many server side internal parameters can be obtained. For example, Figure 9 shows the performance parameters automatically collected from benchmark execution for 100 clients on WebLogic application server with 20 server threads and 20 database connections.
The performance data collected in this example is the same as we have been collecting in conducting various empirical studies on evaluating architecture candidates and platforms. Interested readers can refer to (Liu, 2004) for the details of the type of data collected and how to interpret the data for performance comparisons. Using the technology described in this paper, we now have a tool for automatically generating the core application and load testing components of benchmarks following MDA, and efficiently capturing the performance data.

• JDBC Connection Pool
PrepareStatement cache hit ratio = 99.999% Current # of active connections = 19 # of pending requests = 0 Average # of active connections = 12 Maximal # of active connections = 20
• Application Server Worker Thread Pool Current # of idle threads = 0 Current # of pending requests = 79 # of requests completed = 43,000
• Entity Bean Cache Cache hit ratio = 69%
Figure 9. Parameters collected based on automatically generated JMX monitoring configurations 4.5 Benchmark application modeling for Web services For simplicity, we present only the different parts from the J2EE case study since the majority of the models presented to the end users are the same. One of our motivations behind MDABench is to reuse the same model as much as possible and hide platform differences in the cartridge.
Figure 10. Benchmark Modeling for the Axis Web service platform .
Figure 10 shows the load test modeling and the system under test (SUT) entry component (Broker). On server side, an extra <<WebService>> stereotype is used to annotate the web service class. By default, all the
operations can be assessed as Web services. If only selected methods need to be exposed as web services, a method level stereotype <<WebServiceOperation>> can be used. In Web service modeling, many performance parameters can be made through configurations on the model directly, such as WSDL binding styles (RPC/Document) and binding use styles (Encoded/Literal). As we have annotated on the diagram through tagged values on the Broker class, we use the doc/literal wrapped pattern. The wrapped pattern is a slightly improved variation of the commonly used doc/literal style. This is

considered the best configuration for performance. Such tuning largely depends on the server side cartridge. However, the values can be queried by the load testing client to conduct necessary style-specific testing and performance measurement.
There is virtually no change on the client side modeling except the configuration of the endpoint through a tagged value. All the extra changes involved are encapsulated in the client cartridge. If a Web service targeted model is detected, the cartridge will generate Web service specific look-ups and a Web service client while the rest of the testing logic and data is untouched. 4.6 Performance output for Axis web service platform
The same set of performance data is collected for the Web service benchmark application. Figure 11 shows the response time for 25 and 50 clients respectively. The spikes at the end of the 5000ms indicate all response times longer than 5000ms.2 Figure 12 shows the average response time and TPS in terms of number of threads in an incremental requests simulation scenario.
Comparisons between different platforms are beyond the scope this paper.
Figure 11. Samples of response time distribution for 25/75 clients on Axis
Figure 12. Average response time and throughput on Axis in an incremental requests simulation
There are no JMX equivalents and performance APIs in Axis for internal performance or service performance monitoring. Thus we did not generate performance monitoring configurations files for obtaining such data as we did for J2EE platforms.
2 The range can be easily changed, and all raw response times are collected in text files for possible further analysis.

5. Discussions 5.1 Evaluation
It took considerable effort to develop the original Stock-Online application for different middleware platforms, conduct load testing and collect performance data. Extending it to Web service platform later involved another round of similar effort. Though familiarization of the business logic might make it easier, the repetitive and error prone parts for testing and infrastructure plumbing are the components that have to be rebuilt for each platform.
Using our extended framework, one student, the main developer of the AndroMDA extension but with no experience with J2EE, took one week to model the system and conduct the load tests on WebLogic. It took her another half day to deploy the system on JBoss and conduct the same load testing. It took us some time to adapt our testing suite cartridge to Web services. However, after this once-off effort, it took the student another day to change the benchmarking model with Web services annotation and conduct all the tests.
We realize that this effort comparison it is anecdotal, and we do not have accurate effort data from the original development team. It is also easier to develop the same application the second time. However, it is preliminary evidence that the effort spent on the basic plumbing code and load test suite has been absorbed by cartridge developers and code generation. Hence we believe the productivity savings afforded by this approach are potentially considerable. We are planning to conduct a thorough empirical investigation on this. Of course productivity is only one of the benefits. Quality is also improved by encapsulating best practices in the reusable cartridge, and portability and modifiability achieved through MDA standard compatibility.
In our case study, we are not using any vendor specific features in J2EE platform so one single UML model is used for both the JBoss and WebLogic platforms. If platform specific features are involved, the model has to be marked with platform specific information using tagged values. The additional complexity of using the platform specific features is also hidden by the code generation cartridges.
For the Web service platform, we have only collected the basic response time and throughput data. The cartridge is also capable of doing spike and incremental load simulation. Extra Web services specific performance data such as message sizes can also be collected. There are no sophisticated APIs as in the J2EE component technologies for querying platform internal performance related or service related indicators. However, with the maturing of ESB platforms and the adoption of WSDM standards, such APIs or configuration-based performance monitor are appearing. We are investigating how to further adapt our cartridge to collect a more complete set of performance data for Web service platforms.
Making changes to the design to generate a new version of the benchmark is also simpler. If new business components and methods are introduced, new implementation code needs to be added to the generated skeleton on the server side. No change needs to be made on the client load testing part. Changing design elements like stateful/stateless beans or Web service binding styles are simply a matter of changing the UML model. All the changes will be propagated in the source code and deployment information.
In the process of developing our approach and implementation, we integrated performance engineering best practices from the various leading technologies and our own experience. The internal structured design of the load testing client is inspired by ECperf/SPECjAppser (ECperf, 2001). Performance metrics are based on industry standards such as TPC-W (TPC, 2004). Performance collecting utilities are based on our own long experience on performance testing. Incremental and spike simulation are inspired by Grinder 3 (Gomez et al., 2005). All these best practices are essentially encapsulated in the cartridge, and its use automatically supports these best practices through generated code structures and utilities. This is one of the main motivations behind MDABench.
Generating a benchmark application is essentially not different from generating any software application. A benchmark application usually either captures the performance critical parts of the full application or acts as a way of exercising off-the-shelf component framework services which you are interested in. By unifying benchmark related performance work with normal application development in a single consistent environment, we facilitate incremental design and development. This helps to incorporate performance engineering tasks into the SDLC with minimal cost. 5.2 Limitations
There are still several limitations of this approach: • AndroMDA is generic enough to support platforms other than the existing J2EE and Web service platforms. Still, the
existing cartridges are limited to these two different types of platforms. The lack of .NET platform support has limited us from applying our approach to a wider collection of platforms. However, new third party vendors such as ArcStyler

have successfully provided MDA support for .NET. On the other hand, Microsoft has integrated a model based modeling capability (Domain Specific Modeling) in its new Visual Studio, along with potential interoperability with UML. Because our philosophy is to integrate architecture driven performance engineering into practical development environments, we are currently applying the same concepts presented in this paper to Microsoft DSL environment.
• The default implementation of the load testing suite is still relatively simple. It covers only successful testing scenario generation. In real applications, performance of exception handling and transaction rollback is also a major concern. Currently, users have to implement such scenarios manually. We are considering integrating these both at the modeling level and in the default implementation in future versions. We will also take advantage of some other interesting concepts in UML 2.0 Testing Profile such as Arbiter and Verdict stereotypes for determining the success of the test run.
6. Conclusion and Future Work
This paper has presented an approach to generate a customized benchmark application from architecture designs based on the J2EE and Web service platform using MDA. An implementation of this approach based on extending an open source MDA framework has been described and demonstrated.
A benchmark design is modeled with platform independent models in UML. A corresponding load testing suite is modeled following a subset of the UML 2.0 Testing Profile. Deployable code is then generated for both the core benchmark design and its associated load testing suite. The core application is generated by taking advantage of existing code generation cartridges maintained by the open source community. The load test suite generator has been developed by the authors, and fully integrates with the core application generation. Case studies using EJB component technology (Weblogic/JBoss) and the Axis Web services platform for the Stock-Online benchmark suite have demonstrated the tools and the generated outputs from load tests.
This approach has several significant advantages over proprietary model-based CASE tool environments for benchmark generation. Using MDA and exiting open source MDA frameworks reduces the learning curve and training effort required, and improves model traceability and tool interoperability. The default implementation and test data generation saves a large amount of load testing effort. The approach also complements existing model-based performance prediction methods by providing the potential to use the benchmark results for calibrating and validating analytical performance models. The semantic traceability achieved through MDA makes this integration easier, and this remains a major objective of our future work.
7. Acknowledgments
National ICT Australia is funded through the Australian Government's Backing Australia's Ability initiative, in part through the Australian Research Council. 8. References AndroMDA, 2005. AndroMDA v3.0M3, http://andromda.org/. Apache, 2005. Apache Axis 1.3 Final, http://ws.apache.org/axis/. Balsamo, S., Di Marco, A., Inverardi, P. and Simeoni, M., 2004. Model-based performance prediction in software development: a survey. IEEE Transactions on Software Engineering 30 (5), 295-310. BEA, 2004. WebLogic Scripting Tool (WLST), http://e-docs.bea.com/wls/docs90/config_scripting/index.html. Czarnecki, K. and Helsen, S., 2003. Classification of Model Transformation Approaches, In: Proceedings of the OOPSLA'03 Workshop on Generative Techniques in the Context of Model-Driven Architectures. ECperf, 2001. ECperf v1.1, http://java.sun.com/j2ee/ecperf/index.jsp. Gomez, P., Aston, P. and etc, 2005. The Grinder V3.0-beta23, http://grinder.sourceforge.net/. Gorton, I., 2000. Enterprise Transaction Processing Systems: Putting the CORBA OTS, Encina++ and OrbixOTM to Work, Addison-Wesley. Gorton, I. and Liu, A., 2003. Evaluating the performance of EJB components. IEEE Internet Computing 7 (3), 18-23. Gorton, I., Liu, A. and Brebner, P., 2003. Rigorous evaluation of COTS middleware technology. IEEE Computer 36 (3), 50-55. Grundy, J., Cai, Y. and Liu, A., 2001. Generation of distributed system test-beds from high-level software architecture descriptions, In: Proceedings of the 16th Annual International Conference on Automated Software Engineering (ASE). Grundy, J., Wei, Z., Nicolescu, R. and Cai, Y., 2004. An environment for automated performance evaluation of J2EE and ASP.NET thin-client architectures, In: Proceedings of the Australian Software Engineering Conference (ASWEC). Grundy, J. C., Cai, Y. and Liu, A., 2005. SoftArch/MTE: Generating Distributed System Test-beds from High-level Software Architecture Descriptions,. Automated Software Engineering 12 (1), 5-39. Hyades, 2005. Eclipse Hyades, http://www.eclipse.org/hyades/. Liu, Y., 2004. Performance Prediction of Component-based System, Ph.D. Thesis, University of Sydney, Sydney, Australia.

Liu, Y. and Gorton, I., 2004. Accuracy of Performance Prediction for EJB applications: A statistical analysis, In: Proceedings of the Software Engineering for Middleware (SEM). Liu, Y., Gorton, I., Liu, A., Jiang, N. and Chen, S., 2002. Design a Test Suite for Empirically-based Middleware Performance Prediction, In: Proceedings of the TOOLS Pacific. Marco, A. D. and Inverardi, P., 2004. Compositional Generation of Software Architecture Performance QN Models, In: Proceedings of the 4th Working IEEE / IFIP Conference on Software Architecture (WICSA). OASIS, 2005. OASIS Web Services Distributed Management (WSDM), http://www.oasis-open.org/committees/tc_home.php?wg_abbrev=wsdm. OMG, 2005. Model Driven Architecture, http://www.omg.org/mda/. Rutherford, M. J. and Wolf, A. L., 2003a. A case for test-code generation in model-driven systems, In: Proceedings of the the second international conference on Generative programming and component engineering, Erfurt, Germany. Rutherford, M. J. and Wolf, A. L., 2003b. Integrating a Performance Analysis Kit into Model-Driven Development, In: Proceedings of the the 5th GPCE Young Researchers Workshop 2003, Erfurt, Germany. Skene, J. and Emmerich, W., 2003a. Model Driven Performance Analysis of Enterprise Information Systems. Electronic Notes in Theoretical Computer Science 82 (6), 1-11. Skene, J. and Emmerich, W., 2003b. A model-driven approach to non-functional analysis of software architectures, In: Proceedings of the 18th IEEE International Conference on Automated Software Engineering (ASE). TPC, 2004. TPC Benchmark W (TPC-W), http://www.tpc.org/tpcw/spec/TPCWV2.pdf. Weis, T., Ulbrich, A., Geihs, K. and Becker, C., 2004. Quality of service in middleware and applications: a model-driven approach, In: Proceedings of the Eighth IEEE International Enterprise Distributed Object Computing Conference(EDOC). wlshell, 2005. wlshell, v.2.0.2, http://www.wlshell.net/. Yilmaz, C., Memon, A. M., Porter, A. A., Krishna, A. S., Schmidt, D. C., Gokhale, A. and Natarajan, B., 2004. Preserving distributed systems critical properties: a model-driven approach. Software, IEEE 21 (6), 32-40.