Preliminary Atmospheric Hazard Assessment for Mars Science Laboratory Entry, Descent and Landing

NASA/TM—2014–217499
Mars Global Reference Atmospheric Model2010 Version: Users GuideH.L. JusthMarshall Space Flight Center, Huntsville, Alabama
February 2014
https://ntrs.nasa.gov/search.jsp?R=20140003184 2020-04-06T03:50:45+00:00Z

�������������� ������������
Since its founding, NASA has been dedicated to the advancement of aeronautics and space science. The �������������� ���������������������������������������������������������������������maintain this important role.
������������������������������������ ����!������"��������#���$������� ��������������%����������� �����������������&�������������������������������'� ������������the NASA STI Database, the largest collection of aeronautical and space science STI in the world. ������������������������������%�����(�����mechanism for disseminating the results of its research and development activities. These results �����(������ �����������������������"�����������$�)��������( �����������)�������������*
+� �-#6��#�!��:;!�#�����&�"���������������� �����������������<�����������phase of research that present the results of NASA programs and include extensive data ��������������������&����( ���������������������������������� ��������� ���and information deemed to be of continuing reference value. NASA’s counterpart of peer-reviewed formal professional papers but has less stringent limitations on manuscript length and extent of graphic presentations.
+� �-#6��#�!�>->�"��?:>&���������� ���������� ������������������������������������@� ������$��&�&$�B(������������������$�)������������$�� ������������������������minimal annotation. Does not contain extensive �������&
+� #���"�#��"�"-��"�&���������� ���������� �����������C������� �contractors and grantees.
� #��E-"-�#-��:;!�#�����&�#������ ���������������������� ������������������$���������$��������$����������������������� ������������� ��������&
+� ��-#��!��:;!�#�����&��������$��������$�or historical information from NASA programs, projects, and mission, often concerned with subjects having substantial public interest.
+� �-#6��#�!��"���!�����&� English-language translations of foreign
��������� �������������������������NASA’s mission.
Specialized services that complement the STI �������������%�� �'�����������������( ���������custom thesauri, building customized databases, organizing and publishing research results…even providing videos.
E��������������������(��������������������������$�������������)��*
• Access the NASA STI program home page at G��*JJ)))&��&���&��'K
+� -C�������(��B(�����'������������� G����L��&���&��'K
+� �����������������6����?������ 757 –864–9658
+� P�����*� ������������������?��� Mail Stop 148� �����!������"��������#���� 6����$�Q��RUVWXYRXZZ$�:��

i
NASA/TM—2014–217499
Mars Global Reference Atmospheric Model2010 Version: Users GuideH.L. JusthMarshall Space Flight Center, Huntsville, Alabama
February 2014
National Aeronautics andSpace Administration
Marshall Space Flight Center • Huntsville, Alabama 35812

ii
vailable from:
NASA STI Information DeskMail Stop 148
NASA Langley Research CenterHampton, VA 23681–1299, USA
757–864–9658
This report is also available in electronic form at<http://www.sti.nasa.gov>
Acknowledgments
The author thanks Dan Murri, Jill Prince, and the NASA Engineering Safety Center for support provided through the Autonomous Aerobraking Development Plan, as well as the Mars Program Office and Jet Propulsion Laboratory for their support of the updating and maintaining of the Mars Global Reference Atmospheric Model (Mars-GRAM). Mars-GRAM was originally developed under the leadership of Dr. Carl Gerald (Jere) Justus. The first release of Mars-GRAM occurred in May 1988. A complete history of Mars-GRAM program versions is contained in the marshist.txt file that can be found in the documentation folder within the Mars-GRAM 2010 zip file.

iii
PREFACE
The 2010 version of the Mars Global Reference Atmospheric Model (Mars-GRAM 2010) was developed by the Natural Environments Branch, Spacecraft and Vehicle Systems Department, Engineer-ing Directorate, of the NASA Marshall Space Flight Center.
For those unfamiliar with earlier versions of Mars-GRAM, NASA TM-108509, “Mars Global Reference Atmospheric Model (Mars-GRAM 3.34) Programmer’s Guide,” NASA TM-108513, “A Revised Thermosphere for the Mars Global Reference Atmospheric Model (Mars-GRAM Version 3.4),” NASA/TM—1999–209629, “Mars Global Reference Atmospheric Model (Mars-GRAM) Version 3.8: Users Guide,” NASA/TM—2000–210279, “Mars Global Reference Atmospheric Model 2000 Version (Mars-GRAM 2000): Users Guide,” and NASA/TM—2001–210961, “Mars Global Reference Atmospheric Model 2001 Version (Mars-GRAM 2001): Users Guide” are recommended. These Technical Memorandums are available electronically from the NASA Technical Report Server at <http://ntrs.nasa.gov/> or in hardcopy from
National Technical Information Service 5285 Port Royal Road Springfield, VA 22161
For information on obtaining Mars-GRAM 2010 (or earlier) code and data, as well as additional copies of this Technical Memorandum, contact
Natural Environments Branch Mail Code EV44 Marshall Space Flight Center, AL 35812
Attn: Hilary L. Justh Phone: 256–544–3694 E-mail: [email protected]
Examples of output from the University of Michigan Mars Thermospheric General Circulation Model (MTGCM) are available for browsing by interested readers at the following Web site: <http://data.engin.umich.edu/tgcm_planets_archive/thermo.html>. This Web site has a constantly changing archive of available MTGCM case runs for use by the scientific community at large.
Examples of output from the NASA Ames Mars General Circulation Model (MGCM) are avail-able for browsing by interested readers at the following Web site: <http://humbabe.arc.nasa.gov/>. This Web site includes example MGCM output based on Mars Orbiter Laser Altimeter (MOLA) topography and pre-MOLA topography.

iv

v
TABLE OF CONTENTS
1. INTRODUCTION .............................................................................................................. 1
1.1 Background and Overview .......................................................................................... 1 1.2 Basic Description of Mars-GRAM 2010 ...................................................................... 1 1.3 Significant Changes in Mars-GRAM 2010 ................................................................... 2
2. PREEXISTING FEATURES OF MARS-GRAM 2010 ..................................................... 3
2.1 Mars Orbiter Laser Altimeter Topography Data ........................................................ 3 2.2 Mars General Circulation Model Input Data ............................................................. 4 2.3 Longitude-Dependent (Terrain-Fixed) Wave Model ................................................... 6 2.4 Mars-GRAM Climate Factors and Height Adjustment .............................................. 8 2.5 Quantitative Dust Concentration Model ..................................................................... 9 2.6 Solar and Thermal Radiation From Mars-GRAM Output ........................................ 10 2.7 Slope Wind Model ...................................................................................................... 10 2.8 Traditional Mars-GRAM Options for Representing the Mean Atmosphere Along Entry Corridors ................................................................................................ 11 2.9 Auxiliary Profile Option ............................................................................................. 11
3. NEW FEATURES OF MARS-GRAM 2010 ..................................................................... 13
3.1 Mars-GRAM 2010 Adjustment Factors ...................................................................... 13
4. HOW TO RUN MARS-GRAM 2010 .................................................................................. 15
4.1 How to Obtain the Program ........................................................................................ 15 4.2 Running the Program ................................................................................................. 15 4.3 Program Input ............................................................................................................ 17 4.4 Program Output .......................................................................................................... 23
5. SAMPLE RESULTS ........................................................................................................... 24
5.1 Improvement of Mars-GRAM 2010 at Lower Altitudes ............................................. 24 5.2 Improvement of Mars-GRAM 2010 at Aerobraking Altitudes ................................... 26

vi
TABLE OF CONTENTS (Continued)
APPENDIX A—HEADERS FOR MARS-GRAM 2010 OUTPUT FILES ........................... 29
APPENDIX B—EXAMPLE NAMELIST FORMAT INPUT FILE ..................................... 35
APPENDIX C—SAMPLE OUTPUT LIST FILE .................................................................. 39
APPENDIX D—SUMMARY OF FILES PROVIDED WITH MARS-GRAM 2010 ............ 56
APPENDIX E—EXAMPLE APPLICATION OF MARS-GRAM IN A TRAJECTORY CODE ....................................................................... 63
APPENDIX F—DETAILS OF MGCM, MTGCM, AND MOLA DATA FILES .................. 65
APPENDIX G—AUXILIARY PROGRAMS FOR USE WITH MARS-GRAM ................. 71
REFERENCES ....................................................................................................................... 76

vii
LIST OF FIGURES
1. Latitude-height contours of density ratio (Mars-GRAM/TES limb) after application of MGCM adjustment factors .......................................................... 24
2. Density ratio (Mars-GRAM/TES) for Mars-GRAM 2005 ......................................... 25
3. Density ratio (Mars-GRAM/TES) for Mars-GRAM 2010 .......................................... 25
4. The 99th percentile density ratios of the profile data from MGS, MRO, and ODY to Mars-GRAM 2010 output versus height ................................................. 26
5. Contour plots of the ratio of observed PDS density values to Mars-GRAM output values (before adjustment) versus height and latitude ....................................... 27
6. Contour plots of the ratio of observed PDS density values to Mars-GRAM 2010 output values (after adjustment) versus height and latitude ................................. 28
LIST OF TABLES
1. Global average height offset (km) required for MTGCM-MGCM matchup, as a function of solar longitude and dust optical depth ............................................... 9

viii
LIST OF ACRONYMS AND ABBREVIATIONS
ASCII American Standard Code for Information Interchange
AU astronomical unit
COSPAR Committee on Space Research
ERT Earth-receive time
FTP file transfer protocol
GCM General Circulation Model
IAU International Astronomical Union
Lat latitude
LDW longitude-dependent waves
Lon longitude
LTST local true solar time
Mars-GRAM Mars Global Reference Atmospheric Model
MET Mars-event time
MGCM Mars General Circulation Model
MGS Mars Global Surveyor
MOLA Mars Orbiting Laser Altimeter
MRO Mars Reconnaissance Orbiter
MTGCM Mars Thermospheric General Circulation Model

ix
LIST OF ACRONYMS AND ABBREVIATIONS (Continued)
NPOS desired number of positions
ODY Mars Odyssey
PC-DOS personal computer Disc Operating System
PDS Planetary Data System
TES thermal emission spectrometer
TT terrestrial (dynamical) time
UTC coordinated universal time

x
NOMENCLATURE
A coefficient
A0 diurnal mean value of the given parameter (temperature, pressure, density and wind components)
A1 amplitude of the diurnal tide component
A2 amplitude of the semi-diurnal tide component
B coefficient
B0 diurnal mean value of longitude-dependent wave
B1,B2,B3 amplitude of the LDW peak for wave-1, wave-2, and wave-3 components
d Julian day at which LDW is evaluated
d0 Julian day for the primary peak(s) of the LDW traveling component
F adjustment factor
F10 solar activity parameter
F10.7 solar flux at 10.7 cm wavelength (10–22 W/cm2 at 1 AU)
Fh height factor
F(z) logarithmic height factor
g gravity (3.712 m/s2 at the surface of Mars)
H local pressure scale height (km)
Lat latitude (degrees)
Ls areocentric longitude of the Sun from Mars (degrees)
md areal dust density (kg/m2)
n number of peaks and troughs the wave component has through 360 degrees of longitude

xi
NOMENCLATURE (Continued)
p pressure (N/m2)
psfc surface pressure (N/m2)
q0 dust mixing ratio, mass of dust per unit mass of air, at the surface
R gas law ‘constant’
Ri Richardson number
S wave scale parameter
T temperature (K)
T5 temperature at 5 m (K)
Tg temperature at ground surface (K)
t local solar time (hours)
u wind component (m/s)
v wind component (m/s)
ZF height of the 1.26 nbar pressure level (km)
z height (km)
z0 surface roughness parameter
λ longitude (degrees)
Δz0 input value of constant height offset (km)
ς height parameter
ρ density (kg/m3)
τ optical depth
Φ1, Φ2, Φ3 phases (longitude) of the LDW peak for wave-1, wave-2, and wave-3 components
�1•,�2
• ,�3• rate of movement of the LDW peak for wave-1, wave-2, and wave-3 components
xii
NOMENCLATURE (Continued)
φ1 phase (local time in hours) of diurnal tide component
φ2 phase (local time in hours) of semi-diurnal tide component

1
TECHNICAL MEMORANDUM
MARS GLOBAL REFERENCE ATMOSPHERIC MODEL2010 VERSION: USERS GUIDE
1. INTRODUCTION
1.1 Background and Overview
The Mars Global Reference Atmospheric Model (Mars-GRAM) is an engineering-level atmospheric model widely used for diverse mission applications. Applications include systems design, performance analysis, and operations planning for aerobraking, entry, descent and land-ing, and aerocapture. Mars-GRAM has been utilized during the aerobraking operations of Mars Global Surveyor (MGS),1 Mars Odyssey (ODY), and Mars Reconnaissance Orbiter (MRO). Mars-GRAM has also been used in the prediction and validation of Mars Pathfinder hypersonic aero-dynamics,2 the aerothermodynamic and entry dynamics studies for Mars Polar Lander,3 the Mars Aerocapture System Study, as well as the Aerocapture Technology Assessment Group.
Mars-GRAM versions4–8 prior to Mars-GRAM 2000 were based on ad hoc parameteriza-tions to data observed by the Mariner and Viking missions. Mars-GRAM 2000,9 Mars-GRAM 2001, Mars-GRAM 2005, and the current version, Mars-GRAM 2010, are based on input data tables derived from output results from the NASA Ames Mars General Circulation Model (MGCM)10,11 and the University of Michigan Mars Thermospheric General Circulation Model (MTGCM).12,13
Section 1 provides an overview of Mars-GRAM 2010. Section 2 of this Technical Memo-randum describes the MGCM and MTGCM data and how they are applied in Mars-GRAM. The new features of Mars-GRAM 2010 are described in section 3. Section 4 explains how to obtain the Mars-GRAM code and data files and how to set up and run the program. Sample results are presented in section 5. Appendices A–F provide additional details of Mars-GRAM 2010 input and output files and how to interpret program results. Appendix G describes several auxiliary programs that are provided with Mars-GRAM 2010.
1.2 Basic Description of Mars-GRAM 2010
Mars-GRAM’s perturbation modeling capability is commonly used, in a Monte Carlo mode, to perform high-fidelity engineering end-to-end simulations for entry, descent, and land-ing.14 Mars-GRAM has been validated15 against Radio Science data, and both nadir and limb data from thermal emission spectrometer (TES).16

2
From the surface to 80 km altitude, Mars-GRAM is based on the NASA Ames MGCM. Above 80 km, Mars-GRAM is based on the MTGCM. Mars-GRAM and MGCM use surface topography from the MGS Mars Orbiter Laser Altimeter (MOLA), with altitudes referenced to the MOLA constant potential surface (areoid).
There are several traditional Mars-GRAM options for representing the mean atmosphere along entry corridors. The first option is mapping year 0, with user-controlled dust optical depth and Mars-GRAM data interpolated from MGCM results driven by selected values of globally- uniform dust optical depth. The second is the auxiliary profile option in which the user can read and use any auxiliary profile of temperature and density versus altitude in the mapping year 0 option. In exercising the auxiliary profile Mars-GRAM option, the values from the auxiliary pro-file replace data from the original MGCM databases. Examples of auxiliary profiles include data from TES nadir or limb observations or Mars mesoscale model output at a particular location and time. The final option is mapping years 1 and 2, with Mars-GRAM data coming from MGCM results driven by the observed TES dust optical depth during TES year 1 and 2.
Mars-GRAM standard inputs are geographic position and time. The user can also adjust the optical depth of the uniformly mixed background dust level, add a seasonal dust optical depth, set the dust particle diameter and density, and provide the starting areocentric longitude of the Sun from Mars (Ls), position, duration, intensity, and radius of a dust storm. Mars-GRAM outputs include density, temperature, pressure, winds, and selected atmospheric constituents. Three Mars-GRAM parameters allow standard deviations of Mars-GRAM perturbations to be adjusted: rpscale can be used to scale density perturbations up or down, rwscale can be used to scale wind perturbations, and wlscale can be used to adjust wavelengths (spectral range) of the perturbations.
1.3 Significant Changes in Mars-GRAM 2010
Mars-GRAM 2010 has been updated to FORTRAN 90/95. Mars-GRAM 2010 now includes adjustment factors that are used to alter the input data from MGCM and MTGCM for the mapping year 0 user-controlled dust case.17 The greatest adjustments are made at large opti-cal depths such as τ >1. The addition of the adjustment factors has led to better correspondence to TES limb data from zero to 60 km altitude as well as better agreement with MGS, ODY, and MRO data at approximately 90 to 130 km altitude.

3
2. PREEXISTING FEATURES OF MARS-GRAM 2010
2.1 Mars Orbiter Laser Altimeter Topography Data
2.1.1 MOLA Areoid
Flying on MGS, the MOLA produced topographic data18–20 at a variety of high resolutions from 1 by 1 degree to 1/16 by 1/16 degree latitude-longitude grids. MOLA topography is measured with respect to a zero elevation surface level known as the MOLA areoid, which is defined as the gravitational equipotential whose average value at the equator is equal to the mean radius deter-mined by MOLA. Mars-GRAM 2010 uses half-degree latitude-longitude resolution data for both MOLA areoid and topography.
Prior to Mars-GRAM 2001, a simple ellipsoid of revolution as zero elevation level was used. Previous resolution for Mars-GRAM topography was 7.5 by 9 degrees, a resolution that is consistent with the evaluation grid of the Ames MGCM. Although Mars-GRAM 2010 works internally with MOLA areoid and topography, and uses these as defaults, program input options also allow users to input and output heights relative to the old Mars-GRAM ellipsoid.
2.1.2 MOLA Topography
MOLA topography and areoid radius in Mars-GRAM 2010 are specified in a text- format input file, MOLATOPH.TXT. For Mars-GRAM use, this file must be converted to a binary file, molatoph.bin, by running a conversion program, makebin.f90, discussed in appendices D and F. Each line of the text file is for a given latitude-longitude grid, and contains grid-averaged values of longitude (° E.), latitude (° N.), planetary radius (m), areoid radius (m), topographic alti-tude (m), and number of data points in the grid. Planetary radius (radius to the local topographic surface) and areoid radius (radius to the zero elevation surface) are measured along a planetocen-tric radius direction from the center of mass of the planet. MOLA latitude data are planetocentric, hence, differ slightly from planetographic latitudes. Topographic altitude is the difference between planetary radius and areoid radius. Because of nonlinearities and interpolation methods used in processing MOLA data, grid-averaged topography that is provided in the MOLATOPH.TXT file and used in Mars-GRAM 2010 is slightly different from the difference between the grid-averaged planetary radius and grid-averaged areoid radius.
Relative to MOLA areoid, the highest point on Mars, the peak of Olympus Mons, is 21.2 km, and lowest, a point in the Hellas Basin, is –7.8 km. For the half-degree resolution MOLA data that is used in Mars-GRAM 2010, the highest and lowest elevations are 21 and –7.6 km, respectively.

4
2.2 Mars General Circulation Model Input Data
2.2.1 Introduction to MGCM and MTGCM Data
Mars-GRAM 2010 utilizes input data tables from the NASA Ames MGCM10,11 and the Uni-versity of Michigan MTGCM.12,13 These tables give the variation of temperature, density, pressure, and wind components with height, latitude, time of day, and Ls. The tables also provide boundary layer data at the topographic surface, as well as 5 and 30 m above the surface as a function of longi-tude, latitude, time of day, and Ls. MGCM data tables cover altitudes from the surface to 80 km. MTGCM data tables cover altitudes of 80 to 170 km. A modified latitude-longitude depen-dent Stewart-type thermospheric model6 is used for altitudes above 170 km, and for dependence on solar activity at higher levels. The Stewart-type thermosphere model starts at a lower boundary con-dition height of the 1.26 nbar pressure level referred to as height ZF. Between 80 km and height ZF (typically at about 125 km), MTGCM data are used directly and also for dependence on solar activ-ity. MTGCM values are interpolated/extrapolated to any desired solar activity value from MTGCM input data for F10.7 = 70 and 130. F10.7 is the solar flux at 10.7 cm wavelength in units of 10–22 W/cm2 at 1 astronomical unit (AU). Above 170 km, modified Stewart-type thermosphere model data are used directly. Between height ZF and 170 km, a fairing process is used that smoothly transitions from MTGCM values to Stewart-type model values.
Details and formats of MOLA, MGCM, and MTGCM data files are given in appendices D and F. To facilitate transfer, these files are provided to the user in American Standard Code for Information Interchange (ASCII format). For a shorter Mars-GRAM run time it is best to read the files in binary form. A program, makebin.f, which is discussed in appendix F is provided to convert the ASCII format MGCM and MTGCM data files to binary files on the user’s machine.
2.2.2 Evaluation of MGCM and MTGCM Tidal Components
For each atmospheric parameter of temperature, pressure, density, and wind components, MGCM and MTGCM data tables provide a diurnal (daily) mean value, and the amplitudes and phases of the diurnal and semi-diurnal tidal components. Tidal values for each parameter are computed from the relation:
Tide = A0 +A1 � cos� t ��1( )
12
�
���
�
�+A2 � cos
� t ��2( )6
�
���
�
�, (1)
where A0 is diurnal mean value of the given parameter, A1 is amplitude of the diurnal tide compo-nent, t is local solar time in hours, φ1 is phase (local time in hours) of the diurnal component, A2 is amplitude of the semi-diurnal tide component, and φ2 is phase (local time in hours) of the semi-diurnal tide component.
MGCM and MTGCM tidal coefficients are provided at 5 km height increments starting at 0 km relative to datum level, and ending at 80 km (MGCM) or 170 km (MTGCM) relative to datum level. MGCM coefficient data are provided at 7.5 degrees latitude spacing, while MTGCM data have 5 degrees latitude spacing. Both MGCM and MTGCM data are available at every 30 degrees of Ls angle, and include three levels of dust optical depth (τ = 0.3, 1, and 3). MGCM

5
tidal coefficients are also provided at the topographic surface and heights 5 and 30 m above local topography. Surface layer MGCM data are at 9 degree longitude spacing (for the same latitudes, Ls values, and dust optical depths as MGCM data above the surface layer).
2.2.3 Interpolation Methods Equation (1) is used to evaluate each atmospheric parameter at the desired local solar time (t), at ‘corners’ of a multidimensional ‘box’ of grid points. This box contains the desired interpola-tion location, Ls, and dust optical depth (τ). Multidimensional interpolation routines are used to evaluate all atmospheric parameters at locations between the MGCM or MTGCM grid points. For data above the surface layer, interpolation is three-dimensional in latitude, Ls, and τ. For sur-face layer data (topographic surface, and 5 or 30 m above the surface), interpolation is four- dimensional in longitude, latitude, Ls, and τ. Interpolation is logarithmic for τ and linear for all other dimensions.
Interpolation to a desired height in km (z) is done by interpolating between two height lev-els (z1 and z2) from grid point altitudes just above and below z. Above the surface layer, z1 and z2 are at the 5 km vertical grid spacing of the MGCM or MTGCM data. Near the surface layer (top-ographic surface or 5 and 30 m above surface height), altitudes z1 and z2 are adjusted as appropri-ate. Temperature in K, T(z), and wind components in meters per second, u(z), and v (z), are found by linear interpolation on height. Pressure, p(z), is found by first computing pressure scale height (H) in kilometers:
H = (z2 � z1)
lnp(z1)p(z2)
���
���
(2)
and evaluating pressure in N/m2, p(z), from the hydrostatic relation:
p(z) = p(z1)expz1� zH
���
���. (3)
Gas law ‘constant’ R is evaluated from pressure (p), density (ρ), and temperature (T) at heights z1 and z2 by:
R(z1) = p(z1)�(z1)T (z1)[ ] (4)
and
R(z2) = p(z2)�(z2)T (z2)[ ] . (5)
Density in kg/m3, ρ(z), at height (z) is then determined by the gas law relation and a linearly interpolated R value, R(z):
�(z) = p(z)R(z)T (z)[ ] . (6)

6
2.2.4 Interpolation in the Boundary Layer
MGCM data tables used by Mars-GRAM include ground surface temperature. Between the surface and 5 m height, large temperature gradients can exist. There can also be a difference between ground surface temperature and air temperature ‘immediately’ above ground. These fea-tures must be represented by a boundary layer model. Following the approach used in the Ames MGCM,21 Mars-GRAM assumes temperature varies from Tg at ground surface to T5 at the 5 m level according to the relation:
T (z) =Tg +T5 �Tg( ) 1+ Fh
1/2F (z)��
��
1+ Fh1/2�
���
, (7)
where the factor Fh is given by:
Fh = 1�16Ri( )1/2 if Ri < 0; Fh = 1+15Ri
1+5Ri( )1/2�
�
��
�
�
�1
if Ri � 0 (8)
as a function of Richardson number (Ri) determined from wind and temperature gradients between the ground and 5 m level. Logarithmic height factor, F(z), is given by
F (z) =ln
zz0
�
���
��
ln5z0
�
���
��
, (9)
where z0 is the surface roughness parameter assumed to be 0.01 m, except over surface ice, where z0 = 0.0001 m is used.22
Wind components at heights <5 m above the surface are evaluated from a logarithmic boundary layer profile relation:
u(z)=u(5)F(z) (10)
and
v(z)=v(5)F(z) . (11)
2.3 Longitude-Dependent (Terrain-Fixed) Wave Model
Tide components evaluated by equation (1) depend only on local solar time. Implicitly, this equation also depends on longitude. At any given instant, solar time varies at a rate of 1 hour for

7
every 15 degrees of longitude. During aerobraking operations, measurements by MGS,23–26 ODY and MRO revealed substantial longitude-dependent wave patterns for atmospheric density. Being in Sun synchronous orbits, MGS, ODY and MRO passed through each periapsis at essentially the same latitude and local solar time. Nevertheless, they found substantial variations that tended to repeat as a function of the periapsis longitude. The density variations were of the form of longi-tude-dependent (i.e., terrain fixed) wave patterns. Mars-GRAM 2010 includes an optional model for these longitude-dependent waves (LDW) of the form:
LDW = B0 +B1cos � � ��1 ��1
• d � d0( )( ) / 180��
�� +B2 cos � 2� ��2 ��2
• d � d0( )( ) / 180��
��
+B3 cos � 3� ��3 ��3• d � d0( )( ) / 180�
��� , (12)
where λ is longitude (in degrees), B0 is the diurnal mean value of longitude-dependent wave, B1, B2, and B3 are amplitude, Φ1, Φ2, and Φ3 are phases (longitudes), Φ1
•, Φ2•, and Φ3
• are the rate of movement of the LDW peak for wave-1, wave-2, and wave-3 components, d0 is the Julian day for the primary peak(s) of the LDW traveling component, and d is the Julian day at which LDW is evaluated. The term wave-n means the wave component has n peaks and troughs through 360 degrees of longitude. LDW perturbations computed by equation (12) are applied as a multi-plier to the mean density and pressure computed from MGCM and MTGCM data, as interpo-lated by methods described in section 2.2.3. Wave model coefficients for equation (12) can be input from the NAMELIST format input file (see app. B), or from an auxiliary file of time-dependent wave model coefficients named by the input parameter WaveFile (secs. 4.2 and 4.3). Values of LDW coefficients may be determined empirically by accelerometer observations,23,25 or theoreti-cally, from wave characteristics of Mars GCMs.24,26
For altitudes above 100 km, LDW perturbations from equation (12) are assumed to be altitude independent. For altitudes below 100 km, LDW perturbations are assumed to diminish in magnitude at an exponential rate, namely,
LDW(z) = 1+ LDW(100)�1( )exp z �100( ) /S[ ] , (13)
where S is the wave scale parameter Wscale, from the NAMELIST format input file.
One way of adjusting Mars-GRAM 2010 density values up or down (at altitudes below 100 km) is by changing the LDW mean term, B0. For example, if the user wants to adjust Mars-GRAM 2010 density values by a factor W1 = B0(z1) at height z1 and W2 = B0(z2) at height z2 (where z1 and z2 are both <100 km), then use the scale parameter value:
S = (z2 – z1)/ln[(W2 – 1)/(W1 – 1)] , (14)
which yields an LDW multiplier value at 100 km, B0(100), given by
B0(100) = 1 + (W2 – 1)exp[(100 –z 2)/S] . (15)
8
Once values of S and B0(100) are input to the program, density at any height (z) (below 100 km) is adjusted by the factor,
B0(z) = 1+ B0(100)�1( )exp (z �100) /S[ ] . (16)
Note that multipliers may be larger or smaller than 1 (yielding density increase or decrease, respectively).
2.4 Mars-GRAM Climate Factors and Height Adjustment
Below 170 km, Mars-GRAM 2010 is based directly on MGCM and MTGCM output and does not need any of the climate factors that were included prior to Mars-GRAM 2001. The only climate adjustment factor that is still included in Mars-GRAM 2010 is deltaTEX, which adjusts the exospheric temperature. Mars-GRAM 2010 model output can be affected as a result of the choice of dust optical depth through the input parameter Dusttau and by the LDW parameters that were discussed in section 2.3.
Mars-GRAM 2010 density output can also be adjusted through the use of the input param-eter zoffset, the direct height offset of the MTGCM data. The height offset adjustment only affects density above 80 km. The function of the height offset is very similar to that of the LDW wave parameter B0 that was discussed in section 2.3. B0 shifts a height versus density plot to the right or left as it increases or decreases density at a given height. Height offset shifts such a height-versus- density curve up or down as it increases or decreases the height at which a given density applies. The net result of a positive or negative height offset is to increase or decrease the density at a given height.
Zoffset can be specified in several ways. A specific offset value in kilometers may be specified in the NAMELIST format input file. Alternatively, the offset value required to match MTGCM data to MGCM data at 80 km can be computed and applied by Mars-GRAM. The MTGCM-MGCM matchup can be specified as applicable locally or globally, based on data shown in table 1. A local matchup can be based on either density at a given location and time of day or the daily average density at a given location.
Another option is to have the program compute and use a global height offset that depends on time of year given by the solar longitude (Ls). Based on comparisons of MTGCM with density observed during MGS aerobraking,25 time-of-year dependence of height offset is given as:
Height Offset (km) = �z0 � 2.5sin �Ls / 180( ) , (17)
where Δz0 is an input value of constant height offset given by input parameter zoffset. With a default value of Δz0 = 5 km, height offset values from equation (17) vary seasonally from 2.5 km at Ls = 90 degrees to 7.5 km at Ls = 270 degrees.

9
Table 1. Global average height offset (km) required for MTGCM-MGCM matchup, as a function of solar longitude and dust optical depth.
Solar Longitude
(deg)
Dust Optical Depth
0.3 1 30 –0.002 –0.001 –0.002
30 –0.001 0.000 0.00360 0.001 –0.003 –0.00290 –0.002 –0.002 –0.000
120 0.001 –0.002 –0.001150 0.004 –0.002 0.011180 –0.003 –0.004 –0.002210 –0.002 0.001 –0.001240 –0.002 –0.001 0.018270 –0.002 0.004 –0.003300 –0.001 0.008 –0.002330 0.033 –0.001 –0.003360 –0.002 –0.001 –0.003
Mars-GRAM allows optional regional or global scale dust storms to be activated at any desired Ls. Dust storm simulations are discussed in section 2.5. Based on comparisons between Mars-GRAM and density observed by the MGS accelerometer23 during the regional Noachis dust storm, an additional height offset of MTGCM data is applied during simulated dust storms. This additional offset amount in kilometers is seven times the dust storm optical depth.
2.5 Quantitative Dust Concentration Model
Background dust optical depth (τ) in a non dust storm case is specified by the input param-eter Dusttau. Interpolation routines given in section 2.2.3 interpolate logarithmically between τ values for both MGCM and MTGCM input data. If Dusttau = 0 is input, a prescribed Viking-like seasonal variation of dust optical depth is used, in which case variation of τ with Ls (in degrees) is specified by:
� = 0.65� 0.35sin �Ls / 180( ) . (18)
A model for global or local scale dust storms5 is retained for mapping year 0. In Mars-GRAM 2010, the input value for dust storm intensity given by input parameter, INTENS, is equiv-alent to the peak dust optical depth for the storm. Allowable values for INTENS range from zero for no dust storm to three for the maximum intensity dust storm. Dust storm intensity is added to background dust optical depth to give total dust optical depth. Mars-GRAM does all necessary interpolations on dust optical depth as it varies with time, Ls, and space for local storms. DUST-LAT and DUSTLON input parameters give the location of the dust storm. The input option,

10
ALSDUR, allows users to control the duration of simulated dust storms. Input parameter RADMAX is the maximum radius (kilometers) a dust storm can attain. The radius develops according to the parameterized space and time profile of buildup and decay in the program. If a value of zero or more than 10,000 km is used for RADMAX, the storm is taken to be of global dimensions and uniformly covers Mars, but is still assumed to build up and decay in intensity according to the same temporal profile.
Mars-GRAM 2010 computes several dust concentration parameters from dust optical depth. Methods used by Haberle et al. in the MGCM are employed.21,27 Areal dust density (md), total column mass of dust per unit ground surface area, is 0.005 times τ. Dust mixing ratio, the mass of dust per unit mass of air, at the surface (q0) is computed by:
q0 = mdg / 0.994exp�v psfc( ) , (19)
where g is gravity, 3.712 m/s2 at the surface of Mars; v is input parameter Dustnu, which controls the vertical dust distribution; and ps fc is surface pressure. Dust mixing ratio at height z is deter-mined by:
q(z) = q0 exp v 1� p(z) / psfc��
��{ } , (20)
where p(z) is pressure at height z. Dust mass density, the mass of dust per unit volume of air, is the product of dust mixing ratio and atmospheric density. From the dust mixing ratio, assuming that dust particles are spheres of a given diameter and mass, Mars-GRAM 2010 also computes dust number density, number of dust particles per unit volume of air. Users can also input values of dust particle diameter through the use of the input parameter Dustdiam and dust particle density using the input parameter Dustdens. Consistent with the MGCM,27 Mars-GRAM 2010 assumes a default particle diameter, 5 μm, and a default particle density, 3,000 kg/m3.
Dust model output values are written to the file MarsRad.txt details of which are discussed in appendix A.
2.6 Solar and Thermal Radiation From Mars-GRAM Output
Several auxiliary programs used with Mars-GRAM are described in appendix G. One, marsrad.f90, computes the upwelling and downwelling components of the solar (shortwave) and thermal (longwave) radiation at the surface and the top of the atmosphere. This auxiliary program uses the Mars-GRAM output file MarsRad.txt, which includes the dust concentration information discussed in section 2.5. A full discussion of MarsRad.txt is contained in appendix A.
To compute upwelling shortwave radiation at the surface, Mars-GRAM uses surface albedo values from the data file albedo1.txt that contains the surface albedo at 1 degree latitude-longitude resolution.28,29
The auxiliary program marsrad.f90 produces two output files: radlist.txt and radout.txt. The computation methods that are used within marsrad.f90 to determine the radiation

11
components contained in the output files are discussed in appendix G. Mars-GRAM output that is used as input to marsrad.f90 consists of one or more vertical profiles of temperature versus pressure (altitude). To facilitate the production of latitude-longitude, latitude-time, or longitude-time arrays of such profiles, program radtraj.f90 is also provided as an auxiliary program and is discussed in appendix G.
2.7 Slope Wind Model The slope wind model contained in the Mars-GRAM 2010 subroutine slopewind is based on Ye et al.30 In this model, the slope winds depend on terrain slopes that are determined from MOLA 0.5 degree resolution topography for the MOLA grid containing the latitude-longitude of interest. The method of Ye et al.30 provides an analytical relationship to compute winds as a func-tion of altitude and terrain slope for daytime, thermally-driven, upslope winds. The slopewind subroutine assumes a diurnal pattern of slope wind variation with time of day. The slope winds apply up to 4.5 km above the surface during the day and up to 2.5 km above the surface at night and are added to background MGCM winds at 7.5 × 9 degree resolution. Peak daytime winds are assumed to occur at 15 hours local solar time. Peak nighttime winds, due to downslope drainage flows, are assumed to occur at 3 hours local solar time. Lighter, cross-slope flows occur between these two times. Vertical component slope winds are also computed. These are proportional to the terrain slope, to the horizontal slope winds, and have an assumed variation with altitude, which gives maximum vertical winds near the middle of the slope wind altitude region, and zero vertical winds near the surface and near the top of the slope wind altitude region. The slope winds can also be scaled with the input factor, blwinfac, with a value of zero suppressing the slope wind output.
2.8 Traditional Mars-GRAM Options for Representing the Mean Atmosphere Along Entry Corridors
Mars-GRAM has several options for representing the mean atmosphere along entry cor-ridors and these can be set using the input parameter MapYear. The MapYear = 0 option allows the user to control the dust optical depth and utilizes data interpolated from MGCM model results driven by selected values of globally-uniform dust optical depth. If MapYear = 1 is chosen, data are from MGCM model results driven by observed TES dust optical depth during TES mapping year 1 which was from April 1999 through January 2001. If MapYear = 2 is chosen, data are from MGCM model results driven by observed TES dust optical depth during TES mapping year 2 which was from February 2001 through December 2002. TES mapping year 1 had no global dust storm while TES mapping year 2 had a major, global-scale dust storm, peaking at Ls = 210. The Map Year 1 and 2 data sets have a 1 km vertical resolution up to 10 km.
2.9 Auxiliary Profile Option
The auxiliary profile option provides the user with the choice to read and use any auxil-iary profile of temperature and density versus altitude. In exercising the auxiliary profile Mars-GRAM option, the values from the auxiliary profile replaces data from the original MGCM and MTGCM databases. This option is controlled by setting parameters profile, profnear, and proffar in the NAMELIST input file. Each line of the auxiliary profile input file consists of: (1) height, in
12
km, (2) latitude, in degrees, (3) longitude, in degrees, (4) temperature, in K, (5) pressure, in N/m2, (6) density, in kg/m3, (7) eastward wind, in m/s, and (8) northward wind, in m/s. Heights are rela-tive to the MOLA areoid or reference ellipsoid, as set by input parameter MOLAhgts. Latitudes are planetocentric or planetographic, as set by input parameter ipclat. Longitudes are east or west, as set by input parameter LonEW. MGCM/MTGCM temperature, pressure, and density data are used if any of the profile inputs for temperature, pressure, or density are zero. MGCM/MTGCM winds are used if both wind components are zero on the profile file. A sample auxiliary profile file named profiledata.txt is provided with the Mars-GRAM 2010 distribution. Additional examples of auxiliary profiles include data from TES nadir or limb observations or Mars mesoscale model output at a particular location and time.

13
3. NEW FEATURES OF MARS-GRAM 2010
3.1 Mars-GRAM 2010 Adjustment Factors
3.1.1 Adjustment Factor Requirements
The adjustment factors generated by this process had to satisfy the gas law: p = ρRT, as well as the hydrostatic relation: dp/dz = –ρg. If T is assumed to be unchanged and both p and ρ are adjusted by a common factor, F, both relations are preserved. The adjustment factors [F(z,Lat,Ls)] were expressed as a function of height (z), latitude (Lat), and areocentric solar longitude (Ls). This adjustment factor (F) is applied to the daily mean density and pressure values from MGCM (0–80 km) and MTGCM (above 80 km). The pressure scale height (RT/g) is unchanged by this process. However, since the pressure has been changed by the adjustment factor, the height of the 1.26 nbar pressure level, referred to as ZF in Mars-GRAM, has also been changed.
The daily mean MGCM or MTGCM density, DTA0, and the daily mean MGCM or MTGCM pressure, PTA0, depend on height (z), latitude (Lat), solar longitude (Ls), dust amount (τ), and solar activity parameter (F10). The adjusted values of DTA0´ and PTA0´ are computed from the adjustment factors (F) using the following equations:
DTA �0 =DTA0*F z,Lat,Ls( ) (21)
and
PTA �0 = PTA0*F z,Lat,Ls( ) , (22)
where the adjustment factor (F) has been determined as described above. Adjustment factors (F) are also used to adjust ZF by the relation:
ZF ́= ZF +H ln(F) , (23)
where H is local pressure scale height.
3.1.2 Development of MTGCM Factors
Mars-GRAM density and pressure need to be consistent at 80 km, where the transition from MGCM to MTGCM data occurs. Thus, the assumption was made that F(80,Lat,Ls) for the MTGCM data had to be the same as the adjustment factor at 80 km for the MGCM data. After adjustment factors F(80,Lat,Ls) were determined from the MGCM analysis, they were used to determine MTGCM adjustment factors by use of the following equation:

14
F z,Lat,Ls( ) = F 80,Lat,Ls( )* 1+A� +B� 2( ) , (24)
where the height parameter ς = (z – 80) and the coefficients A and B depend on Lat and Ls.
Final adjustment factors F(z,Lat,Ls) for MTGCM data were implemented into Mars-GRAM and a validation run comparing Mars-GRAM 2010 versus MGS, ODY, and MRO aerobraking data from the Planetary Data System (PDS) was completed. Any residual variation of aerobraking density about mean values that became apparent during this process was used to update the height dependence of Mars-GRAM perturbation standard deviations.
15
4. HOW TO RUN MARS-GRAM 2010
4.1 How to Obtain the Program
All source code and required data files are available as a downloadable zip file issued by the Marshall Space Flight Center Natural Environments Branch (EV44). The software is offered free of charge. To obtain the program source code and data files, refer to the contact information in the preface. See appendices D through G for summaries of the program and data files available in the downloaded file.
4.2 Running the Program
There are two ways to run Mars-GRAM: (1) as a subroutine in a user-provided main driver program (such as a trajectory program) and (2) as a stand-alone program, using a NAMELIST format input file, in which values for all input options are provided. To use Mars-GRAM as a subroutine, see discussion in appendix E and use example file dumytraj.f (available in the zip file distribution) as a guide. File README2.txt (available in the zip file distribution) also discusses use of dumytraj_M10.f90 as an example for using Mars-GRAM as a subroutine.
The steps involved in setting up and running Mars-GRAM in stand-alone mode are the following:
• To compile marsgram_M10.f90, dumytraj_M10.f90, and multtraj_M10.f90 under UNIX, to produce executable files marsgram_M10.x, dumytraj_M10.x, and multtraj_M10.exe, you can use the commands:
f90 Cfiles_M10_C.f90 Ifiles_M10_I.f90 marsgram_M10.x marsgram_M10.f90 marssubs_M10.f90/
setup_M10.f90 TESsubs_M10.f90mv a.out marsgram_M10.xerase *.oerase *.mod f90 Cfiles_M10_C.f90 Ifiles_M10_I.f90 dumytraj_M10.f90 marssubs_M10.f90 setup_M10.f90 /TESsubs_M10.f90 wrapper_M10.f90mv a.out dumytraj_M10.xerase *.oerase *.mod

16
f90 Cfiles_M10_C.f90 Ifiles_M10_I.f90 multtraj_M10.f90 marssubs_M10.f90 setup_M10.f90 /TESsubs_M10.f90 wrapper_M10.f90mv a.out multtraj_M10.xerase *.oerase *.mod
• To compile marsgram_M10.f90, dumytraj_M10.f90, and multtraj_M10.f90 under personal computer Disk Operating System (PC-DOS) (for example, with gfortran), to produce executable files marsgram_M10.exe, dumytraj_M10.exe, and multtraj_M10.exe, you can use the example compile-and-link macros in the Code directory.
• To compile the auxiliary programs bldtraj.f90, finddate.f90, marsrad.f90, julday.f90, or radtraj.f90, or the binary conversion programs makebin.f90, readalb.f90, or READTOPO.f90 under UNIX, just use the FORTRAN compile statement for the specific auxiliary program source code file, i.e.
f90 -o auxiliary.x auxiliary.f90
or for PC-DOS, use the compile-and-link macros in the Utilities directory.
• Make sure that necessary data files albedo1.txt (surface albedo data), COSPAR2.DAT (Com-mittee on Space Research (COSPAR) model atmosphere data), MOLATOPH.TXT (MOLA topographic height information), and hgtoffst.dat (global average height offset values) are in an appropriate directory whose pathname is specified by parameter DATADIR in the NAMELIST format input file.
• Compile and run programs READTOPO.f90 to convert the MOLA data from ASCII to binary and readalb.f90 to convert the albedo data from ASCII to binary.
• Compile and run program makebin.f90 (see app. F) and convert the ASCII format MGCM and MTGCM data files provided to binary form (see app. D); this conversion process needs to be done only once on each user’s machine.
• Make sure that the binary format MGCM and MTGCM data files (see apps. D and F) are in an appropriate directory whose pathname is specified by parameter GCMDIR in the NAMELIST format input file.
• Prepare a NAMELIST format input file whose name is specified at run time with the desired values of all input options (example in app. B).
• If trajectory input mode rather than automatic profile mode is desired, prepare a trajectory input file whose name is set by parameter TRAJFL in the NAMELIST input file containing time, height, latitude, and longitude further discussion of this is included below.

17
• If time-dependent coefficients for longitude-dependent wave model are to be used, prepare a file whose name is specified by parameter WaveFile in the NAMELIST format input file. This file contains one set of coefficients per line: time (seconds from start time) and wave model coeffi-cients (B0 through Φ3, defined in sec. 2.3; further discussion below).
• Run the program by entering its executable name (e.g., marsgram); the program automatically opens and reads the NAMELIST input file, the TRAJFL file (if the trajectory mode is used), the data files albedo1.txt, COSPAR2.DAT, MOLATOPH.TXT and hgtoffst.dat, all MGCM and MTGCM binary data files, and the WaveFile file (if time-dependent coefficients are used).
If the program is run in profile mode, the user provides in the NAMELIST format input file fixed values for increments of time, height, latitude, and longitude. In this mode, the program automatically increments position until the desired number of positions (NPOS) are evaluated. In trajectory mode, selected by using NPOS = 0, Mars-GRAM reads time and position informa-tion from the TRAJFL file.
If constant values of longitude-dependent wave model coefficients are used, values for these are read in as part of the NAMELIST input file (sec. 3.3). For time-dependent coefficients, values are read from the WaveFile file. Each set of coefficients applies from the time given with the coef-ficient data, until a new time and set of coefficients are given on the next line of WaveFile. The last set of coefficients in WaveFile applies indefinitely, beginning with its given time.
4.3 Program Input
Appendix B gives a sample of a NAMELIST format input file for Mars-GRAM 2010. Whether the subroutine or stand-alone version is used, input variables whose values are supplied in the INPUT file are as follows:
LSTFL Name of LIST file; example of a LIST file is given in appendix C; for a listing to the console in the stand-alone version enter filename CON
OUTFL Name of OUTPUT file; a complete description of this file is contained in appendix A
TRAJFL (Optional) trajectory input file name; file contains time (seconds) relative to start time, height (km), latitude (degrees), longitude (degrees West if LonEW = 0 or degrees East if LonEW = 1; see below)
profile (Optional) auxiliary profile input file name
WaveFile (Optional) input file for time-dependent wave coefficient data; see file description under parameter iuwave, below
DATADIR Pathname to directory for COSPAR data, topographic height data, surface albedo data, and global height offset data files

18
GCMDIR Pathname to directory for MGCM and MTGCM binary data files
IERT 1 for time input as Earth-receive time (ERT) or 0 Mars-event time (MET)
IUTC 1 for time input as Coordinated Universal Time (UTC), or 0 for Terrestrial (Dynamical) Time (TT)
MONTH Integer month (1 through 12) for initial time
MDAY Integer day of month for initial time
MYEAR Integer year for starting time, a four-digit number; alternatively years 1970–2069 can be input as a two-digit number
NPOS Maximum number of positions to evaluate, if an automatically-generated profile is to be produced; use 0 if trajectory positions are to be read in from a TRAJFL file
IHR Integer initial time, hour of day (ERT or MET, controlled by IERT value and UTC or TT, controlled by IUTC value)
IMIN Integer initial time, minute of hour (meaning controlled by IERT and IUTC values)
SEC Initial time, seconds of minute (meaning controlled by IERT and IUTC values)
LonEW Longitude switch, 0 for input and output with West longitude positive (default) or 1 for East longitude positive
Dusttau Optical depth of background dust level (no time-developing dust storm, just uniformly mixed dust), 0.1 to 3 (if 0 is input, a Viking-like annual variation of background dust is assumed)
Dustmin Minimum seasonal dust τ if input Dusttau = 0 (> = 0.1)
Dustmax Maximum seasonal dust τ if input Dusttau = 0 (< = 3)
Dustnu Parameter for vertical distribution of dust density (Haberle et al.21)
Dustdiam Dust particle diameter (micrometers, assumed monodisperse)
Dustdens Dust particle density (kg/m3)
ALS0 Value of areocentric longitude of the Sun (Ls, in degrees) at which a dust storm is to start; use a value of 0 if no dust storm is to be simulated; dust storm can be

19
simulated only during the season of the Mars year for which Ls is between 180° and 320°
ALSDUR Duration in Ls degrees for dust storm (default = 48)
INTENS Dust storm intensity, measured as peak dust optical depth of the storm, with allowable values ranging from 0 (no dust storm) to 3 (maximum intensity dust storm). Dust storm intensity is added to background dust optical depth to give total dust optical depth
RADMAX Maximum radius (km) a dust storm can attain, developing according to the parameterized space and time profile of buildup and decay in the program; if a value of 0 or more than 10,000 km is used, the storm is taken to be of global dimensions and therefore uniformly covering the planet, but still assumed to build up and decay in intensity according to the same temporal profile
DUSTLAT Latitude (degrees, North positive) for center of dust storm
DUSTLON Longitude (degrees, West positive if LonEW = 0, or East positive otherwise) for center of dust storm
MapYear 1 or 2 for TES mapping year 1 or 2 GCM input data, or 0 for Mars-GRAM 2001 GCM input data sets
F107 10.7 cm solar flux in its usual units of 10–22 W/cm2 at average Earth orbit position (1 AU); solar flux is automatically converted by the program to its value at the position of Mars in its orbit
NR1 Seed value (integer) for random number generator; allowable range is 1 to 29999; to do Monte Carlo simulations with a variety of perturbations, use a differ-ent random number seed on each model run; to repeat a given random number sequence on a later model run, use the same random number seed value
NVARX x-code for the plotable output (x-y pairs for line graphs or x-y-z triplets for con-tour plots); appendix A lists the variables associated with the x-code (e.g., if NVARX = 1, x output for plotting is height above the MOLA areoid)
NVARY y-code for contour plot output (x-y-z triplets); use a y-code value of 0 for line graph (x-y pair) plots; appendix A lists y-code values and parameters represented
LOGSCALE Parameter to control units of output values of density and pressure on output plot files; a value of 0 means use regular density and pressure units (kg/m3 and N/m2); 1 means to output logarithm (base-10) of the regular units; 2 means to output percentage deviation from COSPAR values of density and pressure; 3 means use SI units, with density in kg/km3 (suitable for high altitudes)

20
FLAT Latitude of initial point to simulate (degrees, North positive)
FLON Longitude of initial point to simulate (degrees, West positive if LonEW = 0; East positive otherwise)
FHGT Height (km) of initial point to simulate above the reference ellipsoid; use FHGT ≤ –10. km to specify that surface altitude should be used
MOLAhgts 1 for input heights relative to the MOLA areoid, otherwise input heights are rela-tive to the old reference ellipsoid
hgtasfcm Height above surface (0–1,000 m); use if FHGT ≤ –10 km
zoffset Constant height offset (km) for MTGCM data or constant part of Ls-dependent (Bougher) height offset (0.0 means no constant offset). Positive offset increases density, negative offset decreases density
ibougher 0 for no Ls-dependent (Bougher) height offset term; 1 means add Ls-dependent (Bougher) term, –A*sin(Ls) (km), to constant term (zoffset), offset amplitude A = 2.5 for MapYear = 0 or 0.5 for MapYear > 0; 2 means use global mean height offset from data file hgtoffst.dat; 3 means use daily average height offset at local position; 4 means use height offset at current time and local position. Value of zoffset is ignored if ibougher = 2, 3, or 4
DELHGT Height increment (km) between successive steps in an automatically generated profile (positive upward)
DELLAT Latitude increment (degrees, Northward positive) between successive steps in an automatically generated profile
DELLON Longitude increment (degrees, Westward positive if LonEW = 0; Eastward posi-tive if LonEW = 1) between successive steps in an automatically generated profile
DELTIME Time increment (s) between steps in an automatically generated profile
deltaTEX Additive adjustment to modify temperature (K) of the exosphere (asymptotic temperature approached at very high altitudes), nominal = 0
profnear Latitude-longitude radius (degrees) within which weight for auxiliary profile is 1 (use profnear = 0.0 for no profile input)
proffar Latitude-longitude radius (degrees) beyond which weight for auxiliary profile is 0.0
rpscale Random density perturbation scale factor (0–2, 1 = nominal)

21
rwscale Random wind perturbation scale factor (> = 0)
wlscale Scale factor for perturbation wavelengths (0.1–10)
wmscale Scale factor for mean winds
blwinfac Scale factor for boundary layer slope winds (0 = none)
NMONTE Number of Monte Carlo runs during one execution of the program; new/ different starting random numbers are automatically generated for each
of the Monte Carlo profiles or trajectories
iup Option controlling output of LIST file and graphics output files (0 = none, other than 0 (default) indicates generate these files)
WaveA0 Mean term of longitude-dependent wave multiplier for density
WaveDate Julian date for (primary) peak(s) of wave (0 for no traveling component)
WaveA1 Amplitude of wave-1 component of longitude-dependent wave multiplier for density
Wavephi1 Phase of wave-1 component of longitude-dependent wave multiplier (longitude, with West positive if LonEW = 0, East positive otherwise)
phi1dot Rate of longitude movement (degrees per day) for wave-1 component (Westward positive if LonEW = 0, Eastward positive if LonEW = 1)
WaveA2 Amplitude of wave-2 component of longitude-dependent wave multiplier for density
Wavephi2 Phase of wave-2 component of longitude-dependent wave multiplier (longitude, with West positive if LonEW = 0, East positive otherwise)
phi2dot Rate of longitude movement (degrees per day) for wave-2 component (Westward positive if LonEW = 0, Eastward positive if LonEW = 1)
WaveA3 Amplitude of wave-3 component of longitude-dependent wave multiplier for density
Wavephi3 Phase of wave-3 component of longitude-dependent wave multiplier (longitude, with West positive if LonEW = 0, East positive otherwise)
phi3dot Rate of longitude movement (degrees per day) for wave-3 component (Westward positive if LonEW = 0, Eastward positive if LonEW = 1)

22
iuwave Unit number for (Optional) time-dependent wave coefficient data file named by input parameter WaveFile (or 0 for none); WaveFile contains time (sec) rela-tive to start time, and wave model coefficients (WaveA0 through Wavephi3) from given time to next time in the data file
Wscale Vertical scale (km) of longitude-dependent wave damping at altitudes below 100 km (10 ≤ Wscale ≤ 10,000 km)
corlmin Minimum relative step size for perturbation updates (0.0-1.0); 0.0 means always update perturbations, x.x means only update perturbations when corlim > x.x
ipclat 1 for planetocentric latitude and height input, 0 for planetographic latitude and height input
requa Equatorial radius (km) for reference ellipsoid
rpole Polar radius (km) for reference ellipsoid
idaydata 1 for daily max/min data output; 0 for none
Four auxiliary input files are required in addition to the MGCM and MTGCM input data files. The file MOLATOPH.TXT contains the MOLA areoid and topography data at 1/2 by 1/2 degree latitude-longitude resolution. Each line of MOLATOPH.TXT contains East longitude and latitude at the center of the 1/2 by 1/2 degree grid box, grid-box-average radius (m) to topographic surface, areoid radius (m) which is the radius to reference constant potential surface, evaluated at the center of the grid box, topography which is the grid-box-average difference (m) between local planetary radius and areoid, analogous to local terrain height above sea level for Earth, and Num, the number of MOLA laser measurements averaged over the grid box. MOLA latitudes are plan-etocentric. Longitudes in the MOLA input file are with respect to the IAU 1991 prime meridian. A shift (of about 0.24°) is made automatically within Mars-GRAM 2010, in order to convert to longitudes relative to the International Astronomical Union (IAU) 2000 prime meridian.
File COSPAR2.DAT contains COSPAR reference values of temperature, density, and pressure as a function of height. File hgtoffst.dat contains global values of MTGCM height offset versus Ls and dust optical depth. File albedo1.txt contains 1-degree resolution surface albedo data. Each line of albedo1.txt contains latitude, and West longitude at the center of the 1 by 1 degree grid box, and grid-box-average surface albedo, the ratio of surface-reflected solar flux to that inci-dent on the surface. Before Mars-GRAM is first used, the ASCII format files MOLATOPH.TXT and albedo1.txt must be converted to binary with the auxiliary programs READTOPO.f90 and readalb.f90, that are supplied with Mars-GRAM 2010.
If the number of positions to be calculated, NPOS is set to 0, an optional trajectory input file is read from a file whose name is given by the input parameter TRAJFILE. Each line of the trajectory file consists of: time, in seconds past the start time specified in the NAMELIST input, height in km, latitude in degrees, and longitude in degrees. Heights are relative to the MOLA

23
areoid or reference ellipsoid, as set by the input parameter MOLAhgts. Latitudes are planetocen-tric or planetographic, as set by the input parameter ipclat. Longitudes are East or West, as set by the input parameter LonEW. Any additional information included on each line (e.g. orbit number, measured density, etc.) is ignored. Trajectory positions in these files do not have to be at small time or space steps. For example, a trajectory file may consist of successive periapsis times and posi-tions for a simulated or observed aerobraking operation. Trajectory files may also contain arrays of locations used for computing height-latitude cross sections or latitude-longitude cross sections. Such trajectory input files can be as built by the program BLDTRAJ.f90.
If time-dependent wave parameters WaveA0 through Wavephi3 are desired, these are input from the file whose pathname is specified by the parameter Wavefile in the NAMELIST format input file. Parameter iuwave determines whether time-dependent WaveFile values are read or not. Iuwave = 0 means no WaveFile data; otherwise iuwave is the WaveFile unit number. Each data line in the WaveFile file contains the time in seconds relative to start time, and wave model coefficients WaveA0 through Wavephi3. Wave parameter values apply from the given time on each data line until the time given on the subsequent data line. Time-dependent wave parameters read in from WaveFile supercede any values given in the NAMELIST format input file.
4.4 Program Output
There are three general types of program output provided in Mars-GRAM. The first is a LIST file whose name is specified by the input parameter LSTFL and contains header and descriptor information that is suitable for printing or viewing by an analyst. An example LIST file is given in appendix C. Second is an OUTPUT file whose name is specified by the input parameter OUTFL which contains one header line and one line per output position and is suitable for read-ing into another program for additional analysis. A description of this file can be found in appen-dix A. Finally, there is a set of plotable output files, or graphics output files, that are text files suitable for input to a graphics program. Descriptions of these files can be found in appendix A.
The graphics output files contain either x-y data pairs or x-y-z data triplets, determined by the selected values for the input parameters NVARX and NVARY. If line-graph (x-y pair) data is the selected plot output option, then NVARY = 0 is input. If contour plot (x-y-z triplet) data are the selected plot output option, then a non-zero value of NVARY is input. Appendix A lists codes for NVARX and NVARY.
If the user desires to suppress the LIST, OUTPUT and graphics output files so that out-put can be handled in a user-provided program, they must set the LIST file unit number, iup, to 0 in the NAMELIST format input file. The unit number associated with the ‘screen’ output, iu0 or iustdout, normally 6 in the stand-alone version, can be set to any other value, by changing the assigned value of iustdout at program code line MGRM 21, and then recompiling the program.

24
5. SAMPLE RESULTS
5.1 Improvement of Mars-GRAM 2010 at Lower Altitudes
Application of adjustment factors to the Ames MGCM data yields improved comparisons between Mars-GRAM and TES limb data, as shown by the density ratios (Mars-GRAM/TES Limb) given in figure 1. Prior to adjustment these density ratios were as low as 0.65 near 60 km.
60
55
50
45
40
35
30
25
20
15
10
5
0–80 –70 –60 –50 –40 –30 –20 –10 0 10 20 30 40 50 60 70 80
Latitude (deg)
Heig
ht A
bove
MOL
A (k
m)
Figure 1. Latitude-height contours of density ratio (Mars-GRAM/TES limb) after application of MGCM adjustment factors.
Mars-GRAM 2005 and Mars-GRAM 2010 MapYear = 0 results have also been compared for three locations at local true solar time (LTST) 2 and 14:
• Location 1 (L1) = 22.5º S., 180º E., Ls = 90 ± 5, τ = 0.11• Location 2 (L2) = 22.5º S., 180º E., Ls = 75 ± 5, τ = 0.12• Location 3 (L3) = 2.5º N., 180º E., Ls = 210 ± 5, τ = 2.65 *dust storm case*

25
Figure 2 provides the density ratios of Mars-GRAM to TES for Mars-GRAM 2005. As figure 3 shows, the application of the adjustment factor in Mars-GRAM 2010 results in ratios of ≈1 at lower altitudes.
80
70
60
50
40
30
20
10
00.4 0.6 0.8 1 1.2 1.4 1.6 1.8
Density Ratio (Mars-GRAM/TES Limb)
Altit
ude (
MOLA
) (km
)L1LTST=2L1LTST=14L2LTST=2L2LTST=14L3LTST=14
Figure 2. Density ratio (Mars-GRAM/TES) for Mars-GRAM 2005.
80
70
60
50
40
30
20
10
0
Altit
ude (
MOLA
) (km
)
0.4 0.6 0.8 1 1.2 1.4 1.6 1.8Density Ratio (Mars-GRAM/TES Limb)
L1LTST=2L1LTST=14L2LTST=2L2LTST=14L3LTST=14
Figure 3. Density ratio (Mars-GRAM/TES) for Mars-GRAM 2010.

26
At the higher altitudes, Mars-GRAM 2010 results have corrected the effect of the under- estimated dust aloft in the MGCM. At location 3, the Mars-GRAM 2010 density ratio has shifted closer to 1. This demonstrates that the addition of adjustment factors to Mars-GRAM 2010 has improved the results for the MapYear = 0 cases for large τ values.
5.2 Improvement of Mars-GRAM 2010 at Aerobraking Altitudes
Mars-GRAM modeled data output has improved at aerobraking altitudes by adding MTGCM adjustment factors which included height parameters and thermosphere coefficients. Improvement has been quantified by examining profile data density ratios for MGS, MRO, and ODY.
Taking the 99th percentile of all the density profiles illustrates the significant change the updated Mars-GRAM 2010 has on the profile density ratios. As shown in figure 4, the least amount of change was observed in the MGS data over the 99th percentile profile data, with an overall change of 2 units across the altitude range. The MRO data showed a significant improve-ment from the previous version of Mars-GRAM, reducing the higher altitude ratios from 6 to close to the optimal value of 1 on the updated data. However, the greatest change in ratio values occurred with the ODY data where the older data reached values close to 20 but the newer data brought the ratios down to a range between <1 to over 4 at the higher altitudes. All of the ratio values of the datasets improved from the old Mars-GRAM data output to the updated Mars-GRAM 2010 version.
135
130
125
120
115
110
105
100
950 2 4 6 8 10 12 14 16 18 20
Ratio (�������/������MG)
Heig
ht (k
m)
Old MGS/Mars-GRAMNew MGS/Mars-GRAMOld MRO/Mars-GRAMNew MRO/Mars-GRAMOld ODY/Mars-GRAMNew ODY/Mars-GRAM
Figure 4. The 99th percentile density ratios of the profile data from MGS, MRO, and ODY to Mars-GRAM 2010 output versus height.
27
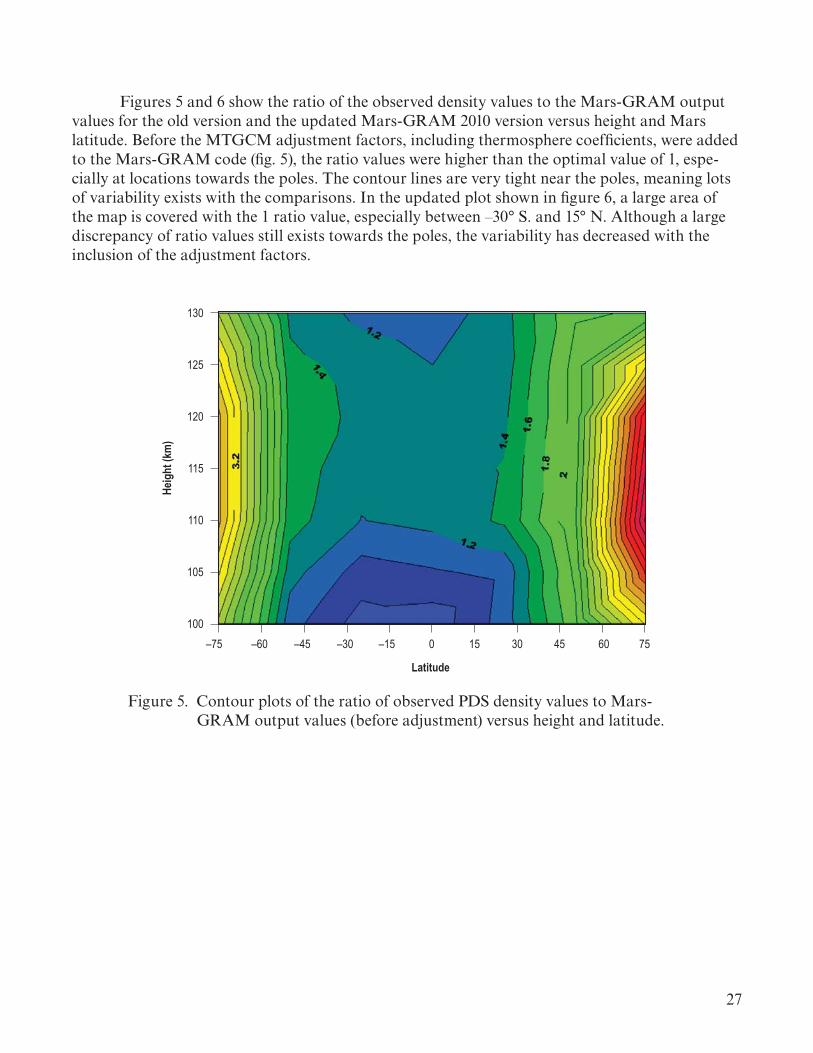
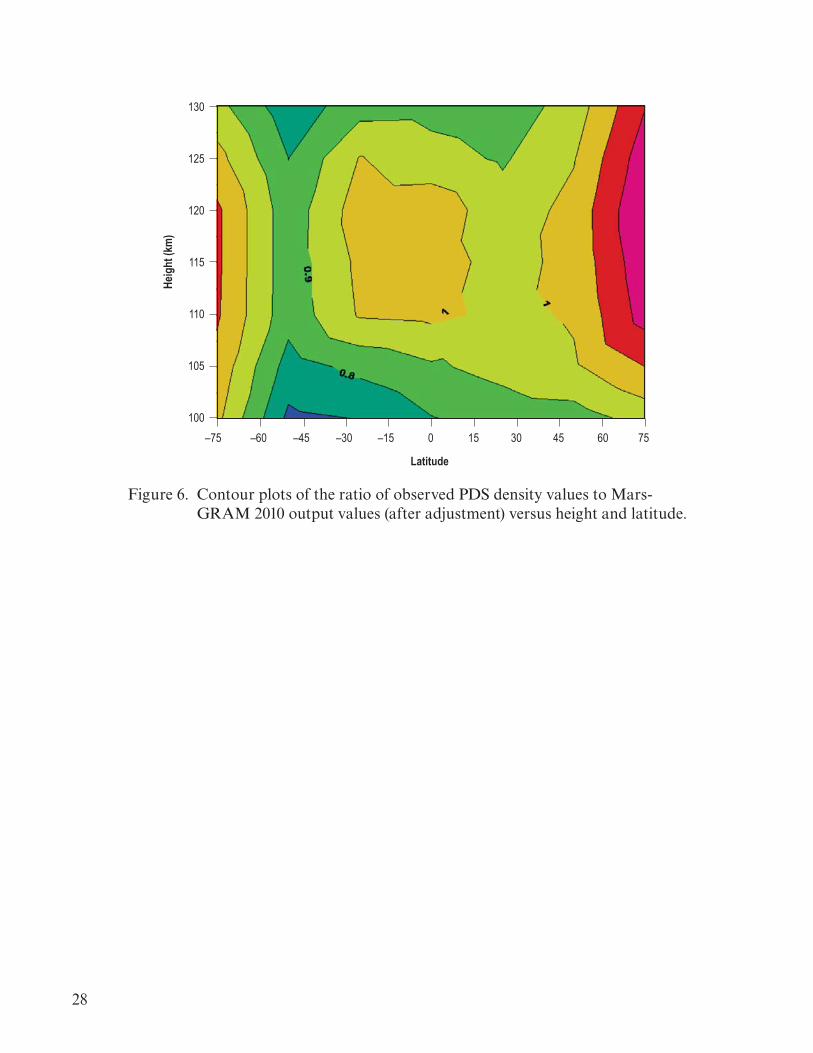
Figures 5 and 6 show the ratio of the observed density values to the Mars-GRAM output values for the old version and the updated Mars-GRAM 2010 version versus height and Mars latitude. Before the MTGCM adjustment factors, including thermosphere coefficients, were added to the Mars-GRAM code (fig. 5), the ratio values were higher than the optimal value of 1, espe-cially at locations towards the poles. The contour lines are very tight near the poles, meaning lots of variability exists with the comparisons. In the updated plot shown in figure 6, a large area of the map is covered with the 1 ratio value, especially between –30° S. and 15° N. Although a large discrepancy of ratio values still exists towards the poles, the variability has decreased with the inclusion of the adjustment factors.
130
125
120
115
110
105
100–75 –60 –45 –30 –15 0 15 30 45 60 75
Latitude
Heig
ht (k
m)
Figure 5. Contour plots of the ratio of observed PDS density values to Mars-GRAM output values (before adjustment) versus height and latitude.
28
130
125
120
115
110
105
100–75 –60 –45 –30 –15 0 15 30 45 60 75
Latitude
Heig
ht (k
m)
Figure 6. Contour plots of the ratio of observed PDS density values to Mars-GRAM 2010 output values (after adjustment) versus height and latitude.

29
APPENDIX A—HEADERS FOR MARS-GRAM 2010 OUTPUT FILES
Mars-GRAM 2010 produces several output files suitable for passing to a graphics program for plotting and further analysis. Several of these files allow run-time selection from among several plotable parameters as the X parameter in an X-Y graph, or the X and Y parameters in an X-Y-Z graph. See the list of parameter selection codes at the end of this appendix. The graphics output file names and their descriptive headers are as follows:
OUTPUT.txt (or other name, as prescribed in the NAMELIST INPUT file)
Time Time after initial input time (seconds)
Height Planetocentric height (km) above MOLA areoid (Height = HgtMOLA) OR planeto-centric height (km) above ellipsoid (Height = HgtELPS) OR planetocentric height (km) above local MOLA topographic surface (Height = HgtSFCM) OR planetographic height (km) above ellipsoid (Height = HgtGRPH), as determined by input parameters MOLAhgts, NVARX, NVARY, and ipclat
Lat Planetocentric latitude (Lat = LatPC) or planetographic latitude (Lat = LatPG) in degrees (North positive)
LonW/LonE Longitude (degrees, West positive or East positive)
Denkgm3 Average (mean plus wave perturbed) density (kg/m3) or “Logkgm3” for Log10(kg/m3) or “Den%Avg” for percent deviation from COSPAR average, or “Denkgkm3” for kg/km3, depending on input value of LOGSCALE
Temp Average temperature (K)
EWind Eastward wind component (m/s, positive toward East)
NWind Northward wind component (m/s, positive toward North)
sigD Standard deviation for density perturbations (% of unperturbed mean)
Ls Areocentric longitude of Sun from Mars (degrees)
Dust Dust optical depth
LTST Local true solar time (Mars hours)
CO2%m Carbon Dioxide mass concentration (% by mass)
N2%m Nitrogen mass concentration (% by mass)
30
Ar%m Argon mass concentration (% by mass)
O2%m Molecular Oxygen mass concentration (% by mass)
CO%m Carbon Monoxide mass concentration (% by mass)
O%m Atomic Oxygen mass concentration (% by mass)
He%m Helium mass concentration (% by mass)
H2%m Molecular Hydrogen mass concentration (% by mass)
H%m Atomic Hydrogen mass concentration (% by mass)
H2O%m Water vapor mass concentration (% by mass)
DensP Ratio of perturbed density to mean density
DayData.txt (Daily averages for heights below 1.26 nbar level)
Var_X User-selected plot variable determined by NVARX value
Var_Y (Optional) user-selected plot variable from NVARY value
TempDay Local daily average temperature (K)
PresDay Local daily average pressure (N/m2 or as prescribed by LOGSCALE)
DensDay Local daily average density (kg/m3 or as prescribed by LOGSCALE)
EWwnDay Local daily average Eastward wind (m/s)
NSwnDay Local daily average Northward wind (m/s)
Tempmin Local daily minimum temperature (K)
Tempmax Local daily maximum temperature (K)
Densmin Local daily minimum density (kg/m3 or as prescribed by LOGSCALE)
Densmax Local daily maximum density (kg/m3 or as prescribed by LOGSCALE)
LOGSCALE Option controlling units of pressure and density output
DensAV Local density (kg/m3 or as prescribed by LOGSCALE)
Density.txt
Var_X User-selected plot variable determined by NVARX value

31
Var_Y (Optional) user-selected plot variable from NVARY value
DENSLO Low (~ average - 1 standard deviation) density (kg/m3 or Log-10 or % from COSPAR or kg/km3, as controlled by LOGSCALE)
DENSAV Average (mean plus wave-perturbed) density (kg/m3 or Log-10 or % from COSPAR, or kg/km3, as controlled by LOGSCALE)
DENSHI High (~ average + 1 standard deviation) density (kg/m3 or Log-10 or % from COSPAR, or kg/km3, as controlled by LOGSCALE)
DENSTOT Total (mean plus perturbed) density (kg/m3 or Log-10 or % from COSPAR, or kg/km3, as controlled by LOGSCALE)
DustOD Dust optical depth
Radius Radial distance from planetary center of mass to spacecraft position (areoid radius plus altitude)
Grav Local acceleration of gravity (m/s2)
RadAU Mars orbital radius (Astronomical Units)
LOGSCALE Option controlling units of density output
Hgtoffset Local height offset (km) for MTGCM and MGCM data
Ibougher Input parameter controlling height offset option
MapYear TES mapping year (0 for Mars-GRAM 2001 data)
Profwgt Weight factor for auxiliary input profile data
MarsRad.txt
Var_X User-selected plot variable (determined by NVARX value)
Var_Y (Optional) user-selected plot variable (from NVARY value)
alb Surface albedo (ratio upward/downward SW radiation at surface)
mu0 Cosine of solar zenith angle
Dareaden Dust column areal density (kg / m2)
Dmixrat Dust mixing ratio (kg dust / kg air)
Dmasden Dust mass density (micrograms dust / m3)
Dnumden Dust number density (number dust particles / m3)

32
Ice Surface polar ice indicator (0 = no, 1 = yes)
File = Perturb.txt
Ice Surface polar ice indicator (0 = no, 1 = yes)
Var_X User-selected plot variable (determined by NVARX value)
Var_Y (Optional) user-selected plot variable (from NVARY value)
SigD Standard deviation of density perturbations (% of unperturbed mean)
DensRand Density perturbation from random model (% of unperturbed mean)
DensWave Density perturbation from wave model (% of unperturbed mean)
DensP Total density perturbation value (% of unperturbed mean)
corlim Fraction of minimum step size for accuracy of perturbations (should be > 1 for insured accuracy of perturbations)
SigU Standard deviation of horizontal wind perturbations (m/s)
SigW Standard deviation of vertical wind perturbations (m/s) iupdate 1 if perturbations updated, 0 if perturbations not updated but perturbation step
updated, -1 if neither perturbations nor step updated
ThrmData.txt (Thermospheric parameters for heights above 80 km)
Var_X User-selected plot variable (determined by NVARX value)
Var_Y (Optional) user-selected plot variable (from NVARY value)
Tbase Temperature at 1.26 nbar level (K)
Zbase Altitude of 1.26 nbar level (km)
F1peak Altitude of F1 ionization peak (km)
MolWgt Mean molecular weight (kg / kg.mole)
Texos Exospheric temperature (K)
hgtoffset Height offset for thermospheric (MTGCM) data (km)
ibougher Input parameter controlling height offset option

33
TPresHgt.txt
ibougher Input parameter controlling height offset option
Var_X User-selected plot variable (determined by NVARX value)
Var_Y (Optional) user-selected plot variable (from NVARY value)
Temp Mean temperature (K)
Pres Mean (plus wave-perturbed) pressure (N/m2, or as controlled by LOGSCALE)
TdegC Mean temperature (°C)
Pres_mb Mean (plus wave-perturbed) pressure (mb)
Hrho Density scale height (km)
Hpres Pressure scale height (km)
MolWt Molecular weight (kg/kg-mole)
TerHgt Altitude of local surface above MOLA 1/2-degree areoid (km)
Tgrnd Ground surface temperature (K)
Areoid Local radius (km) of MOLA 1/2-degree areoid
dAreoid MOLA areoid minus radius of old reference ellipsoid (km); equal to height from old ellipsoid minus height from MOLA areoid
CO2%v Mole fraction (%) Carbon Dioxide concentration (% by volume)
N2%v Mole fraction (%) Nitrogen concentration (% by volume)
Ar%v Mole fraction (%) Argon concentration (% by volume)
O2%v Mole fraction (%) Molecular Oxygen concentration (% by volume)
CO%v Mole fraction (%) Carbon Monoxide concentration (% by volume)
O%v Mole fraction (%) Atomic Oxygen concentration (% by volume)
He%v Mole fraction (%) Helium concentration (% by volume)
H2%v Mole fraction (%) Molecular Hydrogen concentration (% by volume)
H%v Mole fraction (%) Atomic Hydrogen concentration (% by volume)
H2O%v Mole fraction (%) Water vapor concentration (% by volume)
LOGSCALE Option controlling units of pressure output
34
Winds.txt
Var_X User-selected plot variable (determined by NVARX value)
Var_Y (Optional) user-selected plot variable (from NVARY value)
EWmean Mean eastward wind component (m/s, positive eastward)
EWpert Eastward wind perturbation (m/s)
EWtot Total (mean plus perturbed) eastward wind (m/s)
NSmean Mean northward wind component (m/s, positive northward)
NSpert Northward wind perturbation (m/s)
NStot Total (mean plus perturbed) northward wind (m/s)
VWpert Vertical wind perturbation (m/s)
iupdate 1 if perturbations updated, 0 if perturbations not updated but perturbation step updated, -1 if neither perturbations nor step updated
Model input codes used to select the plotable x and y parameters (Var_X and Var_Y) are as follows:
Code Parameter ------- ----------------------------------------------------------------------------------------------------- 1 Planetocentric height above local MOLA areoid (km) 2 Planetocentric height above local MOLA topographic surface (km) 3 Planetocentric latitude (degree (deg.)) 4 Longitude (deg.) West+ if LonEW = 0, East+ if LonEW = 1 5 Time from start (Earth seconds) 6 Time from start (Martian Sols) 7 Areocentric Longitude of Sun, Ls (deg.) 8 Local Solar Time (Mars hours) 9 Pressure (mb) 10 Pressure Height (km) [-H*log(Pres/PresSurf) = -H*log(sigma)] 11 Sigma coordinate [sigma = Pressure/(Pressure at Surface)] 12 Planetocentric Height (km) above reference ellipsoid (km) 13 Planetographic Height (km) above reference ellipsoid (km) 14 Planetographic Latitude (deg.) 15 Longitude in range -180 to +180 (East or West, controlled by LonEW)
Run-time selection of these plotable parameters is made by the input variables NVARX and NVARY contained in the NAMELIST format input file as described in section 4.3 and appendix B.

35
APPENDIX B—EXAMPLE NAMELIST FORMAT INPUT FILE
The following is an example of the NAMELIST format input file required by Mars-GRAM 2010. Input data given here are provided as file inputstd0.txt. Values given are the default values assigned by the program. Only values that differ from the defaults actually have to be included in the NAMELIST file:
$INPUT_M10 LSTFL = ‘LIST.txt’ OUTFL = ‘OUTPUT.txt’ TRAJFL = ‘TRAJDATA.txt’ profile = ‘null’ WaveFile = ‘null’ DATADIR = ‘D:\Mars\Mars2010\Release1.0_Nov10\binFiles\’ GCMDIR = ‘D:\Mars\Mars2010\Release1.0_Nov10\binFiles\’ IERT = 1 IUTC = 1 MONTH = 7 MDAY = 20 MYEAR = 76 NPOS = 41 IHR = 12 IMIN = 30 SEC = 0.0 LonEW = 0 Dusttau = 0.3 Dustmin = 0.3 Dustmax = 1.0 Dustnu = 0.003 Dustdiam = 5.0 Dustdens = 3000. ALS0 = 0.0 ALSDUR = 48. INTENS = 0.0 RADMAX = 0.0 DUSTLAT = 0.0 DUSTLON = 0.0 MapYear = 0 F107 = 68.0 NR1 = 1234 NVARX = 1 NVARY = 0 LOGSCALE = 0 FLAT = 22.48 FLON = 47.97 FHGT = -5. MOLAhgts = 1 hgtasfcm = 0. zoffset = 3.25 ibougher = 1 DELHGT = 5.0 DELLAT = 0.5

36
DELLON = 0.5 DELTIME = 500.0 deltaTEX = 0.0 profnear = 0.0 proffar = 0.0 rpscale = 1.0 rwscale = 1.0 wlscale = 1.0 wmscale = 1.0 blwinfac = 1.0 NMONTE = 1 iup = 13 WaveA0 = 1.0 WaveDate = 0.0 WaveA1 = 0.0 Wavephi1 = 0.0 phi1dot = 0.0 WaveA2 = 0.0 Wavephi2 = 0.0 phi2dot = 0.0 WaveA3 = 0.0 Wavephi3 = 0.0 phi3dot = 0.0 iuwave = 0 Wscale = 20. corlmin = 0.0 ipclat = 1 requa = 3396.19 rpole = 3376.20 idaydata = 1 $END
Explanation of variables: LSTFL = List file name (CON for console listing) OUTFL = Output file name TRAJFL = (Optional) Trajectory input file. File contains time (sec) relative to start time, height (km), latitude (deg), longitude (deg W if LonEW=0, deg E if LonEW=1, see below) profile = (Optional) auxiliary profile input file name WaveFile = (Optional) file for time-dependent wave coefficient data. See file description under parameter iuwave, below. DATADIR = Directory for COSPAR data and topographic height data GCMDIR = Directory for GCM binary data files IERT = 1 for time input as Earth-Receive time (ERT) or 0 Mars-event time (MET) IUTC = 1 for time input as Coordinated Universal Time (UTC), or 0 for Terrestrial (Dynamical) Time (TT) MONTH = (Integer) month of year MDAY = (Integer) day of month MYEAR = (Integer) year (4-digit; 1970-2069 can be 2-digit) NPOS = max # positions to evaluate (0 = read data from trajectory input file) IHR = Hour of day (ERT or MET, controlled by IERT and UTC or TT, controlled by IUTC) IMIN = minute of hour (meaning controlled by IERT and IUTC) SEC = seconds of minute (meaning controlled by IERT and IUTC). IHR:IMIN:SEC is time for initial position to be evaluated LonEW = 0 for input and output West longitudes positive; 1 for East longitudes positive

37
Dusttau = Optical depth of background dust level (no time-developing dust storm, just uniformly mixed dust), 0.1 to 3.0, or use 0 for assumed seasonal variation of background dust Dustmin = Minimum seasonal dust tau if input Dusttau=0 (>=0.1) Dustmax = Maximum seasonal dust tau if input Dusttau=0 (<=1.0) Dustnu = Parameter for vertical distribution of dust density (Haberle et al., J. Geophys. Res., 104, 8957, 1999) Dustdiam = Dust particle diameter (micrometers, assumed monodisperse) Dustdens = Dust particle density (kg/m**3) ALS0 = starting Ls value (degrees) for dust storm (0 = none) ALSDUR = duration (in Ls degrees) for dust storm (default = 48) INTENS = dust storm intensity (0.0 - 3.0) RADMAX = max. radius (km) of dust storm (0 or >10000 = global) DUSTLAT = Latitude (degrees) for center of dust storm DUSTLON = Longitude (degrees) (West positive if LonEW=0, or East positive if LonEW = 1) for center of dust storm MapYear = 1 or 2 for TES mapping year 1 or 2 GCM input data, or 0 for Mars-GRAM 2001 GCM input data sets F107 = 10.7 cm solar flux (10**-22 W/cm**2 at 1 AU) NR1 = starting random number (0 < NR1 < 30000) NVARX = x-code for plotable output (1=hgt above MOLA areoid). See file xycodes.txt NVARY = y-code for 3-D plotable output (0 for 2-D plots) LOGSCALE = 0=regular SI units, 1=log-base-10 scale, 2=percentage deviations from COSPAR model, 3=SI units, with density in kg/km**3 (suitable for high altitudes) FLAT = initial latitude (N positive), degrees FLON = initial longitude (West positive if LowEW = 0 or East positive if LonEW = 1), degrees FHGT = initial height (km); <=-10 means evaluate at surface height; > 3000 km means planeto-centric radius MOLAhgts = 1 for input heights relative to MOLA areoid, otherwise input heights are relative to reference ellipsoid hgtasfcm = height above surface (0-4500 m); use if FHGT <= -10. km zoffset = constant height offset (km) for MTGCM data or constant part of Ls-dependent (Bougher) height offset (0.0 means no constant offset). Positive offset increases density, negative offset decreases density. ibougher = 0 for no Ls-dependent (Bougher) height offset term; 1 means add Ls-dependent (Bougher) term, -A*Sin(Ls) (km), to constant term (zoffset) [offset amplitude A = 2.5 for MapYear=0 or 0.5 for MapYear > 0]; 2 means use global mean height offset from data file hgtoffst.dat; 3 means use daily average height offset at local position; 4 means use height offset at current time and local position. Value of zoffset is ignored if ibougher = 2, 3, or 4. DELHGT = height increment (km) between steps DELLAT = Latitude increment (deg) between steps (Northward positive) DELLON = Longitude increment (deg) between steps (Westward positive if LonEW = 0, Eastward positive if LonEW = 1) DELTIME = time increment (sec) between steps deltaTEX = adjustment for exospheric temperature (K) profnear = Lat-lon radius (degrees) within which weight for auxiliary profile is 1.0 (Use profnear = 0.0 for no profile input) proffar = Lat-lon radius (degrees) beyond which weight for auxiliary profile is 0.0 rpscale = random density perturbation scale factor (0-2) rwscale = random wind perturbation scale factor (>=0) wlscale = scale factor for perturbation wavelengths (0.1-10) wmscale = scale factor for mean winds blwinfac = scale factor for boundary layer slope winds (0 = none)

38
NMONTE = number of Monte Carlo runs iup = 0 for no LIST and graphics output, or unit number for output WaveA0 = Mean term of longitude-dependent wave multiplier for density WaveDate = Julian date for (primary) peak(s) of wave (0 for no traveling component) WaveA1 = Amplitude of wave-1 component of longitude-dependent wave multiplier for density Wavephi1 = Phase of wave-1 component of longitude-dependent wave multiplier (longitude, with West positive if LonEW = 0, East positive if LonEW = 1) phi1dot = Rate of longitude movement (degrees per day) for wave-1 component (Westward positive if LonEW = 0, Eastward positive if LonEW = 1) WaveA2 = Amplitude of wave-2 component of longitude-dependent wave multiplier for density Wavephi2 = Phase of wave-2 component of longitude-dependent wave multiplier (longitude, with West positive if LonEW = 0, East positive if LonEW = 1) phi2dot = Rate of longitude movement (degrees per day) for wave-2 component (Westward positive if LonEW = 0, Eastward positive if LonEW = 1) WaveA3 = Amplitude of wave-3 component of longitude-dependent wave multiplier for density Wavephi3 = Phase of wave-3 component of longitude-dependent wave multiplier (longitude, with West positive if LonEW = 0, East positive if LonEW = 1) phi3dot = Rate of longitude movement (degrees per day) for wave-3 component (Westward positive if LonEW = 0, Eastward positive if LonEW = 1) iuwave = Unit number for (Optional) time-dependent wave coefficient data file “WaveFile” (or 0 for none). WaveFile contains time (sec) relative to start time, and wave model coefficients (WaveA0 thru Wavephi3) from the given time to the next time in the data file. Wscale = Vertical scale (km) of longitude-dependent wave damping at altitudes below 100 km (10<=Wscale<=10,000 km) corlmin = minimum relative step size for perturbation updates (0.0-1.0); 0.0 means always update perturbations, x.x means only update perturbations when corlim > x.x ipclat = 1 for Planeto-centric latitude and height input, 0 for Planeto-graphic latitude and height input requa = Equatorial radius (km) for reference ellipsoid rpole = Polar radius (km) for reference ellipsoid idaydata = 1 for daily max/min data output; 0 for none

39
APPENDIX C—SAMPLE OUTPUT LIST FILE
Following is the LIST file output produced by the standard input parameters given in appendix B. Standard input files for MapYear = 0, 1, and 2 are provided to users as the files input-std0.txt, inputstd1.txt, and inputstd2.txt. The output data given below are provided in the file List-MapYr0.txt. Output files that result from the use of inputstd1.txt and inputstd2.txt are provided to users in the files ListMapYr1.txt and ListMapYr2.txt. Availability of these files allows users to complete a test run after compiling Mars-GRAM 2010 on their own computer and to electroni-cally check their output by a file-compare process (e.g. the ‘diff’ command in UNIX or the ‘fc’ command in DOS). Please note that, due to machine-dependent or compiler-dependent rounding differences, some output values may differ slightly from those shown here. These differences are usually no more than one unit in the last significant digit displayed:
Mars-GRAM 2010 (Version 1.0) - Nov 2010 LIST file= LIST.txt OUTPUT file= OUTPUT.txt Data directory= D:\Mars\Mars2010\Release1.0_Nov10\binFiles\ GCM directory= D:\Mars\Mars2010\Release1.0_Nov10\binFiles\ Input time is Earth-Receive Time (ERT) Input time is Coordinated Universal Time (UTC) Date = 7/20/1976 Julian Day = 2442980.02083 Time = 12:30: 0.0 Input heights are planeto-centric, relative to MOLA areoid Reference ellipsoid radii (km): Equator = 3396.19 Pole = 3376.20 Output heights are planeto-centric, except as noted. Longitude & ephemeris use IAU 2000 rotational system. F10.7 flux = 68.0 (1 AU) 25.0 (Mars) Dust optical depth from NAMELIST input Dustnu = 0.0030 Dustdiam = 5.00 E-6 meters Dustdens = 3000.0 kg/m**3 Random seed = 1234 Dens.Pert.Scale Factor = 1.00 corlmin = 0.000 Wind.Pert.Scale Factor = 1.00 Wavelength Scale Factor = 1.00 Mean Wind Scale Factor = 1.00 Slope Wind Scale Factor = 1.00 A0,A1,phi1,A2,phi2,A3,phi3= 1.000 0.000 0.0 0.000 0.0 0.000 0.0 Wave Scale = 20.0 km. Wave phases are in degrees of West Longitude Time (rel. to T0) = 0.0 sec. ( 0.000 sols) Ls = 97.0 Dust = 0.30 Height Above MOLA (or Surface) = -5.000 km ( -1.372 km) OWLT = 19.01 Min Topographic Height = -3.628 km Radius (Areoid) = 3387.954 (3392.954) km Hgt Above Ellipsoid = -5.292 km Scale Hgt H(p)= 10.94 H(rho)= 10.94 km Height Offset Parameters: ibougher = 1 Local Height Offset = 0.000 km Planeto-Centric Lat = 22.48 deg Longitude = 47.97 W ( 312.03 E) deg. Planeto-Graphic Lat = 22.72 deg Planeto-Graphic Hgt (Ellps)= -5.292 km Planeto-Cent Sun Lat = 25.02 deg Mars Orbital Radius = 1.649 AU Sun Longitude = 108.69 deg.W Local True Solar Time = 16.05 Mars hrs Temperature = 241.8 K Pressure = 8.953E+02 N/m**2 profwgt = 0.000 Density (Low, Avg., High) = 1.922E-02 1.960E-02 1.999E-02 kg/m**3 Departure, COSPAR NH Mean = -21.6 % -20.0 % -18.4 % iupdate = 1 Tot.Dens. = 2.006E-02 kg/m**3 Dens.Pert. = 2.34% Wave = 0.00% of mean Eastward Wind (Mean,Perturbed,Total) = 0.0 -1.1 -1.1 m/s VertWind Northward Wind(Mean,Perturbed,Total) = 0.0 -0.4 -0.4 m/s -0.2 m/s CO2=2.577E+23 N2=7.809E+21 Ar=4.685E+21 O2=3.692E+20 CO=2.840E+20 #/m**3 96.084 1.854 1.586 0.100 0.067 % by mass 94.445 2.862 1.717 0.135 0.104 % by volume

40
H2O=2.025E+21 O=0.000E+00 He=0.000E+00 H2=0.000E+00 Total=2.729E+23 #/m**3 0.308 0.000 0.000 0.000 % by mass MolWgt=43.259 0.742 0.000 0.000 0.000 % volume (mole) fraction ------------------------------------------------------------------------------------------------------------------------------ Time (rel. to T0) = 500.0 sec. ( 0.006 sols) Ls = 97.0 Dust = 0.30 Height Above MOLA (or Surface) = 0.000 km ( 3.585 km) OWLT = 19.01 Min Topographic Height = -3.585 km Radius (Areoid) = 3392.852 (3392.852) km Hgt Above Ellipsoid = -0.268 km Scale Hgt H(p)= 10.85 H(rho)= 12.96 km Height Offset Parameters: ibougher = 1 Local Height Offset = 0.000 km Planeto-Centric Lat = 22.98 deg Longitude = 48.47 W ( 311.53 E) deg. Planeto-Graphic Lat = 23.22 deg Planeto-Graphic Hgt (Ellps)= -0.268 km Planeto-Cent Sun Lat = 25.02 deg Mars Orbital Radius = 1.649 AU Sun Longitude = 110.72 deg.W Local True Solar Time = 16.15 Mars hrs Temperature = 227.5 K Pressure = 5.670E+02 N/m**2 profwgt = 0.000 Density (Low, Avg., High) = 1.294E-02 1.320E-02 1.346E-02 kg/m**3 Departure, COSPAR NH Mean = -16.5 % -14.9 % -13.2 % iupdate = 1 Tot.Dens. = 1.338E-02 kg/m**3 Dens.Pert. = 1.41% Wave = 0.00% of mean Eastward Wind (Mean,Perturbed,Total) = 2.8 2.9 5.7 m/s VertWind Northward Wind(Mean,Perturbed,Total) = -7.9 -2.5 -10.4 m/s -0.7 m/s CO2=1.739E+23 N2=5.267E+21 Ar=3.160E+21 O2=2.490E+20 CO=1.915E+20 #/m**3 96.290 1.857 1.589 0.100 0.068 % by mass 94.928 2.875 1.725 0.136 0.105 % by volume H2O=4.244E+20 O=0.000E+00 He=0.000E+00 H2=0.000E+00 Total=1.832E+23 #/m**3 0.096 0.000 0.000 0.000 % by mass MolWgt=43.386 0.232 0.000 0.000 0.000 % volume (mole) fraction ------------------------------------------------------------------------------------------------------------------------------ Time (rel. to T0) = 1000.0 sec. ( 0.011 sols) Ls = 97.0 Dust = 0.30 Height Above MOLA (or Surface) = 5.000 km ( 8.545 km) OWLT = 19.01 Min Topographic Height = -3.545 km Radius (Areoid) = 3397.749 (3392.749) km Hgt Above Ellipsoid = 4.756 km Scale Hgt H(p)= 9.92 H(rho)= 11.27 km Height Offset Parameters: ibougher = 1 Local Height Offset = 0.000 km Planeto-Centric Lat = 23.48 deg Longitude = 48.97 W ( 311.03 E) deg. Planeto-Graphic Lat = 23.73 deg Planeto-Graphic Hgt (Ellps)= 4.756 km Planeto-Cent Sun Lat = 25.02 deg Mars Orbital Radius = 1.649 AU Sun Longitude = 112.74 deg.W Local True Solar Time = 16.25 Mars hrs Temperature = 211.0 K Pressure = 3.577E+02 N/m**2 profwgt = 0.000 Density (Low, Avg., High) = 8.793E-03 8.969E-03 9.148E-03 kg/m**3 Departure, COSPAR NH Mean = -11.2 % -9.4 % -7.6 % iupdate = 1 Tot.Dens. = 8.701E-03 kg/m**3 Dens.Pert. = -2.99% Wave = 0.00% of mean Eastward Wind (Mean,Perturbed,Total) = 2.5 -1.9 0.6 m/s VertWind Northward Wind(Mean,Perturbed,Total) = 3.0 1.3 4.3 m/s -0.3 m/s CO2=1.183E+23 N2=3.581E+21 Ar=2.149E+21 O2=1.693E+20 CO=1.302E+20 #/m**3 96.366 1.858 1.590 0.100 0.068 % by mass 95.107 2.880 1.728 0.136 0.105 % by volume H2O=5.525E+19 O=0.000E+00 He=0.000E+00 H2=0.000E+00 Total=1.244E+23 #/m**3 0.018 0.000 0.000 0.000 % by mass MolWgt=43.434 0.044 0.000 0.000 0.000 % volume (mole) fraction ------------------------------------------------------------------------------------------------------------------------------ Time (rel. to T0) = 1500.0 sec. ( 0.017 sols) Ls = 97.0 Dust = 0.30 Height Above MOLA (or Surface) = 10.000 km ( 13.513 km) OWLT = 19.01 Min Topographic Height = -3.513 km Radius (Areoid) = 3402.642 (3392.642) km Hgt Above Ellipsoid = 9.778 km Scale Hgt H(p)= 9.48 H(rho)= 10.60 km Height Offset Parameters: ibougher = 1 Local Height Offset = 0.000 km Planeto-Centric Lat = 23.98 deg Longitude = 49.47 W ( 310.53 E) deg. Planeto-Graphic Lat = 24.23 deg Planeto-Graphic Hgt (Ellps)= 9.778 km Planeto-Cent Sun Lat = 25.02 deg Mars Orbital Radius = 1.649 AU Sun Longitude = 114.77 deg.W Local True Solar Time = 16.35 Mars hrs Temperature = 198.7 K Pressure = 2.161E+02 N/m**2 profwgt = 0.000 Density (Low, Avg., High) = 5.624E-03 5.753E-03 5.885E-03 kg/m**3 Departure, COSPAR NH Mean = -13.1 % -11.1 % -9.0 % iupdate = 1

41
Tot.Dens. = 5.749E-03 kg/m**3 Dens.Pert. = -0.07% Wave = 0.00% of mean Eastward Wind (Mean,Perturbed,Total) = -16.4 -0.9 -17.3 m/s VertWind Northward Wind(Mean,Perturbed,Total) = 9.5 2.0 11.4 m/s -0.8 m/s CO2=7.588E+22 N2=2.297E+21 Ar=1.378E+21 O2=1.086E+20 CO=8.352E+19 #/m**3 96.380 1.857 1.589 0.100 0.068 % by mass 95.139 2.880 1.728 0.136 0.105 % by volume H2O=9.639E+18 O=0.000E+00 He=0.000E+00 H2=0.000E+00 Total=7.975E+22 #/m**3 0.005 0.000 0.000 0.000 % by mass MolWgt=43.442 0.012 0.000 0.000 0.000 % volume (mole) fraction ------------------------------------------------------------------------------------------------------------------------------ Time (rel. to T0) = 2000.0 sec. ( 0.023 sols) Ls = 97.0 Dust = 0.30 Height Above MOLA (or Surface) = 15.000 km ( 18.545 km) OWLT = 19.01 Min Topographic Height = -3.545 km Radius (Areoid) = 3407.533 (3392.533) km Hgt Above Ellipsoid = 14.800 km Scale Hgt H(p)= 9.08 H(rho)= 10.13 km Height Offset Parameters: ibougher = 1 Local Height Offset = 0.000 km Planeto-Centric Lat = 24.48 deg Longitude = 49.97 W ( 310.03 E) deg. Planeto-Graphic Lat = 24.73 deg Planeto-Graphic Hgt (Ellps)= 14.800 km Planeto-Cent Sun Lat = 25.02 deg Mars Orbital Radius = 1.649 AU Sun Longitude = 116.80 deg.W Local True Solar Time = 16.46 Mars hrs Temperature = 188.3 K Pressure = 1.276E+02 N/m**2 profwgt = 0.000 Density (Low, Avg., High) = 3.494E-03 3.587E-03 3.682E-03 kg/m**3 Departure, COSPAR NH Mean = -16.2 % -14.0 % -11.7 % iupdate = 1 Tot.Dens. = 3.597E-03 kg/m**3 Dens.Pert. = 0.28% Wave = 0.00% of mean Eastward Wind (Mean,Perturbed,Total) = -19.7 -6.0 -25.7 m/s VertWind Northward Wind(Mean,Perturbed,Total) = 10.8 0.2 11.0 m/s 1.4 m/s CO2=4.731E+22 N2=1.431E+21 Ar=8.589E+20 O2=6.767E+19 CO=5.205E+19 #/m**3 96.385 1.857 1.589 0.100 0.067 % by mass 95.149 2.879 1.727 0.136 0.105 % by volume H2O=1.827E+18 O=0.000E+00 He=0.000E+00 H2=0.000E+00 Total=4.972E+22 #/m**3 0.002 0.000 0.000 0.000 % by mass MolWgt=43.445 0.004 0.000 0.000 0.000 % volume (mole) fraction ------------------------------------------------------------------------------------------------------------------------------ Time (rel. to T0) = 2500.0 sec. ( 0.028 sols) Ls = 97.0 Dust = 0.30 Height Above MOLA (or Surface) = 20.000 km ( 23.571 km) OWLT = 19.01 Min Topographic Height = -3.571 km Radius (Areoid) = 3412.420 (3392.420) km Hgt Above Ellipsoid = 19.821 km Scale Hgt H(p)= 8.69 H(rho)= 9.71 km Height Offset Parameters: ibougher = 1 Local Height Offset = 0.000 km Planeto-Centric Lat = 24.98 deg Longitude = 50.47 W ( 309.53 E) deg. Planeto-Graphic Lat = 25.24 deg Planeto-Graphic Hgt (Ellps)= 19.821 km Planeto-Cent Sun Lat = 25.02 deg Mars Orbital Radius = 1.649 AU Sun Longitude = 118.83 deg.W Local True Solar Time = 16.56 Mars hrs Temperature = 178.1 K Pressure = 7.374E+01 N/m**2 profwgt = 0.000 Density (Low, Avg., High) = 2.125E-03 2.190E-03 2.257E-03 kg/m**3 Departure, COSPAR NH Mean = -19.2 % -16.7 % -14.2 % iupdate = 1 Tot.Dens. = 2.229E-03 kg/m**3 Dens.Pert. = 1.78% Wave = 0.00% of mean Eastward Wind (Mean,Perturbed,Total) = -30.6 -0.7 -31.3 m/s VertWind Northward Wind(Mean,Perturbed,Total) = 8.2 -6.1 2.1 m/s -0.3 m/s CO2=2.888E+22 N2=8.737E+20 Ar=5.242E+20 O2=4.130E+19 CO=3.177E+19 #/m**3 96.388 1.856 1.588 0.100 0.067 % by mass 95.153 2.878 1.727 0.136 0.105 % by volume H2O=3.014E+17 O=0.000E+00 He=0.000E+00 H2=0.000E+00 Total=3.036E+22 #/m**3 0.000 0.000 0.000 0.000 % by mass MolWgt=43.446 0.001 0.000 0.000 0.000 % volume (mole) fraction ------------------------------------------------------------------------------------------------------------------------------ Time (rel. to T0) = 3000.0 sec. ( 0.034 sols) Ls = 97.0 Dust = 0.30 Height Above MOLA (or Surface) = 25.000 km ( 28.359 km) OWLT = 19.01 Min Topographic Height = -3.359 km Radius (Areoid) = 3417.305 (3392.305) km Hgt Above Ellipsoid = 24.841 km Scale Hgt H(p)= 8.34 H(rho)= 9.43 km Height Offset Parameters: ibougher = 1 Local Height Offset = 0.000 km Planeto-Centric Lat = 25.48 deg Longitude = 50.97 W ( 309.03 E) deg.

42
Planeto-Graphic Lat = 25.74 deg Planeto-Graphic Hgt (Ellps)= 24.841 km Planeto-Cent Sun Lat = 25.02 deg Mars Orbital Radius = 1.649 AU Sun Longitude = 120.85 deg.W Local True Solar Time = 16.66 Mars hrs Temperature = 168.0 K Pressure = 4.160E+01 N/m**2 profwgt = 0.000 Density (Low, Avg., High) = 1.265E-03 1.310E-03 1.356E-03 kg/m**3 Departure, COSPAR NH Mean = -21.9 % -19.1 % -16.3 % iupdate = 1 Tot.Dens. = 1.302E-03 kg/m**3 Dens.Pert. = -0.63% Wave = 0.00% of mean Eastward Wind (Mean,Perturbed,Total) = -42.1 3.7 -38.5 m/s VertWind Northward Wind(Mean,Perturbed,Total) = 9.5 5.4 14.9 m/s 1.3 m/s CO2=1.728E+22 N2=5.224E+20 Ar=3.134E+20 O2=2.469E+19 CO=1.900E+19 #/m**3 96.389 1.855 1.588 0.100 0.067 % by mass 95.156 2.877 1.726 0.136 0.105 % by volume H2O=4.024E+16 O=0.000E+00 He=0.000E+00 H2=0.000E+00 Total=1.816E+22 #/m**3 0.000 0.000 0.000 0.000 % by mass MolWgt=43.446 0.000 0.000 0.000 0.000 % volume (mole) fraction ------------------------------------------------------------------------------------------------------------------------------ Time (rel. to T0) = 3500.0 sec. ( 0.039 sols) Ls = 97.0 Dust = 0.30 Height Above MOLA (or Surface) = 30.000 km ( 33.384 km) OWLT = 19.01 Min Topographic Height = -3.384 km Radius (Areoid) = 3422.188 (3392.188) km Hgt Above Ellipsoid = 29.861 km Scale Hgt H(p)= 8.01 H(rho)= 8.72 km Height Offset Parameters: ibougher = 1 Local Height Offset = 0.000 km Planeto-Centric Lat = 25.98 deg Longitude = 51.47 W ( 308.53 E) deg. Planeto-Graphic Lat = 26.25 deg Planeto-Graphic Hgt (Ellps)= 29.861 km Planeto-Cent Sun Lat = 25.02 deg Mars Orbital Radius = 1.649 AU Sun Longitude = 122.88 deg.W Local True Solar Time = 16.76 Mars hrs Temperature = 157.1 K Pressure = 2.293E+01 N/m**2 profwgt = 0.000 Density (Low, Avg., High) = 7.418E-04 7.719E-04 8.032E-04 kg/m**3 Departure, COSPAR NH Mean = -24.3 % -21.2 % -18.0 % iupdate = 1 Tot.Dens. = 7.296E-04 kg/m**3 Dens.Pert. = -5.47% Wave = 0.00% of mean Eastward Wind (Mean,Perturbed,Total) = -60.3 -4.5 -64.8 m/s VertWind Northward Wind(Mean,Perturbed,Total) = -4.5 -4.2 -8.8 m/s -0.0 m/s CO2=1.018E+22 N2=3.077E+20 Ar=1.846E+20 O2=1.455E+19 CO=1.119E+19 #/m**3 96.391 1.855 1.587 0.100 0.067 % by mass 95.158 2.876 1.726 0.136 0.105 % by volume H2O=3.427E+15 O=0.000E+00 He=0.000E+00 H2=0.000E+00 Total=1.070E+22 #/m**3 0.000 0.000 0.000 0.000 % by mass MolWgt=43.446 0.000 0.000 0.000 0.000 % volume (mole) fraction ------------------------------------------------------------------------------------------------------------------------------ Time (rel. to T0) = 4000.0 sec. ( 0.045 sols) Ls = 97.0 Dust = 0.30 Height Above MOLA (or Surface) = 35.000 km ( 38.545 km) OWLT = 19.01 Min Topographic Height = -3.545 km Radius (Areoid) = 3427.069 (3392.069) km Hgt Above Ellipsoid = 34.882 km Scale Hgt H(p)= 7.76 H(rho)= 8.72 km Height Offset Parameters: ibougher = 1 Local Height Offset = 0.000 km Planeto-Centric Lat = 26.48 deg Longitude = 51.97 W ( 308.03 E) deg. Planeto-Graphic Lat = 26.75 deg Planeto-Graphic Hgt (Ellps)= 34.881 km Planeto-Cent Sun Lat = 25.02 deg Mars Orbital Radius = 1.649 AU Sun Longitude = 124.91 deg.W Local True Solar Time = 16.86 Mars hrs Temperature = 149.4 K Pressure = 1.234E+01 N/m**2 profwgt = 0.000 Density (Low, Avg., High) = 4.175E-04 4.371E-04 4.576E-04 kg/m**3 Departure, COSPAR NH Mean = -28.3 % -24.9 % -21.4 % iupdate = 1 Tot.Dens. = 4.215E-04 kg/m**3 Dens.Pert. = -3.58% Wave = 0.00% of mean Eastward Wind (Mean,Perturbed,Total) = -84.4 4.2 -80.2 m/s VertWind Northward Wind(Mean,Perturbed,Total) = -14.5 4.7 -9.7 m/s -0.5 m/s CO2=5.765E+21 N2=1.742E+20 Ar=1.045E+20 O2=8.234E+18 CO=6.334E+18 #/m**3 96.392 1.854 1.587 0.100 0.067 % by mass 95.160 2.875 1.725 0.136 0.105 % by volume H2O=4.724E+14 O=0.000E+00 He=0.000E+00 H2=0.000E+00 Total=6.059E+21 #/m**3 0.000 0.000 0.000 0.000 % by mass MolWgt=43.446 0.000 0.000 0.000 0.000 % volume (mole) fraction ------------------------------------------------------------------------------------------------------------------------------

43
Time (rel. to T0) = 4500.0 sec. ( 0.051 sols) Ls = 97.0 Dust = 0.30 Height Above MOLA (or Surface) = 40.000 km ( 43.648 km) OWLT = 19.01 Min Topographic Height = -3.648 km Radius (Areoid) = 3431.950 (3391.950) km Hgt Above Ellipsoid = 39.903 km Scale Hgt H(p)= 7.56 H(rho)= 8.12 km Height Offset Parameters: ibougher = 1 Local Height Offset = 0.000 km Planeto-Centric Lat = 26.98 deg Longitude = 52.47 W ( 307.53 E) deg. Planeto-Graphic Lat = 27.25 deg Planeto-Graphic Hgt (Ellps)= 39.903 km Planeto-Cent Sun Lat = 25.02 deg Mars Orbital Radius = 1.649 AU Sun Longitude = 126.94 deg.W Local True Solar Time = 16.96 Mars hrs Temperature = 139.3 K Pressure = 6.522E+00 N/m**2 profwgt = 0.000 Density (Low, Avg., High) = 2.350E-04 2.477E-04 2.610E-04 kg/m**3 Departure, COSPAR NH Mean = -30.9 % -27.2 % -23.2 % iupdate = 1 Tot.Dens. = 2.232E-04 kg/m**3 Dens.Pert. = -9.88% Wave = 0.00% of mean Eastward Wind (Mean,Perturbed,Total) = -89.0 -4.8 -93.7 m/s VertWind Northward Wind(Mean,Perturbed,Total) = -9.0 -4.4 -13.4 m/s -0.0 m/s CO2=3.267E+21 N2=9.865E+19 Ar=5.919E+19 O2=4.663E+18 CO=3.587E+18 #/m**3 96.393 1.853 1.586 0.100 0.067 % by mass 95.162 2.874 1.724 0.136 0.105 % by volume H2O=2.599E+13 O=0.000E+00 He=0.000E+00 H2=0.000E+00 Total=3.433E+21 #/m**3 0.000 0.000 0.000 0.000 % by mass MolWgt=43.447 0.000 0.000 0.000 0.000 % volume (mole) fraction ------------------------------------------------------------------------------------------------------------------------------ Time (rel. to T0) = 5000.0 sec. ( 0.056 sols) Ls = 97.0 Dust = 0.30 Height Above MOLA (or Surface) = 45.000 km ( 48.628 km) OWLT = 19.01 Min Topographic Height = -3.628 km Radius (Areoid) = 3436.830 (3391.830) km Hgt Above Ellipsoid = 44.926 km Scale Hgt H(p)= 7.33 H(rho)= 7.41 km Height Offset Parameters: ibougher = 1 Local Height Offset = 0.000 km Planeto-Centric Lat = 27.48 deg Longitude = 52.97 W ( 307.03 E) deg. Planeto-Graphic Lat = 27.75 deg Planeto-Graphic Hgt (Ellps)= 44.926 km Planeto-Cent Sun Lat = 25.02 deg Mars Orbital Radius = 1.649 AU Sun Longitude = 128.97 deg.W Local True Solar Time = 17.07 Mars hrs Temperature = 133.2 K Pressure = 3.389E+00 N/m**2 profwgt = 0.000 Density (Low, Avg., High) = 1.267E-04 1.346E-04 1.430E-04 kg/m**3 Departure, COSPAR NH Mean = -34.7 % -30.6 % -26.3 % iupdate = 1 Tot.Dens. = 1.225E-04 kg/m**3 Dens.Pert. = -8.99% Wave = 0.00% of mean Eastward Wind (Mean,Perturbed,Total) = -86.7 1.6 -85.1 m/s VertWind Northward Wind(Mean,Perturbed,Total) = -12.8 0.3 -12.4 m/s -1.0 m/s CO2=1.776E+21 N2=5.361E+19 Ar=3.216E+19 O2=2.534E+18 CO=1.949E+18 #/m**3 96.395 1.853 1.585 0.100 0.067 % by mass 95.163 2.873 1.724 0.136 0.104 % by volume H2O=3.620E+12 O=0.000E+00 He=0.000E+00 H2=0.000E+00 Total=1.866E+21 #/m**3 0.000 0.000 0.000 0.000 % by mass MolWgt=43.447 0.000 0.000 0.000 0.000 % volume (mole) fraction ------------------------------------------------------------------------------------------------------------------------------ Time (rel. to T0) = 5500.0 sec. ( 0.062 sols) Ls = 97.0 Dust = 0.30 Height Above MOLA (or Surface) = 50.000 km ( 53.523 km) OWLT = 19.01 Min Topographic Height = -3.523 km Radius (Areoid) = 3441.711 (3391.711) km Hgt Above Ellipsoid = 49.951 km Scale Hgt H(p)= 7.86 H(rho)= 7.21 km Height Offset Parameters: ibougher = 1 Local Height Offset = 0.000 km Planeto-Centric Lat = 27.98 deg Longitude = 53.47 W ( 306.53 E) deg. Planeto-Graphic Lat = 28.26 deg Planeto-Graphic Hgt (Ellps)= 49.951 km Planeto-Cent Sun Lat = 25.02 deg Mars Orbital Radius = 1.649 AU Sun Longitude = 130.99 deg.W Local True Solar Time = 17.17 Mars hrs Temperature = 132.4 K Pressure = 1.726E+00 N/m**2 profwgt = 0.000 Density (Low, Avg., High) = 6.440E-05 6.903E-05 7.399E-05 kg/m**3 Departure, COSPAR NH Mean = -40.4 % -36.1 % -31.5 % iupdate = 1 Tot.Dens. = 6.888E-05 kg/m**3 Dens.Pert. = -0.21% Wave = 0.00% of mean Eastward Wind (Mean,Perturbed,Total) = -86.4 0.5 -86.0 m/s VertWind Northward Wind(Mean,Perturbed,Total) = 12.2 7.8 20.0 m/s -0.5 m/s CO2=9.105E+20 N2=2.747E+19 Ar=1.648E+19 O2=1.299E+18 CO=9.990E+17 #/m**3

44
96.396 1.852 1.585 0.100 0.067 % by mass 95.165 2.872 1.723 0.136 0.104 % by volume H2O=2.765E+12 O=0.000E+00 He=0.000E+00 H2=0.000E+00 Total=9.568E+20 #/m**3 0.000 0.000 0.000 0.000 % by mass MolWgt=43.447 0.000 0.000 0.000 0.000 % volume (mole) fraction ------------------------------------------------------------------------------------------------------------------------------ Time (rel. to T0) = 6000.0 sec. ( 0.068 sols) Ls = 97.0 Dust = 0.30 Height Above MOLA (or Surface) = 55.000 km ( 58.286 km) OWLT = 19.01 Min Topographic Height = -3.286 km Radius (Areoid) = 3446.592 (3391.592) km Hgt Above Ellipsoid = 54.978 km Scale Hgt H(p)= 9.17 H(rho)= 8.50 km Height Offset Parameters: ibougher = 1 Local Height Offset = 0.000 km Planeto-Centric Lat = 28.48 deg Longitude = 53.97 W ( 306.03 E) deg. Planeto-Graphic Lat = 28.76 deg Planeto-Graphic Hgt (Ellps)= 54.978 km Planeto-Cent Sun Lat = 25.02 deg Mars Orbital Radius = 1.649 AU Sun Longitude = 133.02 deg.W Local True Solar Time = 17.27 Mars hrs Temperature = 140.4 K Pressure = 9.204E-01 N/m**2 profwgt = 0.000 Density (Low, Avg., High) = 3.209E-05 3.475E-05 3.764E-05 kg/m**3 Departure, COSPAR NH Mean = -45.8 % -41.3 % -36.4 % iupdate = 1 Tot.Dens. = 2.639E-05 kg/m**3 Dens.Pert. = -24.06% Wave = 0.00% of mean Eastward Wind (Mean,Perturbed,Total) = -68.2 -6.4 -74.6 m/s VertWind Northward Wind(Mean,Perturbed,Total) = -1.9 1.7 -0.1 m/s -4.6 m/s CO2=4.584E+20 N2=1.383E+19 Ar=8.296E+18 O2=6.536E+17 CO=5.028E+17 #/m**3 96.398 1.851 1.584 0.100 0.067 % by mass 95.167 2.870 1.722 0.136 0.104 % by volume H2O=3.607E+13 O=0.000E+00 He=0.000E+00 H2=0.000E+00 Total=4.817E+20 #/m**3 0.000 0.000 0.000 0.000 % by mass MolWgt=43.447 0.000 0.000 0.000 0.000 % volume (mole) fraction ------------------------------------------------------------------------------------------------------------------------------ Time (rel. to T0) = 6500.0 sec. ( 0.073 sols) Ls = 97.0 Dust = 0.30 Height Above MOLA (or Surface) = 60.000 km ( 63.123 km) OWLT = 19.01 Min Topographic Height = -3.123 km Radius (Areoid) = 3451.473 (3391.473) km Hgt Above Ellipsoid = 60.007 km Scale Hgt H(p)= 12.00 H(rho)= 11.87 km Height Offset Parameters: ibougher = 1 Local Height Offset = 0.000 km Planeto-Centric Lat = 28.98 deg Longitude = 54.47 W ( 305.53 E) deg. Planeto-Graphic Lat = 29.26 deg Planeto-Graphic Hgt (Ellps)= 60.006 km Planeto-Cent Sun Lat = 25.02 deg Mars Orbital Radius = 1.649 AU Sun Longitude = 135.05 deg.W Local True Solar Time = 17.37 Mars hrs Temperature = 146.6 K Pressure = 5.372E-01 N/m**2 profwgt = 0.000 Density (Low, Avg., High) = 1.774E-05 1.943E-05 2.129E-05 kg/m**3 Departure, COSPAR NH Mean = -44.2 % -38.9 % -33.0 % iupdate = 1 Tot.Dens. = 1.943E-05 kg/m**3 Dens.Pert. = 0.01% Wave = 0.00% of mean Eastward Wind (Mean,Perturbed,Total) = -45.7 2.1 -43.6 m/s VertWind Northward Wind(Mean,Perturbed,Total) = -12.5 -2.2 -14.7 m/s -2.0 m/s CO2=2.563E+20 N2=7.728E+18 Ar=4.637E+18 O2=3.653E+17 CO=2.810E+17 #/m**3 96.399 1.850 1.583 0.100 0.067 % by mass 95.169 2.869 1.721 0.136 0.104 % by volume H2O=2.233E+14 O=0.000E+00 He=0.000E+00 H2=0.000E+00 Total=2.693E+20 #/m**3 0.000 0.000 0.000 0.000 % by mass MolWgt=43.448 0.000 0.000 0.000 0.000 % volume (mole) fraction ------------------------------------------------------------------------------------------------------------------------------ Time (rel. to T0) = 7000.0 sec. ( 0.079 sols) Ls = 97.0 Dust = 0.30 Height Above MOLA (or Surface) = 65.000 km ( 68.349 km) OWLT = 19.02 Min Topographic Height = -3.349 km Radius (Areoid) = 3456.354 (3391.354) km Hgt Above Ellipsoid = 65.038 km Scale Hgt H(p)= 9.35 H(rho)= 9.59 km Height Offset Parameters: ibougher = 1 Local Height Offset = 0.498 km Planeto-Centric Lat = 29.48 deg Longitude = 54.97 W ( 305.03 E) deg. Planeto-Graphic Lat = 29.77 deg Planeto-Graphic Hgt (Ellps)= 65.037 km Planeto-Cent Sun Lat = 25.02 deg Mars Orbital Radius = 1.649 AU Sun Longitude = 137.08 deg.W Local True Solar Time = 17.47 Mars hrs
45
Temperature = 147.0 K Pressure = 3.605E-01 N/m**2 profwgt = 0.000 Density (Low, Avg., High) = 1.170E-05 1.299E-05 1.443E-05 kg/m**3 Departure, COSPAR NH Mean = -30.3 % -22.7 % -14.1 % iupdate = 1 Tot.Dens. = 1.228E-05 kg/m**3 Dens.Pert. = -5.46% Wave = 0.00% of mean Eastward Wind (Mean,Perturbed,Total) = -29.4 7.5 -21.9 m/s VertWind Northward Wind(Mean,Perturbed,Total) = -23.0 -9.5 -32.6 m/s -2.1 m/s CO2=1.714E+20 N2=5.165E+18 Ar=3.099E+18 O2=2.442E+17 CO=1.878E+17 #/m**3 96.401 1.849 1.583 0.100 0.067 % by mass 95.171 2.868 1.721 0.136 0.104 % by volume H2O=2.476E+14 O=0.000E+00 He=0.000E+00 H2=0.000E+00 Total=1.801E+20 #/m**3 0.000 0.000 0.000 0.000 % by mass MolWgt=43.448 0.000 0.000 0.000 0.000 % volume (mole) fraction ------------------------------------------------------------------------------------------------------------------------------ Time (rel. to T0) = 7500.0 sec. ( 0.084 sols) Ls = 97.0 Dust = 0.30 Height Above MOLA (or Surface) = 70.000 km ( 73.223 km) OWLT = 19.02 Min Topographic Height = -3.223 km Radius (Areoid) = 3461.234 (3391.234) km Hgt Above Ellipsoid = 70.069 km Scale Hgt H(p)= 7.91 H(rho)= 8.18 km Height Offset Parameters: ibougher = 1 Local Height Offset = 0.993 km Planeto-Centric Lat = 29.98 deg Longitude = 55.47 W ( 304.53 E) deg. Planeto-Graphic Lat = 30.27 deg Planeto-Graphic Hgt (Ellps)= 70.068 km Planeto-Cent Sun Lat = 25.02 deg Mars Orbital Radius = 1.649 AU Sun Longitude = 139.10 deg.W Local True Solar Time = 17.58 Mars hrs Temperature = 144.6 K Pressure = 2.166E-01 N/m**2 profwgt = 0.000 Density (Low, Avg., High) = 7.027E-06 7.922E-06 8.931E-06 kg/m**3 Departure, COSPAR NH Mean = -19.5 % -9.3 % 2.3 % iupdate = 1 Tot.Dens. = 7.945E-06 kg/m**3 Dens.Pert. = 0.29% Wave = 0.00% of mean Eastward Wind (Mean,Perturbed,Total) = -48.9 -9.9 -58.8 m/s VertWind Northward Wind(Mean,Perturbed,Total) = -39.0 -6.5 -45.5 m/s -1.5 m/s CO2=1.045E+20 N2=3.148E+18 Ar=1.889E+18 O2=1.488E+17 CO=1.145E+17 #/m**3 96.402 1.849 1.582 0.100 0.067 % by mass 95.173 2.867 1.720 0.136 0.104 % by volume H2O=1.255E+14 O=0.000E+00 He=0.000E+00 H2=0.000E+00 Total=1.098E+20 #/m**3 0.000 0.000 0.000 0.000 % by mass MolWgt=43.448 0.000 0.000 0.000 0.000 % volume (mole) fraction ------------------------------------------------------------------------------------------------------------------------------ Time (rel. to T0) = 8000.0 sec. ( 0.090 sols) Ls = 97.0 Dust = 0.30 Height Above MOLA (or Surface) = 75.000 km ( 77.908 km) OWLT = 19.02 Min Topographic Height = -2.908 km Radius (Areoid) = 3466.114 (3391.114) km Hgt Above Ellipsoid = 75.101 km Scale Hgt H(p)= 6.87 H(rho)= 7.12 km Height Offset Parameters: ibougher = 1 Local Height Offset = 1.481 km Planeto-Centric Lat = 30.48 deg Longitude = 55.97 W ( 304.03 E) deg. Planeto-Graphic Lat = 30.77 deg Planeto-Graphic Hgt (Ellps)= 75.100 km Planeto-Cent Sun Lat = 25.02 deg Mars Orbital Radius = 1.649 AU Sun Longitude = 141.13 deg.W Local True Solar Time = 17.68 Mars hrs Temperature = 141.2 K Pressure = 1.160E-01 N/m**2 profwgt = 0.000 Density (Low, Avg., High) = 3.779E-06 4.334E-06 4.971E-06 kg/m**3 Departure, COSPAR NH Mean = -15.5 % -3.0 % 11.2 % iupdate = 1 Tot.Dens. = 4.403E-06 kg/m**3 Dens.Pert. = 1.59% Wave = 0.00% of mean Eastward Wind (Mean,Perturbed,Total) = -47.9 -10.4 -58.2 m/s VertWind Northward Wind(Mean,Perturbed,Total) = -19.0 -13.1 -32.1 m/s 0.2 m/s CO2=5.718E+19 N2=1.721E+18 Ar=1.033E+18 O2=8.138E+16 CO=6.260E+16 #/m**3 96.404 1.848 1.581 0.100 0.067 % by mass 95.176 2.865 1.719 0.135 0.104 % by volume H2O=4.693E+13 O=0.000E+00 He=0.000E+00 H2=0.000E+00 Total=6.008E+19 #/m**3 0.000 0.000 0.000 0.000 % by mass MolWgt=43.448 0.000 0.000 0.000 0.000 % volume (mole) fraction ------------------------------------------------------------------------------------------------------------------------------ Time (rel. to T0) = 8500.0 sec. ( 0.096 sols) Ls = 97.0 Dust = 0.30 Height Above MOLA (or Surface) = 80.000 km ( 82.699 km) OWLT = 19.02 Min Topographic Height = -2.699 km Radius (Areoid) = 3470.992 (3390.992) km

46
Hgt Above Ellipsoid = 80.133 km Scale Hgt H(p)= 6.87 H(rho)= 7.11 km Height Offset Parameters: ibougher = 1 Local Height Offset = 1.961 km Planeto-Centric Lat = 30.98 deg Longitude = 56.47 W ( 303.53 E) deg. Planeto-Graphic Lat = 31.27 deg Planeto-Graphic Hgt (Ellps)= 80.132 km Planeto-Cent Sun Lat = 25.02 deg Mars Orbital Radius = 1.649 AU Sun Longitude = 143.16 deg.W Local True Solar Time = 17.78 Mars hrs Temperature = 133.8 K Pressure = 5.632E-02 N/m**2 profwgt = 0.000 Density (Low, Avg., High) = 1.843E-06 2.155E-06 2.521E-06 kg/m**3 Departure, COSPAR NH Mean = -19.5 % -5.9 % 10.1 % iupdate = 1 Tot.Dens. = 2.363E-06 kg/m**3 Dens.Pert. = 9.61% Wave = 0.00% of mean Eastward Wind (Mean,Perturbed,Total) = -10.7 3.3 -7.5 m/s VertWind Northward Wind(Mean,Perturbed,Total) = -10.3 -13.9 -24.2 m/s -0.1 m/s CO2=2.843E+19 N2=8.557E+17 Ar=5.134E+17 O2=4.045E+16 CO=3.111E+16 #/m**3 96.406 1.847 1.581 0.100 0.067 % by mass 95.178 2.864 1.718 0.135 0.104 % by volume H2O=4.214E+12 O=0.000E+00 He=0.000E+00 H2=0.000E+00 Total=2.987E+19 #/m**3 0.000 0.000 0.000 0.000 % by mass MolWgt=43.449 0.000 0.000 0.000 0.000 % volume (mole) fraction ------------------------------------------------------------------------------------------------------------------------------ Time (rel. to T0) = 9000.0 sec. ( 0.101 sols) Ls = 97.0 Dust = 0.30 Height Above MOLA (or Surface) = 85.000 km ( 87.133 km) OWLT = 19.02 Min Topographic Height = -2.133 km Radius (Areoid) = 3475.868 (3390.868) km Hgt Above Ellipsoid = 85.164 km Scale Hgt H(p)= 6.18 H(rho)= 6.31 km Height Offset Parameters: ibougher = 1 Local Height Offset = 2.280 km Planeto-Centric Lat = 31.48 deg Longitude = 56.97 W ( 303.03 E) deg. Planeto-Graphic Lat = 31.77 deg Planeto-Graphic Hgt (Ellps)= 85.163 km Planeto-Cent Sun Lat = 25.02 deg Mars Orbital Radius = 1.649 AU Sun Longitude = 145.19 deg.W Local True Solar Time = 17.88 Mars hrs Exospheric Temp. = 186.9 K Tbase = 149.1 K Zbase = 123.1 km Solar Zenith Angle = 75.8 deg F1 peak = 134.1 km Temperature = 128.6 K Pressure = 2.617E-02 N/m**2 profwgt = 0.000 Density (Low, Avg., High) = 8.547E-07 1.022E-06 1.221E-06 kg/m**3 Departure, COSPAR NH Mean = -27.0 % -12.7 % 4.4 % iupdate = 1 Tot.Dens. = 8.968E-07 kg/m**3 Dens.Pert. = -12.23% Wave = 0.00% of mean Eastward Wind (Mean,Perturbed,Total) = 7.9 -13.0 -5.1 m/s VertWind Northward Wind(Mean,Perturbed,Total) = -7.9 -16.0 -23.9 m/s -0.3 m/s CO2=1.313E+19 N2=4.190E+17 Ar=2.510E+17 O2=2.104E+16 CO=3.575E+16 #/m**3 93.902 1.908 1.630 0.109 0.163 % by mass 89.097 2.843 1.704 0.143 0.243 % by volume O=8.797E+17 He=0.000E+00 H2=0.000E+00 H=0.000E+00 Total=1.474E+19 #/m**3 2.287 0.000 0.000 0.000 % by mass MolWgt=41.757 5.970 0.000 0.000 0.000 % volume (mole) fraction ------------------------------------------------------------------------------------------------------------------------------ Time (rel. to T0) = 9500.0 sec. ( 0.107 sols) Ls = 97.0 Dust = 0.30 Height Above MOLA (or Surface) = 90.000 km ( 90.974 km) OWLT = 19.02 Min Topographic Height = -0.974 km Radius (Areoid) = 3480.742 (3390.742) km Hgt Above Ellipsoid = 90.195 km Scale Hgt H(p)= 6.04 H(rho)= 6.19 km Height Offset Parameters: ibougher = 1 Local Height Offset = 2.280 km Planeto-Centric Lat = 31.98 deg Longitude = 57.47 W ( 302.53 E) deg. Planeto-Graphic Lat = 32.28 deg Planeto-Graphic Hgt (Ellps)= 90.194 km Planeto-Cent Sun Lat = 25.02 deg Mars Orbital Radius = 1.649 AU Sun Longitude = 147.22 deg.W Local True Solar Time = 17.98 Mars hrs Exospheric Temp. = 186.4 K Tbase = 148.8 K Zbase = 123.2 km Solar Zenith Angle = 76.9 deg F1 peak = 134.7 km Temperature = 126.3 K Pressure = 1.163E-02 N/m**2 profwgt = 0.000 Density (Low, Avg., High) = 3.765E-07 4.613E-07 5.654E-07 kg/m**3 Departure, COSPAR NH Mean = -37.4 % -23.2 % -5.9 % iupdate = 1 Tot.Dens. = 4.314E-07 kg/m**3 Dens.Pert. = -6.48% Wave = 0.00% of mean Eastward Wind (Mean,Perturbed,Total) = 8.6 4.9 13.5 m/s VertWind Northward Wind(Mean,Perturbed,Total) = -12.5 -12.2 -24.7 m/s 0.3 m/s
47
CO2=5.917E+18 N2=1.882E+17 Ar=1.126E+17 O2=1.001E+16 CO=2.537E+16 #/m**3 93.730 1.898 1.620 0.115 0.256 % by mass 88.755 2.823 1.689 0.150 0.381 % by volume O=4.135E+17 He=0.000E+00 H2=0.000E+00 H=0.000E+00 Total=6.667E+18 #/m**3 2.381 0.000 0.000 0.000 % by mass MolWgt=41.673 6.202 0.000 0.000 0.000 % volume (mole) fraction ------------------------------------------------------------------------------------------------------------------------------ Time (rel. to T0) = 10000.0 sec. ( 0.113 sols) Ls = 97.0 Dust = 0.30 Height Above MOLA (or Surface) = 95.000 km ( 95.839 km) OWLT = 19.02 Min Topographic Height = -0.839 km Radius (Areoid) = 3485.614 (3390.614) km Hgt Above Ellipsoid = 95.225 km Scale Hgt H(p)= 6.14 H(rho)= 6.11 km Height Offset Parameters: ibougher = 1 Local Height Offset = 2.280 km Planeto-Centric Lat = 32.48 deg Longitude = 57.97 W ( 302.03 E) deg. Planeto-Graphic Lat = 32.78 deg Planeto-Graphic Hgt (Ellps)= 95.224 km Planeto-Cent Sun Lat = 25.02 deg Mars Orbital Radius = 1.649 AU Sun Longitude = 149.24 deg.W Local True Solar Time = 18.08 Mars hrs Exospheric Temp. = 185.9 K Tbase = 148.6 K Zbase = 123.3 km Solar Zenith Angle = 77.9 deg F1 peak = 135.3 km Temperature = 125.7 K Pressure = 5.170E-03 N/m**2 profwgt = 0.000 Density (Low, Avg., High) = 1.636E-07 2.061E-07 2.597E-07 kg/m**3 Departure, COSPAR NH Mean = -47.1 % -33.3 % -16.0 % iupdate = 1 Tot.Dens. = 2.028E-07 kg/m**3 Dens.Pert. = -1.62% Wave = 0.00% of mean Eastward Wind (Mean,Perturbed,Total) = 6.7 -1.0 5.7 m/s VertWind Northward Wind(Mean,Perturbed,Total) = -19.0 -3.5 -22.5 m/s 0.0 m/s CO2=2.641E+18 N2=8.355E+16 Ar=4.992E+16 O2=4.696E+15 CO=1.543E+16 #/m**3 93.638 1.886 1.607 0.121 0.348 % by mass 88.602 2.803 1.675 0.158 0.518 % by volume O=1.861E+17 He=0.000E+00 H2=0.000E+00 H=0.000E+00 Total=2.980E+18 #/m**3 2.399 0.000 0.000 0.000 % by mass MolWgt=41.642 6.245 0.000 0.000 0.000 % volume (mole) fraction ------------------------------------------------------------------------------------------------------------------------------ Time (rel. to T0) = 10500.0 sec. ( 0.118 sols) Ls = 97.0 Dust = 0.30 Height Above MOLA (or Surface) = 100.000 km ( 100.979 km) OWLT = 19.02 Min Topographic Height = -0.979 km Radius (Areoid) = 3490.485 (3390.485) km Hgt Above Ellipsoid = 100.255 km Scale Hgt H(p)= 6.10 H(rho)= 6.17 km Height Offset Parameters: ibougher = 1 Local Height Offset = 2.280 km Planeto-Centric Lat = 32.98 deg Longitude = 58.47 W ( 301.53 E) deg. Planeto-Graphic Lat = 33.28 deg Planeto-Graphic Hgt (Ellps)= 100.253 km Planeto-Cent Sun Lat = 25.02 deg Mars Orbital Radius = 1.649 AU Sun Longitude = 151.27 deg.W Local True Solar Time = 18.19 Mars hrs Exospheric Temp. = 185.3 K Tbase = 148.3 K Zbase = 123.4 km Solar Zenith Angle = 78.9 deg F1 peak = 136.0 km Temperature = 126.1 K Pressure = 2.316E-03 N/m**2 profwgt = 0.000 Density (Low, Avg., High) = 7.110E-08 9.243E-08 1.202E-07 kg/m**3 Departure, COSPAR NH Mean = -55.3 % -41.9 % -24.4 % iupdate = 1 Tot.Dens. = 6.524E-08 kg/m**3 Dens.Pert. = -29.42% Wave = 0.00% of mean Eastward Wind (Mean,Perturbed,Total) = 1.9 1.5 3.4 m/s VertWind Northward Wind(Mean,Perturbed,Total) = -26.4 1.5 -24.9 m/s 2.4 m/s CO2=1.188E+18 N2=3.703E+16 Ar=2.210E+16 O2=2.194E+15 CO=8.707E+15 #/m**3 93.892 1.864 1.586 0.126 0.438 % by mass 89.262 2.784 1.661 0.165 0.654 % by volume O=7.283E+16 He=0.000E+00 H2=0.000E+00 H=0.000E+00 Total=1.330E+18 #/m**3 2.093 0.000 0.000 0.000 % by mass MolWgt=41.839 5.474 0.000 0.000 0.000 % volume (mole) fraction ------------------------------------------------------------------------------------------------------------------------------ Time (rel. to T0) = 11000.0 sec. ( 0.124 sols) Ls = 97.0 Dust = 0.30 Height Above MOLA (or Surface) = 105.000 km ( 106.163 km) OWLT = 19.02 Min Topographic Height = -1.163 km Radius (Areoid) = 3495.353 (3390.353) km Hgt Above Ellipsoid = 105.284 km Scale Hgt H(p)= 6.61 H(rho)= 6.41 km Height Offset Parameters: ibougher = 1 Local Height Offset = 2.280 km
48
Planeto-Centric Lat = 33.48 deg Longitude = 58.97 W ( 301.03 E) deg. Planeto-Graphic Lat = 33.78 deg Planeto-Graphic Hgt (Ellps)= 105.282 km Planeto-Cent Sun Lat = 25.02 deg Mars Orbital Radius = 1.649 AU Sun Longitude = 153.30 deg.W Local True Solar Time = 18.29 Mars hrs Exospheric Temp. = 184.8 K Tbase = 148.0 K Zbase = 123.5 km Solar Zenith Angle = 79.8 deg F1 peak = 136.7 km Temperature = 127.2 K Pressure = 1.072E-03 N/m**2 profwgt = 0.000 Density (Low, Avg., High) = 3.196E-08 4.235E-08 5.612E-08 kg/m**3 Departure, COSPAR NH Mean = -60.1 % -47.1 % -29.9 % iupdate = 1 Tot.Dens. = 2.125E-08 kg/m**3 Dens.Pert. = -49.83% Wave = 0.00% of mean Eastward Wind (Mean,Perturbed,Total) = -5.4 -3.1 -8.5 m/s VertWind Northward Wind(Mean,Perturbed,Total) = -32.9 15.8 -17.0 m/s 1.4 m/s CO2=5.435E+17 N2=1.687E+16 Ar=1.005E+16 O2=1.051E+15 CO=4.824E+15 #/m**3 93.787 1.853 1.575 0.132 0.530 % by mass 89.077 2.765 1.647 0.172 0.791 % by volume O=3.386E+16 He=0.000E+00 H2=0.000E+00 H=0.000E+00 Total=6.102E+17 #/m**3 2.124 0.000 0.000 0.000 % by mass MolWgt=41.799 5.548 0.000 0.000 0.000 % volume (mole) fraction ------------------------------------------------------------------------------------------------------------------------------ Time (rel. to T0) = 11500.0 sec. ( 0.130 sols) Ls = 97.0 Dust = 0.30 Height Above MOLA (or Surface) = 110.000 km ( 111.266 km) OWLT = 19.02 Min Topographic Height = -1.266 km Radius (Areoid) = 3500.219 (3390.219) km Hgt Above Ellipsoid = 110.312 km Scale Hgt H(p)= 6.48 H(rho)= 6.43 km Height Offset Parameters: ibougher = 1 Local Height Offset = 2.280 km Planeto-Centric Lat = 33.98 deg Longitude = 59.47 W ( 300.53 E) deg. Planeto-Graphic Lat = 34.28 deg Planeto-Graphic Hgt (Ellps)= 110.310 km Planeto-Cent Sun Lat = 25.02 deg Mars Orbital Radius = 1.649 AU Sun Longitude = 155.33 deg.W Local True Solar Time = 18.39 Mars hrs Exospheric Temp. = 184.3 K Tbase = 147.8 K Zbase = 123.6 km Solar Zenith Angle = 80.8 deg F1 peak = 137.5 km Temperature = 129.4 K Pressure = 5.056E-04 N/m**2 profwgt = 0.000 Density (Low, Avg., High) = 1.459E-08 1.970E-08 2.660E-08 kg/m**3 Departure, COSPAR NH Mean = -64.8 % -52.4 % -35.8 % iupdate = 1 Tot.Dens. = 1.592E-08 kg/m**3 Dens.Pert. = -19.19% Wave = 0.00% of mean Eastward Wind (Mean,Perturbed,Total) = -13.7 -8.5 -22.2 m/s VertWind Northward Wind(Mean,Perturbed,Total) = -36.3 7.7 -28.6 m/s 0.4 m/s CO2=2.532E+17 N2=7.770E+15 Ar=4.623E+15 O2=5.081E+14 CO=2.621E+15 #/m**3 93.931 1.835 1.557 0.137 0.619 % by mass 89.481 2.746 1.634 0.180 0.926 % by volume O=1.424E+16 He=0.000E+00 H2=0.000E+00 H=0.000E+00 Total=2.830E+17 #/m**3 1.921 0.000 0.000 0.000 % by mass MolWgt=41.924 5.034 0.000 0.000 0.000 % volume (mole) fraction ------------------------------------------------------------------------------------------------------------------------------ Time (rel. to T0) = 12000.0 sec. ( 0.135 sols) Ls = 97.0 Dust = 0.30 Height Above MOLA (or Surface) = 115.000 km ( 116.271 km) OWLT = 19.02 Min Topographic Height = -1.271 km Radius (Areoid) = 3505.084 (3390.084) km Hgt Above Ellipsoid = 115.339 km Scale Hgt H(p)= 6.94 H(rho)= 6.41 km Height Offset Parameters: ibougher = 1 Local Height Offset = 2.280 km Planeto-Centric Lat = 34.48 deg Longitude = 59.97 W ( 300.03 E) deg. Planeto-Graphic Lat = 34.79 deg Planeto-Graphic Hgt (Ellps)= 115.338 km Planeto-Cent Sun Lat = 25.02 deg Mars Orbital Radius = 1.649 AU Sun Longitude = 157.35 deg.W Local True Solar Time = 18.49 Mars hrs Exospheric Temp. = 183.7 K Tbase = 147.5 K Zbase = 123.7 km Solar Zenith Angle = 81.8 deg F1 peak = 138.2 km Temperature = 133.9 K Pressure = 2.434E-04 N/m**2 profwgt = 0.000 Density (Low, Avg., High) = 6.659E-09 9.156E-09 1.259E-08 kg/m**3 Departure, COSPAR NH Mean = -69.7 % -58.4 % -42.8 % iupdate = 1 Tot.Dens. = 8.091E-09 kg/m**3 Dens.Pert. = -11.64% Wave = 0.00% of mean Eastward Wind (Mean,Perturbed,Total) = -22.0 -4.4 -26.5 m/s VertWind Northward Wind(Mean,Perturbed,Total) = -36.9 -6.4 -43.3 m/s 0.4 m/s

49
CO2=1.176E+17 N2=3.591E+15 Ar=2.133E+15 O2=2.460E+14 CO=1.397E+15 #/m**3 93.823 1.825 1.546 0.143 0.710 % by mass 89.289 2.727 1.620 0.187 1.061 % by volume O=6.734E+15 He=0.000E+00 H2=0.000E+00 H=0.000E+00 Total=1.317E+17 #/m**3 1.954 0.000 0.000 0.000 % by mass MolWgt=41.882 5.115 0.000 0.000 0.000 % volume (mole) fraction ------------------------------------------------------------------------------------------------------------------------------ Time (rel. to T0) = 12500.0 sec. ( 0.141 sols) Ls = 97.0 Dust = 0.30 Height Above MOLA (or Surface) = 120.000 km ( 121.331 km) OWLT = 19.02 Min Topographic Height = -1.331 km Radius (Areoid) = 3509.947 (3389.947) km Hgt Above Ellipsoid = 120.366 km Scale Hgt H(p)= 7.21 H(rho)= 6.65 km Height Offset Parameters: ibougher = 1 Local Height Offset = 2.280 km Planeto-Centric Lat = 34.98 deg Longitude = 60.47 W ( 299.53 E) deg. Planeto-Graphic Lat = 35.29 deg Planeto-Graphic Hgt (Ellps)= 120.364 km Planeto-Cent Sun Lat = 25.02 deg Mars Orbital Radius = 1.649 AU Sun Longitude = 159.38 deg.W Local True Solar Time = 18.59 Mars hrs Exospheric Temp. = 183.2 K Tbase = 147.2 K Zbase = 123.7 km Solar Zenith Angle = 82.7 deg F1 peak = 139.1 km Temperature = 140.8 K Pressure = 1.213E-04 N/m**2 profwgt = 0.000 Density (Low, Avg., High) = 3.078E-09 4.309E-09 6.033E-09 kg/m**3 Departure, COSPAR NH Mean = -74.1 % -63.8 % -49.3 % iupdate = 1 Tot.Dens. = 8.499E-09 kg/m**3 Dens.Pert. = 97.23% Wave = 0.00% of mean Eastward Wind (Mean,Perturbed,Total) = -27.9 2.7 -25.2 m/s VertWind Northward Wind(Mean,Perturbed,Total) = -35.7 -17.8 -53.5 m/s -1.5 m/s CO2=5.504E+16 N2=1.690E+15 Ar=1.003E+15 O2=1.211E+14 CO=7.461E+14 #/m**3 93.343 1.825 1.544 0.149 0.805 % by mass 88.228 2.709 1.607 0.194 1.196 % by volume O=3.784E+15 He=0.000E+00 H2=0.000E+00 H=0.000E+00 Total=6.239E+16 #/m**3 2.333 0.000 0.000 0.000 % by mass MolWgt=41.597 6.066 0.000 0.000 0.000 % volume (mole) fraction ------------------------------------------------------------------------------------------------------------------------------ Time (rel. to T0) = 13000.0 sec. ( 0.146 sols) Ls = 97.0 Dust = 0.30 Height Above MOLA (or Surface) = 125.000 km ( 126.297 km) OWLT = 19.02 Min Topographic Height = -1.297 km Radius (Areoid) = 3514.808 (3389.808) km Hgt Above Ellipsoid = 125.392 km Scale Hgt H(p)= 7.62 H(rho)= 7.00 km Height Offset Parameters: ibougher = 1 Local Height Offset = 2.280 km Planeto-Centric Lat = 35.48 deg Longitude = 60.97 W ( 299.03 E) deg. Planeto-Graphic Lat = 35.79 deg Planeto-Graphic Hgt (Ellps)= 125.390 km Planeto-Cent Sun Lat = 25.02 deg Mars Orbital Radius = 1.649 AU Sun Longitude = 161.41 deg.W Local True Solar Time = 18.70 Mars hrs Exospheric Temp. = 182.7 K Tbase = 146.9 K Zbase = 123.8 km Solar Zenith Angle = 83.6 deg F1 peak = 140.0 km Temperature = 149.0 K Pressure = 6.236E-05 N/m**2 profwgt = 0.000 Density (Low, Avg., High) = 1.468E-09 2.091E-09 2.980E-09 kg/m**3 Departure, COSPAR NH Mean = -77.9 % -68.5 % -55.1 % iupdate = 1 Tot.Dens. = 3.509E-09 kg/m**3 Dens.Pert. = 67.79% Wave = 0.00% of mean Eastward Wind (Mean,Perturbed,Total) = -30.2 2.7 -27.4 m/s VertWind Northward Wind(Mean,Perturbed,Total) = -35.8 -21.3 -57.1 m/s -2.4 m/s CO2=2.665E+16 N2=8.580E+14 Ar=4.889E+14 O2=6.273E+13 CO=4.131E+14 #/m**3 93.136 1.909 1.551 0.159 0.919 % by mass 87.940 2.831 1.613 0.207 1.363 % by volume O=1.830E+15 He=1.645E+12 H2=6.592E+10 H=1.925E+11 Total=3.031E+16 #/m**3 2.325 0.001 0.000 0.000 % by mass MolWgt=41.554 6.039 0.005 0.000 0.001 % volume (mole) fraction ------------------------------------------------------------------------------------------------------------------------------ Time (rel. to T0) = 13500.0 sec. ( 0.152 sols) Ls = 97.0 Dust = 0.30 Height Above MOLA (or Surface) = 130.000 km ( 131.276 km) OWLT = 19.02 Min Topographic Height = -1.276 km Radius (Areoid) = 3519.668 (3389.668) km Hgt Above Ellipsoid = 130.418 km Scale Hgt H(p)= 8.18 H(rho)= 7.42 km Height Offset Parameters: ibougher = 1 Local Height Offset = 2.280 km
50
Planeto-Centric Lat = 35.98 deg Longitude = 61.47 W ( 298.53 E) deg. Planeto-Graphic Lat = 36.29 deg Planeto-Graphic Hgt (Ellps)= 130.416 km Planeto-Cent Sun Lat = 25.02 deg Mars Orbital Radius = 1.649 AU Sun Longitude = 163.44 deg.W Local True Solar Time = 18.80 Mars hrs Exospheric Temp. = 182.2 K Tbase = 146.7 K Zbase = 123.9 km Solar Zenith Angle = 84.5 deg F1 peak = 141.0 km Temperature = 157.1 K Pressure = 3.331E-05 N/m**2 profwgt = 0.000 Density (Low, Avg., High) = 7.256E-10 1.052E-09 1.526E-09 kg/m**3 Departure, COSPAR NH Mean = -80.7 % -72.0 % -59.4 % iupdate = 1 Tot.Dens. = 2.051E-09 kg/m**3 Dens.Pert. = 94.97% Wave = 0.00% of mean Eastward Wind (Mean,Perturbed,Total) = -29.5 31.2 1.7 m/s VertWind Northward Wind(Mean,Perturbed,Total) = -38.0 -18.7 -56.7 m/s -1.5 m/s CO2=1.327E+16 N2=5.269E+14 Ar=2.569E+14 O2=3.657E+13 CO=2.537E+14 #/m**3 92.205 2.330 1.620 0.185 1.122 % by mass 86.451 3.431 1.673 0.238 1.652 % by volume O=1.005E+15 He=1.378E+12 H2=5.683E+10 H=1.689E+11 Total=1.535E+16 #/m**3 2.537 0.001 0.000 0.000 % by mass MolWgt=41.263 6.543 0.009 0.000 0.001 % volume (mole) fraction ------------------------------------------------------------------------------------------------------------------------------ Time (rel. to T0) = 14000.0 sec. ( 0.158 sols) Ls = 97.0 Dust = 0.30 Height Above MOLA (or Surface) = 135.000 km ( 136.272 km) OWLT = 19.02 Min Topographic Height = -1.272 km Radius (Areoid) = 3524.526 (3389.526) km Hgt Above Ellipsoid = 135.443 km Scale Hgt H(p)= 8.69 H(rho)= 8.00 km Height Offset Parameters: ibougher = 1 Local Height Offset = 2.280 km Planeto-Centric Lat = 36.48 deg Longitude = 61.97 W ( 298.03 E) deg. Planeto-Graphic Lat = 36.79 deg Planeto-Graphic Hgt (Ellps)= 135.440 km Planeto-Cent Sun Lat = 25.01 deg Mars Orbital Radius = 1.649 AU Sun Longitude = 165.46 deg.W Local True Solar Time = 18.90 Mars hrs Exospheric Temp. = 181.7 K Tbase = 146.4 K Zbase = 124.0 km Solar Zenith Angle = 85.3 deg F1 peak = 142.1 km Temperature = 163.9 K Pressure = 1.843E-05 N/m**2 profwgt = 0.000 Density (Low, Avg., High) = 3.803E-10 5.515E-10 7.996E-10 kg/m**3 Departure, COSPAR NH Mean = -80.1 % -71.2 % -58.2 % iupdate = 1 Tot.Dens. = 9.922E-10 kg/m**3 Dens.Pert. = 79.92% Wave = 0.00% of mean Eastward Wind (Mean,Perturbed,Total) = -26.7 -1.7 -28.4 m/s VertWind Northward Wind(Mean,Perturbed,Total) = -40.7 -25.3 -66.0 m/s -2.0 m/s CO2=6.861E+15 N2=3.338E+14 Ar=1.405E+14 O2=2.206E+13 CO=1.608E+14 #/m**3 90.923 2.816 1.690 0.213 1.356 % by mass 84.264 4.099 1.725 0.271 1.974 % by volume O=6.229E+14 He=1.171E+12 H2=4.963E+10 H=1.501E+11 Total=8.143E+15 #/m**3 3.001 0.001 0.000 0.000 % by mass MolWgt=40.786 7.650 0.014 0.001 0.002 % volume (mole) fraction ------------------------------------------------------------------------------------------------------------------------------ Time (rel. to T0) = 14500.0 sec. ( 0.163 sols) Ls = 97.0 Dust = 0.30 Height Above MOLA (or Surface) = 140.000 km ( 141.237 km) OWLT = 19.02 Min Topographic Height = -1.237 km Radius (Areoid) = 3529.383 (3389.383) km Hgt Above Ellipsoid = 140.467 km Scale Hgt H(p)= 9.75 H(rho)= 8.91 km Height Offset Parameters: ibougher = 1 Local Height Offset = 2.280 km Planeto-Centric Lat = 36.98 deg Longitude = 62.47 W ( 297.53 E) deg. Planeto-Graphic Lat = 37.29 deg Planeto-Graphic Hgt (Ellps)= 140.465 km Planeto-Cent Sun Lat = 25.01 deg Mars Orbital Radius = 1.649 AU Sun Longitude = 167.49 deg.W Local True Solar Time = 19.00 Mars hrs Exospheric Temp. = 181.2 K Tbase = 146.2 K Zbase = 124.1 km Solar Zenith Angle = 86.2 deg F1 peak = 143.2 km Temperature = 169.0 K Pressure = 1.069E-05 N/m**2 profwgt = 0.000 Density (Low, Avg., High) = 2.104E-10 3.051E-10 4.423E-10 kg/m**3 Departure, COSPAR NH Mean = -80.7 % -72.0 % -59.4 % iupdate = 1 Tot.Dens. = 4.091E-10 kg/m**3 Dens.Pert. = 34.10% Wave = 0.00% of mean Eastward Wind (Mean,Perturbed,Total) = -22.8 -6.1 -28.9 m/s VertWind Northward Wind(Mean,Perturbed,Total) = -44.5 -17.2 -61.7 m/s -1.6 m/s

51
CO2=3.722E+15 N2=2.222E+14 Ar=8.106E+13 O2=1.400E+13 CO=1.070E+14 #/m**3 89.174 3.389 1.763 0.244 1.632 % by mass 81.209 4.847 1.768 0.305 2.335 % by volume O=4.358E+14 He=1.036E+12 H2=4.507E+10 H=1.386E+11 Total=4.584E+15 #/m**3 3.796 0.002 0.000 0.000 % by mass MolWgt=40.078 9.508 0.023 0.001 0.003 % volume (mole) fraction ------------------------------------------------------------------------------------------------------------------------------ Time (rel. to T0) = 15000.0 sec. ( 0.169 sols) Ls = 97.0 Dust = 0.30 Height Above MOLA (or Surface) = 145.000 km ( 146.335 km) OWLT = 19.02 Min Topographic Height = -1.335 km Radius (Areoid) = 3534.239 (3389.239) km Hgt Above Ellipsoid = 145.492 km Scale Hgt H(p)= 10.14 H(rho)= 9.20 km Height Offset Parameters: ibougher = 1 Local Height Offset = 2.280 km Planeto-Centric Lat = 37.48 deg Longitude = 62.97 W ( 297.03 E) deg. Planeto-Graphic Lat = 37.79 deg Planeto-Graphic Hgt (Ellps)= 145.490 km Planeto-Cent Sun Lat = 25.01 deg Mars Orbital Radius = 1.649 AU Sun Longitude = 169.52 deg.W Local True Solar Time = 19.10 Mars hrs Exospheric Temp. = 180.7 K Tbase = 145.9 K Zbase = 124.1 km Solar Zenith Angle = 87.0 deg F1 peak = 144.5 km Temperature = 172.7 K Pressure = 6.444E-06 N/m**2 profwgt = 0.000 Density (Low, Avg., High) = 1.208E-10 1.752E-10 2.540E-10 kg/m**3 Departure, COSPAR NH Mean = -82.9 % -75.2 % -64.0 % iupdate = 1 Tot.Dens. = 2.445E-10 kg/m**3 Dens.Pert. = 39.54% Wave = 0.00% of mean Eastward Wind (Mean,Perturbed,Total) = -19.2 -7.0 -26.2 m/s VertWind Northward Wind(Mean,Perturbed,Total) = -49.3 -5.6 -54.9 m/s -0.6 m/s CO2=2.079E+15 N2=1.535E+14 Ar=4.868E+13 O2=9.234E+12 CO=7.396E+13 #/m**3 86.732 4.077 1.844 0.280 1.963 % by mass 76.952 5.682 1.802 0.342 2.737 % by volume O=3.362E+14 He=9.462E+11 H2=4.226E+10 H=1.320E+11 Total=2.702E+15 #/m**3 5.099 0.004 0.000 0.000 % by mass MolWgt=39.046 12.444 0.035 0.002 0.005 % volume (mole) fraction ------------------------------------------------------------------------------------------------------------------------------ Time (rel. to T0) = 15500.0 sec. ( 0.175 sols) Ls = 97.1 Dust = 0.30 Height Above MOLA (or Surface) = 150.000 km ( 151.272 km) OWLT = 19.02 Min Topographic Height = -1.272 km Radius (Areoid) = 3539.095 (3389.095) km Hgt Above Ellipsoid = 150.517 km Scale Hgt H(p)= 10.31 H(rho)= 9.58 km Height Offset Parameters: ibougher = 1 Local Height Offset = 2.280 km Planeto-Centric Lat = 37.98 deg Longitude = 63.47 W ( 296.53 E) deg. Planeto-Graphic Lat = 38.29 deg Planeto-Graphic Hgt (Ellps)= 150.514 km Planeto-Cent Sun Lat = 25.01 deg Mars Orbital Radius = 1.649 AU Sun Longitude = 171.55 deg.W Local True Solar Time = 19.21 Mars hrs Exospheric Temp. = 180.1 K Tbase = 145.7 K Zbase = 124.2 km Solar Zenith Angle = 87.8 deg F1 peak = 146.0 km Temperature = 175.0 K Pressure = 3.962E-06 N/m**2 profwgt = 0.000 Density (Low, Avg., High) = 7.125E-11 1.033E-10 1.498E-10 kg/m**3 Departure, COSPAR NH Mean = -84.9 % -78.2 % -68.3 % iupdate = 1 Tot.Dens. = 1.792E-10 kg/m**3 Dens.Pert. = 73.48% Wave = 0.00% of mean Eastward Wind (Mean,Perturbed,Total) = -15.5 -8.1 -23.6 m/s VertWind Northward Wind(Mean,Perturbed,Total) = -53.6 -14.6 -68.2 m/s 2.9 m/s CO2=1.187E+15 N2=1.083E+14 Ar=2.989E+13 O2=6.219E+12 CO=5.218E+13 #/m**3 83.980 4.878 1.920 0.320 2.349 % by mass 72.413 6.607 1.823 0.379 3.183 % by volume O=2.546E+14 He=8.800E+11 H2=4.035E+10 H=1.282E+11 Total=1.640E+15 #/m**3 6.548 0.006 0.000 0.000 % by mass MolWgt=37.948 15.531 0.054 0.002 0.008 % volume (mole) fraction ------------------------------------------------------------------------------------------------------------------------------ Time (rel. to T0) = 16000.0 sec. ( 0.180 sols) Ls = 97.1 Dust = 0.30 Height Above MOLA (or Surface) = 155.000 km ( 156.136 km) OWLT = 19.02 Min Topographic Height = -1.136 km Radius (Areoid) = 3543.950 (3388.950) km Hgt Above Ellipsoid = 155.542 km Scale Hgt H(p)= 10.81 H(rho)= 9.89 km Height Offset Parameters: ibougher = 1 Local Height Offset = 2.280 km

52
Planeto-Centric Lat = 38.48 deg Longitude = 63.97 W ( 296.03 E) deg. Planeto-Graphic Lat = 38.80 deg Planeto-Graphic Hgt (Ellps)= 155.540 km Planeto-Cent Sun Lat = 25.01 deg Mars Orbital Radius = 1.649 AU Sun Longitude = 173.58 deg.W Local True Solar Time = 19.31 Mars hrs Exospheric Temp. = 179.5 K Tbase = 145.4 K Zbase = 124.3 km Solar Zenith Angle = 88.6 deg F1 peak = 147.6 km Temperature = 176.2 K Pressure = 2.474E-06 N/m**2 profwgt = 0.000 Density (Low, Avg., High) = 4.275E-11 6.198E-11 8.987E-11 kg/m**3 Departure, COSPAR NH Mean = -87.3 % -81.6 % -73.3 % iupdate = 1 Tot.Dens. = 1.247E-10 kg/m**3 Dens.Pert. = 101.12% Wave = 0.00% of mean Eastward Wind (Mean,Perturbed,Total) = -11.7 -9.2 -20.9 m/s VertWind Northward Wind(Mean,Perturbed,Total) = -57.6 -18.4 -75.9 m/s 3.1 m/s CO2=6.844E+14 N2=7.744E+13 Ar=1.861E+13 O2=4.246E+12 CO=3.731E+13 #/m**3 80.695 5.813 1.992 0.364 2.799 % by mass 67.278 7.612 1.829 0.417 3.667 % by volume O=1.943E+14 He=8.284E+11 H2=3.899E+10 H=1.259E+11 Total=1.017E+15 #/m**3 8.328 0.009 0.000 0.000 % by mass MolWgt=36.692 19.099 0.081 0.004 0.012 % volume (mole) fraction ------------------------------------------------------------------------------------------------------------------------------ Time (rel. to T0) = 16500.0 sec. ( 0.186 sols) Ls = 97.1 Dust = 0.30 Height Above MOLA (or Surface) = 160.000 km ( 160.950 km) OWLT = 19.02 Min Topographic Height = -0.950 km Radius (Areoid) = 3548.806 (3388.806) km Hgt Above Ellipsoid = 160.568 km Scale Hgt H(p)= 11.25 H(rho)= 10.06 km Height Offset Parameters: ibougher = 1 Local Height Offset = 2.280 km Planeto-Centric Lat = 38.98 deg Longitude = 64.47 W ( 295.53 E) deg. Planeto-Graphic Lat = 39.30 deg Planeto-Graphic Hgt (Ellps)= 160.566 km Planeto-Cent Sun Lat = 25.01 deg Mars Orbital Radius = 1.649 AU Sun Longitude = 175.60 deg.W Local True Solar Time = 19.41 Mars hrs Exospheric Temp. = 179.0 K Tbase = 145.2 K Zbase = 124.3 km Solar Zenith Angle = 89.3 deg F1 peak = 149.3 km Temperature = 176.7 K Pressure = 1.577E-06 N/m**2 profwgt = 0.000 Density (Low, Avg., High) = 2.591E-11 3.757E-11 5.447E-11 kg/m**3 Departure, COSPAR NH Mean = -89.3 % -84.5 % -77.6 % iupdate = 1 Tot.Dens. = 6.128E-11 kg/m**3 Dens.Pert. = 63.11% Wave = 0.00% of mean Eastward Wind (Mean,Perturbed,Total) = -8.5 6.0 -2.5 m/s VertWind Northward Wind(Mean,Perturbed,Total) = -61.5 -36.3 -97.8 m/s -6.1 m/s CO2=3.917E+14 N2=5.610E+13 Ar=1.174E+13 O2=2.937E+12 CO=2.703E+13 #/m**3 76.187 6.947 2.073 0.415 3.346 % by mass 60.610 8.681 1.817 0.455 4.182 % by volume O=1.558E+14 He=7.899E+11 H2=3.815E+10 H=1.253E+11 Total=6.462E+14 #/m**3 11.017 0.014 0.000 0.001 % by mass MolWgt=35.011 24.108 0.122 0.006 0.019 % volume (mole) fraction ------------------------------------------------------------------------------------------------------------------------------ Time (rel. to T0) = 17000.0 sec. ( 0.191 sols) Ls = 97.1 Dust = 0.30 Height Above MOLA (or Surface) = 165.000 km ( 165.854 km) OWLT = 19.02 Min Topographic Height = -0.854 km Radius (Areoid) = 3553.661 (3388.661) km Hgt Above Ellipsoid = 165.595 km Scale Hgt H(p)= 11.63 H(rho)= 10.40 km Height Offset Parameters: ibougher = 1 Local Height Offset = 2.280 km Planeto-Centric Lat = 39.48 deg Longitude = 64.97 W ( 295.03 E) deg. Planeto-Graphic Lat = 39.80 deg Planeto-Graphic Hgt (Ellps)= 165.592 km Planeto-Cent Sun Lat = 25.01 deg Mars Orbital Radius = 1.649 AU Sun Longitude = 177.63 deg.W Local True Solar Time = 19.51 Mars hrs Exospheric Temp. = 178.5 K Tbase = 144.9 K Zbase = 124.4 km Solar Zenith Angle = 90.0 deg F1 peak = 999.9 km Temperature = 177.0 K Pressure = 1.020E-06 N/m**2 profwgt = 0.000 Density (Low, Avg., High) = 1.590E-11 2.305E-11 3.342E-11 kg/m**3 Departure, COSPAR NH Mean = -91.2 % -87.2 % -81.5 % iupdate = 1 Tot.Dens. = 3.656E-11 kg/m**3 Dens.Pert. = 58.62% Wave = 0.00% of mean Eastward Wind (Mean,Perturbed,Total) = -6.1 0.7 -5.4 m/s VertWind

53
Northward Wind(Mean,Perturbed,Total) = -65.4 -14.4 -79.8 m/s -4.3 m/s CO2=2.240E+14 N2=4.084E+13 Ar=7.443E+12 O2=2.042E+12 CO=1.968E+13 #/m**3 71.020 8.243 2.143 0.471 3.971 % by mass 53.651 9.781 1.783 0.489 4.713 % by volume O=1.226E+14 He=7.571E+11 H2=3.753E+10 H=1.252E+11 Total=4.175E+14 #/m**3 14.130 0.022 0.001 0.001 % by mass MolWgt=33.246 29.363 0.181 0.009 0.030 % volume (mole) fraction ------------------------------------------------------------------------------------------------------------------------------ Time (rel. to T0) = 17500.0 sec. ( 0.197 sols) Ls = 97.1 Dust = 0.30 Height Above MOLA (or Surface) = 170.000 km ( 170.917 km) OWLT = 19.02 Min Topographic Height = -0.917 km Radius (Areoid) = 3558.517 (3388.517) km Hgt Above Ellipsoid = 170.623 km Scale Hgt H(p)= 12.23 H(rho)= 10.72 km Height Offset Parameters: ibougher = 1 Local Height Offset = 2.280 km Planeto-Centric Lat = 39.98 deg Longitude = 65.47 W ( 294.53 E) deg. Planeto-Graphic Lat = 40.30 deg Planeto-Graphic Hgt (Ellps)= 170.620 km Planeto-Cent Sun Lat = 25.01 deg Mars Orbital Radius = 1.648 AU Sun Longitude = 179.66 deg.W Local True Solar Time = 19.61 Mars hrs Exospheric Temp. = 177.9 K Tbase = 144.7 K Zbase = 124.4 km Solar Zenith Angle = 90.7 deg F1 peak = 999.9 km Temperature = 177.1 K Pressure = 6.716E-07 N/m**2 profwgt = 0.000 Density (Low, Avg., High) = 9.886E-12 1.434E-11 2.079E-11 kg/m**3 Departure, COSPAR NH Mean = -92.7 % -89.4 % -84.6 % iupdate = 1 Tot.Dens. = 1.551E-11 kg/m**3 Dens.Pert. = 8.21% Wave = 0.00% of mean Eastward Wind (Mean,Perturbed,Total) = -3.9 9.6 5.7 m/s VertWind Northward Wind(Mean,Perturbed,Total) = -69.0 -41.7 -110.7 m/s 0.9 m/s CO2=1.279E+14 N2=2.985E+13 Ar=4.737E+12 O2=1.425E+12 CO=1.438E+13 #/m**3 65.184 9.688 2.193 0.528 4.667 % by mass 46.551 10.867 1.724 0.519 5.237 % by volume O=9.553E+13 He=7.288E+11 H2=3.708E+10 H=1.258E+11 Total=2.747E+14 #/m**3 17.704 0.034 0.001 0.001 % by mass MolWgt=31.429 34.778 0.265 0.013 0.046 % volume (mole) fraction ------------------------------------------------------------------------------------------------------------------------------ Time (rel. to T0) = 18000.0 sec. ( 0.203 sols) Ls = 97.1 Dust = 0.30 Height Above MOLA (or Surface) = 175.000 km ( 175.556 km) OWLT = 19.02 Min Topographic Height = -0.556 km Radius (Areoid) = 3563.373 (3388.373) km Hgt Above Ellipsoid = 175.651 km Scale Hgt H(p)= 12.56 H(rho)= 11.25 km Height Offset Parameters: ibougher = 1 Local Height Offset = 2.280 km Planeto-Centric Lat = 40.48 deg Longitude = 65.97 W ( 294.03 E) deg. Planeto-Graphic Lat = 40.80 deg Planeto-Graphic Hgt (Ellps)= 175.648 km Planeto-Cent Sun Lat = 25.01 deg Mars Orbital Radius = 1.648 AU Sun Longitude = 181.69 deg.W Local True Solar Time = 19.71 Mars hrs Exospheric Temp. = 177.4 K Tbase = 144.5 K Zbase = 124.5 km Solar Zenith Angle = 91.4 deg F1 peak = 999.9 km Temperature = 177.1 K Pressure = 4.470E-07 N/m**2 profwgt = 0.000 Density (Low, Avg., High) = 6.284E-12 9.113E-12 1.321E-11 kg/m**3 Departure, COSPAR NH Mean = -93.9 % -91.2 % -87.2 % iupdate = 1 Tot.Dens. = 9.602E-12 kg/m**3 Dens.Pert. = 5.37% Wave = 0.00% of mean Eastward Wind (Mean,Perturbed,Total) = -2.6 2.6 0.0 m/s VertWind Northward Wind(Mean,Perturbed,Total) = -71.4 -23.2 -94.6 m/s 2.8 m/s CO2=7.495E+13 N2=2.172E+13 Ar=3.000E+12 O2=9.901E+11 CO=1.047E+13 #/m**3 60.104 11.087 2.184 0.577 5.342 % by mass 40.997 11.879 1.641 0.542 5.725 % by volume O=7.083E+13 He=6.988E+11 H2=3.649E+10 H=1.258E+11 Total=1.828E+14 #/m**3 20.651 0.051 0.001 0.002 % by mass MolWgt=30.018 38.746 0.382 0.020 0.069 % volume (mole) fraction ------------------------------------------------------------------------------------------------------------------------------ Time (rel. to T0) = 18500.0 sec. ( 0.208 sols) Ls = 97.1 Dust = 0.30 Height Above MOLA (or Surface) = 180.000 km ( 180.274 km) OWLT = 19.02 Min Topographic Height = -0.274 km Radius (Areoid) = 3568.229 (3388.229) km Hgt Above Ellipsoid = 180.679 km Scale Hgt H(p)= 13.20 H(rho)= 11.60 km
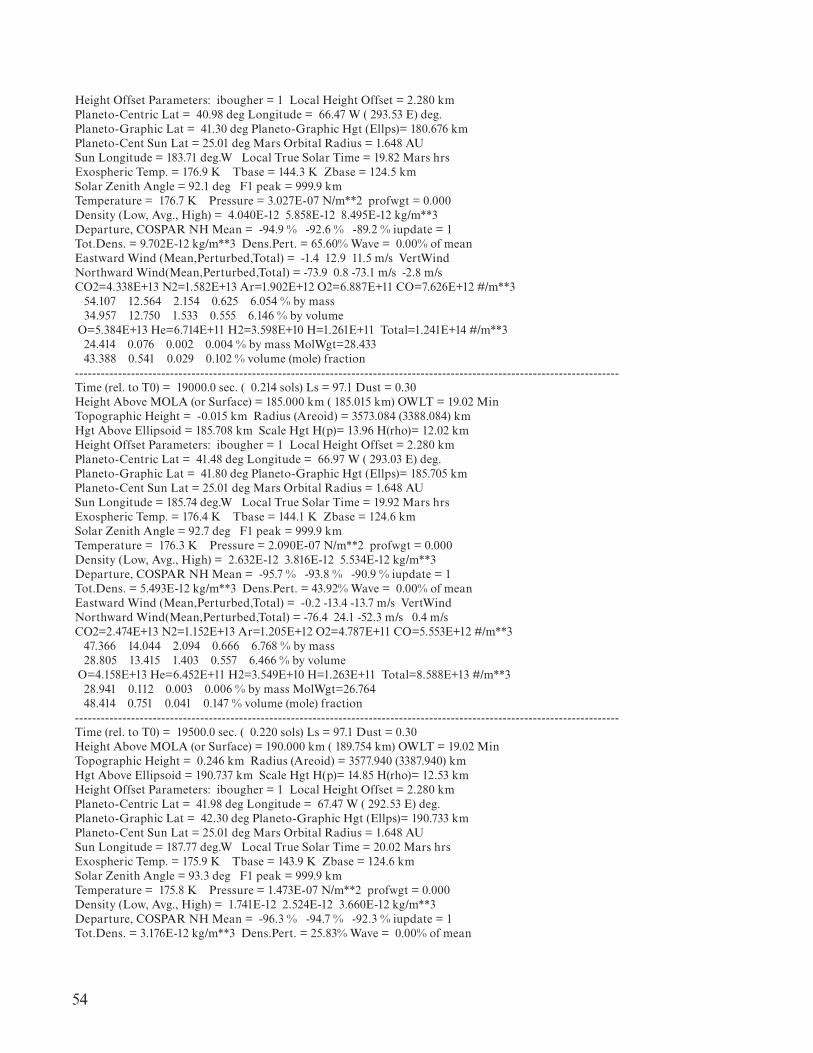
54
Height Offset Parameters: ibougher = 1 Local Height Offset = 2.280 km Planeto-Centric Lat = 40.98 deg Longitude = 66.47 W ( 293.53 E) deg. Planeto-Graphic Lat = 41.30 deg Planeto-Graphic Hgt (Ellps)= 180.676 km Planeto-Cent Sun Lat = 25.01 deg Mars Orbital Radius = 1.648 AU Sun Longitude = 183.71 deg.W Local True Solar Time = 19.82 Mars hrs Exospheric Temp. = 176.9 K Tbase = 144.3 K Zbase = 124.5 km Solar Zenith Angle = 92.1 deg F1 peak = 999.9 km Temperature = 176.7 K Pressure = 3.027E-07 N/m**2 profwgt = 0.000 Density (Low, Avg., High) = 4.040E-12 5.858E-12 8.495E-12 kg/m**3 Departure, COSPAR NH Mean = -94.9 % -92.6 % -89.2 % iupdate = 1 Tot.Dens. = 9.702E-12 kg/m**3 Dens.Pert. = 65.60% Wave = 0.00% of mean Eastward Wind (Mean,Perturbed,Total) = -1.4 12.9 11.5 m/s VertWind Northward Wind(Mean,Perturbed,Total) = -73.9 0.8 -73.1 m/s -2.8 m/s CO2=4.338E+13 N2=1.582E+13 Ar=1.902E+12 O2=6.887E+11 CO=7.626E+12 #/m**3 54.107 12.564 2.154 0.625 6.054 % by mass 34.957 12.750 1.533 0.555 6.146 % by volume O=5.384E+13 He=6.714E+11 H2=3.598E+10 H=1.261E+11 Total=1.241E+14 #/m**3 24.414 0.076 0.002 0.004 % by mass MolWgt=28.433 43.388 0.541 0.029 0.102 % volume (mole) fraction ------------------------------------------------------------------------------------------------------------------------------ Time (rel. to T0) = 19000.0 sec. ( 0.214 sols) Ls = 97.1 Dust = 0.30 Height Above MOLA (or Surface) = 185.000 km ( 185.015 km) OWLT = 19.02 Min Topographic Height = -0.015 km Radius (Areoid) = 3573.084 (3388.084) km Hgt Above Ellipsoid = 185.708 km Scale Hgt H(p)= 13.96 H(rho)= 12.02 km Height Offset Parameters: ibougher = 1 Local Height Offset = 2.280 km Planeto-Centric Lat = 41.48 deg Longitude = 66.97 W ( 293.03 E) deg. Planeto-Graphic Lat = 41.80 deg Planeto-Graphic Hgt (Ellps)= 185.705 km Planeto-Cent Sun Lat = 25.01 deg Mars Orbital Radius = 1.648 AU Sun Longitude = 185.74 deg.W Local True Solar Time = 19.92 Mars hrs Exospheric Temp. = 176.4 K Tbase = 144.1 K Zbase = 124.6 km Solar Zenith Angle = 92.7 deg F1 peak = 999.9 km Temperature = 176.3 K Pressure = 2.090E-07 N/m**2 profwgt = 0.000 Density (Low, Avg., High) = 2.632E-12 3.816E-12 5.534E-12 kg/m**3 Departure, COSPAR NH Mean = -95.7 % -93.8 % -90.9 % iupdate = 1 Tot.Dens. = 5.493E-12 kg/m**3 Dens.Pert. = 43.92% Wave = 0.00% of mean Eastward Wind (Mean,Perturbed,Total) = -0.2 -13.4 -13.7 m/s VertWind Northward Wind(Mean,Perturbed,Total) = -76.4 24.1 -52.3 m/s 0.4 m/s CO2=2.474E+13 N2=1.152E+13 Ar=1.205E+12 O2=4.787E+11 CO=5.553E+12 #/m**3 47.366 14.044 2.094 0.666 6.768 % by mass 28.805 13.415 1.403 0.557 6.466 % by volume O=4.158E+13 He=6.452E+11 H2=3.549E+10 H=1.263E+11 Total=8.588E+13 #/m**3 28.941 0.112 0.003 0.006 % by mass MolWgt=26.764 48.414 0.751 0.041 0.147 % volume (mole) fraction ------------------------------------------------------------------------------------------------------------------------------ Time (rel. to T0) = 19500.0 sec. ( 0.220 sols) Ls = 97.1 Dust = 0.30 Height Above MOLA (or Surface) = 190.000 km ( 189.754 km) OWLT = 19.02 Min Topographic Height = 0.246 km Radius (Areoid) = 3577.940 (3387.940) km Hgt Above Ellipsoid = 190.737 km Scale Hgt H(p)= 14.85 H(rho)= 12.53 km Height Offset Parameters: ibougher = 1 Local Height Offset = 2.280 km Planeto-Centric Lat = 41.98 deg Longitude = 67.47 W ( 292.53 E) deg. Planeto-Graphic Lat = 42.30 deg Planeto-Graphic Hgt (Ellps)= 190.733 km Planeto-Cent Sun Lat = 25.01 deg Mars Orbital Radius = 1.648 AU Sun Longitude = 187.77 deg.W Local True Solar Time = 20.02 Mars hrs Exospheric Temp. = 175.9 K Tbase = 143.9 K Zbase = 124.6 km Solar Zenith Angle = 93.3 deg F1 peak = 999.9 km Temperature = 175.8 K Pressure = 1.473E-07 N/m**2 profwgt = 0.000 Density (Low, Avg., High) = 1.741E-12 2.524E-12 3.660E-12 kg/m**3 Departure, COSPAR NH Mean = -96.3 % -94.7 % -92.3 % iupdate = 1 Tot.Dens. = 3.176E-12 kg/m**3 Dens.Pert. = 25.83% Wave = 0.00% of mean

55
Eastward Wind (Mean,Perturbed,Total) = 0.7 -9.5 -8.8 m/s VertWind Northward Wind(Mean,Perturbed,Total) = -79.0 13.9 -65.1 m/s -0.5 m/s CO2=1.380E+13 N2=8.383E+12 Ar=7.622E+11 O2=3.325E+11 CO=4.041E+12 #/m**3 39.955 15.450 2.004 0.700 7.446 % by mass 22.751 13.819 1.256 0.548 6.662 % by volume O=3.256E+13 He=6.201E+11 H2=3.500E+10 H=1.266E+11 Total=6.066E+13 #/m**3 34.269 0.163 0.005 0.008 % by mass MolWgt=25.059 53.676 1.022 0.058 0.209 % volume (mole) fraction ------------------------------------------------------------------------------------------------------------------------------ Time (rel. to T0) = 20000.0 sec. ( 0.225 sols) Ls = 97.1 Dust = 0.30 Height Above MOLA (or Surface) = 195.000 km ( 194.639 km) OWLT = 19.02 Min Topographic Height = 0.361 km Radius (Areoid) = 3582.794 (3387.794) km Hgt Above Ellipsoid = 195.765 km Scale Hgt H(p)= 15.85 H(rho)= 13.15 km Height Offset Parameters: ibougher = 1 Local Height Offset = 2.280 km Planeto-Centric Lat = 42.48 deg Longitude = 67.97 W ( 292.03 E) deg. Planeto-Graphic Lat = 42.80 deg Planeto-Graphic Hgt (Ellps)= 195.762 km Planeto-Cent Sun Lat = 25.01 deg Mars Orbital Radius = 1.648 AU Sun Longitude = 189.80 deg.W Local True Solar Time = 20.12 Mars hrs Exospheric Temp. = 175.5 K Tbase = 143.7 K Zbase = 124.6 km Solar Zenith Angle = 93.8 deg F1 peak = 999.9 km Temperature = 175.4 K Pressure = 1.060E-07 N/m**2 profwgt = 0.000 Density (Low, Avg., High) = 1.171E-12 1.699E-12 2.463E-12 kg/m**3 Departure, COSPAR NH Mean = -96.8 % -95.4 % -93.4 % iupdate = 1 Tot.Dens. = 1.686E-12 kg/m**3 Dens.Pert. = -0.73% Wave = 0.00% of mean Eastward Wind (Mean,Perturbed,Total) = 1.6 4.2 5.8 m/s VertWind Northward Wind(Mean,Perturbed,Total) = -81.6 1.2 -80.4 m/s 0.0 m/s CO2=7.443E+12 N2=6.096E+12 Ar=4.819E+11 O2=2.308E+11 CO=2.939E+12 #/m**3 32.021 16.697 1.882 0.722 8.048 % by mass 17.007 13.930 1.101 0.527 6.716 % by volume O=2.581E+13 He=5.960E+11 H2=3.453E+10 H=1.269E+11 Total=4.376E+13 #/m**3 40.377 0.233 0.007 0.013 % by mass MolWgt=23.374 58.989 1.362 0.079 0.290 % volume (mole) fraction ------------------------------------------------------------------------------------------------------------------------------

56
APPENDIX D—SUMMARY OF FILES PROVIDED WITH MARS-GRAM 2010
The Mars-GRAM 2010 zip file contains the following directories:
binFiles PC binary version of data files required
Code Source code for Mars-GRAM stand-alone and example trajectory programs
Documentation README and other .txt and .pdf documentation files
Executables PC executables for Mars-GRAM and the various Utilities programs executables for other platforms must be compiled from the source code
IOfiles Reference input and output files [sample output files ListMapYrx.txt (x = 0, 1, 2)]
txtFiles Text version of data files required. Source code makebin.f90 in Utilities directory is a program to read these text files and create the binary files on non-PC systems (see Conversion of ASCII Data to Binary in appendix F).
Utilities Source code for utilities programs to perform various tasks related to Mars-GRAM.
NOTE: Text files provided have end-of-line marks in PC format. These may need to be converted to end-of-line marks on your non-PC platform. File transfer protocol (FTP) file transfer to your target platform from the zip files, read on a PC, can make the transform, if the FTP file transfer is done in ASCII mode. On-line or GNU utilities are also available that can perform this end-of-line transform for you.
The directories contain the following files:
Directory Code:
Cfiles_M10_C.f90 Mars-GRAM common block modules
Ifiles_M10_I.f90 Mars-GRAM interface modules
marsgram_M10.f90 Source code for the “stand-alone” version main program
marssubs_M10.f90 Subroutines used by marsgram_M10, dumytraj_M10, and multtraj_M10
setup_M10.f90 Setup routines used by marsgram_M10, dumytraj_M10, and multtraj_M10
TESsubs_M10.f90 Subroutines to read and interpolate TES mapping year 1 and 2 data; used by marsgram_M10, dumytraj_M10, and multtraj_M10

57
dumytraj_M10.f90 Source code for main driver of dumytraj example trajectory program. To be compiled with marssubs_M10.f90, TESsubs_M10.f90, setup_M10.f90, and wrap-per_M10.f90; this program illustrates the use of Mars-GRAM as a subroutine in trajectory programs or orbit propagator programs.
multtraj_M10.f90 Source code for main driver of multtraj example trajectory program that computes multiple trajectories during one run. This is to be compiled with marssubs_M10.f90, TESsubs_M10.f90, setup_M10.f90, and wrapper_M10.f90. This program illustrates the use of Mars-GRAM as a subroutine in trajectory programs or orbit propagator programs that compute positions of multiple spacecraft during one run.
wrapper_M10.f90 Wrapper routine (subroutine marstraj), called by dumytraj_M10 and multtraj_M10, for including in user’s trajectory code (along with marssubs, TESsubs, and setup routines, called by wrapper)
ldMarsGRAM.bat Example macro to compile and link the Mars-GRAM stand-alone program
lddumytraj.bat Example macro to compile and link the dummy trajectory program dumytraj_M10
ldmulttraj.bat Example macro to compile and link the dummy trajectory program multtraj_M10
Directory Utilities:
makebin.f90 Program to read ASCII version MGCM and MTGCM data files and write out binary version for faster reading on the user’s machine. This program reads the near-surface MGCM data at the ground surface, 5 m, and 30 m above surface for both Mars-GRAM 2001 data with dust optical depths of 0.3, 1, and 3 and the TES mapping year 1 and 2 data. Reads 0.0 to 80.0 km Mars-GRAM 2001 MGCM data and -5 to 80 km TES mapping year 1 and 2 MGCM data. This program also reads 80.0 to 170.0 km Mars-GRAM 2001 MTGCM data and 80 to 240 km TES mapping year 1 and 2 MTGCM data. Finally, it reads optical depth file, tau versus latitude-longitude-Ls, for TES mapping years 1 and 2. Binary conversion process is required only once, before the initial running of Mars-GRAM. See appendix F for file descriptions.
readalb.f90 Program to read ASCII albedos and convert to binary
READTOPO.f90 Program to read ASCII MOLA topography and convert to binary
BLDTRAJ.f90 Program to build pseudo-trajectory file for use in Mars-GRAM to compute output for maps or cross-sections
finddate.f90 Utility to find Earth date/time for desired Ls or Mars time
julday.f90 Utility to find Julian day from year, month, day input
marsrad.f90 Uses Mars-GRAM output to compute various solar (shortwave) and thermal (longwave) fluxes at the surface and the top of the atmosphere

58
radtraj.f90 Special “trajectory” building program to compute vertical profiles at latitude- longitude, latitude-time, or longitude-time cross sections, for input to Mars-GRAM runs to produce output for input to marsrad radiation calculations
LdBldTraj.bat Example macro to compile and link program BLDTRAJ
LdFindDate.bat Example macro to compile and link program finddate
LdJulDay.bat Example macro to compile and link program julday
LdMakebin.bat Example macro to compile and link program makebin
LdMarsRad.bat Example macro to compile and link program marsrad
LdRadTraj.bat Example macro to compile and link program radtraj
LdReadalb.bat Example macro to compile and link program readalb
LdReadtopo.bat Example macro to compile and link program READTOPO
Directory txtFiles:
Data files (ASCII format) for MGCM near-surface data
sfc00xxy.txt MGCM boundary layer data at ground surface for Mars-GRAM 2001 data at dust optical depths 0.3, 1.0, and 3.0 (xx = 03, 10, 30) and for TES mapping years 1 and 2 (xx = y1, y2), and version number y
sfc05xxy.txt MGCM boundary layer data at 5.0 m height for Mars-GRAM 2001 data at dust optical depths 0.3, 1.0, and 3.0 (xx = 03, 10, 30) and for TES mapping years 1 and 2 (xx = y1, y2), and version number y
sfc30xxy.txt MGCM boundary layer data at 30.0 m height for Mars-GRAM 2001 data at dust optical depths 0.3, 1.0, and 3.0 (xx = 03, 10, 30) and for TES mapping years 1 and 2 (xx = y1, y2), and version number y
MGCM data files (ASCII format) for 0 to 80 km or -5 to 80 km
tpdloxxy.txt Mars-GRAM 2001 MGCM 0 to 80 km temperature, pressure, and density data for 3 dust optical depths (xx = 03, 10, 30), version number y, or TES mapping year 1 and 2 data (xx = y1, y2) for -5 to 80 km, version number y
uvloxxy.txt Mars-GRAM 2001 MGCM 0 to 80 km EW wind NS wind data for 3 dust optical depths (xx = 03, 10, 30), version number y, or TES mapping year 1 and 2 data (xx = y1, y2) for -5 to 80 km, version number y

59
Data files (ASCII format) for MTGCM 80 to 170 (or 240) km data
tpdlsxxy.txt Mars-GRAM 2001 MTGCM 80 to 170 km temperature, pressure, and density data for 3 dust optical depths (xx = 03, 10, 30), version number y, for solar activity F10.7 = 70; or MTGCM data for 80 to 240 km for TES mapping years 1 and 2 (xx = y1, y2)
tpdmsxxy.txt Mars-GRAM 2001 MTGCM 80 to 170 km temperature, pressure, and density data for 3 dust optical depths (xx = 03, 10, 30), version number y, for solar activity F10.7 = 130; or MTGCM data for 80 to 240 km for TES mapping years 1 and 2 (xx = y1, y2)
tpdhsxxy.txt MTGCM 80 to 240 km temperature, pressure, and density data for TES mapping years 1 and 2 (xx = y1, y2), version number y, for solar activity F10.7 = 200
uvlsxxy.txt MTGCM 80 to 170 km EW wind and NS wind data for 3 dust optical depths xx, version number y, for solar activity F10.7 = 70; or 80 to 240 km for TES mapping years 1 and 2 (xx = y1, y2)
uvmsxxy.txt MTGCM 80 to 170 km EW wind and NS wind data for 3 dust optical depths xx, version number y, for solar activity F10.7 = 130; or 80 to 240 km for TES mapping years 1 and 2 (xx = y1, y2)
uvhsxxy.txt MTGCM 80 to 240 km EW wind and NS wind data for TES mapping years 1 and 2 (xx = y1, y2) version number y, for solar activity F10.7 = 200
Other text files, which must be converted to binary format
albedo1.txt Global surface albedo at 1 by 1 degree latitude-longitude resolution; must be converted to binary with program readalb.f90
MOLATOPH.TXT MOLA areoid and surface topography at 1/2 by 1/2 degree latitude-longitude resolution; must be converted to binary with program READTOPO.f90
TESdust1.txt TES dust optical depth data versus Ls, latitude, longitude for TES mapping years 1 and 2; must be converted to binary with program makebin.f90
Directory binFiles:
sfc*.bin Binary format MGCM surface data files
tpdlo*.bin Binary format MGCM thermodynamic files
uvlo*.bin Binary format MGCM wind files tpdxs*.bin Binary format MTGCM thermodynamic files (x=l, m, or h for low, medium,
or high solar activity)
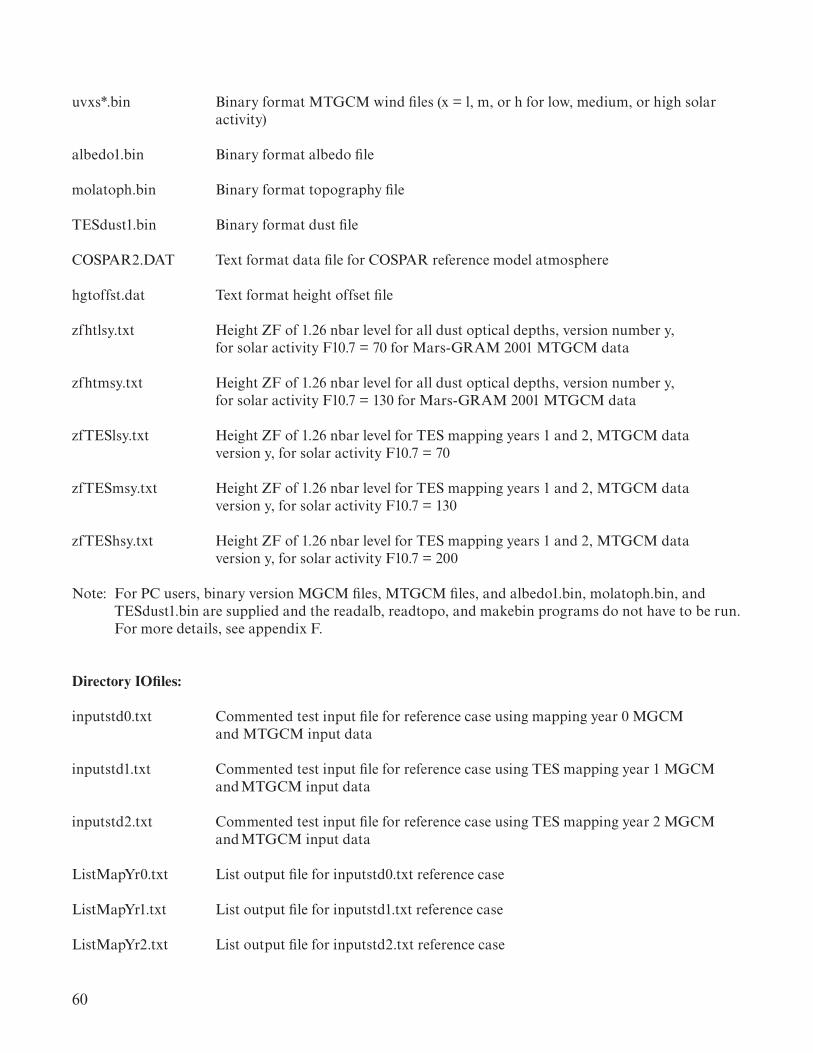
60
uvxs*.bin Binary format MTGCM wind files (x = l, m, or h for low, medium, or high solar activity)
albedo1.bin Binary format albedo file
molatoph.bin Binary format topography file
TESdust1.bin Binary format dust file
COSPAR2.DAT Text format data file for COSPAR reference model atmosphere
hgtoffst.dat Text format height offset file
zfhtlsy.txt Height ZF of 1.26 nbar level for all dust optical depths, version number y, for solar activity F10.7 = 70 for Mars-GRAM 2001 MTGCM data
zfhtmsy.txt Height ZF of 1.26 nbar level for all dust optical depths, version number y, for solar activity F10.7 = 130 for Mars-GRAM 2001 MTGCM data
zfTESlsy.txt Height ZF of 1.26 nbar level for TES mapping years 1 and 2, MTGCM data version y, for solar activity F10.7 = 70
zfTESmsy.txt Height ZF of 1.26 nbar level for TES mapping years 1 and 2, MTGCM data version y, for solar activity F10.7 = 130
zfTEShsy.txt Height ZF of 1.26 nbar level for TES mapping years 1 and 2, MTGCM data version y, for solar activity F10.7 = 200
Note: For PC users, binary version MGCM files, MTGCM files, and albedo1.bin, molatoph.bin, and TESdust1.bin are supplied and the readalb, readtopo, and makebin programs do not have to be run.
For more details, see appendix F.
Directory IOfiles:
inputstd0.txt Commented test input file for reference case using mapping year 0 MGCM and MTGCM input data
inputstd1.txt Commented test input file for reference case using TES mapping year 1 MGCM and MTGCM input data
inputstd2.txt Commented test input file for reference case using TES mapping year 2 MGCM and MTGCM input data
ListMapYr0.txt List output file for inputstd0.txt reference case
ListMapYr1.txt List output file for inputstd1.txt reference case
ListMapYr2.txt List output file for inputstd2.txt reference case

61
profiledata.txt Sample auxiliary profile
dumytraj.bat Example execute macro for dummy trajectory program dumytraj_M10
marsgram0.bat Example execute macro for mapping year 0 reference input
marsgram1.bat Example execute macro for mapping year 1 reference input
marsgram2.bat Example execute macro for mapping year 2 reference input
multtraj.bat Example execute macro for dummy trajectory program multtraj_M10
Directory Documentation:
headers.txt List of output files and file header definitions
marsfix.txt List of code changes since Mars-GRAM 2010 Version 1.0 (Nov 2010)
marshist.txt History file summarizing various Mars-GRAM versions and changes
Mars2000.pdf A portable document format (PDF) version of the Mars-GRAM 2000 user guide
Mars2001.pdf A PDF version of the Mars-GRAM 2001 user guide.
Mars2010.pdf A PDF version of the Mars-GRAM 2010 user guide MarsEnvironment.pdf A PDF version of the Mars Transportation Environment Definition Document
(NASA/TM—2001–210935)
README1.txt General program introduction file
README2.txt Discussion of dumytraj_M10.f90 dummy trajectory program
README3.txt Discussion of MGCM and MTGCM input data files, including provided pro-grams to convert ASCII files into binary files for faster running of Mars-GRAM
README4.txt Discussion of auxiliary programs provided, including marsrad (solar and ther-mal radiative transfer program)
README5.txt Discussion of Mars-GRAM sample input and output files, including reference test case
README6.txt Description of some special program features not fully covered in other README files
xycodes.txt List of x-y plot codes (also given below)
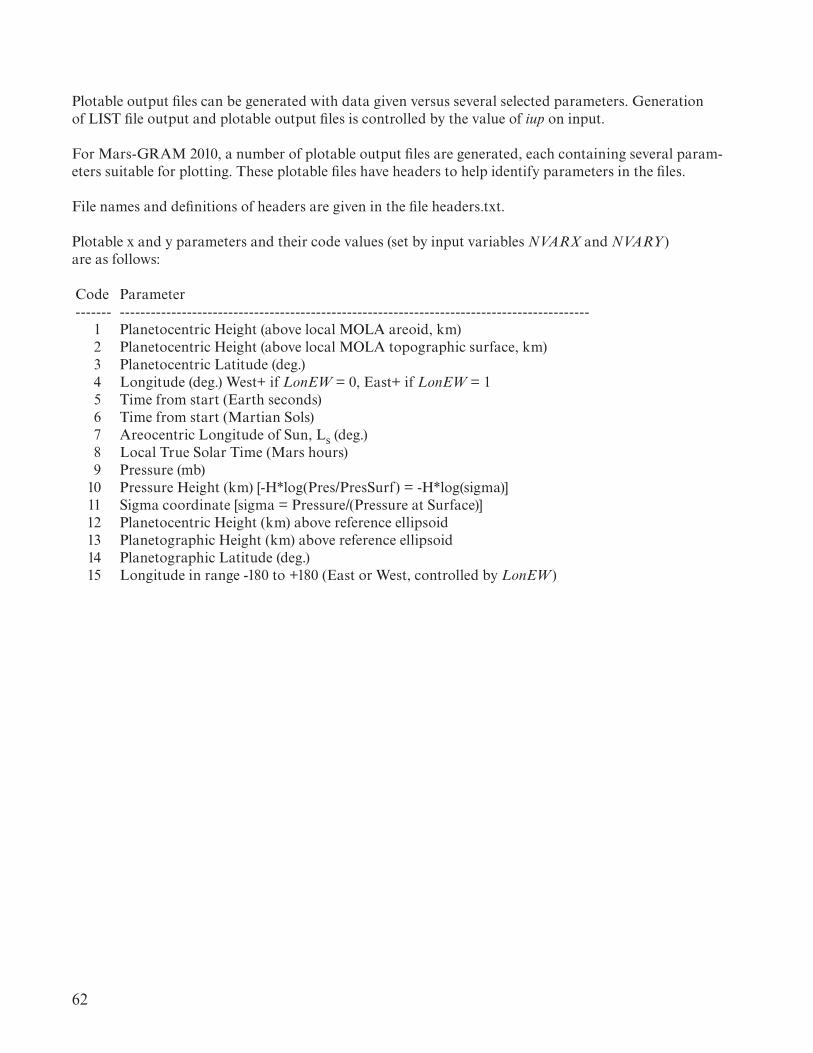
62
Plotable output files can be generated with data given versus several selected parameters. Generation of LIST file output and plotable output files is controlled by the value of iup on input.
For Mars-GRAM 2010, a number of plotable output files are generated, each containing several param-eters suitable for plotting. These plotable files have headers to help identify parameters in the files.
File names and definitions of headers are given in the file headers.txt.
Plotable x and y parameters and their code values (set by input variables NVARX and NVARY) are as follows:
Code Parameter ------- ------------------------------------------------------------------------------------------- 1 Planetocentric Height (above local MOLA areoid, km) 2 Planetocentric Height (above local MOLA topographic surface, km) 3 Planetocentric Latitude (deg.) 4 Longitude (deg.) West+ if LonEW = 0, East+ if LonEW = 1 5 Time from start (Earth seconds) 6 Time from start (Martian Sols) 7 Areocentric Longitude of Sun, Ls (deg.) 8 Local True Solar Time (Mars hours) 9 Pressure (mb) 10 Pressure Height (km) [-H*log(Pres/PresSurf) = -H*log(sigma)] 11 Sigma coordinate [sigma = Pressure/(Pressure at Surface)] 12 Planetocentric Height (km) above reference ellipsoid 13 Planetographic Height (km) above reference ellipsoid 14 Planetographic Latitude (deg.) 15 Longitude in range -180 to +180 (East or West, controlled by LonEW)
63
APPENDIX E—EXAMPLE APPLICATION OF MARS-GRAM IN A TRAJECTORY CODE
With earlier versions of Mars-GRAM a dummy trajectory program, marstraj.f, was supplied. Beginning with Mars-GRAM version 3.8, an alternate version of a double precision dummy trajectory cal-culating program, dumytraj.f, was included. Although similar in general function to the original marstraj.f code, some details of dumytraj.f are different:
(1) In the original marstraj.f, interaction with Mars-GRAM was via calls to three subroutines:
Call Setup(...)
Call Randinit(...)
Call Datastep(...)
These three subroutines are part of the Mars-GRAM 2010 code and are automatically available to be called whenever the Mars-GRAM 2010 code (marssubs_M10.f90 and setup_M10.f90) is linked to the user’s main trajectory driver program. If you already have a trajectory program built like this, with calls to Setup, Randinit, and Datastep it might be easily modified to incorporate Mars-GRAM 2010 subroutines without using the approach taken in dumytraj_M10.f90. Note, however, that the number of arguments in these subroutines has changed, so appropriate modifications in your trajectory programs must be made.
(2) In dumytraj_M10.f90, interaction with Mars-GRAM 2010 is via three calls to one wrapper subroutine named Marstraj_M10 and provided as file wrapper_ M10.f90, but with different values of three control parameters called isetup, jmonte, and istep:
Call Marstraj_M10(...) with isetup = 1
Call Marstraj_M10(...) with isetup = 0, jmonte > 0, istep = 0
Call Marstraj_M10(...) with isetup = 0, jmonte = 0, istep > 0
where isetup = 1 triggers the call to the Setup subroutine, jmonte > 0 triggers the call to the reinitialization process including the call to the Randinit subroutine, and istep = 1 to MAXNUM is a counter for steps along the trajectory with a call to the Datastep subroutine at each step. Marstraj_M10 is a subroutine in the dumytraj_M10.f90 code, and must be included along with the basic Mars-GRAM code setup_M10.f90 and marssubs_M10.f90 as a subroutine in the user’s calling trajectory program.
(3) In the original marstraj.f dummy trajectory main code, the transfer of double precision trajec-tory variables to and from single precision Mars-GRAM variables was assumed to be done within the user’s main trajectory code. In the dumytraj_M10.f90 code this transfer is handled within the Marstraj_M10 subroutine which must be included as a subroutine in the user’s trajectory program.

64
(4) In the original marstraj.f dummy trajectory main code, single precision values of position incre-ments DELHGT, DELLAT, and DELLON were presumed to be calculated within the user’s main trajec-tory program. In the dumytraj_M10.f90 code, input variables to the Marstraj_M10 subroutine are current and next double precision position values of height, latitude, and longitude and the position increments to be passed to the Datastep subroutine including increments of height, latitude, and longitude are computed within the Marstraj_M10 subroutine.
Regardless of which dummy trajectory code you decide to use as your starting model from which to build the interface to Mars-GRAM 2010 for your own trajectory code, it is worthwhile to read the com-ments embedded in the dumytraj_M10.f90 code. These comments give more explicit descriptions of the functions that are being performed. They also provide valuable hints about what to do if you are using predictor-corrector or other trajectory approaches that require mid-point corrections along trajectory steps and/or the use of density variations that occur within each trajectory step.
Another feature of dumytraj_M10.f90 is that it allows high precision Mars ephemeris values for sun latitude, longitude, and Ls angle to be passed from the trajectory program for use by Mars-GRAM 2010 subroutines.
The multiple perturbation version, multtraj_M10.f90 , allows different realizations of perturbation profiles to be generated on a single trajectory run. This can be used, for example, to test sensitivity of a guidance algorithm to different gain levels.

65
APPENDIX F—DETAILS OF MGCM, MTGCM, AND MOLA DATA FILES
Time-of-Day Variation of MGCM and MTGCM Data
ASCII format MGCM and MTGCM data files are provided, each having values for amplitudes and phases of diurnal and semi-diurnal components. The diurnal period is 24 Mars hours and the semi-diurnal period is 12 Mars hours. Generically, the amplitudes and phases are as follows:
A0 = Diurnal mean value of the given parameter
A1 = Amplitude of the diurnal tide component
phi1 = Phase (local time in Mars hours) of the diurnal component
A2 = Amplitude of the semi-diurnal tide component
phi2 = Phase (local time in Mars hours) of the semi-diurnal component
For temperature, wind components, and height of 1.26 nbar level (ZF), data files give amplitudes in the same units as those of the parameter, K for temperature, m/s for wind, or km for ZF. For pressure and density, data files give amplitudes in units of percent of the mean value A0. A0 units for pressure are N/m2, while density A0 units are kg/m3.
Three slightly different functions for tidal variation versus time of day are used. For MGCM and MTGCM temperatures and winds and MTGCM ZF heights, function TideX is used, where
TideX = A0 + A1 * cos((π/12) * (time – phi1)) + A2 * cos((π/6) * (time – phi2))
and time is the local solar time in Mars hours. Note that units for A1 and A2 are same as those for A0 in this function form. For Mars-GRAM 2001, MGCM and MTGCM pressure and density data which have A1 and A2 in units of percent of A0, function TideY is used, where
TideY = A0 * (1 + 0.01 * A1 * cos((π/12) * (t – phi1)) + 0.01 * A2 * cos((π/6) * (t – phi2)))
TES MTGCM data extend to higher altitude, 240 km versus 170 km for Mars-GRAM 2001 MTGCM data. Consequently, tidal amplitudes for density and pressure for the new data grow to larger values than for the Mars-GRAM 2001 data. To accommodate this situation, an alternate model is adopted for pressure and density variation with time of day, whereby it is the log of pressure and density that are assumed to vary as cosine of time of day. Namely TES mapping year 1 and 2 MTGCM pressure and den-sity tides are computed by
tTideY = A0 * ((1.0d0 + 0.01d0 * A1) ** c1) * ((1.0d0 + 0.01d0 * A2) ** c2)

66
where exponents c1 and c2 are given by
c1 = cos((π/12) * (time – phi1))
c2 = cos((π/6) * (t – phi2)
Near-Surface MGCM Data
Near-surface MGCM data files are provided as follows in ASCII format:
sfc00xxy.txt MGCM temperature data at topographic surface
sfc05xxy.txt MGCM temperature and wind data at 5 m height above the surface
sfc30xxy.txt MGCM temperature and wind data at 30 m height above the surface
Naming convention for these files is:
xx = 03, 10, 30 for Mars-GRAM 2001 data at globally-uniform dust optical depths of 0.3, 1.0, and 3.0
xx = y1, y2 for data at time-and space-variable dust optical depth as observed during TES mapping years 1 and 2
y = version number
Each record of these files contains Ls value, latitude, longitude, and tidal coefficients (A0, A1, phi1, A2, phi2) for temperature, and for Eastward and Northward wind components, except for ground surface data files, which contain only temperature information.
MGCM Data Up to 80.0 km Altitude
Files of zonally-averaged MGCM data up to 80.0 km altitude above the MOLA areoid are provided as follows in ASCII format:
tpdloxxy.txt MGCM temperature, pressure, and density data
uvloxxy.txt MGCM Eastward and Northward wind data
Naming convention for these files is:
xx = 03, 10, 30 for Mars-GRAM 2001 data at globally-uniform dust optical depths of 0.3, 1.0, and 3.0. These data are at 5.0 km intervals from 0.0 km to 80.0 km above MOLA
xx = y1, y2 for data at time-and space-variable dust optical depths as observed during TES map-ping years 1 and 2. These data are at 1.0 km interval from -5.0 km to +10.0 km above MOLA, and 5.0 km interval from 10.0 km to 80.0 km above MOLA
y = version number
67
For the MGCM data sets, each record of the tpdloxx.txt files contains Ls value, height, latitude, and tidal coefficients for temperature and pressure. Only the A0 coefficient is given for density. Tidal varia-tions in density are computed from those for pressure and temperature by the perfect gas law relation. For the TES mapping year 1 and 2 data, each record of the tpdloxx.txt files contains Ls value, height, latitude, and tidal coefficients for temperature and density. Only the A0 coefficient is given for pressure. Tidal varia-tions in pressure are computed from those for density and temperature by the perfect gas law relation.
For both MGCM and TES mapping year 1 and 2 data, each record of the uvloxx.txt files contains Ls value, height, latitude, and tidal coefficients for the Eastward and Northward wind components.
MTGCM Data Up to 170.0 or 240.0 km Altitude
Zonally-averaged MTGCM data are provided in ASCII format at 5.0 km height resolution for the altitude range of 80.0 to 170.0 km for Mars-GRAM 2001 data and 80.0 to 240.0 km for TES mapping year 1 and 2 data. Data sets are provided for different levels of solar activity as characterized by 10.7 cm solar flux, F10.7, as measured at 1.0 AU.
tpdlsxxy.txt MTGCM temperature, pressure, and density data for low solar activity (F10.7 = 70)
tpdmsxxy.txt MTGCM temperature, pressure, and density data for moderate solar activity (F10.7 = 130)
tpdhsxxy.txt MTGCM temperature, pressure, and density data for high solar activity (F10.7 = 200; available for TES mapping years 1 and 2 only)
uvlsxxy.txt MTGCM Eastward and Northward wind data for F10.7 = 70
uvmsxxy.txt MTGCM Eastward and Northward wind data for F10.7 = 130
uvhsxxy.txt MTGCM Eastward and Northward wind data for F10.7 = 200 (available for TES mapping years 1 and 2 only)
Naming convention for these files is:
xx = 03, 10, 30 for Mars-GRAM 2001 data at globally-uniform dust optical depths of 0.3, 1.0, and 3.0.
xx = y1, y2 for data at time-and space-variable dust optical depths as observed during TES map-ping years 1 and 2.
y = version number
Each record of the tpdlsxxy.txt, tpdmsxxy.txt and tpdhsxxy.txt files contains Ls value, height, lati-tude, and tidal coefficients for temperature, pressure, and density. Because of height variations in molecu-lar weight, tidal coefficients are retained for all three of these thermodynamic components. Each record of the uvlsxxy.txt, uvmsxxy.txt and uvhsxxy.txt files contains Ls value, height, latitude, and tidal coefficients for the Eastward and Northward wind components.
68
Files zfhtlsy.txt, and zfhtmsy for Mars-GRAM 2001 data, F10.7 = 70 or 130 and zfTESlsy.txt, zfT-ESmsy.txt, and zfTEShsy.txt for TES mapping years 1 and 2, F10.7 = 70, 130, or 200 provide tidal coeffi-cient information for altitude ZF, the height of the 1.26 nbar level. Each record of the ZF files contains dust optical depth or TES mapping year, Ls, latitude, and tidal coefficient values. The mean ZF value and tidal amplitudes are given in km.
MOLA Areoid and Topography Data
MOLA areoid and topography data at 1/2 by 1/2 degree latitude-longitude resolution is provided in ASCII file MOLATOPH.TXT. Each line of this file contains East longitude and latitude at the center of the 1/2 by 1/2 degree grid box, grid-box-average radius in meters to the topographic surface, areoid radius in meters which is the radius to reference constant potential surface, evaluated at the center of the grid box, topography which is the grid-box-average difference in meters between the local planetary radius and are-oid; this is analogous to the local terrain height above sea level for Earth, and Num which equals the num-ber of laser shots averaged over the grid box. MOLA latitudes are planetocentric. Longitudes in the MOLA input file are with respect to the IAU 1991 prime meridian. A shift of about 0.24 degrees is made automati-cally within Mars-GRAM 2010, in order to convert to longitudes relative to the IAU 2000 prime meridian.
Surface Albedo Data
Global surface albedo at 1 by 1 degree latitude-longitude resolution is given in file albedo1.txt. Each line of this file contains latitude, and West longitude at the center of the 1 by 1 degree grid box, and grid-box-average surface albedo which is the ratio of the surface-reflected solar flux to that incident on the surface.
Global Mean MGCM-MTGCM Height Offset Data
Height offsets can be used to control the smoothness of the transition at 80 km altitude between MGCM data and MTGCM data. Height offset options are controlled by input parameters zoffset and ibougher. The file README6.txt contains more details about height offsets and these input parameters. Option ibougher = 2 causes the height offsets to be evaluated from global average height offset data given in the file hgtoffst.dat. In the first part of this file, global-average offsets in km are given for Mars-GRAM 2001 data as a function of Ls and dust optical depth of 0.3, 1.0, and 3.0. In the second part of this file, global-average offsets are given versus Ls for TES mapping years 1 and 2, y1 or y2.
TES Dust Optical Depth Data
Observed average dust optical depth from TES mapping years 1 and 2 are provided in the file TESdust1.txt. TES mapping year 1 was from April 1999 through January 2001. TES mapping year 2 was from February 2001 through December 2002. In terms of Ls, TES mapping years 1 and 2 cover from Ls = 115, through Ls = 360/0, and back to Ls = 115 the following Mars year. A conventional Mars year runs from Ls = 0 to Ls = 360. There were no global-scale dust storms during TES mapping year 1. However, a very intense, global-scale dust storm began near the end of June 2001, during TES mapping year 2. Each line of file TESdust1.txt contains TES mapping year (1 or 2), Ls, latitude, West longitude, and the average TES optical depth expressed as visible-wavelength optical depth, approximately twice the optical depth values measured by TES at its 9 micron observing wavelength. Data in this file are at a resolution of 5.0 degrees in Ls, 7.5 degrees in latitude, and 9.0 degrees in longitude.

69
COSPAR Reference Data
COSPAR Northern hemisphere mean reference data, as given in Pitts et al31, are provided in file COSPAR2.DAT. Each line of this file contains height (km), temperature (K), pressure (mbar), and density (g/cm3).
Conversion of ASCII Data to Binary
Source code is provided for a program called makebin.f90 that reads the ASCII format MGCM and MTGCM data files and the TES dust optical depth data file and writes them out in binary format. After this ASCII-to-binary conversion is completed once, subsequent reading of the binary format files significantly shortens the time required to initialize Mars-GRAM on each run. Source code is also pro-vided for the ASCII-to-binary conversion programs called READTOPO.f90 and readalb.f90 that covert the MOLA topography data and the albedo data files. ZF data files, height offset file, and COSPAR refer-ence data file are sufficiently small that they can be read in ASCII format, so no conversion to binary is required for these files.
Note: For PC users, all necessary binary version files are supplied and the ASCII-to-binary conversion programs (readalb, readtopo, and makebin) do not have to be run.
To run Mars-GRAM, the binary-version MGCM and MTGCM files, together with the ASCII-format ZF data files, must be in the directory whose pathname is given by the input parameter GCMDIR in the NAMELIST input file. The binary version albedo, MOLA topography, and TES dust optical depth data files, together with ASCII-format files COSPAR2.DAT and hgtoffst.dat must be in the directory whose pathname is given by the input parameter DATADIR in the NAMELIST input file. In this distribu-tion of Mars-GRAM, the default pathname for DATADIR and GCMDIR are the same, with all necessary files together in the binFiles directory.
Optional Trajectory Input Files
If the number of positions to be calculated given by the input parameter NPOS is set to 0, an optional trajectory input file is read from a file with the name given by the input parameter TRAJFL. Each line of the trajectory file consists of: time, in seconds past the start time specified in the NAMELIST input, height, in km, latitude in degrees, and longitude in degrees. Heights are relative to the MOLA areoid or reference ellipsoid, as set by the input parameter MOLAhgts. Latitudes are planetocentric or planeto-graphic, as set by the input parameter ipclat. Longitudes are East or West, as set by the input parameter LonEW. Any additional reference information included on each line (e.g. orbit number, measured density, etc.) is ignored. Trajectory positions in these files do not have to be at small time or space steps. For exam-ple, a trajectory file may consist of successive periapsis times and positions for a simulated or observed aerobraking operation. Trajectory files may also contain arrays of locations used for computing height-latitude cross sections or latitude-longitude cross sections. Such trajectory input files can be built by the program BLDTRAJ.f90 (see appendix G).
Optional Auxiliary Profile Input File
As an option, data read from an auxiliary profile may be used to replace data from the MGCM and MTGCM data files. This option is controlled by setting the input parameters profile, profnear, and proffar in the NAMELIST input file. Input parameter profile gives the file name of the file containing the profile data values. Input parameter profnear is the latitude-longitude radius in degrees within which the

70
weight for the auxiliary profile is 1.0. Input parameter proffar is the latitude-longitude radius in degrees beyond which the weight for the auxiliary profile is 0.0. A weighting factor for the profile data, profwgt, having values between 0 and 1, is applied between the proffar and profnear radii. Mean conditions are as given in the profile file if the desired point is within a latitude-longitude radius of profnear from the profile latitude-longitude at the given altitude; mean conditions are as given by the original MGCM or MTGCM data if the desired point is beyond a latitude-longitude radius of proffar from the latitude-longitude of the profile at the given altitude. If profnear = 0, then profile data are NOT used. The profile weight factor, profwgt, for the auxiliary profile also varies between 0 at the first profile altitude level and 1 at the second profile altitude level and between 1 at the next-to-last profile altitude level and 0 at the last profile altitude level. First and second profile points and the next-to-last and last profile points should therefore be selected widely enough apart in altitude that a smooth transition can occur as profwgt changes from 0 to 1 near these profile end points.
Each line of the auxiliary profile input file consists of: height, in km, latitude, in degrees, longitude, in degrees, temperature, in K, pressure, in N/m2, density, in kg/m3, Eastward wind, in m/s, and Northward wind, in m/s. Heights are relative to the MOLA areoid or reference ellipsoid, as set by the input parameter MOLAhgts. Latitudes are planetocentric or planetographic, as set by the input parameter ipclat. Longitudes are East or West, as set by the input parameter LonEW. MGCM/MTGCM temperature, pressure, and den-sity data are used if any of the profile inputs for temperature, pressure, or density are 0. MGCM/MTGCM winds are used if BOTH wind components are 0 in the profile file. A sample auxiliary profile file named profiledata.txt is provided in the IOfiles directory.

71
APPENDIX G—AUXILIARY PROGRAMS FOR USE WITH MARS-GRAM
Four auxiliary programs are provided for use with Mars-GRAM: BLDTRAJ.f90, finddate.f90, marsrad.f90, and radtraj.f90. The stand-alone version Mars-GRAM program files (marsgram_M10.f90, marssubs_M10.f90, and setup_M10.f90) are discussed in appendix D. Appendixes D and E discuss dummy trajectory programs dumytraj_M10.f90 and multtraj_M10.f90, which provide examples of how to use Mars-GRAM as a subroutine in trajectory programs or orbit propagator programs. Programs makebin.f90, readalb.f90, and READTOPO.f90, which convert data provided in ASCII format into binary files, are discussed in appendixes D and F.
Program BLDTRAJ
It is frequently desirable to produce Mars-GRAM output for graphing as a map (i.e. latitude-longitude cross section at a given height) or other cross-section (e.g. height- latitude cross section at a given longitude). Program BLDTRAJ.f90 generates a trajectory file with input lines containing time, height, latitude, and longitude that can be used as Mars-GRAM input for generation of such maps or cross-sec-tions. Program BLDTRAJ is interactive and prompts the user to input starting values, ending values, and step sizes for height (z1, z2, dz), latitude (lat1, lat2, dlat), and longitude (lon1, lon2, dlon). The program also prompts for a value of time increment which is applied between each trajectory step. This time increment may be 0, if all trajectory points are at the same time. Time values in the trajectory file are time in sec-onds from the start time that is specified by the date and time information provided in the Mars-GRAM NAMELIST-format input file.
NOTE: If heights > 3,000.0 km are used, they are interpreted as planetocentric radius values (km).
Example:
For a latitude-longitude map at height 10.0 km above the MOLA areoid, between latitudes -30 and 30 degrees in steps of 5 degrees, and longitudes 0 to 180 degrees in steps of 20 degrees, enter 10 10 0 for z1, z2, dz; enter -30 30 5 for lat1, lat2, dlat; and enter 0 180 20 for lon1, lon2, dlon. All of these input quantities are of type real, and can be entered to one or more significant digits beyond the decimal.
Program finddate
Program finddate.f90 allows calculation of the areocentric longitude of the Sun, Ls, and Mars local true solar time, LTST, for a given Earth date and time. It also computes the next occurrence beyond the initial input date and time of the Earth date and time for which Ls and LTST are any desired values. Accuracy information and other documentary comments are given within the source code. The program is interactive and prompts for all necessary inputs.
Program julday
Program julday.f90 calculates the Julian day from year, month, and day input. Traveling wave com-ponents require the Julian day for initialization of wave phases. The program is interactive and prompts for all necessary inputs.

72
Program marsrad
Program marsrad.f90 uses Mars-GRAM output files containing height profile information to com-pute various solar (shortwave) and thermal (longwave) fluxes at the surface and the top of the atmosphere. These profiles must start at the surface, should usually extend upward to a height of from 10.0 to 30.0 km, and may be at any desired height resolution with a limit of 1,000 points per profile. Mars-GRAM output files used by marsad.f90 are TPresHgt.txt, Density.txt, and MarsRad.txt. See the file headers.txt that is provided in the Documentation Directory of the Mars-GRAM 2010 zip file for a description of the param-eters contained in these files.
Program marsrad.f90 runs interactively, with the only user input required being the number 1 or 2 of plot variables Var_X and, optionally, Var_Y used in the Mars-GRAM output files. The marsrad program computes various solar (shortwave) and thermal (longwave) fluxes at the surface and the top of the atmosphere. Two marsrad output files are produced. Output file Radlist.txt contains an annotated set of radiation fluxes, equivalent black-body temperatures, and albedos. Output file Radout.txt, suitable for input to a plot program, contains fluxes and other information in one line for each set of output. With an input trajectory file that is generated by program radtraj.f90 - see below, output file Radout.txt can be used to plot solar and thermal radiation data as a map lat-lon cross section, or as latitude-time or longitude-time cross sections.
Longwave radiative fluxes are computed by a broad-band (emissivity) method, patterned after Sav-ijarvi32. Dust optical depth tau is for the shortwave (solar) spectrum. For longwave calculations, infrared emissivity versus shortwave solar optical depth curves are used, adapted from Haberle et al.27. Infrared emissivities for CO2 and water vapor are functions of pressure-scaled optical path lengths with emissivities from Staley and Jurica33. Shortwave fluxes are computed from total dust optical depth adjusted for small amount of clear-sky optical depth by a delta-Eddington method34. Both longwave and shortwave effects of water vapor are included, with relative humidity assumed constant at 20%32. Dust optical properties assumed are 0.7 for asymmetry parameter, and 0.9 for single-scatter albedo. Other reasonable values may be found in Table 1 of Murphy et al.35. Values of asymmetry parameter and single-scatter albedo as well as assumed relative humidity can be changed in data statements near the beginning of the marsrad program.
Output parameters given in Radlist.txt output file in addition to plot variables, Var_X and, option-ally, Var_Y are:
tau Total vertical dust optical depth
MarsAU Mars orbital radius (AU)
mu0 Cosine of solar zenith angle
ice 0 for no ice on the surface, 1 for ice on the surface (affects surface albedo)
Longwave (LW) fluxes F (W/m2):
Fdown(sfc) Downwelling LW flux at surface
Fup(sfc) Upwelling LW flux at surface (related to Tsfc)
Fup(toa) Upwelling LW flux at top-of-atmosphere

73
Femit(atmos) LW flux emitted by atmosphere [Fup(toa) - net LW at sfc]
Radiative (equivalent black-body) temperatures (K):
Tsky(sfc) Equivalent sky temperature [related to Fdown(sfc)]
Tsfc Ground surface temperature [related to Fup(sfc)]
Teff(toa) Effective black-body temperature at top-of-atmosphere
Shortwave (SW) fluxes E (W/m2):
Edown(sfc) Downwelling SW flux at surface
Eup(sfc) Upwelling SW flux at surface [albedo times Edown(sfc)]
Eup(toa) Upwelling SW flux at top-of-atmosphere
Eabsorb(atmos) Net SW flux absorbed by atmosphere
Edown(toa) Solar flux at toa = mu0*(solar constant)/MarsAU2
Surface albedo Surface albedo interpolated from file albedo1.txt
Planetary albedo Ratio Eup(toa)/Edown(toa) SW+LW Fluxes (W/m2):
Absorbed(sfc) SW+LW flux absorbed at the surface
Emitted(toa) Upwelling SW+LW flux at top-of-atmosphere
Controlled by parameter “heatrate” set via user input, marsrad.f90 also outputs optical path lengths for water vapor (H2O), CO2, and dust. H2O and CO2 optical path lengths are scaled by pressure to the 0.75 power. With heatrate set to 1, the program also outputs various fluxes (W/m2) and heating rates (K/day) as a function of pressure level. These optional outputs are:
Pres Pressure (mb)
uH2O Pressure-scaled H2O optical path (precipitable micrometers)
uCO2 Pressure-scaled CO2 optical path (atmosphere-centimeters)
udust Dust optical depth from surface to given pressure level
LWFup Upwelling LW flux at pressure level
LWFdn Downwelling LW flux at pressure level

74
LWFnet Net (up - down) LW flux at pressure level
LWdTdt LW heating rate at pressure level
SWdTdt SW heating rate at pressure level
TotdTdt Total (LW+SW) heating rate at pressure level
Parameters given in Radout.txt output file in addition to plot variables, Var_X and, optionally, Var_Y are:
albsfc Surface albedo (interpolated from file albedo1.txt)
tau Total vertical dust optical depth (for solar wavelengths)
RadAU Mars orbital radius (AU)
mu0 Cosine of solar zenith angle
ice 0 for no ice on the surface, 1 for ice on the surface
Tsfc Ground surface temperature (K)
Fusfc Upwelling LW flux at surface (W/m2)
Tsky Equivalent sky temperature (K)
Fdsfc Downwelling LW flux at surface (W/m2)
Teff Effective black-body temperature at top-of atmosphere (K)
Futoa Upwelling LW flux at top-of-atmosphere (W/m2)
Edsfc Downwelling SW flux at surface (W/m2)
Eusfc Upwelling SW flux at surface (W/m2)
Edtoa Solar flux at toa = mu0*(solar constant)/RadAU2 (W/m2)
Eutoa Upwelling SW flux at top-of-atmosphere (W/m2)
Planalb Planetary albedo = ratio Eutoa/Edtoa
thet Solar zenith angle (degrees)
Tdif Diffuse transmittance for diffuse irradiance
Tdir Diffuse transmittance for beam irradiance
Tbeam Beam transmittance

75
Program radtraj
Radtraj.f90 is a special trajectory building program to compute vertical profiles at latitude-lon-gitude, latitude-time, or longitude-time cross sections, for input to Mars-GRAM runs to produce output for input to marsrad radiation calculations. The radtraj.f90 program is similar in function and use to the BLDTRAJ.f90 trajectory building program, except that radtraj.f90 is especially designed for use in conjunction with Mars-GRAM runs for which radiation calculations are to be done by the marsrad.f90 program.
Program radtraj.f90 produces a trajectory file consisting of sets of vertical profiles that are con-strained to start at the surface by automatically setting z1 = -10. Any heights that are below the surface are automatically ignored by the marsrad.f90 program. Any upper height z2 and height step dz may be used for the height profiles. However, it is not necessary to use z2 higher than about 30.km. The input time step if other than zero applies only as the trajectory goes from one vertical profile to the next.

76
REFERENCES
1. Lyons, D.T.; Beerer, J.G.; Esposito, P.; and Johnson, M.D.: “Mars Global Surveyor: Aerobrak-ing Overview,” Journal of Spacecraft and Rockets, Vol. 36, No. 3, pp. 307–313, 1999.
2. Gnoffo, P.A.; Braun, R.D.; Weilmuenster, K.J.; et al.: “Prediction and Validation of Mars Pathfinder Hypersonic Aerodynamic Database,” Journal of Spacecraft and Rockets, Vol. 36, No. 3, pp. 367–373, 1999.
3. Queen, E.M.; Cheatwood, F.M.; Powell, R.W.; and Braun, R.D.: “Mars Polar Lander Aero-thermodynamic and Entry Dispersion Analysis,” Journal of Spacecraft and Rockets, Vol. 36, No. 3, pp. 421–428, 1999.
4. Justus, C.G.: “Mars Global Reference Atmospheric Model for Mission Planning and Analy-sis,” Journal of Spacecraft and Rockets, Vol. 28, No. 2, pp. 216–221, 1991.
5. Justus, C.G.; James, B.F.; and Johnson, D.L.: “Mars Global Reference Atmospheric Model (Mars-GRAM 3.34): Programmer’s Guide,” NASA Technical Memorandum 108509, Marshall Space Flight Center, AL, 1996.
6. Justus, C.G.; Johnson, D.L.; and James, B.F.: “A Revised Thermosphere for the Mars Global Reference Atmospheric Model (Mars-GRAM Version 3.4),” NASA Technical Memorandum 108513, Marshall Space Flight Center, AL, 61 pp., 1996.
7. Justus, C.G.; James, B.F.; and Johnson, D.L.: “Recent and Planned Improvements in the Mars Global Reference Atmospheric Model (Mars-GRAM),” Advances in Space Research, Vol. 19, No. 8, pp. 1223–1231, 1997.
8. Justus, C.G.; and James, B.F.: “Mars Global Reference Atmospheric Model (Mars-GRAM) Version 3.8: Users Guide,” NASA/TM—1999–209629, Marshall Space Flight Center, May 1999.
9. Justus, C.G.; and James, B.F.: “Mars Global Reference Atmospheric Model 2000 Version (Mars-GRAM 2000): Users Guide,” NASA/TM—2000–210279, Marshall Space Flight Center, March 2000.
10. Haberle, R.M.; Pollack, J.B.; Barnes, J.R.; et al.: “Mars Atmospheric Dynamics as Simulated by the NASA Ames General Circulation Model 1. The Zonal-Mean Circulation,” Journal of Geophysical Research, Vol. 98, No. E2, pp. 3093–3123, 1993.

77
11. Barnes, J.R.; Pollack, J.B.; Haberle, R.M.; et al.: “Mars Atmospheric Dynamics as Simulated by the NASA Ames General Circulation Model 2. Transient Baroclinic Eddies,” Journal of Geophysical Research, Vol. 98, No. E2, pp. 3125–3148, 1993.
12. Bougher, S.W.; Roble, R.G.; Ridley, E.C.; et al.: “The Mars Thermosphere: 2. General Circula-tion with Coupled Dynamics and Composition,” Journal of Geophysical Research, Vol. 95, No. B9, pp. 14811–14827, 1990.
13. Bougher, S.W.; Engel, S.; Roble, R.G.; and Foster, B.: “Comparative Terrestrial Planet Thermospheres. 2. Solar Cycle Variation of Global Structure and Winds at Equinox,” Journal of Geophysical Research, Vol. 104, No. E7, pp. 16,591–16,611, 1999.
14. Striepe, S.A.; and Balaram, B.: “Mars Smart Lander Simulations for Entry, Descent, and Landing,” Abstract AIAA Paper 2002-4412, AIAA Atmospheric Flight Mechanics Conference and Exhibit, Monterey, CA, August 2002.
15. Justus C.G.; Duvall, A.; and Keller, V.W.: “Mars Aerocapture and Validation of Mars-GRAM with TES Data,” 53rd Joint Army-Navy-NASA-Air Force (JANNAF) Propulsion Meeting, December 5–8, 2005.
16. Smith M.D.: “Interannual Variability in TES Atmosphere Observations of Mars during 1999-2003,” Icarus, Vol. 167, pp. 148–165, 2004.
17. Justh, H.L.; Justus, C.G.; and Ramey, H.S.: “Mars-GRAM 2010: Improving the Precision of Mars-GRAM,” Fourth International Workshop on the Mars Atmosphere: Modeling and Observations, Paris, France, February 8–11, 2011.
18. Smith, D.E.; and Zuber, M.T.: “The Relationship Between MOLA Northern Hemisphere Topography and the 6.1-mbar Atmospheric Pressure Surface of Mars.” Geophysical Research Letters, Vol. 25, No. 24, pp. 4397–4400, 1998.
19. Zuber, M.T.; Smith, D.E.; Phillips, R.J.; et al.: “Shape of the Northern Hemisphere of Mars from the Mars Orbiter Laser Altimeter,” Geophysical Research Letters, Vol. 25, No. 24, pp. 4393–4396, 1998.
20. Smith, D.E.; Zuber, M.T.; Solomon, S.C.; et al.: “The Global Topography of Mars and Impli-cations for Surface Evolution,” Science, Vol. 284, pp. 1495–1503, 1999.
21. Haberle, R.M.; Joshi, M.M.; Murphy, J.R.; et al.: “General Circulation Model Simulations of the Mars Pathfinder Atmospheric Structure Investigation/Meteorology Data,” Journal of Geophysical Research, Vol. 104, No. E4, pp. 8957–8974, 1999.
22. Haberle, R.M.; Hourbin, H.C.; Hertenstein, R.; and Herdtle, T.: “A Boundary-layer Model for Mars: Comparisons with Viking Lander and Entry Data,” Journal of Atmospheric Sci-ences, Vol. 50, No. 11, pp. 1544–1559, 1993.
78
23. Keating, G.M.; et al.: “The Structure of the Upper Atmosphere of Mars: In Situ Accelerom-eter Measurements from Mars Global Surveyor,” Science, Vol. 279, No. 5357, pp. 1672–1676, 1998.
24. Bridger, A.F.C.: “Stationary Wave Activity Simulated by the NASA Ames MGCM Incorpo-rating New MOLA Topography Data,” Fifth International Conference on Mars, Pasadena, CA, July 18–23, 1999.
25. Bougher, S.; Keating, G.; Zurek, R.; et al.: “Mars Global Surveyor Aerobraking: Atmospheric Trends and Model Interpretation,” Advanced Space Research, Vol. 23, No. 11, pp. 1887–1897, 1999.
26. Joshi, M.M.; Hollingsworth, J.L.; Haberle, R.M.; and Bridger, A.F.C.: “An Interpretation of Martian Thermospheric Waves Based on Analysis of a General Circulation Model,” eophysical Research Letters, Vol. 27, No. 5, pp. 613–616, 2000.
27. Haberle, R.M.; Leovy, C.B.; and Pollack, J.B.: “Some Effects of Global Dust Storms on the Atmospheric Circulation of Mars,” Icarus, Vol. 50, pp. 322–367, 1982.
28. Kieffer, H.H.; Martin, T.Z.; Peterfreund, A.R.; et al.: “Thermal and Albedo Mapping of Mars During the Viking Primary Mission,” Journal of Geophysical Research, Vol. 82, No. 28, pp. 4249–4281, 1977.
29. Paige, D.A.; Bachman, J.E.; and Keegan, K.D.: “Thermal and Albedo Mapping of the Polar Regions of Mars Using Viking Thermal Mapper Observations,” Journal of Geophysical Research, Vol. 99, No. E12, pp. 25959–25991, 1994.
30. Ye, Z.J.; Segal, M.; and Pielke, R.A.: “A comparative study of daytime thermally induced upslope flow on Mars and Earth,” Journal of the Atmospheric Sciences, Vol. 47, No. 5, pp. 612–628, 1990.
31. Pitts, D.E., Tillman; J.E.; Johnson, N.C.; et al.: “The Mars Atmosphere: Observations and Model Profiles for Mars Missions,” NASA JSC-24455, NASA Johnson Space Center, TX, 1991.
32. Savijarvi, H.: “Radiative Fluxes on a Dustfree Mars,” Contributions to Atmospheric Physics, Vol. 64, No. 2, pp. 103–112, 1991.
33. Staley, D.O.; and Jurica, G.M.: “Flux Emissivity Tables for Water Vapor, Carbon Dioxide and Ozone,” Journal of Applied Meteorology, Vol. 9, pp. 365–372, 1970.
34. Joseph, J.H.; Wiscombe, W.J.; and Weinman, J.A.: “The Delta-Eddington Approximation for Radiative Flux Transfer,” Journal of Atmospheric Sciences, Vol. 33, No. 12, pp. 2452–2459, 1976.

79
35. Murphy, J.R. et al., Journal of Geophysical Research, Vol. 98, No. E2, pp. 3197–3220, February 25, 1993.

80
REPORT DOCUMENTATION PAGE Form ApprovedOMB No. 0704-0188
The public reporting burden for this collection of information is estimated to average 1 hour per response, including the time for reviewing instructions, searching existing data sources, gathering and maintaining the data needed, and completing and reviewing the collection of information. Send comments regarding this burden estimate or any other aspect of this collection of information, including suggestions for reducing this burden, to Department of Defense, Washington Headquarters Services, Directorate for Information Operation and Reports (0704-0188), 1215 Jefferson Davis Highway, Suite 1204, Arlington, VA 22202-4302. Respondents should be aware that notwithstanding any other provision of law, no person shall be subject to any penalty for failing to comply with a collection of information if it does not display a currently valid OMB control number.PLEASE DO NOT RETURN YOUR FORM TO THE ABOVE ADDRESS.
1. REPORT DATE (DD-MM-YYYY) 2. REPORT TYPE 3. DATES COVERED (From - To)
4. TITLE AND SUBTITLE 5a. CONTRACT NUMBER
5b. GRANT NUMBER
5c. PROGRAM ELEMENT NUMBER
6. AUTHOR(S) 5d. PROJECT NUMBER
5e. TASK NUMBER
5f. WORK UNIT NUMBER
7. PERFORMING ORGANIZATION NAME(S) AND ADDRESS(ES) 8. PERFORMING ORGANIZATION REPORT NUMBER
9. SPONSORING/MONITORING AGENCY NAME(S) AND ADDRESS(ES) 10. SPONSORING/MONITOR’S ACRONYM(S)
11. SPONSORING/MONITORING REPORT NUMBER
12. DISTRIBUTION/AVAILABILITY STATEMENT
13. SUPPLEMENTARY NOTES
14. ABSTRACT
15. SUBJECT TERMS
16. SECURITY CLASSIFICATION OF:a. REPORT b. ABSTRACT c. THIS PAGE
17. LIMITATION OF ABSTRACT 18. NUMBER OF PAGES
19a. NAME OF RESPONSIBLE PERSON
19b. TELEPHONE NUMBER (Include area code)
Standard Form 298 (Rev. 8-98)Prescribed by ANSI Std. Z39-18
Mars Global Reference Atmospheric Model 2010 Version:Users Guide
H.L. Justh
George C. Marshall Space Flight CenterHuntsville, AL 35812
National Aeronautics and Space AdministrationWashington, DC 20546–0001
Unclassified-UnlimitedSubject Category 18Availability: NASA STI Information Desk (757–864–9658)
Prepared by the Spacecraft & Vehicle Systems Department, Engineering Directorate
M–1375
Technical Memorandum
NASA/TM—2014–217499
Mars Global Reference Atmospheric Model, Mars-GRAM, Mars, atmospheric density, atmospheric temperature, atmospheric models, winds
01–02–2014
UU 96
NASA
U U U
This Technical Memorandum (TM) presents the Mars Global Reference Atmospheric Model 2010 (Mars-GRAM 2010) and its new features. Mars-GRAM is an engineering-level atmospheric model widely used for diverse mission applications. Applications include systems design, performance analysis, and operations planning for aerobraking, entry, descent and landing, and aerocapture. Additionally, this TM includes instructions on obtaining the Mars-GRAM source code and data files as well as running Mars-GRAM. It also contains sample Mars-GRAM input and output files and an example of how to incorporate Mars-GRAM as an atmospheric subroutine in a trajectory code.
STI Help Desk at email: [email protected]
STI Help Desk at: 757–864–9658


National Aeronautics andSpace AdministrationIS20George C. Marshall Space Flight CenterHuntsville, Alabama 35812


![Assimilating martian atmospheric constituents using a ... · Mars Climate Sounder (MCS) observations from NASA Mars Reconnaissance Orbiter (MRO ... (2004) JGR 109, 7004. [3] Lefèvre,](https://static.fdocuments.net/doc/165x107/5b3513497f8b9a6b548cc8ff/assimilating-martian-atmospheric-constituents-using-a-mars-climate-sounder.jpg)