Marine Recreational Information Program Transition Plan ... FES Transition... · Marine...
35
U.S. Department of Commerce | National Oceanic and Atmospheric Administration | National Marine Fisheries Service Marine Recreational Information Program Transition Plan for the Fishing Effort Survey Prepared by the Atlantic and Gulf Subgroup of the Marine Recreational Information Program Transition Team May 5, 2015
Transcript of Marine Recreational Information Program Transition Plan ... FES Transition... · Marine...
U.S. Department of Commerce | National Oceanic and Atmospheric Administration | National Marine Fisheries Service
Marine Recreational Information Program
Transition Plan for the Fishing Effort Survey Prepared by the Atlantic and Gulf Subgroup of the Marine Recreational Information Program Transition Team
May 5, 2015

Transition Plan for the Fishing Effort Survey 2
Table of Contents
I. Executive Summary ................................................................................... 3
II. Introduction and Purpose .......................................................................... 5
III. Fishing Effort Survey Transition Timeline .................................................. 9
IV. Potential Stock Assessment Impacts and Schedule ................................ 13
V. Potential Management Impacts and Schedule ........................................ 14
VI. Identification of Unknowns ...................................................................... 15
VII. Further Experiments ................................................................................ 16
VIII. Lessons Learned from Improved Catch Survey Implementation ............. 17
IX. Appendices .............................................................................................. 20
1. Gantt Chart with Descriptive Timeline ................................................. 21
2. Key Stocks with Initial Priority Ranking .............................................. 22
3. Long-Term Transition Communications Strategy ................................. 29
4. List of Previous Pilot Studies and Links to Final Reports .................... 34
5. Transition Team Atlantic and Gulf Subgroup Representatives List ...... 35

Transition Plan for the Fishing Effort Survey 3
I. Executive Summary In this plan, an Atlantic and Gulf coast Subgroup (henceforth, Subgroup) of the Marine Recreational Information Program’s (MRIP) Transition Team details a comprehensive three-year timeline for transitioning from the current Coastal Household Telephone Survey (CHTS) conducted on the Atlantic coast and in the Gulf of Mexico to a new mail survey design for estimating marine recreational shore and private boat fishing effort, known as the Fishing Effort Survey (FES). All members of the Subgroup agree the timeline presented in this document is the most efficient and scientifically sound approach to implement the FES.
Since 2008, MRIP has conducted six pilot studies to determine the most accurate and efficient survey to estimate marine recreational fishing effort on the Atlantic and Gulf coasts. The most recent study, conducted in four states (Massachusetts, New York, North Carolina, and Florida) in 2012-2013, compared a new mail survey design for estimating recreational shore and private boat fishing effort with the CHTS design that has been used on the Atlantic coast and in the Gulf of Mexico since 1979. MRIP subjected the final report from the pilot project to external peer review in 2014 and certified the new survey design in February 2015 as a suitable replacement for the CHTS. The FES is much less susceptible to potential sources of bias than the CHTS. The new mail survey design can reach more anglers, achieve higher response rates, and is less prone to possible recall errors. The pilot project results indicated that FES estimates are on average 2.6 times higher than CHTS estimates for private boat fishing and 6.1 times higher for shore fishing. Because there are consistent differences in the results of the two surveys, the National Oceanic and Atmospheric Administration’s (NOAA) National Marine Fisheries Service (NOAA Fisheries) recognized the FES cannot be implemented immediately as a replacement for the CHTS, and a well thought out transition plan is needed to ensure that the phase-in of the FES:
• Is appropriately integrated into ongoing stock assessments and fisheries management actions in a way that minimizes disruptions to these processes, which are based on input from multiple data sources over lengthy time series;
• Creates a replicable process for implementing new or improved scientific methods into fisheries science, stock assessment, and management;
• Supports the Recreational Fisheries Policy goals and guiding principles to foster, support, and enhance a broadly accessible and diverse array of sustainable saltwater recreational fisheries and builds stakeholder support, understanding, and engagement in implementing the new survey; and
• Advances the mission of NOAA Fisheries to ensure the sustainability of our Nation’s living marine resources.
Transition Plan for the Fishing Effort Survey 4
In 2014, MRIP formed a Transition Team composed of representatives from NOAA Fisheries, the regional fishery management councils, the interstate marine fisheries commissions, and several state agencies to develop appropriate plans for transitioning from legacy survey designs to new, improved survey designs. A subset of the Transition Team representing the Atlantic coast and the Gulf of Mexico, or Subgroup, was formed to consider different timelines for the number of years of side-by-side benchmarking required before catch estimates based on the FES would be used for management decisions and the CHTS can be terminated. After reviewing the pros and cons of alternatives, the Subgroup recommended the three-year timeline described in this Transition Plan and approved by NOAA Fisheries leadership.
This Transition Plan outlines the necessary steps and activities needed to ensure a smooth transition to the new survey method, while taking the necessary time and effort to properly incorporate new estimates into the science and management processes. During the transition period, fishery management agencies will continue to use analyses based on the CHTS data as the “best available” science to effectively manage the health of fish stocks and marine ecosystems.
The Transition Plan calls for side-by-side benchmarking of the FES against the CHTS for three years (2015-2017) with the development and application of a calibration model to revise historical catch statistics after the second year. With this timeline, new estimates will be incorporated into stock assessments during 2017 using preliminary calibrations of historical landings, and setting of new Annual Catch Limits (ACLs) in 2018 for at least some stocks (See Appendix 1). The Plan does not allow for any extension of the benchmarking beyond three years, so the needed changes in stock assessment schedules can be set.
In response to recreational fishing survey design improvements and a recognized need to appropriately transition from current to new surveys, a MRIP Transition Team was formed to develop and recommend standardized processes for transitioning from historical estimates to estimates derived from improved sampling and estimation designs. The Transition Team comprises representatives from NOAA Fisheries, the regional fishery management councils, the interstate marine fisheries commissions, and several state agencies. In order for a new survey method to be implemented, historical catch statistics would first need to be converted into the same ‘currency’ as the new estimates; MRIP charged the Transition Team with the planning and execution of appropriate transition plans to ensure this happens. It is critical to establish processes that will enable scientists and fishery managers to make “apples to apples”
comparisons between new and historical catch statistics, providing a framework that decision-makers can use for integrating new data into science and management activities at the regional and state level. The Team will play an important role in coordinating consistent approaches and methods for Councils, Interstate Commissions, and NOAA Fisheries Regions to apply to recreational catch estimates derived from new or improved survey designs for:
• Determining the status of exploited stocks;
• Setting annual catch limits;
• Monitoring catch against catch limits;
• Assessing the need for and selection of accountability measures; and
• Conducting analyses leading to the adoption of recreational fishing regulations.
Role of Transition Team
Transition Plan for the Fishing Effort Survey 5
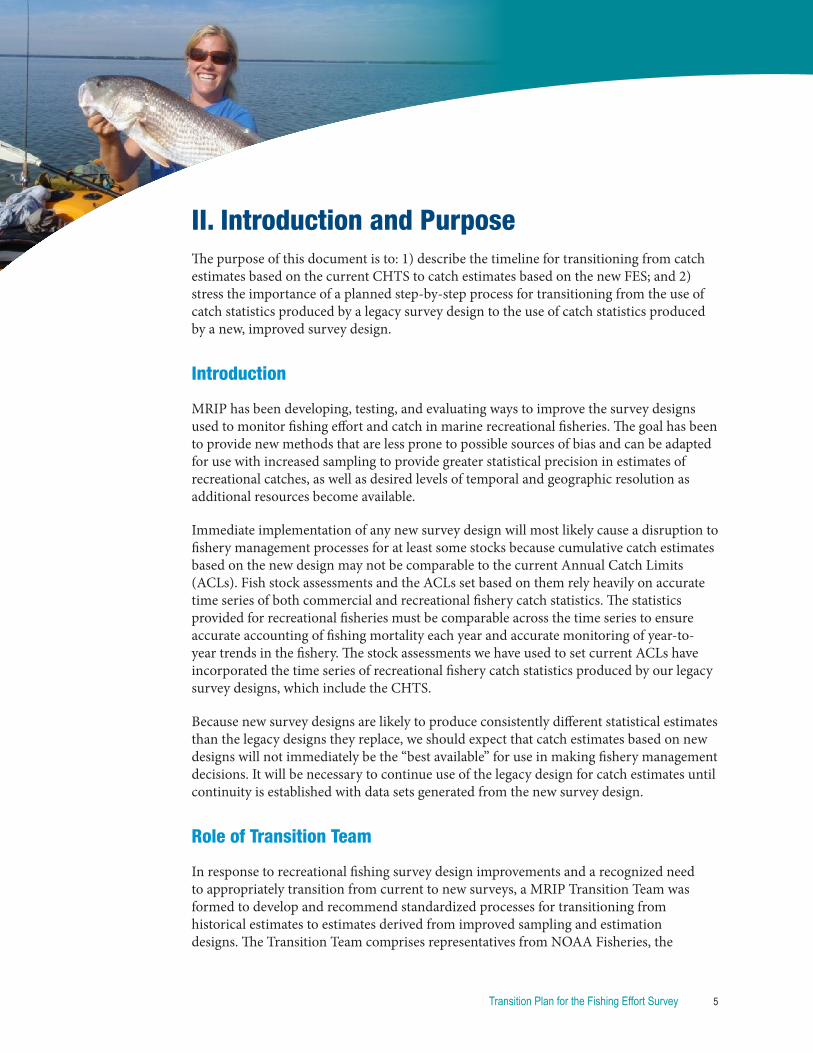
II. Introduction and PurposeThe purpose of this document is to: 1) describe the timeline for transitioning from catch estimates based on the current CHTS to catch estimates based on the new FES; and 2) stress the importance of a planned step-by-step process for transitioning from the use of catch statistics produced by a legacy survey design to the use of catch statistics produced by a new, improved survey design.
Introduction
MRIP has been developing, testing, and evaluating ways to improve the survey designs used to monitor fishing effort and catch in marine recreational fisheries. The goal has been to provide new methods that are less prone to possible sources of bias and can be adapted for use with increased sampling to provide greater statistical precision in estimates of recreational catches, as well as desired levels of temporal and geographic resolution as additional resources become available.
Immediate implementation of any new survey design will most likely cause a disruption to fishery management processes for at least some stocks because cumulative catch estimates based on the new design may not be comparable to the current Annual Catch Limits (ACLs). Fish stock assessments and the ACLs set based on them rely heavily on accurate time series of both commercial and recreational fishery catch statistics. The statistics provided for recreational fisheries must be comparable across the time series to ensure accurate accounting of fishing mortality each year and accurate monitoring of year-to-year trends in the fishery. The stock assessments we have used to set current ACLs have incorporated the time series of recreational fishery catch statistics produced by our legacy survey designs, which include the CHTS.
Because new survey designs are likely to produce consistently different statistical estimates than the legacy designs they replace, we should expect that catch estimates based on new designs will not immediately be the “best available” for use in making fishery management decisions. It will be necessary to continue use of the legacy design for catch estimates until continuity is established with data sets generated from the new survey design.
Role of Transition Team
In response to recreational fishing survey design improvements and a recognized need to appropriately transition from current to new surveys, a MRIP Transition Team was formed to develop and recommend standardized processes for transitioning from historical estimates to estimates derived from improved sampling and estimation designs. The Transition Team comprises representatives from NOAA Fisheries, the
Transition Plan for the Fishing Effort Survey 6
regional fishery management councils, the interstate marine fisheries commissions, and several state agencies. In order for a new survey method to be implemented, historical catch statistics would first need to be converted into the same ‘currency’ as the new estimates; MRIP charged the Transition Team with the planning and execution of appropriate transition plans to ensure this happens. It is critical to establish processes that will enable scientists and fishery managers to make “apples to apples” comparisons between new and historical catch statistics, providing a framework that decision-makers can use for integrating new data into science and management activities at the regional and state level. The Team will play an important role in coordinating consistent approaches and methods for Councils, Interstate Commissions, and NOAA Fisheries Regions to apply to recreational catch estimates derived from new or improved survey designs for:
• Determining the status of exploited stocks;
• Setting annual catch limits;
• Monitoring catch against catch limits;
• Assessing the need for and selection of accountability measures; and
• Conducting analyses leading to the adoption of recreational fishing regulations.
General Transition Approach
There are several steps that must be taken before estimates based on any new design can be used effectively in the management process.
1. Benchmarking: The newly designed survey should be conducted side-by-side with the legacy survey to allow measurement and evaluation of consistent differences in the statistical estimates produced. During this benchmarking period, statistical estimates produced by the legacy design are the “best available” for use in monitoring catches relative to ACLs and making management decisions.
2. Calibration model development: Consistent differences between new design and legacy design estimates should be evaluated to determine possible sources of bias in the legacy design to explain those differences. In addition, literature research should be conducted to assess how biases identified in the legacy design would most likely have changed over time. Based on the information gained, one or more calibration models should be developed and evaluated for possible use in correcting past catch statistics. Alternative models should be considered and one should be selected and defended as the most appropriate, validated by an external peer review.
3. Re-estimation of historical catch statistics: Once a calibration model has been proposed, peer reviewed, and approved, the model should be used to generate a corrected time series of recreational catch statistics. The revised time series should immediately be made available to stock assessment scientists and fishery managers.
4. Incorporation of new estimates into stock assessments: The revised catch statistics should be incorporated into stock assessments as soon as possible to provide the most accurate assessments of stock status and provide new ACLs for use in fisheries management. Stocks with very substantial mortality levels due to recreational fishing (high proportion of total mortality relative to that caused by commercial fishing)

Transition Plan for the Fishing Effort Survey 7
should be identified as “key stocks” and prioritized for assessment scheduling. Depending on the magnitude of the estimation changes and potential disruption of the management process, assessments scheduled for key stocks may have to be moved to earlier dates while those scheduled for non-key stocks are moved to later dates.
5. Incorporation of new estimates and ACLs into management actions: Once revised catch statistics and new assessment results become available, management should begin to use both for decision making as soon as possible. If revised statistics are available but new assessments are not, then managers may need to continue using the statistics based on the legacy design until new assessment results are available. In years when the legacy design is no longer being conducted, the approved calibration model would be used to convert catch estimates based on the new design into estimates that are compatible with the legacy design for use in management.
New Fishing Effort Survey
In 2012, MRIP conducted a pilot study in four states that compared a new mail survey design for estimating recreational shore and private boat fishing effort with the CHTS design that has been used on the Atlantic coast and in the Gulf of Mexico since 1979. MRIP subjected the final report from the pilot project to external peer review in 2014 and certified the new survey design in February 2015 as a suitable replacement for the CHTS. MRIP has named the new survey the Fishing Effort Survey (FES), and it is much less susceptible to potential sources of bias than the CHTS. It can reach more anglers, can achieve higher response rates, and is less prone to possible recall errors.
The FES was tested in Massachusetts, New York, North Carolina, and Florida to estimate fishing effort in September 2012 through December 2013. The design is a single phase, dual-frame, self-administered mail survey. The two frames used for sampling coastal state residents are: 1) the U.S. Postal Service (USPS) Delivery Sequence File, which includes all residential addresses serviced by the USPS; and 2) the list of mailing addresses provided by licensed or registered anglers that is derived from the MRIP National Saltwater Angler Registry (NSAR). To improve survey efficiency, the design matches samples of USPS addresses to the list of NSAR addresses. Matching addresses are sampled at a higher rate and the resultant data are appropriately weighted. The pilot project results indicated the mail survey estimates are on average 2.6 times higher than CHTS estimates for private boat fishing and 6.1 times higher for shore fishing. More detailed information comparing the FES to the CHTS can be found at: http://www.st.nmfs.noaa.gov/Assets/recreational/pdf/2012-FES_w_review_and_comments_FINAL.pdf.
Need for FES Transition Plan
Because there are consistent differences in the results of the two surveys, NOAA Fisheries determined that the FES should not be implemented immediately as a replacement for the CHTS. A well thought out Transition Plan is essential to ensure the FES is appropriately phased in with minimum disruptions to stock assessment and fisheries management processes. Research studies should continue in parallel with this transition process to better understand and explain differences between the simultaneous estimates produced by the FES and the CHTS. Stakeholders will want to know why catch estimates are being
Transition Plan for the Fishing Effort Survey 8
revised and will need a clear explanation of why the new numbers are more accurate than the ones replaced.
To develop a Transition Plan for implementation of the FES on the Atlantic and Gulf of Mexico (Gulf) coasts, the Subgroup met weekly, discussing all potential options of the best approach for a smooth transition and incorporation of new estimates into the stock assessment and management processes. This plan provides a description of the potential methods to be used to:
• Compare legacy estimates to estimates produced by using the new FES in a statistically robust manner;
• Determine when calibration or other means of linking legacy data sets with the new FES estimates is feasible and necessary, and identify the requirements and methods for making such linkages; and
• Minimize disruptions to stock assessments, catch monitoring, and management regulations, and facilitate decisions on when and how implementation of the FES is introduced.
Transition Planning and Best Scientific Information Available
The Magnuson-Stevens Fisheries Conservation and Management Act is the principal law governing marine fisheries in the U.S., and it includes ten National Standards to guide fishery conservation and management. One of these standards, referred to as National Standard 2, guides scientific integrity and states that “conservation and management measures shall be based upon the best scientific information available.” The Magnuson-Stevens Fishery Conservation and Management Reauthorization Act of 2007 added provisions to improve the use of science in decision-making. One of the revisions specified that the Secretary of Commerce and councils must establish a peer review process for scientific information used to advise councils on the conservation and management of fisheries.
Catch estimates based on the new FES design will only be the “best available” for management use after historical catch estimates have been appropriately adjusted to the new design and incorporated into stock assessments and the setting of management measures. Until historic catch date is adjusted to be compatible with the FES and results incorporated into ACLs and other management reference points, estimates based on the CHTS will continue to be the “best available.”
Transition Plan for the Fishing Effort Survey 9
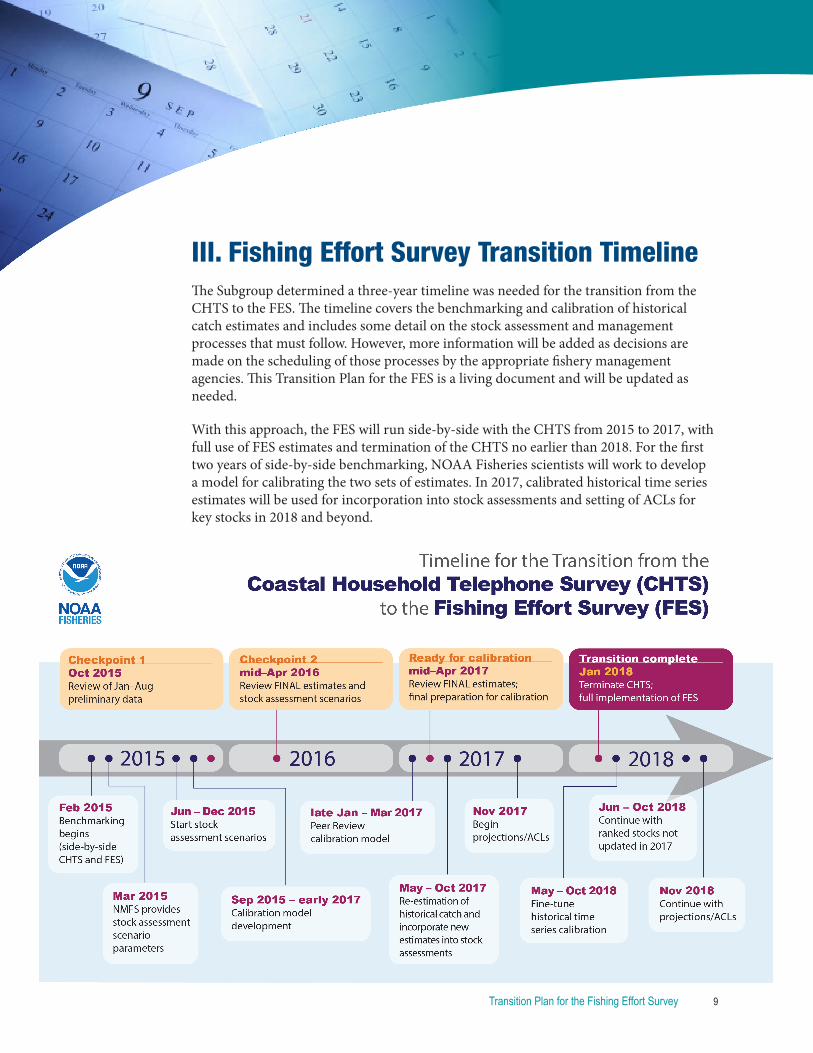
III. Fishing Effort Survey Transition Timeline The Subgroup determined a three-year timeline was needed for the transition from the CHTS to the FES. The timeline covers the benchmarking and calibration of historical catch estimates and includes some detail on the stock assessment and management processes that must follow. However, more information will be added as decisions are made on the scheduling of those processes by the appropriate fishery management agencies. This Transition Plan for the FES is a living document and will be updated as needed.
With this approach, the FES will run side-by-side with the CHTS from 2015 to 2017, with full use of FES estimates and termination of the CHTS no earlier than 2018. For the first two years of side-by-side benchmarking, NOAA Fisheries scientists will work to develop a model for calibrating the two sets of estimates. In 2017, calibrated historical time series estimates will be used for incorporation into stock assessments and setting of ACLs for key stocks in 2018 and beyond.
Transition Plan for the Fishing Effort Survey 10
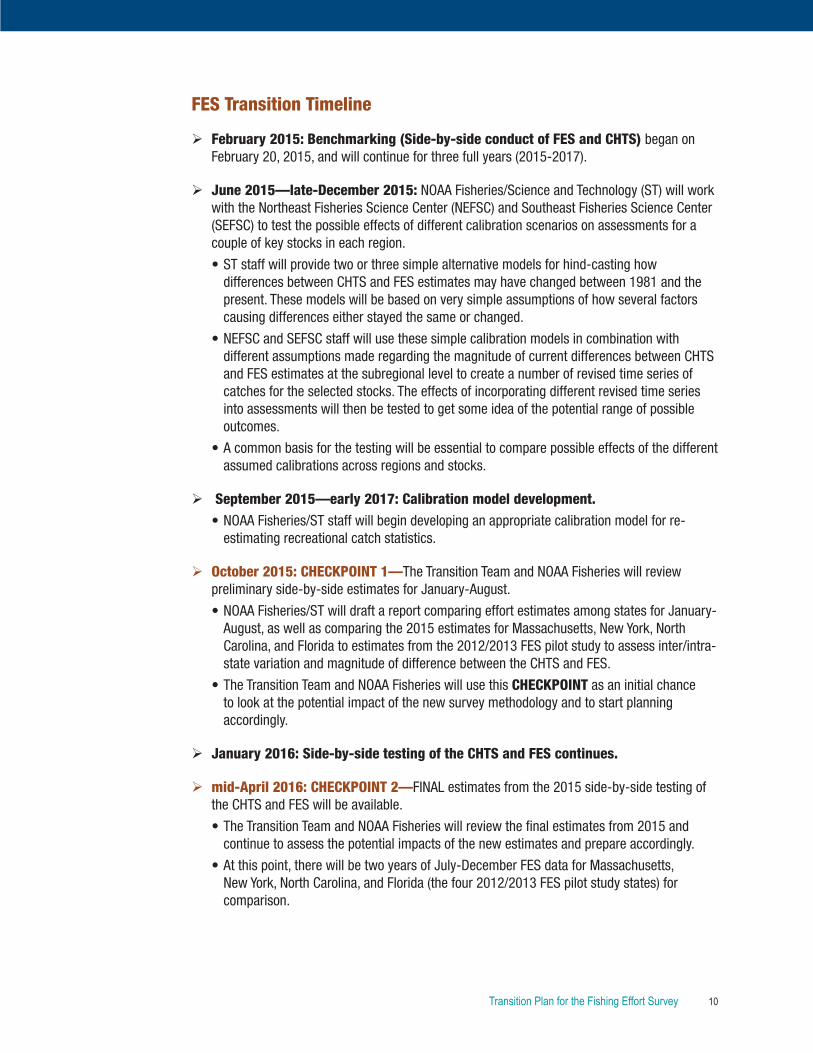
FES Transition Timeline
¾ February 2015: Benchmarking (Side-by-side conduct of FES and CHTS) began on February 20, 2015, and will continue for three full years (2015-2017).
¾ June 2015—late-December 2015: NOAA Fisheries/Science and Technology (ST) will work with the Northeast Fisheries Science Center (NEFSC) and Southeast Fisheries Science Center (SEFSC) to test the possible effects of different calibration scenarios on assessments for a couple of key stocks in each region.
•ST staff will provide two or three simple alternative models for hind-casting how differences between CHTS and FES estimates may have changed between 1981 and the present. These models will be based on very simple assumptions of how several factors causing differences either stayed the same or changed.
•NEFSC and SEFSC staff will use these simple calibration models in combination with different assumptions made regarding the magnitude of current differences between CHTS and FES estimates at the subregional level to create a number of revised time series of catches for the selected stocks. The effects of incorporating different revised time series into assessments will then be tested to get some idea of the potential range of possible outcomes.
•A common basis for the testing will be essential to compare possible effects of the different assumed calibrations across regions and stocks.
¾ September 2015—early 2017: Calibration model development.•NOAA Fisheries/ST staff will begin developing an appropriate calibration model for re-
estimating recreational catch statistics.
¾ October 2015: CHECKPOINT 1—The Transition Team and NOAA Fisheries will review preliminary side-by-side estimates for January-August.
•NOAA Fisheries/ST will draft a report comparing effort estimates among states for January-August, as well as comparing the 2015 estimates for Massachusetts, New York, North Carolina, and Florida to estimates from the 2012/2013 FES pilot study to assess inter/intra-state variation and magnitude of difference between the CHTS and FES.
•The Transition Team and NOAA Fisheries will use this CHECKPOINT as an initial chance to look at the potential impact of the new survey methodology and to start planning accordingly.
¾ January 2016: Side-by-side testing of the CHTS and FES continues.
¾ mid-April 2016: CHECKPOINT 2—FINAL estimates from the 2015 side-by-side testing of the CHTS and FES will be available.
•The Transition Team and NOAA Fisheries will review the final estimates from 2015 and continue to assess the potential impacts of the new estimates and prepare accordingly.
•At this point, there will be two years of July-December FES data for Massachusetts, New York, North Carolina, and Florida (the four 2012/2013 FES pilot study states) for comparison.
Transition Plan for the Fishing Effort Survey 11
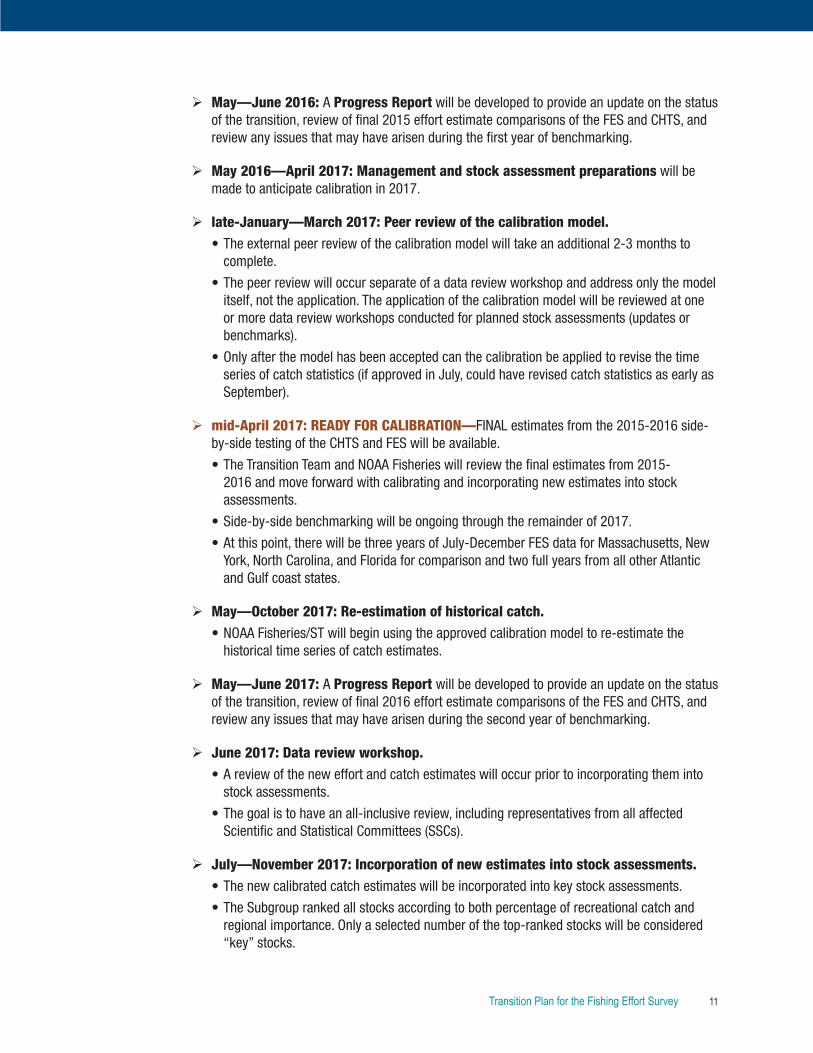
¾ May—June 2016: A Progress Report will be developed to provide an update on the status of the transition, review of final 2015 effort estimate comparisons of the FES and CHTS, and review any issues that may have arisen during the first year of benchmarking.
¾ May 2016—April 2017: Management and stock assessment preparations will be made to anticipate calibration in 2017.
¾ late-January—March 2017: Peer review of the calibration model.•The external peer review of the calibration model will take an additional 2-3 months to
complete.
•The peer review will occur separate of a data review workshop and address only the model itself, not the application. The application of the calibration model will be reviewed at one or more data review workshops conducted for planned stock assessments (updates or benchmarks).
•Only after the model has been accepted can the calibration be applied to revise the time series of catch statistics (if approved in July, could have revised catch statistics as early as September).
¾ mid-April 2017: READY FOR CALIBRATION—FINAL estimates from the 2015-2016 side-by-side testing of the CHTS and FES will be available.
•The Transition Team and NOAA Fisheries will review the final estimates from 2015-2016 and move forward with calibrating and incorporating new estimates into stock assessments.
•Side-by-side benchmarking will be ongoing through the remainder of 2017.
•At this point, there will be three years of July-December FES data for Massachusetts, New York, North Carolina, and Florida for comparison and two full years from all other Atlantic and Gulf coast states.
¾ May—October 2017: Re-estimation of historical catch.•NOAA Fisheries/ST will begin using the approved calibration model to re-estimate the
historical time series of catch estimates.
¾ May—June 2017: A Progress Report will be developed to provide an update on the status of the transition, review of final 2016 effort estimate comparisons of the FES and CHTS, and review any issues that may have arisen during the second year of benchmarking.
¾ June 2017: Data review workshop. •A review of the new effort and catch estimates will occur prior to incorporating them into
stock assessments.
•The goal is to have an all-inclusive review, including representatives from all affected Scientific and Statistical Committees (SSCs).
¾ July—November 2017: Incorporation of new estimates into stock assessments.•The new calibrated catch estimates will be incorporated into key stock assessments.
•The Subgroup ranked all stocks according to both percentage of recreational catch and regional importance. Only a selected number of the top-ranked stocks will be considered “key” stocks.
Transition Plan for the Fishing Effort Survey 12
•Based on staff availability and resources, as many key stocks as possible will be re-assessed at this time.
•Assessment updates, where possible, will: 1) not take into account any other new factors; 2) not review the FES itself; and 3) produce new results as expeditiously as possible.
•The purpose is to adequately prepare for what could potentially be very large changes in assessment results, even in terms of status determinations and rebuilding rates.
• ‘Fine-tuning’ of the calibration model and historical catch statistics can be done after the third year of benchmarking and data are available mid-2018.
¾ November 2017: Begin incorporation of new estimates and ACLs into management actions. •Assessment updates based on data collected in years 1 and 2 will be used to set ACLs for
2018 and beyond in FES currency.
•Projections of 2018+ catches will be based on revised historical catch statistics.
•FES-based catch statistics will be used for monitoring of catches in 2018 and beyond.
•FES-based catch statistics would be converted into CHTS-based statistics for use in management of stocks for which the 2018+ ACLs are based on older assessments that do not incorporate FES data. Such statistics would be estimated by applying a reverse calibration to FES estimates.
¾ January 2018: Terminate side-by-side testing after final November-December 2017 data collection.
¾ May 2018—October 2018: Fine-tune the historical time series based on a revised calibration that uses three years of side-by-side benchmarking comparisons after final estimates from 2017 become available.
¾ June—October 2018: Continue updating stocks that were not assessed in 2017 based on rankings.
This three-year timeline is needed to: 1) ensure development of a stable calibration that can account for interannual variability in the differences between FES and CHTS estimates; 2) allow time needed to prepare for stock assessment and management processes that will need to be accelerated to complete the incorporation of revised historical catch statistics within the desired time frame; and 3) allow further research needed to more fully explain the differences between the FES and CHTS effort estimates.

Transition Plan for the Fishing Effort Survey 13
IV. Potential Stock Assessment Impacts and ScheduleAs mentioned in the previous section, starting mid-2015, staff at the NEFSC and SEFSC will begin preliminary evaluations of the effects of hypothetical FES:CHTS calibration scenarios on the outcomes of the assessments for several key stocks in each region. This exercise will help identify any technical complications that may arise as well as the potential implications for management advice. This in turn will help inform the rate at which the remaining assessments can be updated and the level of review that may be warranted.
The Subgroup suggested using relatively simple FES:CHTS calibration scenarios that are based on inferred temporal changes in coverage by the CHTS and different magnitudes of current estimation differences based on the 2012/2013 FES pilot study. They also pointed out that the time series of adjusted catches should be extended as far back in time as possible, as there could be significantly different effects on the stock assessments if the CHTS effectiveness was constant or trended over time (e.g., owing to increased cell phone usage in recent years).
Once the results of these preliminary analyses are complete, it will be necessary to decide whether to do as many assessments as resources allow all at once, or to spread the assessments out with the normal schedule. It is likely that a sequential implementation of the revised data for the assessments would create some difficulties for managers because different species would be regulated based on the new and old estimates at the same time. The timeline and workload will need to account for both state and federally managed species and may differ among regions.
Overall, the costs and timing of revised stock assessments will depend on 1) the magnitude of changes and complexity of developing a temporally varying calibration model; 2) technical details of incorporating revised estimates into stock assessment models; 3) availability of resources to focus only on this effort; 4) the number of species to be assessed; and 5) the regional review processes. It is likely that not all stocks may be updated easily and there is the need to prioritize assessments (Appendix 2) and that, depending on the complexity, it may take two years or longer to run assessments. Additionally, there may be a regional split in the timeline due to differing assessment processes in each region.
At the earliest, revised catch statistics would be ready for use in stock assessments by October of the second year of side-by-side benchmarking (2017). If priority stocks are to be assessed first, the impacts of a gradual assessment schedule must be clearly

Transition Plan for the Fishing Effort Survey 14
communicated. Some stocks will be managed under the lower estimates (possibly with retrospective adjustments) while others will be at the higher, new FES estimates. The Subgroup has developed preliminary recommendations for stock assessment priorities. The priority rankings combine input from the management and science sub-groups and are intended to be used for future planning by the fishery management bodies and regional stock assessment processes. A table of key stocks with initial priority rankings can be found in Appendix 2.
V. Potential Management Impacts and ScheduleThe potential management impacts in the short term and long term are likely to be quite substantial given current management schedules for both federal and commission managed stocks with a recreational fishing component. Given the potential scheduling issues and increased staff workload, the Subgroup concluded the stocks with the largest recreational catch component should be done first, followed by other identified stocks based on their ranking and recommends addressing as many stocks as possible. Additionally, developing management schedules will be difficult and may vary within and among regions, with some stocks being more heavily impacted than others.
The user group and public perceptions of MRIP and any changes that may result from the revised recreational fishing effort estimates will be substantial, with some constituents having increased negative feelings regarding additional changes (i.e., the perception already exists among some that current MRIP estimates are already unrealistically high). It cannot be easily determined which is more likely, the pressure to incorporate estimates sooner than later or accepting that taking longer would ensure a more stable calibration. A clear communications strategy is vital to the success of the planned transition and must be incorporated. A broad communications strategy is provided in Appendix 3.
With the proposed schedule, the time for making decisions on 1) setting acceptable biological catches (ABC) and ACLs for stocks affected by the transition and 2) making potential allocation adjustments will need to be much shorter/compressed than the typical process. The transition timeline for management is abbreviated and optimistic (see Appendix 1), i.e., there is no room for delay or to work through unknown issues that may arise. For Fishery Management Councils it takes approximately one year to implement ACLs based on new assessment results; however, there have been a few occasions when this has occurred mid-year. For Commissions, their management cycle could allow for almost immediate change to their stocks’ quotas and they have the ability to modify mid-year.
A critical issue that must be anticipated is even if an assessment with newer higher recreational data produces higher ABCs, in an allocated fishery part of the increase will go to the recreational sector and part of the increase will go to the commercial sector. Thus, without allocation adjustments, substantial recreational restrictions might be triggered even if ABCs get substantially increased. There could be stock assessments that trigger allocation reviews and other assessments that do not, depending on the nature of existing allocations and the results of new assessments. There was also concern on how unassessed stocks would be affected. The Subgroup’s best

Transition Plan for the Fishing Effort Survey 15
estimate for the quickest turn-around for completing allocation reviews that Councils consider urgent is 1-2 years, and a minimum of one year for Commissions for an amendment and six months for a Commission addendum.
If revised estimates result in stock status determinations being changed to “overfishing” or “overfished,” workload will increase for NOAA Fisheries, Councils, and Commissions to develop and react to rebuilding plans and requirements to end overfishing.
As the primary transition year, 2018, approaches, fishery managers will need to evaluate if ACLs can be set for each stock by using FES-compatible updated assessment information. If so, then MRIP catch estimates based on 2018 FES effort estimates will be used to account for the ACLs and to determine if accountability measures are triggered.
For stocks that do not have updated FES-compatible assessments and ACLs in 2018, accounting for catch and management of ACLs and AMs will be done by using reverse-calibration of the FES-based MRIP catch estimates, so that the catch data used for management is consistent with the legacy catch data used to set the ACLs.
VI. Identification of Unknowns As the transition proceeds, the Subgroup identified several unknowns that will be important to monitor due to the potential effects they may have on planned schedules.
1. Developing the calibration model could prove to be more challenging than expected, with the various complexities of coverage differences (e.g., decreased landline households), response rates declining in phone surveys, measurement error in the proportion of households reporting fishing, etc.
a. This could impact the timeline for development of the model, currently planned to start September 2015 and continue into early 2017.
b. There will be future work with statistical consultants to update the group on these issues once more is known.
2. However, with future budgets unknown, the decision to stop side-by-side testing may be forced. Currently, the CHTS costs approximately $1.8M per year and the FES is estimated to cost $1.3M per year during the benchmarking period.
3. There could potentially be a legal challenge to either incorporate estimates sooner or to delay in order to get better precision; e.g., the Red Snapper court decision (Guindon v. Pritzker; March 26, 2014).
4. Congressional direction may mandate either incorporating estimates sooner or a delay to get better precision.
After the first and second years of benchmarking, any issues that arose will be outlined in a progress report.

Transition Plan for the Fishing Effort Survey 16
VII. Further ExperimentsIt is necessary to understand what factors are causing the large differences in estimates between the CHTS and the FES found in the pilot study. Starting in 2015, NOAA Fisheries will continue to investigate what potential causes could have affected recreational fishing effort estimates. Any additional studies could occur concurrently with the benchmarking and calibration. To the maximum extent feasible, NOAA Fisheries will need to be able to explain why the FES estimates are higher than the CHTS, as well as why they are likely to be more accurate. Working toward better understanding of possible sources of bias in both the CHTS and FES is necessary to ensure that NOAA Fisheries is providing the most accurate and best available science for estimating recreational fishing catch and effort.
Transition Plan for the Fishing Effort Survey 17
VIII. Lessons Learned from Improved Catch Survey ImplementationThe Subgroup recognizes there is an opportunity to learn from prior MRIP calibration efforts that were deemed necessary to account for consistent changes in estimates that have resulted from implementing other survey design improvements. It will be important to monitor progress in the development and application of these other calibration approaches to determine how best to move forward with developing and applying a calibration of the CHTS to the FES.
In 2012, an MRIP Calibration Workshop was held to determine the most appropriate way to account for any consistent changes in 2004-2011 catch statistics that resulted from the implementation of an improved estimation method for the Access Point Angler Intercept Survey (APAIS) conducted on the Atlantic and Gulf coasts. Workshop participants included representatives from NOAA Fisheries, the regional fishery management councils, the interstate marine fisheries commissions, and several state agencies. Participants concluded a simple ratio calibration approach based on the 2004-2011 comparisons was appropriate to use for re-estimating catches in earlier years (1981-2003). In this case, eight years of side-by-side estimates were available for benchmarking, and the calibration model was based on the average annual new:old ratios. Since then, this ratio calibration has been applied to update recreational catch statistics for all stocks prior to incorporation into stock assessments.
It may be useful to conduct a study of the sensitivity of this first APAIS ratio calibration to the number of years of side-by-side comparisons used. This may help to evaluate the importance of accounting for interannual variability when calibrating between alternative estimators. The extent to which the ratio calibration changes as more years of side-by-side estimates are added to the calculation of mean ratios for a number of recreationally important stocks could be examined. For any given stock, it is very likely that changes in the mean ratio will tend to decrease as more years are added to the analysis, leading to greater stability of the calibration. This proposed study could be instructive in determining how to go about evaluating the number of benchmarking years needed to provide a relatively stable calibration between the FES and the CHTS.
In 2014, a Calibration Workshop was held to evaluate the potential consistent effects of implementing a new sampling design for the Access Point Angler Intercept Survey (APAIS) on the Atlantic and Gulf coasts in 2013. Workshop participants included three expert statistical consultants and representatives from NOAA Fisheries, the regional fishery management councils, the interstate marine fisheries commissions, and several state agencies. The participants determined that analyses conducted by the NOAA

Transition Plan for the Fishing Effort Survey 18
Fisheries Office of Science and Technology showed there was sufficient evidence that the more complete temporal coverage of the new design resulted in consistent increases or decreases in APAIS angler catch rate statistics for at least some species. They developed three different calibration models to evaluate for possible use in correcting the pre-2013 legacy catch statistics. In this case, no side-by-side benchmarking comparisons could be made. However, the statistical consultants concluded the simplest of the three proposed models was appropriate for use in the short term until more data collected with the new APAIS design could be used to complete evaluation of the other two proposed calibration models. The simple ratio calibration approach has been used to revise historical catch statistics and incorporate them into stock assessment updates for Gulf Red Snapper, Gulf Red Grouper, and other key stocks in 2015. Once an evaluation of the other two proposed calibration models has been completed, one of the three methods will be selected as the best for use in re-estimation of historical catches and incorporation of new estimates into stock assessments and management.
One important lesson learned in the 2014 APAIS design change calibration effort was that the development of an appropriate calibration would have been much simpler if data from a side-by-side benchmarking of the new and old APAIS designs had been available for all states. Without such data, this particular calibration relies on a number of assumptions about how 2013 catch statistics would have differed if based on conduct of the old APAIS sampling design. If side-by-side data were available, the differences in estimates caused by a difference in temporal coverage and other factors could have been directly measured. This underlines the importance of conducting the FES alongside the CHTS to get a good measure of consistent differences in their resulting estimates of fishing effort.
As work continues to evaluate the three alternative APAIS design change calibration models, it will be possible to examine the sensitivity of the three proposed models to the number of years used for comparisons of the temporal coverage of sampling under the new and old designs. For example, it will be possible to look at how the simple ratio calibration used in 2014-2015 may have changed with the inclusion of a second year (2013-2014) of data collected using the new APAIS design. Such sensitivity studies could be important for understanding the potential effects of interannual variability on the results of any calibration approach. Such studies will potentially help the Transition Team understand the potential consequences of attempting a calibration with less than two years of side-by-side data.
It may be important to integrate any further APAIS calibration efforts with the FES calibration and transition planning. The Terms of Reference for the 2014 APAIS Calibration Workshop stated it would be important to coordinate any new calibration accounting for the APAIS sample design change with the previous APAIS estimation change calibration and any future calibrations for other substantial MRIP survey design changes for the Atlantic and Gulf states. If at some point in late 2015 or 2016 one of the other two APAIS calibration models is chosen over the simple one used for 2015 assessment updates, it may be desirable to wait and apply that selected APAIS calibration in combination with the FES calibration planned for 2017.
Certainly, any attempts to integrate calibrations developed for different survey design changes would have to determine if there may be interacting effects of those changes. As the FES calibration is developed, the Transition Team will make sure analyses are

Transition Plan for the Fishing Effort Survey 19
conducted to evaluate possible interactions with the APAIS estimation change and APAIS design change calibrations. If the calibrations turn out to be independent of one another, then it may be safe to apply them sequentially to obtain the most correct adjustments needed for historical catch statistics. However, if they are not independent, then developing an appropriate overall calibration that accounts for all changes could turn out to be a very complex process requiring considerably more time to find the right solution.
Transition Plan for the Fishing Effort Survey 20
IX. Appendices
APPENDIX 1: Gantt Chart with descriptive timeline of the FES Transition Plan.
APPENDIX 2: Key stocks with initial priority ranking.
APPENDIX 3: Overview of the long-term communications strategy for the transition from the Coastal Household Telephone Survey (CHTS) to the Fishing Effort Survey (FES).
APPENDIX 4: List of Previous Pilot Studies and Links to Final Reports.
APPENDIX 5: List of the Marine Recreational Information Program Transition Team’s Atlantic and Gulf Subgroup Representatives.

Transition Plan for the Fishing Effort Survey 21
APPENDIX 1
Gantt Chart with descriptive timeline of the FES Transition Plan.
Transition Plan for the Fishing Effort Survey 22
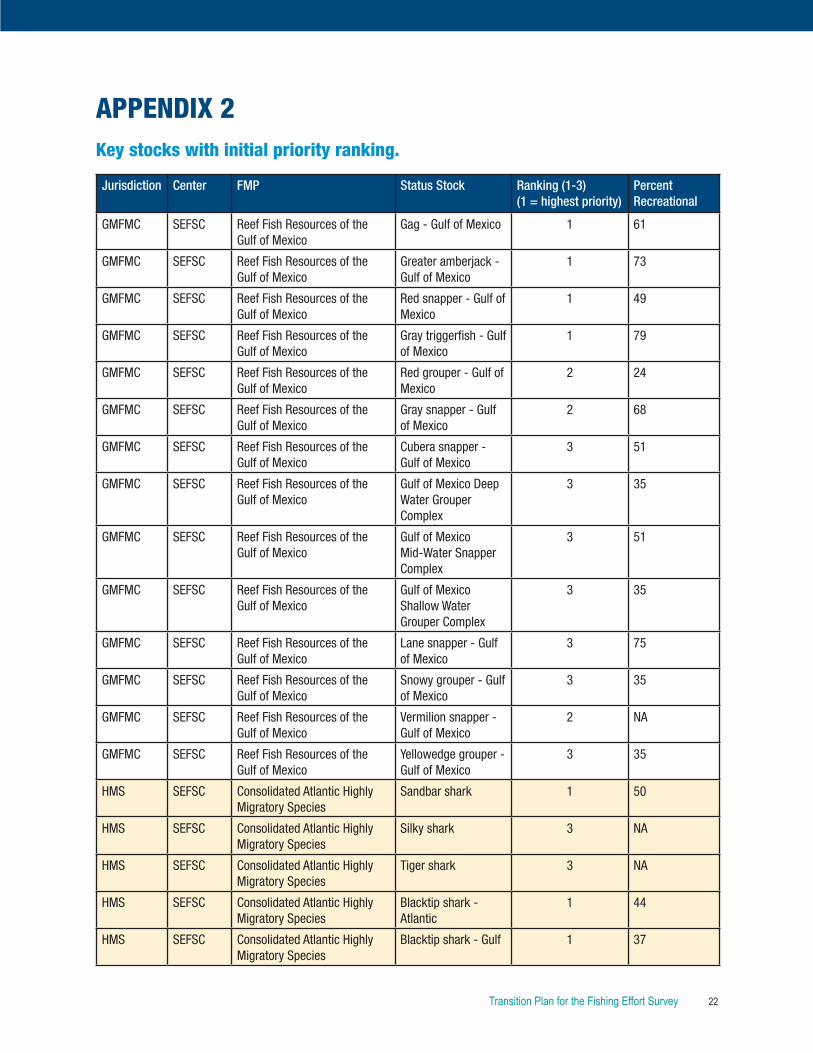
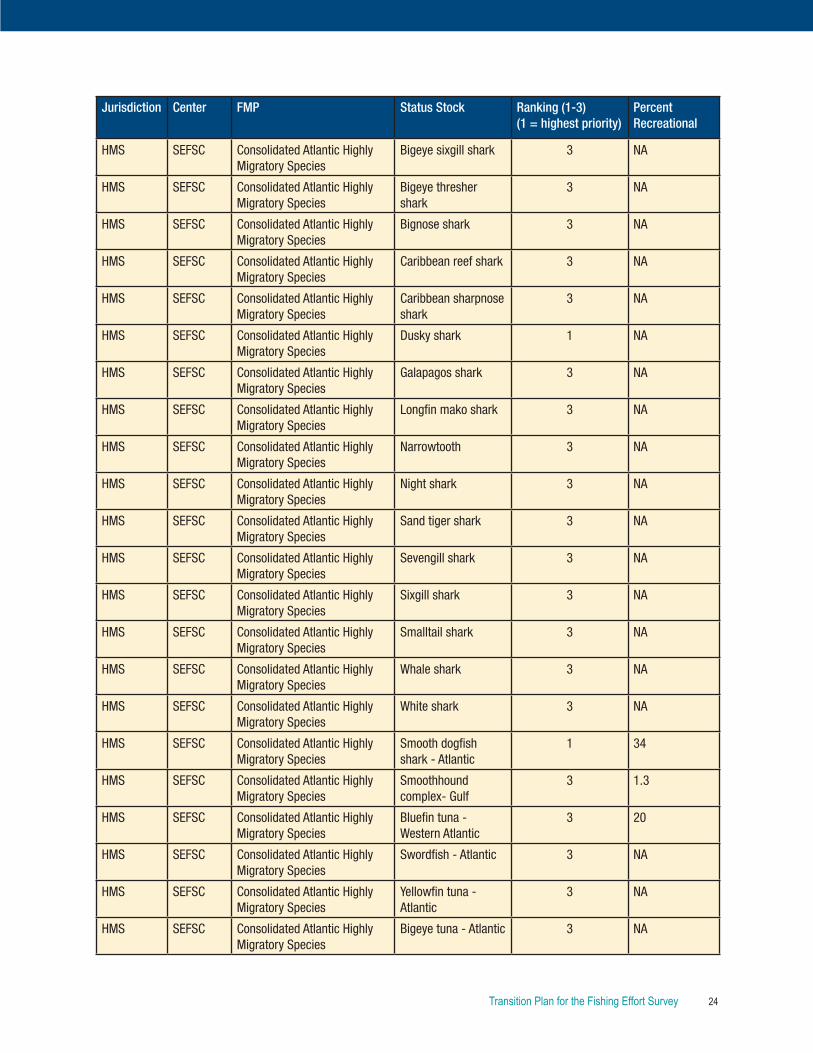
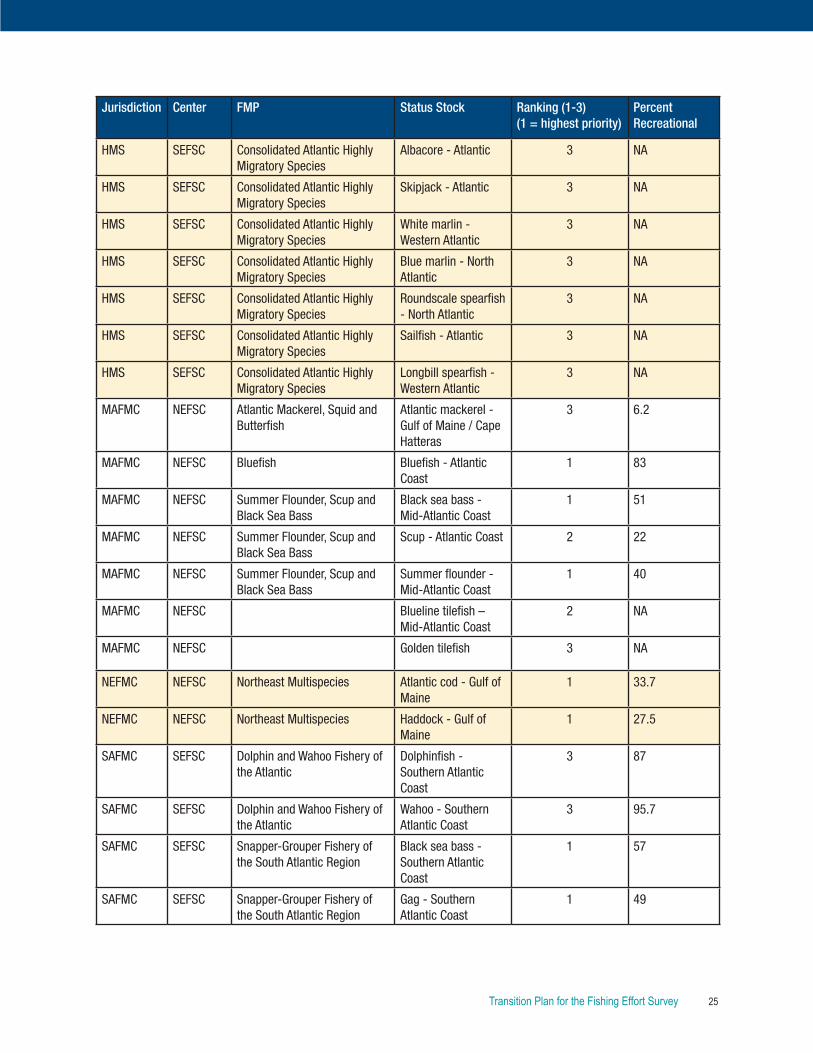
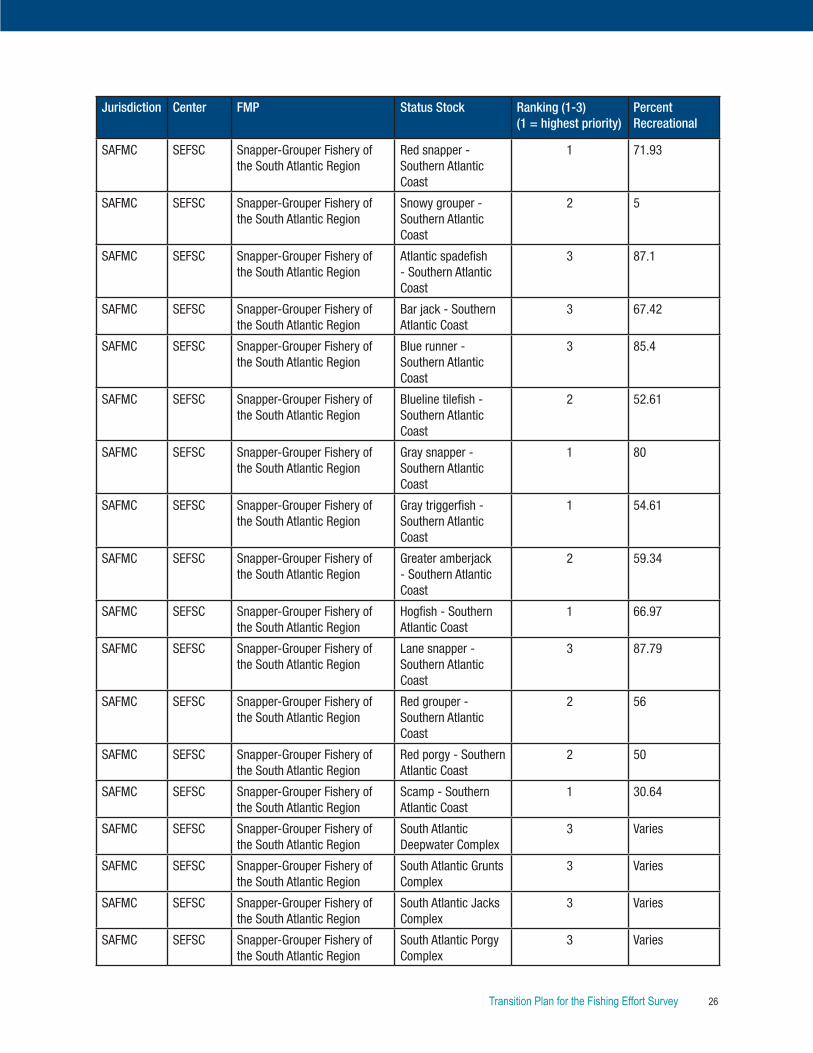
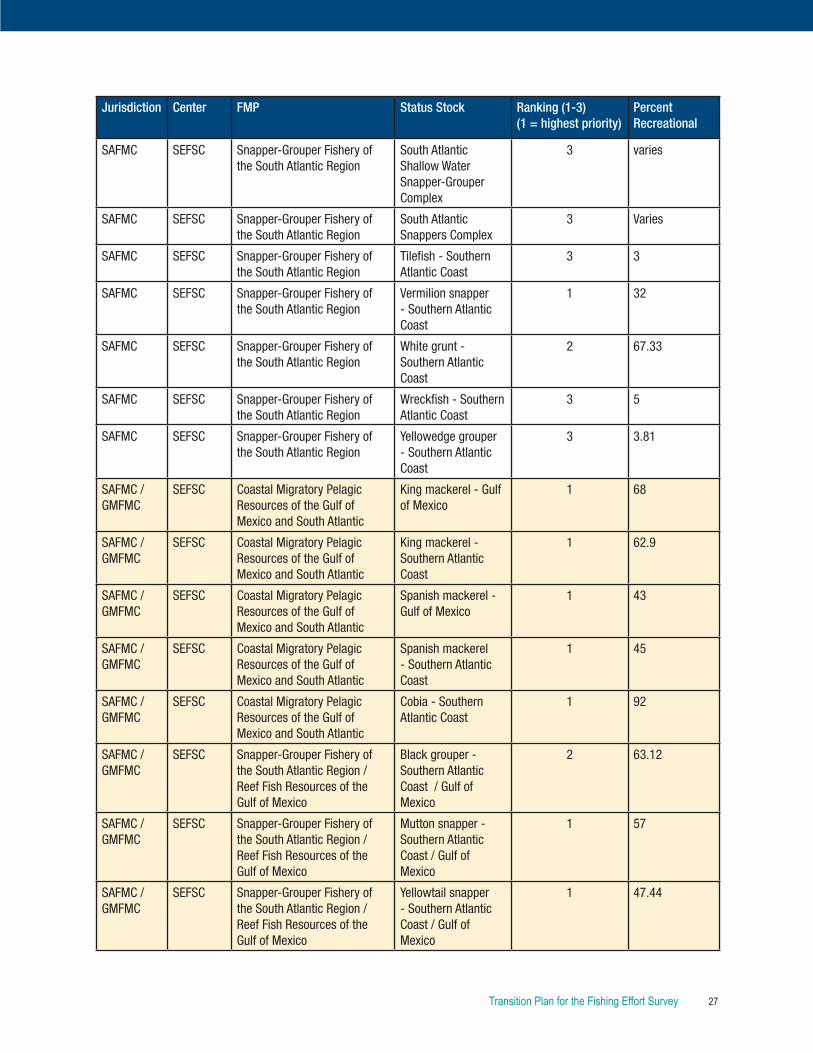
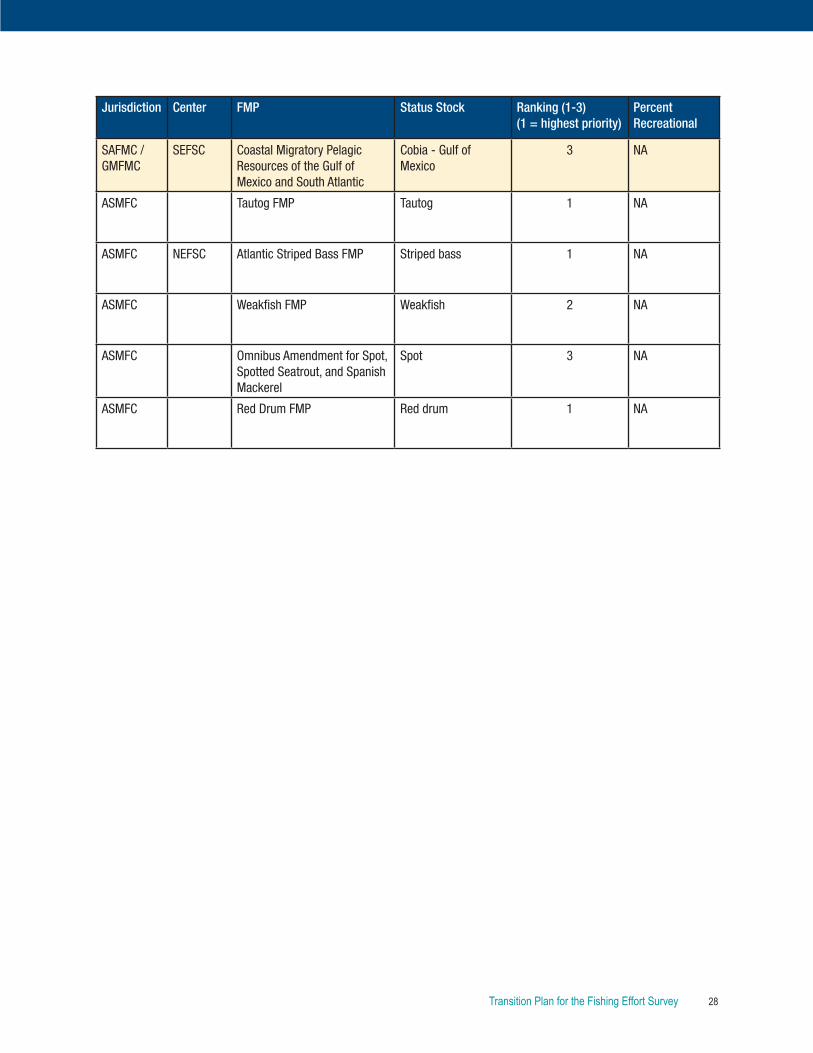
APPENDIX 2Key stocks with initial priority ranking.
Jurisdiction Center FMP Status Stock Ranking (1-3) (1 = highest priority)
Percent Recreational
GMFMC SEFSC Reef Fish Resources of the Gulf of Mexico
Gag - Gulf of Mexico 1 61
GMFMC SEFSC Reef Fish Resources of the Gulf of Mexico
Greater amberjack - Gulf of Mexico
1 73
GMFMC SEFSC Reef Fish Resources of the Gulf of Mexico
Red snapper - Gulf of Mexico
1 49
GMFMC SEFSC Reef Fish Resources of the Gulf of Mexico
Gray triggerfish - Gulf of Mexico
1 79
GMFMC SEFSC Reef Fish Resources of the Gulf of Mexico
Red grouper - Gulf of Mexico
2 24
GMFMC SEFSC Reef Fish Resources of the Gulf of Mexico
Gray snapper - Gulf of Mexico
2 68
GMFMC SEFSC Reef Fish Resources of the Gulf of Mexico
Cubera snapper - Gulf of Mexico
3 51
GMFMC SEFSC Reef Fish Resources of the Gulf of Mexico
Gulf of Mexico Deep Water Grouper Complex
3 35
GMFMC SEFSC Reef Fish Resources of the Gulf of Mexico
Gulf of Mexico Mid-Water Snapper Complex
3 51
GMFMC SEFSC Reef Fish Resources of the Gulf of Mexico
Gulf of Mexico Shallow Water Grouper Complex
3 35
GMFMC SEFSC Reef Fish Resources of the Gulf of Mexico
Lane snapper - Gulf of Mexico
3 75
GMFMC SEFSC Reef Fish Resources of the Gulf of Mexico
Snowy grouper - Gulf of Mexico
3 35
GMFMC SEFSC Reef Fish Resources of the Gulf of Mexico
Vermilion snapper - Gulf of Mexico
2 NA
GMFMC SEFSC Reef Fish Resources of the Gulf of Mexico
Yellowedge grouper - Gulf of Mexico
3 35
HMS SEFSC Consolidated Atlantic Highly Migratory Species
Sandbar shark 1 50
HMS SEFSC Consolidated Atlantic Highly Migratory Species
Silky shark 3 NA
HMS SEFSC Consolidated Atlantic Highly Migratory Species
Tiger shark 3 NA
HMS SEFSC Consolidated Atlantic Highly Migratory Species
Blacktip shark - Atlantic
1 44
HMS SEFSC Consolidated Atlantic Highly Migratory Species
Blacktip shark - Gulf 1 37

Transition Plan for the Fishing Effort Survey 23
Jurisdiction Center FMP Status Stock Ranking (1-3) (1 = highest priority)
Percent Recreational
HMS SEFSC Consolidated Atlantic Highly Migratory Species
Bull shark 2 NA
HMS SEFSC Consolidated Atlantic Highly Migratory Species
Spinner shark 2 NA
HMS SEFSC Consolidated Atlantic Highly Migratory Species
Lemon shark 3 NA
HMS SEFSC Consolidated Atlantic Highly Migratory Species
Nurse shark 3 NA
HMS SEFSC Consolidated Atlantic Highly Migratory Species
Scalloped hammerhead shark
1 86
HMS SEFSC Consolidated Atlantic Highly Migratory Species
Smooth hammerhead shark
2 NA
HMS SEFSC Consolidated Atlantic Highly Migratory Species
Great hammerhead shark
2 NA
HMS SEFSC Consolidated Atlantic Highly Migratory Species
Atlantic sharpnose shark - Atlantic
2 12
HMS SEFSC Consolidated Atlantic Highly Migratory Species
Atlantic sharpnose shark - Gulf
3 2
HMS SEFSC Consolidated Atlantic Highly Migratory Species
Blacknose shark - Atlantic
3 3
HMS SEFSC Consolidated Atlantic Highly Migratory Species
Blacknose shark - Gulf
2 8
HMS SEFSC Consolidated Atlantic Highly Migratory Species
Bonnethead shark - Atlantic
3 9
HMS SEFSC Consolidated Atlantic Highly Migratory Species
Bonnethead shark - Gulf
3 NA
HMS SEFSC Consolidated Atlantic Highly Migratory Species
Finetooth shark 2 31
HMS SEFSC Consolidated Atlantic Highly Migratory Species
Blue shark 3 NA
HMS SEFSC Consolidated Atlantic Highly Migratory Species
Oceanic whitetip 3 NA
HMS SEFSC Consolidated Atlantic Highly Migratory Species
Porbeagle shark 3 NA
HMS SEFSC Consolidated Atlantic Highly Migratory Species
Shortfin mako 3 NA
HMS SEFSC Consolidated Atlantic Highly Migratory Species
Common thresher shark
3 NA
HMS SEFSC Consolidated Atlantic Highly Migratory Species
Atlantic angel shark 3 NA
HMS SEFSC Consolidated Atlantic Highly Migratory Species
Basking shark 3 NA
HMS SEFSC Consolidated Atlantic Highly Migratory Species
Bigeye sand tiger shark
3 NA
Transition Plan for the Fishing Effort Survey 24
Jurisdiction Center FMP Status Stock Ranking (1-3) (1 = highest priority)
Percent Recreational
HMS SEFSC Consolidated Atlantic Highly Migratory Species
Bigeye sixgill shark 3 NA
HMS SEFSC Consolidated Atlantic Highly Migratory Species
Bigeye thresher shark
3 NA
HMS SEFSC Consolidated Atlantic Highly Migratory Species
Bignose shark 3 NA
HMS SEFSC Consolidated Atlantic Highly Migratory Species
Caribbean reef shark 3 NA
HMS SEFSC Consolidated Atlantic Highly Migratory Species
Caribbean sharpnose shark
3 NA
HMS SEFSC Consolidated Atlantic Highly Migratory Species
Dusky shark 1 NA
HMS SEFSC Consolidated Atlantic Highly Migratory Species
Galapagos shark 3 NA
HMS SEFSC Consolidated Atlantic Highly Migratory Species
Longfin mako shark 3 NA
HMS SEFSC Consolidated Atlantic Highly Migratory Species
Narrowtooth 3 NA
HMS SEFSC Consolidated Atlantic Highly Migratory Species
Night shark 3 NA
HMS SEFSC Consolidated Atlantic Highly Migratory Species
Sand tiger shark 3 NA
HMS SEFSC Consolidated Atlantic Highly Migratory Species
Sevengill shark 3 NA
HMS SEFSC Consolidated Atlantic Highly Migratory Species
Sixgill shark 3 NA
HMS SEFSC Consolidated Atlantic Highly Migratory Species
Smalltail shark 3 NA
HMS SEFSC Consolidated Atlantic Highly Migratory Species
Whale shark 3 NA
HMS SEFSC Consolidated Atlantic Highly Migratory Species
White shark 3 NA
HMS SEFSC Consolidated Atlantic Highly Migratory Species
Smooth dogfish shark - Atlantic
1 34
HMS SEFSC Consolidated Atlantic Highly Migratory Species
Smoothhound complex- Gulf
3 1.3
HMS SEFSC Consolidated Atlantic Highly Migratory Species
Bluefin tuna - Western Atlantic
3 20
HMS SEFSC Consolidated Atlantic Highly Migratory Species
Swordfish - Atlantic 3 NA
HMS SEFSC Consolidated Atlantic Highly Migratory Species
Yellowfin tuna - Atlantic
3 NA
HMS SEFSC Consolidated Atlantic Highly Migratory Species
Bigeye tuna - Atlantic 3 NA
Transition Plan for the Fishing Effort Survey 25
Jurisdiction Center FMP Status Stock Ranking (1-3) (1 = highest priority)
Percent Recreational
HMS SEFSC Consolidated Atlantic Highly Migratory Species
Albacore - Atlantic 3 NA
HMS SEFSC Consolidated Atlantic Highly Migratory Species
Skipjack - Atlantic 3 NA
HMS SEFSC Consolidated Atlantic Highly Migratory Species
White marlin - Western Atlantic
3 NA
HMS SEFSC Consolidated Atlantic Highly Migratory Species
Blue marlin - North Atlantic
3 NA
HMS SEFSC Consolidated Atlantic Highly Migratory Species
Roundscale spearfish - North Atlantic
3 NA
HMS SEFSC Consolidated Atlantic Highly Migratory Species
Sailfish - Atlantic 3 NA
HMS SEFSC Consolidated Atlantic Highly Migratory Species
Longbill spearfish - Western Atlantic
3 NA
MAFMC NEFSC Atlantic Mackerel, Squid and Butterfish
Atlantic mackerel - Gulf of Maine / Cape Hatteras
3 6.2
MAFMC NEFSC Bluefish Bluefish - Atlantic Coast
1 83
MAFMC NEFSC Summer Flounder, Scup and Black Sea Bass
Black sea bass - Mid-Atlantic Coast
1 51
MAFMC NEFSC Summer Flounder, Scup and Black Sea Bass
Scup - Atlantic Coast 2 22
MAFMC NEFSC Summer Flounder, Scup and Black Sea Bass
Summer flounder - Mid-Atlantic Coast
1 40
MAFMC NEFSC Blueline tilefish – Mid-Atlantic Coast
2 NA
MAFMC NEFSC Golden tilefish 3 NA
NEFMC NEFSC Northeast Multispecies Atlantic cod - Gulf of Maine
1 33.7
NEFMC NEFSC Northeast Multispecies Haddock - Gulf of Maine
1 27.5
SAFMC SEFSC Dolphin and Wahoo Fishery of the Atlantic
Dolphinfish - Southern Atlantic Coast
3 87
SAFMC SEFSC Dolphin and Wahoo Fishery of the Atlantic
Wahoo - Southern Atlantic Coast
3 95.7
SAFMC SEFSC Snapper-Grouper Fishery of the South Atlantic Region
Black sea bass - Southern Atlantic Coast
1 57
SAFMC SEFSC Snapper-Grouper Fishery of the South Atlantic Region
Gag - Southern Atlantic Coast
1 49
Transition Plan for the Fishing Effort Survey 26
Jurisdiction Center FMP Status Stock Ranking (1-3) (1 = highest priority)
Percent Recreational
SAFMC SEFSC Snapper-Grouper Fishery of the South Atlantic Region
Red snapper - Southern Atlantic Coast
1 71.93
SAFMC SEFSC Snapper-Grouper Fishery of the South Atlantic Region
Snowy grouper - Southern Atlantic Coast
2 5
SAFMC SEFSC Snapper-Grouper Fishery of the South Atlantic Region
Atlantic spadefish - Southern Atlantic Coast
3 87.1
SAFMC SEFSC Snapper-Grouper Fishery of the South Atlantic Region
Bar jack - Southern Atlantic Coast
3 67.42
SAFMC SEFSC Snapper-Grouper Fishery of the South Atlantic Region
Blue runner - Southern Atlantic Coast
3 85.4
SAFMC SEFSC Snapper-Grouper Fishery of the South Atlantic Region
Blueline tilefish - Southern Atlantic Coast
2 52.61
SAFMC SEFSC Snapper-Grouper Fishery of the South Atlantic Region
Gray snapper - Southern Atlantic Coast
1 80
SAFMC SEFSC Snapper-Grouper Fishery of the South Atlantic Region
Gray triggerfish - Southern Atlantic Coast
1 54.61
SAFMC SEFSC Snapper-Grouper Fishery of the South Atlantic Region
Greater amberjack - Southern Atlantic Coast
2 59.34
SAFMC SEFSC Snapper-Grouper Fishery of the South Atlantic Region
Hogfish - Southern Atlantic Coast
1 66.97
SAFMC SEFSC Snapper-Grouper Fishery of the South Atlantic Region
Lane snapper - Southern Atlantic Coast
3 87.79
SAFMC SEFSC Snapper-Grouper Fishery of the South Atlantic Region
Red grouper - Southern Atlantic Coast
2 56
SAFMC SEFSC Snapper-Grouper Fishery of the South Atlantic Region
Red porgy - Southern Atlantic Coast
2 50
SAFMC SEFSC Snapper-Grouper Fishery of the South Atlantic Region
Scamp - Southern Atlantic Coast
1 30.64
SAFMC SEFSC Snapper-Grouper Fishery of the South Atlantic Region
South Atlantic Deepwater Complex
3 Varies
SAFMC SEFSC Snapper-Grouper Fishery of the South Atlantic Region
South Atlantic Grunts Complex
3 Varies
SAFMC SEFSC Snapper-Grouper Fishery of the South Atlantic Region
South Atlantic Jacks Complex
3 Varies
SAFMC SEFSC Snapper-Grouper Fishery of the South Atlantic Region
South Atlantic Porgy Complex
3 Varies
Transition Plan for the Fishing Effort Survey 27
Jurisdiction Center FMP Status Stock Ranking (1-3) (1 = highest priority)
Percent Recreational
SAFMC SEFSC Snapper-Grouper Fishery of the South Atlantic Region
South Atlantic Shallow Water Snapper-Grouper Complex
3 varies
SAFMC SEFSC Snapper-Grouper Fishery of the South Atlantic Region
South Atlantic Snappers Complex
3 Varies
SAFMC SEFSC Snapper-Grouper Fishery of the South Atlantic Region
Tilefish - Southern Atlantic Coast
3 3
SAFMC SEFSC Snapper-Grouper Fishery of the South Atlantic Region
Vermilion snapper - Southern Atlantic Coast
1 32
SAFMC SEFSC Snapper-Grouper Fishery of the South Atlantic Region
White grunt - Southern Atlantic Coast
2 67.33
SAFMC SEFSC Snapper-Grouper Fishery of the South Atlantic Region
Wreckfish - Southern Atlantic Coast
3 5
SAFMC SEFSC Snapper-Grouper Fishery of the South Atlantic Region
Yellowedge grouper - Southern Atlantic Coast
3 3.81
SAFMC / GMFMC
SEFSC Coastal Migratory Pelagic Resources of the Gulf of Mexico and South Atlantic
King mackerel - Gulf of Mexico
1 68
SAFMC / GMFMC
SEFSC Coastal Migratory Pelagic Resources of the Gulf of Mexico and South Atlantic
King mackerel - Southern Atlantic Coast
1 62.9
SAFMC / GMFMC
SEFSC Coastal Migratory Pelagic Resources of the Gulf of Mexico and South Atlantic
Spanish mackerel - Gulf of Mexico
1 43
SAFMC / GMFMC
SEFSC Coastal Migratory Pelagic Resources of the Gulf of Mexico and South Atlantic
Spanish mackerel - Southern Atlantic Coast
1 45
SAFMC / GMFMC
SEFSC Coastal Migratory Pelagic Resources of the Gulf of Mexico and South Atlantic
Cobia - Southern Atlantic Coast
1 92
SAFMC / GMFMC
SEFSC Snapper-Grouper Fishery of the South Atlantic Region / Reef Fish Resources of the Gulf of Mexico
Black grouper - Southern Atlantic Coast / Gulf of Mexico
2 63.12
SAFMC / GMFMC
SEFSC Snapper-Grouper Fishery of the South Atlantic Region / Reef Fish Resources of the Gulf of Mexico
Mutton snapper - Southern Atlantic Coast / Gulf of Mexico
1 57
SAFMC / GMFMC
SEFSC Snapper-Grouper Fishery of the South Atlantic Region / Reef Fish Resources of the Gulf of Mexico
Yellowtail snapper - Southern Atlantic Coast / Gulf of Mexico
1 47.44
Transition Plan for the Fishing Effort Survey 28
Jurisdiction Center FMP Status Stock Ranking (1-3) (1 = highest priority)
Percent Recreational
SAFMC / GMFMC
SEFSC Coastal Migratory Pelagic Resources of the Gulf of Mexico and South Atlantic
Cobia - Gulf of Mexico
3 NA
ASMFC Tautog FMP Tautog 1 NA
ASMFC NEFSC Atlantic Striped Bass FMP Striped bass 1 NA
ASMFC Weakfish FMP Weakfish 2 NA
ASMFC Omnibus Amendment for Spot, Spotted Seatrout, and Spanish Mackerel
Spot 3 NA
ASMFC Red Drum FMP Red drum 1 NA

Transition Plan for the Fishing Effort Survey 29
APPENDIX 3
Overview of the long-term communications strategy for the transition from the Coastal Household Telephone Survey (CHTS) to the Fishing Effort Survey (FES).
A more detailed communications plan specific to the Fishing Effort Survey (FES) and this transition plan is being developed. The following communications plan is a high-level overview of what MRIP will be doing to ensure successful communication of the FES transition plan.
Communications Goals:• Promote an open and productive dialogue among data partners and other stakeholders to facilitate the
progress of the Transition Team toward meeting its goals.
• Communicate the broad, regionally-based perspectives that informed the development of this plan.
• Ensure consistency and quality of information about the rationale behind this Transition Plan among all audiences through pickup and reuse of outreach materials by data partners and other stakeholders.
Strategy:
Continually leverage existing communications opportunities and create new opportunities through outreach to and dialogue with our data partners and other stakeholders.
This is a two-pronged approach aimed at building trust in MRIP and NOAA Fisheries with our partners and stakeholders. Primarily, we focus on continuing our discussions and presentation of MRIP improvements and the FES transition so that our partners are fully informed about and engaged in every step of the transition process. This strategy relies on two-way communications to ensure that we are providing the information our audiences most need, and doing so in a way that most effectively conveys that information. All of this will be done while connecting FES to broader recreational fisheries messages.
Prong 1: Take advantage of national and regional opportunities to engage with partners
The initial roll out of the FES design resulted in a “wait and see” attitude among our partners and stakeholders. Over the next months a number of decisions regarding transition planning will be made and over the next years we will be hitting many key milestones. We want to take advantage of meetings and other events to build upon the success of the initial roll out and lay the groundwork for the next milestones.
Prong 2: Create opportunities for outreach and engagement.
The work of the Transition Team will provide numerous potential points at which new information and continued research will become opportunities to educate and engage our audiences. The MRIP Communication and Education Team (CET) will work with the Transition Team to identify these opportunities.

Transition Plan for the Fishing Effort Survey 30
Overarching: Connect FES-specific messaging to broader MRIP and recreational fishing messaging.
We will use FES-specific messaging as a platform for building a broader understanding of MRIP as a complete process and “bottom-up” support by engaging and empowering staff to communicate about MRIP. This involves connecting FES communications to broader MRIP and NOAA Fisheries communications efforts and to regionally-specific recreational fishing communications goals. The national and regional MRIP communications teams will be the primary avenue for this.
Audiences:
NOAA audiences
• NOAA and NOAA Fisheries Leadership
• F/ST, F/SF
• Science Center (SC) and Regional Office (RO) recreational fisheries staff, regional recreational fisheries coordinators, recreational communication leads
• MRIP teams
Management Groups and Subgroups (e.g,. SSCs and Advisory Panel members)
• Fishery Management Council members and staff for all regions
• Marine Fisheries Commission members and staff for all regions
• State Resource Agencies (primarily Atlantic and Gulf coasts)
• Members of NOAA’s Marine Fisheries Advisory Committee (MAFAC) with an emphasis on the MAFAC Recreational Fisheries Subcommittee and Working Group
Congressional Stakeholders
Recreational Fishing Community
Commercial Fishing Community Leaders
Environmental Community Leaders
National and Regional Media
Transition Plan for the Fishing Effort Survey 31
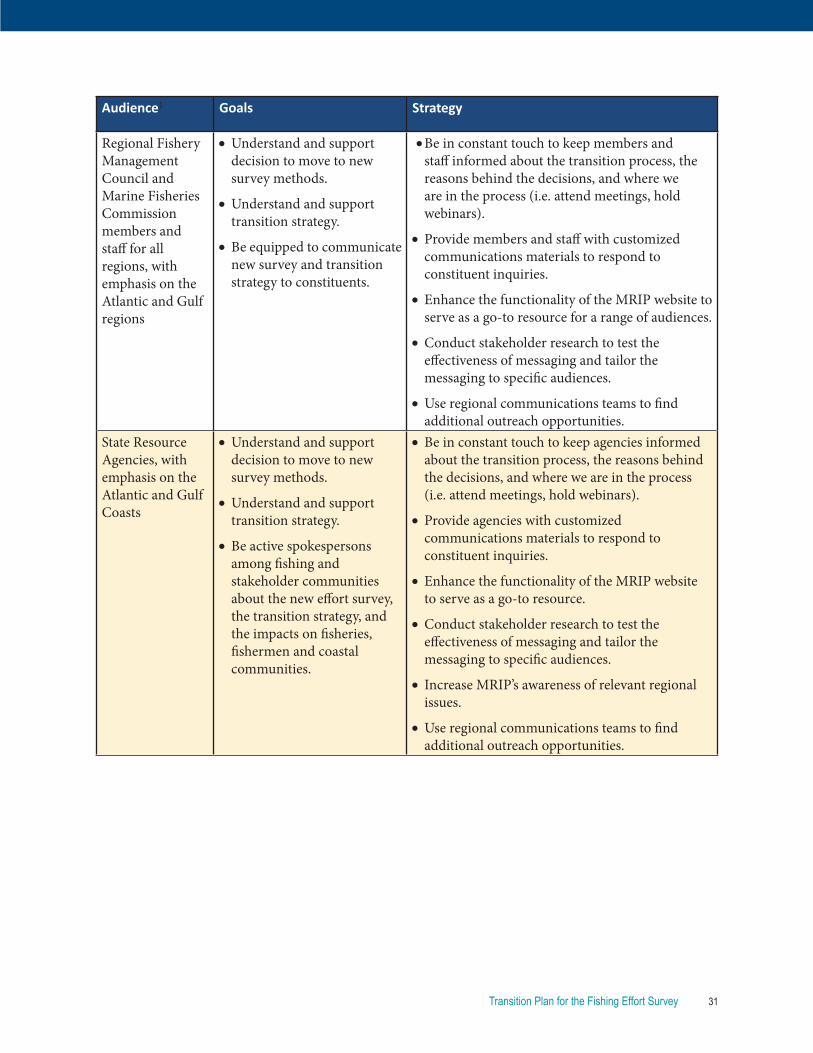
Audience1 Goals Strategy
Regional Fishery Management Council and Marine Fisheries Commission members and staff for all regions, with emphasis on the Atlantic and Gulf regions
•Understand and support decision to move to new survey methods.
•Understand and support transition strategy.
•Be equipped to communicate new survey and transition strategy to constituents.
•Be in constant touch to keep members and staff informed about the transition process, the reasons behind the decisions, and where we are in the process (i.e. attend meetings, hold webinars).
•Provide members and staff with customized communications materials to respond to constituent inquiries.
•Enhance the functionality of the MRIP website to serve as a go-to resource for a range of audiences.
•Conduct stakeholder research to test the effectiveness of messaging and tailor the messaging to specific audiences.
•Use regional communications teams to find additional outreach opportunities.
State Resource Agencies, with emphasis on the Atlantic and Gulf Coasts
•Understand and support decision to move to new survey methods.
•Understand and support transition strategy.
•Be active spokespersons among fishing and stakeholder communities about the new effort survey, the transition strategy, and the impacts on fisheries, fishermen and coastal communities.
•Be in constant touch to keep agencies informed about the transition process, the reasons behind the decisions, and where we are in the process (i.e. attend meetings, hold webinars).
•Provide agencies with customized communications materials to respond to constituent inquiries.
•Enhance the functionality of the MRIP website to serve as a go-to resource.
•Conduct stakeholder research to test the effectiveness of messaging and tailor the messaging to specific audiences.
• Increase MRIP’s awareness of relevant regional issues.
•Use regional communications teams to find additional outreach opportunities.

Transition Plan for the Fishing Effort Survey 32
Audience1 Goals Strategy
Members of NOAA’s Marine Fisheries Advisory Committee (MAFAC) with an emphasis on the MAFAC Recreational Fisheries Subcommittee and Working Group
•Understand and support decision to move to new survey methods.
•Understand and support transition strategy.
•Be active spokespersons among fishing and stakeholder communities about the new effort survey, the transition strategy, and the impacts on fisheries, fishermen and coastal communities.
•Keep members up to date about the transition process, the reasons behind the decisions, and where we are in the process (i.e. provide materials, hold webinars).
•Provide members with the key messages and targeted materials to respond to inquiries from stakeholders.
Recreational fishing community stakeholders
•Understand improvements to new survey and the transition strategy.
•Understand immediate-term and potential long term implications of new effort survey for fishermen.
•Understand role of state licensing in the mail survey.
•Participate in mail survey if they receive it.
•Working with the NOAA Fisheries Recreational Engagement Initiative Team to expand
•Enhance the functionality of the MRIP website to serve as a go-to resource for a range of audiences.
•Use regional communications teams to find additional outreach opportunities.
Environmental community stakeholders
•Understand and support the new effort survey and transition approach.
•Specifically, understand that higher effort estimates do not on their face indicate overfishing.
•Will work with NOAA Fisheries Office of Communications to identify
National and regional media
•Accurately characterize the findings of the pilot study, the approach to implementing it, the transition strategy, and the implications for fishery health, fishermen, coastal communities and other stakeholders.
•Will work with NOAA Office of Public and Constituent Affairs to identify

Transition Plan for the Fishing Effort Survey 33
Audience1 Goals Strategy
Commercial fishing community operating under MSA/regional FMP’s
•Understand and support strategy for phasing in new effort survey estimates alongside old effort survey estimates.
•Be engaged participants in the management decision-making process as calibrations and adjustments are made to estimates and stock assessments.
•Will work with NOAA Fisheries Office of Sustainable Fisheries to identify
Congressional members and staff who have fishing constituencies (rec and commercial)
•Understand and support decision to move to new survey methods.
•Understand and support transition strategy.
•Be equipped to answer questions about new survey and transition strategy from constituents.
•Will work with NOAA Office of Legislative Affairs to identify
NOAA and NOAA Fisheries Leadership, F/ST, F/SF, SC and RO recreational fisheries staff, regional recreational fisheries coordinators, recreational communication leads, MRIP teams
•Understand and support decision to move to new survey methods.
•Understand and support transition strategy.
•Be equipped to communicate new survey and transition strategy to partners and constituents.
• Initiate steps to improve internal communication.
•Provide leadership and staff with big picture information they can carry to constituents and more detailed information they can use to enhance coordination with MRIP.
• Increase MRIP’s awareness of relevant national and regional programs and events.
Additional outreach and materials targeted to specific groups and key messages will be developed through work with members of the national and regional MRIP Communications and Education Team. This will include identification of key regional stakeholder groups that should be targeted, a regional needs assessment of FES communication materials and resources, and identification of areas where regional communications staff will take the lead instead of MRIP.
A more extensive database is being developed which lays out goals, challenges, relative priority, ideal frequency, POC, key events, and specific messages, materials, and tactics for those events.
Transition Plan for the Fishing Effort Survey 34
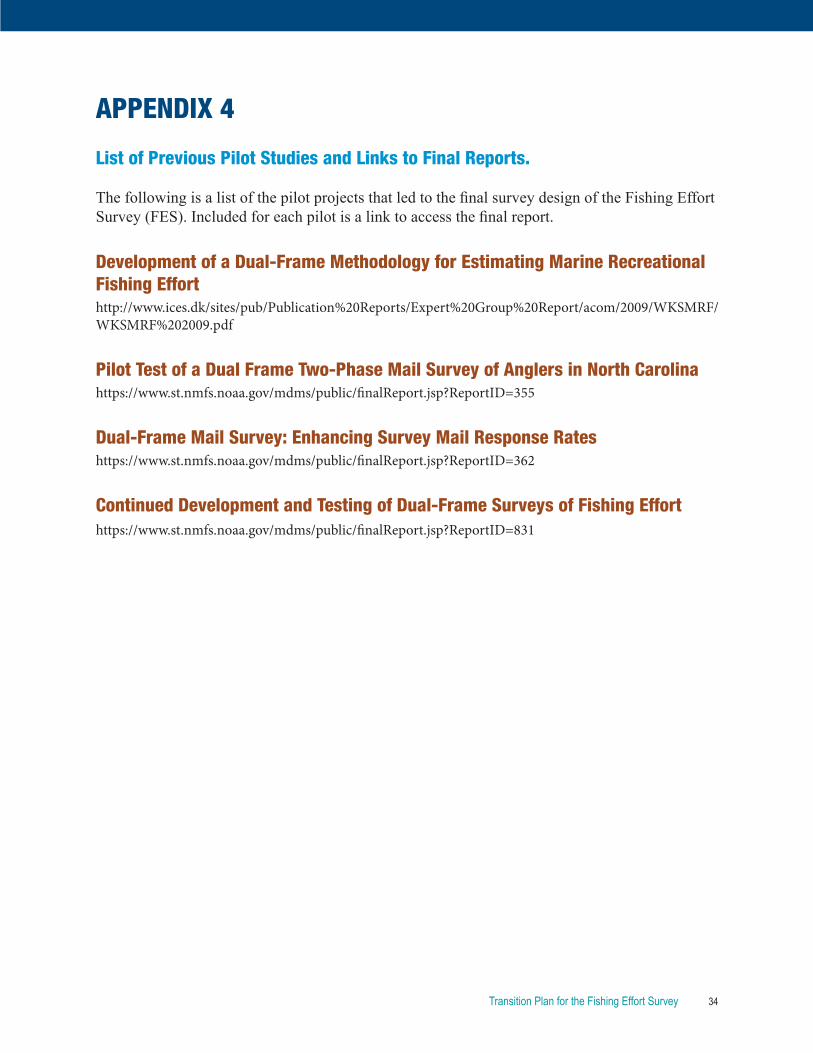
APPENDIX 4
List of Previous Pilot Studies and Links to Final Reports.
The following is a list of the pilot projects that led to the final survey design of the Fishing Effort Survey (FES). Included for each pilot is a link to access the final report.
Development of a Dual-Frame Methodology for Estimating Marine Recreational Fishing Efforthttp://www.ices.dk/sites/pub/Publication%20Reports/Expert%20Group%20Report/acom/2009/WKSMRF/WKSMRF%202009.pdf
Pilot Test of a Dual Frame Two-Phase Mail Survey of Anglers in North Carolinahttps://www.st.nmfs.noaa.gov/mdms/public/finalReport.jsp?ReportID=355
Dual-Frame Mail Survey: Enhancing Survey Mail Response Rateshttps://www.st.nmfs.noaa.gov/mdms/public/finalReport.jsp?ReportID=362
Continued Development and Testing of Dual-Frame Surveys of Fishing Efforthttps://www.st.nmfs.noaa.gov/mdms/public/finalReport.jsp?ReportID=831
Transition Plan for the Fishing Effort Survey 35
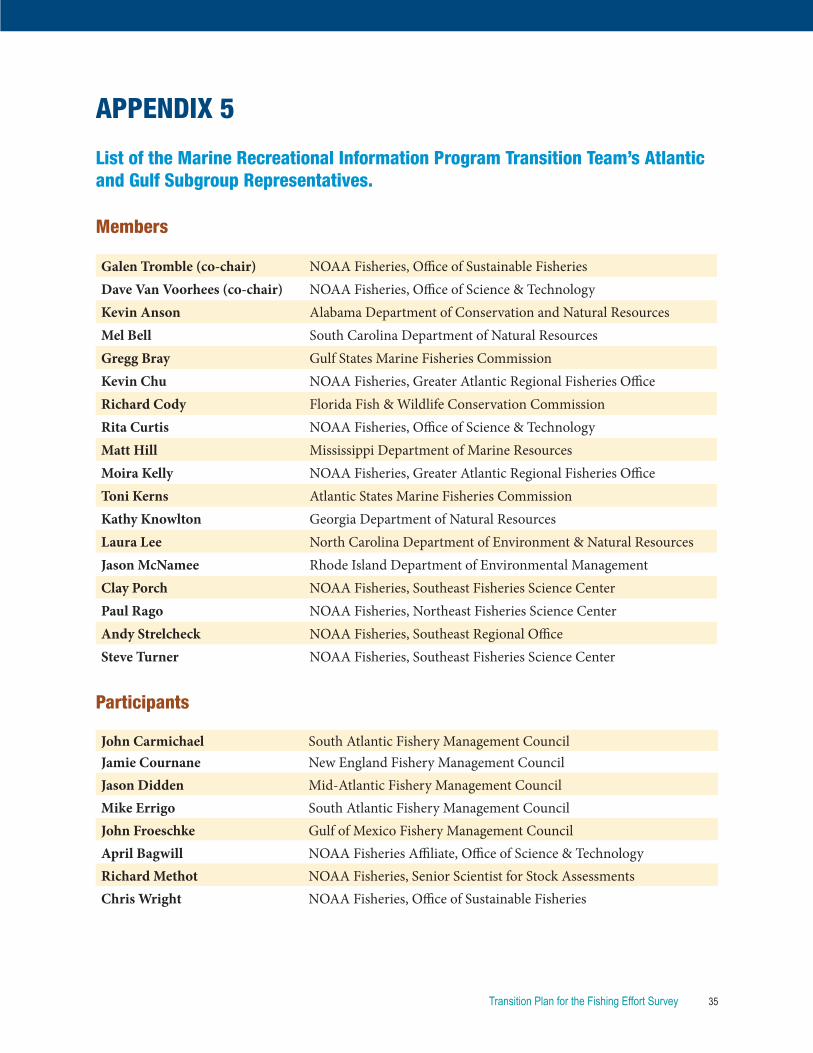
APPENDIX 5
List of the Marine Recreational Information Program Transition Team’s Atlantic and Gulf Subgroup Representatives.
Members
Galen Tromble (co-chair) NOAA Fisheries, Office of Sustainable Fisheries Dave Van Voorhees (co-chair) NOAA Fisheries, Office of Science & Technology Kevin Anson Alabama Department of Conservation and Natural ResourcesMel Bell South Carolina Department of Natural ResourcesGregg Bray Gulf States Marine Fisheries Commission Kevin Chu NOAA Fisheries, Greater Atlantic Regional Fisheries Office Richard Cody Florida Fish & Wildlife Conservation CommissionRita Curtis NOAA Fisheries, Office of Science & TechnologyMatt Hill Mississippi Department of Marine ResourcesMoira Kelly NOAA Fisheries, Greater Atlantic Regional Fisheries OfficeToni Kerns Atlantic States Marine Fisheries CommissionKathy Knowlton Georgia Department of Natural ResourcesLaura Lee North Carolina Department of Environment & Natural ResourcesJason McNamee Rhode Island Department of Environmental ManagementClay Porch NOAA Fisheries, Southeast Fisheries Science CenterPaul Rago NOAA Fisheries, Northeast Fisheries Science CenterAndy Strelcheck NOAA Fisheries, Southeast Regional OfficeSteve Turner NOAA Fisheries, Southeast Fisheries Science Center
Participants
John Carmichael South Atlantic Fishery Management CouncilJamie Cournane New England Fishery Management CouncilJason Didden Mid-Atlantic Fishery Management CouncilMike Errigo South Atlantic Fishery Management CouncilJohn Froeschke Gulf of Mexico Fishery Management CouncilApril Bagwill NOAA Fisheries Affiliate, Office of Science & TechnologyRichard Methot NOAA Fisheries, Senior Scientist for Stock AssessmentsChris Wright NOAA Fisheries, Office of Sustainable Fisheries