Using recreational echo-sounders for marine science ...
10
ACOUSTICS 2017 Page 1 of 10 Using recreational echo-sounders for marine science studies Iain M. Parnum (1), Tyler Ellement, Malcolm A. Perry (1), Miles J.G. Parsons (1), and Sira Tecchiato (2) (1) Centre for Marine Science and Technology, Curtin University, Perth, Australia (2) Department of Environment and Agriculture, Curtin University, GPO Box U 1987 Perth 6845, WA ABSTRACT In recent years, recreational echo-sounders, such as the Humminbird, Lowrance and Simrad Yachting brands, have become more advanced. These brands now offer models with the ability to log not just depth, but acoustic data from the different transducers. This paper presents methods for converting, processing and visualising data collected by recreational sounders. Examples of visualising fish aggregations and seafloor mapping are given. The examples show both the potential and the drawbacks of using such systems. 1 INTRODUCTION In recent years, recreational echo-sounders, such as the Humminbird, Lowrance and Simrad Yachting brands, have added capabilities that make them applicable for some marine science studies, in particularly the ability to record and log acoustic data (not just depth and position) from the different transducers including a sidescan sonar (sometimes referred to as “Side Imaging”). This has led to some researchers using these systems for ap- plications such as depth profiling (Shcherbina et al., 2008), substrate characterization (Kaeser and Litts, 2010; Buscombe et al., 2015), manatee surveys (Gonzalez-Socoloske et al., 2009) and mapping impacts of anchors on seagrass beds (Collins et al., 2010). However, there are some limitations and challenges in using these systems for marine science studies. One of the challenges, is the limited software available to use this data, which is usually in a proprietary binary format. There are commercial software available to produce sidescan mosaics, e.g. SonarWiz™, Reef Master™ and Sonar TRX™, the latter two of which can also output depth products. Free soft- ware called HumViewer (http://humviewer.cm-johansen.dk/) is useful for reviewing data collected and outputting the depth and position data into a text file (.csv). Python code “PyHum” developed by Buscombe (2017) is a valuable tool to process and analysis the sidescan and vertical echo-sounder data particular for substrate classi- fication. This paper presents the software, HumConverter, that converts raw Humminbird sonar data (.son, and associated .idx and .dat files) into MATLAB™ (.mat) data files, and gives examples of how this data has been be used to observe the marine environment. Advantages and limitations of using non-scientific systems for the dif- ferent applications are also discussed. 2 METHODS 2.1 Data acquisition: Humminbird 898 SI echo-sounder Data shown in the following examples were collected with a Humminbird 898 SI echo-sounder, which has 4 transducers: two vertical incidence single beam echo-sounders operating at 83 and 200 kHz, and one of two sidescan sonar transducers can be selected: either 455 or 800 kHz (Figure 1). Depending on the application, the transducer was either deployed fixed at the vessel’s transom or attached to a towfish constructed from polypipe using an extended 9 m cable (Figure 2). Fix mounting to the vessel is most appropriate for tasks where accurate positioning and depth measurements are required, but can cause more artefacts from ship’s motion. Deploying the transducer in a towfish de-couples it from the ship’s motions, but increases the uncertainty to the vertical and horizontal location of the transducer (Blondel, 2010). Data is logged using an SD card.
Transcript of Using recreational echo-sounders for marine science ...
ACOUSTICS 2017 Page 1 of 10
Using recreational echo-sounders for marine science studies
Iain M. Parnum (1), Tyler Ellement, Malcolm A. Perry (1), Miles J.G. Parsons (1), and Sira Tecchiato (2)
(1) Centre for Marine Science and Technology, Curtin University, Perth, Australia (2) Department of Environment and Agriculture, Curtin University, GPO Box U 1987 Perth 6845, WA
ABSTRACT
In recent years, recreational echo-sounders, such as the Humminbird, Lowrance and Simrad Yachting brands, have become more advanced. These brands now offer models with the ability to log not just depth, but acoustic data from the different transducers. This paper presents methods for converting, processing and visualising data collected by recreational sounders. Examples of visualising fish aggregations and seafloor mapping are given. The examples show both the potential and the drawbacks of using such systems.
1 INTRODUCTION In recent years, recreational echo-sounders, such as the Humminbird, Lowrance and Simrad Yachting brands,
have added capabilities that make them applicable for some marine science studies, in particularly the ability to record and log acoustic data (not just depth and position) from the different transducers including a sidescan sonar (sometimes referred to as “Side Imaging”). This has led to some researchers using these systems for ap-plications such as depth profiling (Shcherbina et al., 2008), substrate characterization (Kaeser and Litts, 2010; Buscombe et al., 2015), manatee surveys (Gonzalez-Socoloske et al., 2009) and mapping impacts of anchors on seagrass beds (Collins et al., 2010). However, there are some limitations and challenges in using these systems for marine science studies. One of the challenges, is the limited software available to use this data, which is usually in a proprietary binary format. There are commercial software available to produce sidescan mosaics, e.g. SonarWiz™, Reef Master™ and Sonar TRX™, the latter two of which can also output depth products. Free soft-ware called HumViewer (http://humviewer.cm-johansen.dk/) is useful for reviewing data collected and outputting the depth and position data into a text file (.csv). Python code “PyHum” developed by Buscombe (2017) is a valuable tool to process and analysis the sidescan and vertical echo-sounder data particular for substrate classi-fication. This paper presents the software, HumConverter, that converts raw Humminbird sonar data (.son, and associated .idx and .dat files) into MATLAB™ (.mat) data files, and gives examples of how this data has been be used to observe the marine environment. Advantages and limitations of using non-scientific systems for the dif-ferent applications are also discussed.
2 METHODS
2.1 Data acquisition: Humminbird 898 SI echo-sounder Data shown in the following examples were collected with a Humminbird 898 SI echo-sounder, which has 4
transducers: two vertical incidence single beam echo-sounders operating at 83 and 200 kHz, and one of two sidescan sonar transducers can be selected: either 455 or 800 kHz (Figure 1). Depending on the application, the transducer was either deployed fixed at the vessel’s transom or attached to a towfish constructed from polypipe using an extended 9 m cable (Figure 2). Fix mounting to the vessel is most appropriate for tasks where accurate positioning and depth measurements are required, but can cause more artefacts from ship’s motion. Deploying the transducer in a towfish de-couples it from the ship’s motions, but increases the uncertainty to the vertical and horizontal location of the transducer (Blondel, 2010). Data is logged using an SD card.

Proceedings of ACOUSTICS 2017 19-22 November 2017,
Perth, Australia
Page 2 of 10 ACOUSTICS 2017
Figure 1: Diagram of the different beam patterns for the Humminbird 858 SI (taken from: Humminbird (2010)).
Figure 2: The Humminbird 898 SI echo-sounder system: (a) Topside electronics and GPS, (b) Transducer mounted in a towfish with extended cable.
2.2 Data conversion: HumConverter A MATLAB executable GUI program, called HumConverter, was developed by the authors to convert Hum-
minbird data files (.dat, .son and .idx) into MATLAB data files (.mat). The Humminbird data files are well described in Buscombe (2017) and on the PyHum webpage as: *.DAT files which contain basic information about the sonar, time, position and sonar settings. It does this on the first ping, so the time and position refer only to the instant the recording is initiated;
*.SON files which contain the 8-bit sonar data (echograms);
*.IDX files (1 per SON file) which contain indices of successive pings in the corresponding SON file;
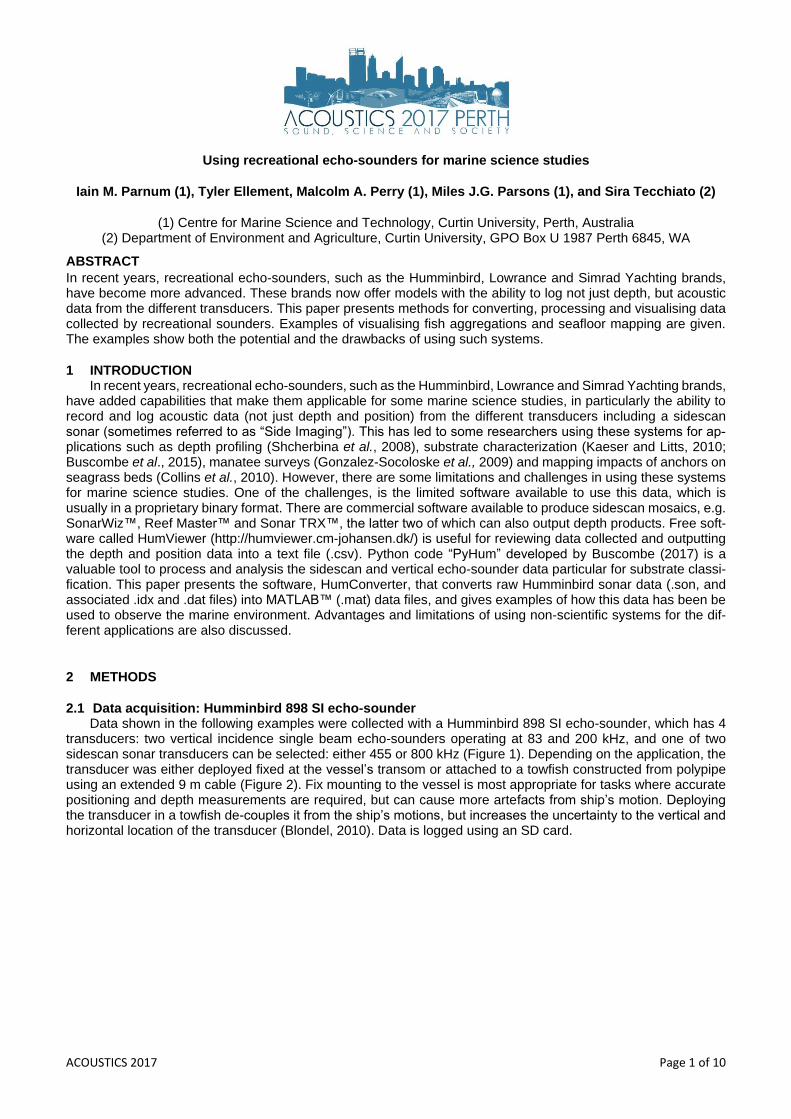
HumConverter is available on request from the lead author. Once HumConverter is installed and started, users see the screen grab shown in Figure 3. Users then selected the Humminbird model number (it supports 1199, 798, 898, 998, 1198); where the location of the .dat and .son files are; choses and the maximum number of pings per .mat file; and, then clicks to convert either a single file or a folder of files. The HumConverter program saves
Proceedings of ACOUSTICS 2017 19-22 November 2017, Perth, Australia
ACOUSTICS 2017 Page 3 of 10
separate .mat files for the different transducers/channels. The saved .mat filename is: DatFilename_SONfile-name_SON_pXX.mat, where XX is the partition number, i.e. for the first set of files this is 01, then if files have more pings than the set Packets per file then the files with be split into 01, 02… until all pings are read. For instance, for the Humminbird 898 with a .dat filename: R00001.DAT and corresponding folder with B000.SON (for the 83 kHz channel), B0001.SON (200 kHz channel), B002.SON (455/800 kHz port channel) (455/800 kHz star-board channel) files containing 6000 pings (and a maximum Packets per file of 5000), will create 2x four mat files, the first set containing pings 1 to 5000 being: R00001_B000_SON_p01.mat, R00001_B001_SON_p01.mat, R00002_B001_SON_p01.mat, R00003_B001_SON_p01.mat; then pings 5001 to 6000 in files: R00001_B000_SON_p02.mat, R00001_B001_SON_p02.mat, R00002_B001_SON_p02.mat, R00003_B001_SON_p02.mat. There are quite a few unused fields (where the variable is called spare) in the Humminbird files, which the user can decide not to save by ticking the “Remove Unused fields”. If the .IDX files are missing (e.g. loss of power can cause the file not to be closed properly when being logged), it might be possible to retrieve some of the data by ticking the “Always find packets manually” box. Ticking “Save errors” creates a file listing errors if there were problems in the conversion process. It will work without a .DAT file, the only major issue is that the converted times will be based on the time the file was last modified.
Table 1 lists some of the most useful variables saved in the converted MATLAB files. In addition, to the variables
logged by the system, there are some additional ones calculated to make processing easier, such as longitude and latitude are calculated from the UTM World Mercator Meters coordinators, and UTC time is extrapolated to each ping.
Figure 3: Screen grab of HumConverter Graphic User Interface.
Proceedings of ACOUSTICS 2017 19-22 November 2017,
Perth, Australia
Page 4 of 10 ACOUSTICS 2017
Table 1: Selected variables saved in the MATLAB files by HumConverter.
MATLAB file variable name Description
GPSquality Quality of the GPS signal (0 = good, 1=bad)
beamNumber
depth
Channel number, (e.g. 0 = 83 kHz for 898) which should be all the same number for individual files Depth value as reported for that channel in decimetres
frequency Frequency (Hz) of the transmit signal
heading Heading in tenths of a degree
latitude Latitude in degrees (WGS84)
longitude Longitude in degrees (WGS84)
samples
Sonar data (8 bit) linear units, size of data is number of pings vs number of range samples.
utmX Easting (World Mercator Meters)
utmY Northing (World Mercator Meters)
time_ms Time in ms from start of file
time UTC Time in MATLAB datenum format, i.e. days since 00-Jan-0000.
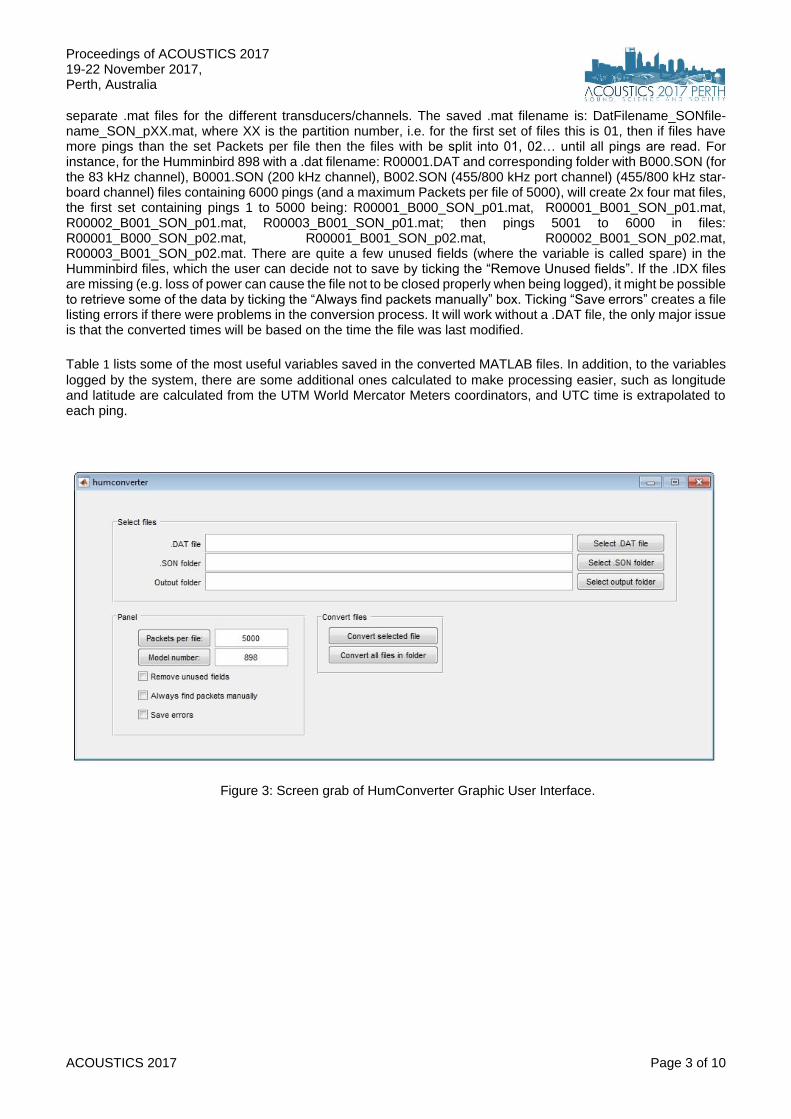
3 Mapping depth profiles in Esperance Bay, Western Australia As part of a seafloor sediment and habitat study, Humminbird data was collected to measure depth profiles
in Esperance Bay, Western Australia, in March 2016 (Tecchiato et al., 2017). The Humminbird transducer was mounted on the boat’s transom. Following conversion of the Humminbird data using HumConverter, the 200 kHz data was used, as it provided the highest resolution depth data in the vertical direction (1.95cm). The top panel of
Figure 4 shows an example of an echogram from the 200 kHz channel, with the depth pick of the Humminbird
shown in white. Although the depth pick provided by the Humminbird system in general performs well, there are some obvious erroneous points. Moreover, there seems to be an offset between them and the actual location of the seafloor. Buscombe (2017) suggested the depth values needed to be corrected for a delay in the application of the TVG. For this study, it was decided to re-pick the depth using a user defined depth filter based on the echogram and then use the maximum positive differential of the waveform from each ping as the definition of the seafloor location. The result of this is shown in black. These values were corrected for the waterline and tide and then averaged for every 5 m along track to suppress motion artefacts. The results of some of the depth profiles collected in Esperance Bay are shown in colour over a chart on the bottom panel of Figure 4, there was good agreement between the depth profiles and the chart.

Proceedings of ACOUSTICS 2017 19-22 November 2017, Perth, Australia
ACOUSTICS 2017 Page 5 of 10
Figure 4: Humminbird echo-sounder data collected in Esperance, Western Australia. Top panel: an example echogram from the 200 kHz channel with the white line the original depth pick and black line the new depth pick. Bottom panel: corrected depth values shown as a colour line over a chart, with the black square giving the loca-tion of data shown in the top panel. Chart provided under licence by the Australian Hydrographic Office, not for
navigation use.

Proceedings of ACOUSTICS 2017 19-22 November 2017,
Perth, Australia
Page 6 of 10 ACOUSTICS 2017
4 Ship wreck survey off Shelley foreshore, Swan River, Western Australia A survey of a wreck near the Shelley foreshore in the Swan River (Western Australia) was carried out 23rd
March 2012 using the Humminbird transducer mounted in the towfish is shown in Figure 2. The 455 kHz sidescan sonar was chosen. An image of the raw sidescan data, as seen in the HumView software, can be seen in the left panel in Figure 5. Following conversion of the Humminbird data using HumConverter, the 455 kHz sidescan data was geo-corrected using the following steps:
1) Correcting position for offset between GPS antenna and location of the towfish 2) Smoothing GPS data with a Kalman filter 3) Re-picking the range to the seafloor 4) Calculating the across track distance for each sample accounting for tilt of sidescan beam (assuming a
flat bottom). 5) Correct position for heading
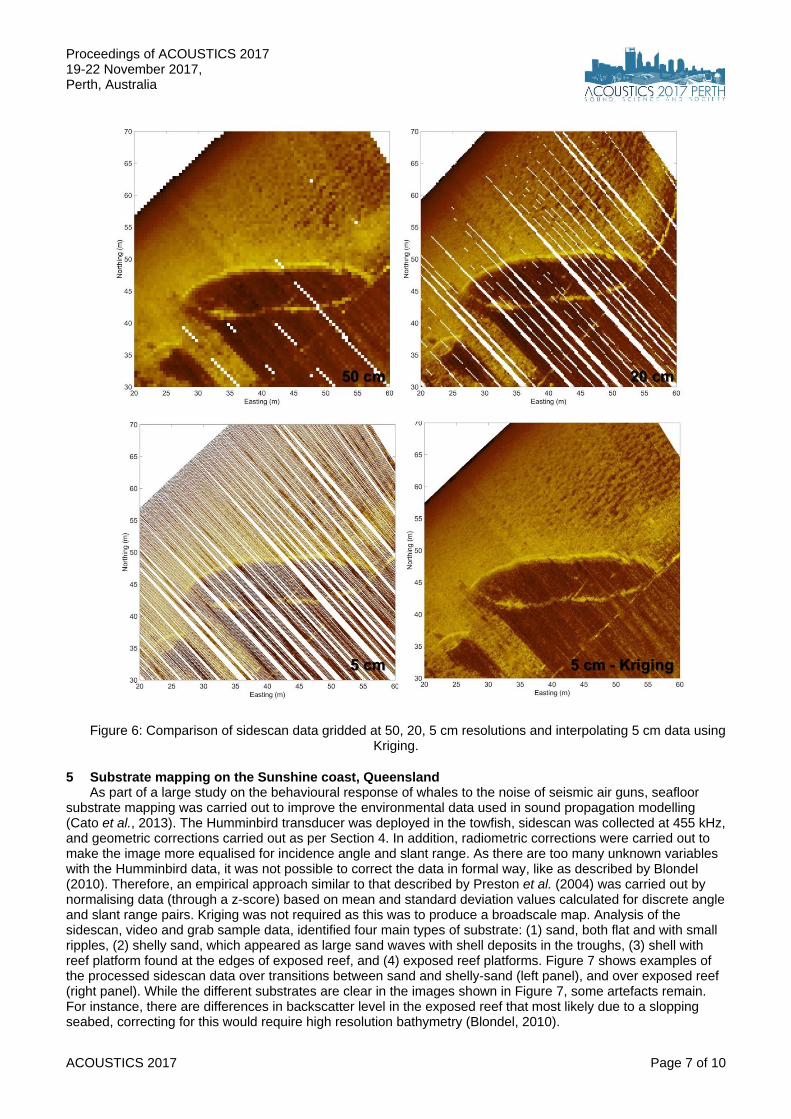
To plot the sidescan images in a Geographic Information System (GIS), e.g. ArcMap, Google Earth, etc. typically requires gridding the data in to a uniform grid and creating a geotiff. For sidescan data, the across track resolution (sampling or digitised rate) is usually better than the along track resolution (i.e. distance between pings), which can result in a loss of detail from the image (Blondel, 2010). Figure 6 shows the sidescan image over the wreck gridded at 50, 20 and 5 cm cell resolutions. Even at 50 cm resolution there are gaps in the data, thus increasing the resolution results in finer detail being resolved, but more gaps in the data. To address this issue, the data were gridded to 5 cm, which is a little more than twice as large the across track resolution, and then the interpo-lation Kriging algorithm implemented by the software Surfer was used to fill the gaps. The result is seen in Figure 5 (c) and the bottom right panel of Figure 6, where most of the detail seen in the original data (Figure 5 (a)) has been retained.
Figure 5: A wreck located off Shelley foreshore in the Swan River, Western Australia: (a) Raw Humminbird sidescan (455 kHz) data as replayed in HumViewer; (b) aerial photograph and (c) geo-corrected sidescan im-
age both displayed in ArcMap (v10.3).
Proceedings of ACOUSTICS 2017 19-22 November 2017, Perth, Australia
ACOUSTICS 2017 Page 7 of 10
Figure 6: Comparison of sidescan data gridded at 50, 20, 5 cm resolutions and interpolating 5 cm data using Kriging.
5 Substrate mapping on the Sunshine coast, Queensland As part of a large study on the behavioural response of whales to the noise of seismic air guns, seafloor
substrate mapping was carried out to improve the environmental data used in sound propagation modelling (Cato et al., 2013). The Humminbird transducer was deployed in the towfish, sidescan was collected at 455 kHz, and geometric corrections carried out as per Section 4. In addition, radiometric corrections were carried out to make the image more equalised for incidence angle and slant range. As there are too many unknown variables with the Humminbird data, it was not possible to correct the data in formal way, like as described by Blondel (2010). Therefore, an empirical approach similar to that described by Preston et al. (2004) was carried out by normalising data (through a z-score) based on mean and standard deviation values calculated for discrete angle and slant range pairs. Kriging was not required as this was to produce a broadscale map. Analysis of the sidescan, video and grab sample data, identified four main types of substrate: (1) sand, both flat and with small ripples, (2) shelly sand, which appeared as large sand waves with shell deposits in the troughs, (3) shell with reef platform found at the edges of exposed reef, and (4) exposed reef platforms. Figure 7 shows examples of the processed sidescan data over transitions between sand and shelly-sand (left panel), and over exposed reef (right panel). While the different substrates are clear in the images shown in Figure 7, some artefacts remain. For instance, there are differences in backscatter level in the exposed reef that most likely due to a slopping seabed, correcting for this would require high resolution bathymetry (Blondel, 2010).

Proceedings of ACOUSTICS 2017 19-22 November 2017,
Perth, Australia
Page 8 of 10 ACOUSTICS 2017
Figure 7: Humminbird (455 kHz) sidescan data collected over: (a) transitions between sand (dark brown areas) and shelly sand (yellow areas); and (b) exposed reef platform.
6 Fish survey in Cockburn Sound, Western Australia During a fish survey carried out using a multifrequency Biosonics DTX scientific echo-sounder system by
Landero et al (2016), Humminbird echo-sounder data was also collected to compare its ability to map fish tar-gets and schools. The Biosonics transducers (38, 120 and 400 kHz) were being towed on a pontoon beside the boat and processed as detailed by Landero et al (2016); whereas, the Humminbird transducer was mounted on the boat’s transom. After converting the Humminbird data, they were plotted as echograms. Figure 8 shows a comparison between the two systems over an area containing fish targets and a large fish school. There were concerns about acoustic interference between the systems, but no interference was detected on the Biosonics system at the levels of backscatter investigated here, and the main source of noise on the Humminbird data was from aeration and motion causing spikes and dropouts of data (Figure 8). The Humminbird had a lower signal-to-noise ratio compared to the Biosonics, but there was good agreement between the systems in detecting and broad mapping of schools. The main drawback to using the Humminbird for such fisheries applications is the lack of understanding of the system and uncertainty in the stability preventing formal measurements, like Target Strength (MacLennan and Simmonds, 2013), but counting individual targets and measuring some school mor-pholgical parameters is certainly possible (Parsons, 2009; MacLennan and Simmonds, 2013).

Proceedings of ACOUSTICS 2017 19-22 November 2017, Perth, Australia
ACOUSTICS 2017 Page 9 of 10
Figure 8: Single beam echograms over fish targets and schools in Cockburn: (top) Sv values Biosonics DTX echo-sounder at 38 kHz; and (bottom) 20 log10 (Digital numbers) of the Humminbird 898 echosounder at 200
kHz.

Proceedings of ACOUSTICS 2017 19-22 November 2017,
Perth, Australia
Page 10 of 10 ACOUSTICS 2017
7 SUMMARY Increasing limitations on research programs from financial pressure and time-deficient deadlines continually
lead towards scientists and managers sourcing more cost-effective, novel or community driven methods of data collection. This work describes the development of software to make use of acoustic data collected with recrea-tional echo-sounder and sidescan sonar systems. It has provided a series of examples of where seafloor and water-column data collected with a Humminbird system can be applied to aid marine research. Although the resolution and signal-to-noise ratio is lower compared with more sophisticated and expensive sonar systems, for some applications the results are good enough to fulfil objectives of the study and are more affordable. Moreover, this data could potentially be collected by citizen scientists on a much larger scale, promoting the possibility of survey replication over time, or increased spatial coverage.
8 FUTURE WORK There are more recreational sounders being used than scientific ones, and so offer a potentially cost-effec-tive strategy for mapping and monitoring the marine environment. The first step of this approach is to make the data more accessible to scientific analysis (e.g. MATLAB), along with other software and code such as PyHum (Buscombe, 2017) already available, HumConverter hopes to help achieve that. The authors have also developed beta code to convert the Simrad/Lowrance (.sl2) files in to MATLAB data (.mat) files. The next step is combing large (and possibly multisource) datasets to meaningful and useful data products. This brings new challenges, such as instead less systematic sampling; however, it in some areas it might offer the only affordable option and so is worth exploring.
REFERENCES Blondel, Philippe. The handbook of sidescan sonar. Springer Science & Business Media, 2010. Buscombe, Daniel. "Shallow water benthic imaging and substrate characterization using recreational-grade
sidescan-sonar." Environmental Modelling & Software 89 (2017): 1-18. Buscombe, Daniel, Paul E. Grams, and Sean MC Smith. "Automated riverbed sediment classification using low-
cost sidescan sonar." Journal of Hydraulic Engineering 142, no. 2 (2015): 06015019. Cato, Douglas H., Michael J. Noad, Rebecca A. Dunlop, Robert D. McCauley, Nicholas J. Gales, Chandra P.
Salgado Kent, Hendrik Kniest et al. "A study of the behavioural response of whales to the noise of seismic air guns: Design, methods and progress." Acoustics Australia 41, no. 1 (2013): 88-97.
Collins, K. J., A. M. Suonpää, and J. J. Mallinson. "The impacts of anchoring and mooring in seagrass, Studland Bay, Dorset, UK." Underwater Technology 29, no. 3 (2010): 117-123.
Gonzalez-Socoloske, Daniel, Leon David Olivera-Gomez, and Robert E. Ford. "Detection of free-ranging West Indian manatees Trichechus manatus using side-scan sonar." Endangered species research (2009): 249.
Humminbird. (2010). Installation and operations manual. Kaeser, Adam J., and Thomas L. Litts. "A novel technique for mapping habitat in navigable streams using low-
cost side scan sonar." Fisheries 35.4 (2010): 163-174. Landero, M., Iain Parnum, Miles Parsons, Chandra Salgado-Kent, and Ben Saunders. "Integrating echo-sounder
and underwater video data for demersal fish assessment." In Proceedings of Acoustics2016-The Second Australasian Acoustical Societies Conference. 2016.
MacLennan, David N., and E. John Simmonds. Fisheries acoustics. Vol. 5. Springer Science & Business Media, 2013.
Parsons, Miles James Gerard. "An investigation into active and passive acoustic techniques to study aggregating fish species." PhD diss., 2009.
Preston, J. M., A. C. Christney, L. S. Beran, and W. T. Collins. "Statistical seabed segmentation—from images and echoes to objective clustering." In Proceedings of the Seventh European Conference on Underwater Acoustics, ECUA, pp. 5-8. 2004.
Shcherbina, Andrey Y., Glen G. Gawarkiewicz, Christopher A. Linder, and Simon R. Thorrold. "Mapping bathy-metric and hydrographic features of Glover's Reef, Belize, with a REMUS autonomous underwater vehi-cle." Limnology and Oceanography 53, no. 5part2 (2008): 2264-2272.
Tecchiato, S., De Muro, S., Buosi, C., Ibba, A., Parnum, I.M. and Mick O’Leary. (2017). Esperance benthic habi-tats and their relationship with coastal sediment dynamics. Preliminary Project Report. Curtin University.