
Marginal Emissions Factors for the US Electricity System Kyle Siler-Evans Department of Engineering...
19
Marginal Emissions Factors for the US Electricity System Kyle Siler-Evans Department of Engineering & Public Policy Carnegie Mellon University
-
Upload
ann-cameron -
Category
Documents
-
view
215 -
download
0
Transcript of Marginal Emissions Factors for the US Electricity System Kyle Siler-Evans Department of Engineering...

Marginal Emissions Factors for the US Electricity System
Kyle Siler-EvansDepartment of Engineering & Public Policy
Carnegie Mellon University

Research Question
2
Avoided Energy(MWh)
Avoided Emissions(kg)
?
-CO2, NOx, SO2
Energy efficiency is widely seen as the low-hanging fruit for CO2 reductions

Data• Continuous Emissions Monitoring System
(CEMS)– Hourly, generator level CO2, SO2, and NOx
emissions data– Includes fossil-fuel generators larger than 25MW
3

Method & Example AnalysisΔG = Gh – Gh+1 (MWh)
ΔE = Eh – Eh+1 (kg)
4
Marginal CO2 Factor MRO region (Midwest)

Method & Example Analysis
5
Marginal Fuels: MRO Region (Midwest)
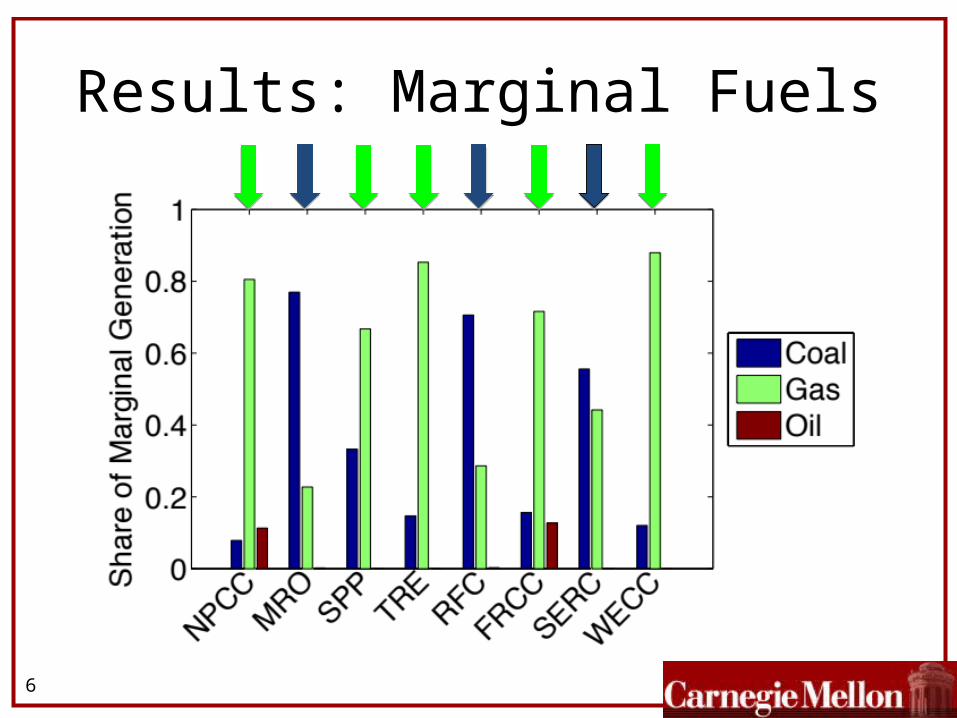
Results: Marginal Fuels
6

Results: Marginal Fuels
7

Results: Marginal Fuels in SPP
8
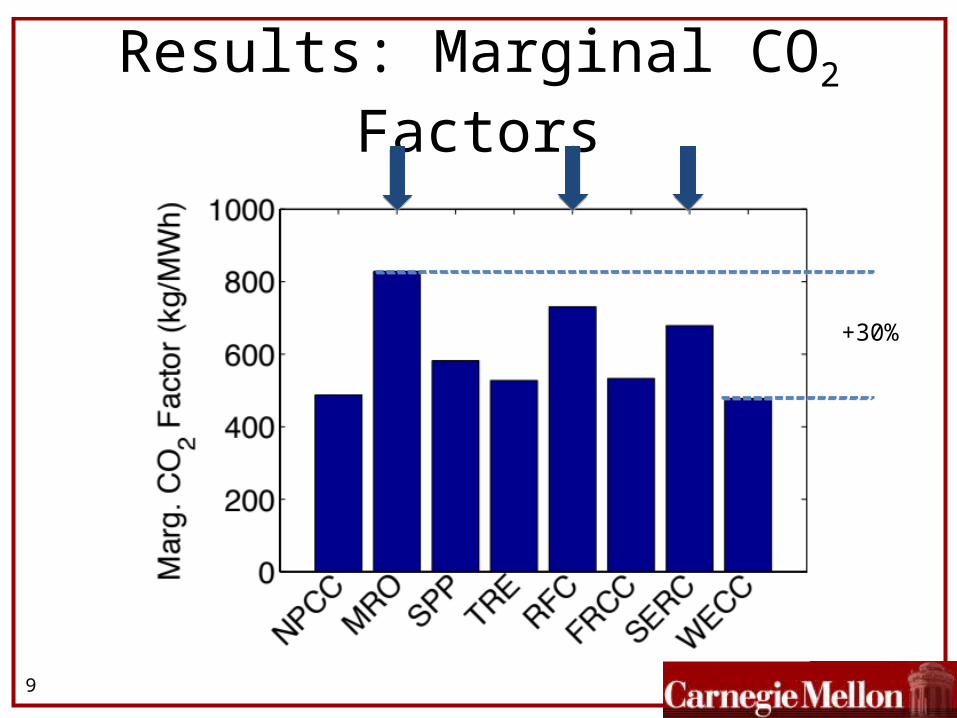
Results: Marginal CO2 Factors
9
+30%

Results: Marginal SO2 Factors
10
20 ×

Results: Influence of dispatch order
11
System Demand (GW) System Demand (GW)
MRO (Midwest)

Results: Influence of dispatch order
12
System Demand (GW) System Demand (GW)
TRE (Texas)

Results: Influence of dispatch order
13
System Demand (GW)System Demand (GW)
FRCC (Florida)
14
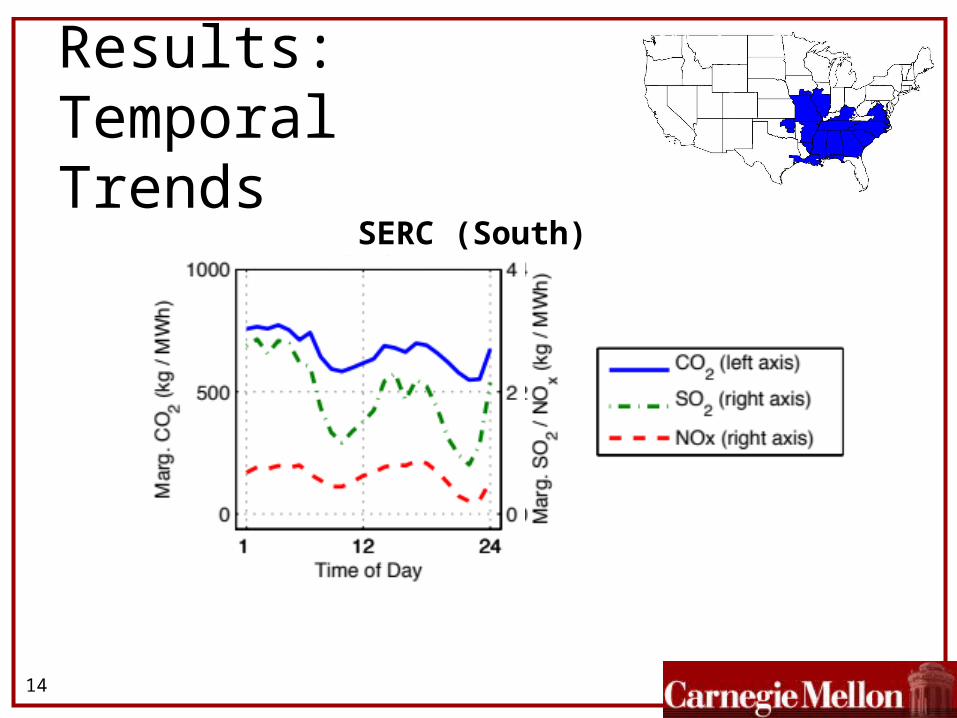
SERC (South)
Results: Temporal Trends

15
SERC (South)
Results: Temporal Trends

Summary & Conclusions
• Policies often focus on energy, while our goal is (or should be) on emissions.
• Marginal emissions factors give a consistent metric for calculating displaced emissions.
16

Summary & Conclusions
• There are significant regional differences in the emissions benefits of avoiding 1 MWh of electricity.– Compared to WECC (West), an equivalent energy
efficiency measure in MRO (Midwest) is expected to avoid roughly 75% more CO2, 12 times more SO2, and 3 times more NOx emissions
17

Summary & Conclusions
• Average emissions rates may grossly misestimate the emissions benefit of an intervention.
• Temporal differences are modest in terms of marginal CO2 rates, but more pronounced when considering NOx and SO2.
18

Thank You
Questions?
19


![Universidad del Cauca. Siler Amador Donado [Relis] samador ...](https://static.fdocuments.net/doc/165x107/618d03ad98d5b4372b738e84/universidad-del-cauca-siler-amador-donado-relis-samador-.jpg)
