Crew Boat Market Report - November 2013 - Marcon International, Inc

Marcon International, Inc. Vessels and Barges for Sale or Charter Worldwide
www.marcon.com
Details believed correct, not guaranteed. Offered subject to availability.
P.O. Box 1170, 9 NW Front Street, Suite 201 Coupeville, WA 98239 U.S.A. Telephone (360) 678 8880 Fax (360) 678-8890 E Mail: [email protected] http://www.marcon.com
May 2015
Inland Pushboat Market Report Following is a breakdown of pushboats Marcon has available for sale worldwide. Most of these are typical U.S. inland river units, although there are a few foreign pushboats listed from Europe, Latin America and Southeast Asia.
Horsepower Ranges Under
1,000 1,000 – 2,000
2,000 – 3,000
3,000 – 4,000
4,000 – 5,000
5,000 – 6,000
6,000 – 7,000
Over 7,000
Total
Jun 1996 75 19 5 10 7 5 7 0 128
Apr 1997 60 16 4 12 3 2 0 0 97
Jan 1998 66 22 6 12 2 2 0 0 110
Jan 1999 58 18 4 8 3 0 1 0 92
Jan 2000 73 25 6 7 3 1 1 0 116
Jan 2001 61 33 4 7 3 0 2 0 110
Feb 2002 48 11 3 3 0 0 0 0 65
Feb 2003 57 30 4 14 2 0 0 0 107
Feb 2004 39 22 6 7 1 0 0 0 75
Feb 2005 33 13 9 7 2 0 0 0 64
Feb 2006 26 5 7 4 1 0 0 0 43
Feb 2007 22 5 6 4 1 0 0 0 38
Feb 2008 20 17 7 5 5 0 0 0 54
Feb 2009 17 14 6 4 5 0 0 0 46
Feb 2010 33 25 13 10 6 0 0 0 87
Feb 2011 37 26 8 6 3 0 0 0 80
Feb 2012 31 19 6 4 1 4 0 4 69
Feb 2013 31 28 18 8 7 4 1 4 101
May 2013 29 25 16 10 8 3 1 4 96
Aug 2013 27 30 16 9 10 3 1 0 96
Nov 2013 32 29 16 9 9 3 1 0 99
Feb 2014 31 28 13 6 5 1 1 0 85
May 2014 30 27 13 7 5 1 0 0 83
Aug 2014 28 28 15 7 5 2 0 0 85
Nov 2014 27 24 10 7 6 2 0 0 76
Feb 2015 25 24 12 6 6 2 0 0 75
May 2015 – Worldwide 28 19 10 5 4 1 0 0 67
May 2015 – U.S. 25 15 6 5 2 0 0 0 53
May 2015 – Foreign 3 4 4 0 2 1 0 0 14
Avg. Age - Worldwide 1975 1968 1970 1966 1969 1981 0 0
Avg. Age – U.S. 1975 1964 1964 1966 1955 0 0 0
Avg. Age – Foreign 1978 1982 1977 0 1997 1981 0 0
For Charter - Worldwide 5 8 5 0 0 0 0 0 18
For Charter – U.S. 4 5 1 0 0 0 0 0 10
For Charter - Foreign 1 3 4 0 0 0 0 0 8
Up Since Last Report Down Since Last Report Not included though in the list are those vessels, which are not officially on the market, but could be developed on a private and confidential basis.
Market Overview Of the 13,054 vessels (excluding barges) Marcon currently tracks, 704 are inland river pushboats with 67 officially on the market for sale (53 U.S. flag and 14 foreign flag). Five of the boats with age listed were built within the last ten years, though all five of them were built in 2005. 35 boats are forty-five years of age or older. The oldest listed is a 1,500HP, 80 footer built in 1939 (photo right), but rebuilt and repowered many times since and still going strong.
Marcon International, Inc. Inland Push Boat Market Report – May 2015
www.marcon.com
Details believed correct, not guaranteed. Offered subject to availability.
2
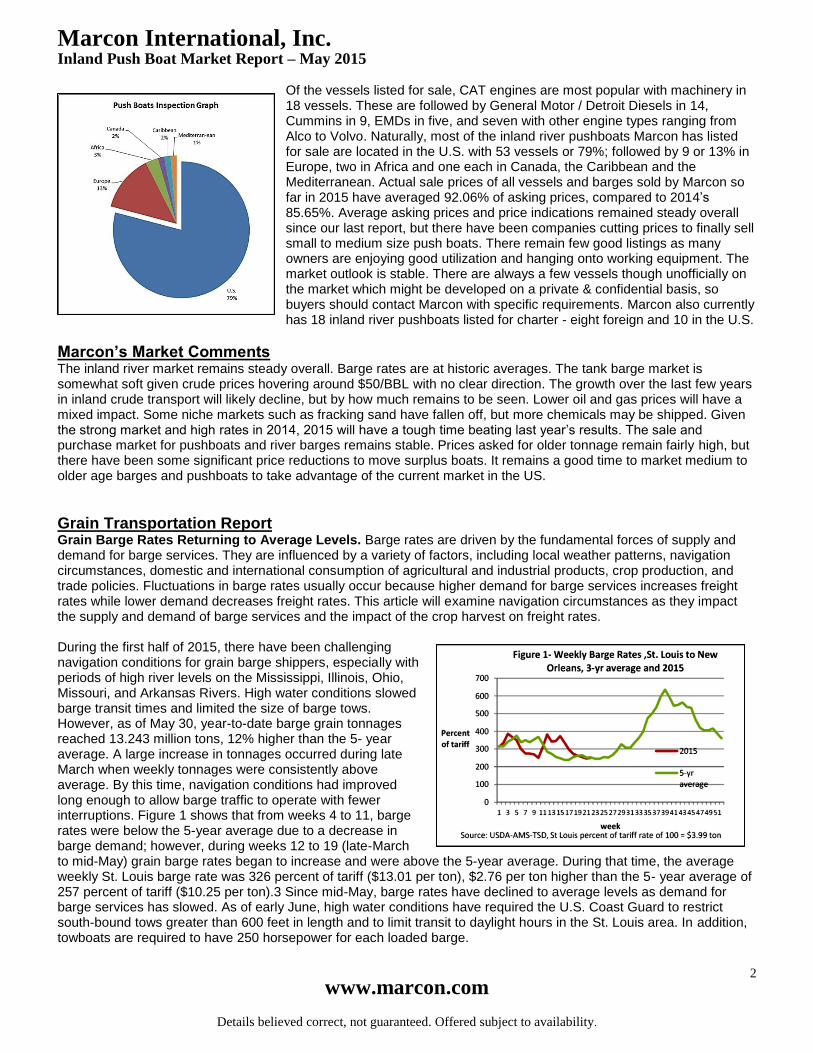
Of the vessels listed for sale, CAT engines are most popular with machinery in 18 vessels. These are followed by General Motor / Detroit Diesels in 14, Cummins in 9, EMDs in five, and seven with other engine types ranging from Alco to Volvo. Naturally, most of the inland river pushboats Marcon has listed for sale are located in the U.S. with 53 vessels or 79%; followed by 9 or 13% in Europe, two in Africa and one each in Canada, the Caribbean and the Mediterranean. Actual sale prices of all vessels and barges sold by Marcon so far in 2015 have averaged 92.06% of asking prices, compared to 2014’s 85.65%. Average asking prices and price indications remained steady overall since our last report, but there have been companies cutting prices to finally sell small to medium size push boats. There remain few good listings as many owners are enjoying good utilization and hanging onto working equipment. The market outlook is stable. There are always a few vessels though unofficially on the market which might be developed on a private & confidential basis, so buyers should contact Marcon with specific requirements. Marcon also currently has 18 inland river pushboats listed for charter - eight foreign and 10 in the U.S.
Marcon’s Market Comments The inland river market remains steady overall. Barge rates are at historic averages. The tank barge market is somewhat soft given crude prices hovering around $50/BBL with no clear direction. The growth over the last few years in inland crude transport will likely decline, but by how much remains to be seen. Lower oil and gas prices will have a mixed impact. Some niche markets such as fracking sand have fallen off, but more chemicals may be shipped. Given the strong market and high rates in 2014, 2015 will have a tough time beating last year’s results. The sale and purchase market for pushboats and river barges remains stable. Prices asked for older tonnage remain fairly high, but there have been some significant price reductions to move surplus boats. It remains a good time to market medium to older age barges and pushboats to take advantage of the current market in the US.
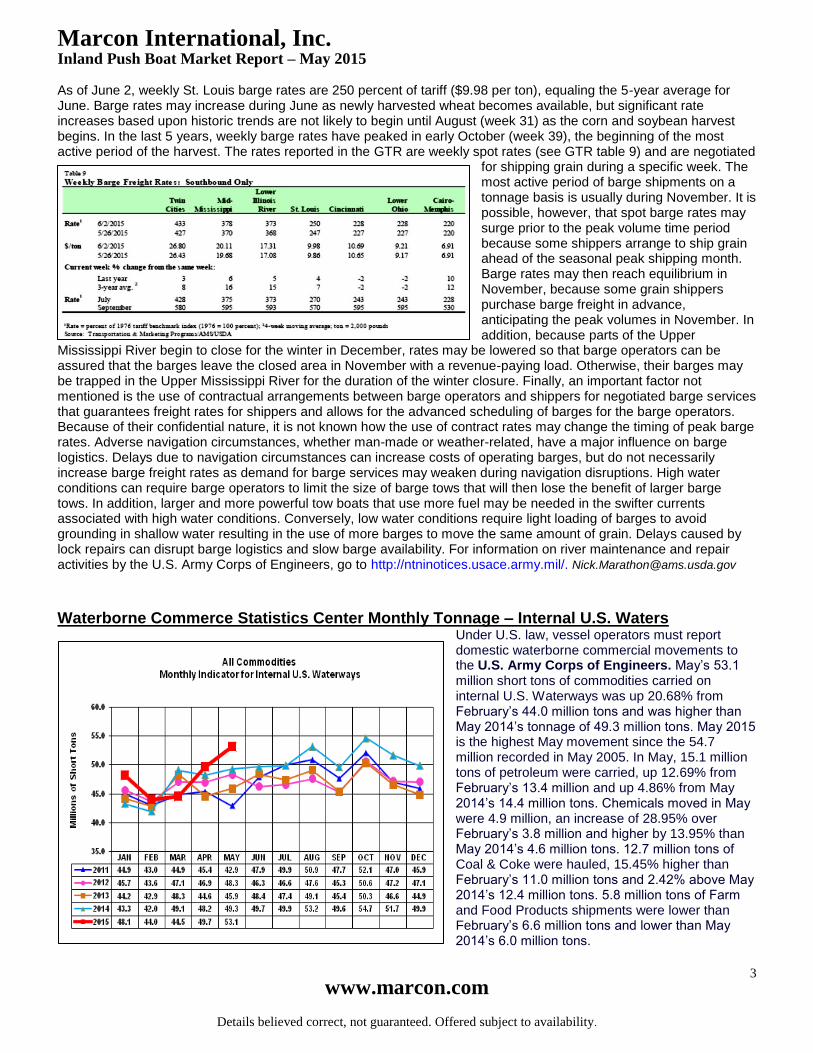
Grain Transportation Report Grain Barge Rates Returning to Average Levels. Barge rates are driven by the fundamental forces of supply and demand for barge services. They are influenced by a variety of factors, including local weather patterns, navigation circumstances, domestic and international consumption of agricultural and industrial products, crop production, and trade policies. Fluctuations in barge rates usually occur because higher demand for barge services increases freight rates while lower demand decreases freight rates. This article will examine navigation circumstances as they impact the supply and demand of barge services and the impact of the crop harvest on freight rates. During the first half of 2015, there have been challenging navigation conditions for grain barge shippers, especially with periods of high river levels on the Mississippi, Illinois, Ohio, Missouri, and Arkansas Rivers. High water conditions slowed barge transit times and limited the size of barge tows. However, as of May 30, year-to-date barge grain tonnages reached 13.243 million tons, 12% higher than the 5- year average. A large increase in tonnages occurred during late March when weekly tonnages were consistently above average. By this time, navigation conditions had improved long enough to allow barge traffic to operate with fewer interruptions. Figure 1 shows that from weeks 4 to 11, barge rates were below the 5-year average due to a decrease in barge demand; however, during weeks 12 to 19 (late-March to mid-May) grain barge rates began to increase and were above the 5-year average. During that time, the average weekly St. Louis barge rate was 326 percent of tariff ($13.01 per ton), $2.76 per ton higher than the 5- year average of 257 percent of tariff ($10.25 per ton).3 Since mid-May, barge rates have declined to average levels as demand for barge services has slowed. As of early June, high water conditions have required the U.S. Coast Guard to restrict south-bound tows greater than 600 feet in length and to limit transit to daylight hours in the St. Louis area. In addition, towboats are required to have 250 horsepower for each loaded barge.
Marcon International, Inc. Inland Push Boat Market Report – May 2015
www.marcon.com
Details believed correct, not guaranteed. Offered subject to availability.
3
As of June 2, weekly St. Louis barge rates are 250 percent of tariff ($9.98 per ton), equaling the 5-year average for June. Barge rates may increase during June as newly harvested wheat becomes available, but significant rate increases based upon historic trends are not likely to begin until August (week 31) as the corn and soybean harvest begins. In the last 5 years, weekly barge rates have peaked in early October (week 39), the beginning of the most active period of the harvest. The rates reported in the GTR are weekly spot rates (see GTR table 9) and are negotiated
for shipping grain during a specific week. The most active period of barge shipments on a tonnage basis is usually during November. It is possible, however, that spot barge rates may surge prior to the peak volume time period because some shippers arrange to ship grain ahead of the seasonal peak shipping month. Barge rates may then reach equilibrium in November, because some grain shippers purchase barge freight in advance, anticipating the peak volumes in November. In addition, because parts of the Upper
Mississippi River begin to close for the winter in December, rates may be lowered so that barge operators can be assured that the barges leave the closed area in November with a revenue-paying load. Otherwise, their barges may be trapped in the Upper Mississippi River for the duration of the winter closure. Finally, an important factor not mentioned is the use of contractual arrangements between barge operators and shippers for negotiated barge services that guarantees freight rates for shippers and allows for the advanced scheduling of barges for the barge operators. Because of their confidential nature, it is not known how the use of contract rates may change the timing of peak barge rates. Adverse navigation circumstances, whether man-made or weather-related, have a major influence on barge logistics. Delays due to navigation circumstances can increase costs of operating barges, but do not necessarily increase barge freight rates as demand for barge services may weaken during navigation disruptions. High water conditions can require barge operators to limit the size of barge tows that will then lose the benefit of larger barge tows. In addition, larger and more powerful tow boats that use more fuel may be needed in the swifter currents associated with high water conditions. Conversely, low water conditions require light loading of barges to avoid grounding in shallow water resulting in the use of more barges to move the same amount of grain. Delays caused by lock repairs can disrupt barge logistics and slow barge availability. For information on river maintenance and repair activities by the U.S. Army Corps of Engineers, go to http://ntninotices.usace.army.mil/. [email protected]
Waterborne Commerce Statistics Center Monthly Tonnage – Internal U.S. Waters
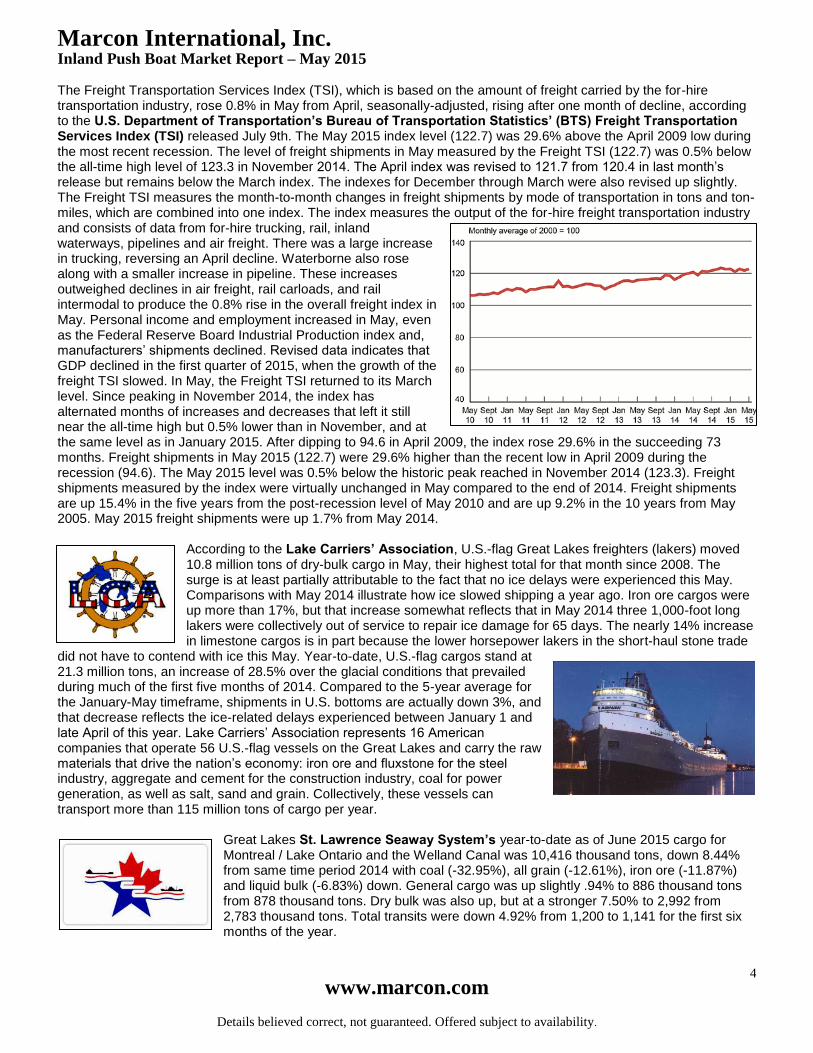
Under U.S. law, vessel operators must report domestic waterborne commercial movements to the U.S. Army Corps of Engineers. May’s 53.1 million short tons of commodities carried on internal U.S. Waterways was up 20.68% from February’s 44.0 million tons and was higher than May 2014’s tonnage of 49.3 million tons. May 2015 is the highest May movement since the 54.7 million recorded in May 2005. In May, 15.1 million tons of petroleum were carried, up 12.69% from February’s 13.4 million and up 4.86% from May 2014’s 14.4 million tons. Chemicals moved in May were 4.9 million, an increase of 28.95% over February’s 3.8 million and higher by 13.95% than May 2014’s 4.6 million tons. 12.7 million tons of Coal & Coke were hauled, 15.45% higher than February’s 11.0 million tons and 2.42% above May 2014’s 12.4 million tons. 5.8 million tons of Farm and Food Products shipments were lower than February’s 6.6 million tons and lower than May 2014’s 6.0 million tons.
Marcon International, Inc. Inland Push Boat Market Report – May 2015
www.marcon.com
Details believed correct, not guaranteed. Offered subject to availability.
4
The Freight Transportation Services Index (TSI), which is based on the amount of freight carried by the for-hire transportation industry, rose 0.8% in May from April, seasonally-adjusted, rising after one month of decline, according to the U.S. Department of Transportation’s Bureau of Transportation Statistics’ (BTS) Freight Transportation Services Index (TSI) released July 9th. The May 2015 index level (122.7) was 29.6% above the April 2009 low during the most recent recession. The level of freight shipments in May measured by the Freight TSI (122.7) was 0.5% below the all-time high level of 123.3 in November 2014. The April index was revised to 121.7 from 120.4 in last month’s release but remains below the March index. The indexes for December through March were also revised up slightly. The Freight TSI measures the month-to-month changes in freight shipments by mode of transportation in tons and ton-miles, which are combined into one index. The index measures the output of the for-hire freight transportation industry and consists of data from for-hire trucking, rail, inland waterways, pipelines and air freight. There was a large increase in trucking, reversing an April decline. Waterborne also rose along with a smaller increase in pipeline. These increases outweighed declines in air freight, rail carloads, and rail intermodal to produce the 0.8% rise in the overall freight index in May. Personal income and employment increased in May, even as the Federal Reserve Board Industrial Production index and, manufacturers’ shipments declined. Revised data indicates that GDP declined in the first quarter of 2015, when the growth of the freight TSI slowed. In May, the Freight TSI returned to its March level. Since peaking in November 2014, the index has alternated months of increases and decreases that left it still near the all-time high but 0.5% lower than in November, and at the same level as in January 2015. After dipping to 94.6 in April 2009, the index rose 29.6% in the succeeding 73 months. Freight shipments in May 2015 (122.7) were 29.6% higher than the recent low in April 2009 during the recession (94.6). The May 2015 level was 0.5% below the historic peak reached in November 2014 (123.3). Freight shipments measured by the index were virtually unchanged in May compared to the end of 2014. Freight shipments are up 15.4% in the five years from the post-recession level of May 2010 and are up 9.2% in the 10 years from May 2005. May 2015 freight shipments were up 1.7% from May 2014.
According to the Lake Carriers’ Association, U.S.-flag Great Lakes freighters (lakers) moved 10.8 million tons of dry-bulk cargo in May, their highest total for that month since 2008. The surge is at least partially attributable to the fact that no ice delays were experienced this May. Comparisons with May 2014 illustrate how ice slowed shipping a year ago. Iron ore cargos were up more than 17%, but that increase somewhat reflects that in May 2014 three 1,000-foot long lakers were collectively out of service to repair ice damage for 65 days. The nearly 14% increase in limestone cargos is in part because the lower horsepower lakers in the short-haul stone trade
did not have to contend with ice this May. Year-to-date, U.S.-flag cargos stand at 21.3 million tons, an increase of 28.5% over the glacial conditions that prevailed during much of the first five months of 2014. Compared to the 5-year average for the January-May timeframe, shipments in U.S. bottoms are actually down 3%, and that decrease reflects the ice-related delays experienced between January 1 and late April of this year. Lake Carriers’ Association represents 16 American companies that operate 56 U.S.-flag vessels on the Great Lakes and carry the raw materials that drive the nation’s economy: iron ore and fluxstone for the steel industry, aggregate and cement for the construction industry, coal for power generation, as well as salt, sand and grain. Collectively, these vessels can transport more than 115 million tons of cargo per year.
Great Lakes St. Lawrence Seaway System’s year-to-date as of June 2015 cargo for Montreal / Lake Ontario and the Welland Canal was 10,416 thousand tons, down 8.44% from same time period 2014 with coal (-32.95%), all grain (-12.61%), iron ore (-11.87%) and liquid bulk (-6.83%) down. General cargo was up slightly .94% to 886 thousand tons from 878 thousand tons. Dry bulk was also up, but at a stronger 7.50% to 2,992 from 2,783 thousand tons. Total transits were down 4.92% from 1,200 to 1,141 for the first six months of the year.

Marcon International, Inc. Inland Push Boat Market Report – May 2015
www.marcon.com
Details believed correct, not guaranteed. Offered subject to availability.
5
Bunker Prices Worldwide In April, prices slightly rebounded in Rotterdam and Singapore, but the gains were closely countered by declines in Fujairah and Houston. In May, we saw increases in all areas. Fujairah, historically less volatile than other areas, reported a very modest increase for the first time since July 2014 as it rose 0.68% to May’s average US$ 737.00/mt from April’s average US$ 732.00/mt. In the U.S., Houston increased 6.20% to US$ 651.00/mt from US$ 613.00/mt. Rotterdam increased 7.96% to US$ 583.50/mt from US$ 540.50/mt and Singapore rose by 6.89% to US$ 589.50/mt from US$ 551.50/mt. In the United States, Kirby Corporation’s average 249 towboats operating with their 905 inland tank barges on inland waterways of the U.S. average cost per gallon for fuel consumed during first quarter 2015 was US$ 2.06 per U.S. gallon compared to US$ 2.83/gallon for fourth quarter 2014 and US$ 3.13/gallon during the comparable first quarter of 2014. During first quarter 2015, Kirby’s inland tank barge utilization remained in the 90 – 95% range. Customers did return some barges moving crude oil and condensate during the quarter; however, most of the returned barges were put to work elsewhere in Kirby's system. The industry did see some reduced utilization and some degree of negative pressure on both spot and contract rates. Inland marine operating conditions presented challenges during the quarter with heavy ice on the Illinois and Upper Ohio Rivers and heavy fog on the Gulf Coast. The constant fluctuation in fuel prices on the West Coast continues to frustrate drivers and vessel operators alike. February’s increases of 24.02% to 27.09%, March’s decreases of 11.38% to 13.05% and April’s increases of 18.5 - 22.9% have now been followed by a mild smoothing out of increases in most areas reported in May. Reviewing OPIS
contract average weekly prices of ultra-low sulphur diesel for the week ending 29th
May compared to the week ending 1st May we saw Seattle increase by 5.38% to
US$ 2.43 per gallon from US$ 2.30. Fuel in Portland, Oregon matched Seattle’s at US$ 2.43/gal (US$ 2.31/gal), a 5.08% jump. Diesel in San Francisco declined a modest 3.51% to US$ 2.34/gal from the US$ 2.42/gal average paid the end of April and Los Angeles / Long Beach / El Segundo grew a marginal 0.86% to US$ 2.21/gal from US$ 2.27/gal. Usually we see increases after Memorial Day weekend and as we move closer to summer with schools getting out and vacations starting. However this year, the first week of June saw decreases in all areas reported on the West Coast, with Seattle and Portland both at US$ 2.35, San Francisco US$ 2.23 and Los Angeles / Long Beach / El Segundo at US$ 2.21.
According to the Paris-based, International Energy Agency’s “Oil Market Report”, product market strength and rising tension throughout the Mid-East supported global crude oil prices in May and through early June. At the time of writing, ICE Brent was trading at around $65.95/bbl, while US WTI was at $61.50/bbl. Global oil supplies fell by 155 kb/d in May to 96 mb/d on lower non-OPEC output, but remained at a steep 3.0 mb/d above last year. Annual growth slowed marginally from March and April and remained roughly split between non-OPEC and OPEC countries. Forecast of non-OPEC supply growth for 2015 has been raised to 1 mb/d. OPEC supply in May edged up 50 kb/d to 31.33 mb/d, the highest since August 2012. Saudi Arabia, Iraq and UAE pumped at record monthly rates to keep output over 1 mb/d above OPEC's official supply target for a third month running. Oil ministers agreed

Marcon International, Inc. Inland Push Boat Market Report – May 2015
www.marcon.com
Details believed correct, not guaranteed. Offered subject to availability.
6
to maintain that target. The estimate of global demand growth has been revised up to 1.7 mb/d for 1Q15 and 1.4 mb/d for 2015 as a whole. Momentum is expected to ease somewhat in 2H15, assuming a return to normal weather conditions and given a recent partial recovery in oil prices. Global refinery crude runs reached an estimated 77.9 mb/d in April, 0.3 mb/d lower than March, and 1.7 mb/d above a year earlier. Delayed new capacity of 1.5 mb/d in non-OECD regions lifted product cracks and OECD refining utilisation rates, and caused backwardation to re-appear in oil products markets. OECD industry oil stocks built by a steep 38.0 mb in April, to stand 147 mb above average levels, as refined-product stocks moved to their widest surplus in over four years. Preliminary data indicate that OECD inventories added a further 12.6 mb in May although US crude stocks posted their first draw in nine months.
Per the latest U.S. Energy Information Administration’s “Short-Term Energy Outlook”, North Sea Brent crude oil spot prices increased by almost $5/b in May to a monthly average of $64/b, the highest monthly average for Brent so far this year. Several factors put upward pressure on crude oil prices in May. These factors included indications that global oil demand growth is accelerating, evidence that U.S. tight oil production could decline in the coming months, and the growing risk of unplanned supply outages in the Mid-East and North Africa. As of May 29, according to Baker Hughes, the number of rigs drilling for crude oil in the United States had fallen for 25 consecutive weeks and was 60% below its peak in October 2014. Brent crude oil prices increased despite
estimated increases in global oil inventories, which rose in May by more than 2.0 million b/d for the third consecutive month, compared with an average build of 1.0 million b/d in March through May of last year. Inventory builds are projected to moderate in the coming months, but are expected to remain high compared with previous years. The monthly average WTI crude oil spot price increased to an average of $59/b in May, up $5/b from April. After increasing for 20 consecutive weeks to a record 62.2 million barrels on April 17, crude oil inventories at Cushing, Oklahoma, have since fallen for six consecutive weeks by a total of 3.2 million barrels. Along with falling Cushing inventories, increasing U.S. refinery runs and production outages in Canada put upward pressure on the price of WTI crude.
Shipyard News & Newbuildings Following is a list of the 28 pushboats and towboats delivered year-to-date as of May 31
st, 2015 from U.S. shipyards
per Colton Co. 2014 saw the delivery of 101 boats.
2015 Deliveries of Pushboats / Towboats Sorted by Owner/Operator
O.N. Name Builder Owner/Operator Type of Vessel GT Date
1243635 Rex Dobson New Generation SB New Generation Tptn. 2,000HP Towboat 189 29-May-15
1260628 Sturgeon Sisco Marine Tappan Zee Constructors Pushboat 11 28-May-15
1258564 Lynne Eymard Marine Eymard Towing 2,000HP Towboat 181 19-May-15
1260302 Molly Patricia Conrad Shipyard Genesis Marine 3,150HP Towboat 293 19-May-15
1260379 Higman Tradition Hope Services Maryland Marine 2,000HP Towboat 177 13-May-15
1254677 Independence Eymard Marine Progressive Barge Line 2,000HP Towboat 222 06-May-15
1257962 Bill Seymour Eastern Shipbuilding Florida Marine 2,000HP Towboat 291 29-Apr-15
1259982 Lois Marie Inland Boat Works Crosby Tugs Pushboat 19 28-Apr-15
1259131 Carolyn Lampley Serodino Hunter Marine 2,000HP Towboat 72 10-Apr-15
1243636 Capt. Rodney Adams New Generation SB Blessey Marine 2,000HP Towboat 189 09-Apr-15
1258228 Michelle Sloan Diversified Marine Brusco Tug & Barge 4,000HP Towboat 175 06-Apr-15
1255186 Henry Cenac Intracoastal Iron Works Cenac Marine 2,000HP Towboat 99 06-Apr-15
1259133 L Avery Sneed Shipbuilding NGL Marine 2,600HP Towboat 299 03-Apr-15
1258712 Meg Kennedy Moore Verret Shipyard Blessey Marine 1,350HP Towboat 185 03-Apr-15
1256158 Margaret Ann Nichols Boat Magnolia Marine 3,000HP Towboat 344 01-Apr-15
1256433 Chip Stiebing Horizon SB Florida Marine 5,000HP Towboat 236 31-Mar-15
1258726 American Hero Steiner Construction American Comm. Lines 2,000HP Towboat 239 27-Mar-15
1259305 Can Do II Fairhaven Shipyard Bay Fuels Pushboat 11 26-Mar-15
1258264 Panther Serodino 1,200HP Towboat 82 26-Mar-15
1258192 Ashley Danielson John Bludworth SY Genesis Marine 2,600HP Towboat 372 18-Mar-15
1258846 Becky S Main Iron Works Bisso Towboat 2,000HP Towboat 198 10-Mar-15
1258454 Brianna Elizabeth Main Iron Works 2,000HP Towboat 231 10-Mar-15
1252432 Delfred Romero Sneed Shipbuilding Enterprise Marine 2,600HP Towboat 294 04-Mar-15
1258562 Texian Hope Services Maryland Marine 2,000HP Towboat 177 12-Feb-15
1258033 Michelle Golding Sneed Shipbuilding Golding Barge Line 2,600HP Towboat 299 12-Feb-15
1255184 Genie Cenac Intracoastal Iron Works Cenac Marine 2,000HP Towboat 98 11-Feb-15
1257590 Kate Golding Marine Builders Golding Barge Line 2,600HP Towboat 160 10-Feb-15
1256311 Elizabeth M. Robinson John Bludworth SY Genesis Marine 2,600HP Towboat 372 20-Jan-15

Marcon International, Inc. Inland Push Boat Market Report – May 2015
www.marcon.com
Details believed correct, not guaranteed. Offered subject to availability.
7
Over that past 15 to 20 years there has been a revolution in US ship docking tugs. Larger container ships and tankers made obsolete the conventional single and twin propeller tugs that could serve either line haul or ship docking functions. Pilots and insurers wanted modern technology that, more often than not, meant stern mounted azimuthing Z-drives. This revolution eventually includes ship docking on the Mississippi around the Port of New Orleans. But mixed in with the ship moorings and piers, were the fleets, where loaded barges from up river were exchanged for empties or loaded to go back up river. When big tows of 30 to 40 barges come down river, they have barges bound for different customers to be dropped off at various fleets that line the 100 miles of the river between Baton Rouge and New Orleans and beyond. A typical Mississippi barge is 195 by 35 feet and carries 1,500 ton cargos of grains, coal or other bulk cargos. A big tow coming down the river below Baton Rouge is like a floating island being guided in the river current by an 8 – 10,000HP line-haul boat. The captain of the line-haul boat works with fleet boats to hold up on the river while the fleet boat takes individual barges off the tow and moves them to the fleet along the riverbank. At the same time the fleeting boat may also add barges from the fleet to the tow. When the river is in freshet this all has to be completed with some dispatch. The greatest challenge for the fleet boat operator is when laying a barge onto the upriver end of the fleet. In this maneuver there exists the very real, and not infrequent, danger of getting broadside to the upstream rake of a barge bow and being swept underwater by the force of the river current.
Typical fleeting boats are 800 to 1,500HP and in the 60-foot range. This year, by introducing the first azimuthing Z-drive fleeting boat to the river, the Carline Companies brought the modern concept of ship docking tugs to this previously neglected class of vessel. Their new 68 by 34-foot fleeting boat, the “USS Cairo”, is setting the standard, not only for safety, but for efficient barge fleeting on the lower Mississippi. While safety when down-streaming barges was the prime motivation for Carline to have this boat designed by Christian Townsend of CT Marine, there are also gains in efficiency. As operators of harbor tugs have long been aware, the Z-drive can deliver full thrust in any direction almost instantly, whereas the conventional rudder set aft of the propeller and even the flanking rudders set ahead of the rudder as is the practice on many inland river
towboats, will sacrifice time and power by the inefficient nature of the conventional drive and rudder system. While the Z-drive tugs handling ocean class ships are typically in the 5,000HP range, the demands of fleeting 200-foot barges are more modest. For power on the “USS Cairo”, Carline choose a pair of six-cylinder, Tier 3, Cummins QSK19 750HP (Heavy Duty) mains turning into Thrustmaster TH750MZ Z-drives with 57-inch propellers in Nozzles. A pair of Cummins 6BTA-powered 85kW generators meets the towboat’s electrical needs. In keeping with CT Marine’s recently designed conventional towboats, the “USS Cairo” has a high visibility octagonal-shaped wheelhouse providing additional operator ease and safety. An elevated foredeck provides safer access to empty barges for the deckhands. (Article courtesy of Cummins Hotips#767 May 2015. Photo courtesy of Carline Industries.) Horizon Shipbuilding, Inc. is proud to announce the March 2015 delivery of another 80’ Inland River Towboat, the M/V “Chip Stiebing”, to Florida Marine Transporters of Mandeville, LA. This is the second 80’ towboat of the three vessel contract with FMT. Horizon Shipbuilding, Inc., a Bayou La Batre, Alabama shipyard has delivered several 140’ and 120’ inland river towboats over the eight year relationship with Florida Marine Transporters. The Project Manager for the construction of the M/V “Chip Stiebing”, Mike Sims, has now delivered two of the three 80’ vessels on-time for Horizon Shipbuilding and Florida Marine Transporters. Horizon would like to acknowledge the work and commitment for the design of the vessels to Jeff Brumfield and Rusty Zeller of FMT, John Gilbert & Associates and Horizon’s design team. The contract for three 80’-0” x 33’-0” x 10’-6” twin propeller towboats was awarded to Horizon in 2013. The 2,100HP M/V “Chip Stiebing” is used for Intracoastal Waterways and Inland Rivers Operations. The towboat is powered by Caterpillar 3508C, rated 1,050HP at 1,600RPM, diesel engines. The reduction gears are Twin Disc MG 540 reduction gears. Three John Deere 4045 99kW, 208V AC, 60Hz, diesel generators are installed for electrical power.

Marcon International, Inc. Inland Push Boat Market Report – May 2015
www.marcon.com
Details believed correct, not guaranteed. Offered subject to availability.
8
Featured Listings For Sale Direct from Owners File: TP27100 Push Boat: 100.0' loa x 30.0' beam x 8.4' depth. Built in 1958 by Superior Boat Works; Greenville. Rebuilt: 2006. U.S. flag. GRT: 292. FO: 34,954g. FW: 18,000g. Main Engines: 2 x EMD 12-645C total 2,400BHP. Last Overhauled: 2009. 70" x 63" props. Genset(s): 2 - 100kW. 8 berths. Shallow draft. Two steering & four flanking rudders. Height of eye 30’. Replaced wheels, rudders, bushings, shafts July 2006. U.S. Coast Guard sticker exp. 2015. P&S main engines both overhauled 07/2009. Cold stacked since 08/2014 with machinery ran weekly. Hull reportedly good condition. U.S. Gulf Coast.
File: TP18092 Push Boat: 90.0' loa x 28.0' beam x 10.5' depth x 7.00' light draft x 9.00' loaded draft. Built in 1969 by Jeffboat Inc, Jeffersonville, IN. Rebuilt: 2012. U.S. flag. GRT: 222. Class: UTV Inspection done. FO: 28,278g. FW: 5,000g. Winch: 2 - 40T electric make-up. Main Engines: 2 x CAT 3512 total 2,400BHP. 2 - 75' x 56' 4-blade SS FP prop(s) on 3" shaft(s). Repowered 2002. Tier 1. Consumption: 1,700gpd @ 98% MCR. Speed about 8-12kn on 1,700gpd. Genset(s): 2 - 99kW / John Deere. Quarters: 5. Air Conditioned. Three deck inland river
pushboat. Eye level 38'. Two steering & two flanking rudders. Max tow size 12,000 DWT. Originally built 1969, but repowered in 2002 and refurbished / overhauled in 2012. Working, but can be developed for sale. U.S. Gulf Coast. File: TP10041 Push Boat: 45.0' loa x 19.1' beam x 7.2' depth. Built in 1968 by Main Iron Works Inc. U.S. flag. GRT: 48. Main Engines: 2 x CAT C12 total 800BHP. Repowered 2006. Although not officially on market, we may be able to develop for sale out of competition. U.S. Gulf Coast.
File: TP06868 Push Boat: 68.0' loa x 24.0' beam x 7.3' depth. Built in 1972 by C.J. Langenfelder & Son, USA. U.S. flag. GRT: 84. FO: 10,700g. FW: 5,000g. Winch: 2 - 40T manual Nabrico. Main Engines: 2 x GM 8V71 total 680BHP. FP 52" x 38" 4-blade SS prop(s). Genset(s): 1 - 40kW / GM4-71; 1 - 30kW / Northern Lights r. Quarters: 4 (2 staterooms). AirCon. Lugger type. Converted landing craft with push knees forward. Air draft 34' (24' with mast down). Includes new bilge system, pump & manifold, new fenders bow & stern, starboard gen removed dipped & baked. Stored out of water and available for prompt
sale. Price reduced. Keen seller. U.S. Northwest. $160,000. File: TP06047 Push Boat: 50.0' loa x 18.6' beam x 7.2' depth. Built in 1978 by Rysco Shipyard Inc. U.S. flag. GRT: 49. Main Engines: 2 x GM 8V71 total 460BHP. Although not officially on the market, we may be able to develop for sale out of competition. U.S. Gulf Coast.
File: TP04035 Push Boat: 36.0' loa x 13.3' beam x 4.7' depth. Built in 1966 by William Ed Jackson. U.S. flag. GRT: 15. Main Engines: 2 totaling 400BHP. Although not officially on the market, we may be able to develop for sale out of competition. U.S. Gulf Coast. File: TP04033 Push Boat: 35.0' loa x 12.2' beam x 5.3' depth. Built in 1960 by Breaux's Bay
Craft Inc. U.S. flag. GRT: 14. Main Engines: 2 totaling 400BHP. Although not officially on the market, we may be able to develop for sale out of competition. U.S. Gulf Coast. File: TP02051 Push Boat: 50.0' loa x 17.9' beam x 4.7' depth. Built in 1953 by Siracusa's Shipyard; LA. U.S. flag. GRT: 42. FO: 800g. FW: 400g. Winch: 5T BR deck. Main Engine: 1 x GM 6-71 total 165BHP. 3" shaft(s). Pump(s): Diesel fuel & water transfer. Genset(s): 1 - 20kW / GM2-71 220vAC. Quarters: 2 crew. Open deck. 18' eye level. No electronics. Lugger style pushboat with two story house aft and push knees forward. U.S. Gulf Coast. File: HB29546 Hopper Barge – Inland (Two Available): 295.3' loa x 46.6' beam x 13.8' depth x 10.50' loaded draft. Built in 2011 by Industrias Astivik S.Ab. Foreign flag. GRT: 1,617. NRT: 814. Class: Formerly ABS Barge Intra-Coastal Waterway Service. No longer classed or loadlined. Dwt: 2,800mt. Light Displ.: 652T. Hold Capacity: 2,330.5m3. 1 hold. 2 open hold hopper barges originally built for coal trade. Capacity abt. 2,330.5m3 below main deck plus abt. 1,311.5mt piled in open coaming. Double bottom. South America.

Marcon International, Inc. Inland Push Boat Market Report – May 2015
www.marcon.com
Details believed correct, not guaranteed. Offered subject to availability.
9
File: HB26053 Hopper Barge – Inland: 260.0' loa x 52.5' beam x 12.0' depth. Built in 1982 by Bergeron Shipyard; Braithwaite, LA. U.S. flag. GRT/NRT: 1,375. Dwt: 4,055T. Light Displacement: 586T. Bulkheads: 2 Long/ 6 Trav. Hold Capacity: 127,660ft3. Bow Rake, Square Stern Hopper size 224.6 x 39. 4ft Bin walls. U.S. Northeast.
File: HB25067 Hopper Barge – Inland: 250.0' loa x 52.5' beam x 12.0' depth x 11.60' loaded draft. Built in 1982 by Bergeron Shipyard; Braithwaite, LA. U.S. flag. GRT/NRT: 1,375. Dwt: 3,000T. Light Displ.: 586T. Bulkheads: 2 Long/ 6 Trav. Hold Capacity: 127,660ft3. Bow Rake, Square Stern. Hopper size 224.6’ x 39’. 4ft Bin walls. U.S. Northeast.
File: TB21440 Double Hull Tank Barge – Inland: 248.1' loa x 51.2' beam x 14.3' depth x 12.10' loaded draft. Built in 2006. Foreign flag. Class: Panama Loadline / Certification. Dwt: 3,350st. Light Displ.: 650st. Rake(s): Single. Bulkheads: 1 long'l / 5 transv. Capacity: 21,440bbl. Tanks: 12. BW: None. Pumps: 2 10" LS-16GM-3 deep well / GM12V71 @ 200Tph. Fully IMO II / MARPOL / OPA-90 compliant. Originally heavily built to ABS Loadline as hopper barge and converted to current configuration by Owner's shipyard. Coated void
spaces. Very good for bunkering service in coastal and protected waters. Small scale drawing & recent photos of tanks, deck layout and piping / pumping on request. Currently working inland waters hauling diesel. Caribbean. File: TB10500 Tank Barge – Inland: 174.0' loa x 35.0' beam x 12.6' depth. Built in 1983 by SouthWest Marine. U.S. flag. GRT: 585. NRT: 450. Class: Last DD August 2012. Rake(s): Double. Capacity: 10,500bbl. 500lb. anchor(s). Single skin bunker barge. 2012 survey available on request. U.S. West Coast.
File: TB07140 Tank Barge – Inland: 140.0' loa x 35.0' beam x 10.0' depth. Built in 1966 by Todd Shipyards; Houston, TX. U.S. flag. GRT/NRT: 439. Rake(s): Double. Capacity: 7,000bbl. Tanks: 6. FO: 105,000g. BW: 200,000g. Pumps: 1 - 6"/GM4-71 Gorman Rupp deepwell. Single skin. Ex-ocean combo water/diesel barge. Potable water tanks coated with Texaco H. Bottom approx. 5/16"-3/8". Good candidate for deck barge. U.S. Gulf Coast.
See our website at www.marcon.com for the most recent inland river pushboat and barge listings. Call if you do not see what you are looking for. Many other boats are listed on a non-published basis.
We are interested in receiving information on any vessels surplus to your requirements that may be available for sale or charter on either a published or private and confidential basis. We are also interested in receiving press releases, news and comments about the industry on a regular basis for our market reports.