
MapInfo Professional User Guide and Help Systemlrem.hcmuaf.edu.vn/data/MapInfo...
300
MapInfo Professional Version 9.0 USER GUIDE
Transcript of MapInfo Professional User Guide and Help Systemlrem.hcmuaf.edu.vn/data/MapInfo...

MapInfo ProfessionalVersion 9.0
USER GUIDE
Information in this document is subject to change without notice and does not represent a commitment on the part of the vendor or its representatives. No part of this document may be reproduced or transmitted in any form or by any means, electronic or mechanical, including photocopying, without the written permission of MapInfo Corporation, One Global View, Troy, New York 12180-8399.© 2007 MapInfo Corporation. All rights reserved. MapInfo, the MapInfo logo, MapBasic, and MapInfo Professional are trademarks of MapInfo Corporation and/or its affiliates. MapInfo Corporate Headquarters:Voice: (518) 285-6000Fax: (518) 285-6070Sales Info Hotline: (800) 327-8627Government Sales Hotline: (800) 619-2333Technical Support Hotline: (518) 285-7283Technical Support Fax: (518) 285-6080Contact information for all MapInfo offices is located at: http://www.mapinfo.com/contactus.Adobe Acrobat® is a registered trademark of Adobe Systems Incorporated in the United States.Products named herein may be trademarks of their respective manufacturers and are hereby recognized. Trademarked names are used editorially, to the benefit of the trademark owner, with no intent to infringe on the trademark.libtiff © 1988-1995 Sam Leffler, copyright © Silicon Graphics, Inc.libgeotiff © 1995 Niles D. Ritter.Portions © 1999 3D Graphics, Inc. All Rights Reserved.HIL - Halo Image Library © 1993, Media Cybernetics Inc. Halo Imaging Library is a trademark of Media Cybernetics, Inc.Portions thereof LEAD Technologies, Inc. © 1991-2003. All Rights Reserved.Portions © 1993-2005 Ken Martin, Will Schroeder, Bill Lorensen. All Rights Reserved.ECW by ER Mapper © 1993-2005VM Grid by Northwood Technologies, Inc., a Marconi Company © 1995-2005.Portions © 2003 Earth Resource Mapping, Ltd. All Rights Reserved.MrSID, MrSID Decompressor and the MrSID logo are trademarks of LizardTech, Inc. used under license. Portions of this computer program are copyright © 1995-1998 LizardTech and/or the university of California or are protected by US patent nos. 5,710,835; 5,130,701; or 5,467,110 and are used under license. All rights reserved. MrSID is protected under US and international patent & copyright treaties and foreign patent applications are pending. Unauthorized use or duplication prohibited.Contains FME ® Objects; © 2005 Safe Software, Inc.Crystal Reports ® is proprietary trademark of Crystal Decisions. All Rights Reserved.Products named herein may be trademarks of their respective manufacturers and are hereby recognized. Trademarked names are used editorially, to the benefit of the trademark owner, with no intent to infringe on the trademark.Portions © Tele Atlas, Inc (GDT, Inc.)May 2007
Table of Contents
Chapter 1: Introduction. . . . . . . . . . . . . . . . . . . . . . . . . . . . . . . . . . . . . . . . . . . . . . 15What is MapInfo Professional? . . . . . . . . . . . . . . . . . . . . . . . . . . . . . . . . . . . . . . . . . . . .16
Mapping at a Glance . . . . . . . . . . . . . . . . . . . . . . . . . . . . . . . . . . . . . . . . . . . . . . . . . . .16Reviewing the MapInfo Professional Features. . . . . . . . . . . . . . . . . . . . . . . . . . . . . . . .17
Getting Support . . . . . . . . . . . . . . . . . . . . . . . . . . . . . . . . . . . . . . . . . . . . . . . . . . . . . . . . .19Using the Status Bar . . . . . . . . . . . . . . . . . . . . . . . . . . . . . . . . . . . . . . . . . . . . . . . . . . .19Using the Help System. . . . . . . . . . . . . . . . . . . . . . . . . . . . . . . . . . . . . . . . . . . . . . . . . .19Getting Technical Support . . . . . . . . . . . . . . . . . . . . . . . . . . . . . . . . . . . . . . . . . . . . . . .20
Chapter 2: What’s New in MapInfo Professional 9.0 . . . . . . . . . . . . . . . . . . . . . . 21Before You Get Started. . . . . . . . . . . . . . . . . . . . . . . . . . . . . . . . . . . . . . . . . . . . . . . . . . .22
Changes to the Installer . . . . . . . . . . . . . . . . . . . . . . . . . . . . . . . . . . . . . . . . . . . . . . . .22Licensing Support for MapInfo Professional . . . . . . . . . . . . . . . . . . . . . . . . . . . . . . . . .22MapBasic Available Free of Charge on the Web . . . . . . . . . . . . . . . . . . . . . . . . . . . . . .22
Major Features and Enhancements. . . . . . . . . . . . . . . . . . . . . . . . . . . . . . . . . . . . . . . . .22Using Date- and Time-Based Data in Maps and Queries . . . . . . . . . . . . . . . . . . . . . . .23Curved Labels Improve the Look of Your Maps. . . . . . . . . . . . . . . . . . . . . . . . . . . . . . .31Using Universal Data Directly . . . . . . . . . . . . . . . . . . . . . . . . . . . . . . . . . . . . . . . . . . . .34Using Templates for Layouts . . . . . . . . . . . . . . . . . . . . . . . . . . . . . . . . . . . . . . . . . . . . .40
Mapping – New Features and Enhancements . . . . . . . . . . . . . . . . . . . . . . . . . . . . . . . .55Setting a Global Label Font . . . . . . . . . . . . . . . . . . . . . . . . . . . . . . . . . . . . . . . . . . . . . .56Creating Multiple HotLinks in a Map . . . . . . . . . . . . . . . . . . . . . . . . . . . . . . . . . . . . . . .56Setting the New Default Layout Preferences . . . . . . . . . . . . . . . . . . . . . . . . . . . . . . . . .60New Prompt Prevents the Loss of Work when Closing Windows . . . . . . . . . . . . . . . . .61Improvements in Symbol Style Dialog Box and New Fonts . . . . . . . . . . . . . . . . . . . . . .62
Tool Enhancement . . . . . . . . . . . . . . . . . . . . . . . . . . . . . . . . . . . . . . . . . . . . . . . . . . . . . .63Setting the Window Size with the Window Manager Tool . . . . . . . . . . . . . . . . . . . . . . .63
Coordinate System and Datum Enhancements . . . . . . . . . . . . . . . . . . . . . . . . . . . . . . .63Updated Australian Victorian Coordinate System . . . . . . . . . . . . . . . . . . . . . . . . . . . . .64Updated Danish Coordinate System Entries . . . . . . . . . . . . . . . . . . . . . . . . . . . . . . . . .64
Printing, Importing, and Exporting Enhancements . . . . . . . . . . . . . . . . . . . . . . . . . . . .65Exporting to GeoTIFF (*.tif) Format . . . . . . . . . . . . . . . . . . . . . . . . . . . . . . . . . . . . . . . .65
Database Enhancements . . . . . . . . . . . . . . . . . . . . . . . . . . . . . . . . . . . . . . . . . . . . . . . . .69

Table of Contents
4 MapInfo Professional v.9.0
Using the Find Command in Remote Tables . . . . . . . . . . . . . . . . . . . . . . . . . . . . . . . . . 69Using the Geocode Command in Remote Tables . . . . . . . . . . . . . . . . . . . . . . . . . . . . . 70New Find Selection Preferences for Copying/Pasting . . . . . . . . . . . . . . . . . . . . . . . . . . 70New Time and DateTime Data Type Support for Remote Databases . . . . . . . . . . . . . . 72
Miscellaneous Enhancements . . . . . . . . . . . . . . . . . . . . . . . . . . . . . . . . . . . . . . . . . . . . . 74Envinsa Routing and Geocoding Constraints Change. . . . . . . . . . . . . . . . . . . . . . . . . . 74New TrueType Font Behavior . . . . . . . . . . . . . . . . . . . . . . . . . . . . . . . . . . . . . . . . . . . . 74Improved Character Set Conversion . . . . . . . . . . . . . . . . . . . . . . . . . . . . . . . . . . . . . . . 74MapBasic Help Available from MapBasic Window . . . . . . . . . . . . . . . . . . . . . . . . . . . . 75
Data Enhancements . . . . . . . . . . . . . . . . . . . . . . . . . . . . . . . . . . . . . . . . . . . . . . . . . . . . . 76Installing the Free Data Locally . . . . . . . . . . . . . . . . . . . . . . . . . . . . . . . . . . . . . . . . . . . 77Data Updates and Additions . . . . . . . . . . . . . . . . . . . . . . . . . . . . . . . . . . . . . . . . . . . . . 77
Chapter 3: Installing and Configuring MapInfo Professional . . . . . . . . . . . . . . . . 79System Requirements . . . . . . . . . . . . . . . . . . . . . . . . . . . . . . . . . . . . . . . . . . . . . . . . . . . 80MapInfo Professional and Operating System Support . . . . . . . . . . . . . . . . . . . . . . . . . 81
Windows 2000 Support . . . . . . . . . . . . . . . . . . . . . . . . . . . . . . . . . . . . . . . . . . . . . . . . . 81Windows 2003 Server with Terminal Services/Citrix Support . . . . . . . . . . . . . . . . . . . . 82
MapInfo Professional Database Connectivity and Support . . . . . . . . . . . . . . . . . . . . . 83Before You Install MapInfo Professional . . . . . . . . . . . . . . . . . . . . . . . . . . . . . . . . . . . . 84
Navigating the MapInfo Professional CD Browser. . . . . . . . . . . . . . . . . . . . . . . . . . . . . 85Installing MapInfo Professional . . . . . . . . . . . . . . . . . . . . . . . . . . . . . . . . . . . . . . . . . . . . 85
Typical Workstation Installation . . . . . . . . . . . . . . . . . . . . . . . . . . . . . . . . . . . . . . . . . . . 88Custom Workstation Installation . . . . . . . . . . . . . . . . . . . . . . . . . . . . . . . . . . . . . . . . . . 88Network Installation . . . . . . . . . . . . . . . . . . . . . . . . . . . . . . . . . . . . . . . . . . . . . . . . . . . . 90Setting Up Client Workstations . . . . . . . . . . . . . . . . . . . . . . . . . . . . . . . . . . . . . . . . . . . 92
MapInfo Licensing and Activation. . . . . . . . . . . . . . . . . . . . . . . . . . . . . . . . . . . . . . . . . . 92Node-Locked Licenses . . . . . . . . . . . . . . . . . . . . . . . . . . . . . . . . . . . . . . . . . . . . . . . . . 92Concurrent Licenses . . . . . . . . . . . . . . . . . . . . . . . . . . . . . . . . . . . . . . . . . . . . . . . . . . 101Silent Installation Procedures for System Administrators . . . . . . . . . . . . . . . . . . . . . . 105Installing Data . . . . . . . . . . . . . . . . . . . . . . . . . . . . . . . . . . . . . . . . . . . . . . . . . . . . . . . 109Installing Related Programs, Hardware, and Resources . . . . . . . . . . . . . . . . . . . . . . . 110Troubleshooting your Installation . . . . . . . . . . . . . . . . . . . . . . . . . . . . . . . . . . . . . . . . . 112
Modifying or Removing MapInfo Professional. . . . . . . . . . . . . . . . . . . . . . . . . . . . . . . 112Controlling Advanced System Settings . . . . . . . . . . . . . . . . . . . . . . . . . . . . . . . . . . . . 113Controlling the Location of Application Data Files During Installation . . . . . . . . . . . . . 114Removing MapInfo Professional from your System using Control Panel . . . . . . . . . . 115
Configuring the MapInfo Professional Preferences . . . . . . . . . . . . . . . . . . . . . . . . . . 116Setting the Preferences . . . . . . . . . . . . . . . . . . . . . . . . . . . . . . . . . . . . . . . . . . . . . . . . 117Setting your System Preferences . . . . . . . . . . . . . . . . . . . . . . . . . . . . . . . . . . . . . . . . 118Setting your Map Window Preferences . . . . . . . . . . . . . . . . . . . . . . . . . . . . . . . . . . . . 120Setting your Layout Window Preferences . . . . . . . . . . . . . . . . . . . . . . . . . . . . . . . . . . 124
Table of Contents
User Guide 5
Setting your Legend Window Preferences. . . . . . . . . . . . . . . . . . . . . . . . . . . . . . . . . .125Setting the Startup Preferences . . . . . . . . . . . . . . . . . . . . . . . . . . . . . . . . . . . . . . . . .126Setting your Address Matching Preferences . . . . . . . . . . . . . . . . . . . . . . . . . . . . . . . .129Setting your Directory Preferences . . . . . . . . . . . . . . . . . . . . . . . . . . . . . . . . . . . . . . .129Setting your Output Setting Preferences . . . . . . . . . . . . . . . . . . . . . . . . . . . . . . . . . . .130Setting the Printer Preferences . . . . . . . . . . . . . . . . . . . . . . . . . . . . . . . . . . . . . . . . . .134Setting your Style Preferences. . . . . . . . . . . . . . . . . . . . . . . . . . . . . . . . . . . . . . . . . . .135Setting the Web Services Preferences . . . . . . . . . . . . . . . . . . . . . . . . . . . . . . . . . . . .136Setting up the Image Processing Preferences. . . . . . . . . . . . . . . . . . . . . . . . . . . . . . .144Setting up a Geocoding Server . . . . . . . . . . . . . . . . . . . . . . . . . . . . . . . . . . . . . . . . . .145Setting up the Routing Server . . . . . . . . . . . . . . . . . . . . . . . . . . . . . . . . . . . . . . . . . . .148
Starting up and Leaving MapInfo Professional . . . . . . . . . . . . . . . . . . . . . . . . . . . . . .149Starting MapInfo Professional . . . . . . . . . . . . . . . . . . . . . . . . . . . . . . . . . . . . . . . . . . .149Exiting MapInfo Professional . . . . . . . . . . . . . . . . . . . . . . . . . . . . . . . . . . . . . . . . . . . .149
File Format Types Supported. . . . . . . . . . . . . . . . . . . . . . . . . . . . . . . . . . . . . . . . . . . . .150
Chapter 4: The Basics of MapInfo Professional . . . . . . . . . . . . . . . . . . . . . . . . . 153A Tour of the MapInfo Professional Desktop . . . . . . . . . . . . . . . . . . . . . . . . . . . . . . . .154
Working with Toolbars . . . . . . . . . . . . . . . . . . . . . . . . . . . . . . . . . . . . . . . . . . . . . . . . .154Using Workspaces . . . . . . . . . . . . . . . . . . . . . . . . . . . . . . . . . . . . . . . . . . . . . . . . . . . .158
Understanding Your Data in MapInfo Professional . . . . . . . . . . . . . . . . . . . . . . . . . . .160What is a Layer? . . . . . . . . . . . . . . . . . . . . . . . . . . . . . . . . . . . . . . . . . . . . . . . . . . . . .160Map Objects as Part of Layers. . . . . . . . . . . . . . . . . . . . . . . . . . . . . . . . . . . . . . . . . . .161Managing a Map’s Layers . . . . . . . . . . . . . . . . . . . . . . . . . . . . . . . . . . . . . . . . . . . . . .161
Working with Layers in the Layer Control . . . . . . . . . . . . . . . . . . . . . . . . . . . . . . . . . .162Accessing Layer Control . . . . . . . . . . . . . . . . . . . . . . . . . . . . . . . . . . . . . . . . . . . . . . .162Adding a Layer to the Map . . . . . . . . . . . . . . . . . . . . . . . . . . . . . . . . . . . . . . . . . . . . . .163Reordering Layers . . . . . . . . . . . . . . . . . . . . . . . . . . . . . . . . . . . . . . . . . . . . . . . . . . . .163Positioning and Sizing Labels . . . . . . . . . . . . . . . . . . . . . . . . . . . . . . . . . . . . . . . . . . .164Setting the Zoom Layering . . . . . . . . . . . . . . . . . . . . . . . . . . . . . . . . . . . . . . . . . . . . . .165Displaying the Lines, Nodes, and Centroids . . . . . . . . . . . . . . . . . . . . . . . . . . . . . . . .166Understanding the Cosmetic Layer . . . . . . . . . . . . . . . . . . . . . . . . . . . . . . . . . . . . . . .166Making the Layers “Editable” . . . . . . . . . . . . . . . . . . . . . . . . . . . . . . . . . . . . . . . . . . . .167Getting Layer Information . . . . . . . . . . . . . . . . . . . . . . . . . . . . . . . . . . . . . . . . . . . . . .168Selecting Objects in a Layer . . . . . . . . . . . . . . . . . . . . . . . . . . . . . . . . . . . . . . . . . . . .169
Working with Thematic Layers . . . . . . . . . . . . . . . . . . . . . . . . . . . . . . . . . . . . . . . . . . .169Ordering Thematic Layers . . . . . . . . . . . . . . . . . . . . . . . . . . . . . . . . . . . . . . . . . . . . . .170Displaying Thematic Layers . . . . . . . . . . . . . . . . . . . . . . . . . . . . . . . . . . . . . . . . . . . . .170Converting Objects into Region Objects . . . . . . . . . . . . . . . . . . . . . . . . . . . . . . . . . . .170Working with Raster and Grid Layers in Layer Control . . . . . . . . . . . . . . . . . . . . . . . .171Converting Grid Files to MapInfo Professional Grids (*.mig) . . . . . . . . . . . . . . . . . . .172
Working with Seamless Layers . . . . . . . . . . . . . . . . . . . . . . . . . . . . . . . . . . . . . . . . . . .172
Table of Contents
6 MapInfo Professional v.9.0
Features Available with Seamless Layers . . . . . . . . . . . . . . . . . . . . . . . . . . . . . . . . . 173Data – Where MapInfo Professional Begins . . . . . . . . . . . . . . . . . . . . . . . . . . . . . . . . . 175
What Is a Database and Other Basic Terminology . . . . . . . . . . . . . . . . . . . . . . . . . . . 176What Data Can I Use in MapInfo Professional? . . . . . . . . . . . . . . . . . . . . . . . . . . . . . 177Support for Raster Images. . . . . . . . . . . . . . . . . . . . . . . . . . . . . . . . . . . . . . . . . . . . . . 178Opening MapInfo Tables . . . . . . . . . . . . . . . . . . . . . . . . . . . . . . . . . . . . . . . . . . . . . . . 179Opening Data in Remote Tables . . . . . . . . . . . . . . . . . . . . . . . . . . . . . . . . . . . . . . . . . 182
Reviewing the Windows in MapInfo Professional . . . . . . . . . . . . . . . . . . . . . . . . . . . . 183Displaying Data in a Map Window . . . . . . . . . . . . . . . . . . . . . . . . . . . . . . . . . . . . . . . . 184Displaying Data in a Browser Window. . . . . . . . . . . . . . . . . . . . . . . . . . . . . . . . . . . . . 186Changing a Record's Data, Font, and Style . . . . . . . . . . . . . . . . . . . . . . . . . . . . . . . . 187Displaying Data in a Graph Window . . . . . . . . . . . . . . . . . . . . . . . . . . . . . . . . . . . . . . 188Displaying Data in a Layout Window . . . . . . . . . . . . . . . . . . . . . . . . . . . . . . . . . . . . . 188Other Windows for Displaying Data . . . . . . . . . . . . . . . . . . . . . . . . . . . . . . . . . . . . . . . 189
Saving, Closing, and Exporting Your Work . . . . . . . . . . . . . . . . . . . . . . . . . . . . . . . . . 190Saving a Workspace . . . . . . . . . . . . . . . . . . . . . . . . . . . . . . . . . . . . . . . . . . . . . . . . . . 190Saving a Table or a Copy of a Table . . . . . . . . . . . . . . . . . . . . . . . . . . . . . . . . . . . . . . 191Closing a Table . . . . . . . . . . . . . . . . . . . . . . . . . . . . . . . . . . . . . . . . . . . . . . . . . . . . . . 192Opening vs. Importing . . . . . . . . . . . . . . . . . . . . . . . . . . . . . . . . . . . . . . . . . . . . . . . . . 192Exporting Your Data to a New Format . . . . . . . . . . . . . . . . . . . . . . . . . . . . . . . . . . . . . 193.Importing and Exporting Data in AutoCAD Format . . . . . . . . . . . . . . . . . . . . . . . . . . 193Cropping Images . . . . . . . . . . . . . . . . . . . . . . . . . . . . . . . . . . . . . . . . . . . . . . . . . . . . . 194Exporting to ASCII Format . . . . . . . . . . . . . . . . . . . . . . . . . . . . . . . . . . . . . . . . . . . . . 194Exporting to dBase (*.DBF) Format . . . . . . . . . . . . . . . . . . . . . . . . . . . . . . . . . . . . . . 194Smoothing Map Images During Export . . . . . . . . . . . . . . . . . . . . . . . . . . . . . . . . . . . . 194
Using the Tools in the Tool Manager . . . . . . . . . . . . . . . . . . . . . . . . . . . . . . . . . . . . . . 195What are the MapInfo Professional Tools? . . . . . . . . . . . . . . . . . . . . . . . . . . . . . . . . . 195
Chapter 5: Putting Your Data on the Map. . . . . . . . . . . . . . . . . . . . . . . . . . . . . . . 199How Do I Get My Data on the Map?. . . . . . . . . . . . . . . . . . . . . . . . . . . . . . . . . . . . . . . . 200
When Do I Geocode vs. Create Points? . . . . . . . . . . . . . . . . . . . . . . . . . . . . . . . . . . . 200Displaying your Data on a Map . . . . . . . . . . . . . . . . . . . . . . . . . . . . . . . . . . . . . . . . . . . 200
Displaying your Excel (.XLS) Data . . . . . . . . . . . . . . . . . . . . . . . . . . . . . . . . . . . . . . . 201Displaying your Access (.MDB) Data . . . . . . . . . . . . . . . . . . . . . . . . . . . . . . . . . . . . . 202Displaying your Comma Delimited Data . . . . . . . . . . . . . . . . . . . . . . . . . . . . . . . . . . . 203Displaying your dBase Data . . . . . . . . . . . . . . . . . . . . . . . . . . . . . . . . . . . . . . . . . . . . 204Displaying your Lotus 1-2-3 Data. . . . . . . . . . . . . . . . . . . . . . . . . . . . . . . . . . . . . . . . . 204Displaying your ESRI Shapefile Data . . . . . . . . . . . . . . . . . . . . . . . . . . . . . . . . . . . . . 204Registering and Displaying your ASCII Data . . . . . . . . . . . . . . . . . . . . . . . . . . . . . . . 206Opening MapInfo Professional Grid Files . . . . . . . . . . . . . . . . . . . . . . . . . . . . . . . . . . 206Importing Graphic Files . . . . . . . . . . . . . . . . . . . . . . . . . . . . . . . . . . . . . . . . . . . . . . . . 207Importing and Displaying GML File Data . . . . . . . . . . . . . . . . . . . . . . . . . . . . . . . . . . 207
Table of Contents
User Guide 7
Understanding MapInfo Professional’s Use of the Topography Layer. . . . . . . . . . . . .208Viewing a List of Open Tables . . . . . . . . . . . . . . . . . . . . . . . . . . . . . . . . . . . . . . . . . . .208Displaying Data Details using the Statistics Window . . . . . . . . . . . . . . . . . . . . . . . . .209Displaying Your Remote DBMS Data . . . . . . . . . . . . . . . . . . . . . . . . . . . . . . . . . . . . .210Displaying and Importing Data from a Web Map Service . . . . . . . . . . . . . . . . . . . . . .211
Geocoding – Assigning Coordinates to Records . . . . . . . . . . . . . . . . . . . . . . . . . . . .211What Do I Need to Know Before Geocoding? . . . . . . . . . . . . . . . . . . . . . . . . . . . . . . .212Understanding the Geocoding Process . . . . . . . . . . . . . . . . . . . . . . . . . . . . . . . . . . . .213Modes of Geocoding . . . . . . . . . . . . . . . . . . . . . . . . . . . . . . . . . . . . . . . . . . . . . . . . . .214Methods of Geocoding . . . . . . . . . . . . . . . . . . . . . . . . . . . . . . . . . . . . . . . . . . . . . . . . .214Refining Your Geocoding Search . . . . . . . . . . . . . . . . . . . . . . . . . . . . . . . . . . . . . . . .215Finding an Exact Street Match . . . . . . . . . . . . . . . . . . . . . . . . . . . . . . . . . . . . . . . . . . .216Placing Geocoded Points. . . . . . . . . . . . . . . . . . . . . . . . . . . . . . . . . . . . . . . . . . . . . . .217Matching Street Names . . . . . . . . . . . . . . . . . . . . . . . . . . . . . . . . . . . . . . . . . . . . . . . .217Matching Address Numbers. . . . . . . . . . . . . . . . . . . . . . . . . . . . . . . . . . . . . . . . . . . . .218Matching to Region . . . . . . . . . . . . . . . . . . . . . . . . . . . . . . . . . . . . . . . . . . . . . . . . . . .219Selecting Records Not Geocoded . . . . . . . . . . . . . . . . . . . . . . . . . . . . . . . . . . . . . . . .220Locating Newly Geocoded Points . . . . . . . . . . . . . . . . . . . . . . . . . . . . . . . . . . . . . . . .221Result Codes . . . . . . . . . . . . . . . . . . . . . . . . . . . . . . . . . . . . . . . . . . . . . . . . . . . . . . . .221Ungeocoding a Table . . . . . . . . . . . . . . . . . . . . . . . . . . . . . . . . . . . . . . . . . . . . . . . . .222
Putting Latitude/Longitude Coordinates on a Map . . . . . . . . . . . . . . . . . . . . . . . . . . .223Dispersing Points Located in the Same Place . . . . . . . . . . . . . . . . . . . . . . . . . . . . . . .224Creating Points for Intersections . . . . . . . . . . . . . . . . . . . . . . . . . . . . . . . . . . . . . . . . .224Geocoding Data using a Server . . . . . . . . . . . . . . . . . . . . . . . . . . . . . . . . . . . . . . . . . .224
Displaying Your Data on the Map . . . . . . . . . . . . . . . . . . . . . . . . . . . . . . . . . . . . . . . . .225Finding Data on your Map . . . . . . . . . . . . . . . . . . . . . . . . . . . . . . . . . . . . . . . . . . . . . .226
Printing Your Results . . . . . . . . . . . . . . . . . . . . . . . . . . . . . . . . . . . . . . . . . . . . . . . . . . .226Setting Up the Page . . . . . . . . . . . . . . . . . . . . . . . . . . . . . . . . . . . . . . . . . . . . . . . . . . .227Printing Your Map . . . . . . . . . . . . . . . . . . . . . . . . . . . . . . . . . . . . . . . . . . . . . . . . . . . .228Viewing and Printing Text . . . . . . . . . . . . . . . . . . . . . . . . . . . . . . . . . . . . . . . . . . . . . .229Troubleshooting Print Problems. . . . . . . . . . . . . . . . . . . . . . . . . . . . . . . . . . . . . . . . . .230
Chapter 6: Understanding Your Data. . . . . . . . . . . . . . . . . . . . . . . . . . . . . . . . . . 233Working with MapInfo Tables. . . . . . . . . . . . . . . . . . . . . . . . . . . . . . . . . . . . . . . . . . . . .234
Adding to a Table . . . . . . . . . . . . . . . . . . . . . . . . . . . . . . . . . . . . . . . . . . . . . . . . . . . . .234Updating a Table . . . . . . . . . . . . . . . . . . . . . . . . . . . . . . . . . . . . . . . . . . . . . . . . . . . . .235Appending Rows to a Table . . . . . . . . . . . . . . . . . . . . . . . . . . . . . . . . . . . . . . . . . . . . .236Appending One Table to Another. . . . . . . . . . . . . . . . . . . . . . . . . . . . . . . . . . . . . . . . .237Parsing Data from One Column to Multiple Columns . . . . . . . . . . . . . . . . . . . . . . . . .237Placing Graphic Information in Visible Columns . . . . . . . . . . . . . . . . . . . . . . . . . . . . .239Creating a New Table . . . . . . . . . . . . . . . . . . . . . . . . . . . . . . . . . . . . . . . . . . . . . . . . .240Editing a Table’s Structure . . . . . . . . . . . . . . . . . . . . . . . . . . . . . . . . . . . . . . . . . . . . .242
Table of Contents
8 MapInfo Professional v.9.0
Copying and Renaming a Table . . . . . . . . . . . . . . . . . . . . . . . . . . . . . . . . . . . . . . . . . 243Deleting a Table. . . . . . . . . . . . . . . . . . . . . . . . . . . . . . . . . . . . . . . . . . . . . . . . . . . . . . 243Packing a Table . . . . . . . . . . . . . . . . . . . . . . . . . . . . . . . . . . . . . . . . . . . . . . . . . . . . . 243Collecting Data into the Table using Update Column . . . . . . . . . . . . . . . . . . . . . . . . . 244Browsing a Table . . . . . . . . . . . . . . . . . . . . . . . . . . . . . . . . . . . . . . . . . . . . . . . . . . . . . 245
Creating a Report of your Data . . . . . . . . . . . . . . . . . . . . . . . . . . . . . . . . . . . . . . . . . . . 245Opening an Existing Report . . . . . . . . . . . . . . . . . . . . . . . . . . . . . . . . . . . . . . . . . . . . 246Saving a Report . . . . . . . . . . . . . . . . . . . . . . . . . . . . . . . . . . . . . . . . . . . . . . . . . . . . . 246
Chapter 7: Accessing Remote Data . . . . . . . . . . . . . . . . . . . . . . . . . . . . . . . . . . . 247Understanding Remote Tables and Databases . . . . . . . . . . . . . . . . . . . . . . . . . . . . . . 248
Supported Databases and Versions . . . . . . . . . . . . . . . . . . . . . . . . . . . . . . . . . . . . . . 248About Linked and Live DBMS Tables . . . . . . . . . . . . . . . . . . . . . . . . . . . . . . . . . . . . . 249
Accessing Data in Remote Spatial Databases . . . . . . . . . . . . . . . . . . . . . . . . . . . . . . 251Storing Coordinate Values in a Remote Table. . . . . . . . . . . . . . . . . . . . . . . . . . . . . . . 251Creating a Spatial Index Column . . . . . . . . . . . . . . . . . . . . . . . . . . . . . . . . . . . . . . . . . 252Creating a MapInfo_MapCatalog . . . . . . . . . . . . . . . . . . . . . . . . . . . . . . . . . . . . . . . . . 252Making a Remote Table Mappable . . . . . . . . . . . . . . . . . . . . . . . . . . . . . . . . . . . . . . . 252Opening a Connection to an ODBC Data Source . . . . . . . . . . . . . . . . . . . . . . . . . . . . 253Opening a Connection to an Oracle Spatial Data Source . . . . . . . . . . . . . . . . . . . . . . 255Opening a Database Table from a Connection . . . . . . . . . . . . . . . . . . . . . . . . . . . . . . 256Refreshing Live and Linked Remote Tables . . . . . . . . . . . . . . . . . . . . . . . . . . . . . . . . 262Unlinking a Table from a Remote Database . . . . . . . . . . . . . . . . . . . . . . . . . . . . . . . . 262Saving a DBMS Table . . . . . . . . . . . . . . . . . . . . . . . . . . . . . . . . . . . . . . . . . . . . . . . . . 262Disconnecting from a Remote Database . . . . . . . . . . . . . . . . . . . . . . . . . . . . . . . . . . . 266Understanding OCI and ODBC Connectivity Error Messages. . . . . . . . . . . . . . . . . . . 266Working with Styles in DBMS Tables. . . . . . . . . . . . . . . . . . . . . . . . . . . . . . . . . . . . . . 267Converting Unsupported Geometries in Oracle, Informix, and SQL Server . . . . . . . . 267Supporting Oracle Spatial . . . . . . . . . . . . . . . . . . . . . . . . . . . . . . . . . . . . . . . . . . . . . . 269Creating Legends from/for a Live Table. . . . . . . . . . . . . . . . . . . . . . . . . . . . . . . . . . . . 271
Chapter 8: Drawing and Editing Objects . . . . . . . . . . . . . . . . . . . . . . . . . . . . . . . 275Understanding the Drawing and Editing Tools . . . . . . . . . . . . . . . . . . . . . . . . . . . . . . 276
Using the Drawing and Editing Commands . . . . . . . . . . . . . . . . . . . . . . . . . . . . . . . . . 276Adding Nodes to an Object (Overlay Nodes Command) . . . . . . . . . . . . . . . . . . . . . . . 277
Drawing Objects . . . . . . . . . . . . . . . . . . . . . . . . . . . . . . . . . . . . . . . . . . . . . . . . . . . . . . . 278Specifying an Object's Geographic Attributes . . . . . . . . . . . . . . . . . . . . . . . . . . . . . . . 278Reverting to a Previous Version . . . . . . . . . . . . . . . . . . . . . . . . . . . . . . . . . . . . . . . . . 279Using the Ruler Window as You Draw. . . . . . . . . . . . . . . . . . . . . . . . . . . . . . . . . . . . . 279Object Styles . . . . . . . . . . . . . . . . . . . . . . . . . . . . . . . . . . . . . . . . . . . . . . . . . . . . . . . . 280Printing Fill Patterns. . . . . . . . . . . . . . . . . . . . . . . . . . . . . . . . . . . . . . . . . . . . . . . . . . . 280
Drawing Polygons and Polylines. . . . . . . . . . . . . . . . . . . . . . . . . . . . . . . . . . . . . . . . . . 281
Table of Contents
User Guide 9
Converting a Polyline to a Region . . . . . . . . . . . . . . . . . . . . . . . . . . . . . . . . . . . . . . . .282Converting Objects into Polyline Objects . . . . . . . . . . . . . . . . . . . . . . . . . . . . . . . . . .283
Drawing Symbols . . . . . . . . . . . . . . . . . . . . . . . . . . . . . . . . . . . . . . . . . . . . . . . . . . . . . .284Changing a Symbol Style on a Map. . . . . . . . . . . . . . . . . . . . . . . . . . . . . . . . . . . . . . .284Supported Fonts for Symbols. . . . . . . . . . . . . . . . . . . . . . . . . . . . . . . . . . . . . . . . . . . .285Working with Custom Symbols . . . . . . . . . . . . . . . . . . . . . . . . . . . . . . . . . . . . . . . . . .285
Working with Text on the Map . . . . . . . . . . . . . . . . . . . . . . . . . . . . . . . . . . . . . . . . . . .287Editing Objects . . . . . . . . . . . . . . . . . . . . . . . . . . . . . . . . . . . . . . . . . . . . . . . . . . . . . . . .288
Positioning and Sizing your Map Objects. . . . . . . . . . . . . . . . . . . . . . . . . . . . . . . . . . .289Changing your Map Object Attributes . . . . . . . . . . . . . . . . . . . . . . . . . . . . . . . . . . . . .292Reshaping Map Objects. . . . . . . . . . . . . . . . . . . . . . . . . . . . . . . . . . . . . . . . . . . . . . . .293Using “Snap To” to Select Nodes and Centroids . . . . . . . . . . . . . . . . . . . . . . . . . . . . .295Setting Snap Preferences for a Visible Snap Area . . . . . . . . . . . . . . . . . . . . . . . . . . .296Autotracing Objects . . . . . . . . . . . . . . . . . . . . . . . . . . . . . . . . . . . . . . . . . . . . . . . . . . .297Smoothing and Unsmoothing Lines . . . . . . . . . . . . . . . . . . . . . . . . . . . . . . . . . . . . . . .298Converting Regions to Polylines . . . . . . . . . . . . . . . . . . . . . . . . . . . . . . . . . . . . . . . . .298Merging One Map into Another . . . . . . . . . . . . . . . . . . . . . . . . . . . . . . . . . . . . . . . . . .299
Chapter 9: Selecting and Querying Data. . . . . . . . . . . . . . . . . . . . . . . . . . . . . . . 301Selecting Your Data in MapInfo Professional. . . . . . . . . . . . . . . . . . . . . . . . . . . . . . . .302
Characteristics of Selections . . . . . . . . . . . . . . . . . . . . . . . . . . . . . . . . . . . . . . . . . . . .303Selecting from the Screen . . . . . . . . . . . . . . . . . . . . . . . . . . . . . . . . . . . . . . . . . . . . . .304Selecting Tools. . . . . . . . . . . . . . . . . . . . . . . . . . . . . . . . . . . . . . . . . . . . . . . . . . . . . . .305Unselecting Objects or Records. . . . . . . . . . . . . . . . . . . . . . . . . . . . . . . . . . . . . . . . . .309
Querying Your Data in MapInfo Professional . . . . . . . . . . . . . . . . . . . . . . . . . . . . . . . .310Selecting and Using Queries . . . . . . . . . . . . . . . . . . . . . . . . . . . . . . . . . . . . . . . . . . . .310Making Queries using the Select Command . . . . . . . . . . . . . . . . . . . . . . . . . . . . . . . .313Making Queries using the SQL Select Command . . . . . . . . . . . . . . . . . . . . . . . . . . . .314Displaying Query Results Quickly . . . . . . . . . . . . . . . . . . . . . . . . . . . . . . . . . . . . . . . .315Creating Query Expressions . . . . . . . . . . . . . . . . . . . . . . . . . . . . . . . . . . . . . . . . . . . .315Using Select to Create Queries . . . . . . . . . . . . . . . . . . . . . . . . . . . . . . . . . . . . . . . . . .318Interactively Selecting Objects . . . . . . . . . . . . . . . . . . . . . . . . . . . . . . . . . . . . . . . . . . .320Using SQL Select to Query Data . . . . . . . . . . . . . . . . . . . . . . . . . . . . . . . . . . . . . . . . .321Saving Queries. . . . . . . . . . . . . . . . . . . . . . . . . . . . . . . . . . . . . . . . . . . . . . . . . . . . . . .325Using Templates for Queries . . . . . . . . . . . . . . . . . . . . . . . . . . . . . . . . . . . . . . . . . . . .326Deriving Columns. . . . . . . . . . . . . . . . . . . . . . . . . . . . . . . . . . . . . . . . . . . . . . . . . . . . .327Creating Column Aliases . . . . . . . . . . . . . . . . . . . . . . . . . . . . . . . . . . . . . . . . . . . . . . .327Aggregating Data . . . . . . . . . . . . . . . . . . . . . . . . . . . . . . . . . . . . . . . . . . . . . . . . . . . . .328Joining Tables Using SQL Select. . . . . . . . . . . . . . . . . . . . . . . . . . . . . . . . . . . . . . . . .330Joining Tables Geographically (Using Geographic Operators) . . . . . . . . . . . . . . . . . .332Joining Two or More Tables . . . . . . . . . . . . . . . . . . . . . . . . . . . . . . . . . . . . . . . . . . . .334Finding Duplicate Values in a Column . . . . . . . . . . . . . . . . . . . . . . . . . . . . . . . . . . . . .335
Table of Contents
10 MapInfo Professional v.9.0
Calculating the Distance to a Fixed Point . . . . . . . . . . . . . . . . . . . . . . . . . . . . . . . . . . 337
Chapter 10: Creating Thematic Maps, Legends, and Other Maps . . . . . . . . . . . 339MapInfo Professional in Action . . . . . . . . . . . . . . . . . . . . . . . . . . . . . . . . . . . . . . . . . . . 340Using Thematic Mapping to Analyze Information . . . . . . . . . . . . . . . . . . . . . . . . . . . . 340
Planning Your Thematic Map. . . . . . . . . . . . . . . . . . . . . . . . . . . . . . . . . . . . . . . . . . . . 341Methods of Thematic Mapping. . . . . . . . . . . . . . . . . . . . . . . . . . . . . . . . . . . . . . . . . . . 343Types of Thematic Maps . . . . . . . . . . . . . . . . . . . . . . . . . . . . . . . . . . . . . . . . . . . . . . . 344Ranged Maps . . . . . . . . . . . . . . . . . . . . . . . . . . . . . . . . . . . . . . . . . . . . . . . . . . . . . . . 345Bar Chart Maps . . . . . . . . . . . . . . . . . . . . . . . . . . . . . . . . . . . . . . . . . . . . . . . . . . . . . . 347Pie Chart Maps . . . . . . . . . . . . . . . . . . . . . . . . . . . . . . . . . . . . . . . . . . . . . . . . . . . . . . 348Graduated Symbol Maps . . . . . . . . . . . . . . . . . . . . . . . . . . . . . . . . . . . . . . . . . . . . . . 349Dot Density Maps . . . . . . . . . . . . . . . . . . . . . . . . . . . . . . . . . . . . . . . . . . . . . . . . . . . . 351Individual Value Maps . . . . . . . . . . . . . . . . . . . . . . . . . . . . . . . . . . . . . . . . . . . . . . . . . 353Grid Surface Maps . . . . . . . . . . . . . . . . . . . . . . . . . . . . . . . . . . . . . . . . . . . . . . . . . . . 355
Creating a Thematic Map . . . . . . . . . . . . . . . . . . . . . . . . . . . . . . . . . . . . . . . . . . . . . . . . 355Step 1: Choosing a Type of Thematic Template . . . . . . . . . . . . . . . . . . . . . . . . . . . . . 355Step 2: Choosing Thematic Values . . . . . . . . . . . . . . . . . . . . . . . . . . . . . . . . . . . . . . . 357Step 3: Customizing Your Thematic Map . . . . . . . . . . . . . . . . . . . . . . . . . . . . . . . . . . 359Thematic Maps as Layers . . . . . . . . . . . . . . . . . . . . . . . . . . . . . . . . . . . . . . . . . . . . . . 360
Changing the Display Parameters of a Map . . . . . . . . . . . . . . . . . . . . . . . . . . . . . . . . 361Changing a Map's Proportions. . . . . . . . . . . . . . . . . . . . . . . . . . . . . . . . . . . . . . . . . . . 361
Working with Thematic Maps and Legends . . . . . . . . . . . . . . . . . . . . . . . . . . . . . . . . . 362Modifying a Thematic Map. . . . . . . . . . . . . . . . . . . . . . . . . . . . . . . . . . . . . . . . . . . . . . 362Using the Theme Templates . . . . . . . . . . . . . . . . . . . . . . . . . . . . . . . . . . . . . . . . . . . . 362Saving Your Thematic Settings . . . . . . . . . . . . . . . . . . . . . . . . . . . . . . . . . . . . . . . . . . 363Creating a Theme Legend . . . . . . . . . . . . . . . . . . . . . . . . . . . . . . . . . . . . . . . . . . . . . 364
Updating Columns using Thematic Mapping . . . . . . . . . . . . . . . . . . . . . . . . . . . . . . . . 365Adding Temporary Columns . . . . . . . . . . . . . . . . . . . . . . . . . . . . . . . . . . . . . . . . . . . . 368
Working with Legends . . . . . . . . . . . . . . . . . . . . . . . . . . . . . . . . . . . . . . . . . . . . . . . . . . 369Creating a Legend Window . . . . . . . . . . . . . . . . . . . . . . . . . . . . . . . . . . . . . . . . . . . . . 369What are Cartographic Legends? . . . . . . . . . . . . . . . . . . . . . . . . . . . . . . . . . . . . . . . . 371Customizing a Thematic Legend . . . . . . . . . . . . . . . . . . . . . . . . . . . . . . . . . . . . . . . . 371What are Thematic Legends? . . . . . . . . . . . . . . . . . . . . . . . . . . . . . . . . . . . . . . . . . . . 373
Working with Grid Surface Maps. . . . . . . . . . . . . . . . . . . . . . . . . . . . . . . . . . . . . . . . . . 374Working with Grid Handlers . . . . . . . . . . . . . . . . . . . . . . . . . . . . . . . . . . . . . . . . . . . . . 375
Chapter 11: Buffering and Working with Objects . . . . . . . . . . . . . . . . . . . . . . . . 377Buffering Your Data . . . . . . . . . . . . . . . . . . . . . . . . . . . . . . . . . . . . . . . . . . . . . . . . . . . . 378
Understanding Buffers . . . . . . . . . . . . . . . . . . . . . . . . . . . . . . . . . . . . . . . . . . . . . . . . . 378Creating a Buffer . . . . . . . . . . . . . . . . . . . . . . . . . . . . . . . . . . . . . . . . . . . . . . . . . . . . . 378Buffer Methods. . . . . . . . . . . . . . . . . . . . . . . . . . . . . . . . . . . . . . . . . . . . . . . . . . . . . . . 382
Table of Contents
User Guide 11
Types of Buffers . . . . . . . . . . . . . . . . . . . . . . . . . . . . . . . . . . . . . . . . . . . . . . . . . . . . . .383Editing Objects using the Set Target Model . . . . . . . . . . . . . . . . . . . . . . . . . . . . . . . . .385
Aggregating and Disaggregating Data . . . . . . . . . . . . . . . . . . . . . . . . . . . . . . . . . . . . .387Clipping a Region of a Map . . . . . . . . . . . . . . . . . . . . . . . . . . . . . . . . . . . . . . . . . . . . .388Overview of Combining Map Objects . . . . . . . . . . . . . . . . . . . . . . . . . . . . . . . . . . . . .388Clearing a Target . . . . . . . . . . . . . . . . . . . . . . . . . . . . . . . . . . . . . . . . . . . . . . . . . . . .391Splitting Objects . . . . . . . . . . . . . . . . . . . . . . . . . . . . . . . . . . . . . . . . . . . . . . . . . . . . .392
Creating Territories by Combining Objects . . . . . . . . . . . . . . . . . . . . . . . . . . . . . . . . .393Combining Selected Objects . . . . . . . . . . . . . . . . . . . . . . . . . . . . . . . . . . . . . . . . . . . .393Combining Objects Using Column . . . . . . . . . . . . . . . . . . . . . . . . . . . . . . . . . . . . . . .394Creating a Voronoi Polygon . . . . . . . . . . . . . . . . . . . . . . . . . . . . . . . . . . . . . . . . . . . .395Grouping Objects using Multipoint and Collection Object Types . . . . . . . . . . . . . . . . .396
Creating and Manipulating Objects . . . . . . . . . . . . . . . . . . . . . . . . . . . . . . . . . . . . . . . .396
Chapter 12: Stylizing Your Map for Presentations and Publishing . . . . . . . . . 397Changing a Map’s Style . . . . . . . . . . . . . . . . . . . . . . . . . . . . . . . . . . . . . . . . . . . . . . . . .398
Changing a Region’s Style . . . . . . . . . . . . . . . . . . . . . . . . . . . . . . . . . . . . . . . . . . . . .398Changing a Line’s Style . . . . . . . . . . . . . . . . . . . . . . . . . . . . . . . . . . . . . . . . . . . . . . .399Changing a Symbol’s Style . . . . . . . . . . . . . . . . . . . . . . . . . . . . . . . . . . . . . . . . . . . . .400Changing the Text Style. . . . . . . . . . . . . . . . . . . . . . . . . . . . . . . . . . . . . . . . . . . . . . . .402
Labeling Your Map . . . . . . . . . . . . . . . . . . . . . . . . . . . . . . . . . . . . . . . . . . . . . . . . . . . . .403Designing Your Labels . . . . . . . . . . . . . . . . . . . . . . . . . . . . . . . . . . . . . . . . . . . . . . . . .403Choosing the Label Content. . . . . . . . . . . . . . . . . . . . . . . . . . . . . . . . . . . . . . . . . . . . .404Using AutoLabeling . . . . . . . . . . . . . . . . . . . . . . . . . . . . . . . . . . . . . . . . . . . . . . . . . . .405Labeling Interactively . . . . . . . . . . . . . . . . . . . . . . . . . . . . . . . . . . . . . . . . . . . . . . . . . .410Using Text Objects as Labels . . . . . . . . . . . . . . . . . . . . . . . . . . . . . . . . . . . . . . . . . . .410Saving Labels. . . . . . . . . . . . . . . . . . . . . . . . . . . . . . . . . . . . . . . . . . . . . . . . . . . . . . . .411
Working with Layouts . . . . . . . . . . . . . . . . . . . . . . . . . . . . . . . . . . . . . . . . . . . . . . . . . . .411What is a Layout Window?. . . . . . . . . . . . . . . . . . . . . . . . . . . . . . . . . . . . . . . . . . . . . .412Working in the Layout Window. . . . . . . . . . . . . . . . . . . . . . . . . . . . . . . . . . . . . . . . . . .413Before You Create a Layout. . . . . . . . . . . . . . . . . . . . . . . . . . . . . . . . . . . . . . . . . . . . .414Creating a Layout Window . . . . . . . . . . . . . . . . . . . . . . . . . . . . . . . . . . . . . . . . . . . . .416Using Legends in a Layout. . . . . . . . . . . . . . . . . . . . . . . . . . . . . . . . . . . . . . . . . . . . . .420Moving Frames in a Layout Window . . . . . . . . . . . . . . . . . . . . . . . . . . . . . . . . . . . . . .420Aligning Objects in a Layout Window. . . . . . . . . . . . . . . . . . . . . . . . . . . . . . . . . . . . . .420Setting the Map Scale for a Layout Window . . . . . . . . . . . . . . . . . . . . . . . . . . . . . . . .421Cloning a Map View . . . . . . . . . . . . . . . . . . . . . . . . . . . . . . . . . . . . . . . . . . . . . . . . . . .422
Creating a Cartographic Legend . . . . . . . . . . . . . . . . . . . . . . . . . . . . . . . . . . . . . . . . . .422What is a Cartographic Legend? . . . . . . . . . . . . . . . . . . . . . . . . . . . . . . . . . . . . . . . . .423
Printing and Exporting Your Results . . . . . . . . . . . . . . . . . . . . . . . . . . . . . . . . . . . . . .424Printing Your Project . . . . . . . . . . . . . . . . . . . . . . . . . . . . . . . . . . . . . . . . . . . . . . . . . .424Exporting a Layout . . . . . . . . . . . . . . . . . . . . . . . . . . . . . . . . . . . . . . . . . . . . . . . . . . . .425
Table of Contents
12 MapInfo Professional v.9.0
Save Window As Supports Raster Formats. . . . . . . . . . . . . . . . . . . . . . . . . . . . . . . . . 426
Chapter 13: Registering Raster Images . . . . . . . . . . . . . . . . . . . . . . . . . . . . . . . . 429Working with Raster Images . . . . . . . . . . . . . . . . . . . . . . . . . . . . . . . . . . . . . . . . . . . . . 430
Determining Map Coordinates . . . . . . . . . . . . . . . . . . . . . . . . . . . . . . . . . . . . . . . . . . 430An Introduction to Raster Image Registration . . . . . . . . . . . . . . . . . . . . . . . . . . . . . . . 430Understanding Raster Images in MapInfo Professional. . . . . . . . . . . . . . . . . . . . . . . . 431Raster Image Format Details . . . . . . . . . . . . . . . . . . . . . . . . . . . . . . . . . . . . . . . . . . . . 432
Opening a Raster Image. . . . . . . . . . . . . . . . . . . . . . . . . . . . . . . . . . . . . . . . . . . . . . . . . 433Registering the Coordinates of a Raster Image. . . . . . . . . . . . . . . . . . . . . . . . . . . . . . 433Reprojecting a Raster Map . . . . . . . . . . . . . . . . . . . . . . . . . . . . . . . . . . . . . . . . . . . . . 434Transferring Vector Map Coordinates Directly to a Raster Map . . . . . . . . . . . . . . . . . 435Modifying Control Points for Raster Images . . . . . . . . . . . . . . . . . . . . . . . . . . . . . . . . 435Adjusting the Contrast or Brightness of a Raster Image . . . . . . . . . . . . . . . . . . . . . . . 437Adjusting the Translucency of a Raster Image . . . . . . . . . . . . . . . . . . . . . . . . . . . . . . 438
Printing/Exporting Translucent Raster Images . . . . . . . . . . . . . . . . . . . . . . . . . . . . . . 438
Chapter 14: Working with Coordinate Systems and Projections. . . . . . . . . . . . 439Working with Coordinate Systems . . . . . . . . . . . . . . . . . . . . . . . . . . . . . . . . . . . . . . . . 440
Displaying Coordinates . . . . . . . . . . . . . . . . . . . . . . . . . . . . . . . . . . . . . . . . . . . . . . . . 440Elements of a Coordinate System . . . . . . . . . . . . . . . . . . . . . . . . . . . . . . . . . . . . . . . . 440Understanding Coordinate Systems . . . . . . . . . . . . . . . . . . . . . . . . . . . . . . . . . . . . . . 441
Building Blocks of a Coordinate System . . . . . . . . . . . . . . . . . . . . . . . . . . . . . . . . . . . 445Coordinate Systems, Projections, and their Parameters . . . . . . . . . . . . . . . . . . . . . . . 445Projection Types . . . . . . . . . . . . . . . . . . . . . . . . . . . . . . . . . . . . . . . . . . . . . . . . . . . . . 446Datums . . . . . . . . . . . . . . . . . . . . . . . . . . . . . . . . . . . . . . . . . . . . . . . . . . . . . . . . . . . . 449Units. . . . . . . . . . . . . . . . . . . . . . . . . . . . . . . . . . . . . . . . . . . . . . . . . . . . . . . . . . . . . . . 450Coordinate System Origin . . . . . . . . . . . . . . . . . . . . . . . . . . . . . . . . . . . . . . . . . . . . . . 450Standard Parallels (Conic Projections) . . . . . . . . . . . . . . . . . . . . . . . . . . . . . . . . . . . . 451Oblique Azimuth (Hotine Oblique Mercator) . . . . . . . . . . . . . . . . . . . . . . . . . . . . . . . . 451Scale Factor (Transverse Mercator) . . . . . . . . . . . . . . . . . . . . . . . . . . . . . . . . . . . . . . 451False Easting and False Northing . . . . . . . . . . . . . . . . . . . . . . . . . . . . . . . . . . . . . . . . 451Range (Azimuthal Projections) . . . . . . . . . . . . . . . . . . . . . . . . . . . . . . . . . . . . . . . . . . 451About Polyconic Coordinate Systems . . . . . . . . . . . . . . . . . . . . . . . . . . . . . . . . . . . . . 452Examples of Projection Entries in the MAPINFOW.PRJ File. . . . . . . . . . . . . . . . . . . . 452
Adding Projections to the MAPINFOW.PRJ File . . . . . . . . . . . . . . . . . . . . . . . . . . . . . 453Using the New Projection in a Coordinate System . . . . . . . . . . . . . . . . . . . . . . . . . . . 455Entering a New Coordinate System (Example) . . . . . . . . . . . . . . . . . . . . . . . . . . . . . . 455
Understanding Precision in MapInfo Professional . . . . . . . . . . . . . . . . . . . . . . . . . . . 456What is Precision? . . . . . . . . . . . . . . . . . . . . . . . . . . . . . . . . . . . . . . . . . . . . . . . . . . . . 456
Understanding Affine Transformations . . . . . . . . . . . . . . . . . . . . . . . . . . . . . . . . . . . . 456Description of an Affine Transformation. . . . . . . . . . . . . . . . . . . . . . . . . . . . . . . . . . . . 457
Table of Contents
User Guide 13
Using Earth and Non-Earth Maps . . . . . . . . . . . . . . . . . . . . . . . . . . . . . . . . . . . . . . . . .459Specifying Coordinates for a Non-Earth Map . . . . . . . . . . . . . . . . . . . . . . . . . . . . . . .459
Chapter 15: Working with Web Services. . . . . . . . . . . . . . . . . . . . . . . . . . . . . . . 461Introduction to Web Services. . . . . . . . . . . . . . . . . . . . . . . . . . . . . . . . . . . . . . . . . . . . .462
Accessing Web Services in MapInfo Professional . . . . . . . . . . . . . . . . . . . . . . . . . . .462Enhancing Map Data using a Web Map Service. . . . . . . . . . . . . . . . . . . . . . . . . . . . . .463
How Does MapInfo Professional Use WMS Servers? . . . . . . . . . . . . . . . . . . . . . . . . .463Supported Image Formats for WMS . . . . . . . . . . . . . . . . . . . . . . . . . . . . . . . . . . . . . .464Understanding WMS Error Messages . . . . . . . . . . . . . . . . . . . . . . . . . . . . . . . . . . .465
Enhancing Map Data using a Web Feature Service . . . . . . . . . . . . . . . . . . . . . . . . . . .466WFS Server Requirements . . . . . . . . . . . . . . . . . . . . . . . . . . . . . . . . . . . . . . . . . . . . .467
Geocoding using a Geocoding Server . . . . . . . . . . . . . . . . . . . . . . . . . . . . . . . . . . . . .469What Are MapMarker and Envinsa Geocoding Services? . . . . . . . . . . . . . . . . . . . . . .470Geocoding a Single Address using a Geocoding Service . . . . . . . . . . . . . . . . . . . . . .471Understanding the Geocoding Result Codes. . . . . . . . . . . . . . . . . . . . . . . . . . . . . . . .471
Creating Routing Distance and Time Buffers. . . . . . . . . . . . . . . . . . . . . . . . . . . . . . . .473How are Time and Distance Buffers Calculated? . . . . . . . . . . . . . . . . . . . . . . . . . . . .474Using Driving Region Buffers to Display Data . . . . . . . . . . . . . . . . . . . . . . . . . . . . . . .475Creating Time or Distance Buffers for Objects. . . . . . . . . . . . . . . . . . . . . . . . . . . . . . .475
Accessing Envinsa Online Services at MapInfo. . . . . . . . . . . . . . . . . . . . . . . . . . . . . .476
Chapter 16: Specialized Topics in MapInfo Professional . . . . . . . . . . . . . . . . . 477Embedding MapInfo Professional Maps . . . . . . . . . . . . . . . . . . . . . . . . . . . . . . . . . . . .478
What You Should Know First . . . . . . . . . . . . . . . . . . . . . . . . . . . . . . . . . . . . . . . . . . . .478Menus and Commands Available While Using the MapInfo Map . . . . . . . . . . . . . . . .479Limitations of OLE . . . . . . . . . . . . . . . . . . . . . . . . . . . . . . . . . . . . . . . . . . . . . . . . . . . .479Working with Embedded Maps . . . . . . . . . . . . . . . . . . . . . . . . . . . . . . . . . . . . . . . . . .479Sharing Documents with Embedded Maps . . . . . . . . . . . . . . . . . . . . . . . . . . . . . . . . .479Using MapInfo Tables with Data Map . . . . . . . . . . . . . . . . . . . . . . . . . . . . . . . . . . . . .480
Internet Connectivity and MapInfo Professional . . . . . . . . . . . . . . . . . . . . . . . . . . . . .480What Are Active Objects? . . . . . . . . . . . . . . . . . . . . . . . . . . . . . . . . . . . . . . . . . . . . . .481HTML Landing Pages . . . . . . . . . . . . . . . . . . . . . . . . . . . . . . . . . . . . . . . . . . . . . . . . .482
Redistricting — Grouping Map Objects into Districts . . . . . . . . . . . . . . . . . . . . . . . . .482What is Redistricting and How Can I Use It? . . . . . . . . . . . . . . . . . . . . . . . . . . . . . . .482Using the Districts Browser . . . . . . . . . . . . . . . . . . . . . . . . . . . . . . . . . . . . . . . . . . . . .484Using Redistricting . . . . . . . . . . . . . . . . . . . . . . . . . . . . . . . . . . . . . . . . . . . . . . . . . . . .484Options in Redistricting . . . . . . . . . . . . . . . . . . . . . . . . . . . . . . . . . . . . . . . . . . . . . . . .485
Creating Expressions . . . . . . . . . . . . . . . . . . . . . . . . . . . . . . . . . . . . . . . . . . . . . . . . . . .485Where Expressions Can Be Used . . . . . . . . . . . . . . . . . . . . . . . . . . . . . . . . . . . . . . . .486Constructing Simple Expressions . . . . . . . . . . . . . . . . . . . . . . . . . . . . . . . . . . . . . . . .486Using Mathematical Operators in Expressions . . . . . . . . . . . . . . . . . . . . . . . . . . . . . .488
Table of Contents
14 MapInfo Professional v.9.0
Using String Operators in Expressions . . . . . . . . . . . . . . . . . . . . . . . . . . . . . . . . . . . . 489Using Comparison Operators in Expressions . . . . . . . . . . . . . . . . . . . . . . . . . . . . . . . 489Using Geographic Operators in Expressions. . . . . . . . . . . . . . . . . . . . . . . . . . . . . . . . 490Using Logical Operators in Expressions . . . . . . . . . . . . . . . . . . . . . . . . . . . . . . . . . . . 491Understanding Operator Precedence . . . . . . . . . . . . . . . . . . . . . . . . . . . . . . . . . . . . . 493Using Functions in Expressions. . . . . . . . . . . . . . . . . . . . . . . . . . . . . . . . . . . . . . . . . . 494
Working with the MapBasic Window. . . . . . . . . . . . . . . . . . . . . . . . . . . . . . . . . . . . . . . 494Accessing the MapBasic Window . . . . . . . . . . . . . . . . . . . . . . . . . . . . . . . . . . . . . . . . 494Running a MapBasic Program . . . . . . . . . . . . . . . . . . . . . . . . . . . . . . . . . . . . . . . . . . 495
Appendix A: Glossary of Terms . . . . . . . . . . . . . . . . . . . . . . . . . . . . . . . . . . . . . . 497Appendix B: Directory of MapInfo Professional Shortcuts . . . . . . . . . . . . . . . . 517
Shortcuts for File Menu Items . . . . . . . . . . . . . . . . . . . . . . . . . . . . . . . . . . . . . . . . . . . . 518Shortcuts for Edit Menu Items. . . . . . . . . . . . . . . . . . . . . . . . . . . . . . . . . . . . . . . . . . . . 518Shortcut to Tools Menu Items . . . . . . . . . . . . . . . . . . . . . . . . . . . . . . . . . . . . . . . . . . . . 518Shortcuts to Objects Menu Items . . . . . . . . . . . . . . . . . . . . . . . . . . . . . . . . . . . . . . . . . 519Shortcuts for Query Menu Items . . . . . . . . . . . . . . . . . . . . . . . . . . . . . . . . . . . . . . . . . . 519Shortcuts for Options Menu Items . . . . . . . . . . . . . . . . . . . . . . . . . . . . . . . . . . . . . . . . 519Shortcuts for Map Menu Items. . . . . . . . . . . . . . . . . . . . . . . . . . . . . . . . . . . . . . . . . . . . 519Shortcut for Layout Menu Item . . . . . . . . . . . . . . . . . . . . . . . . . . . . . . . . . . . . . . . . . . . 520Shortcuts for Window Menu Items . . . . . . . . . . . . . . . . . . . . . . . . . . . . . . . . . . . . . . . . 520Shortcuts by Keystroke . . . . . . . . . . . . . . . . . . . . . . . . . . . . . . . . . . . . . . . . . . . . . . . . . 521
Appendix C: Elements of a Coordinate System . . . . . . . . . . . . . . . . . . . . . . . . . 523Projections and Their Parameters. . . . . . . . . . . . . . . . . . . . . . . . . . . . . . . . . . . . . . . . . 524Coordinate System Enhancements by Version . . . . . . . . . . . . . . . . . . . . . . . . . . . . . . 538For More Information on Projections . . . . . . . . . . . . . . . . . . . . . . . . . . . . . . . . . . . . . . 543
Appendix D: Introductory Data Copyrights . . . . . . . . . . . . . . . . . . . . . . . . . . . . . 545Understanding your Introductory and Sample Data . . . . . . . . . . . . . . . . . . . . . . . . . . 546Africa . . . . . . . . . . . . . . . . . . . . . . . . . . . . . . . . . . . . . . . . . . . . . . . . . . . . . . . . . . . . . . . . 546Asia. . . . . . . . . . . . . . . . . . . . . . . . . . . . . . . . . . . . . . . . . . . . . . . . . . . . . . . . . . . . . . . . . . 546Europe . . . . . . . . . . . . . . . . . . . . . . . . . . . . . . . . . . . . . . . . . . . . . . . . . . . . . . . . . . . . . . . 547North America . . . . . . . . . . . . . . . . . . . . . . . . . . . . . . . . . . . . . . . . . . . . . . . . . . . . . . . . . 548World . . . . . . . . . . . . . . . . . . . . . . . . . . . . . . . . . . . . . . . . . . . . . . . . . . . . . . . . . . . . . . . . 550
Index . . . . . . . . . . . . . . . . . . . . . . . . . . . . . . . . . . . . . . . . . . . . . . . . . . . . . . . . . . . . 552
Introduction
Welcome to the MapInfo family of products! As the field of computer mapping continues to expand, MapInfo leads the way with new products that are designed to fulfill users’ computer mapping needs from the most basic to the most specialized with MapMarker, our premier address matching product.
MapInfo Professional®, our flagship product, is a comprehensive computer mapping tool that enables you to perform complex geographic analysis such as redistricting, accessing your remote data, dragging and dropping map objects into your applications, creating thematic maps that emphasize patterns in your data, and much more.
This User Guide contains all of the information you need to learn about and be productive using MapInfo Professional.
Sections in this Chapter:
What is MapInfo Professional? . . . . . . . . . . . . . . . . . . . . . . . . . . . .16Getting Support . . . . . . . . . . . . . . . . . . . . . . . . . . . . . . . . . . . . . . . .19
1
What is MapInfo Professional?
16 MapInfo Professional v. 9.0
What is MapInfo Professional?With MapInfo Professional, the power of computer mapping is at your complete disposal. You can display your data as points, as thematically shaded regions, as pie or bar charts, as districts, etc. You can perform geographic operations such as redistricting, combining and splitting objects, and buffering. You can also make queries against your data and access your remote data directly from MapInfo Professional.
For example, MapInfo Professional can show which branch store is the closest to your biggest customers. It can calculate the distances between customers and stores; it can show you the customers who spent the most last year; it can color-code the store symbols by sales volume. What makes it all come together is a visual display of your data on the map.
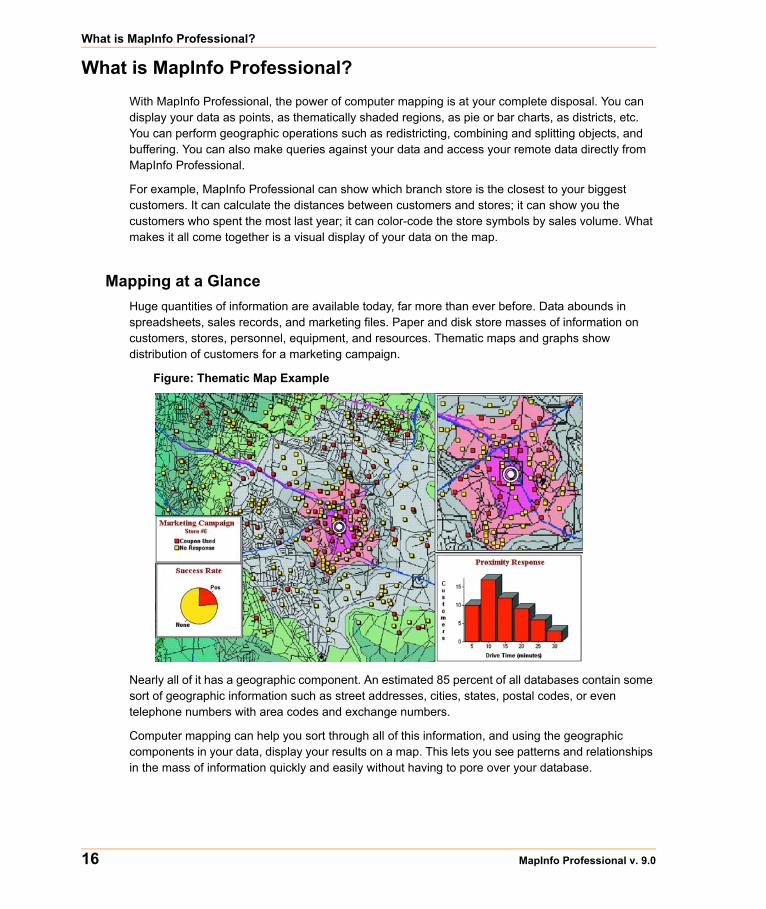
Mapping at a GlanceHuge quantities of information are available today, far more than ever before. Data abounds in spreadsheets, sales records, and marketing files. Paper and disk store masses of information on customers, stores, personnel, equipment, and resources. Thematic maps and graphs show distribution of customers for a marketing campaign.
Figure: Thematic Map Example
Nearly all of it has a geographic component. An estimated 85 percent of all databases contain some sort of geographic information such as street addresses, cities, states, postal codes, or even telephone numbers with area codes and exchange numbers.
Computer mapping can help you sort through all of this information, and using the geographic components in your data, display your results on a map. This lets you see patterns and relationships in the mass of information quickly and easily without having to pore over your database.
Chapter 1: Introduction
User Guide 17
Windows Compatibility
MapInfo Professional is Windows XP Professional and Windows XP Home and Office compatible, so you will feel right at home with its windowing environment. It is designed to fit smoothly into your work environment, so it only changes the results you get, not the way you work.
Using Your Own Data
To begin with, you can use the data you already have, in the form it’s already in — spreadsheets such as Excel, databases such as Access 2000, popular CAD packages, and other GIS applications, to name just a few. If your data is on a remote database, you can access it directly from MapInfo Professional. If you have data that is not already online, you can create database files right inside the product, or use data supplied by MapInfo — such as census data.
Similarly, you can use any of thousands of maps available from MapInfo, everything from street and highway maps to world maps. You can also create your own maps, either in MapInfo Professional or with a drawing package. You can diagram anything — floor plans, flow charts, even brain anatomy — can be treated as a map and entered into the product.
After you’ve organized your data visually, you’ll save the results to files, or send them to any of the dozens of printers and plotters MapInfo Professional recognizes.
If you have your data on hand and you can read a map, you’re just about ready to begin. Soon, we’ll show you an example of how easy it is to put MapInfo Professional’s power to work for you.
But first, install MapInfo Professional following the instructions in Installing MapInfo Professional in Chapter 3 on page 85. If you are new to the product, or new to computer mapping, we suggest you refer to The Basics of MapInfo Professional in Chapter 4 on page 153 for an overview of basic mapping terms and concepts. Use the web-enabled tutorial to learn about its features, and become accustomed to the more common tasks and functions.
For more product and service information, you can connect directly from MapInfo Professional to our forum (on the Help menu, click MapInfo on the Web), or, consult our World Wide Web site (http://www.mapinfo.com).
Reviewing the MapInfo Professional FeaturesMapInfo Professional gives you the processing power of databases (including powerful SQL queries) and the visual power of maps, plus charts and graphs. It’s an essential business tool for data analysis, sales, and presentations.
Here is a look at some of the features MapInfo Professional offers:
• Direct opening of files created with dBASE or FoxBASE, delimited ASCII, comma delimited CSV files, ESRI® shapefiles, Lotus 1–2–3, Microsoft Excel, and Microsoft Access; importing of graphics files in a variety of formats; a function for creating database files from within the product.
• Multiple views of your data in Map, Browser, and Graph windows. Hot Views allow you to open multiple views of the same data and update them when you change any one view.
• Live ODBC access to remote database data such as Oracle and SQL Server.• Seamless map layers that allow you to handle several map layers as if they were one layer.• Cartographic legends, enabling you to create and customize legends for any map layer.
What is MapInfo Professional?
18 MapInfo Professional v. 9.0
• Thematic maps to create analyses of your data with high visual impact, including grid surface themes, 3DMaps, and Prism maps.
• Use raster underlay capabilities to enhance your work session.• Querying capabilities ranging from simple data selections from a single file to complex SQL
queries from one or more files.• Workspaces that save all your settings and views so you can start where you left off.• HotLinks that let you launch files or URLs directly from a Map window. • OLE embedding of Map windows into other applications.• A comprehensive array of drawing and editing tools for customizing your maps.• Thousands of ready-made maps and functions for creating your own maps.• Crystal Reports, the industry-standard report-writing program, allows you to create reports of
your tabular data directly in the product.• A layout window for preparing output.• Printing and export capabilities for high-quality output• The ability to change the projection of your map for display or digitizing.• Object processing functions that help to correct errors in data, set node snap tolerances for
different objects, as well as thin nodes and polygons.
When it’s time to run MapInfo Professional, you’ll feel right at home with its windowing environment. After you’ve organized your data visually, you’ll save the results to files, or send them to your printer or plotter.
For tips to help you succeed in using MapInfo Professional, see Ensuring Your Success in the Help System.
MapInfo Professional Documentation Set
We have updated our MapInfo Professional User Guide (Abridged) to include the new features of MapInfo Professional and integrated issues and features from earlier versions. If you cannot find information you are looking for, please refer to the online help system, which is installed with the product.
Accessing MapInfo Professional Documentation
You can access the MapInfo Professional and Crystal Reports PDF files in the Documentation subfolder located in your installation directory. You can read these files using Adobe® Acrobat Reader, which is available on the installation CD or by going to the Adobe web site:
.http://www.adobe.com/products/acrobat/readstep2.html
Chapter 1: Introduction
User Guide 19
Getting SupportHere at MapInfo Corporation, we are committed to your success and we provide a wide range of support to assist you in getting the results you are working toward.
Using the Status Bar The Status Bar along the lower edge of your window provides helpful information during your mapping session and allows you to make some changes directly in the Status Bar. On the Options menu, click Show/Hide Status Bar to control the display of the Status Bar.
Note: Not all entries display in the Status Bar at all times. Entries display when a feature is active.
• Status Bar Help: For instantaneous answers to “What does that command do” simply move the cursor over the command. A brief description of the command displays in the left pane of the Status Bar along the lower edge of your screen.
• Zoom, Map Scale, Cursor Location: View any one of these settings in the Status Bar. You can change which one displays directly from the Status Bar. Click the arrow on the right side of the box to display a popup list of the three options. Click the setting you want to display. The Status Bar automatically updates. These display settings are also controlled in the Map Options dialog box (on the Map menu, click Options).
• Editable Layers: To keep track of which layer is currently editable, review the list of layers that display in the Status Bar. You can change the editable layer directly in the Status Bar. Click the arrow to the right of the box to display a popup list of the layers in the Map window. Click the layer you want to make editable. The Status Bar automatically updates, showing the new editable layer.
• Selectable Layers: The Status Bar indicates which layer the current selection is from. If there is nothing selected, the Status Bar reads: “Selecting: NONE.”
• Browser window Records: When viewing a table in a Browser, the record count displays in the Status Bar.
• Snap-to-Node: This S-key toggle feature is in use when SNAP displays in the Status Bar.• Autotrace indicator: This T-key feature is in use when AUTOTRACE displays in the Status Bar.• Autonode indicator: This N-key feature is in use when AUTONODE displays in the Status Bar.
Using the Help SystemMapInfo Professional’s comprehensive Online Help system provides the information you need to learn and use the product more effectively. You can reach the information in several ways:
• Use the Help Contents screen to choose topics from “books”. Click a book to display its topics, choose a topic from the list.
• Use the Search feature to search on a specific word. Type the word you want to search for in the first field, select the matching word in the second, and then the topic in the third box. MapInfo Professional displays the topic in the pane on the right.
• Use the Index feature to find a topic quickly. Type the first few letters of the word you are looking for. The index entry that most closely matches your entry is highlighted. Click the index entry you want to display.
• Use the Favorites tab to collect and store topics you want to refer to frequently.
Getting Support
20 MapInfo Professional v. 9.0
• Context-Sensitive Feature: Press the F1 key to receive more information on any menu command or dialog box. The Help window for that item displays. Also click the Help button in the MapInfo Professional dialogs to display information on the current dialog box.
• Quick Access to the MapInfo publications web site: Click the underlined MapInfo Corporation name at the bottom of each topic page to go to the MapInfo web site. From here you have access to product information, upcoming events, tech tips, and a complete set of documentation.
Getting Technical Support MapInfo Corporation offers a free support period on all new software purchases and upgrades, so you can be productive from the start. Once the free period ends, MapInfo Corporation offers a broad selection of extended support services for individual, business, and corporate users.
Technical Support is here to help you, and your call is important. This section lists the information you need to provide when you call your local support center. It also explains some of the technical support procedures so that you will know what to expect about the handling and resolution of your particular issue.
Please remember to include your serial number, partner number or contract number when contacting Technical Support.
Technical Support Offerings
To use Technical Support, you must register your product. This can be done very easily during installation or anytime during normal business hours by contacting Customer Service directly at 1-800-552-2511 Option 3.
Full technical support for MapInfo Professional is provided for the currently shipping version plus the two previous versions.
Extended support options are available at each of our technical support centers in the Americas, Europe/Middle East/Africa, and Asia-Pacific regions. See below for how to contact the office nearest you.
• For technical support contact information for your geography, see the Getting Technical Support topic in the Help System.

What’s New in MapInfo Professional 9.0
Thank you for upgrading to the most advanced computer mapping product in the MapInfo family! As the field of computer mapping continues to expand, MapInfo leads the way with new products that are designed to fulfill your computer mapping needs from the most basic to the most specialized with MapMarker, our premier address matching product and Envinsa, our enterprise-wide location platform.
For more information about the bug fixes and corrections we have made to MapInfo Professional in this release, you will soon be able to review the release notes at:
http://extranet.mapinfo.com/support/documentation/manuals.cfm
Sections in this Chapter:
Before You Get Started . . . . . . . . . . . . . . . . . . . . . . . . . . . . . . . . . .22Major Features and Enhancements . . . . . . . . . . . . . . . . . . . . . . . .22Mapping – New Features and Enhancements . . . . . . . . . . . . . . . .55Tool Enhancement . . . . . . . . . . . . . . . . . . . . . . . . . . . . . . . . . . . . . .63Coordinate System and Datum Enhancements. . . . . . . . . . . . . . .63Printing, Importing, and Exporting Enhancements. . . . . . . . . . . .65Database Enhancements . . . . . . . . . . . . . . . . . . . . . . . . . . . . . . . . .69Miscellaneous Enhancements . . . . . . . . . . . . . . . . . . . . . . . . . . . .74Data Enhancements . . . . . . . . . . . . . . . . . . . . . . . . . . . . . . . . . . . . .76
2
Before You Get Started
22 MapInfo Professional v. 9.0
Before You Get StartedThere are some big enhancements to the MapInfo Professional 9.0 functionality including support for curved labels, new time and date/time data types for crime analysis and other queries and thematic maps, and being able to open new data formats directly in the application.
All of the data used in this documentation is available either from the data CD or from the trial data on the MapInfo web site. To retrieve the trial data, go to:
www.mapinfo.com > Support and Training > Downloads > MapInfo Professional > MIProTrialData.exe
and download this data to your computer. You must have Internet access to retrieve the trial data.
Changes to the Installer In the past, if you wanted to add ODBC or Oracle Spatial support, you followed the Custom Workstation Installation instructions. We have changed the installation program to add the ODBC Connectivity and Oracle Spatial support by default. This should simplify the installation process and ensure a better product installation experience.
You may notice that we have shipped two disks for MapInfo Professional this time. One is your familiar MapInfo Professional installation CD and the other is a data CD that contains new and updated data you can use to improve the accuracy of geocoding and enhance the look of your maps. For more information about this change see Database Enhancements on page 69.
Licensing Support for MapInfo ProfessionalWe have added product licensing options to the MapInfo Professional product during this release. Please review the licensing documentation carefully in Installing and Configuring MapInfo Professional on page 79.
MapBasic Available Free of Charge on the WebMapInfo has decided to make MapBasic, the powerful API you can use to extend MapInfo Professional available on the web. Go to www.mapinfo.com/proresources to obtain your free copy of MapBasic 9.0 and access other resources to enhance your use of MapInfo Professional.
Major Features and EnhancementsWe have created the following major features and enhancements in response to your requests and suggestions.
• Using Date- and Time-Based Data in Maps and Queries on page 23• Curved Labels Improve the Look of Your Maps on page 31• Using Universal Data Directly on page 34• Using Templates for Layouts on page 40
Chapter 2: What’s New in MapInfo Professional 9.0
User Guide 23
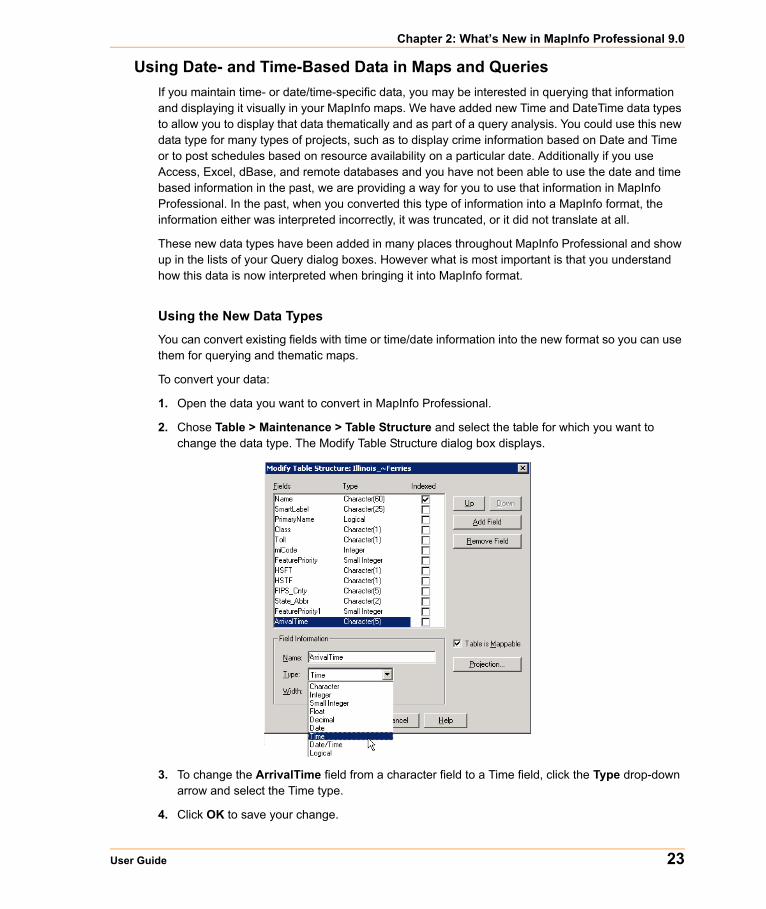
Using Date- and Time-Based Data in Maps and Queries If you maintain time- or date/time-specific data, you may be interested in querying that information and displaying it visually in your MapInfo maps. We have added new Time and DateTime data types to allow you to display that data thematically and as part of a query analysis. You could use this new data type for many types of projects, such as to display crime information based on Date and Time or to post schedules based on resource availability on a particular date. Additionally if you use Access, Excel, dBase, and remote databases and you have not been able to use the date and time based information in the past, we are providing a way for you to use that information in MapInfo Professional. In the past, when you converted this type of information into a MapInfo format, the information either was interpreted incorrectly, it was truncated, or it did not translate at all.
These new data types have been added in many places throughout MapInfo Professional and show up in the lists of your Query dialog boxes. However what is most important is that you understand how this data is now interpreted when bringing it into MapInfo format.
Using the New Data Types
You can convert existing fields with time or time/date information into the new format so you can use them for querying and thematic maps.
To convert your data:
1. Open the data you want to convert in MapInfo Professional.
2. Chose Table > Maintenance > Table Structure and select the table for which you want to change the data type. The Modify Table Structure dialog box displays.
3. To change the ArrivalTime field from a character field to a Time field, click the Type drop-down arrow and select the Time type.
4. Click OK to save your change.
Major Features and Enhancements
24 MapInfo Professional v. 9.0
Adding Time or DateTime Data Types to Existing Data
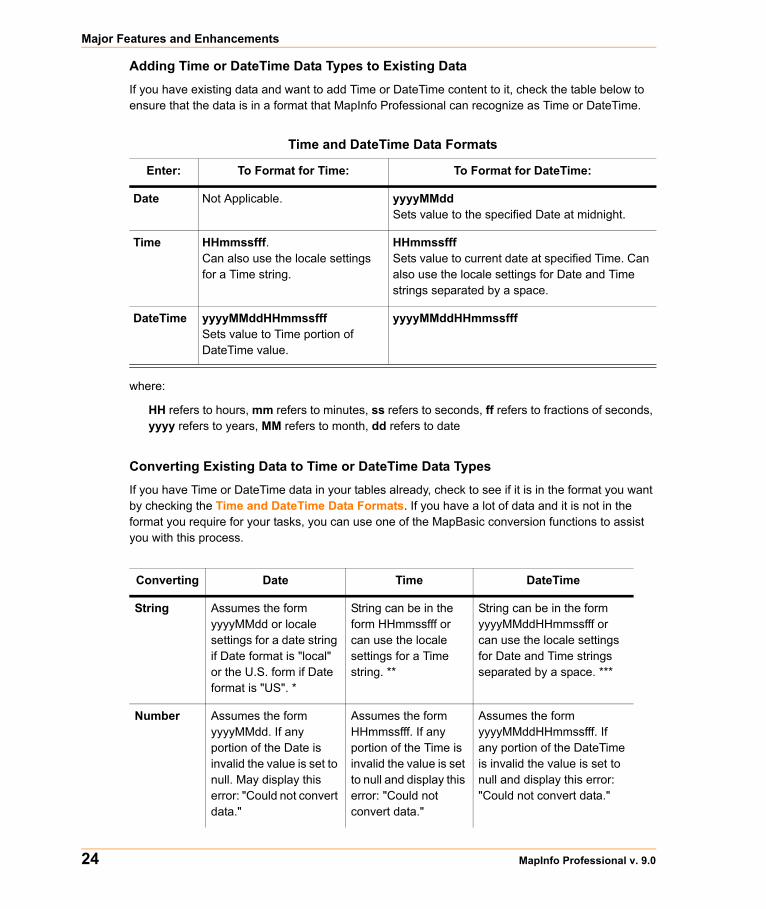
If you have existing data and want to add Time or DateTime content to it, check the table below to ensure that the data is in a format that MapInfo Professional can recognize as Time or DateTime.
where:
HH refers to hours, mm refers to minutes, ss refers to seconds, ff refers to fractions of seconds, yyyy refers to years, MM refers to month, dd refers to date
Converting Existing Data to Time or DateTime Data Types
If you have Time or DateTime data in your tables already, check to see if it is in the format you want by checking the Time and DateTime Data Formats. If you have a lot of data and it is not in the format you require for your tasks, you can use one of the MapBasic conversion functions to assist you with this process.
Time and DateTime Data Formats
Enter: To Format for Time: To Format for DateTime:
Date Not Applicable. yyyyMMddSets value to the specified Date at midnight.
Time HHmmssfff. Can also use the locale settings for a Time string.
HHmmssfffSets value to current date at specified Time. Can also use the locale settings for Date and Time strings separated by a space.
DateTime yyyyMMddHHmmssfff Sets value to Time portion of DateTime value.
yyyyMMddHHmmssfff
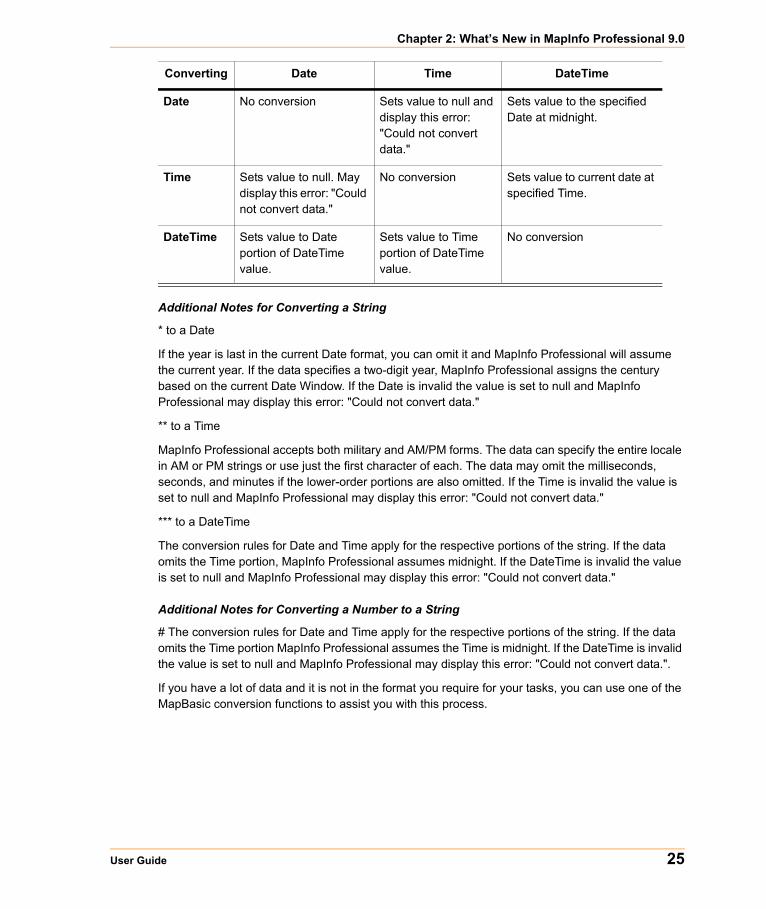
Converting Date Time DateTime
String Assumes the form yyyyMMdd or locale settings for a date string if Date format is "local" or the U.S. form if Date format is "US". *
String can be in the form HHmmssfff or can use the locale settings for a Time string. **
String can be in the form yyyyMMddHHmmssfff or can use the locale settings for Date and Time strings separated by a space. ***
Number Assumes the form yyyyMMdd. If any portion of the Date is invalid the value is set to null. May display this error: "Could not convert data."
Assumes the form HHmmssfff. If any portion of the Time is invalid the value is set to null and display this error: "Could not convert data."
Assumes the form yyyyMMddHHmmssfff. If any portion of the DateTime is invalid the value is set to null and display this error: "Could not convert data."
Chapter 2: What’s New in MapInfo Professional 9.0
User Guide 25
Additional Notes for Converting a String
* to a Date
If the year is last in the current Date format, you can omit it and MapInfo Professional will assume the current year. If the data specifies a two-digit year, MapInfo Professional assigns the century based on the current Date Window. If the Date is invalid the value is set to null and MapInfo Professional may display this error: "Could not convert data."
** to a Time
MapInfo Professional accepts both military and AM/PM forms. The data can specify the entire locale in AM or PM strings or use just the first character of each. The data may omit the milliseconds, seconds, and minutes if the lower-order portions are also omitted. If the Time is invalid the value is set to null and MapInfo Professional may display this error: "Could not convert data."
*** to a DateTime
The conversion rules for Date and Time apply for the respective portions of the string. If the data omits the Time portion, MapInfo Professional assumes midnight. If the DateTime is invalid the value is set to null and MapInfo Professional may display this error: "Could not convert data."
Additional Notes for Converting a Number to a String
# The conversion rules for Date and Time apply for the respective portions of the string. If the data omits the Time portion MapInfo Professional assumes the Time is midnight. If the DateTime is invalid the value is set to null and MapInfo Professional may display this error: "Could not convert data.".
If you have a lot of data and it is not in the format you require for your tasks, you can use one of the MapBasic conversion functions to assist you with this process.
Date No conversion Sets value to null and display this error: "Could not convert data."
Sets value to the specified Date at midnight.
Time Sets value to null. May display this error: "Could not convert data."
No conversion Sets value to current date at specified Time.
DateTime Sets value to Date portion of DateTime value.
Sets value to Time portion of DateTime value.
No conversion
Converting Date Time DateTime
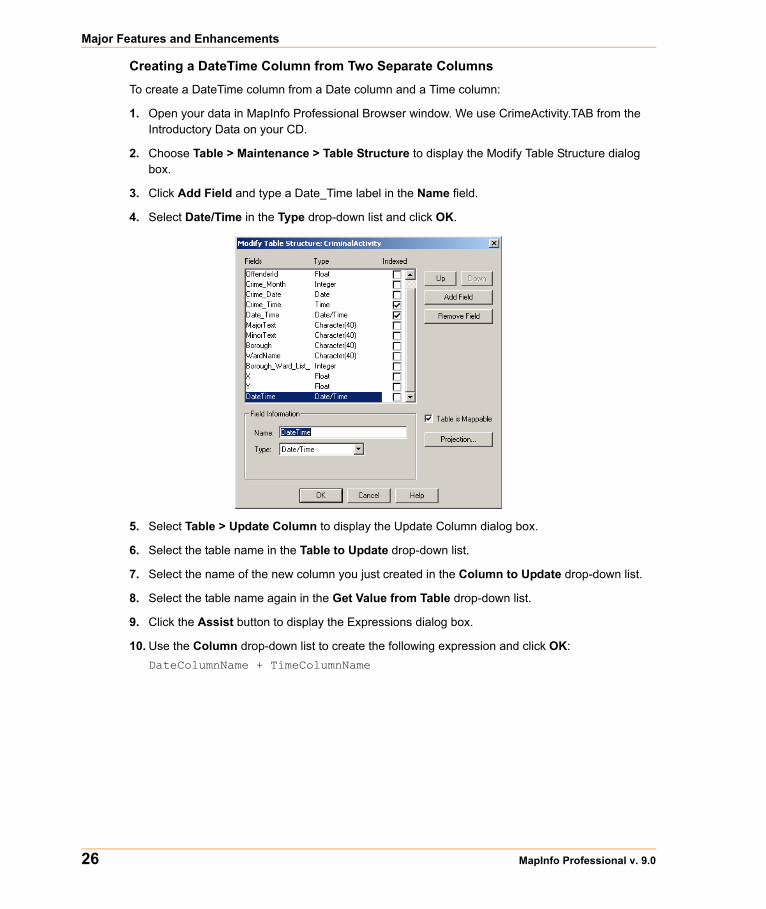
Major Features and Enhancements
26 MapInfo Professional v. 9.0
Creating a DateTime Column from Two Separate Columns
To create a DateTime column from a Date column and a Time column:
1. Open your data in MapInfo Professional Browser window. We use CrimeActivity.TAB from the Introductory Data on your CD.
2. Choose Table > Maintenance > Table Structure to display the Modify Table Structure dialog box.
3. Click Add Field and type a Date_Time label in the Name field.
4. Select Date/Time in the Type drop-down list and click OK.
5. Select Table > Update Column to display the Update Column dialog box.
6. Select the table name in the Table to Update drop-down list.
7. Select the name of the new column you just created in the Column to Update drop-down list.
8. Select the table name again in the Get Value from Table drop-down list.
9. Click the Assist button to display the Expressions dialog box.
10. Use the Column drop-down list to create the following expression and click OK:DateColumnName + TimeColumnName
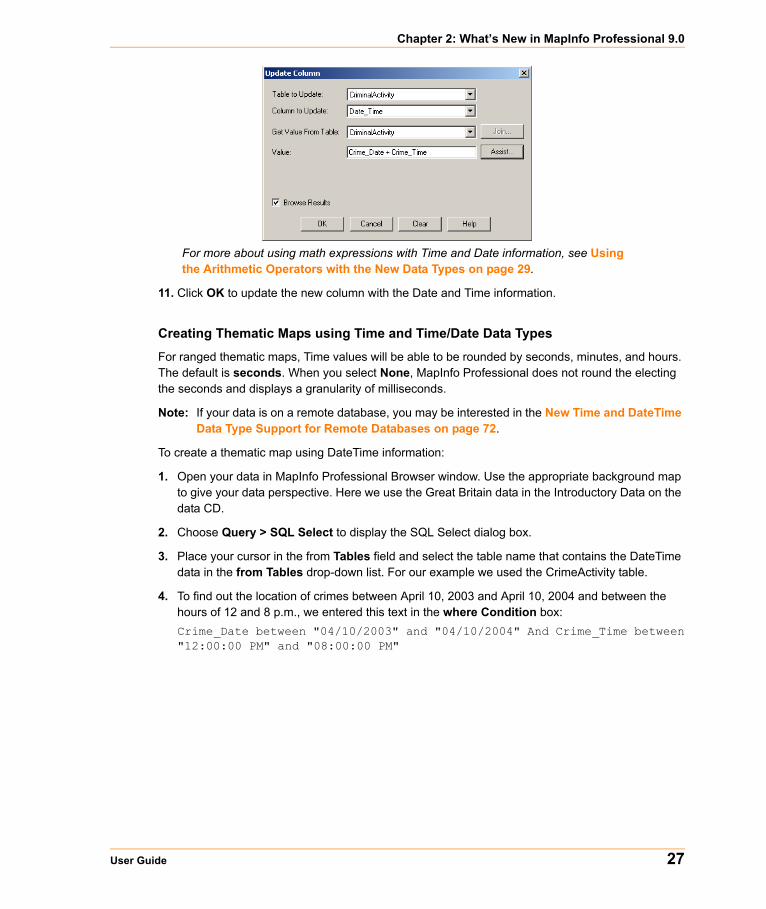
Chapter 2: What’s New in MapInfo Professional 9.0
User Guide 27
For more about using math expressions with Time and Date information, see Using the Arithmetic Operators with the New Data Types on page 29.
11. Click OK to update the new column with the Date and Time information.
Creating Thematic Maps using Time and Time/Date Data Types
For ranged thematic maps, Time values will be able to be rounded by seconds, minutes, and hours. The default is seconds. When you select None, MapInfo Professional does not round the electing the seconds and displays a granularity of milliseconds.
Note: If your data is on a remote database, you may be interested in the New Time and DateTime Data Type Support for Remote Databases on page 72.
To create a thematic map using DateTime information:
1. Open your data in MapInfo Professional Browser window. Use the appropriate background map to give your data perspective. Here we use the Great Britain data in the Introductory Data on the data CD.
2. Choose Query > SQL Select to display the SQL Select dialog box.
3. Place your cursor in the from Tables field and select the table name that contains the DateTime data in the from Tables drop-down list. For our example we used the CrimeActivity table.
4. To find out the location of crimes between April 10, 2003 and April 10, 2004 and between the hours of 12 and 8 p.m., we entered this text in the where Condition box:Crime_Date between "04/10/2003" and "04/10/2004" And Crime_Time between"12:00:00 PM" and "08:00:00 PM"
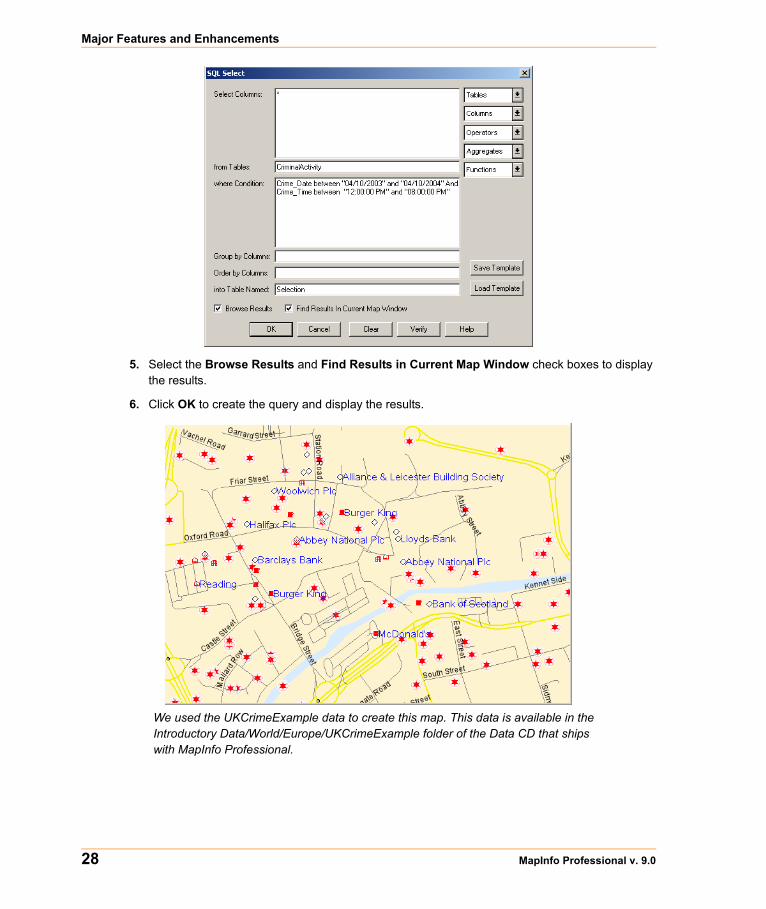
Major Features and Enhancements
28 MapInfo Professional v. 9.0
5. Select the Browse Results and Find Results in Current Map Window check boxes to display the results.
6. Click OK to create the query and display the results.
We used the UKCrimeExample data to create this map. This data is available in the Introductory Data/World/Europe/UKCrimeExample folder of the Data CD that ships with MapInfo Professional.
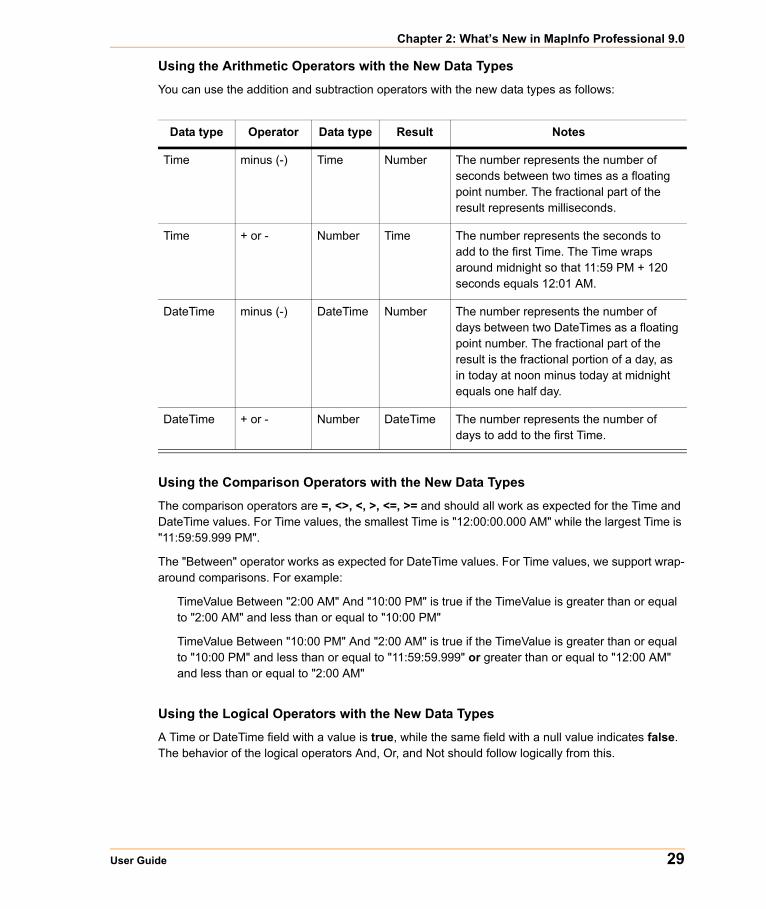
Chapter 2: What’s New in MapInfo Professional 9.0
User Guide 29
Using the Arithmetic Operators with the New Data Types
You can use the addition and subtraction operators with the new data types as follows:
Using the Comparison Operators with the New Data Types
The comparison operators are =, <>, <, >, <=, >= and should all work as expected for the Time and DateTime values. For Time values, the smallest Time is "12:00:00.000 AM" while the largest Time is "11:59:59.999 PM".
The "Between" operator works as expected for DateTime values. For Time values, we support wrap-around comparisons. For example:
TimeValue Between "2:00 AM" And "10:00 PM" is true if the TimeValue is greater than or equal to "2:00 AM" and less than or equal to "10:00 PM"
TimeValue Between "10:00 PM" And "2:00 AM" is true if the TimeValue is greater than or equal to "10:00 PM" and less than or equal to "11:59:59.999" or greater than or equal to "12:00 AM" and less than or equal to "2:00 AM"
Using the Logical Operators with the New Data Types
A Time or DateTime field with a value is true, while the same field with a null value indicates false. The behavior of the logical operators And, Or, and Not should follow logically from this.
Data type Operator Data type Result Notes
Time minus (-) Time Number The number represents the number of seconds between two times as a floating point number. The fractional part of the result represents milliseconds.
Time + or - Number Time The number represents the seconds to add to the first Time. The Time wraps around midnight so that 11:59 PM + 120 seconds equals 12:01 AM.
DateTime minus (-) DateTime Number The number represents the number of days between two DateTimes as a floating point number. The fractional part of the result is the fractional portion of a day, as in today at noon minus today at midnight equals one half day.
DateTime + or - Number DateTime The number represents the number of days to add to the first Time.
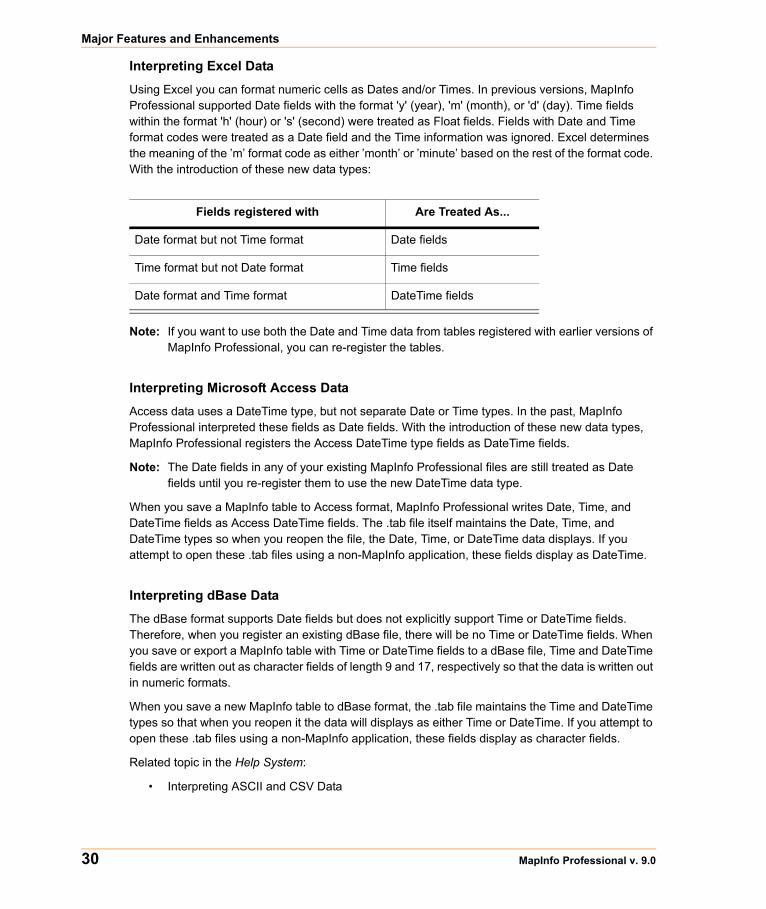
Major Features and Enhancements
30 MapInfo Professional v. 9.0
Interpreting Excel Data
Using Excel you can format numeric cells as Dates and/or Times. In previous versions, MapInfo Professional supported Date fields with the format 'y' (year), 'm' (month), or 'd' (day). Time fields within the format 'h' (hour) or 's' (second) were treated as Float fields. Fields with Date and Time format codes were treated as a Date field and the Time information was ignored. Excel determines the meaning of the ’m’ format code as either ’month’ or ’minute’ based on the rest of the format code. With the introduction of these new data types:
Note: If you want to use both the Date and Time data from tables registered with earlier versions of MapInfo Professional, you can re-register the tables.
Interpreting Microsoft Access Data
Access data uses a DateTime type, but not separate Date or Time types. In the past, MapInfo Professional interpreted these fields as Date fields. With the introduction of these new data types, MapInfo Professional registers the Access DateTime type fields as DateTime fields.
Note: The Date fields in any of your existing MapInfo Professional files are still treated as Date fields until you re-register them to use the new DateTime data type.
When you save a MapInfo table to Access format, MapInfo Professional writes Date, Time, and DateTime fields as Access DateTime fields. The .tab file itself maintains the Date, Time, and DateTime types so when you reopen the file, the Date, Time, or DateTime data displays. If you attempt to open these .tab files using a non-MapInfo application, these fields display as DateTime.
Interpreting dBase Data
The dBase format supports Date fields but does not explicitly support Time or DateTime fields. Therefore, when you register an existing dBase file, there will be no Time or DateTime fields. When you save or export a MapInfo table with Time or DateTime fields to a dBase file, Time and DateTime fields are written out as character fields of length 9 and 17, respectively so that the data is written out in numeric formats.
When you save a new MapInfo table to dBase format, the .tab file maintains the Time and DateTime types so that when you reopen it the data will displays as either Time or DateTime. If you attempt to open these .tab files using a non-MapInfo application, these fields display as character fields.
Related topic in the Help System:
• Interpreting ASCII and CSV Data
Fields registered with Are Treated As...
Date format but not Time format Date fields
Time format but not Date format Time fields
Date format and Time format DateTime fields
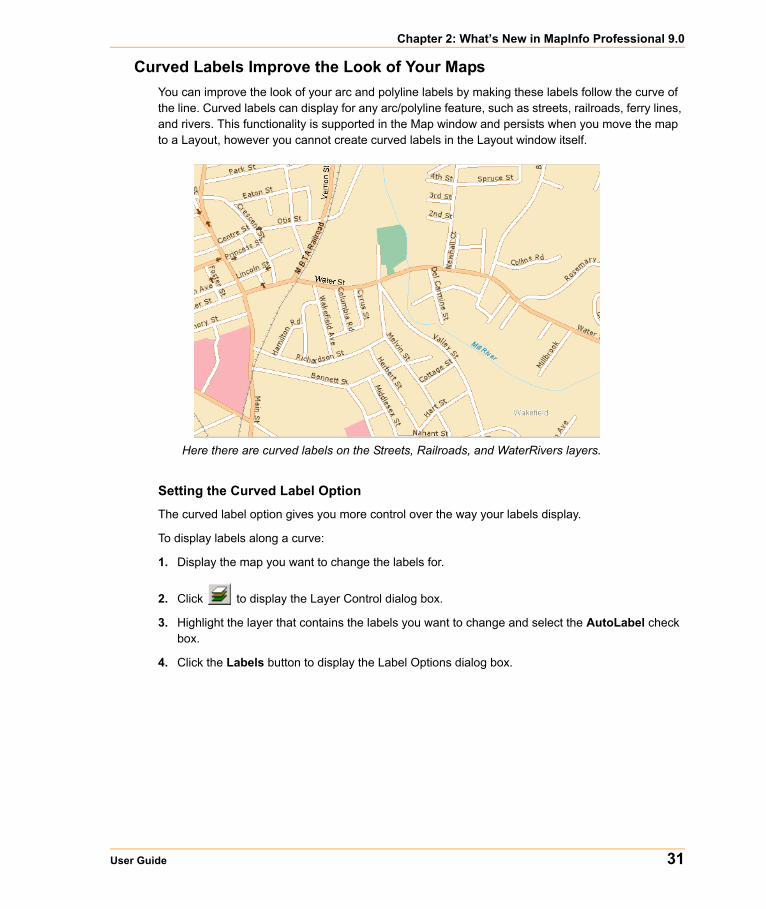
Chapter 2: What’s New in MapInfo Professional 9.0
User Guide 31
Curved Labels Improve the Look of Your MapsYou can improve the look of your arc and polyline labels by making these labels follow the curve of the line. Curved labels can display for any arc/polyline feature, such as streets, railroads, ferry lines, and rivers. This functionality is supported in the Map window and persists when you move the map to a Layout, however you cannot create curved labels in the Layout window itself.
Here there are curved labels on the Streets, Railroads, and WaterRivers layers.
Setting the Curved Label Option
The curved label option gives you more control over the way your labels display.
To display labels along a curve:
1. Display the map you want to change the labels for.
2. Click to display the Layer Control dialog box.
3. Highlight the layer that contains the labels you want to change and select the AutoLabel check box.
4. Click the Labels button to display the Label Options dialog box.
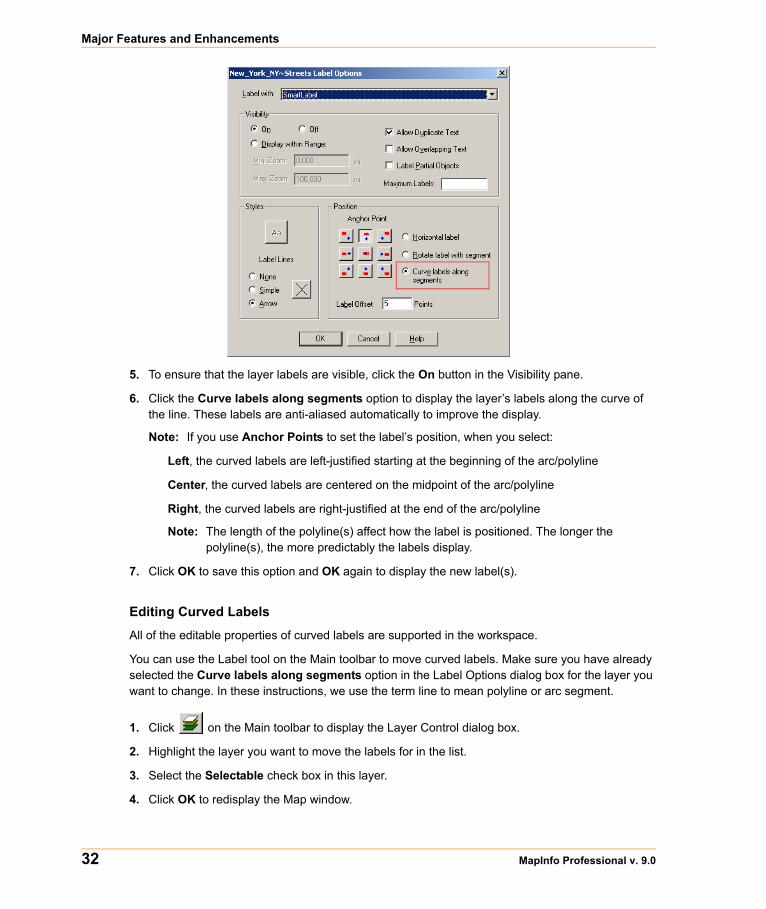
Major Features and Enhancements
32 MapInfo Professional v. 9.0
5. To ensure that the layer labels are visible, click the On button in the Visibility pane.
6. Click the Curve labels along segments option to display the layer’s labels along the curve of the line. These labels are anti-aliased automatically to improve the display.
Note: If you use Anchor Points to set the label’s position, when you select:
Left, the curved labels are left-justified starting at the beginning of the arc/polyline
Center, the curved labels are centered on the midpoint of the arc/polyline
Right, the curved labels are right-justified at the end of the arc/polyline
Note: The length of the polyline(s) affect how the label is positioned. The longer the polyline(s), the more predictably the labels display.
7. Click OK to save this option and OK again to display the new label(s).
Editing Curved Labels
All of the editable properties of curved labels are supported in the workspace.
You can use the Label tool on the Main toolbar to move curved labels. Make sure you have already selected the Curve labels along segments option in the Label Options dialog box for the layer you want to change. In these instructions, we use the term line to mean polyline or arc segment.
1. Click on the Main toolbar to display the Layer Control dialog box.
2. Highlight the layer you want to move the labels for in the list.
3. Select the Selectable check box in this layer.
4. Click OK to redisplay the Map window.
Chapter 2: What’s New in MapInfo Professional 9.0
User Guide 33
5. Click on the Main toolbar.
6. Click the line on which you want to reposition the label.
7. Click the new location for the label until the label displays as you want it to.
Note: If the segment you select does not have a label name associated with it in the data, no label displays. If MapInfo Professional cannot edit the label, the Label tool beeps to indicate an error.
Understanding your Data and Curved Labels
When you select curved autolabeling, MapInfo Professional attempts to create a curved label for every arc/polyline record in a map, just as it does for non-curved labels.
For example, in street maps, the street can be made of several polylines or one long polyline. The length and number of the polylines, the rules that govern whether a curved label can be created, and the labeling options you choose, all affect which curved labels are created and where they display.
Some polyline and arc segments in your layer data may not contain label name entries. When this occurs, MapInfo Professional cannot display labels for that segment.
What to Expect from Curved Labels
This feature is made up of complex algorithms that are designed to enhance the display of your polyline/arc features. There are several rules which determine whether MapInfo Professional can display a curved label.
• MapInfo Professional can only draw curved labels using TrueType fonts. If you select a non-TrueType font, MapInfo Professional substitutes a comparable TrueType font, so, the label you chose may display differently than you expect. Also, if you change a horizontal label using a non-TrueType to a curved label, the new label may display differently due to the font substitution.
• Part of the label string must fit along the polyline/arc that it is labelling. If it cannot fit, MapInfo Professional determines that the label is too long and throws it away
• MapInfo Professional cannot draw curved labels for polylines that are very jagged, however, it depends on the curvature of the line
• Labels that curve onto themselves are thrown away and do not display• Curved labels follow the same rules for overlap detection, duplicate text, and partial segment
labeling as non-curved labels. Each of these rules affect how and when MapInfo Professional displays the labels
• You cannot drag curved labels as you can other labels• You can create curved labels with the Label tool at any point along a polyline/arc• You can reposition the curved auto labels with the Label tool• Curved and non-curved labels persist for layers in the workspace• The Labeler utility does not support curved labels, so you cannot transfer curved labels to the
Cosmetic layer• The curved labels functionality supports double byte characters• The Label Lines controls are disabled whenever you select the Curve labels along
segments option• You cannot underline curved labels
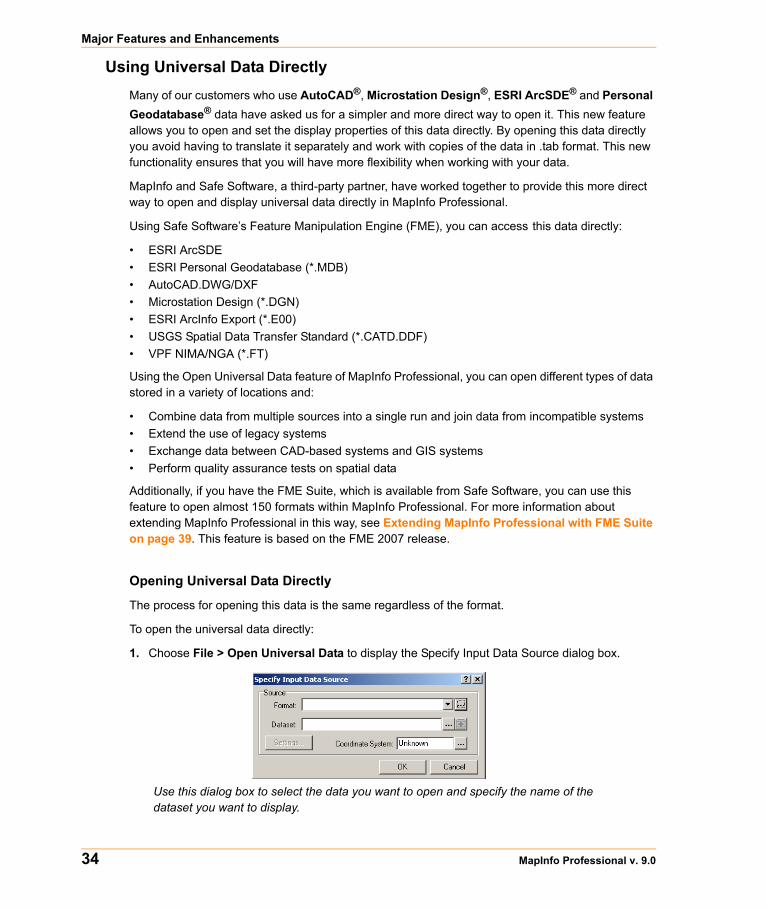
Major Features and Enhancements
34 MapInfo Professional v. 9.0
Using Universal Data DirectlyMany of our customers who use AutoCAD®, Microstation Design®, ESRI ArcSDE® and Personal Geodatabase® data have asked us for a simpler and more direct way to open it. This new feature allows you to open and set the display properties of this data directly. By opening this data directly you avoid having to translate it separately and work with copies of the data in .tab format. This new functionality ensures that you will have more flexibility when working with your data.
MapInfo and Safe Software, a third-party partner, have worked together to provide this more direct way to open and display universal data directly in MapInfo Professional.
Using Safe Software’s Feature Manipulation Engine (FME), you can access this data directly:
• ESRI ArcSDE• ESRI Personal Geodatabase (*.MDB)• AutoCAD.DWG/DXF• Microstation Design (*.DGN)• ESRI ArcInfo Export (*.E00)• USGS Spatial Data Transfer Standard (*.CATD.DDF)• VPF NIMA/NGA (*.FT)
Using the Open Universal Data feature of MapInfo Professional, you can open different types of data stored in a variety of locations and:
• Combine data from multiple sources into a single run and join data from incompatible systems • Extend the use of legacy systems • Exchange data between CAD-based systems and GIS systems • Perform quality assurance tests on spatial data
Additionally, if you have the FME Suite, which is available from Safe Software, you can use this feature to open almost 150 formats within MapInfo Professional. For more information about extending MapInfo Professional in this way, see Extending MapInfo Professional with FME Suite on page 39. This feature is based on the FME 2007 release.
Opening Universal Data Directly
The process for opening this data is the same regardless of the format.
To open the universal data directly:
1. Choose File > Open Universal Data to display the Specify Input Data Source dialog box.
Use this dialog box to select the data you want to open and specify the name of the dataset you want to display.
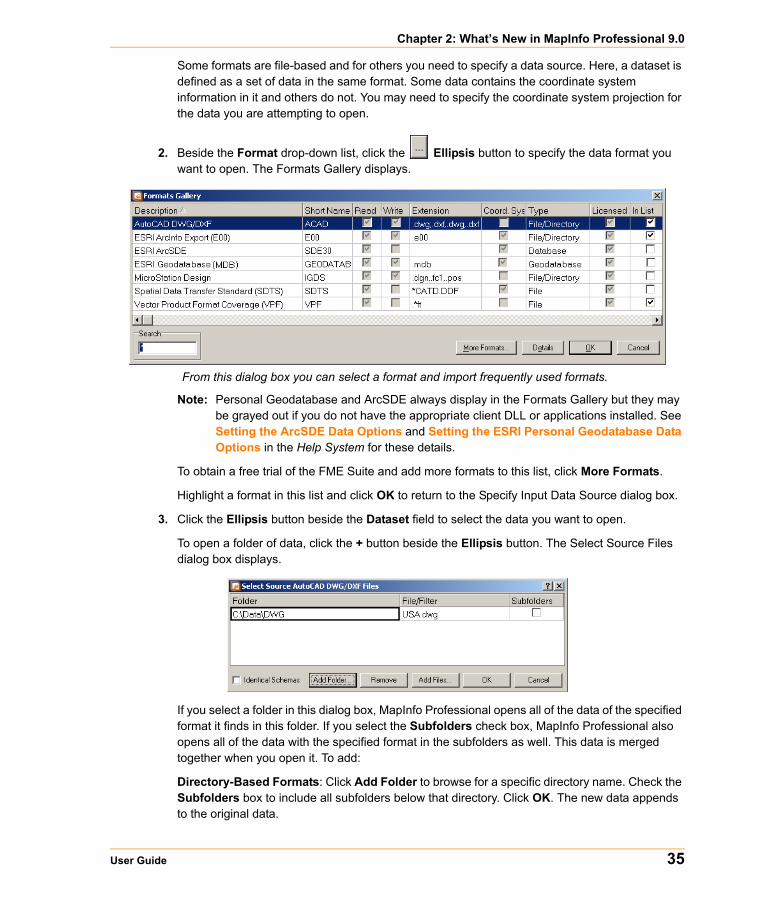
Chapter 2: What’s New in MapInfo Professional 9.0
User Guide 35
Some formats are file-based and for others you need to specify a data source. Here, a dataset is defined as a set of data in the same format. Some data contains the coordinate system information in it and others do not. You may need to specify the coordinate system projection for the data you are attempting to open.
2. Beside the Format drop-down list, click the Ellipsis button to specify the data format you want to open. The Formats Gallery displays.
From this dialog box you can select a format and import frequently used formats.
Note: Personal Geodatabase and ArcSDE always display in the Formats Gallery but they may be grayed out if you do not have the appropriate client DLL or applications installed. See Setting the ArcSDE Data Options and Setting the ESRI Personal Geodatabase Data Options in the Help System for these details.
To obtain a free trial of the FME Suite and add more formats to this list, click More Formats.
Highlight a format in this list and click OK to return to the Specify Input Data Source dialog box.
3. Click the Ellipsis button beside the Dataset field to select the data you want to open.
To open a folder of data, click the + button beside the Ellipsis button. The Select Source Files dialog box displays.
If you select a folder in this dialog box, MapInfo Professional opens all of the data of the specified format it finds in this folder. If you select the Subfolders check box, MapInfo Professional also opens all of the data with the specified format in the subfolders as well. This data is merged together when you open it. To add:
Directory-Based Formats: Click Add Folder to browse for a specific directory name. Check the Subfolders box to include all subfolders below that directory. Click OK. The new data appends to the original data.
Major Features and Enhancements
36 MapInfo Professional v. 9.0
File-Based Formats: You can type directly in the Folder field, and use wildcards to include all files of a specific format. For example:
*.dgn
merges all the .dgn files on your C drive. Check Identical Schemas if the files have the same schema.
• Click Add Files to select individual files
• Ctrl+Left-click to select multiple files
• Click Remove to delete single or multiple files based on your selection
Click OK. The new data appends to the original data. The Specify Data Input Source dialog box redisplays.
4. If the coordinate system for the data you selected is unknown, you need to specify it in the Coordinate System field. Click the Ellipsis button beside the field to select the appropriate projection and click OK. If you do not specify the coordinate system here, you will be prompted later. For more about this feature, see Coordinate System Behavior and Universal Data on page 38.
5. Click Settings to display the settings options for this file type. The options in these dialog boxes depend on the format you selected. To learn more about these settings, see the these topics in the Help System:
Setting the AutoCAD Options
Setting the ArcInfo Export File Options
Setting the ArcSDE Data Options
Setting the ESRI Personal Geodatabase Data Options
Setting the Microstation Design File Options
Setting the Vector Product Format Coverage Settings
Note: The Spatial Data Transfer Standard data does not have settings options.
It is possible that a style option s will not show. If it's the case it means that the layer(s) in question does (do) not have any geometry objects (only attributes).
6. When you have completed your settings, click OK to open the data you selected.
If you did not specify the coordinate system in step 4 and the coordinate system is unknown, the Choose Projection dialog box displays, allowing you to select the projection for the data you are opening. Select the appropriate projection for the data and click OK. The system defaults to your Table Projection setting in the Map Window Preference if you do not select a projection here. See Coordinate System Behavior and Universal Data on page 38 for more information. The Select Layers dialog box displays.

Chapter 2: What’s New in MapInfo Professional 9.0
User Guide 37
Use this box to specify the layers to open and then specify the layer display options.
To change the name of the layer, click it, type a new name in the File Name field and click Apply. Use the Check All and Uncheck All buttons to select or deselect the Open check box for all of the layers. Click the Back button to return to the Specify Input Data Source dialog box.
7. Now you are ready to select the layers to which you will apply the new display options. All layers you select together will share the same display characteristics.
• To change the display options of all layers, click the layer name of the first layer, press the Shift key, and click the layer name of the last layer
• To change the display options of some layers, click the layer name of the first layer, press the Ctrl key, and click the other layers that require the same change
• To change the display options of one layer, click the layer name of the layer
8. Once you have selected the layer(s), use the display buttons to make the changes you require. If the layer(s) you are changing contain:
• Point data, click the Symbol Style button to change the symbol options
• Line data, click the Line Style button to change the line options
• Region data, click the Region Style button to change the background options
• Text data, click the Text Style button to change the text options
Note: If you want to open maps based on data that is thematically related, assign the same styles to the layers that contain that information.
9. Once you have completed your layer display options, consider the options that affect the whole data source. You can select from these options:
• Use color information from data
• Do not open empty layers
10. Use the Directory field to specify the path to which you want to save the resulting data. Click the Ellipsis button beside the field to navigate to the appropriate directory.
MapInfo Professional opens all layers with the Open check box selected.
Major Features and Enhancements
38 MapInfo Professional v. 9.0
11. Select the viewing options from the Preferred View drop down box, as you would when opening any other data.
12. When you have completed your selections, click OK to open the data according to the settings you have specified. A status bar displays to indicate the progress and the data displays.
Note: For any terminology that might not be familiar to you, review the FME Suite Help System.
Avoiding Out of Disk Space Errors when using Universal Data
When you open universal data using this new feature, the data is stored locally temporarily so you can reopen it faster the next time you use MapInfo Professional. For example, the temporary file folder location for Windows XP is:
C:\Documents and Settings\<user id>\Local Settings\Application Data\MapInfo\MapInfo\Professional\900\UniversalDataCache\
Note: Paths in this explanation are based on installations on Windows XP and Windows 2000 operating systems. Vista operating system users need to consult their system documentation for the right path for their installation.
If you find that you are opening large files with many layers using this feature, these files can get very large and may impact the performance of your system. If you see Out of Disk Space errors, you may want to delete these files to see if this data is the cause of the error. Whenever you delete temporary files, you will have to reopen that stored data to display it again.
Coordinate System Behavior and Universal Data
Some of the universal data you are working with contains coordinate system information and some do not. If you are opening Spatial Data Transfer Standard data and some of the ESRI data, the coordinate system information entry is handled for you. Coordinate system information for AutoCAD, Microstation Design and VPF data must be specified, although VPF data is usually in the Longitude/Latitude WGS 84 projection.
Refreshing the Universal Data
You can refresh the data from the original data source using the Universal Data Table Refresh command. This allows you to incorporate changes to the original data in your new MapInfo Professional map.
To refresh the universal data:
1. The data you want to refresh must be open in the Map window.
2. Choose Table > Universal Data Table Refresh. The Select Tables dialog box displays.
3. Highlight the table(s) you want to refresh in the list and click Select. A status bar displays to indicate the progress and the layers are refreshed.
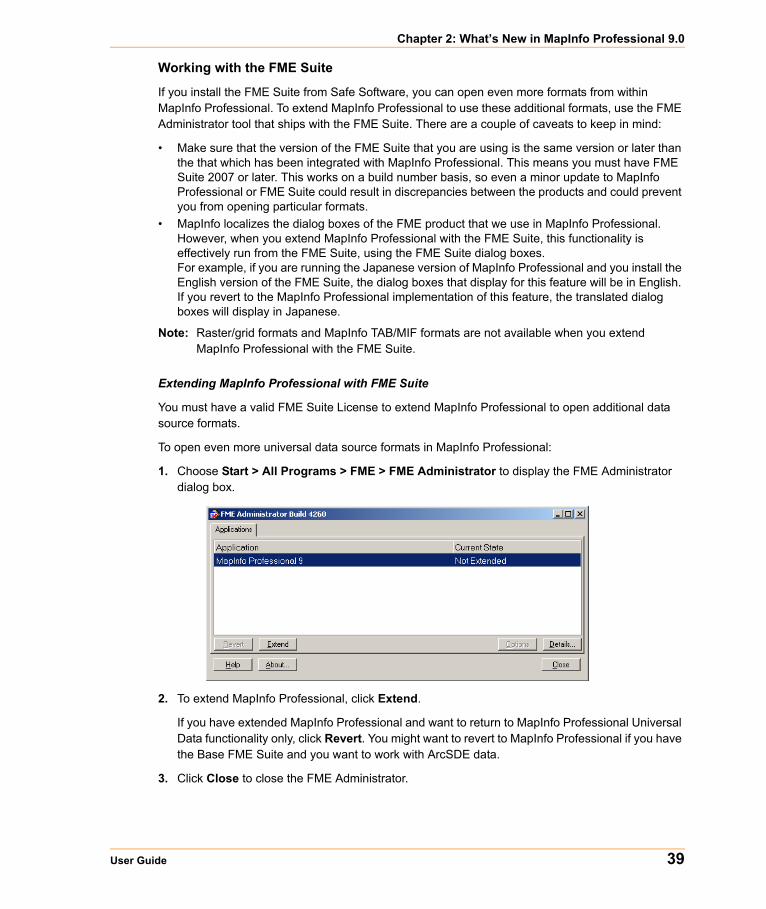
Chapter 2: What’s New in MapInfo Professional 9.0
User Guide 39
Working with the FME Suite
If you install the FME Suite from Safe Software, you can open even more formats from within MapInfo Professional. To extend MapInfo Professional to use these additional formats, use the FME Administrator tool that ships with the FME Suite. There are a couple of caveats to keep in mind:
• Make sure that the version of the FME Suite that you are using is the same version or later than the that which has been integrated with MapInfo Professional. This means you must have FME Suite 2007 or later. This works on a build number basis, so even a minor update to MapInfo Professional or FME Suite could result in discrepancies between the products and could prevent you from opening particular formats.
• MapInfo localizes the dialog boxes of the FME product that we use in MapInfo Professional. However, when you extend MapInfo Professional with the FME Suite, this functionality is effectively run from the FME Suite, using the FME Suite dialog boxes. For example, if you are running the Japanese version of MapInfo Professional and you install the English version of the FME Suite, the dialog boxes that display for this feature will be in English. If you revert to the MapInfo Professional implementation of this feature, the translated dialog boxes will display in Japanese.
Note: Raster/grid formats and MapInfo TAB/MIF formats are not available when you extend MapInfo Professional with the FME Suite.
Extending MapInfo Professional with FME Suite
You must have a valid FME Suite License to extend MapInfo Professional to open additional data source formats.
To open even more universal data source formats in MapInfo Professional:
1. Choose Start > All Programs > FME > FME Administrator to display the FME Administrator dialog box.
2. To extend MapInfo Professional, click Extend.
If you have extended MapInfo Professional and want to return to MapInfo Professional Universal Data functionality only, click Revert. You might want to revert to MapInfo Professional if you have the Base FME Suite and you want to work with ArcSDE data.
3. Click Close to close the FME Administrator.
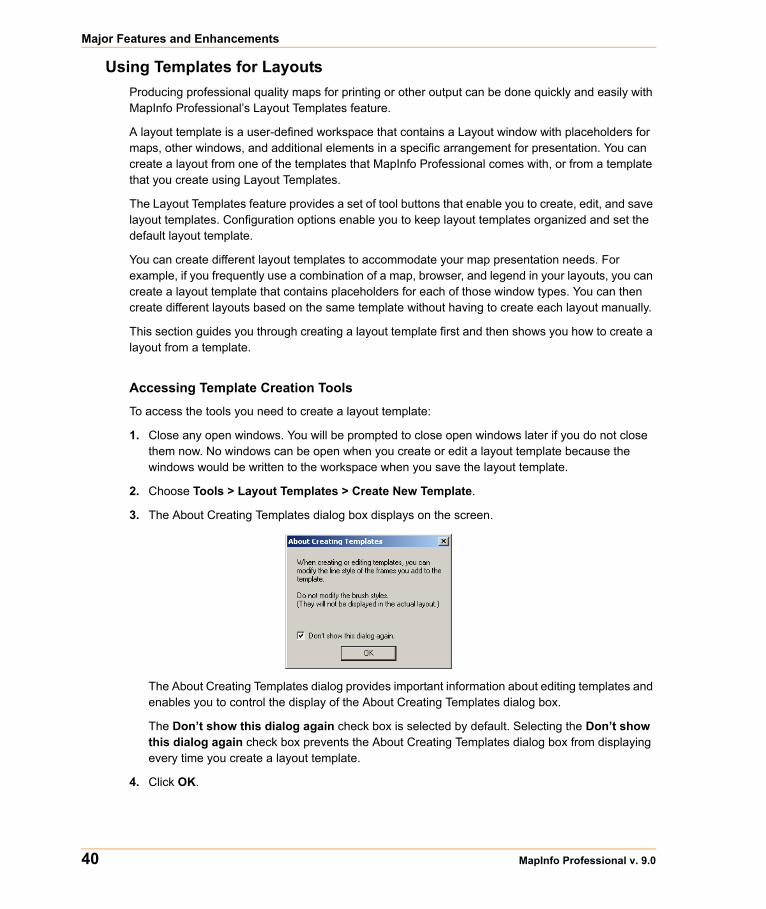
Major Features and Enhancements
40 MapInfo Professional v. 9.0
Using Templates for LayoutsProducing professional quality maps for printing or other output can be done quickly and easily with MapInfo Professional’s Layout Templates feature.
A layout template is a user-defined workspace that contains a Layout window with placeholders for maps, other windows, and additional elements in a specific arrangement for presentation. You can create a layout from one of the templates that MapInfo Professional comes with, or from a template that you create using Layout Templates.
The Layout Templates feature provides a set of tool buttons that enable you to create, edit, and save layout templates. Configuration options enable you to keep layout templates organized and set the default layout template.
You can create different layout templates to accommodate your map presentation needs. For example, if you frequently use a combination of a map, browser, and legend in your layouts, you can create a layout template that contains placeholders for each of those window types. You can then create different layouts based on the same template without having to create each layout manually.
This section guides you through creating a layout template first and then shows you how to create a layout from a template.
Accessing Template Creation Tools
To access the tools you need to create a layout template:
1. Close any open windows. You will be prompted to close open windows later if you do not close them now. No windows can be open when you create or edit a layout template because the windows would be written to the workspace when you save the layout template.
2. Choose Tools > Layout Templates > Create New Template.
3. The About Creating Templates dialog box displays on the screen.
The About Creating Templates dialog provides important information about editing templates and enables you to control the display of the About Creating Templates dialog box.
The Don’t show this dialog again check box is selected by default. Selecting the Don’t show this dialog again check box prevents the About Creating Templates dialog box from displaying every time you create a layout template.
4. Click OK.
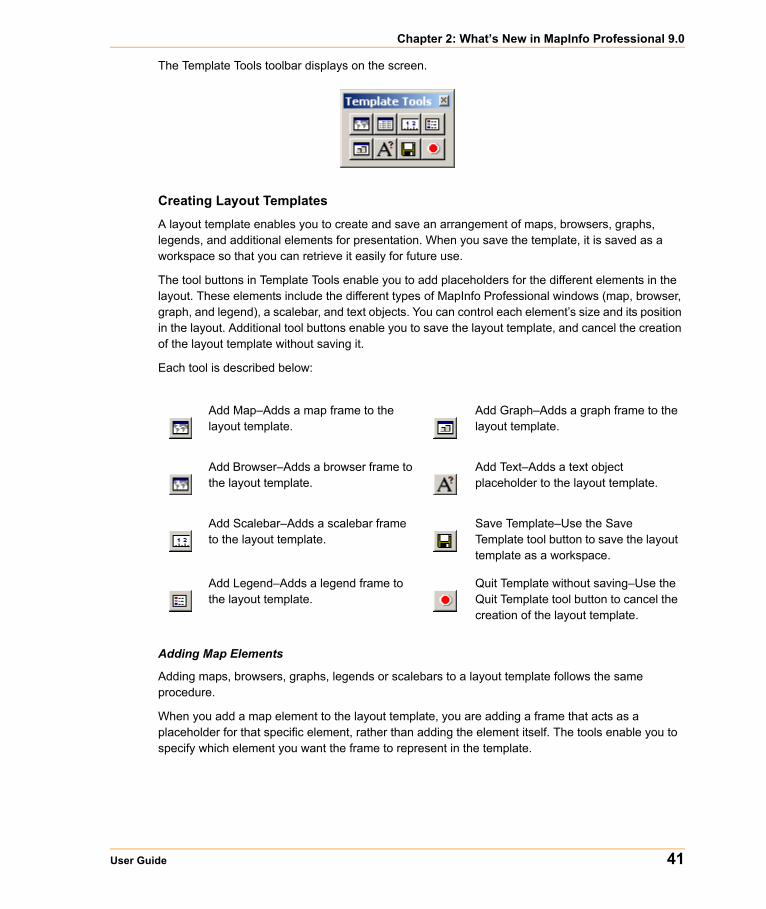
Chapter 2: What’s New in MapInfo Professional 9.0
User Guide 41
The Template Tools toolbar displays on the screen.
Creating Layout Templates
A layout template enables you to create and save an arrangement of maps, browsers, graphs, legends, and additional elements for presentation. When you save the template, it is saved as a workspace so that you can retrieve it easily for future use.
The tool buttons in Template Tools enable you to add placeholders for the different elements in the layout. These elements include the different types of MapInfo Professional windows (map, browser, graph, and legend), a scalebar, and text objects. You can control each element’s size and its position in the layout. Additional tool buttons enable you to save the layout template, and cancel the creation of the layout template without saving it.
Each tool is described below:
Adding Map Elements
Adding maps, browsers, graphs, legends or scalebars to a layout template follows the same procedure.
When you add a map element to the layout template, you are adding a frame that acts as a placeholder for that specific element, rather than adding the element itself. The tools enable you to specify which element you want the frame to represent in the template.
Add Map–Adds a map frame to the layout template.
Add Graph–Adds a graph frame to the layout template.
Add Browser–Adds a browser frame to the layout template.
Add Text–Adds a text object placeholder to the layout template.
Add Scalebar–Adds a scalebar frame to the layout template.
Save Template–Use the Save Template tool button to save the layout template as a workspace.
Add Legend–Adds a legend frame to the layout template.
Quit Template without saving–Use the Quit Template tool button to cancel the creation of the layout template.
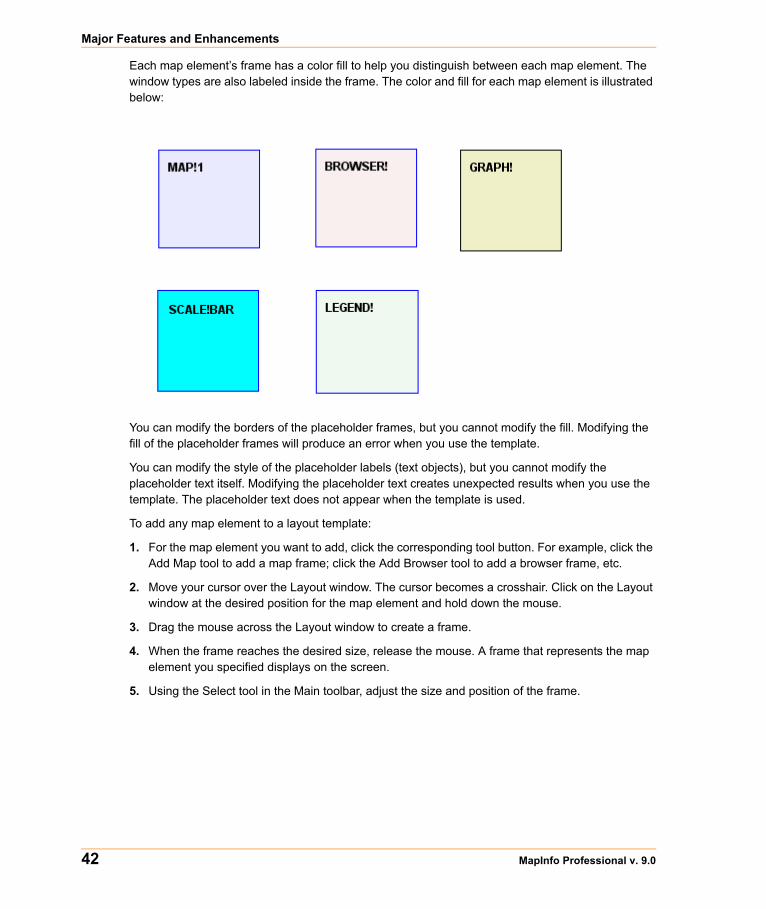
Major Features and Enhancements
42 MapInfo Professional v. 9.0
Each map element’s frame has a color fill to help you distinguish between each map element. The window types are also labeled inside the frame. The color and fill for each map element is illustrated below:
You can modify the borders of the placeholder frames, but you cannot modify the fill. Modifying the fill of the placeholder frames will produce an error when you use the template.
You can modify the style of the placeholder labels (text objects), but you cannot modify the placeholder text itself. Modifying the placeholder text creates unexpected results when you use the template. The placeholder text does not appear when the template is used.
To add any map element to a layout template:
1. For the map element you want to add, click the corresponding tool button. For example, click the Add Map tool to add a map frame; click the Add Browser tool to add a browser frame, etc.
2. Move your cursor over the Layout window. The cursor becomes a crosshair. Click on the Layout window at the desired position for the map element and hold down the mouse.
3. Drag the mouse across the Layout window to create a frame.
4. When the frame reaches the desired size, release the mouse. A frame that represents the map element you specified displays on the screen.
5. Using the Select tool in the Main toolbar, adjust the size and position of the frame.
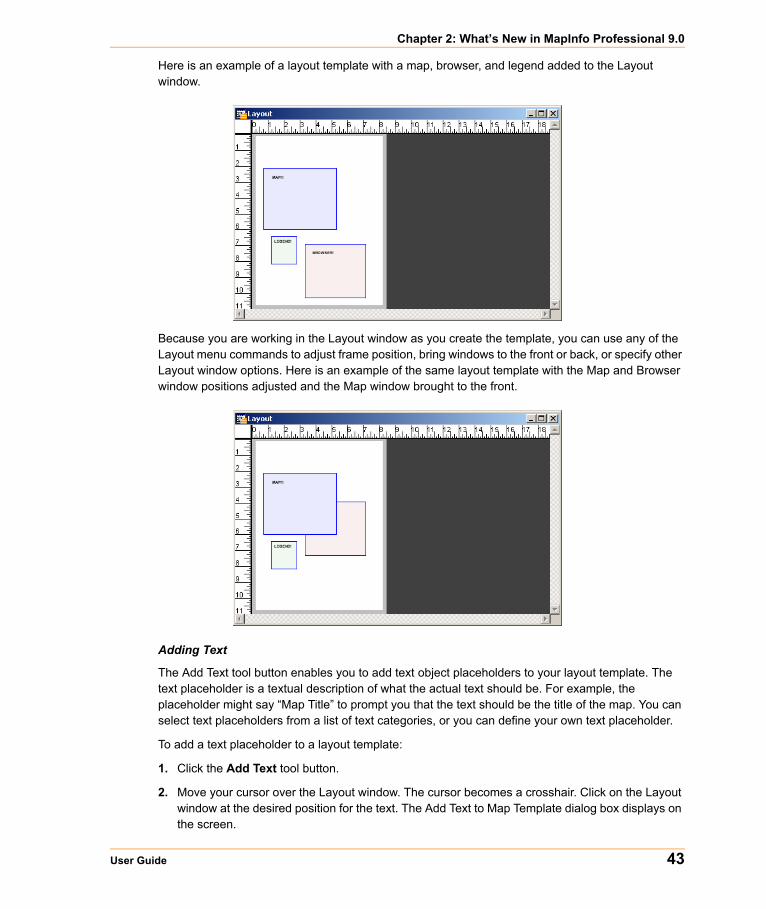
Chapter 2: What’s New in MapInfo Professional 9.0
User Guide 43
Here is an example of a layout template with a map, browser, and legend added to the Layout window.
Because you are working in the Layout window as you create the template, you can use any of the Layout menu commands to adjust frame position, bring windows to the front or back, or specify other Layout window options. Here is an example of the same layout template with the Map and Browser window positions adjusted and the Map window brought to the front.
Adding Text
The Add Text tool button enables you to add text object placeholders to your layout template. The text placeholder is a textual description of what the actual text should be. For example, the placeholder might say “Map Title” to prompt you that the text should be the title of the map. You can select text placeholders from a list of text categories, or you can define your own text placeholder.
To add a text placeholder to a layout template:
1. Click the Add Text tool button.
2. Move your cursor over the Layout window. The cursor becomes a crosshair. Click on the Layout window at the desired position for the text. The Add Text to Map Template dialog box displays on the screen.
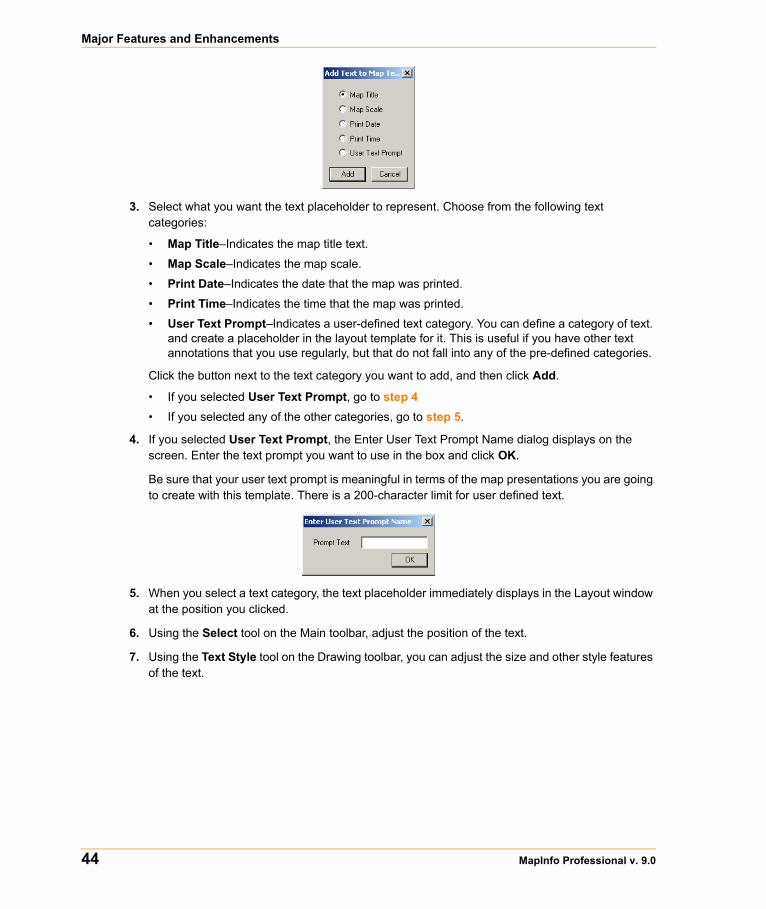
Major Features and Enhancements
44 MapInfo Professional v. 9.0
3. Select what you want the text placeholder to represent. Choose from the following text categories:
• Map Title–Indicates the map title text.
• Map Scale–Indicates the map scale.
• Print Date–Indicates the date that the map was printed.
• Print Time–Indicates the time that the map was printed.
• User Text Prompt–Indicates a user-defined text category. You can define a category of text. and create a placeholder in the layout template for it. This is useful if you have other text annotations that you use regularly, but that do not fall into any of the pre-defined categories.
Click the button next to the text category you want to add, and then click Add.
• If you selected User Text Prompt, go to step 4• If you selected any of the other categories, go to step 5.
4. If you selected User Text Prompt, the Enter User Text Prompt Name dialog displays on the screen. Enter the text prompt you want to use in the box and click OK.
Be sure that your user text prompt is meaningful in terms of the map presentations you are going to create with this template. There is a 200-character limit for user defined text.
5. When you select a text category, the text placeholder immediately displays in the Layout window at the position you clicked.
6. Using the Select tool on the Main toolbar, adjust the position of the text.
7. Using the Text Style tool on the Drawing toolbar, you can adjust the size and other style features of the text.
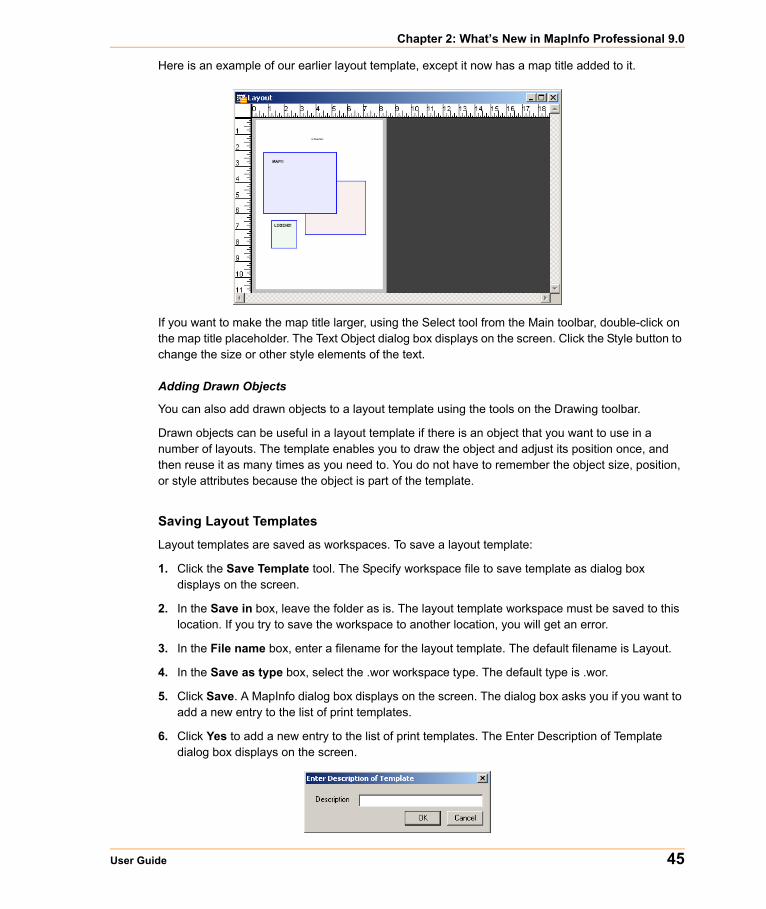
Chapter 2: What’s New in MapInfo Professional 9.0
User Guide 45
Here is an example of our earlier layout template, except it now has a map title added to it.
If you want to make the map title larger, using the Select tool from the Main toolbar, double-click on the map title placeholder. The Text Object dialog box displays on the screen. Click the Style button to change the size or other style elements of the text.
Adding Drawn Objects
You can also add drawn objects to a layout template using the tools on the Drawing toolbar.
Drawn objects can be useful in a layout template if there is an object that you want to use in a number of layouts. The template enables you to draw the object and adjust its position once, and then reuse it as many times as you need to. You do not have to remember the object size, position, or style attributes because the object is part of the template.
Saving Layout Templates
Layout templates are saved as workspaces. To save a layout template:
1. Click the Save Template tool. The Specify workspace file to save template as dialog box displays on the screen.
2. In the Save in box, leave the folder as is. The layout template workspace must be saved to this location. If you try to save the workspace to another location, you will get an error.
3. In the File name box, enter a filename for the layout template. The default filename is Layout.
4. In the Save as type box, select the .wor workspace type. The default type is .wor.
5. Click Save. A MapInfo dialog box displays on the screen. The dialog box asks you if you want to add a new entry to the list of print templates.
6. Click Yes to add a new entry to the list of print templates. The Enter Description of Template dialog box displays on the screen.
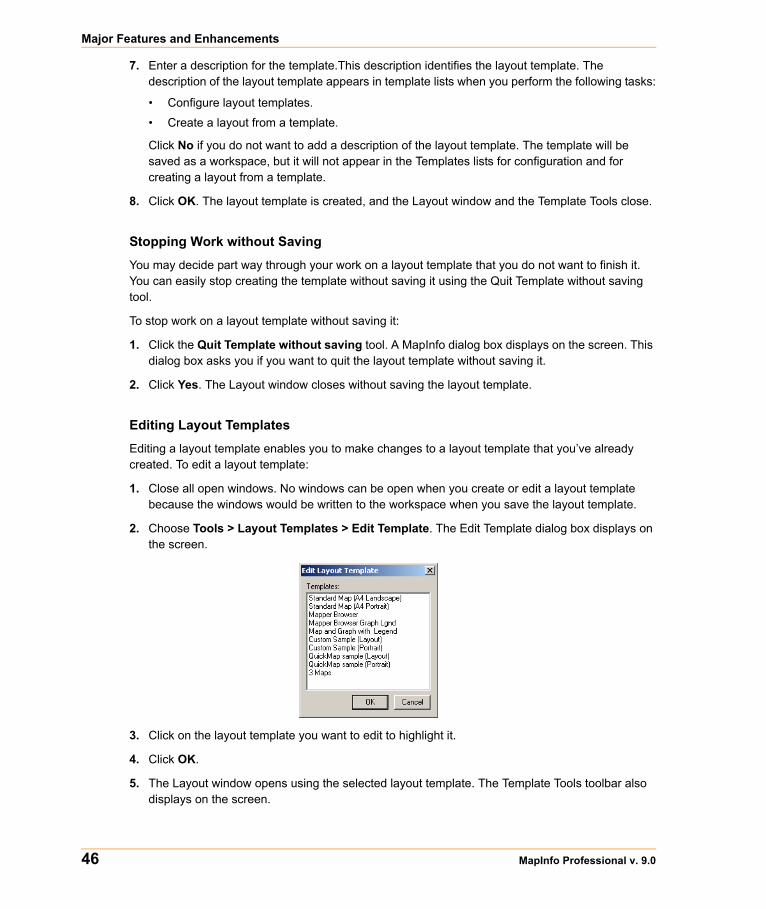
Major Features and Enhancements
46 MapInfo Professional v. 9.0
7. Enter a description for the template.This description identifies the layout template. The description of the layout template appears in template lists when you perform the following tasks:
• Configure layout templates.
• Create a layout from a template.
Click No if you do not want to add a description of the layout template. The template will be saved as a workspace, but it will not appear in the Templates lists for configuration and for creating a layout from a template.
8. Click OK. The layout template is created, and the Layout window and the Template Tools close.
Stopping Work without Saving
You may decide part way through your work on a layout template that you do not want to finish it. You can easily stop creating the template without saving it using the Quit Template without saving tool.
To stop work on a layout template without saving it:
1. Click the Quit Template without saving tool. A MapInfo dialog box displays on the screen. This dialog box asks you if you want to quit the layout template without saving it.
2. Click Yes. The Layout window closes without saving the layout template.
Editing Layout Templates
Editing a layout template enables you to make changes to a layout template that you’ve already created. To edit a layout template:
1. Close all open windows. No windows can be open when you create or edit a layout template because the windows would be written to the workspace when you save the layout template.
2. Choose Tools > Layout Templates > Edit Template. The Edit Template dialog box displays on the screen.
3. Click on the layout template you want to edit to highlight it.
4. Click OK.
5. The Layout window opens using the selected layout template. The Template Tools toolbar also displays on the screen.
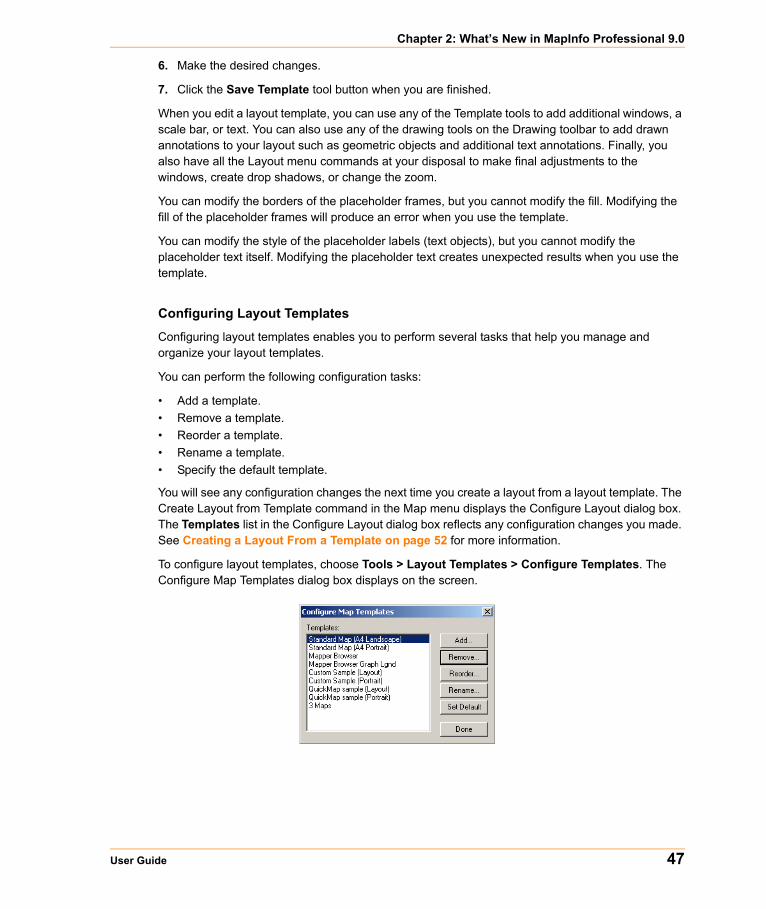
Chapter 2: What’s New in MapInfo Professional 9.0
User Guide 47
6. Make the desired changes.
7. Click the Save Template tool button when you are finished.
When you edit a layout template, you can use any of the Template tools to add additional windows, a scale bar, or text. You can also use any of the drawing tools on the Drawing toolbar to add drawn annotations to your layout such as geometric objects and additional text annotations. Finally, you also have all the Layout menu commands at your disposal to make final adjustments to the windows, create drop shadows, or change the zoom.
You can modify the borders of the placeholder frames, but you cannot modify the fill. Modifying the fill of the placeholder frames will produce an error when you use the template.
You can modify the style of the placeholder labels (text objects), but you cannot modify the placeholder text itself. Modifying the placeholder text creates unexpected results when you use the template.
Configuring Layout Templates
Configuring layout templates enables you to perform several tasks that help you manage and organize your layout templates.
You can perform the following configuration tasks:
• Add a template.• Remove a template.• Reorder a template. • Rename a template.• Specify the default template.
You will see any configuration changes the next time you create a layout from a layout template. The Create Layout from Template command in the Map menu displays the Configure Layout dialog box. The Templates list in the Configure Layout dialog box reflects any configuration changes you made. See Creating a Layout From a Template on page 52 for more information.
To configure layout templates, choose Tools > Layout Templates > Configure Templates. The Configure Map Templates dialog box displays on the screen.
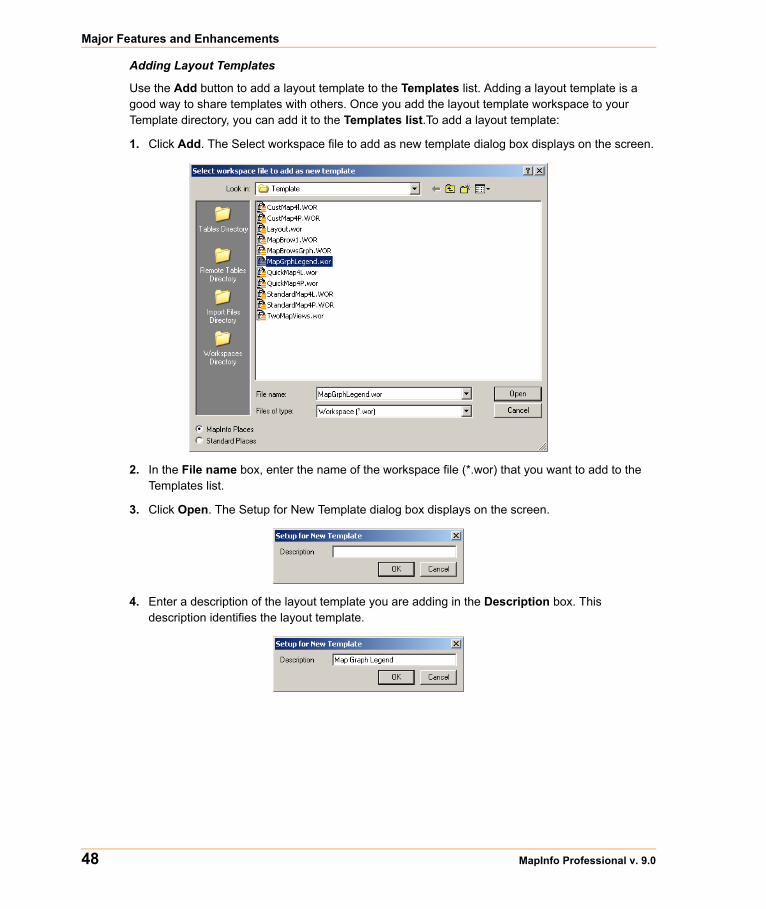
Major Features and Enhancements
48 MapInfo Professional v. 9.0
Adding Layout Templates
Use the Add button to add a layout template to the Templates list. Adding a layout template is a good way to share templates with others. Once you add the layout template workspace to your Template directory, you can add it to the Templates list.To add a layout template:
1. Click Add. The Select workspace file to add as new template dialog box displays on the screen.
2. In the File name box, enter the name of the workspace file (*.wor) that you want to add to the Templates list.
3. Click Open. The Setup for New Template dialog box displays on the screen.
4. Enter a description of the layout template you are adding in the Description box. This description identifies the layout template.
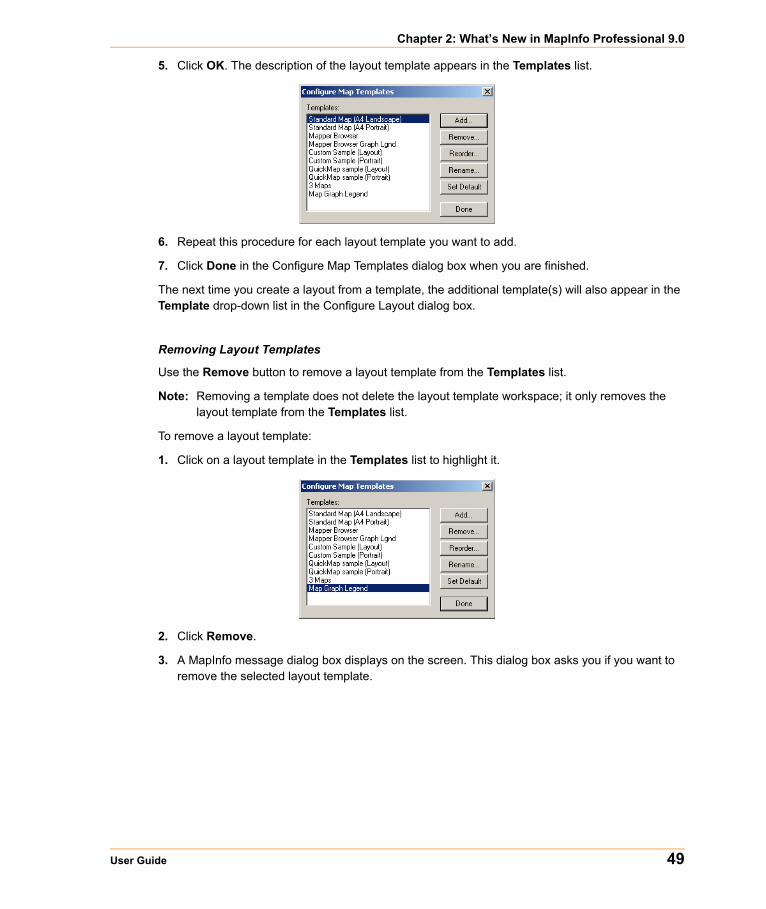
Chapter 2: What’s New in MapInfo Professional 9.0
User Guide 49
5. Click OK. The description of the layout template appears in the Templates list.
6. Repeat this procedure for each layout template you want to add.
7. Click Done in the Configure Map Templates dialog box when you are finished.
The next time you create a layout from a template, the additional template(s) will also appear in the Template drop-down list in the Configure Layout dialog box.
Removing Layout Templates
Use the Remove button to remove a layout template from the Templates list.
Note: Removing a template does not delete the layout template workspace; it only removes the layout template from the Templates list.
To remove a layout template:
1. Click on a layout template in the Templates list to highlight it.
2. Click Remove.
3. A MapInfo message dialog box displays on the screen. This dialog box asks you if you want to remove the selected layout template.
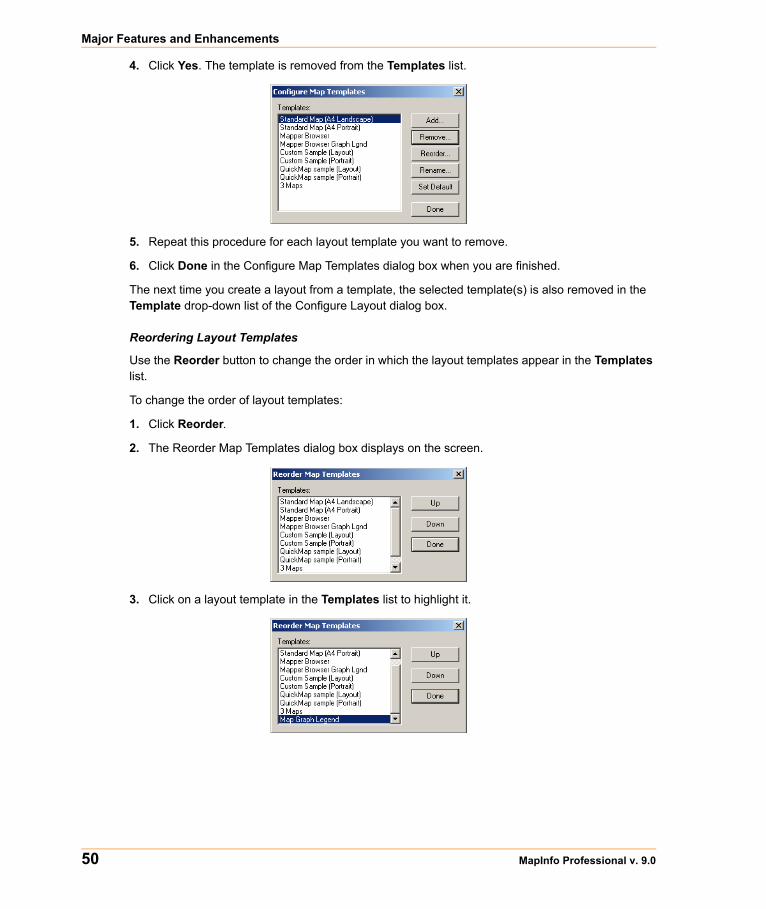
Major Features and Enhancements
50 MapInfo Professional v. 9.0
4. Click Yes. The template is removed from the Templates list.
5. Repeat this procedure for each layout template you want to remove.
6. Click Done in the Configure Map Templates dialog box when you are finished.
The next time you create a layout from a template, the selected template(s) is also removed in the Template drop-down list of the Configure Layout dialog box.
Reordering Layout Templates
Use the Reorder button to change the order in which the layout templates appear in the Templates list.
To change the order of layout templates:
1. Click Reorder.
2. The Reorder Map Templates dialog box displays on the screen.
3. Click on a layout template in the Templates list to highlight it.
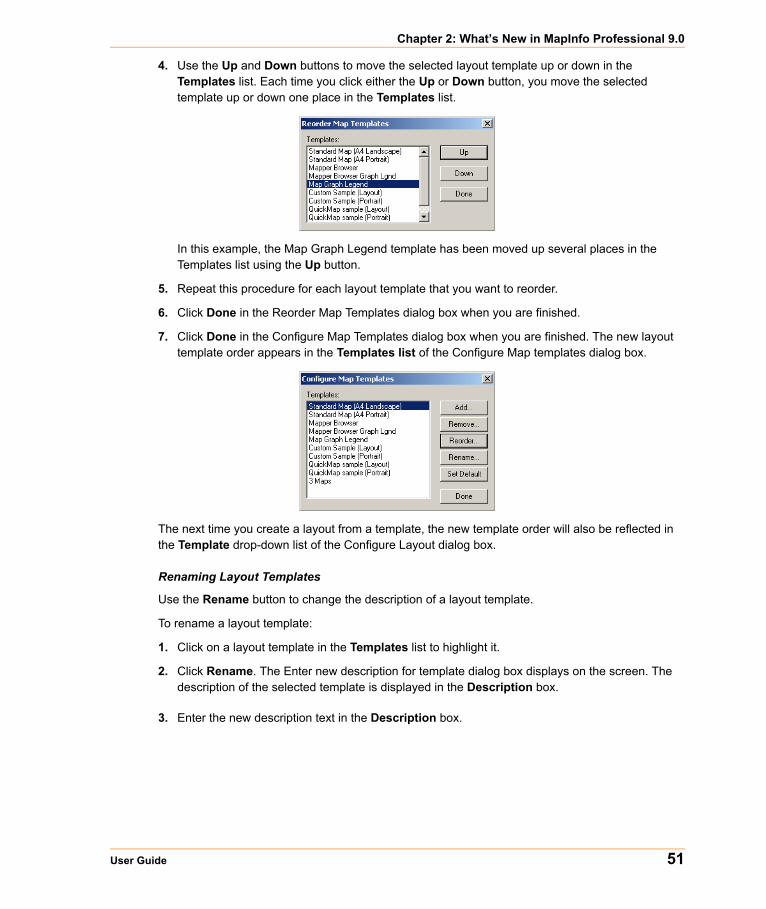
Chapter 2: What’s New in MapInfo Professional 9.0
User Guide 51
4. Use the Up and Down buttons to move the selected layout template up or down in the Templates list. Each time you click either the Up or Down button, you move the selected template up or down one place in the Templates list.
In this example, the Map Graph Legend template has been moved up several places in the Templates list using the Up button.
5. Repeat this procedure for each layout template that you want to reorder.
6. Click Done in the Reorder Map Templates dialog box when you are finished.
7. Click Done in the Configure Map Templates dialog box when you are finished. The new layout template order appears in the Templates list of the Configure Map templates dialog box.
The next time you create a layout from a template, the new template order will also be reflected in the Template drop-down list of the Configure Layout dialog box.
Renaming Layout Templates
Use the Rename button to change the description of a layout template.
To rename a layout template:
1. Click on a layout template in the Templates list to highlight it.
2. Click Rename. The Enter new description for template dialog box displays on the screen. The description of the selected template is displayed in the Description box.
3. Enter the new description text in the Description box.
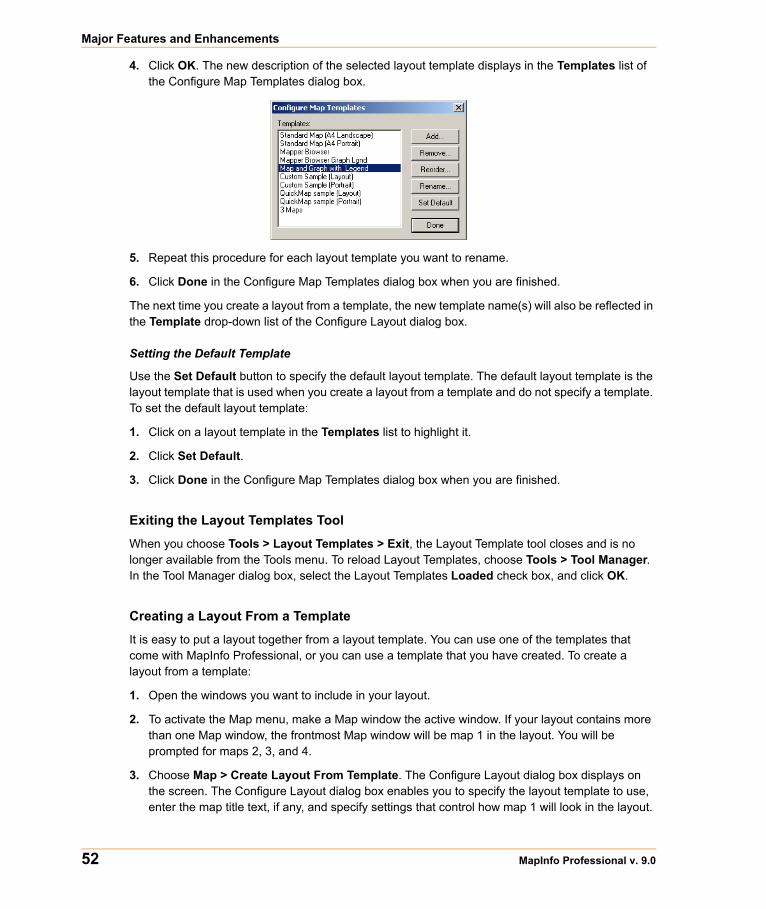
Major Features and Enhancements
52 MapInfo Professional v. 9.0
4. Click OK. The new description of the selected layout template displays in the Templates list of the Configure Map Templates dialog box.
5. Repeat this procedure for each layout template you want to rename.
6. Click Done in the Configure Map Templates dialog box when you are finished.
The next time you create a layout from a template, the new template name(s) will also be reflected in the Template drop-down list of the Configure Layout dialog box.
Setting the Default Template
Use the Set Default button to specify the default layout template. The default layout template is the layout template that is used when you create a layout from a template and do not specify a template. To set the default layout template:
1. Click on a layout template in the Templates list to highlight it.
2. Click Set Default.
3. Click Done in the Configure Map Templates dialog box when you are finished.
Exiting the Layout Templates Tool
When you choose Tools > Layout Templates > Exit, the Layout Template tool closes and is no longer available from the Tools menu. To reload Layout Templates, choose Tools > Tool Manager. In the Tool Manager dialog box, select the Layout Templates Loaded check box, and click OK.
Creating a Layout From a Template
It is easy to put a layout together from a layout template. You can use one of the templates that come with MapInfo Professional, or you can use a template that you have created. To create a layout from a template:
1. Open the windows you want to include in your layout.
2. To activate the Map menu, make a Map window the active window. If your layout contains more than one Map window, the frontmost Map window will be map 1 in the layout. You will be prompted for maps 2, 3, and 4.
3. Choose Map > Create Layout From Template. The Configure Layout dialog box displays on the screen. The Configure Layout dialog box enables you to specify the layout template to use, enter the map title text, if any, and specify settings that control how map 1 will look in the layout.
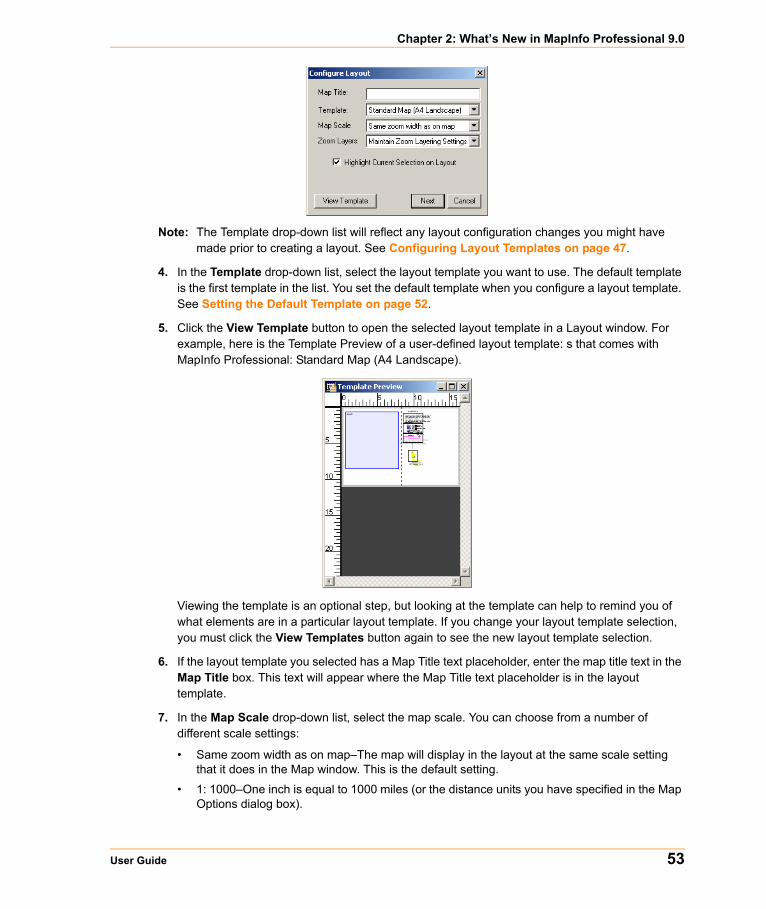
Chapter 2: What’s New in MapInfo Professional 9.0
User Guide 53
Note: The Template drop-down list will reflect any layout configuration changes you might have made prior to creating a layout. See Configuring Layout Templates on page 47.
4. In the Template drop-down list, select the layout template you want to use. The default template is the first template in the list. You set the default template when you configure a layout template. See Setting the Default Template on page 52.
5. Click the View Template button to open the selected layout template in a Layout window. For example, here is the Template Preview of a user-defined layout template: s that comes with MapInfo Professional: Standard Map (A4 Landscape).
Viewing the template is an optional step, but looking at the template can help to remind you of what elements are in a particular layout template. If you change your layout template selection, you must click the View Templates button again to see the new layout template selection.
6. If the layout template you selected has a Map Title text placeholder, enter the map title text in the Map Title box. This text will appear where the Map Title text placeholder is in the layout template.
7. In the Map Scale drop-down list, select the map scale. You can choose from a number of different scale settings:
• Same zoom width as on map–The map will display in the layout at the same scale setting that it does in the Map window. This is the default setting.
• 1: 1000–One inch is equal to 1000 miles (or the distance units you have specified in the Map Options dialog box).
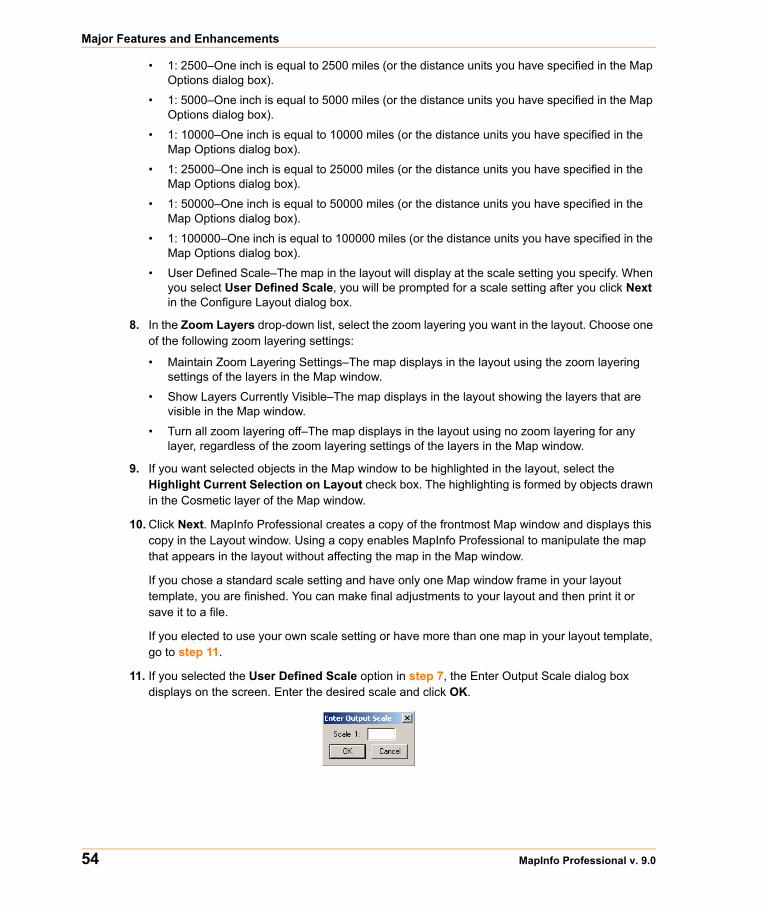
Major Features and Enhancements
54 MapInfo Professional v. 9.0
• 1: 2500–One inch is equal to 2500 miles (or the distance units you have specified in the Map Options dialog box).
• 1: 5000–One inch is equal to 5000 miles (or the distance units you have specified in the Map Options dialog box).
• 1: 10000–One inch is equal to 10000 miles (or the distance units you have specified in the Map Options dialog box).
• 1: 25000–One inch is equal to 25000 miles (or the distance units you have specified in the Map Options dialog box).
• 1: 50000–One inch is equal to 50000 miles (or the distance units you have specified in the Map Options dialog box).
• 1: 100000–One inch is equal to 100000 miles (or the distance units you have specified in the Map Options dialog box).
• User Defined Scale–The map in the layout will display at the scale setting you specify. When you select User Defined Scale, you will be prompted for a scale setting after you click Next in the Configure Layout dialog box.
8. In the Zoom Layers drop-down list, select the zoom layering you want in the layout. Choose one of the following zoom layering settings:
• Maintain Zoom Layering Settings–The map displays in the layout using the zoom layering settings of the layers in the Map window.
• Show Layers Currently Visible–The map displays in the layout showing the layers that are visible in the Map window.
• Turn all zoom layering off–The map displays in the layout using no zoom layering for any layer, regardless of the zoom layering settings of the layers in the Map window.
9. If you want selected objects in the Map window to be highlighted in the layout, select the Highlight Current Selection on Layout check box. The highlighting is formed by objects drawn in the Cosmetic layer of the Map window.
10. Click Next. MapInfo Professional creates a copy of the frontmost Map window and displays this copy in the Layout window. Using a copy enables MapInfo Professional to manipulate the map that appears in the layout without affecting the map in the Map window.
If you chose a standard scale setting and have only one Map window frame in your layout template, you are finished. You can make final adjustments to your layout and then print it or save it to a file.
If you elected to use your own scale setting or have more than one map in your layout template, go to step 11.
11. If you selected the User Defined Scale option in step 7, the Enter Output Scale dialog box displays on the screen. Enter the desired scale and click OK.
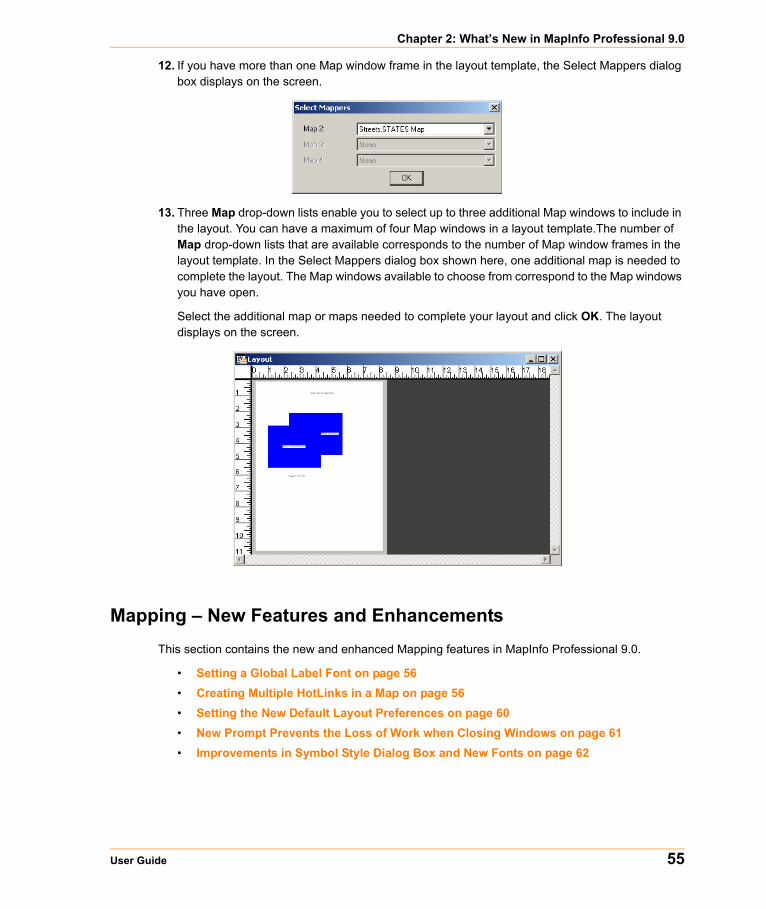
Chapter 2: What’s New in MapInfo Professional 9.0
User Guide 55
12. If you have more than one Map window frame in the layout template, the Select Mappers dialog box displays on the screen.
13. Three Map drop-down lists enable you to select up to three additional Map windows to include in the layout. You can have a maximum of four Map windows in a layout template.The number of Map drop-down lists that are available corresponds to the number of Map window frames in the layout template. In the Select Mappers dialog box shown here, one additional map is needed to complete the layout. The Map windows available to choose from correspond to the Map windows you have open.
Select the additional map or maps needed to complete your layout and click OK. The layout displays on the screen.
Mapping – New Features and EnhancementsThis section contains the new and enhanced Mapping features in MapInfo Professional 9.0.
• Setting a Global Label Font on page 56• Creating Multiple HotLinks in a Map on page 56• Setting the New Default Layout Preferences on page 60• New Prompt Prevents the Loss of Work when Closing Windows on page 61• Improvements in Symbol Style Dialog Box and New Fonts on page 62
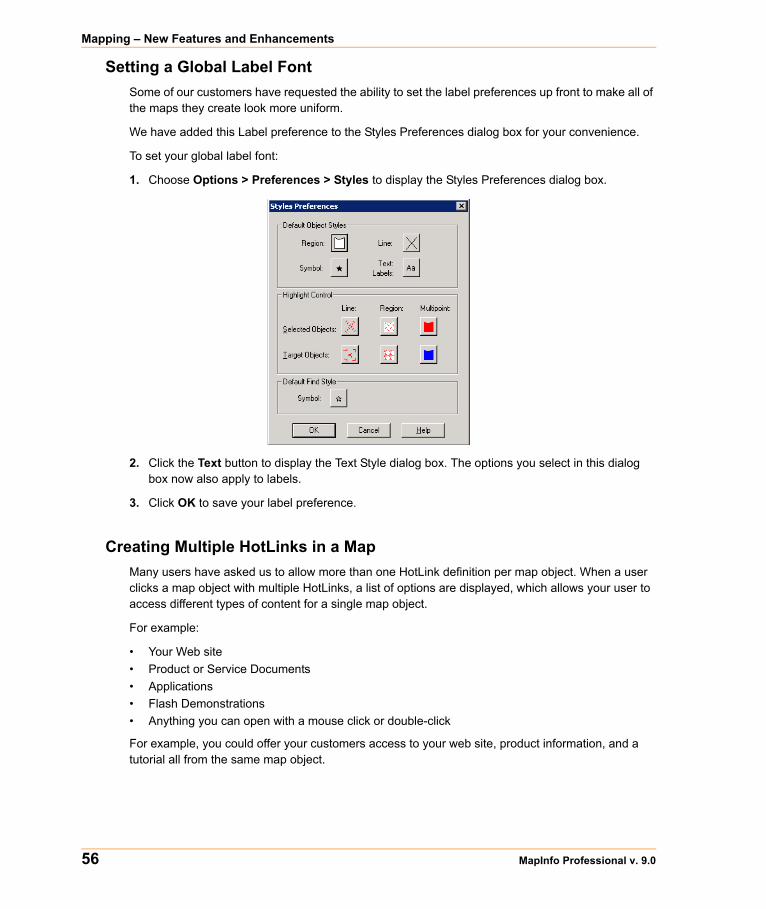
Mapping – New Features and Enhancements
56 MapInfo Professional v. 9.0
Setting a Global Label Font Some of our customers have requested the ability to set the label preferences up front to make all of the maps they create look more uniform.
We have added this Label preference to the Styles Preferences dialog box for your convenience.
To set your global label font:
1. Choose Options > Preferences > Styles to display the Styles Preferences dialog box.
2. Click the Text button to display the Text Style dialog box. The options you select in this dialog box now also apply to labels.
3. Click OK to save your label preference.
Creating Multiple HotLinks in a MapMany users have asked us to allow more than one HotLink definition per map object. When a user clicks a map object with multiple HotLinks, a list of options are displayed, which allows your user to access different types of content for a single map object.
For example:
• Your Web site• Product or Service Documents• Applications• Flash Demonstrations• Anything you can open with a mouse click or double-click
For example, you could offer your customers access to your web site, product information, and a tutorial all from the same map object.
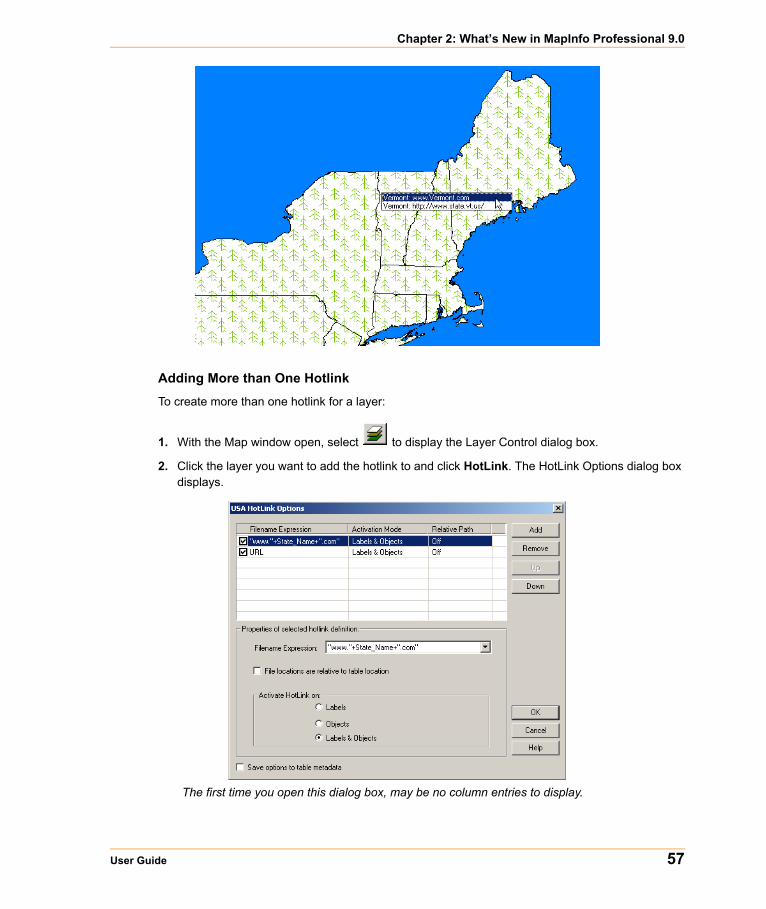
Chapter 2: What’s New in MapInfo Professional 9.0
User Guide 57
Adding More than One Hotlink
To create more than one hotlink for a layer:
1. With the Map window open, select to display the Layer Control dialog box.
2. Click the layer you want to add the hotlink to and click HotLink. The HotLink Options dialog box displays.
The first time you open this dialog box, may be no column entries to display.
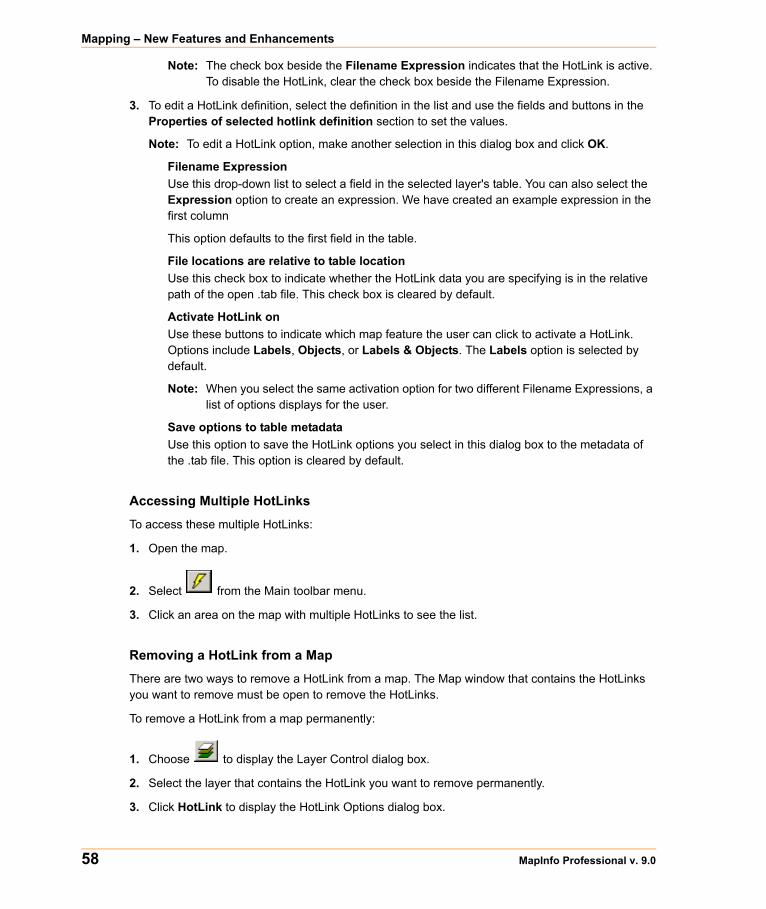
Mapping – New Features and Enhancements
58 MapInfo Professional v. 9.0
Note: The check box beside the Filename Expression indicates that the HotLink is active. To disable the HotLink, clear the check box beside the Filename Expression.
3. To edit a HotLink definition, select the definition in the list and use the fields and buttons in the Properties of selected hotlink definition section to set the values.
Note: To edit a HotLink option, make another selection in this dialog box and click OK.
Filename ExpressionUse this drop-down list to select a field in the selected layer's table. You can also select the Expression option to create an expression. We have created an example expression in the first column
This option defaults to the first field in the table.
File locations are relative to table locationUse this check box to indicate whether the HotLink data you are specifying is in the relative path of the open .tab file. This check box is cleared by default.
Activate HotLink onUse these buttons to indicate which map feature the user can click to activate a HotLink. Options include Labels, Objects, or Labels & Objects. The Labels option is selected by default.
Note: When you select the same activation option for two different Filename Expressions, a list of options displays for the user.
Save options to table metadataUse this option to save the HotLink options you select in this dialog box to the metadata of the .tab file. This option is cleared by default.
Accessing Multiple HotLinks
To access these multiple HotLinks:
1. Open the map.
2. Select from the Main toolbar menu.
3. Click an area on the map with multiple HotLinks to see the list.
Removing a HotLink from a Map
There are two ways to remove a HotLink from a map. The Map window that contains the HotLinks you want to remove must be open to remove the HotLinks.
To remove a HotLink from a map permanently:
1. Choose to display the Layer Control dialog box.
2. Select the layer that contains the HotLink you want to remove permanently.
3. Click HotLink to display the HotLink Options dialog box.
Chapter 2: What’s New in MapInfo Professional 9.0
User Guide 59
4. Highlight the HotLink you want to remove.
5. Click Remove. There is no confirmation prompt for this action.
6. Click OK to save this change.
To disable a HotLink temporarily:
1. Follow step 1through step 3 in the previous instructions to display the HotLink Options dialog box.
2. Clear the check box beside the Filename Expression column of the HotLink you want to disable.
3. Click OK to save this change.
Changing the Display Order of HotLinks in a List
If you have multiple HotLinks for a particular map feature, you may want to prioritize the order in which the HotLinks display.
To reorder the list of HotLink entries for a particular layer:
1. Choose to display the Layer Control dialog box.
2. Select the layer that contains the HotLink you want to remove permanently.
3. Click HotLink to display the HotLink Options dialog box.
4. Highlight the HotLink you want to move and use the Up and Down buttons to position the HotLink in the proper order.
5. Click OK to save this change.
Multiple HotLink Notes
The following multiple HotLink behavior may not be obvious:
• If a HotLink definition has a Filename Expression value of none (that is, it is an empty string) the Hotlink Options dialog box displays the Filename Expression as <undefined>.
• When you hover the cursor over a map feature that contains a HotLink, MapInfo Professional displays a message in the Status bar describing the content of the HotLink. When there is more than one HotLink for that map feature or the activation attributes overlap, the phrase, Multiple active objects under cursor is displayed in the Status bar.
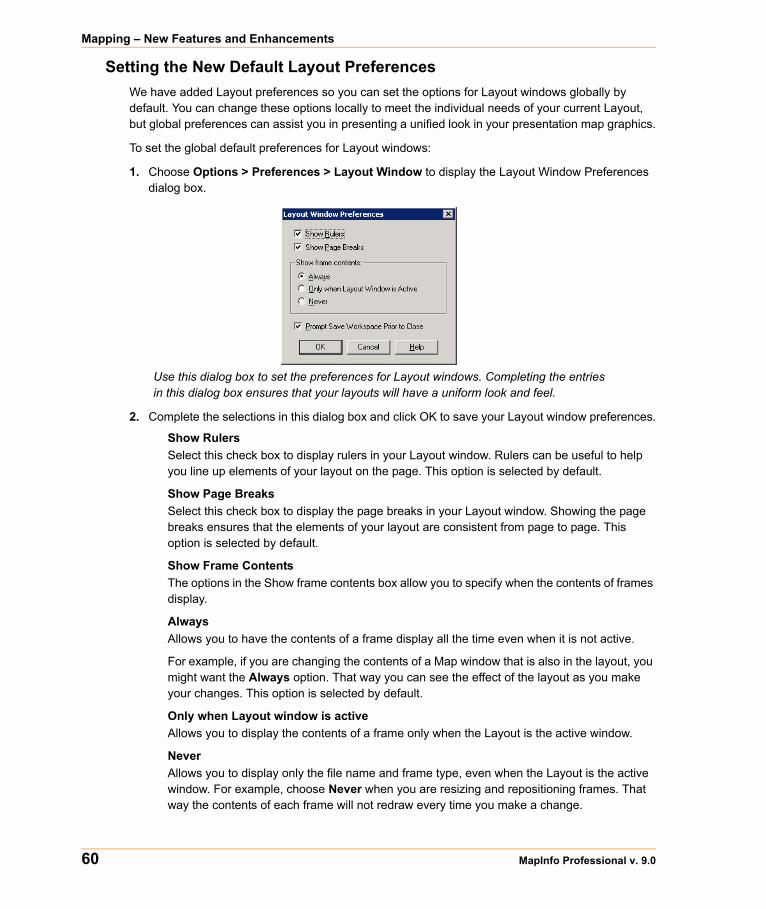
Mapping – New Features and Enhancements
60 MapInfo Professional v. 9.0
Setting the New Default Layout Preferences We have added Layout preferences so you can set the options for Layout windows globally by default. You can change these options locally to meet the individual needs of your current Layout, but global preferences can assist you in presenting a unified look in your presentation map graphics.
To set the global default preferences for Layout windows:
1. Choose Options > Preferences > Layout Window to display the Layout Window Preferences dialog box.
Use this dialog box to set the preferences for Layout windows. Completing the entries in this dialog box ensures that your layouts will have a uniform look and feel.
2. Complete the selections in this dialog box and click OK to save your Layout window preferences.
Show RulersSelect this check box to display rulers in your Layout window. Rulers can be useful to help you line up elements of your layout on the page. This option is selected by default.
Show Page BreaksSelect this check box to display the page breaks in your Layout window. Showing the page breaks ensures that the elements of your layout are consistent from page to page. This option is selected by default.
Show Frame ContentsThe options in the Show frame contents box allow you to specify when the contents of frames display.
AlwaysAllows you to have the contents of a frame display all the time even when it is not active.
For example, if you are changing the contents of a Map window that is also in the layout, you might want the Always option. That way you can see the effect of the layout as you make your changes. This option is selected by default.
Only when Layout window is activeAllows you to display the contents of a frame only when the Layout is the active window.
NeverAllows you to display only the file name and frame type, even when the Layout is the active window. For example, choose Never when you are resizing and repositioning frames. That way the contents of each frame will not redraw every time you make a change.
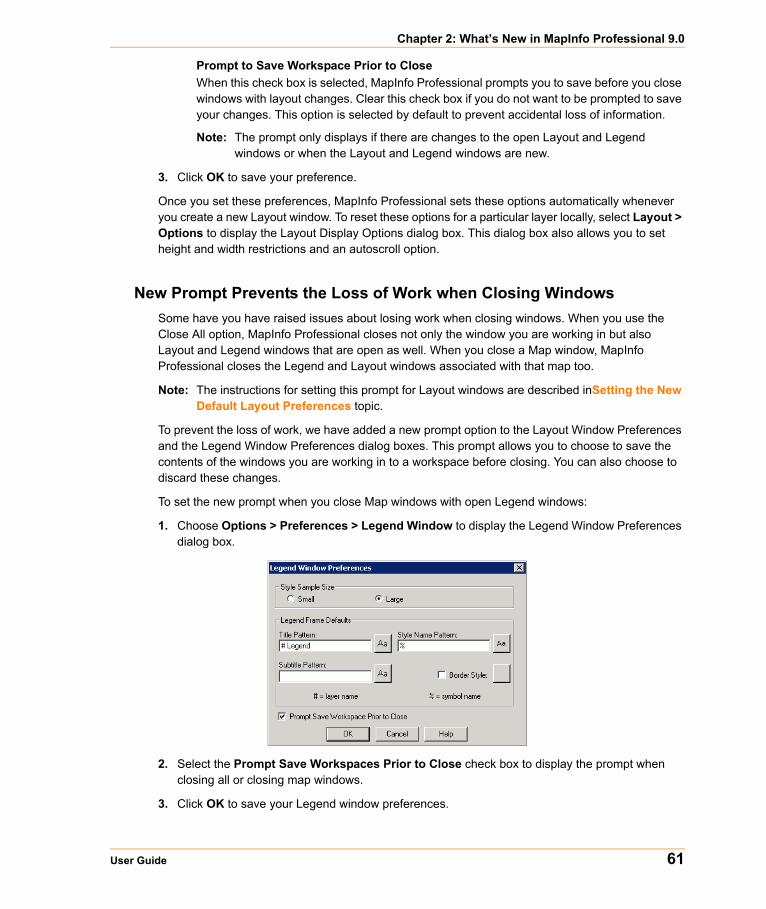
Chapter 2: What’s New in MapInfo Professional 9.0
User Guide 61
Prompt to Save Workspace Prior to CloseWhen this check box is selected, MapInfo Professional prompts you to save before you close windows with layout changes. Clear this check box if you do not want to be prompted to save your changes. This option is selected by default to prevent accidental loss of information.
Note: The prompt only displays if there are changes to the open Layout and Legend windows or when the Layout and Legend windows are new.
3. Click OK to save your preference.
Once you set these preferences, MapInfo Professional sets these options automatically whenever you create a new Layout window. To reset these options for a particular layer locally, select Layout > Options to display the Layout Display Options dialog box. This dialog box also allows you to set height and width restrictions and an autoscroll option.
New Prompt Prevents the Loss of Work when Closing WindowsSome have you have raised issues about losing work when closing windows. When you use the Close All option, MapInfo Professional closes not only the window you are working in but also Layout and Legend windows that are open as well. When you close a Map window, MapInfo Professional closes the Legend and Layout windows associated with that map too.
Note: The instructions for setting this prompt for Layout windows are described inSetting the New Default Layout Preferences topic.
To prevent the loss of work, we have added a new prompt option to the Layout Window Preferences and the Legend Window Preferences dialog boxes. This prompt allows you to choose to save the contents of the windows you are working in to a workspace before closing. You can also choose to discard these changes.
To set the new prompt when you close Map windows with open Legend windows:
1. Choose Options > Preferences > Legend Window to display the Legend Window Preferences dialog box.
2. Select the Prompt Save Workspaces Prior to Close check box to display the prompt when closing all or closing map windows.
3. Click OK to save your Legend window preferences.
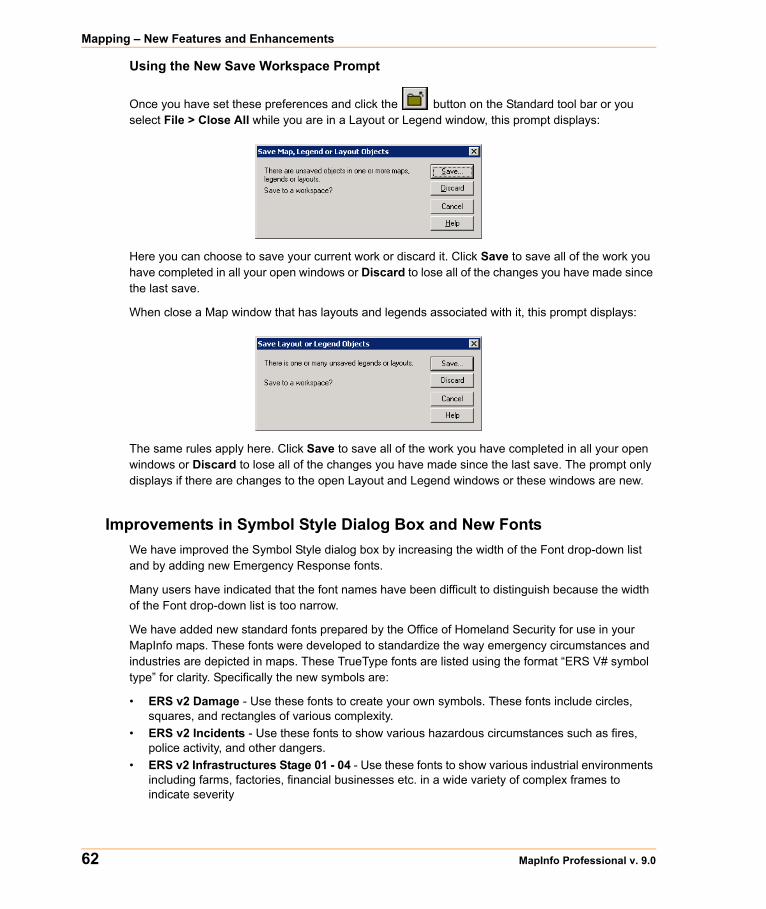
Mapping – New Features and Enhancements
62 MapInfo Professional v. 9.0
Using the New Save Workspace Prompt
Once you have set these preferences and click the button on the Standard tool bar or you select File > Close All while you are in a Layout or Legend window, this prompt displays:
Here you can choose to save your current work or discard it. Click Save to save all of the work you have completed in all your open windows or Discard to lose all of the changes you have made since the last save.
When close a Map window that has layouts and legends associated with it, this prompt displays:
The same rules apply here. Click Save to save all of the work you have completed in all your open windows or Discard to lose all of the changes you have made since the last save. The prompt only displays if there are changes to the open Layout and Legend windows or these windows are new.
Improvements in Symbol Style Dialog Box and New FontsWe have improved the Symbol Style dialog box by increasing the width of the Font drop-down list and by adding new Emergency Response fonts.
Many users have indicated that the font names have been difficult to distinguish because the width of the Font drop-down list is too narrow.
We have added new standard fonts prepared by the Office of Homeland Security for use in your MapInfo maps. These fonts were developed to standardize the way emergency circumstances and industries are depicted in maps. These TrueType fonts are listed using the format “ERS V# symbol type” for clarity. Specifically the new symbols are:
• ERS v2 Damage - Use these fonts to create your own symbols. These fonts include circles, squares, and rectangles of various complexity.
• ERS v2 Incidents - Use these fonts to show various hazardous circumstances such as fires, police activity, and other dangers.
• ERS v2 Infrastructures Stage 01 - 04 - Use these fonts to show various industrial environments including farms, factories, financial businesses etc. in a wide variety of complex frames to indicate severity
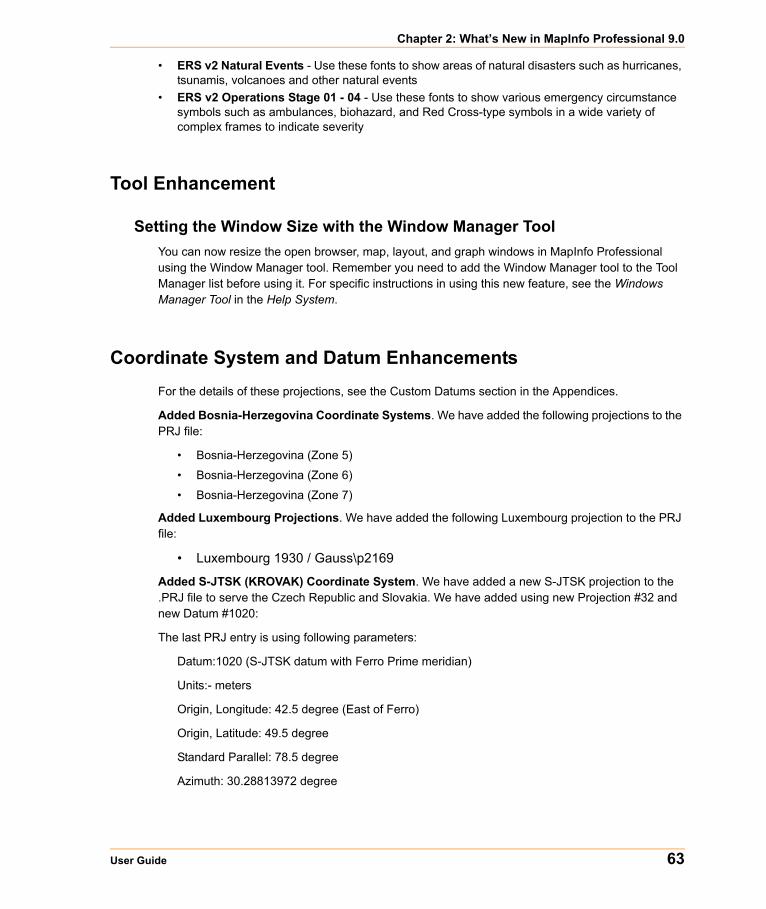
Chapter 2: What’s New in MapInfo Professional 9.0
User Guide 63
• ERS v2 Natural Events - Use these fonts to show areas of natural disasters such as hurricanes, tsunamis, volcanoes and other natural events
• ERS v2 Operations Stage 01 - 04 - Use these fonts to show various emergency circumstance symbols such as ambulances, biohazard, and Red Cross-type symbols in a wide variety of complex frames to indicate severity
Tool Enhancement
Setting the Window Size with the Window Manager ToolYou can now resize the open browser, map, layout, and graph windows in MapInfo Professional using the Window Manager tool. Remember you need to add the Window Manager tool to the Tool Manager list before using it. For specific instructions in using this new feature, see the Windows Manager Tool in the Help System.
Coordinate System and Datum EnhancementsFor the details of these projections, see the Custom Datums section in the Appendices.
Added Bosnia-Herzegovina Coordinate Systems. We have added the following projections to the PRJ file:
• Bosnia-Herzegovina (Zone 5)
• Bosnia-Herzegovina (Zone 6)
• Bosnia-Herzegovina (Zone 7)
Added Luxembourg Projections. We have added the following Luxembourg projection to the PRJ file:
• Luxembourg 1930 / Gauss\p2169
Added S-JTSK (KROVAK) Coordinate System. We have added a new S-JTSK projection to the .PRJ file to serve the Czech Republic and Slovakia. We have added using new Projection #32 and new Datum #1020:
The last PRJ entry is using following parameters:
Datum:1020 (S-JTSK datum with Ferro Prime meridian)
Units:- meters
Origin, Longitude: 42.5 degree (East of Ferro)
Origin, Latitude: 49.5 degree
Standard Parallel: 78.5 degree
Azimuth: 30.28813972 degree
Coordinate System and Datum Enhancements
64 MapInfo Professional v. 9.0
Added Swedish Coordinate System. We have added the following projection to the PRJ file.
• ST 74
Updated EPSG Aliases for Swedish Coordinate Systems. We have added two new EPSG aliases for Swedish coordinate systems to the PRJ file to maintain consistency with the latest update to MapXtreme:
• EPSG:2326
• EPSG:3152
Updated Hong Kong EPSG Code. We have added the following EPSG code entry to the PRJ file:
• Hong Kong 1980 Grid System\p2326
Updated Australian Victorian Coordinate SystemWe have added the following Australian bounded projections to the PRJ file:
• VIC VicGrid66 (AGD 66)
• VIC VicGrid94 (GDA 94)
• VIC AMG Zone 54 (AGD 66)
• VIC AMG Zone 55 (AGD 66)
• VIC MGA Zone 54 (GDA 94)
• VIC MGA Zone 55 (GDA 94)
• VIC Longitude/Latitude (AGD 66)
• VIC Longitude/Latitude (GDA 94)
Updated Danish Coordinate System EntriesWe have added the following Danish projections to the PRJ file
• UTM Zone 32 Euref89\p25832
• UTM Zone 33 Euref89\p25833
• UTM Zone 32 (ED 50)\p23032
• UTM Zone 33 (ED 50)\p23033
• System 34 Jylland-Fyn\p34003
• System 34 Sjaelland\p34005
• System 45 Bornholm\p45001
• KP2000 Jylland-Fyn\p18401
• KP2000 Sjaelland\p18402
• KP2000 Bornholm\p18403
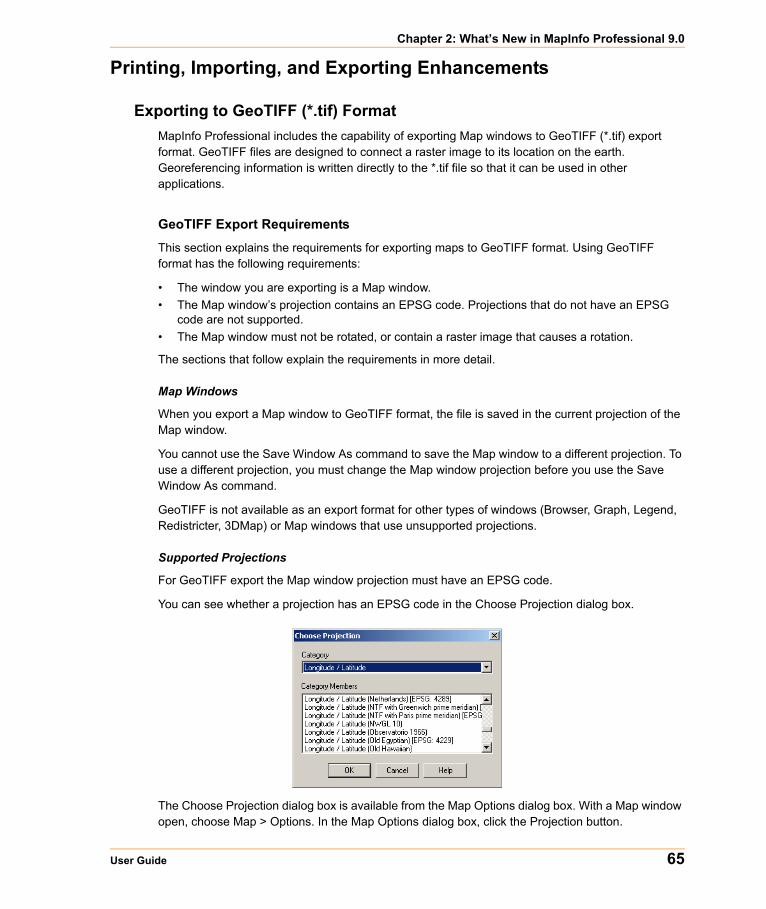
Chapter 2: What’s New in MapInfo Professional 9.0
User Guide 65
Printing, Importing, and Exporting Enhancements
Exporting to GeoTIFF (*.tif) Format MapInfo Professional includes the capability of exporting Map windows to GeoTIFF (*.tif) export format. GeoTIFF files are designed to connect a raster image to its location on the earth. Georeferencing information is written directly to the *.tif file so that it can be used in other applications.
GeoTIFF Export Requirements
This section explains the requirements for exporting maps to GeoTIFF format. Using GeoTIFF format has the following requirements:
• The window you are exporting is a Map window.• The Map window’s projection contains an EPSG code. Projections that do not have an EPSG
code are not supported.• The Map window must not be rotated, or contain a raster image that causes a rotation.
The sections that follow explain the requirements in more detail.
Map Windows
When you export a Map window to GeoTIFF format, the file is saved in the current projection of the Map window.
You cannot use the Save Window As command to save the Map window to a different projection. To use a different projection, you must change the Map window projection before you use the Save Window As command.
GeoTIFF is not available as an export format for other types of windows (Browser, Graph, Legend, Redistricter, 3DMap) or Map windows that use unsupported projections.
Supported Projections
For GeoTIFF export the Map window projection must have an EPSG code.
You can see whether a projection has an EPSG code in the Choose Projection dialog box.
The Choose Projection dialog box is available from the Map Options dialog box. With a Map window open, choose Map > Options. In the Map Options dialog box, click the Projection button.
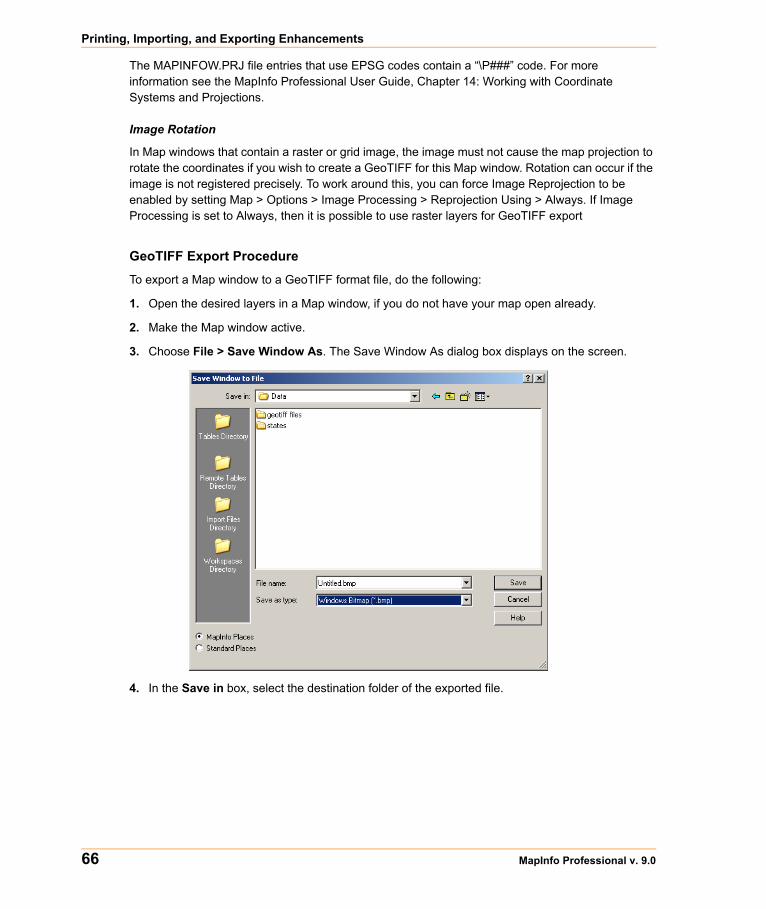
Printing, Importing, and Exporting Enhancements
66 MapInfo Professional v. 9.0
The MAPINFOW.PRJ file entries that use EPSG codes contain a “\P###” code. For more information see the MapInfo Professional User Guide, Chapter 14: Working with Coordinate Systems and Projections.
Image Rotation
In Map windows that contain a raster or grid image, the image must not cause the map projection to rotate the coordinates if you wish to create a GeoTIFF for this Map window. Rotation can occur if the image is not registered precisely. To work around this, you can force Image Reprojection to be enabled by setting Map > Options > Image Processing > Reprojection Using > Always. If Image Processing is set to Always, then it is possible to use raster layers for GeoTIFF export
GeoTIFF Export Procedure
To export a Map window to a GeoTIFF format file, do the following:
1. Open the desired layers in a Map window, if you do not have your map open already.
2. Make the Map window active.
3. Choose File > Save Window As. The Save Window As dialog box displays on the screen.
4. In the Save in box, select the destination folder of the exported file.
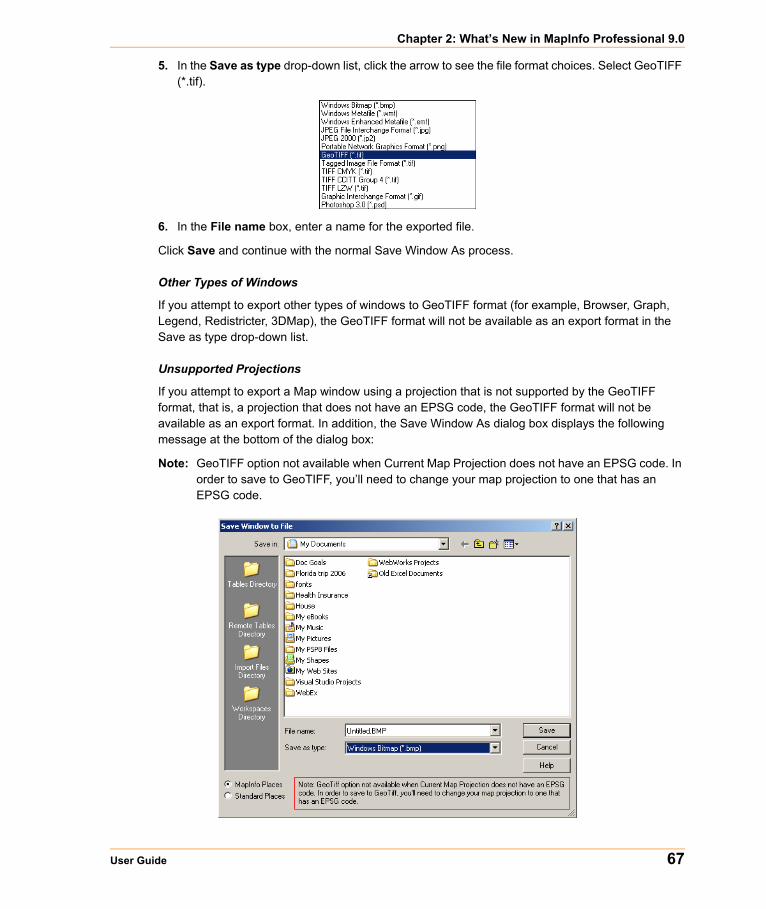
Chapter 2: What’s New in MapInfo Professional 9.0
User Guide 67
5. In the Save as type drop-down list, click the arrow to see the file format choices. Select GeoTIFF (*.tif).
6. In the File name box, enter a name for the exported file.
Click Save and continue with the normal Save Window As process.
Other Types of Windows
If you attempt to export other types of windows to GeoTIFF format (for example, Browser, Graph, Legend, Redistricter, 3DMap), the GeoTIFF format will not be available as an export format in the Save as type drop-down list.
Unsupported Projections
If you attempt to export a Map window using a projection that is not supported by the GeoTIFF format, that is, a projection that does not have an EPSG code, the GeoTIFF format will not be available as an export format. In addition, the Save Window As dialog box displays the following message at the bottom of the dialog box:
Note: GeoTIFF option not available when Current Map Projection does not have an EPSG code. In order to save to GeoTIFF, you’ll need to change your map projection to one that has an EPSG code.
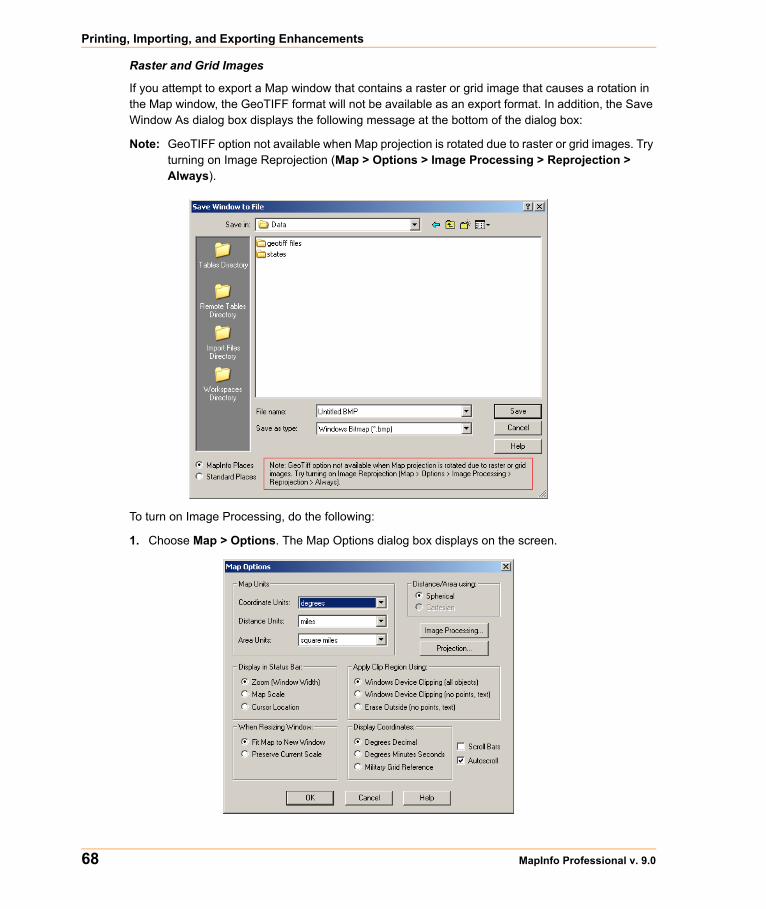
Printing, Importing, and Exporting Enhancements
68 MapInfo Professional v. 9.0
Raster and Grid Images
If you attempt to export a Map window that contains a raster or grid image that causes a rotation in the Map window, the GeoTIFF format will not be available as an export format. In addition, the Save Window As dialog box displays the following message at the bottom of the dialog box:
Note: GeoTIFF option not available when Map projection is rotated due to raster or grid images. Try turning on Image Reprojection (Map > Options > Image Processing > Reprojection > Always).
To turn on Image Processing, do the following:
1. Choose Map > Options. The Map Options dialog box displays on the screen.
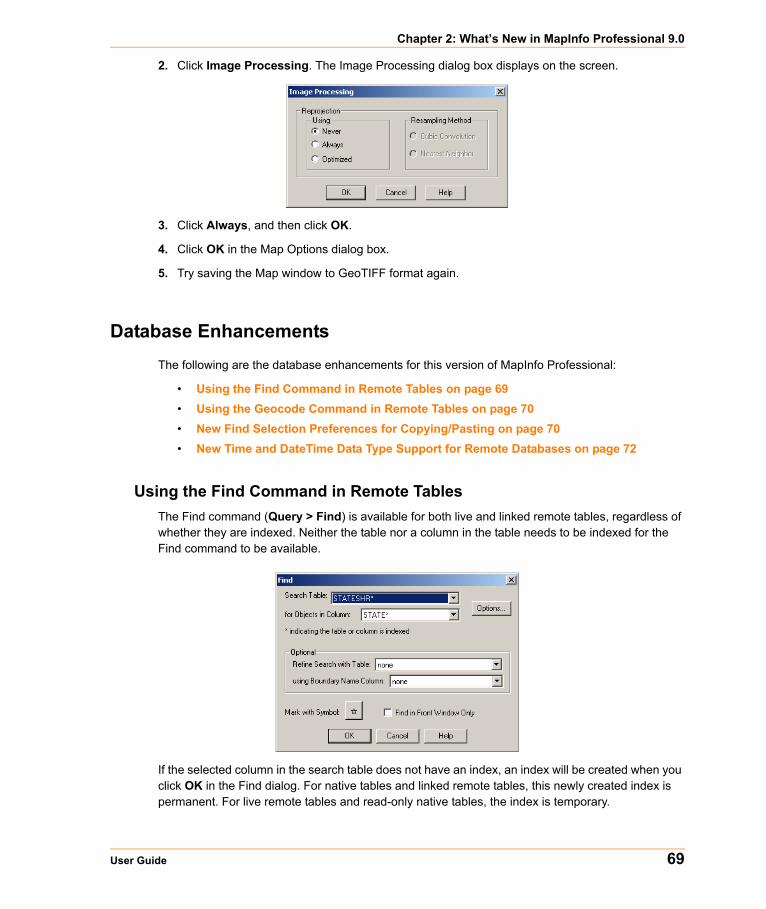
Chapter 2: What’s New in MapInfo Professional 9.0
User Guide 69
2. Click Image Processing. The Image Processing dialog box displays on the screen.
3. Click Always, and then click OK.
4. Click OK in the Map Options dialog box.
5. Try saving the Map window to GeoTIFF format again.
Database EnhancementsThe following are the database enhancements for this version of MapInfo Professional:
• Using the Find Command in Remote Tables on page 69• Using the Geocode Command in Remote Tables on page 70• New Find Selection Preferences for Copying/Pasting on page 70• New Time and DateTime Data Type Support for Remote Databases on page 72
Using the Find Command in Remote TablesThe Find command (Query > Find) is available for both live and linked remote tables, regardless of whether they are indexed. Neither the table nor a column in the table needs to be indexed for the Find command to be available.
If the selected column in the search table does not have an index, an index will be created when you click OK in the Find dialog. For native tables and linked remote tables, this newly created index is permanent. For live remote tables and read-only native tables, the index is temporary.
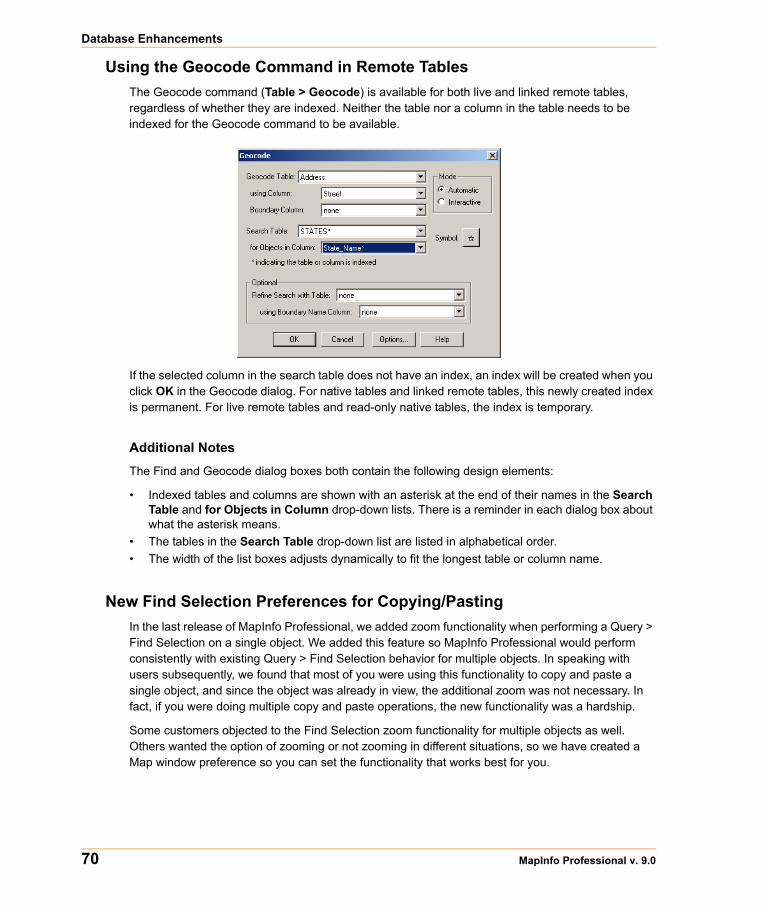
Database Enhancements
70 MapInfo Professional v. 9.0
Using the Geocode Command in Remote TablesThe Geocode command (Table > Geocode) is available for both live and linked remote tables, regardless of whether they are indexed. Neither the table nor a column in the table needs to be indexed for the Geocode command to be available.
If the selected column in the search table does not have an index, an index will be created when you click OK in the Geocode dialog. For native tables and linked remote tables, this newly created index is permanent. For live remote tables and read-only native tables, the index is temporary.
Additional Notes
The Find and Geocode dialog boxes both contain the following design elements:
• Indexed tables and columns are shown with an asterisk at the end of their names in the Search Table and for Objects in Column drop-down lists. There is a reminder in each dialog box about what the asterisk means.
• The tables in the Search Table drop-down list are listed in alphabetical order. • The width of the list boxes adjusts dynamically to fit the longest table or column name.
New Find Selection Preferences for Copying/PastingIn the last release of MapInfo Professional, we added zoom functionality when performing a Query > Find Selection on a single object. We added this feature so MapInfo Professional would perform consistently with existing Query > Find Selection behavior for multiple objects. In speaking with users subsequently, we found that most of you were using this functionality to copy and paste a single object, and since the object was already in view, the additional zoom was not necessary. In fact, if you were doing multiple copy and paste operations, the new functionality was a hardship.
Some customers objected to the Find Selection zoom functionality for multiple objects as well. Others wanted the option of zooming or not zooming in different situations, so we have created a Map window preference so you can set the functionality that works best for you.
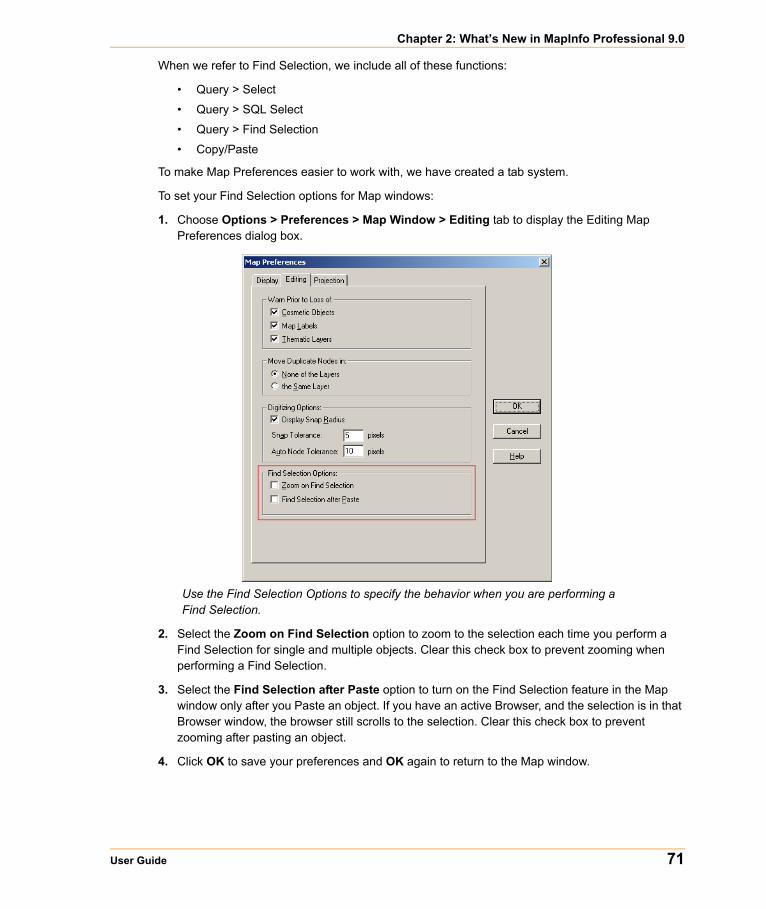
Chapter 2: What’s New in MapInfo Professional 9.0
User Guide 71
When we refer to Find Selection, we include all of these functions:
• Query > Select
• Query > SQL Select
• Query > Find Selection
• Copy/Paste
To make Map Preferences easier to work with, we have created a tab system.
To set your Find Selection options for Map windows:
1. Choose Options > Preferences > Map Window > Editing tab to display the Editing Map Preferences dialog box.
Use the Find Selection Options to specify the behavior when you are performing a Find Selection.
2. Select the Zoom on Find Selection option to zoom to the selection each time you perform a Find Selection for single and multiple objects. Clear this check box to prevent zooming when performing a Find Selection.
3. Select the Find Selection after Paste option to turn on the Find Selection feature in the Map window only after you Paste an object. If you have an active Browser, and the selection is in that Browser window, the browser still scrolls to the selection. Clear this check box to prevent zooming after pasting an object.
4. Click OK to save your preferences and OK again to return to the Map window.
Database Enhancements
72 MapInfo Professional v. 9.0
New Time and DateTime Data Type Support for Remote DatabasesThe new Time and DateTime data types (see Using Date- and Time-Based Data in Maps and Queries on page 23) address a long time issue with many remote databases. Because MapInfo Professional only had a date data type, and most remote databases and servers have Date and DateTime data types, data read from servers would often be truncated or lost in the process.
With the addition of these new Time and DateTime data types, the server DATE, TIME, and DATETIME/TIMESTAMP match up with the MI Date, MI Time, and MI DateTime more closely. If you create a new table with DateTime or Time data in it, the .tab file (both live and linked) you create is marked as version 900 file.
To preserve backward compatibility, when you open an existing live .tab file (linked .tab files are really native tables with a local table definition), the behavior depends on the version of the .tab file. If the tab file is marked as version 900 or later, MapInfo Professional treats the server DATE as MI Date, the server DATETIME or TIMESTAMP as MI DateTime, and server TIME (if any) as MI Time. If the version number is earlier than 900, MapInfo Professional matches the behavior of previous releases, that is, the server DATE and DATETIME or TIMESTAMP values are converted to MI Date and server TIME to MI Char. In addition the Informix DATETIME type is opened as MI Date but is marked read-only. This is true of live tables only because linked tables have already been defined.
Handling Time and DateTime Data From Remote Databases
When you download Date, Time, and DateTime data type information to MapInfo Professional, this is the results you can expect:
*Backward compatibility depends upon the .tab file version as described above.
**If you use ODBC, the Oracle DATE type is returned as TIMESTAMP. The driver issue causes an inconsistency with OCI.
When you commit table data from MapInfo Professional to these remote database servers, MapInfo Professional updates the server table with the value that the user provides in the browser. MapInfo Professional may apply some restrictions during the input time.
MapInfo Professional
Data Type From InformixFrom Oracle
(OCI)From MS Access
From MS SQL Server
DATE DATE DATE**
TIME DATETIME HOUR TO SECOND
DATETIME DATETIME YEAR TO FRACTION
TIMESTAMP* DATETIME* DATETIME*
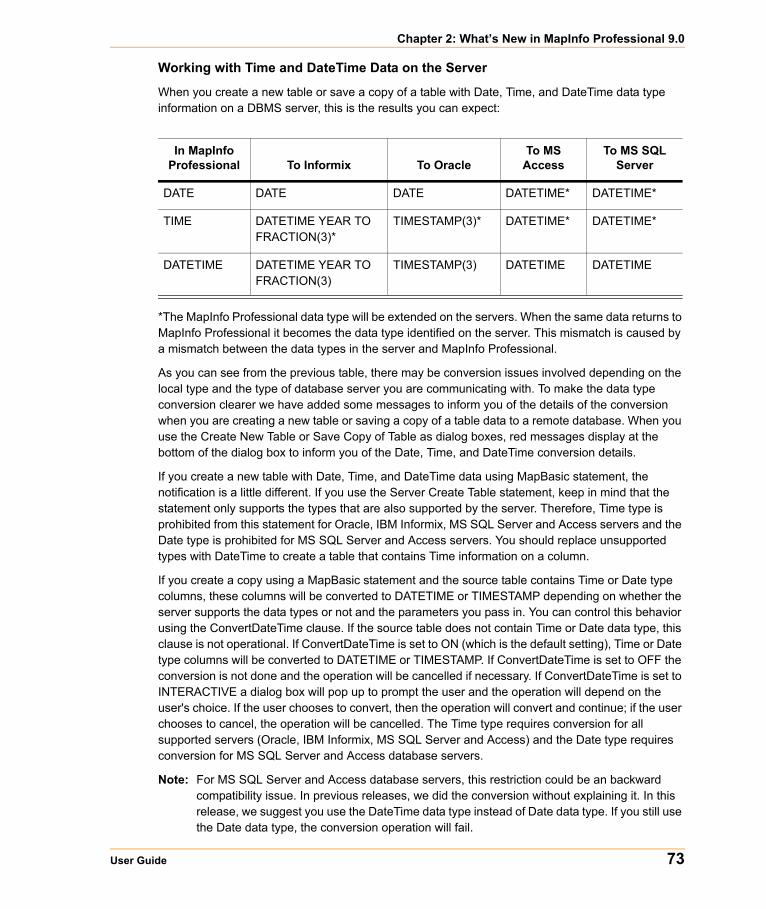
Chapter 2: What’s New in MapInfo Professional 9.0
User Guide 73
Working with Time and DateTime Data on the Server
When you create a new table or save a copy of a table with Date, Time, and DateTime data type information on a DBMS server, this is the results you can expect:
*The MapInfo Professional data type will be extended on the servers. When the same data returns to MapInfo Professional it becomes the data type identified on the server. This mismatch is caused by a mismatch between the data types in the server and MapInfo Professional.
As you can see from the previous table, there may be conversion issues involved depending on the local type and the type of database server you are communicating with. To make the data type conversion clearer we have added some messages to inform you of the details of the conversion when you are creating a new table or saving a copy of a table data to a remote database. When you use the Create New Table or Save Copy of Table as dialog boxes, red messages display at the bottom of the dialog box to inform you of the Date, Time, and DateTime conversion details.
If you create a new table with Date, Time, and DateTime data using MapBasic statement, the notification is a little different. If you use the Server Create Table statement, keep in mind that the statement only supports the types that are also supported by the server. Therefore, Time type is prohibited from this statement for Oracle, IBM Informix, MS SQL Server and Access servers and the Date type is prohibited for MS SQL Server and Access servers. You should replace unsupported types with DateTime to create a table that contains Time information on a column.
If you create a copy using a MapBasic statement and the source table contains Time or Date type columns, these columns will be converted to DATETIME or TIMESTAMP depending on whether the server supports the data types or not and the parameters you pass in. You can control this behavior using the ConvertDateTime clause. If the source table does not contain Time or Date data type, this clause is not operational. If ConvertDateTime is set to ON (which is the default setting), Time or Date type columns will be converted to DATETIME or TIMESTAMP. If ConvertDateTime is set to OFF the conversion is not done and the operation will be cancelled if necessary. If ConvertDateTime is set to INTERACTIVE a dialog box will pop up to prompt the user and the operation will depend on the user's choice. If the user chooses to convert, then the operation will convert and continue; if the user chooses to cancel, the operation will be cancelled. The Time type requires conversion for all supported servers (Oracle, IBM Informix, MS SQL Server and Access) and the Date type requires conversion for MS SQL Server and Access database servers.
Note: For MS SQL Server and Access database servers, this restriction could be an backward compatibility issue. In previous releases, we did the conversion without explaining it. In this release, we suggest you use the DateTime data type instead of Date data type. If you still use the Date data type, the conversion operation will fail.
In MapInfo Professional To Informix To Oracle
To MS Access
To MS SQL Server
DATE DATE DATE DATETIME* DATETIME*
TIME DATETIME YEAR TO FRACTION(3)*
TIMESTAMP(3)* DATETIME* DATETIME*
DATETIME DATETIME YEAR TO FRACTION(3)
TIMESTAMP(3) DATETIME DATETIME
Miscellaneous Enhancements
74 MapInfo Professional v. 9.0
Miscellaneous EnhancementsThe following changes are additional significant enhancements to the MapInfo Professional product:
• New Time and DateTime Data Type Support for Remote Databases on page 72• Envinsa Routing and Geocoding Constraints Change on page 74• New TrueType Font Behavior on page 74• Improved Character Set Conversion on page 74• MapBasic Help Available from MapBasic Window on page 75
Envinsa Routing and Geocoding Constraints ChangeWe have changed the way we limit the amount of information that is sent to servers based on upgrades to the Envinsa product. For example, you may notice that the Add button in the Create Driving Regions dialog box or the Geocode using Server dialog box is disabled if you have reached the limit on the number of request values (number of address batches, times, or distances) you have sent to the server. In the past, MapInfo Professional used to use the same limit for all servers but we found that the loads a server can handle vary widely. Newer versions of Envinsa allow the server to set limits on the server side, and MapInfo Professional will now use these limits. You may see some changes in behavior when you switch servers and the new server has different limits.
Another difference you may see is that a particular quantity of address batches, times or distances may work for one server but not for another.
These changes should improve the performance of your connection to the server in that MapInfo Professional is not sending more information to the server than it can handle.
New TrueType Font BehaviorCurved labels and other text display features are moving MapInfo Professional toward using only TrueType fonts. For all text display excluding curved and rotated labels, MapInfo Professional 9.0 will honor the use of non-TrueType fonts, but we recommend the use of TrueType fonts wherever possible.
When you use the Text Style dialog box, you may notice that only TrueType fonts display in the Font list by default. If you have used a non-TrueType font in an old workspace or table, this font appears in the Font list. If you use a non-TrueType font in an existing workspace or .tab file and begin using the curved labels feature, MapInfo Professional substitutes the font you are using with a TrueType font.
Improved Character Set ConversionFor many years, MapInfo Professional has supported the automatic conversion of characters from one character set (called a codepage in Windows) to another. Even though our internal code API allows for conversions from any two character sets, in all cases the conversion occurs between a character set associated with some data (a text file in MapBasic or a table) and the system character set, which is an internal value based on a Windows setting.
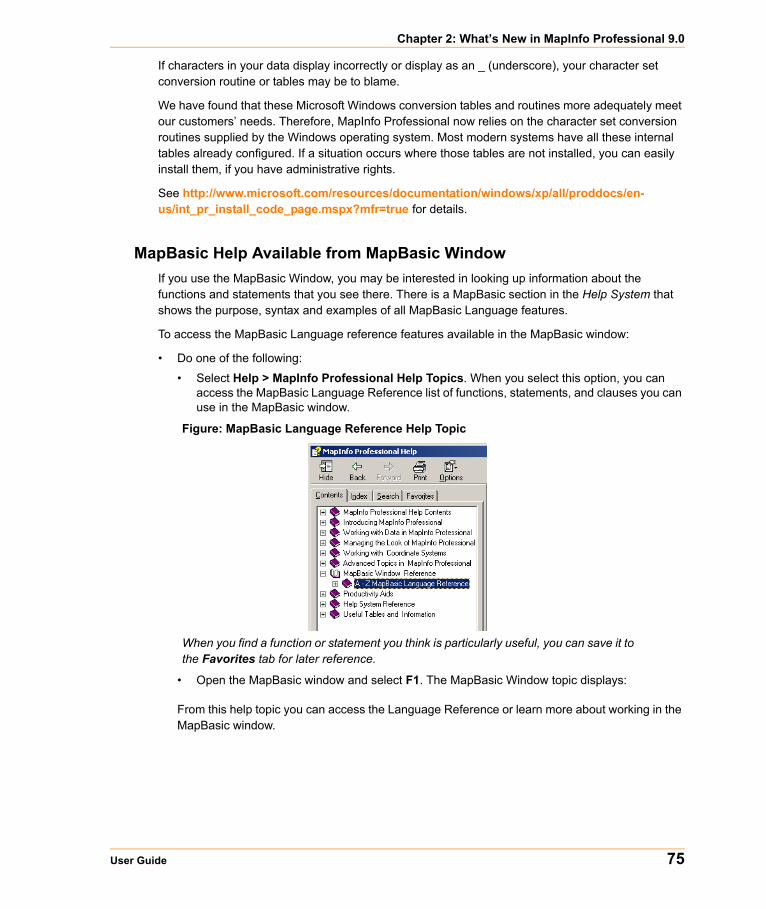
Chapter 2: What’s New in MapInfo Professional 9.0
User Guide 75
If characters in your data display incorrectly or display as an _ (underscore), your character set conversion routine or tables may be to blame.
We have found that these Microsoft Windows conversion tables and routines more adequately meet our customers’ needs. Therefore, MapInfo Professional now relies on the character set conversion routines supplied by the Windows operating system. Most modern systems have all these internal tables already configured. If a situation occurs where those tables are not installed, you can easily install them, if you have administrative rights.
See http://www.microsoft.com/resources/documentation/windows/xp/all/proddocs/en-us/int_pr_install_code_page.mspx?mfr=true for details.
MapBasic Help Available from MapBasic WindowIf you use the MapBasic Window, you may be interested in looking up information about the functions and statements that you see there. There is a MapBasic section in the Help System that shows the purpose, syntax and examples of all MapBasic Language features.
To access the MapBasic Language reference features available in the MapBasic window:
• Do one of the following:
• Select Help > MapInfo Professional Help Topics. When you select this option, you can access the MapBasic Language Reference list of functions, statements, and clauses you can use in the MapBasic window.
Figure: MapBasic Language Reference Help Topic
When you find a function or statement you think is particularly useful, you can save it to the Favorites tab for later reference.
• Open the MapBasic window and select F1. The MapBasic Window topic displays:
From this help topic you can access the Language Reference or learn more about working in the MapBasic window.
Data Enhancements
76 MapInfo Professional v. 9.0
Data EnhancementsTo provide more room for data in the future, we have decided to ship a separate data CD with MapInfo Professional.
Here is the directory structure and data presentation for the introductory and sample data that is shipped with MapInfo Professional. We use the term Introductory Data to describe the data you can use to geocode locally and to enhance the maps you create in every session. The Sample Data folder provides examples of other types of data that are available from MapInfo Corporation.
The Introductory_Data directory is structured as follows:
NorthAmerica
USA
Canada
Mexico
World
[files]
Europe
Asia
Africa
Australia
World_WMS
workspcs
The Sample Data is designed to give you a taste of the other kinds of data products you have available to you. The SampleData directory is structured as follows:
Geographic
AirPhotoUSA
StreetPro Samples
Industry_Data
Business Points
Insurance
TelcoData
Weather
We have added more industry-specific sample workspaces and updated the samples that ship with the MapInfo Professional application to enhance your maps and geocoding. To make space for this new data, we have removed the indexes from all of the data except the USZIPBDY.TAB, US_ZIPS.TAB, and the US_CNTY.TAB files. You need the indexes for these files to maximize your ability to geocode to ZIP code boundaries and centroids and county centroids.
Chapter 2: What’s New in MapInfo Professional 9.0
User Guide 77
Installing the Free Data LocallyTo install the free data locally:
• Place the Data CD in the CD drive and follow the prompts that display according to the needs of your implementation of MapInfo Professional.
CAUTION: If you want to install this data in addition to your existing product data, you need to specify a new directory to ensure that your current data is maintained.
Data Updates and AdditionsThe data updates and additions for this release include:
• Updated ZIP Code Point file to version April, 2007
• Updated ZIP Code Boundary file to version October 2005
• Added new version of telephone company data for Connecticut April, 2007 (Area Codes, PSAP, RateCenters)
• Added Updated RiskInfo (Weather) data for Connecticut September, 2005
• Added Business Points sample data for Connecticut in workspaces, showing potential use cases – January, 2006
• Added a sample of IDSS (Insurance Decision Solution Suite)
• Updated all StreetPro sample data – StreetPro US Version 10.0 January 2007
• Added StreetPro samples for Austria, Denmark, France, Ireland, Norway, Portugal, and Switzerland
• Added sample crime data in the UKCrimeExample directory
• Crater_3d.wor and ElevationUS_3D.wor provide is a new 3D grid workspaces
• CurvedLabel.wor displays the new Curved Label feature

Data Enhancements
78 MapInfo Professional v. 9.0
Installing and Configuring MapInfo Professional
This chapter helps you install and set the basic preferences for MapInfo Professional®. In addition, there are instructions for fixing problems that come up as part of the installation process. We also cover starting and exiting the product.
Sections in this Chapter:
System Requirements . . . . . . . . . . . . . . . . . . . . . . . . . . . . . . . . . . . .8MapInfo Professional and Operating System Support . . . . . . . . . .9MapInfo Professional Database Connectivity and Support . . . . .11Before You Install MapInfo Professional . . . . . . . . . . . . . . . . . . . .12Installing MapInfo Professional . . . . . . . . . . . . . . . . . . . . . . . . . . .13MapInfo Licensing and Activation . . . . . . . . . . . . . . . . . . . . . . . . .20Modifying or Removing MapInfo Professional . . . . . . . . . . . . . . .40Configuring the MapInfo Professional Preferences . . . . . . . . . . .44Starting up and Leaving MapInfo Professional . . . . . . . . . . . . . . .77File Format Types Supported . . . . . . . . . . . . . . . . . . . . . . . . . . . . .78
3
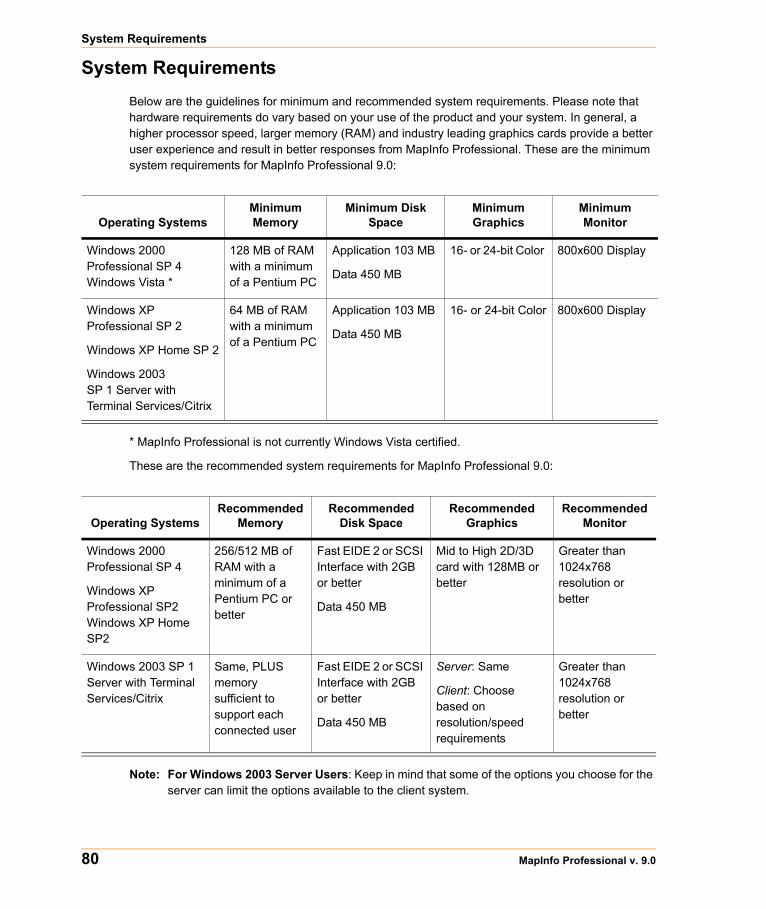
System Requirements
80 MapInfo Professional v. 9.0
System RequirementsBelow are the guidelines for minimum and recommended system requirements. Please note that hardware requirements do vary based on your use of the product and your system. In general, a higher processor speed, larger memory (RAM) and industry leading graphics cards provide a better user experience and result in better responses from MapInfo Professional. These are the minimum system requirements for MapInfo Professional 9.0:
* MapInfo Professional is not currently Windows Vista certified.
These are the recommended system requirements for MapInfo Professional 9.0:
Note: For Windows 2003 Server Users: Keep in mind that some of the options you choose for the server can limit the options available to the client system.
Operating SystemsMinimum Memory
Minimum Disk Space
Minimum Graphics
Minimum Monitor
Windows 2000 Professional SP 4Windows Vista *
128 MB of RAM with a minimum of a Pentium PC
Application 103 MB
Data 450 MB
16- or 24-bit Color 800x600 Display
Windows XP Professional SP 2
Windows XP Home SP 2
Windows 2003 SP 1 Server with Terminal Services/Citrix
64 MB of RAM with a minimum of a Pentium PC
Application 103 MB
Data 450 MB
16- or 24-bit Color 800x600 Display
Operating SystemsRecommended
MemoryRecommended
Disk SpaceRecommended
GraphicsRecommended
Monitor
Windows 2000 Professional SP 4
Windows XP Professional SP2 Windows XP Home SP2
256/512 MB of RAM with a minimum of a Pentium PC or better
Fast EIDE 2 or SCSI Interface with 2GB or better
Data 450 MB
Mid to High 2D/3D card with 128MB or better
Greater than 1024x768 resolution or better
Windows 2003 SP 1 Server with Terminal Services/Citrix
Same, PLUS memory sufficient to support each connected user
Fast EIDE 2 or SCSI Interface with 2GB or better
Data 450 MB
Server: Same
Client: Choose based on resolution/speed requirements
Greater than 1024x768 resolution or better
Chapter 3: Installing and Configuring MapInfo Professional
User Guide 81
MapInfo has exhaustively tested MapInfo Professional under the following Microsoft Windows Desktop Operating Systems:
• Windows 2000 Professional• Window XP Home Edition• Windows XP Professional
MapInfo has exhaustively tested MapInfo Professional under the following Microsoft Windows Server Operating Systems:
• Windows 2003 Server• Windows 2003 with Terminal Services with Citrix Meta Frame technology. To learn more about
this installation option see Windows 2003 Server with Terminal Services/Citrix Support.
MapInfo has performed Installation and validation testing on the following 64Bit Windows Operating System:
• Microsoft's 64-bit Windows XP Professional with 32 Bit compatibility mode.
Note: There are no special installation instructions for installing MapInfo Professional on a 64-bit Windows Operating System. Please follow the instructions designed for your installation type (Typical Workstation Installation on page 16, Custom Workstation Installation on page 16 or Network Installation on page 18) presented in this chapter.
MapInfo Professional and Operating System Support This section provides additional detail on the operating system support for MapInfo Professional, including:
• Windows 2000 Support on page 9• Windows 2003 Server with Terminal Services/Citrix Support on page 10
Windows 2000 SupportMapInfo Professional supports Windows 2000 (SP 4) features as described in the Application Specification for Microsoft Windows 2000 document (available at http://www.microsoft.com/WINDOWS2000/news/bulletins/appspec.asp).
The key aspects of Windows 2000 support with regard to MapInfo Professional are:
• Supporting multiple users on a single machine, each having their own application settings.• Supporting use of MapInfo Professional on a secure Windows 2000 computer (one where users
have very limited access rights).• Using an installer based on the Windows Installer Service.
In order to support these requirements, we have changed the location of many application data files (for example, files containing information used by MapInfo Professional during execution (for example, the projection file, mapinfow.prj). The installer places the files under the current user's Application Data folder. Likewise, some registry entries have been moved from HKEY_LOCAL_MACHINE to locations under HKEY_CURRENT_USER. In both cases the current
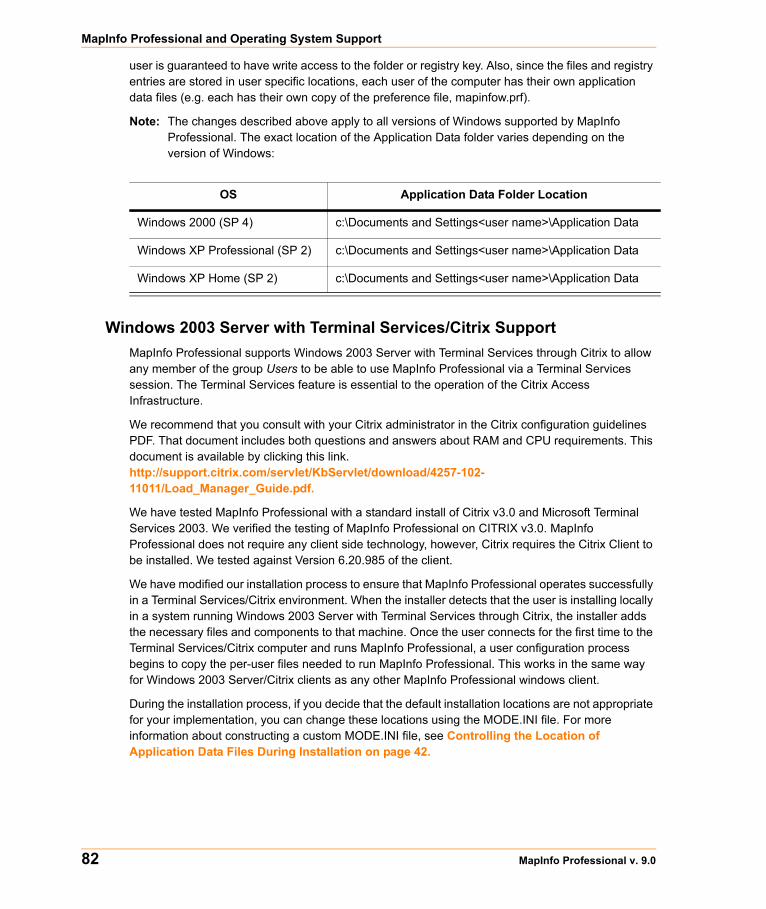
MapInfo Professional and Operating System Support
82 MapInfo Professional v. 9.0
user is guaranteed to have write access to the folder or registry key. Also, since the files and registry entries are stored in user specific locations, each user of the computer has their own application data files (e.g. each has their own copy of the preference file, mapinfow.prf).
Note: The changes described above apply to all versions of Windows supported by MapInfo Professional. The exact location of the Application Data folder varies depending on the version of Windows:
Windows 2003 Server with Terminal Services/Citrix SupportMapInfo Professional supports Windows 2003 Server with Terminal Services through Citrix to allow any member of the group Users to be able to use MapInfo Professional via a Terminal Services session. The Terminal Services feature is essential to the operation of the Citrix Access Infrastructure.
We recommend that you consult with your Citrix administrator in the Citrix configuration guidelines PDF. That document includes both questions and answers about RAM and CPU requirements. This document is available by clicking this link. http://support.citrix.com/servlet/KbServlet/download/4257-102-11011/Load_Manager_Guide.pdf.
We have tested MapInfo Professional with a standard install of Citrix v3.0 and Microsoft Terminal Services 2003. We verified the testing of MapInfo Professional on CITRIX v3.0. MapInfo Professional does not require any client side technology, however, Citrix requires the Citrix Client to be installed. We tested against Version 6.20.985 of the client.
We have modified our installation process to ensure that MapInfo Professional operates successfully in a Terminal Services/Citrix environment. When the installer detects that the user is installing locally in a system running Windows 2003 Server with Terminal Services through Citrix, the installer adds the necessary files and components to that machine. Once the user connects for the first time to the Terminal Services/Citrix computer and runs MapInfo Professional, a user configuration process begins to copy the per-user files needed to run MapInfo Professional. This works in the same way for Windows 2003 Server/Citrix clients as any other MapInfo Professional windows client.
During the installation process, if you decide that the default installation locations are not appropriate for your implementation, you can change these locations using the MODE.INI file. For more information about constructing a custom MODE.INI file, see Controlling the Location of Application Data Files During Installation on page 42.
OS Application Data Folder Location
Windows 2000 (SP 4) c:\Documents and Settings<user name>\Application Data
Windows XP Professional (SP 2) c:\Documents and Settings<user name>\Application Data
Windows XP Home (SP 2) c:\Documents and Settings<user name>\Application Data
Chapter 3: Installing and Configuring MapInfo Professional
User Guide 83
All Citrix testing we have done has been accomplished using the standard Citrix server and client installations. We used Citrix Server version 3.0 and the Citrix Client version 6.20.985. The recommended RAM amount is based on the general guidelines from Citrix and uses this formula:
Amount of RAM required for the application x the number of concurrent users
in the case of MapInfo Professional:
64MB of RAM X the number of concurrent users
so, we recommend this formula as well. For more information about the load requirements of Citrix, please consult your Citrix Load Manager Support Guide.
Installing MapInfo Professional on the Citrix Server
Citrix users follow the Typical Workstation Installation instructions to install MapInfo Professional.
Note: While we expect to work with ODBC and OCI technology on Citrix, we recommend that your Citrix administrator consult with database vendor documentation to configure their respective drivers on Citrix.
MapInfo Professional Database Connectivity and SupportMapInfo Professional supports the following spatial database servers:
• SQL Server 2000/2005
• Informix 9.x
• Solaris 32-bit
• HPUX
• Oracle Spatial 10G, 9iR2, 9iR1
Further, using ODBC drivers, you can access your data from MapInfo Professional using:
• Oracle ODBC Driver 9x
• SQL Server 2000/2005
• Informix 3.x
You can also open tables of data from the following databases and make them mappable but only for point data:
• Oracle 9iR2
• Oracle 10G
• MS Access XP
• MS SQL Server 2000/2005
• Informix 9.4
For more about working with remote database information, see Accessing Remote Data and Setting your Database Connection Preferences in the Help System.
Before You Install MapInfo Professional
84 MapInfo Professional v. 9.0
A Note about SQL Server 2005 Support
MapInfo Professional supports the changes in the MS SQL Server 2005 schema concept. Microsoft has enhanced SQL Server 2005 to use schemas to organize database objects into namespaces. In the past the schema was part of the owner/user construct, so when you deleted a user, you deleted the objects associated with that user.
Using SQL Server 2005, objects are associated with a schema, which can be associated with many users and each user can be associated with many schemas.
The old fully qualified name of a database object was:
Server.Database.User.Object.
The new fully qualified name of the object is:
Server.Database.Schema.Object
If you leave out the server and database name identifiers, MapInfo Professional uses the current server and database names. If you do not explicitly specify a schema for a user, the server assumes any unqualified object names are in the default schema. Therefore, if you are accessing a SQL Server 2005 database, you need to update any features/functions, tools, and test scripts accessing the objects, including the metadata in the MAPCATALOG, to use the new fully or partially qualified object name.
To make this version of SQL Server work, you must have this 8.5.1 (or later) version of MapInfo Professional. There is a work around for MapInfo Professional 8.5 and earlier versions that accesses a server table with the form, Database.Owner.Object. Review the MapInfo Professional 8.5 User Guide for these instructions.
Before You Install MapInfo ProfessionalBefore installing MapInfo Professional, record your serial number and access code in an easy-to-remember place, such as the title page of the User Guide or Supplement. You need a valid serial number and access code to complete an installation or an upgrade. Also, please complete the postage-paid registration card and return it to MapInfo Corporation. Additionally, you can register online by accessing the Contact Info option on the CD Browser.
If the MapInfo Professional installer detects a current version of the product, 6.0 or earlier, or detects that the product had been installed at some time, the installer copies the MAPINFOW.WOR, STARTUP.WOR and MAPINFOW.PRF from the operating system's system directory to <user profile root>\Application Data\MapInfo\MapInfo.
Application data (appdata) files are the non-executable data files that MapInfo Professional uses during operation.
To use a silent installation procedure, see Silent Installation Procedures for System Administrators on page 105.
Chapter 3: Installing and Configuring MapInfo Professional
User Guide 85
Navigating the MapInfo Professional CD BrowserThe initial screen of the MapInfo Professional CD Browser includes these options:
• Install Products: From this option you can install MapInfo Professional (including DBMS support and translators), free data, access to the documentation, and Install Utilities, including: ECW Compressor and GPS.
• What’s New: Display a list and description of new and enhanced features.
• Online Reference: MapInfo Professional provides the following online reference documents: The MapInfo Professional Supplement, MapBasic Reference, Crystal Reports User’s Guide, the MapInfo Professional Printing Guide, as well as the Adobe Acrobat Reader. The MapInfo Professional and Crystal Reports documentation are copied into the Documentation subfolder of your installation directory during the installation process.
• Run MapInfo Tutorial: From this option you can access the MapInfo Tutorial from the MapInfo web site to learn more about the basic features of MapInfo Professional.
• Other Products: Display information about MapBasic, MapInfo Discovery, and MapInfo Pro for SQL Server.
• Contact Information: Where ever you are, MapInfo is there to help you. Contact us at any of these locations or visit us on the world wide web at www.mapinfo.com!
• Register Online: We have simplified the registration process. Simply click this entry and the wizard walks you through the registration process quickly.
• Browse CD: From this option you can review the contents of the CD. There are additional utilities that may be useful to you that are only available when you browse.
• Exit: From this option you can close the CD Browser application.
Installing MapInfo ProfessionalCAUTION: We strongly recommend that you exit from all Windows programs before
beginning the installation process. If you are upgrading from an earlier version of MapInfo Professional, we recommend that you uninstall before upgrading.
You must have Administrator rights to run the Installer on Windows XP.
If your Windows Start menu does not have a MapInfo program folder, the installation process creates this folder. If your Windows Start menu already has a MapInfo program folder, this process creates a new MapInfo icon within that folder.
MapInfo Professional provides its application data files to each user. Called a Per-User install, this functionality runs the first time you run MapInfo Professional or MapInfo Professional client on a machine, and each time the MapInfo Professional Installer is run thereafter. The application data files include, among others, the Pen Styles file, Custom Symbols files, Graph Support files, and Thematic Legend templates. These files allow different users to have custom settings.
Note: The Installer requires that your TEMP variable be set to a valid directory.
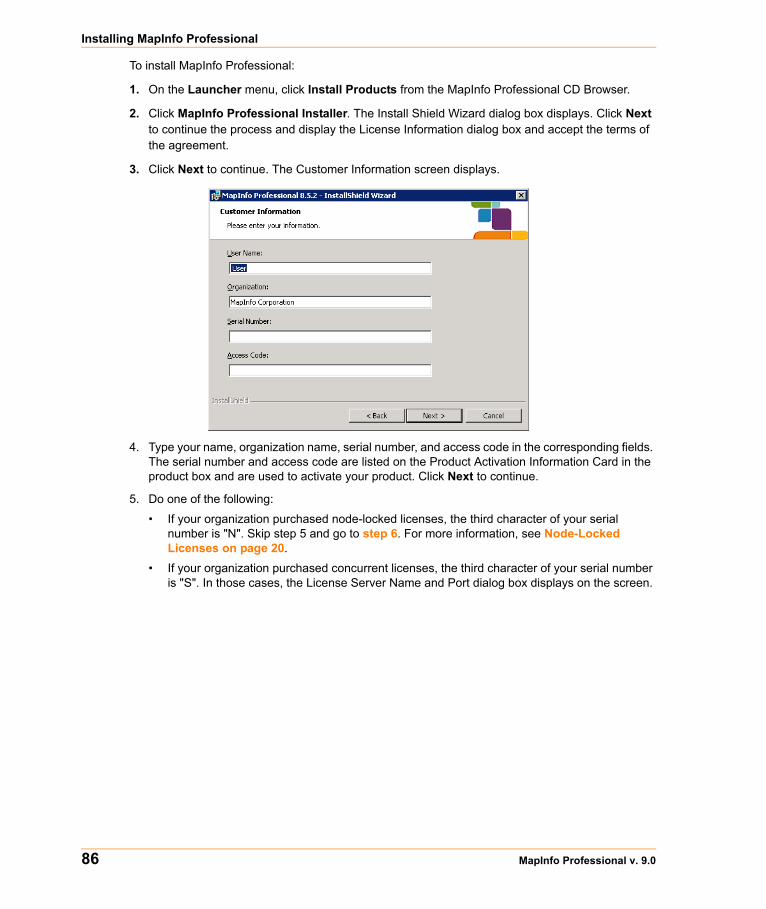
Installing MapInfo Professional
86 MapInfo Professional v. 9.0
To install MapInfo Professional:
1. On the Launcher menu, click Install Products from the MapInfo Professional CD Browser.
2. Click MapInfo Professional Installer. The Install Shield Wizard dialog box displays. Click Next to continue the process and display the License Information dialog box and accept the terms of the agreement.
3. Click Next to continue. The Customer Information screen displays.
4. Type your name, organization name, serial number, and access code in the corresponding fields. The serial number and access code are listed on the Product Activation Information Card in the product box and are used to activate your product. Click Next to continue.
5. Do one of the following:
• If your organization purchased node-locked licenses, the third character of your serial number is "N". Skip step 5 and go to step 6. For more information, see Node-Locked Licenses on page 20.
• If your organization purchased concurrent licenses, the third character of your serial number is "S". In those cases, the License Server Name and Port dialog box displays on the screen.

Chapter 3: Installing and Configuring MapInfo Professional
User Guide 87
If you know the license server name and port number, enter them here. If you do not, you can continue with the installation without filling in the license server name and port number. You will have another opportunity to supply this information when you start MapInfo Professional. For more information, see Concurrent Licenses on page 29. Click Next.
6. Review the following installation types and determine which instructions are appropriate. Click one of the following and click Next to continue:
• Typical Workstation Installation. Click this option if you will be using MapInfo Professional as a desktop application including remote database access and connectivity. See Typical Workstation Installation on page 16 to continue these instructions.
• Custom Workstation Installation. Click this option to restrict the components that are installed by the installation program. For example, you can prevent the installer from adding the help system and tools. See Custom Workstation Installation on page 16 to continue these instructions.
• Network Installation. Click this option if you are installing or upgrading to a MapInfo Professional network product. See Network Installation on page 18 to continue these instructions. These instructions are for network administrators only. After you install MapInfo Professional on the network, follow the instructions for installing MapInfo Professional on client equipment in Setting Up Client Workstations on page 19.
Installing MapInfo Professional
88 MapInfo Professional v. 9.0
Typical Workstation InstallationChoose this option to install MapInfo Professional program files, Online Help, Tools, Universal Translator, and Crystal Reports. The ArcLink translation utility is not installed with this option.
CAUTION: Make sure you have completed the directions in Installing MapInfo Professional on page 13 before beginning these instructions.
To continue installing MapInfo Professional on a workstation:
1. In the Setup Type dialog box, click Typical Workstation Installation; the Destination Folder screen displays. If you have an earlier version (or versions) of MapInfo Professional installed and you do not want to overwrite that version, create a new directory name in the next step.
2. Do one of the following:
• Click Next to accept the destination folder indicated
• Click Change to create a new path in the Change Current Destination Folder dialog box. Type the new path in the Folder name field and click OK to continue. Click Next to continue.
The Ready to Install the Program screen displays. Review your selections to ensure that the path is correct before moving on. Click Back to make changes.
3. Click Install to begin. A progress bar indicates the status of the process.
4. When the InstallShield Wizard Complete screen displays, choose Finish to return to the Install Products screen.
Note: When you open MapInfo Professional for the first time, the final installation and configuration process takes place automatically. See MapInfo Licensing and Activation on page 20 before you begin using MapInfo Professional.
Custom Workstation InstallationChoose this installation type to select components and drivers within the MapInfo Professional installation program. This is particularly useful if you want to save disk space by not installing the Help System, the documentation, or the MapInfo Professional tools.
CAUTION: Make sure you have completed the directions in Installing MapInfo Professional on page 13 before beginning these instructions.
To continue installing using the custom workstation instructions:
1. In the Setup Type dialog box, click Custom Workstation Installation; the Custom Setup dialog box displays. A feature description, and the space required for the feature and its sub-features displays in the Feature Description area.
2. In the Custom Setup dialog box you decide what components are to be installed and the directory you want them to install to. Click the feature icon to select the feature for installation.
The options for a Custom Setup include:
• MapInfo Program Files
• Tools (which refer to the MapInfo Utility Tools, Crystal Reports etc.)
• Translators (Universal Translators, ArcLink, etc.)
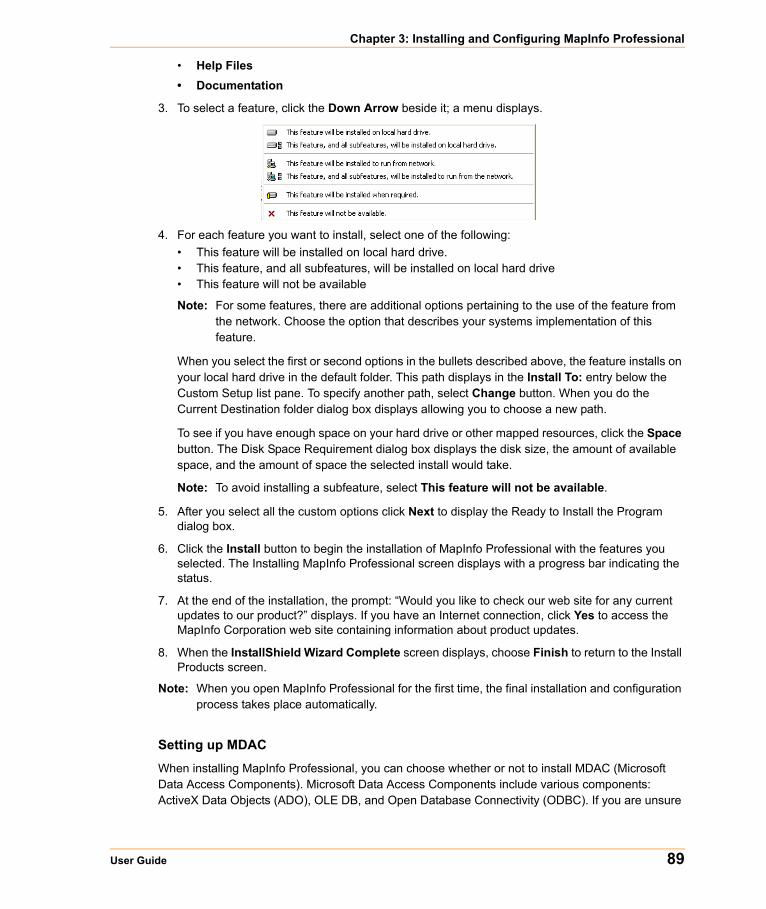
Chapter 3: Installing and Configuring MapInfo Professional
User Guide 89
• Help Files
• Documentation
3. To select a feature, click the Down Arrow beside it; a menu displays.
4. For each feature you want to install, select one of the following:• This feature will be installed on local hard drive.• This feature, and all subfeatures, will be installed on local hard drive• This feature will not be available
Note: For some features, there are additional options pertaining to the use of the feature from the network. Choose the option that describes your systems implementation of this feature.
When you select the first or second options in the bullets described above, the feature installs on your local hard drive in the default folder. This path displays in the Install To: entry below the Custom Setup list pane. To specify another path, select Change button. When you do the Current Destination folder dialog box displays allowing you to choose a new path.
To see if you have enough space on your hard drive or other mapped resources, click the Space button. The Disk Space Requirement dialog box displays the disk size, the amount of available space, and the amount of space the selected install would take.
Note: To avoid installing a subfeature, select This feature will not be available.
5. After you select all the custom options click Next to display the Ready to Install the Program dialog box.
6. Click the Install button to begin the installation of MapInfo Professional with the features you selected. The Installing MapInfo Professional screen displays with a progress bar indicating the status.
7. At the end of the installation, the prompt: “Would you like to check our web site for any current updates to our product?” displays. If you have an Internet connection, click Yes to access the MapInfo Corporation web site containing information about product updates.
8. When the InstallShield Wizard Complete screen displays, choose Finish to return to the Install Products screen.
Note: When you open MapInfo Professional for the first time, the final installation and configuration process takes place automatically.
Setting up MDAC
When installing MapInfo Professional, you can choose whether or not to install MDAC (Microsoft Data Access Components). Microsoft Data Access Components include various components: ActiveX Data Objects (ADO), OLE DB, and Open Database Connectivity (ODBC). If you are unsure

Installing MapInfo Professional
90 MapInfo Professional v. 9.0
whether or not to install the MDAC, consult with your network administrator. This choice allows IT administrators to manually install their own replacement modules for the MDAC. You must have MDAC, or a replacement, to connect to any databases.
Adding ODBC and OCI Drivers
After you add the ODBC and OCI drivers as part of the Typical Installation process, you can use the instructions in Setting your Database Connection Preferences in the Help System to set your database connection preferences.
You must have the OCI and ODBC drivers installed for MapInfo Professional to connect to remote databases. If you see the following messages, then you have installed the MapInfo DLLs for these features correctly but the drivers are missing:
OCI (Oracle Call Interface)The MapInfo Oracle OCI Database driver (MIDLOCI.DLL) failed to load.This is most commonly caused by not having an installation of Oracle's OCI driver, which is necessary for the MapInfo Oracle OCI Database driver to load.To fix this issue, please install the Oracle OCI Database driver or rerun the MapInfo Professional Installer to remove the MapInfo Oracle OCI Database driver.Clicking "OK" will allow you to run MapInfo Professional without the ability to open Oracle tables through Oracle's Oracle Call Interface.If you need more information, please contact MapInfo Technical Support.
ODBC (Open DataBase Connectivity)The MapInfo ODBC Database driver (MIDLODBC.DLL) failed to load.This is most commonly caused by an incomplete installation of MapInfo ODBC Connectivity Support. To fix this issue, please rerun the MapInfo Professional Installer to repair or remove the MapInfo ODBC Connectivity Support.Clicking "OK" will allow you to run MapInfo Professional without the ability to open remote database tables through ODBC.If you need more information, please contact MapInfo Technical Support.
A combined message displays if you attempt to add both of these options and neither of them have access to the appropriate database drivers.
Network InstallationInstalling MapInfo Professional 9.0 on a network involves two separate procedures:
• Installing the product on a network drive (presumably done by the Network Administrator).• Setting up users with program manager icons, etc. (presumably done by the user).
Make sure you have completed the directions in Installing MapInfo Professional on page 85 before beginning these directions.
Choose this installation ONLY if you are a Network Administrator and have full rights to the network.
Chapter 3: Installing and Configuring MapInfo Professional
User Guide 91
To continue installing MapInfo Professional 9.0 on a network:
1. Click Network Installation; the Administrator Selection Screen displays.
The options for a Network Setup include:
• MapInfo Professional Program Files• Tools, Translators• Help Files
A feature description, and the space required for the feature, displays in the Feature Description area. Click the option icon to install it.
2. When you select a feature, a menu displays allowing you to choose to install and/or run the feature and its subfeatures from various locations, including your local hard drive or from CD.
• If you select the hard drive option, the feature will be installed in the path indicated; on your local hard drive in the folder indicated; to specify a different location, choose Change to display the Current Destination folder screen.
• If you choose to install an option to your hard drive, the Space button is enabled; choose this button to display the Disk Space Requirement dialog box.
Note: You can choose to not install a feature by skipping it.
See Installing MapInfo Professional on a Network Drive in the Help System for additional details.
3. After the installation is complete, the prompt: “Would you like to check our web site for any current updates to our product?” displays. If you have an Internet connection, check Yes to be connected to the page of the MapInfo Corporation Web site containing information about product updates.
4. When the InstallShield Wizard Complete screen displays, choose Finish to return to the Install Products screen.
Note: When your users open MapInfo Professional for the first time, the final installation and configuration process takes place automatically. See MapInfo Licensing and Activation on page 20 for information on licensing.
Installing MapInfo Professional on a Network Drive
The procedure for installing MapInfo Professional on a network drive is the same as the regular installation procedure except for the following:
• Select Network Installation in the Setup Type screen.• Continue as in a Workstation Installation, selecting features, destination locations, etc.
The Network Installation alone does not install any files to the local hard drive.
MapInfo Licensing and Activation
92 MapInfo Professional v. 9.0
Setting Up Client WorkstationsTo permit a user to use this network installation of MapInfo Professional, run SETUP.EXE:
1. Map a drive to the MapInfo Professional Install directory.
2. Select Run from the Start menu.
3. Run SETUP.EXE from [MapInfo install directory]\AddClient. The MapInfo Professional Client Welcome screen displays.
4. Click Next. The License Information screen displays.
5. Click “I accept the terms of the license agreement” and select Next. The Customer Information screen displays with the network install values as the default.
6. Modify for the current instance and select Next.
7. Click Install to continue the installation.
8. Click Finish to complete the client installation.
9. Open MapInfo Professional and begin the product activation process. See MapInfo Licensing and Activation on page 20.
MapInfo Licensing and ActivationThis section describes the licenses available for MapInfo Professional and how to get started with the product according to the type of license your organization purchased.
MapInfo has two licensing schemes:
• Node-locked• Concurrent
The serial number and access code that you enter during the installation indicates to MapInfo Professional what type of license you have. Depending on the license type, MapInfo Professional will guide you through activating the product (if your organization purchased node-locked licenses) or connecting to a license server (if your organization purchased concurrent licenses).
Node-Locked LicensesNode-locked licenses enable you to run MapInfo Professional on a specific computer. If you purchased node-locked licenses, your installation of MapInfo Professional must be activated before you can use it. Activation is the process of acquiring a license from MapInfo. This section explains the activation options available for node-locked licenses.
Product Activation
MapInfo uses the serial number and access code you supplied during the installation to activate the product. If you need to refer to these numbers again, the serial number and access code are located on the product box and on the Product Activation Information Card.
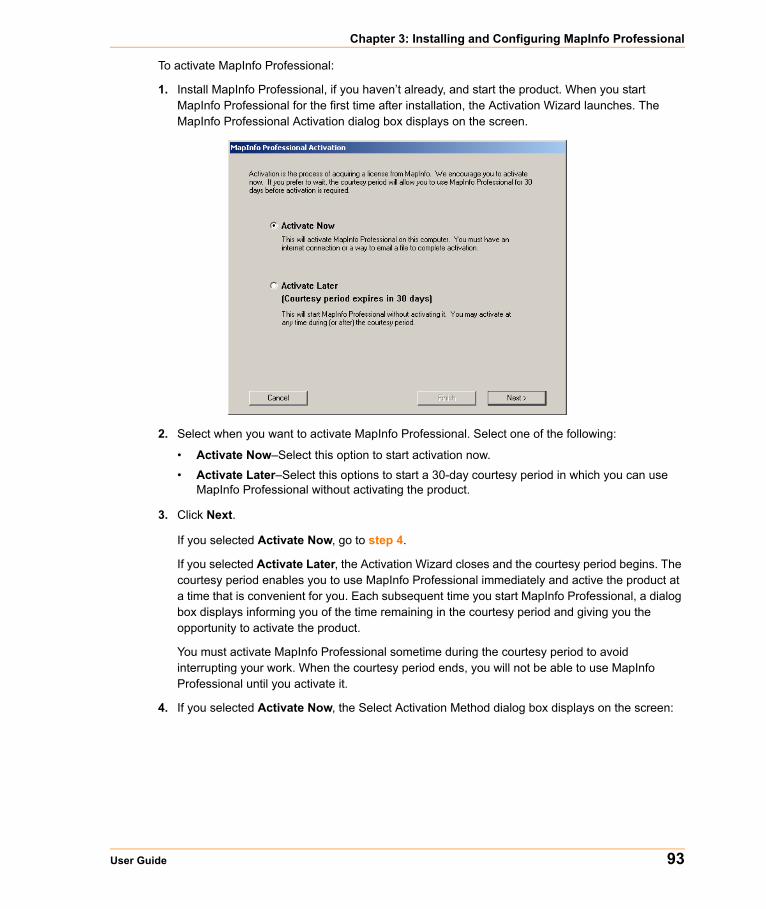
Chapter 3: Installing and Configuring MapInfo Professional
User Guide 93
To activate MapInfo Professional:
1. Install MapInfo Professional, if you haven’t already, and start the product. When you start MapInfo Professional for the first time after installation, the Activation Wizard launches. The MapInfo Professional Activation dialog box displays on the screen.
2. Select when you want to activate MapInfo Professional. Select one of the following:
• Activate Now–Select this option to start activation now.
• Activate Later–Select this options to start a 30-day courtesy period in which you can use MapInfo Professional without activating the product.
3. Click Next.
If you selected Activate Now, go to step 4.
If you selected Activate Later, the Activation Wizard closes and the courtesy period begins. The courtesy period enables you to use MapInfo Professional immediately and active the product at a time that is convenient for you. Each subsequent time you start MapInfo Professional, a dialog box displays informing you of the time remaining in the courtesy period and giving you the opportunity to activate the product.
You must activate MapInfo Professional sometime during the courtesy period to avoid interrupting your work. When the courtesy period ends, you will not be able to use MapInfo Professional until you activate it.
4. If you selected Activate Now, the Select Activation Method dialog box displays on the screen:
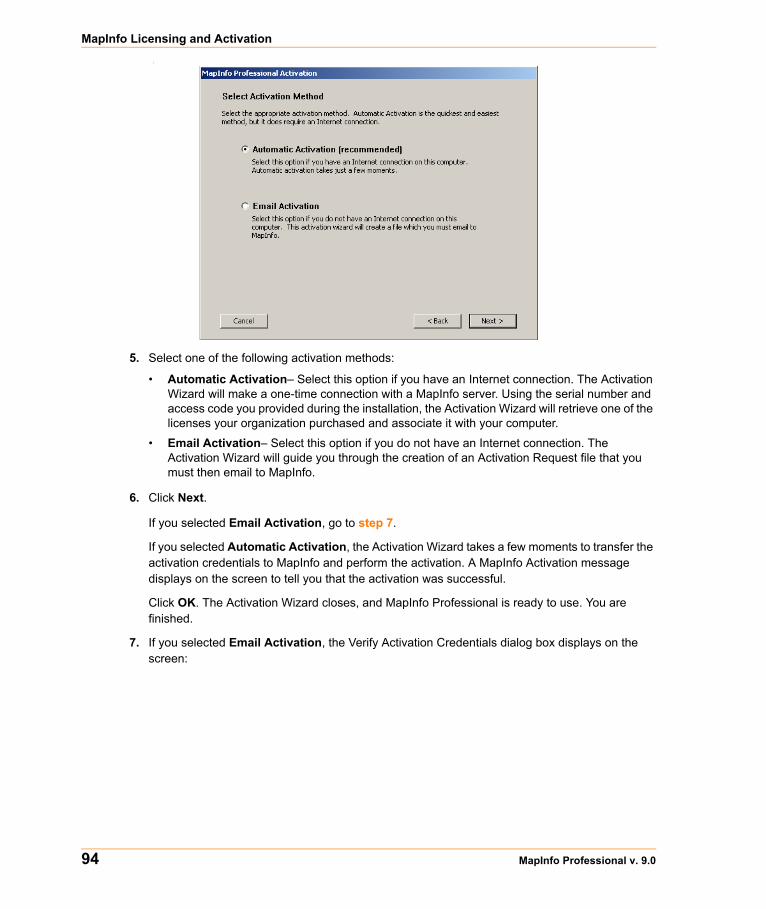
MapInfo Licensing and Activation
94 MapInfo Professional v. 9.0
:
5. Select one of the following activation methods:
• Automatic Activation– Select this option if you have an Internet connection. The Activation Wizard will make a one-time connection with a MapInfo server. Using the serial number and access code you provided during the installation, the Activation Wizard will retrieve one of the licenses your organization purchased and associate it with your computer.
• Email Activation– Select this option if you do not have an Internet connection. The Activation Wizard will guide you through the creation of an Activation Request file that you must then email to MapInfo.
6. Click Next.
If you selected Email Activation, go to step 7.
If you selected Automatic Activation, the Activation Wizard takes a few moments to transfer the activation credentials to MapInfo and perform the activation. A MapInfo Activation message displays on the screen to tell you that the activation was successful.
Click OK. The Activation Wizard closes, and MapInfo Professional is ready to use. You are finished.
7. If you selected Email Activation, the Verify Activation Credentials dialog box displays on the screen:
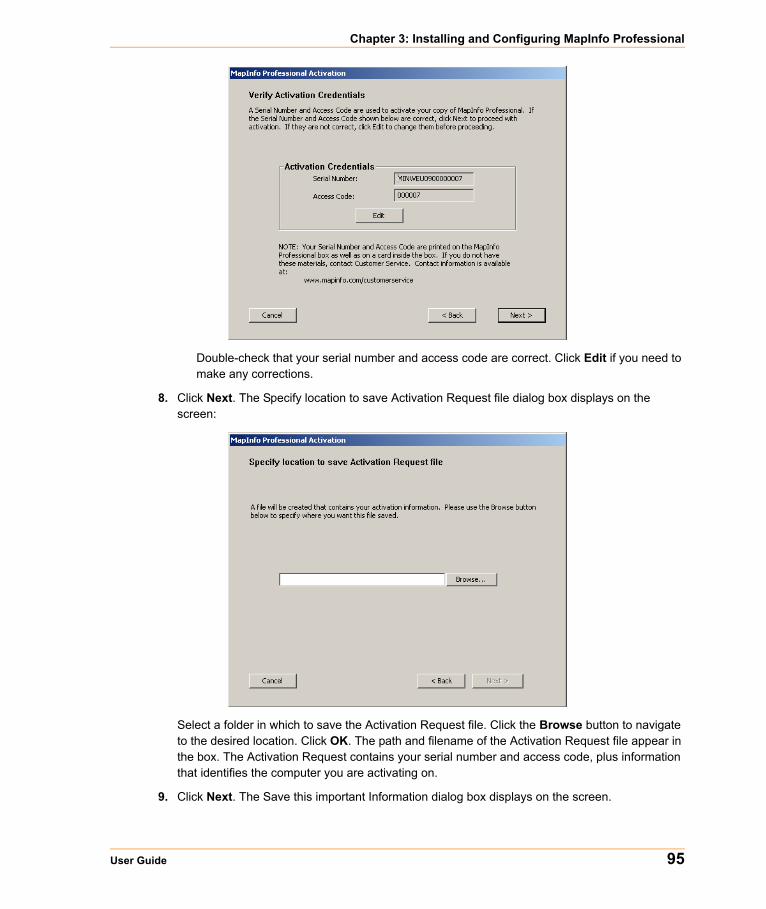
Chapter 3: Installing and Configuring MapInfo Professional
User Guide 95
Double-check that your serial number and access code are correct. Click Edit if you need to make any corrections.
8. Click Next. The Specify location to save Activation Request file dialog box displays on the screen:
Select a folder in which to save the Activation Request file. Click the Browse button to navigate to the desired location. Click OK. The path and filename of the Activation Request file appear in the box. The Activation Request contains your serial number and access code, plus information that identifies the computer you are activating on.
9. Click Next. The Save this important Information dialog box displays on the screen.
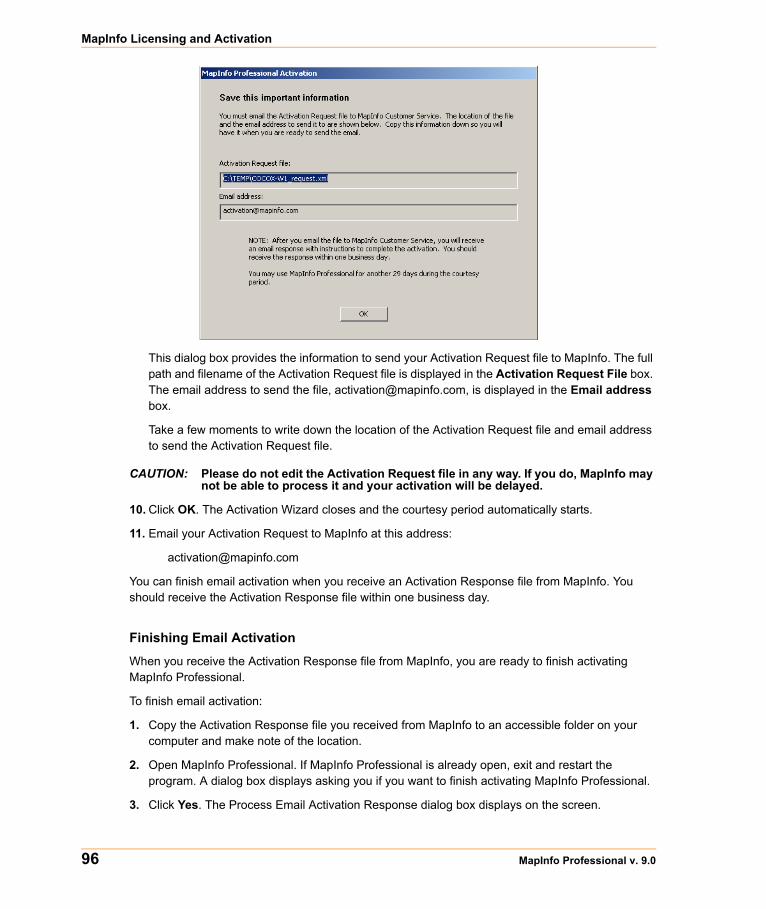
MapInfo Licensing and Activation
96 MapInfo Professional v. 9.0
This dialog box provides the information to send your Activation Request file to MapInfo. The full path and filename of the Activation Request file is displayed in the Activation Request File box. The email address to send the file, [email protected], is displayed in the Email address box.
Take a few moments to write down the location of the Activation Request file and email address to send the Activation Request file.
CAUTION: Please do not edit the Activation Request file in any way. If you do, MapInfo may not be able to process it and your activation will be delayed.
10. Click OK. The Activation Wizard closes and the courtesy period automatically starts.
11. Email your Activation Request to MapInfo at this address:
You can finish email activation when you receive an Activation Response file from MapInfo. You should receive the Activation Response file within one business day.
Finishing Email Activation
When you receive the Activation Response file from MapInfo, you are ready to finish activating MapInfo Professional.
To finish email activation:
1. Copy the Activation Response file you received from MapInfo to an accessible folder on your computer and make note of the location.
2. Open MapInfo Professional. If MapInfo Professional is already open, exit and restart the program. A dialog box displays asking you if you want to finish activating MapInfo Professional.
3. Click Yes. The Process Email Activation Response dialog box displays on the screen.
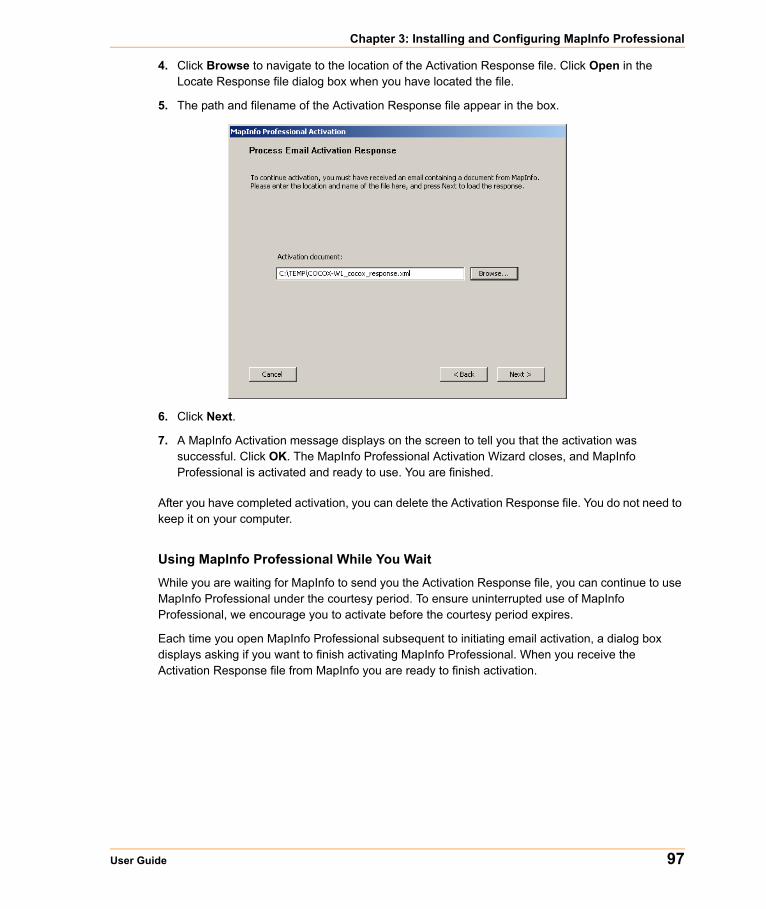
Chapter 3: Installing and Configuring MapInfo Professional
User Guide 97
4. Click Browse to navigate to the location of the Activation Response file. Click Open in the Locate Response file dialog box when you have located the file.
5. The path and filename of the Activation Response file appear in the box.
6. Click Next.
7. A MapInfo Activation message displays on the screen to tell you that the activation was successful. Click OK. The MapInfo Professional Activation Wizard closes, and MapInfo Professional is activated and ready to use. You are finished.
After you have completed activation, you can delete the Activation Response file. You do not need to keep it on your computer.
Using MapInfo Professional While You Wait
While you are waiting for MapInfo to send you the Activation Response file, you can continue to use MapInfo Professional under the courtesy period. To ensure uninterrupted use of MapInfo Professional, we encourage you to activate before the courtesy period expires.
Each time you open MapInfo Professional subsequent to initiating email activation, a dialog box displays asking if you want to finish activating MapInfo Professional. When you receive the Activation Response file from MapInfo you are ready to finish activation.
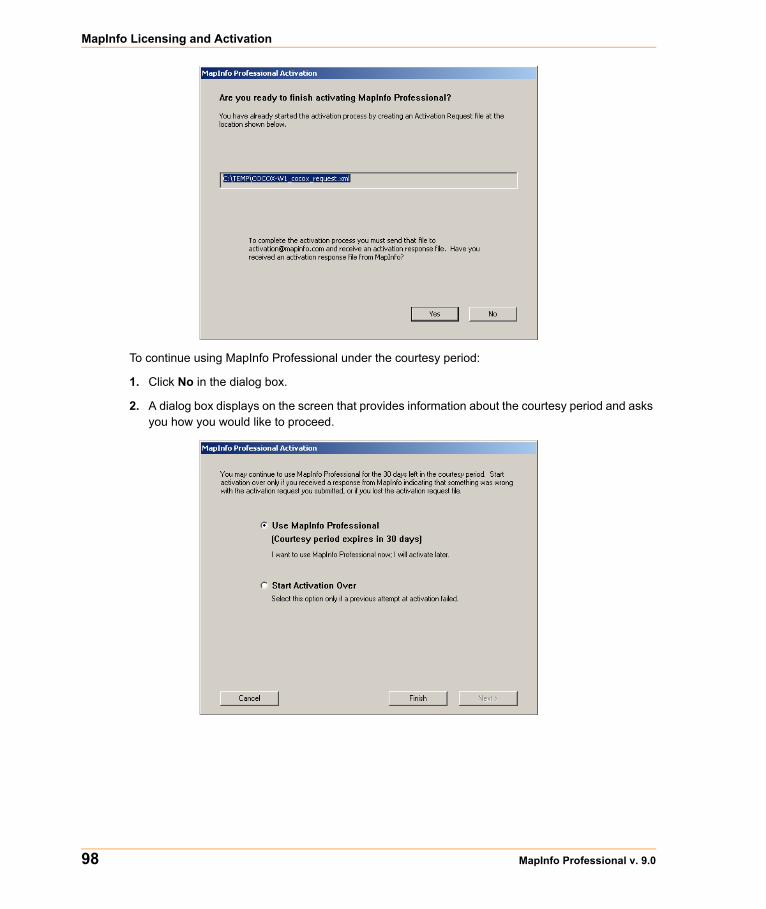
MapInfo Licensing and Activation
98 MapInfo Professional v. 9.0
To continue using MapInfo Professional under the courtesy period:
1. Click No in the dialog box.
2. A dialog box displays on the screen that provides information about the courtesy period and asks you how you would like to proceed.
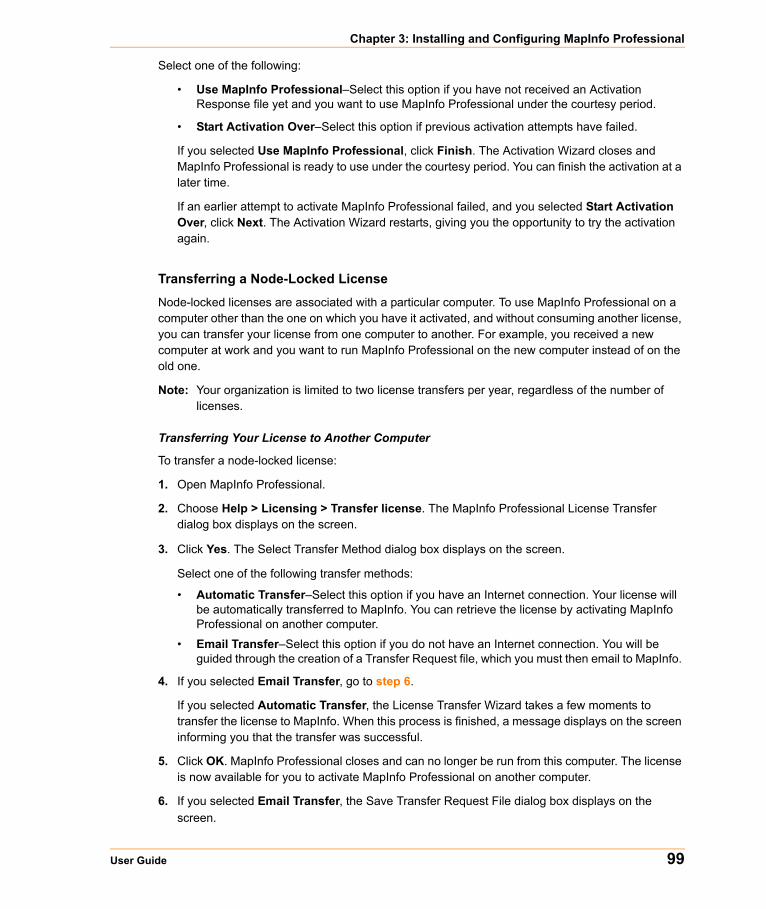
Chapter 3: Installing and Configuring MapInfo Professional
User Guide 99
Select one of the following:
• Use MapInfo Professional–Select this option if you have not received an Activation Response file yet and you want to use MapInfo Professional under the courtesy period.
• Start Activation Over–Select this option if previous activation attempts have failed.
If you selected Use MapInfo Professional, click Finish. The Activation Wizard closes and MapInfo Professional is ready to use under the courtesy period. You can finish the activation at a later time.
If an earlier attempt to activate MapInfo Professional failed, and you selected Start Activation Over, click Next. The Activation Wizard restarts, giving you the opportunity to try the activation again.
Transferring a Node-Locked License
Node-locked licenses are associated with a particular computer. To use MapInfo Professional on a computer other than the one on which you have it activated, and without consuming another license, you can transfer your license from one computer to another. For example, you received a new computer at work and you want to run MapInfo Professional on the new computer instead of on the old one.
Note: Your organization is limited to two license transfers per year, regardless of the number of licenses.
Transferring Your License to Another Computer
To transfer a node-locked license:
1. Open MapInfo Professional.
2. Choose Help > Licensing > Transfer license. The MapInfo Professional License Transfer dialog box displays on the screen.
3. Click Yes. The Select Transfer Method dialog box displays on the screen.
Select one of the following transfer methods:
• Automatic Transfer–Select this option if you have an Internet connection. Your license will be automatically transferred to MapInfo. You can retrieve the license by activating MapInfo Professional on another computer.
• Email Transfer–Select this option if you do not have an Internet connection. You will be guided through the creation of a Transfer Request file, which you must then email to MapInfo.
4. If you selected Email Transfer, go to step 6.
If you selected Automatic Transfer, the License Transfer Wizard takes a few moments to transfer the license to MapInfo. When this process is finished, a message displays on the screen informing you that the transfer was successful.
5. Click OK. MapInfo Professional closes and can no longer be run from this computer. The license is now available for you to activate MapInfo Professional on another computer.
6. If you selected Email Transfer, the Save Transfer Request File dialog box displays on the screen.
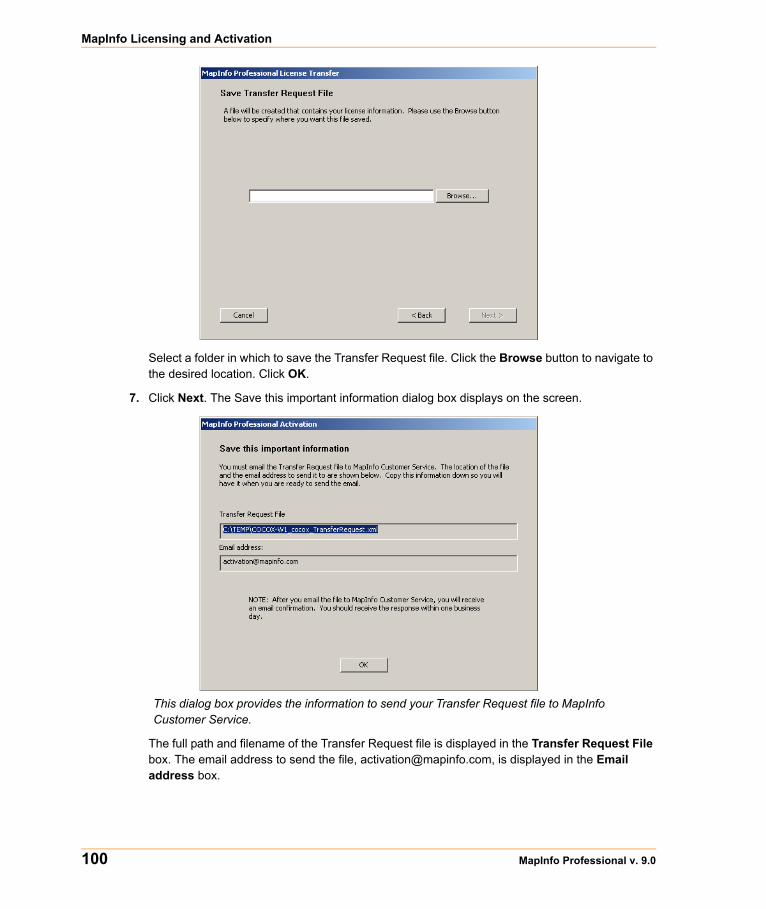
MapInfo Licensing and Activation
100 MapInfo Professional v. 9.0
Select a folder in which to save the Transfer Request file. Click the Browse button to navigate to the desired location. Click OK.
7. Click Next. The Save this important information dialog box displays on the screen.
This dialog box provides the information to send your Transfer Request file to MapInfo Customer Service.
The full path and filename of the Transfer Request file is displayed in the Transfer Request File box. The email address to send the file, [email protected], is displayed in the Email address box.
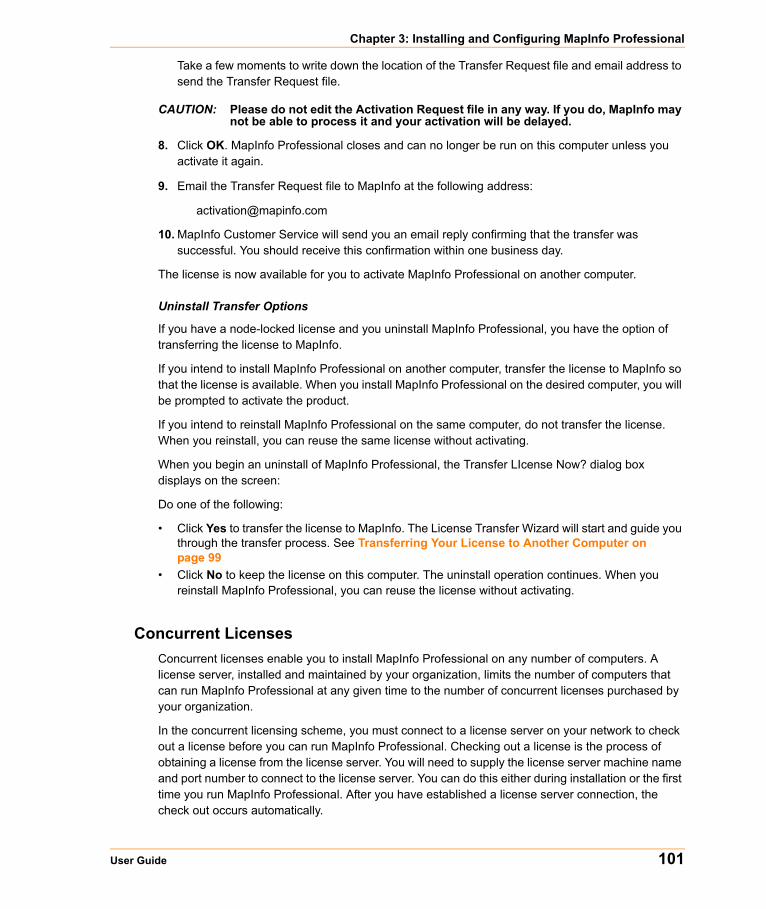
Chapter 3: Installing and Configuring MapInfo Professional
User Guide 101
Take a few moments to write down the location of the Transfer Request file and email address to send the Transfer Request file.
CAUTION: Please do not edit the Activation Request file in any way. If you do, MapInfo may not be able to process it and your activation will be delayed.
8. Click OK. MapInfo Professional closes and can no longer be run on this computer unless you activate it again.
9. Email the Transfer Request file to MapInfo at the following address:
10. MapInfo Customer Service will send you an email reply confirming that the transfer was successful. You should receive this confirmation within one business day.
The license is now available for you to activate MapInfo Professional on another computer.
Uninstall Transfer Options
If you have a node-locked license and you uninstall MapInfo Professional, you have the option of transferring the license to MapInfo.
If you intend to install MapInfo Professional on another computer, transfer the license to MapInfo so that the license is available. When you install MapInfo Professional on the desired computer, you will be prompted to activate the product.
If you intend to reinstall MapInfo Professional on the same computer, do not transfer the license. When you reinstall, you can reuse the same license without activating.
When you begin an uninstall of MapInfo Professional, the Transfer LIcense Now? dialog box displays on the screen:
Do one of the following:
• Click Yes to transfer the license to MapInfo. The License Transfer Wizard will start and guide you through the transfer process. See Transferring Your License to Another Computer on page 99
• Click No to keep the license on this computer. The uninstall operation continues. When you reinstall MapInfo Professional, you can reuse the license without activating.
Concurrent LicensesConcurrent licenses enable you to install MapInfo Professional on any number of computers. A license server, installed and maintained by your organization, limits the number of computers that can run MapInfo Professional at any given time to the number of concurrent licenses purchased by your organization.
In the concurrent licensing scheme, you must connect to a license server on your network to check out a license before you can run MapInfo Professional. Checking out a license is the process of obtaining a license from the license server. You will need to supply the license server machine name and port number to connect to the license server. You can do this either during installation or the first time you run MapInfo Professional. After you have established a license server connection, the check out occurs automatically.
MapInfo Licensing and Activation
102 MapInfo Professional v. 9.0
A license server administrator from your organization installs and maintains the license server. The license server administrator must also perform the following tasks:
• Activate the license server to make licenses available for check out.• Inform users of the license server machine name and port number.
Connecting to a License Server
If your organization purchased concurrent licenses for MapInfo Professional, you will need to connect to a license server to run the product.
To connect to the license server, MapInfo Professional must have the license server name and port number. Your license server administrator will provide you with this information.
Connecting During Installation
The installation program will ask you for the license server name and port number. If you know them at install time, enter them. When you start MapInfo Professional, you will be connected to the license server and a license will be checked out automatically.
If you do not have this information at the time you install MapInfo Professional, the installation program will enable you to continue with the installation without filling in the license server name and port number. You will have another opportunity to connect to the server when you start MapInfo Professional.
Connecting After Installation
If you did not specify the license server name and port number during product installation, you will be prompted for that information when you start MapInfo Professional. You will also be prompted if MapInfo Professional cannot connect to a running license server using the server name and port number you provided at install.
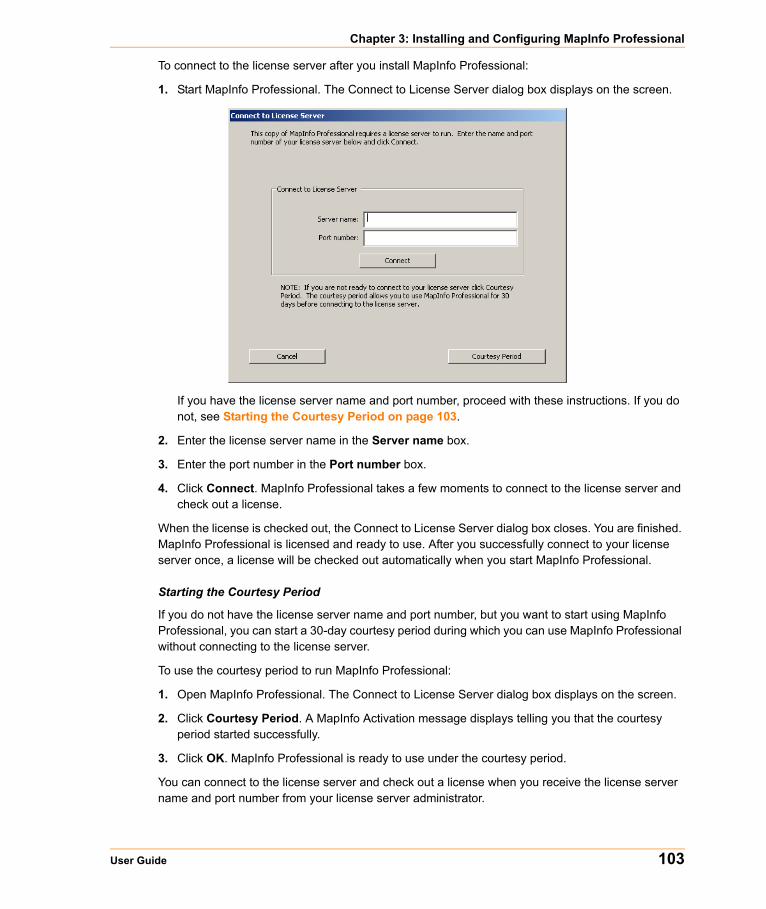
Chapter 3: Installing and Configuring MapInfo Professional
User Guide 103
To connect to the license server after you install MapInfo Professional:
1. Start MapInfo Professional. The Connect to License Server dialog box displays on the screen.
If you have the license server name and port number, proceed with these instructions. If you do not, see Starting the Courtesy Period on page 103.
2. Enter the license server name in the Server name box.
3. Enter the port number in the Port number box.
4. Click Connect. MapInfo Professional takes a few moments to connect to the license server and check out a license.
When the license is checked out, the Connect to License Server dialog box closes. You are finished. MapInfo Professional is licensed and ready to use. After you successfully connect to your license server once, a license will be checked out automatically when you start MapInfo Professional.
Starting the Courtesy Period
If you do not have the license server name and port number, but you want to start using MapInfo Professional, you can start a 30-day courtesy period during which you can use MapInfo Professional without connecting to the license server.
To use the courtesy period to run MapInfo Professional:
1. Open MapInfo Professional. The Connect to License Server dialog box displays on the screen.
2. Click Courtesy Period. A MapInfo Activation message displays telling you that the courtesy period started successfully.
3. Click OK. MapInfo Professional is ready to use under the courtesy period.
You can connect to the license server and check out a license when you receive the license server name and port number from your license server administrator.
MapInfo Licensing and Activation
104 MapInfo Professional v. 9.0
Connection Failures
Failure to connect to the license server can occur for several reasons.
First, although you may know the license server name and port number, the license server administrator may not have had an opportunity to install it yet. In this case, MapInfo Professional cannot find the license server you specified. To use MapInfo Professional, you can start the courtesy period, and then connect when you know that the license server has been installed and is running.
Failures can also occur if the license server has been moved to a different computer. In this case, you were previously able to connect to the license server, but the license server was moved since the last time you used MapInfo Professional. MapInfo Professional is looking for the license server in its previous location. If MapInfo Professional cannot connect to the license server at startup, the Connect to License Server dialog will display on the screen. See Connecting After Installation on page 102 for information. See your license server administrator for the correct license server name.
Finally, if all licenses have been checked out, you will not be able to run MapInfo Professional. You are able to connect to the license server, but you cannot check out a license because they are all in use. You will need to wait until a license becomes available before you can check out a license.
Borrowing a Concurrent License
Some concurrent licenses can be borrowed. Borrowed license enable you to use MapInfo Professional when your computer is not able to connect to your license server. For example, if you have MapInfo Professional installed on a laptop computer and you are going to be away from the office, you can borrow a license to use MapInfo Professional while you are away. Check with your license server administrator to find out if your concurrent license includes borrowing.
When you borrow a license, be sure to specify a borrow period that gives you sufficient time to use MapInfo Professional before the license expires. If the license expires before you have an opportunity to return it, the license is automatically returned to the license server. MapInfo Professional is unusable until you can connect to your network again and check out a license.
To borrow a license, the computer that you want to put the borrowed license on must have MapInfo Professional installed and be connected to the license server.
To borrow a license:
1. Open MapInfo Professional.
2. Choose Help > Licensing > Borrow license. The Borrow MapInfo Professional License dialog box displays on the screen.
3. Specify the number of days that you want to borrow the license. You can specify from one to 365 days.
4. Click Borrow License. After a few moments, MapInfo Activation message displays on the screen to tell you that the license was borrowed from the server successfully.
5. Click OK.
You can use MapInfo Professional on this computer while not connected to your network for the borrow period that you specified.
Chapter 3: Installing and Configuring MapInfo Professional
User Guide 105
Returning a Borrowed License
To return a borrowed license, you must reconnect the computer that is using the borrowed license to your network. If it is not connected, the Return borrowed license command will not be available.
To return a borrowed license:
1. Reconnect the computer to your network.
2. Open MapInfo Professional. A dialog box displays to tell you on what date the borrowed license is going to expire.
3. Click OK.
4. Choose Help > Licensing > Return borrowed license. The Return borrowed license to license server dialog box displays on the screen.
5. This dialog box explains how a license is returned. Click OK.
6. A MapInfo Activation message displays on the screen to tell you that the license has been returned to the license server.
7. Click OK.
Silent Installation Procedures for System AdministratorsSilent installations allow you to repackage MapInfo Professional for deployment within your company so your users do not have to enter user- or company-specific information, path information, Oracle or ODBC DLLs, a serial number, or an access code.
The MapInfo Professional installation setup.exe indicated in the steps below can be found on the installation CD (d:\) in this directory:
\Install\MI_PRO\DISK1
In general, the silent installation process goes like this:
1. Place the installation CD in the target computer’s disk drive.
2. From the command line on the target computer, type: "d:\Install\MI_PRO\DISK1\setup.exe /s /v"PARAMETERS"
where PARAMETERS are the parameters you set to populate the msiexec.
For example:"\Install\MI_PRO\DISK1\setup.exe /s /v"/qb INSTALLDIR=\"[PathTo]\MapInfo\OtherThanStandard\Professional 9.0\" USERNAME=\"MyUser\" COMPANYNAME=\"MyCompanyName\" PIDKEY=\"MySerialNumber\" ACCD=\"MyAccessCode\""
MapInfo Licensing and Activation
106 MapInfo Professional v. 9.0
For concurrent licenses the parameters for the license server name and license server port number must also be included:
1. Place the installation CD in the target computer’s disk drive.
2. From the command line on the target computer, type: "d:\Install\MI_PRO\DISK1\setup.exe /s /v"PARAMETERS"
where PARAMETERS are the parameters you set to populate the msiexec.
For example:"\Install\MI_PRO\DISK1\setup.exe /s /v"/qb INSTALLDIR=\"[PathTo]\MapInfo\OtherThanStandard\Professional 9.0\" USERNAME=\"MyUser\" COMPANYNAME=\"MyCompanyName\" PIDKEY=\"MySerialNumber\" ACCD="MyAccessCode" LSNAME=\"MyLicenseServerName\" LSPN=\"MyLicenseServerPortNumber\""
Look for the type of installation you want to perform from the options below and follow the corresponding instructions. In each of the install scenarios described below, the serial number and access code parameters are given in the following format:
• PIDKEY=MI##############• ACCD=######
Substitute the appropriate serial number and access code when you perform the silent install.
Completely Silent Install
To initiate a silent install:
1. Place the installation CD in the target computer’s disk drive.
2. From the command line on the target computer, type: "d:\Install\MI_PRO\DISK1\setup.exe" /s /v"/q PIDKEY=MI############## ACCD=######"
For concurrent licenses, the license server name and port number parameters must be included:
• LNAME="LicenseServerName"• LSPN="LicenseServerPortNumber"
Substitute the appropriate license server name and port number when you perform the silent install.
Silent Install with an Initial Dialog Box Only
To initiate a silent install where a single dialog box displays to initiate the installation:
1. Place the installation CD in the target computer’s disk drive.
2. From the command line on the target computer, type:
"d:\Install\MI_PRO\DISK1\setup.exe" /s /v"/qb PIDKEY=MI############## ACCD=######"

Chapter 3: Installing and Configuring MapInfo Professional
User Guide 107
For concurrent licenses, the license server name and port number parameters must be included:
• LNAME="LicenseServerName"• LSPN="LicenseServerPortNumber"
Substitute the appropriate license server name and port number when you perform the silent install.
Silent Install with Progress Bar Only
To initiate a silent install where the progress bar displays but users do not have to make entries:
1. Place the installation CD in the target computer’s disk drive.
2. From the command line on the target computer, type: "d:\Install\MI_PRO\DISK1\setup.exe" /s /v"/qb PIDKEY=\"MI##############\" USERNAME=\"FRED\" ACCD=\"######\" COMPANYNAME=\"My Company\" InstallDir=\"c:\Program Files\MapInfo\""
where you substitute the user’s username for FRED, the organization’s name for My Company, and the installation directory path for the c:\Program Files\MapInfo\ entry.
There are three caveats with this process:
• The user is prompted to reboot, if necessary
• The developer must populate the registration info with specific info
• The developer must specify the installation directory
Note: MIDLODBC.DLL or MIDLOCI.DLL are NOT installed using this case.
For concurrent licenses, the license server name and port number parameters must be included:
• LNAME="LicenseServerName"
• LSPN="LicenseServerPortNumber"
Substitute the appropriate license server name and port number when you perform the silent install.
Silent Install that Installs the Oracle Library List Only
To initiate a silent install that installs the Oracle DLL:
1. Place the installation CD in the target computer’s disk drive.
2. From the command line on the target computer, type: "d:\Install\MI_PRO\DISK1\setup.exe" /s /v"/q PIDKEY=MI############## ACCD=###### OCIDLL=TRUE"
Note: MIDLODBC.DLL is NOT installed using this case.
For concurrent licenses, the license server name and port number parameters must be included:
• LNAME="LicenseServerName"
• LSPN="LicenseServerPortNumber"
Substitute the appropriate license server name and port number when you perform the silent install.
MapInfo Licensing and Activation
108 MapInfo Professional v. 9.0
Silent Install that Installs Both the Oracle and ODBC Library Lists
To initiate a silent install that installs the Oracle and ODBC DLLs:
1. Place the installation CD in the target computer’s disk drive.
2. From the command line on the target computer, type: "d:\Install\MI_PRO\DISK1\setup.exe" /s /v"/q PIDKEY=MI############## ACCD=###### OCIDLL=TRUE ODBCDLL=TRUE"
For concurrent licenses, the license server name and port number parameters must be included:
• LNAME="LicenseServerName"
• LSPN="LicenseServerPortNumber"
Substitute the appropriate license server name and port number when you perform the silent install.
Silent Install that Installs the ODBC Library List Only
To initiate a silent install that installs the Oracle and ODBC DLLs:
1. Place the installation CD in the target computer’s disk drive.
2. From the command line on the target computer, type: "d:\Install\MI_PRO\DISK1\setup.exe" /s /v"/q PIDKEY=MI############## ACCD=###### ODBCDLL=TRUE"
Note: The MIDLOCIDLL is NOT installed using this case.
For concurrent licenses, the license server name and port number parameters must be included:
• LNAME="LicenseServerName"
• LSPN="LicenseServerPortNumber"
Substitute the appropriate license server name and port number when you perform the silent install.
Silent Install that Installs ArcLink
To initiate a silent install that installs ArcLink:
1. Place the installation CD in the target computer’s disk drive.
2. From the command line on the target computer, type: "d:\Install\MI_PRO\DISK1\setup.exe" /s /v"/q PIDKEY=MI############## ACCD=###### ADDARC=TRUE"
For concurrent licenses, the license server name and port number parameters must be included:
• LNAME="LicenseServerName"
• LSPN="LicenseServerPortNumber"
Substitute the appropriate license server name and port number when you perform the silent install.
Chapter 3: Installing and Configuring MapInfo Professional
User Guide 109
Silent Install with an Initial Dialog Box that Installs ArcLink
To initiate a silent install with an initial dialog box that installs ArcLink:
1. Place the installation CD in the target computer’s disk drive.
2. From the command line on the target computer, type: "d:\Install\MI_PRO\DISK1\setup.exe" /s /v"/qb PIDKEY=MI############## ACCD=###### ADDARC=TRUE"
This process runs the Smartupdate at end of installation. If you do not want the Smartupdate to run, type:
set RUNSU = FALSE
at the end of the command line.
For concurrent licenses, the license server name and port number parameters must be included:
• LNAME="LicenseServerName"
• LSPN="LicenseServerPortNumber"
Substitute the appropriate license server name and port number when you perform the silent install.
Installing Data To help you get started, MapInfo provides you with some United States-based and world-wide maps you can use as a background to your data. Use these instructions to install this free data.
To install the free data provided with MapInfo Professional:
1. Choose Install Products from the CD Browser.
2. Choose Free Data to display the MapInfo Professional Data screen. In this screen, you can also review the data specifications, access new data over the web and learn about what data is available from MapInfo Corporation.
3. Choose Install Free Data. The Welcome screen displays.
4. Choose Next to continue. The License Information screen displays.
5. Choose Yes to accept the terms of the agreement and to continue the installation process. The Choose Destination Location screen displays.
6. Select the product for which you will be installing the data and click Next to continue:
• MapInfo Professional
• MapInfo Run Time
7. Specify the directory where the data will be installed. Use the Browse button to select a directory if necessary or accept the default directory. Click Next to continue.
MapInfo Licensing and Activation
110 MapInfo Professional v. 9.0
8. Choose one of these options:
• Custom Install: Choose which datasets to install. Select the check box beside each dataset you want to install. The size of each dataset displays, as well as space required and space available.
To see the subcomponents of the data you selected, click Change.
• Typical Install: Install all datasets.
Choose Next to continue. Respond Yes to the “Would you like setup to display workspace Icons” prompt if you want to create an icon for each data set you choose.
9. The Select Program Folder screen displays if you chose to set up Workspace icons. Select the program folder where the icons will be created. Choose Next.
10. The Start Copying Files screen displays. Review the selections you have chosen and click Back to return to any screen to change your selections. When you are ready to begin the installation, click Next.
11. The Setup Complete dialog box displays; click Finish.
Getting More Data
To learn more about our data products, click the Get More Data option in the MapInfo Professional Data screen during the Data Installation process or click MapInfo Data Products on the Web in the Help Menu. If you have a Browser installed, you will be automatically connected to MapInfo Corporation’s web site, where we provide detailed information about MapInfo’s World Wide Data Products. We have over 350 data products to choose from—products that provide both reliable and current information.
Installing Related Programs, Hardware, and ResourcesThis section contains the instructions for installing the ECW Compressor, the Blue Marble GPS, and the documentation associated with MapInfo Professional. We also include information about the Microsoft IntelliMouse and how to use it.
Installing the ECW Compressor
The ECW raster handler allows you to open and display raster images compressed in the ECW format. We recommend that you exit all Windows programs before installing.
1. Choose Install Products from the MapInfo Professional 9.0 CD Browser.
2. Choose ECW Compressor. The Welcome screen displays. Choose Next to continue the installation process.
3. The Software License screen displays. Choose Yes to accept the terms of the agreement and to continue the installation process.
4. The Choose Destination Location screen displays. Specify the directory where ECW Compressor will be installed.
5. The Select Program Folder screen displays. Select a folder. Choose Next to continue.
Chapter 3: Installing and Configuring MapInfo Professional
User Guide 111
6. The Setup Complete screen displays: choose to display the ReadMe file and/or create a shortcut on your desktop. Choose Finish.
Using the Microsoft IntelliMouse™ to Move Around the Windows
MapInfo Professional 9.0 supports the Microsoft IntelliMouse™ as follows:
Document Scrolling: In the Map, Layout, Browser, and MapBasic windows, hold down the Ctrl key and move the wheel to scroll the document vertically; the effect is the same as clicking on the arrow at the end of the scroll bar.
Document Panning: In the Map and Browser windows, hold down the Wheel button on the IntelliMouse™ and move the mouse to pan the document. Release the button to end the panning. There are three panning speeds. The speed of the panning is based on the cursor’s distance from the starting point, indicated by the origin mark. In the Map window, the distance moved at each speed is a percentage of the zoom distance.
For example, the amount to move at slow speed is. 005 * ZoomDistance, medium speed is. 01 * ZoomDistance, and super speed is .1 * ZoomDistance. In the Browser, the window is scrolled by 1, 3, and 7 lines or columns for slow, medium and super speeds. When the cursor is within 15 pixels of the starting point, there is no panning.
AutoScroll: In the Map and Browser windows, click and release the Wheel button to activate AutoScroll. When the mouse cursor is moved away from the starting point the document starts to scroll in whatever direction you move the mouse. When the cursor is returned to the starting point, scrolling stops. AutoScroll is turned off by any mouse click or key stroke. AutoScroll is also turned off when MapInfo Professional loses the focus, for example, when you Alt-Tab to another application.
Zoom: In the Map and Layout windows, move the wheel forward to zoom in on the document. Roll back the mouse wheel to zoom out on the document. The wheel has a series of settings; each “click” is the same as one click with a zoom tool. The mouse wheel does not recenter the view. There are other keyboard commands that allow you to zoom in and out more precisely.
Installing Global Positioning Software (GPS)
To install Global Positioning Software from Blue Marble:
1. From the CD menu, click Install Products and then Free Utilities.
2. Click Install GPS Support. You will be prompted to exit all applications before installing. Choose OK.
3. The MapInfo Special Edition dialog box displays. Choose OK.
4. The Select Destination Location screen displays. Specify the directory where GPS will be installed.
5. The Software License screen displays. Choose YES to accept the terms of the agreement and to continue the installation process.
6. The Add to the Start Menu dialog box displays: click Yes to add a shortcut to the Start menu.
7. The ReadMe displays; choose OK to exit the ReadMe.
Modifying or Removing MapInfo Professional
112 MapInfo Professional v. 9.0
Installing the Online References
MapInfo Professional 9.0 provides the following online reference documents: MapInfo Professional Supplement, MapBasic Reference Guide, Crystal Reports User’s Guide, ArcLink, and EasyLoader documentation, as well as the Adobe Acrobat Reader. These documents are installed in the Documentation subfolder of your installation directory.
Note: If you have any questions about the use of the Acrobat Reader, contact Adobe support at www.Adobe.com.
Troubleshooting your InstallationThe Installer must be run from a drive with a letter such as G: and not from an explicit UNC path. For example, you might have the MapInfo Professional CD in your computer as USERSPC. Other users may share this device as USERSPC; however, it would not contain a drive letter. The MapInfo Professional Installation program requires a drive letter.
To remedy this situation, map your network drive to a specific drive letter:
1. In Windows Explorer, right-click the shared directory or CD-ROM that contains the MapInfo Professional SETUP.EXE and select Map Network Drive.
2. Choose a drive letter to map.
3. Run the Installation Program again from the newly mapped drive letter.
Modifying or Removing MapInfo ProfessionalUse the Program Maintenance feature of the CD Browser to modify, repair, or remove MapInfo Professional.
To access Program Maintenance:
1. Click Install Products from the MapInfo Professional CD Browser.
2. Click MapInfo Professional. The Welcome screen displays. Choose Next. The Program Maintenance screen displays.
3. Choose modify, repair, or remove MapInfo Professional based on your needs.
• Click Modify to display the Custom Setup dialog box.
• Click Repair to repair installation errors in the program.
• Click Remove to remove an existing copy of MapInfo Professional 9.0 from your system. The installer displays the Remove the Program dialog box. Click Remove to uninstall the product’s programs from your system.
You can also access the Program Maintenance screen from the Start menu by clicking Control Panel and then Add/Remove Programs and finally MapInfo Professional.
For information on node-locked license transfer options at uninstall, see Uninstall Transfer Options on page 101
Chapter 3: Installing and Configuring MapInfo Professional
User Guide 113
Controlling Advanced System Settings MapInfo Professional has some advanced system settings that cannot be configured through a dialog box. These settings allow you to control several low-level, technical aspects of how MapInfo Professional runs. Most users do not need to worry about these advanced settings.
For example, MapInfo Professional has a Dynamic Data Exchange (DDE) time-out setting, which controls how long MapInfo Professional tries to communicate with other applications during DDE communications. If you run a MapBasic application, and that application encounters time-out errors during DDE, you may want to increase the DDE time-out setting. To modify one of MapInfo Professional’s advanced system settings (such as the DDE time-out setting), use this procedure.
Modifying the Windows Registry
MapInfo Professional stores system settings in the Windows registry. To edit the Windows 2000 registry, use the REGEDT32 program.
CAUTION: Be very careful when editing the registry; damaging the registry can cause serious problems in your operating system.
For example, to set MapInfo Professional’s Dynamic Data Exchange (DDE) time-out setting, locate the following key in the registry:
HKEY_LOCAL_MACHINE\SOFTWARE\MapInfo\MapInfo\Common
Within that key, edit the DDeTimeout value. If there is no value by that name, create a new value of type string, and assign the name DDeTimeout to the value. Set the value’s data to be a number, representing the number of milliseconds (for example, enter 30000 to specify a time-out of 30 seconds). For more on editing the registry, see the online help for REGEDIT or REGEDT32.
Descriptions of Advanced Registry Settings
This section describes advanced settings that are stored in the registry.
DDeTimeout = numberThis setting controls MapInfo Professional’s time-out setting in DDE conversations where MapInfo Professional is the client (the application that initiates a conversation). The number represents milliseconds. The default value is 10,000 milliseconds (ten seconds). If you run a MapBasic application that attempts to initiate a DDE conversation, but the conversation fails because the server application does not respond within the time-out period, you may need to increase the DDeTimeout number.
OffscreenBitmap = numberThe number is 0 (zero) or 1 (one). A value of 1 (the default) indicates that MapInfo Professional will process off-screen bitmaps when drawing a map. This means that if you cover a Map window, and then bring the Map window to the front again, the map redraws instantly. If you set this setting to zero, MapInfo Professional will not process off-screen bitmaps. This means that when you bring a Map window to the front, MapInfo Professional will redraw the map. If you are using a video driver that is problematic, and encounter video problems with Map windows, you may eliminate those problems by setting the OffscreenBitmap number to 0.
Modifying or Removing MapInfo Professional
114 MapInfo Professional v. 9.0
MaxFiles = numberThis setting must be an integer from 10 to 100, indicating how many files MapInfo Professional can open simultaneously. This setting does not limit the number of tables you can open, but it does limit the number of tables you can edit at one time (the number of tables that have unsaved edits). The default value is 29. If you need to work with more files simultaneously, set number to 100.
MaxORACLETILES = numberA value from 0 = unlimited tiles to infinity.
Improving Performance for MapInfo Professional
To improve MapInfo Professional’s performance, you can increase the speed of the processor in the machine. A video accelerator card will increase the speed of the redraw. It will not speed up the initial draw of the map, but all subsequent redraws will be faster. A faster disk cache will also improve performance, as will adding memory.
Controlling the Location of Application Data Files During Installation By default, the setup program for MapInfo Professional installs application data files to locations that make sense for the typical user. After installing the product, the user is free to move one or more of the application data files to another predefined location and MapInfo Professional will find that file. For example, the administrator of a machine might move MAPINFOW.PEN from the per user area (its default location) into the install directory so all users on that machine will share the same set of pens. For IT personnel responsible for a large number of MapInfo Professional installs it is not practical to manually move application data files to realize the desired configuration.
To solve this problem, create a setting file, MODE.INI, to specify the location of application data files prior to installing MapInfo Professional.
1. Copy the installation files to a read-write location.
2. Create a MODE.INI file in the root directory of the installer.
3. Open MODE.INI into any text editor.
4. Edit MODE.INI, modifying the code associated with the application data file/folder whose location you wish to change.
5. Install MapInfo Professional.
The following is a list of predefined locations for application data files supported by MapInfo Professional, and the corresponding numeric code to be used in MODE.INI.
Code Description Location
1 per user, roaming <Current User>\Application Data
2 per user, not roaming <Current User>\Local Settings\Application Data
3 per machine <All Users>\Application Data
4 program directory <Install Dir>
Chapter 3: Installing and Configuring MapInfo Professional
User Guide 115
The following is a list of application data files/groups and their default locations:
MODE. INI File Example
Create a text file with the following syntax:
GraphSupport = 3CustSymb = 1ThmTmplt = 1MAPINFOW.CLR = 1MAPINFOW.FNT = 1MAPINFOW.PEN = 1MAPINFOW.ABB = 4MAPINFOW.PRJ = 4MAPINFOW.MNU = 4
Removing MapInfo Professional from your System using Control Panel Remove MapInfo Professional by accessing the CD Browser, Program Maintenance screen, or by choosing the Add/Remove Programs option in the Control Panel in Windows 2000 or Windows XP.
• For more information, see Removing MapInfo Professional from your System using the CD Browser in the Help System.
Filename Default Location
MAPINFOW.CLR per user, roaming
MAPINFOW.PEN per user, roaming
MAPINFOW.FNT per user, roaming
MAPINFOW.ABB program directory
MAPINFOW.PRJ program directory
MAPINFOW.MNU program directory
CustSymb per user, roaming
ThmTmplt per user, roaming
GraphSupport per machine
Configuring the MapInfo Professional Preferences
116 MapInfo Professional v. 9.0
Configuring the MapInfo Professional PreferencesPreferences allow you to change a number of default settings, enabling you to customize certain aspects of the program’s behavior. Preference files are stored on a per-user basis. As you gain experience with MapInfo Professional®, you will probably want to change some of these settings. This chapter discusses the various preferences and what they control.
Here is a brief description of the preference categories:
System Settings – Controls what information is copied to the clipboard, color defaults, aspect ratio, paper and layout units, the number of Undo objects permitted, how symbol types used prior to version 4.0 are drawn, and how MapInfo Professional handles 2-digit years.
Map Window – Sets the default Map window options; moving duplicate nodes; snap tolerance; units for distance and area; display of scroll bars in the Map window; display of degrees in either decimal or degrees, minutes, seconds form; and the display of InfoTips.
Layout Window - Sets the Layout window preferences to display Rulers, Page Breaks, and to determine the display options of frame contents.
Legend Window – Sets the legend frame default settings.
Startup – Controls whether the program saves the MAPINFOW.WOR upon exiting and loads it upon start up; whether queries are saved in workspaces; and the display of the Quick Start dialog box upon startup.
Address Matching – Controls the house number placement when specifying street addresses.
Directories – Specifies default directories for opening and saving tables, workspaces, MapBasic programs, import files, ODBC SQL queries, theme templates, graph support files, saved queries, new grids, and Crystal Report files. Also specifies the directories MapInfo Professional searches for tables without fully qualified paths referenced in workspaces or MapBasic programs.
Output Settings – Controls the on-screen display of a raster file, the printer output, and exporting choices.
Printer – Controls which printer information is used for all new windows. This printer can be the Windows default printer, or a printer you designate as your MapInfo Preferred printer. This choice can be overridden on a per window basis using either the Print or Page Setup dialog boxes.
Styles – Sets the default object styles for region, line, symbol, and text objects.
Web Services – Sets refresh, timeout values, server options and other default settings for Proxy Servers, WMS, WFS, Geocode Servers, and Drivetime server web services.
Image Processing - Sets the rules for raster reprojection allowing you to choose whether reprojection is allowed, when, and allows you to select resampling options.
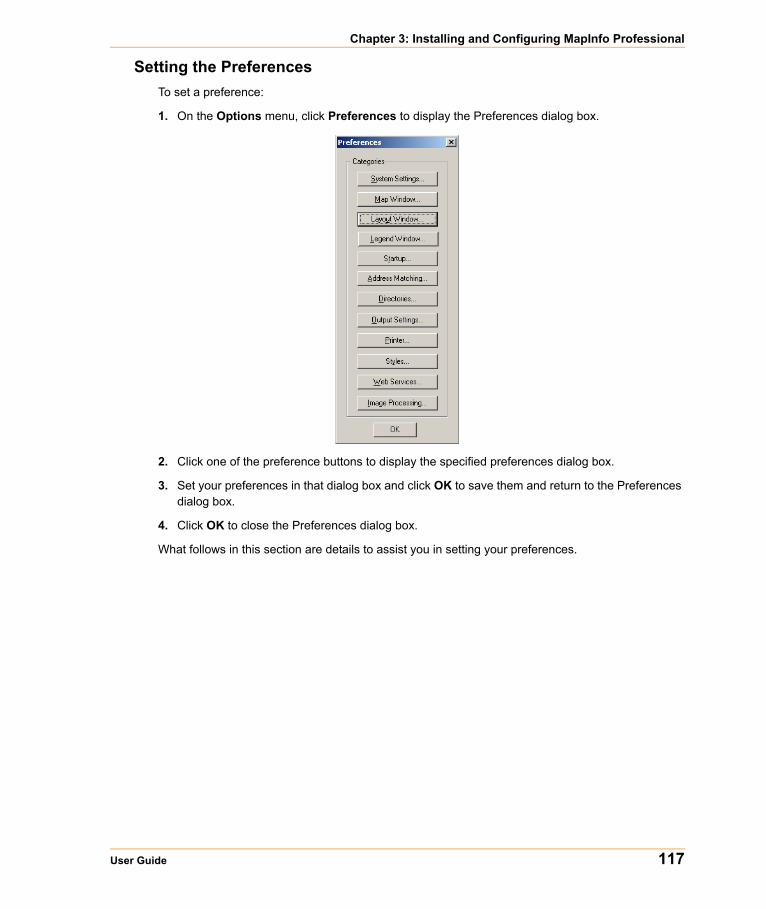
Chapter 3: Installing and Configuring MapInfo Professional
User Guide 117
Setting the PreferencesTo set a preference:
1. On the Options menu, click Preferences to display the Preferences dialog box.
2. Click one of the preference buttons to display the specified preferences dialog box.
3. Set your preferences in that dialog box and click OK to save them and return to the Preferences dialog box.
4. Click OK to close the Preferences dialog box.
What follows in this section are details to assist you in setting your preferences.
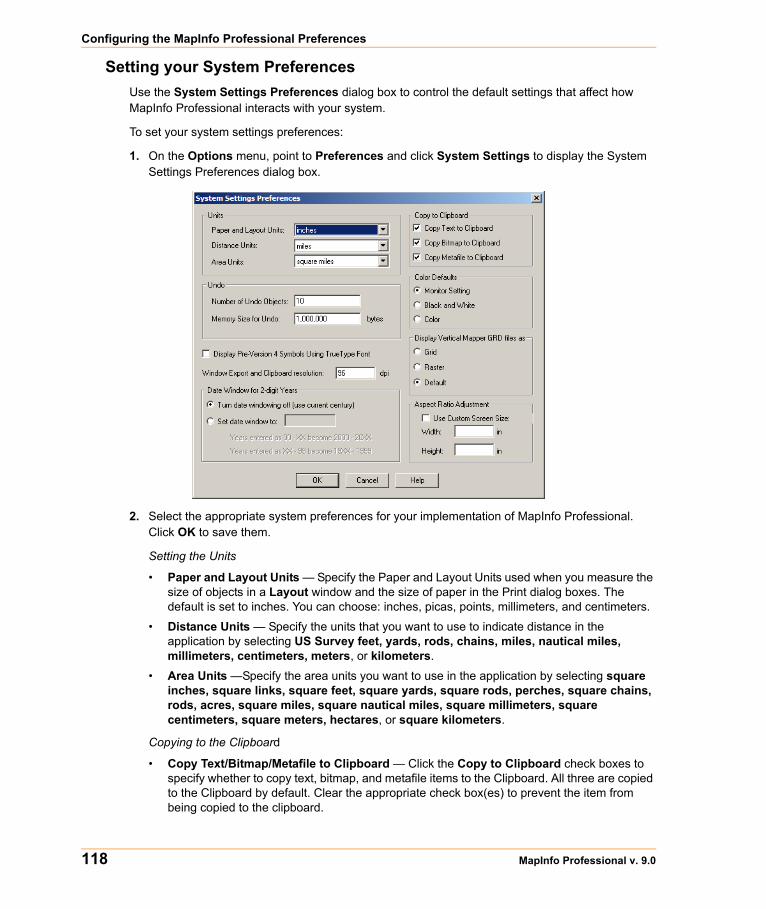
Configuring the MapInfo Professional Preferences
118 MapInfo Professional v. 9.0
Setting your System Preferences Use the System Settings Preferences dialog box to control the default settings that affect how MapInfo Professional interacts with your system.
To set your system settings preferences:
1. On the Options menu, point to Preferences and click System Settings to display the System Settings Preferences dialog box.
2. Select the appropriate system preferences for your implementation of MapInfo Professional. Click OK to save them.
Setting the Units
• Paper and Layout Units — Specify the Paper and Layout Units used when you measure the size of objects in a Layout window and the size of paper in the Print dialog boxes. The default is set to inches. You can choose: inches, picas, points, millimeters, and centimeters.
• Distance Units — Specify the units that you want to use to indicate distance in the application by selecting US Survey feet, yards, rods, chains, miles, nautical miles, millimeters, centimeters, meters, or kilometers.
• Area Units —Specify the area units you want to use in the application by selecting square inches, square links, square feet, square yards, square rods, perches, square chains, rods, acres, square miles, square nautical miles, square millimeters, square centimeters, square meters, hectares, or square kilometers.
Copying to the Clipboard
• Copy Text/Bitmap/Metafile to Clipboard — Click the Copy to Clipboard check boxes to specify whether to copy text, bitmap, and metafile items to the Clipboard. All three are copied to the Clipboard by default. Clear the appropriate check box(es) to prevent the item from being copied to the clipboard.
Chapter 3: Installing and Configuring MapInfo Professional
User Guide 119
Setting the Undo Options
• Number of Objects — You can only undo the last action. Set this option to the number of objects in the last action you want the system to undo. For example, if you moved 10 objects at the same time and enter 10 in this field, MapInfo Professional restores all 10.
Note: You cannot use the Undo capability for the following operations: Revert, Save, Save As, or Modify Table, or any operations whose effects are primarily cosmetic.
The default is 10 objects. You can set it from 0 to 800. Setting the number of objects to 0 deactivates the system. After you use the Undo option, the system toggles to Redo.
• Memory Size for Undo — Type the number of bytes of memory you want to set aside for the Undo feature. This entry is set to 1,000,000 bytes by default. You can enter up to 10,000,000 bytes into this field. Increasing this entry may result in slower response time.
Setting the Color Defaults
Select one of the Color Defaults preferences described below to control how MapInfo Professional shades thematic map layers.
• By default, Monitor Setting is selected. MapInfo Professional uses the color settings of the monitor to shade the map when this option is selected.
• Click the Black & White radio button if you are using a color monitor and want to shade your thematic map in gray-scale.
• Click the Color radio button if you are using a black and white monitor and want to print a thematic map in color on a color printer.
Display Pre-Version 4 Symbols using the True Type font — Select this check box to indicate how you want to draw symbols from early versions of MapInfo Professional (before 4.0). Select this check box to draw vector symbols with characters from the MapInfo Professional Symbols font. By default, vector symbols are drawn.
Window Export and Clipboard Resolution — To set the image resolution for exporting and Clipboard purposes, type the resolution in this field. MapInfo Professional uses this preference whenever you copy windows to the Clipboard, export your work to metafile and raster formats and the Save Window As export process as well. If you do not set this resolution manually, the product assumes 96 DPI. The maximum setting for this field is 1200 DPI.
Display Vertical Mapper grd files as — Use this option to determine how to display Vertical Mapper GRD files within MapInfo Professional. These options allow you to display your Vertical Mapper GRD maps as grid files and not as raster files. Vertical Mapper creates GRD\TAB files that display using the raster handler. This preference contains a Grid option, so that Vertical Mapper grid files use the Info tool and displays file information in 3D windows.
• Click Grid to display GRD files as grid files and get the added support of the MapInfo Professional toolbar features.
• Click Raster to display the GRD files as raster images.
• Click Default to treat the GRD files as rasters or grids depending on existence of the Rasterstyle 6 1 code in the TAB file. If the code does not exist, the file opens as a raster file, if the code does exist, the file opens as a grid file.
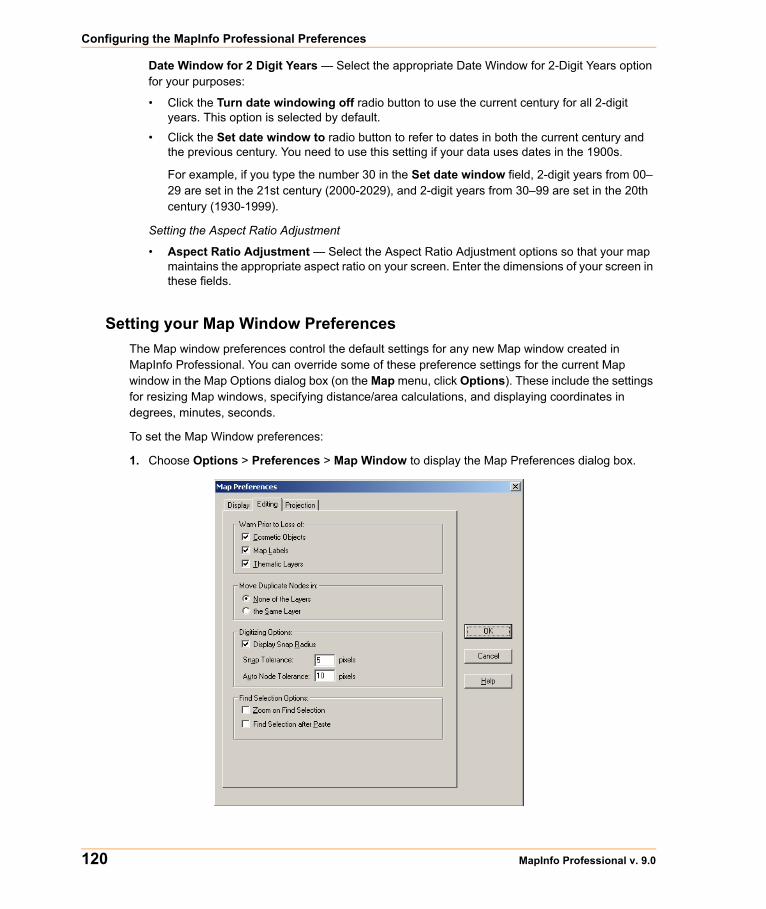
Configuring the MapInfo Professional Preferences
120 MapInfo Professional v. 9.0
Date Window for 2 Digit Years — Select the appropriate Date Window for 2-Digit Years option for your purposes:
• Click the Turn date windowing off radio button to use the current century for all 2-digit years. This option is selected by default.
• Click the Set date window to radio button to refer to dates in both the current century and the previous century. You need to use this setting if your data uses dates in the 1900s.
For example, if you type the number 30 in the Set date window field, 2-digit years from 00–29 are set in the 21st century (2000-2029), and 2-digit years from 30–99 are set in the 20th century (1930-1999).
Setting the Aspect Ratio Adjustment
• Aspect Ratio Adjustment — Select the Aspect Ratio Adjustment options so that your map maintains the appropriate aspect ratio on your screen. Enter the dimensions of your screen in these fields.
Setting your Map Window Preferences The Map window preferences control the default settings for any new Map window created in MapInfo Professional. You can override some of these preference settings for the current Map window in the Map Options dialog box (on the Map menu, click Options). These include the settings for resizing Map windows, specifying distance/area calculations, and displaying coordinates in degrees, minutes, seconds.
To set the Map Window preferences:
1. Choose Options > Preferences > Map Window to display the Map Preferences dialog box.
Chapter 3: Installing and Configuring MapInfo Professional
User Guide 121
2. In the Display tab, select from these options:• Set the When Resizing Map Window options to control the default behavior of Map windows
when you resize them. Select one of these options:
• Click the Fit Map to New Window to draw the map to fit the resized window. You see the same view of the map that you saw before you resized the window. This is the default setting.
• Click the Preserve Current Scale button to change the view of the map when the Map window is resized. As you shrink or enlarge the window, you will see a smaller or larger area of the map.
This setting does not affect Map windows that are already open. To override the preference settings for the currently open Map window, make different selections in the Map Options dialog box.
• Select the Apply Clip Region Using settings to specify how you want the product to clip regions. Select one of these three choices:
• Windows Device Clipping (all objects) – The clipping is controlled by the Windows Device Display. All objects (including points, labels, text, raster and grid images) will be clipped at the Clip Region boundary. This is the default setting.
• Windows Device Clipping (no points, text) – Use this method to emulate the Erase Outside clipping method. All objects are clipped using Erase Outside except points and labels. Points and labels will be completely displayed only if the point or label point lies inside the Clip Region object. Text objects, raster files, and grid files always display and are never clipped.
• Erase Outside (no points, text) – This method uses the Erase Outside functionality. The Clip Region object is the Cutter object, and all other objects are Target objects for this operation. All objects are clipped using Erase Outside, excepts points and labels. In addition, points and labels will be completely displayed only if the point or label point lie inside the Clip Region object. Text objects always display and are never clipped.
• Other display options include
• Scrollbars — To display scrollbars, select the Scroll Bars check box. By default, MapInfo Professional does not display scrollbars in Map windows.
• Autoscroll — To scroll the layout automatically, select the Autoscroll check box.
• Show InfoTips — To display one or two word tips when you cursor over a button, select the InfoTips check box. By default, MapInfo Professional displays InfoTips. Clear the Show InfoTips check box to deactivate their display.
• Show ToolTips in Layer Control Dialog — To display detailed layer information in the Layer Control dialog box, select this check box. If you do not want to see this level of detail, clear this check box.
• Automatic Raster Zoom Layering — To choose the default mode for automatic zoom layering for raster layers, select this check box. Raster zoom layering is turned on by default.
• Automatic Grid Zoom Layering — To choose the default mode for automatic grid zoom layering when adding a grid layer to the map, select this check box. Automatic Grid Zoom Layering is turned off by default.
• Use Cartographic Scale — To display your maps in Cartographic Scale automatically. When you make this change, the options that display in the Change View, Map Print Options and Frame Object dialog boxes use the cartographic scale on which the selected map is based and a scale indicator displays in the Status Bar.
• Draw Layers Under Themes — This option sets the default behavior for the Replace Layer Style check box in both the Ranges and Individual Value Theme dialog boxes. Select this
Configuring the MapInfo Professional Preferences
122 MapInfo Professional v. 9.0
check box to clear the Replace Layer Style check box by default. Clear this check box to select the Replace Layer Style check box by default.
• Automatically Open Default Theme — This option saves the theme to the table’s metadata so that the theme displays each time you open the table. This check box is cleared by default.
• Enable Hardware Acceleration for 3DMap Windows — Select this check box to use your video card acceleration capability to display 3DMaps. Clear the box to display the 3DMap without using your video card acceleration capability. Turning the acceleration off reduces performance, but it avoids failure with certain graphic adapters and drivers.
• Handler for New Grids — Select the output grid file format. By default, MapInfo Professional uses the MapInfo Professional handler (*.MIG). The available formats depend on which grid handlers are installed. When you change the grid file format, the file extension on the grid file name changes to reflect the selected format.
3. In the Editing tab, select from these options:• Set the Warn Prior to Loss options to display warning messages before you leave the currently
open map window and lose cosmetic objects, map labels, and thematic layers you have created. After the warning, you can save these objects, labels and layers as part of a table or workspace. These boxes are selected by default.
You can turn off the display of these warning messages by clearing the desired check boxes from the Warn Prior to Loss of group.
• Select the Move Duplicate Nodes in settings to specify whether MapInfo Professional will move duplicate nodes when you use the Reshape command (on the Edit menu, click Reshape) to edit objects that are adjacent to each other, such as regions. Select one of these options:
• Select the None of the Layers button to prohibit the product from moving duplicate nodes. This is the default setting
• Select the Same Layer button to move duplicate nodes that are in the same layer when one of the connected nodes is moved.
• Digitizing Options include:
• Display Snap Radius — Select this option to set the Snap Tolerance and Auto Node Tolerance to make the snap radius larger or smaller. If you clear the Display Snap Radius option, the radius does not display when the snap mode is turned on.
Type the appropriate Snap Tolerance and Auto Node Tolerance settings to specify the default tolerance in pixels within which Snap to node and Auto Node features operate. You use these settings when you draw objects (click the S key to turn Snap to node on). The default is 5 pixels. Enter a smaller value to obtain a tighter tolerance, and avoid snapping to other objects’ nodes as you draw. Enter a larger value to obtain a looser tolerance, when you want to snap to a node even though you are relatively far away from it.
For more information about Snap Tolerance, see Using “Snap To” to Select Nodes and Centroids in the Help System.
• Find Selection Options include:
• Zoom on Find Selection — Select this option to zoom to the selection each time you perform a Find Selection for single and multiple objects. Clear this check box to prevent zooming when performing a Find Selection.
• Find Selection after Paste — Select this option to turn on the Find Selection feature in the Map window only after you Paste an object. If you have an active Browser, and the selection
Chapter 3: Installing and Configuring MapInfo Professional
User Guide 123
is in that Browser window, the browser still scrolls to the selection. Clear this check box to prevent zooming after pasting an object.
4. In the Projection tab, select from these options:
• Table Projection — To set the default projections for the current map, designate a default table projection for creating new tables, importing GML 2.1, MIF, MBI, and IMG files, and for Choose Projection options in dialog boxes.
Note: You can override the table projection defaults by accessing the Choose Projection button throughout MapInfo Professional except when you use the Universal Translator, ArcLink, or when you import DXF files.
• Session Projection — To set the option to designate a default MapBasic projection for returning coordinate values using a MapBasic window or Update Column. Compiled MapBasic applications are not affected by this preference.
• To change the format in which coordinates display, select one of the options in the Display Coordinates group. You can select only one:
• Decimal Degrees — By default, MapInfo Professional displays coordinates in decimal degrees. MapInfo Professional displays coordinates of objects in the Object Info dialog boxes, and of the cursor location in the status bar if that display option is selected.
• Degrees, minutes, seconds — Choose this option to display your Map using the degree, minute, seconds format.
• Military Grid Reference System — Choose this option to display your Map using the Military Grid Reference System format. Coordinates are converted to the Military Grid Reference System format using the World Geodetic System (WGS) of 1984 Ellipsoid.
To override this preference in individual maps, use the Map Options dialog box (on the Map menu, click Options). Overrides to the default coordinate setting will be saved to your workspace.
Selected in either the Map window preferences or the Map Options dialog boxes, the format will display in the status bar, but not in the Object Info dialog boxes. If you display any Object Info dialog box for an object on a map that uses the Military Grid Reference System, the coordinates will be displayed in decimal degrees.
5. Select the Distance/Area using settings to specify the default type of distance/area calculation that MapInfo Professional uses for new Map windows.
• Spherical — The Spherical calculations measure distance according to the curved surface of the Earth. Spherical is the default. The data is first converted to Latitude/Longitude and then a calculation is produced. Lat/Long data will always use spherical calculations.
• Cartesian — The Cartesian method performs calculations on data projected onto a flat plane. Cartesian coordinates (x,y) define the position of a point in two-dimensional space by its perpendicular projection onto two axes which are at right angles to each other. Long/Lat projections cannot use Cartesian calculations.
Note: To specify a calculation method for the currently active Map window, use the Map Options dialog box (on the Map menu, click Options).
6. Click OK to save these settings and return to the Preferences dialog box.
7. Click OK to close the Preferences dialog box.
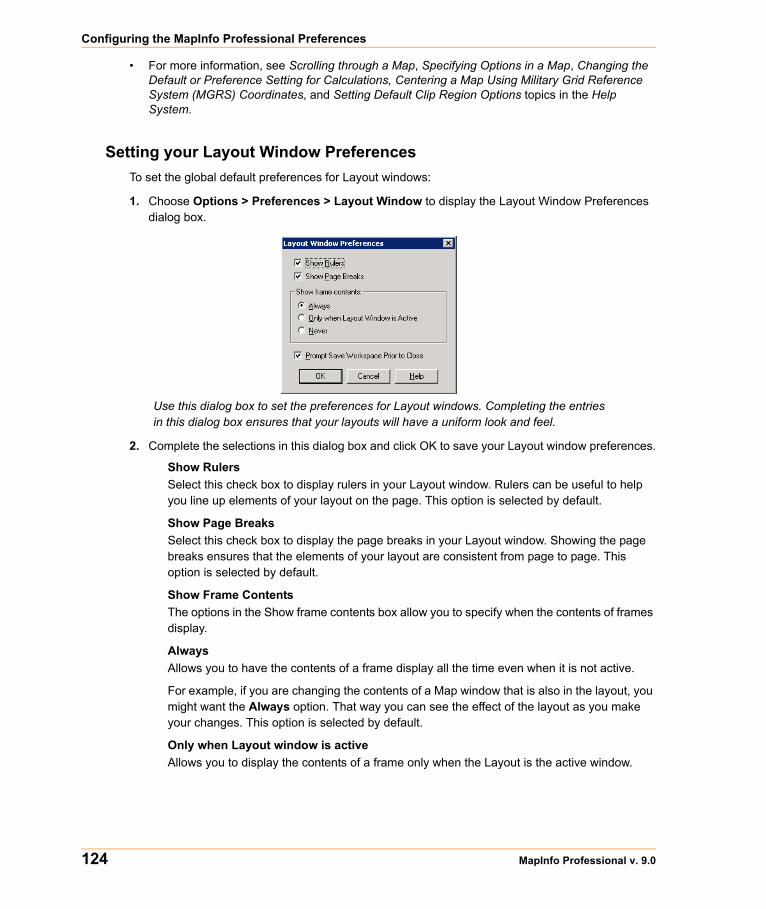
Configuring the MapInfo Professional Preferences
124 MapInfo Professional v. 9.0
• For more information, see Scrolling through a Map, Specifying Options in a Map, Changing the Default or Preference Setting for Calculations, Centering a Map Using Military Grid Reference System (MGRS) Coordinates, and Setting Default Clip Region Options topics in the Help System.
Setting your Layout Window PreferencesTo set the global default preferences for Layout windows:
1. Choose Options > Preferences > Layout Window to display the Layout Window Preferences dialog box.
Use this dialog box to set the preferences for Layout windows. Completing the entries in this dialog box ensures that your layouts will have a uniform look and feel.
2. Complete the selections in this dialog box and click OK to save your Layout window preferences.
Show RulersSelect this check box to display rulers in your Layout window. Rulers can be useful to help you line up elements of your layout on the page. This option is selected by default.
Show Page BreaksSelect this check box to display the page breaks in your Layout window. Showing the page breaks ensures that the elements of your layout are consistent from page to page. This option is selected by default.
Show Frame ContentsThe options in the Show frame contents box allow you to specify when the contents of frames display.
AlwaysAllows you to have the contents of a frame display all the time even when it is not active.
For example, if you are changing the contents of a Map window that is also in the layout, you might want the Always option. That way you can see the effect of the layout as you make your changes. This option is selected by default.
Only when Layout window is activeAllows you to display the contents of a frame only when the Layout is the active window.

Chapter 3: Installing and Configuring MapInfo Professional
User Guide 125
NeverAllows you to display only the file name and frame type, even when the Layout is the active window. For example, choose Never when you are resizing and repositioning frames. That way the contents of each frame will not redraw every time you make a change.
Prompt to Save Workspace Prior to CloseWhen this check box is selected, MapInfo Professional prompts you to save before you close windows with layout changes. Clear this check box if you do not want to be prompted to save your changes. This option is selected by default to prevent accidental loss of information.
Note: The prompt only displays if there are changes to the open Layout and Legend windows or when the Layout and Legend windows are new.
3. Click OK to save your preference.
Once you set these preferences, MapInfo Professional sets these options automatically whenever you create a new Layout window. To reset these options for a particular layer locally, select Layout > Options to display the Layout Display Options dialog box. This dialog box also allows you to set height and width restrictions and an autoscroll option.
Setting your Legend Window PreferencesThese settings control the defaults for how titles are specified for all legend frames in the legend window, as well as the default text style attributes such as font and size. The settings correspond to the settings displayed in Step 2 of the legend wizard. MapInfo Professional uses these defaults if there are no metadata keys in the table on which the legend frame is based. If metadata keys are present, the metadata defaults override the settings in Step 2 of the wizard and the Legend Preferences.
To set the Legend window preferences:
1. On the Options menu, point to Preferences and click Legend Window to display the Legend window preferences.
2. Use the options in this window to set the Legend Frame Defaults.
• To set the Title Pattern, type the text that you want to display at the top of each legend frame in this box.
Configuring the MapInfo Professional Preferences
126 MapInfo Professional v. 9.0
By default, the Title Pattern is “# Legend”, where ‘#’ is the name of the layer on which the frame is based. So, if the frame is based on the States layer, the default pattern title would be “States Legend.” You can change this pattern to “Legend of #” or simply “#.” To have no default pattern, leave the box blank.
Choose a title pattern default that suits your needs. The # character can be used in any of the pattern text boxes as a shortcut key for the layer name.
• To set the Subtitle Pattern, type the subtitle text you want in this box. The entry in this box is blank by default, but you can set your own default title pattern for subtitles.
• To set the Style Name Pattern, type the text you want to display beside each symbol in this box. The default pattern is the ‘%’ character. The Style Name is the text that describes each symbol in a legend frame. The % character is used as a placeholder for the type of object the legend symbol corresponds to: point, line, or region.
You can type in your own default Style Name Pattern, either using the % character or not. For example, in a legend frame based on the States layer, a Style Name Pattern that reads “% of #” will display as “Region of States” next to the symbol in the legend. The % character can only be used in the Style Name Pattern box.
• To set the Border Style, select this check box to place a border around the legend and select the appropriate style by clicking the Border Style button.
3. To change the defaults of the style attributes for the titles, the style name, or the legend frame border, click the desired style box to display the corresponding style dialog box and make your changes.
4. Click OK to save these settings and return to the Preferences dialog box.
5. Click OK to close the Preferences dialog box.
Text Box Size Limits
MapInfo Layout or Mapper windows can contain a maximum of 2047 characters. Text object rotation is restricted to under 256 bytes. Y are restricted to 256 bytes.
Setting the Startup Preferences In general, the Startup preferences control:
• How MapInfo Professional behaves when you startup• The MAPINFOW.WOR workspace properties such as whether printer information and queries
are saved to workspaces
Chapter 3: Installing and Configuring MapInfo Professional
User Guide 127
To set your startup preferences for MapInfo Professional:
1. On the Options menu, point to Preferences and click Startup to display the startup preferences.
.
2. Select the following boxes to enable the indicated functionality; clear the check box to disable this functionality. You may select all that apply.
• Save MAPINFOW.WOR when Exiting MapInfo — Select this check box to save your setup to the MAPINFOW.WOR workspace when you exit MapInfo Professional. When you clear this check box, MapInfo Professional does not save the MAPINFOW.WOR unless you save it explicitly.
• Load MAPINFOW.WOR when Starting MapInfo — Select this check box to display MAPINFOW.WOR when you enter MapInfo Professional.
Note: To enable this check box, you must clear the Display Quick Start Dialog check box.
• Save Queries in Workspaces — Select this check box to save the queries you create during a mapping session in the workspace. If you do not select this check box and the selected map has only one layer based on a query, the query is not saved and the application writes a map definition with an empty layer list. MapInfo Professional cannot support subselects in queries. The operators Any and All are not supported in the MapXtreme 2004 versions of MapInfo SQL and, therefore, subselects are not supported either.
Note: MapInfo Professional cannot map selections with Group Bys, so Group By clauses are ignored. MapInfo Professional only translates the Order By clause.
• Save Printer Information into Workspaces — Select this check box to save the printer information in the workspace.
This check box saves the printer name, paper orientation, paper size, and the number of copies from your printer settings into the workspace. This also includes any overrides you might have made to the default printer settings in the Printer preferences. We recommend that you leave this preference on.
• Restore Printer Information to Workspaces — Select this check box to restore printer information from a workspace. When you open the workspace, the printer name, paper orientation, paper size, and the number of copies are restored. This is useful if you are
Configuring the MapInfo Professional Preferences
128 MapInfo Professional v. 9.0
sharing workspaces with other MapInfo Professional (6.0 or later) users who are also using the same printers.
Note: If this preference is turned off, or if the printer indicated is not available, the printer settings for the workspace revert back to the default printer set in the Printer preferences.
• DBMS Connection — Select this check box to save a default DBMS Connection, specify a DBMS connection that will be opened each time you begin a MapInfo Professional session. Click Set to set this connection.
• Display Quick Start Dialog — Select this check box to display the Quick Start dialog box automatically when you start MapInfo Professional. This check box is selected by default. Clear the Display Quick Start Dialog check box to prevent it from displaying when you start subsequent MapInfo sessions.
3. Click OK to save these settings and return to the Preferences dialog box.
4. Click OK to close the Preferences dialog box.
To set default DBMS Connections, see Setting up your Database Connection Preferences in the Help System.
Creating a Startup Workspace
STARTUP.WOR is the name you give to a workspace from which MapInfo Professional is run. You can create it so that MapInfo Professional automatically opens various tables and windows on startup. When you use STARTUP.WOR, MapInfo Professional performs the startup actions regardless of what you did in your previous MapInfo Professional session or how you have set preferences for MAPINFO.WOR.
To create a workspace:
1. Open the tables and windows you want in your workspace. Size and position them as you please.
2. Choose File > Save Workspace.
3. Name your workspace “Startup” and save the workspace into your “home” directory. By “home” directory we mean your private Windows directory.
When you run MapInfo Professional, MapInfo Professional does the following in the order shown:
• If there is a STARTUP.WOR in the MapInfo Professional program directory, it is run.• Then, if there is a STARTUP.WOR in your home directory it is run. (When there is a
STARTUP.WOR in both the MapInfo Professional program directory and your home directory, both will= run.)
• Then, if any file names are given on the command line—or if you double-click a document, MapInfo Professional loads those files. MapInfo Professional support adding workspaces (.WOR), running applications (.APP), and opening databases (.TAB) on the command line.
• Only if MapInfo Professional did not add a workspace or run a program from the command line does it then check the AutoLoad preference and load MAPINFOW.WOR from the user's home directory. When the preference is set, and the file is found, it is loaded. Note that if we had a workspace or application on the command line, we skip the AutoLoad.
• Finally, if MapInfo Professional didn't load a workspace or run an application from the command line, and it didn't AutoLoad MAPINFOW.WOR, then MapInfo Professional shows the Tool palette.
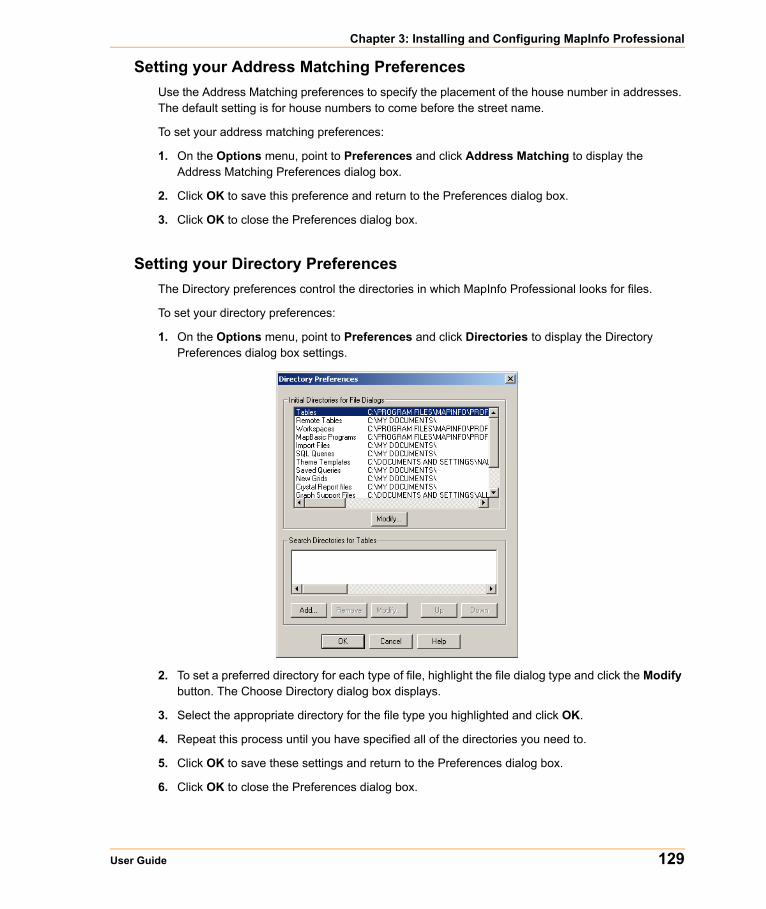
Chapter 3: Installing and Configuring MapInfo Professional
User Guide 129
Setting your Address Matching PreferencesUse the Address Matching preferences to specify the placement of the house number in addresses. The default setting is for house numbers to come before the street name.
To set your address matching preferences:
1. On the Options menu, point to Preferences and click Address Matching to display the Address Matching Preferences dialog box.
2. Click OK to save this preference and return to the Preferences dialog box.
3. Click OK to close the Preferences dialog box.
Setting your Directory PreferencesThe Directory preferences control the directories in which MapInfo Professional looks for files.
To set your directory preferences:
1. On the Options menu, point to Preferences and click Directories to display the Directory Preferences dialog box settings.
2. To set a preferred directory for each type of file, highlight the file dialog type and click the Modify button. The Choose Directory dialog box displays.
3. Select the appropriate directory for the file type you highlighted and click OK.
4. Repeat this process until you have specified all of the directories you need to.
5. Click OK to save these settings and return to the Preferences dialog box.
6. Click OK to close the Preferences dialog box.
Configuring the MapInfo Professional Preferences
130 MapInfo Professional v. 9.0
Use this setting to specify the default directories that display in the File menu dialog boxes when you open or save different files. You can specify directories for:
• Tables
• Remote tables
• Workspaces
• MapBasic programs
• Import files
• DBMS SQL queries
• Theme templates
• Saved queries
• New grids
• Crystal Report files
• Graph support files
• Shapefile tables
When you click Open, you can select an icon from the MapInfo Places Bar. Click the Workspace Directory icon to display the workspace directory you designated in this preference.
Additionally, use this preference to search for raster and grid tables. If you open a *.tab file for a raster or grid image and the image file cannot be found an attempt is made to find the image in the same location as the .TAB. If the image file is not found, it will then use the Search Directories.
Use the Search Directories for Tables and Workspaces to specify search paths that MapInfo will use to look for tables referenced in workspaces or MapBasic programs that do not have fully qualified paths.
To search directories for tables and workspaces:
1. To specify a search path, in Search Directories for Tables group, click Add.
Note: You can use the Add and Remove buttons to add or remove paths from the list.
2. Specify a drive and directory in the Choose Directory dialog box and click OK.
You can set up to four paths. Use the Up and Down keys to change the search order.
3. Click OK to save these settings and return to the Preferences dialog box.
4. Click OK to close the Preferences dialog box.• For more information see Choosing the Directories in the Place Bar in the Help System.
Setting your Output Setting PreferencesThe Output Settings allow you to control raster and grid file color settings for on-screen display, printed output, and file export settings. In addition, you can also specify how you want to handle transparency in vector and raster files in both your printed output and exported files. Other printer settings enable you to specify an output method, map scaling, and whether to print a border around a Map window.
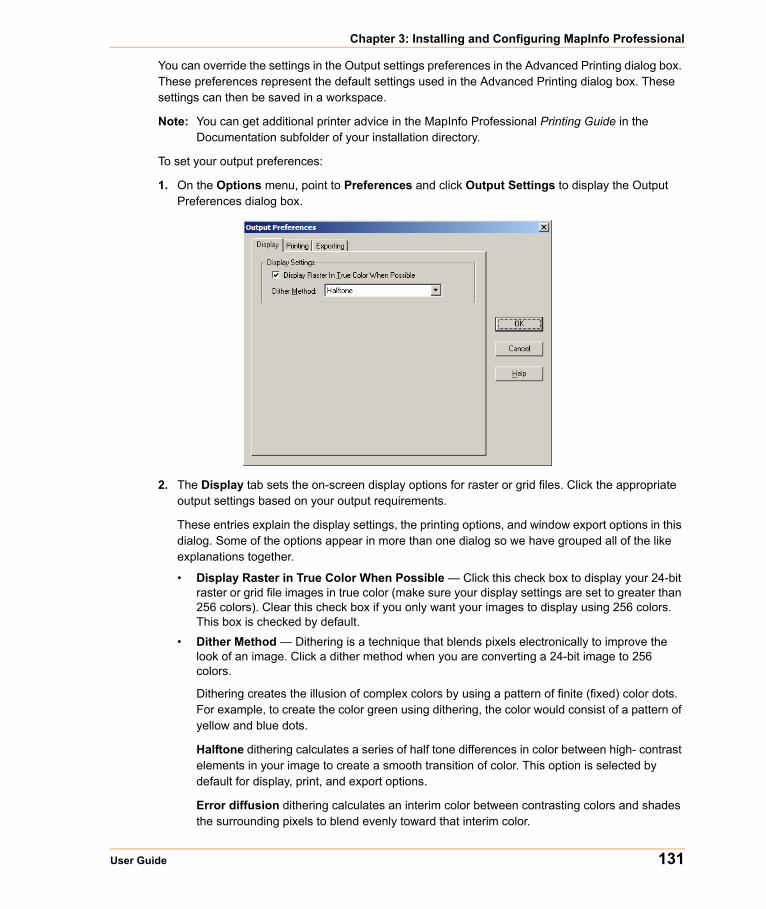
Chapter 3: Installing and Configuring MapInfo Professional
User Guide 131
You can override the settings in the Output settings preferences in the Advanced Printing dialog box. These preferences represent the default settings used in the Advanced Printing dialog box. These settings can then be saved in a workspace.
Note: You can get additional printer advice in the MapInfo Professional Printing Guide in the Documentation subfolder of your installation directory.
To set your output preferences:
1. On the Options menu, point to Preferences and click Output Settings to display the Output Preferences dialog box.
2. The Display tab sets the on-screen display options for raster or grid files. Click the appropriate output settings based on your output requirements.
These entries explain the display settings, the printing options, and window export options in this dialog. Some of the options appear in more than one dialog so we have grouped all of the like explanations together.
• Display Raster in True Color When Possible — Click this check box to display your 24-bit raster or grid file images in true color (make sure your display settings are set to greater than 256 colors). Clear this check box if you only want your images to display using 256 colors. This box is checked by default.
• Dither Method — Dithering is a technique that blends pixels electronically to improve the look of an image. Click a dither method when you are converting a 24-bit image to 256 colors.
Dithering creates the illusion of complex colors by using a pattern of finite (fixed) color dots. For example, to create the color green using dithering, the color would consist of a pattern of yellow and blue dots.
Halftone dithering calculates a series of half tone differences in color between high- contrast elements in your image to create a smooth transition of color. This option is selected by default for display, print, and export options.
Error diffusion dithering calculates an interim color between contrasting colors and shades the surrounding pixels to blend evenly toward that interim color.
Configuring the MapInfo Professional Preferences
132 MapInfo Professional v. 9.0
Note: You can select dither method options in the display, printing, and exporting sections of this dialog box. The same definitions apply to each area.
3. Click the Printing tab to set the printing options for Map windows, Layout windows and all other output file types. Select the appropriate printing settings based on your output requirements. Remember that resetting these printer options locally overrides these preferences.
• Output Method/Print Directly to Device — Click this option to print your image file directly from MapInfo Professional as you did when you were using MapInfo Professional 6.0 or earlier. This check box is checked by default.
• Output Method/Print Using Enhanced Metafile — Click this option to generate an enhanced metafile of your MapInfo Professional image before sending it to the printer. This setting takes advantage of current printer technology to shrink the spool size and print your file quicker without sacrificing quality.
Note: You must use this setting if you are printing a map containing a translucent raster or grid layer. If you do not use this setting, the image will not print translucently.
• Print Border for Map Window — Click this check box to print a black border around the image you are printing. Clear this check box to leave the image unbordered. This check box is checked by default.
• Internal Handling for Printing Transparent Vector Fills and Symbols — Special programming has been added to handle transparent fill patterns and bitmaps for vector images when printing or exporting. Click this check box to use this functionality or clear it to let the printer or Windows export functions to handle this. This check box is checked by default.
• Scale Patterns — Select this check box to match the non-transparent fill patterns in your print output to more closely match what you see on your screen. This check box is checked by default. Clear this check box to let the printer driver have exclusive control over rendering the pattern fills.
Note: The Scale Patterns check box does not affect transparent fill patterns because transparent fill patterns are always scaled.
• Use ROP Method to Display Transparent Raster — Click this check box to allow the internal ROP (Raster Overlay by Pixel) to manage the transparent pixel display and printing in raster images. Since the ROP Method is largely a display method, not all printers, plotters, and export programs can use it. We recommend that you either check with the printer manufacturer before using this setting or try a few test prints or exports to get the results you want. This check box is cleared by default.
Using the ROP method may not produce problems unless you print the metafile.
• Print/Export Raster in True Color When Possible — Click this check box to print and export your 24-bit raster or grid file images in true color (make sure your printer settings are set to greater than 256 colors). Clear this check box if you are not working with a color printer. This check box is checked by default.
Note: See the Dither Method setting above for details about this option.
4. Click the Exporting tab settings to set the export options for Map windows, Layout windows and all other output file types. Select the appropriate window export settings based on your output requirements. Remember that resetting these options locally overrides these preferences.
Chapter 3: Installing and Configuring MapInfo Professional
User Guide 133
• Export Border — Select this check box to include a black border on images you are exporting. Clear this check box to export the image without a border. This check box is checked by default.
Note: The preference setting definitions for Internal Handling for Transparent Vector Fills and Symbols, Use ROP Method to Display Transparent Raster, Print Raster in True Color When Possible, and Dithering Methods are the same for export as for printing.
• Use Anti-Aliasing— Select this check box to apply the anti-aliasing options available in MapInfo Professional.
5. Click OK to save these settings and return to the Preferences dialog box.
6. Click OK to close the Preferences dialog box.
Understanding the Anti-Aliasing Export Preferences
To give you more control over map images when exporting MapInfo Professional maps, you can use anti-aliasing methods. This is particularly important when you are saving maps created in MapInfo Professional for use in other Windows-based applications, in particular in slide presentations or for web pages.
The benefits of anti-aliasing can include:
• Make your fonts look smoother
• Make jagged edges in maps look rounder
• Can make text can be easier to read (for some) because it looks more like printed type
• Make maps look more visually attractive
We have added the ability to smooth images and text during the export process. You can use this capability with all types of windows such as Map windows, layouts, legends, and graphs.
Note: You cannot anti-alias images you are exporting to .EMF or .WMF format, because these are not true raster formats.
There are three smoothing options you can use to customize your raster image:
1. Smooth using a Filter value. You can set a flag that selects one of six filters that allow you to choose the direction the filter is applied to the image from.
2. Smooth using a Mask value. You can select a value that indicates the size of the area you want to smooth. For example, to create a 3x3 pixel mask value, you would enter a 3 in this field. This would limit the amount of change in the color of the pixels. Typically mask sizes would be 2-3 pixels when exporting at screen resolution. If you are exporting at a higher resolution, a larger mask might be appropriate.
3. Smooth using a Threshold value. You can select a threshold value to indicate which pixels to smooth. Each pixel in an image has a value based on its color. The smaller the pixel value, the darker the color. Select this option to smooth all of the pixels above the threshold you enter in this field. When you set this value to 0, MapInfo Professional will smooth all of the pixels.
You must either set a global preference for these anti-aliasing options or set them locally during the export process (using the Advanced button).
• For more information, see Recommendations for Effective Pattern Scaling in the Help System.
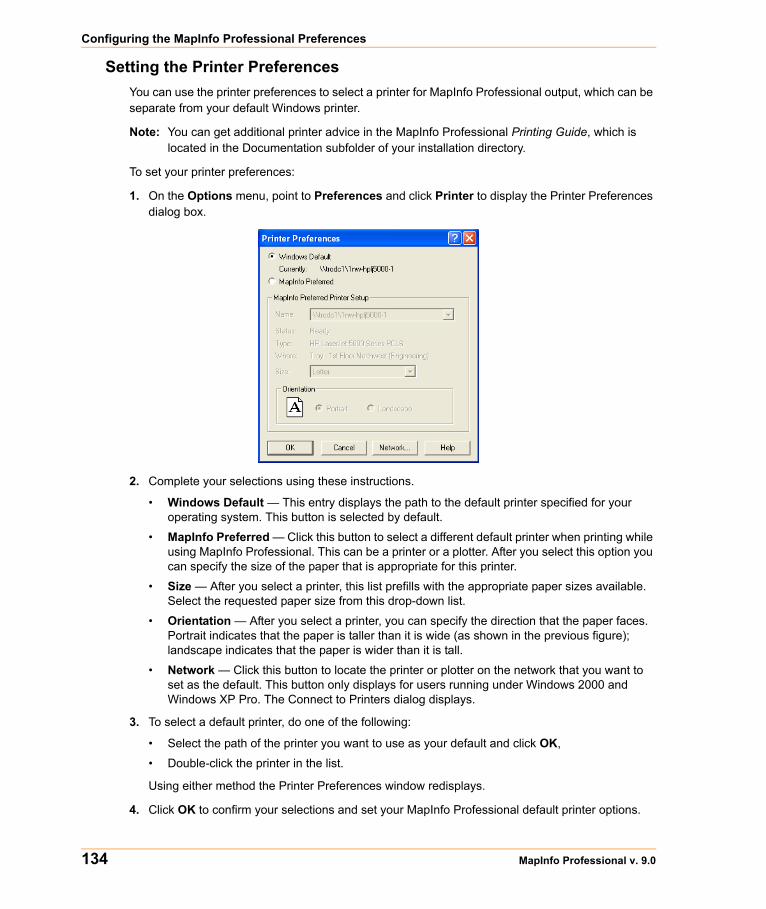
Configuring the MapInfo Professional Preferences
134 MapInfo Professional v. 9.0
Setting the Printer PreferencesYou can use the printer preferences to select a printer for MapInfo Professional output, which can be separate from your default Windows printer.
Note: You can get additional printer advice in the MapInfo Professional Printing Guide, which is located in the Documentation subfolder of your installation directory.
To set your printer preferences:
1. On the Options menu, point to Preferences and click Printer to display the Printer Preferences dialog box.
2. Complete your selections using these instructions.
• Windows Default — This entry displays the path to the default printer specified for your operating system. This button is selected by default.
• MapInfo Preferred — Click this button to select a different default printer when printing while using MapInfo Professional. This can be a printer or a plotter. After you select this option you can specify the size of the paper that is appropriate for this printer.
• Size — After you select a printer, this list prefills with the appropriate paper sizes available. Select the requested paper size from this drop-down list.
• Orientation — After you select a printer, you can specify the direction that the paper faces. Portrait indicates that the paper is taller than it is wide (as shown in the previous figure); landscape indicates that the paper is wider than it is tall.
• Network — Click this button to locate the printer or plotter on the network that you want to set as the default. This button only displays for users running under Windows 2000 and Windows XP Pro. The Connect to Printers dialog displays.
3. To select a default printer, do one of the following:
• Select the path of the printer you want to use as your default and click OK,
• Double-click the printer in the list.
Using either method the Printer Preferences window redisplays.
4. Click OK to confirm your selections and set your MapInfo Professional default printer options.
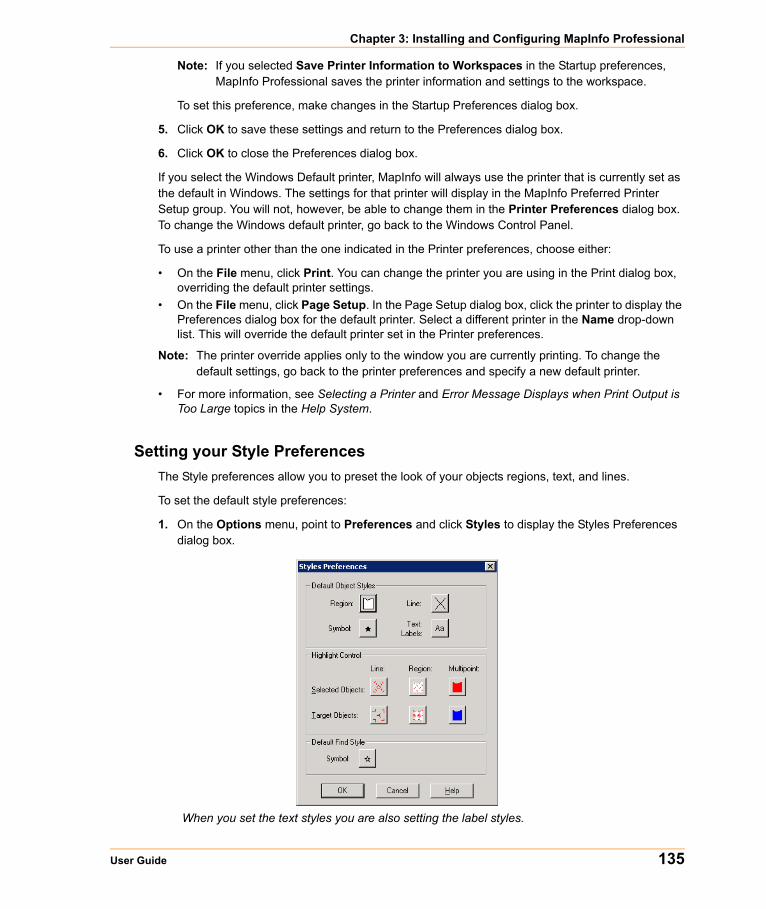
Chapter 3: Installing and Configuring MapInfo Professional
User Guide 135
Note: If you selected Save Printer Information to Workspaces in the Startup preferences, MapInfo Professional saves the printer information and settings to the workspace.
To set this preference, make changes in the Startup Preferences dialog box.
5. Click OK to save these settings and return to the Preferences dialog box.
6. Click OK to close the Preferences dialog box.
If you select the Windows Default printer, MapInfo will always use the printer that is currently set as the default in Windows. The settings for that printer will display in the MapInfo Preferred Printer Setup group. You will not, however, be able to change them in the Printer Preferences dialog box. To change the Windows default printer, go back to the Windows Control Panel.
To use a printer other than the one indicated in the Printer preferences, choose either:
• On the File menu, click Print. You can change the printer you are using in the Print dialog box, overriding the default printer settings.
• On the File menu, click Page Setup. In the Page Setup dialog box, click the printer to display the Preferences dialog box for the default printer. Select a different printer in the Name drop-down list. This will override the default printer set in the Printer preferences.
Note: The printer override applies only to the window you are currently printing. To change the default settings, go back to the printer preferences and specify a new default printer.
• For more information, see Selecting a Printer and Error Message Displays when Print Output is Too Large topics in the Help System.
Setting your Style PreferencesThe Style preferences allow you to preset the look of your objects regions, text, and lines.
To set the default style preferences:
1. On the Options menu, point to Preferences and click Styles to display the Styles Preferences dialog box.
When you set the text styles you are also setting the label styles.
Configuring the MapInfo Professional Preferences
136 MapInfo Professional v. 9.0
Complete your selections using these instructions.
Default Object Styles — Click the Region, Symbol, Line, and Text buttons to set these style options. These selections will serve to create the default settings for these style elements.
Note: Text styles apply to text objects and labels.
Highlight Control — Click this button to specify the Line, Region, and Multipoint styles of selected and target objects, as well as highlighting specifications in the Map window. Additionally, specify the style of selected and target multipoint objects. The default settings are shown in the Style boxes of the Highlight Control group. click one of the boxes to display the corresponding style dialog box and change its settings.
Symbol — Click this button to set the default symbol style for Query > Find tasks. In the Symbol Style dialog box, select the new symbol style and click OK to save them.
2. Click OK to save these settings and return to the Preferences dialog box. Click OK to close the Preferences dialog box.
• For more information, see Changing the Find Symbol Style Locally and Inserting Styles into Tables in the Help System.
Setting the Web Services PreferencesThe Web Services Preferences dialog box provides access to settings for the Web Feature Service and Web Map Service timeout values, GetMap pixel limits, and Proxy Server settings in MapInfo Professional. Additionally, you can set geocoding server and routing server options. These options allow you to control the web services preferences.
Note: You can set per-server defaults based on particular WFS and WMS servers in the Override Timeout Values section of the Server Information dialog box.
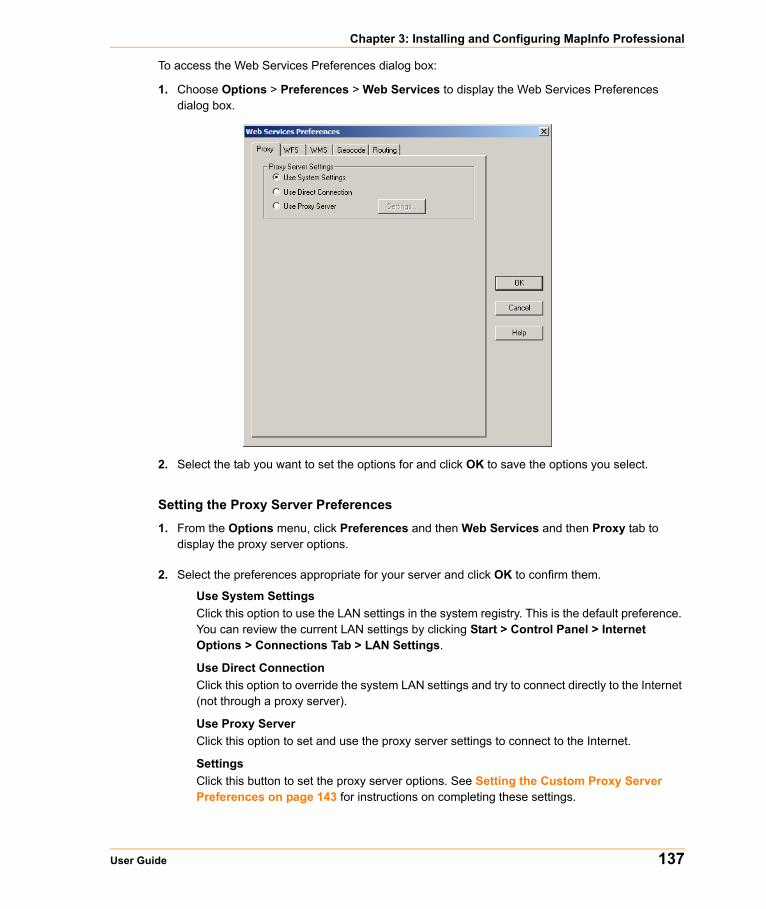
Chapter 3: Installing and Configuring MapInfo Professional
User Guide 137
To access the Web Services Preferences dialog box:
1. Choose Options > Preferences > Web Services to display the Web Services Preferences dialog box.
2. Select the tab you want to set the options for and click OK to save the options you select.
Setting the Proxy Server Preferences
1. From the Options menu, click Preferences and then Web Services and then Proxy tab to display the proxy server options.
2. Select the preferences appropriate for your server and click OK to confirm them.
Use System SettingsClick this option to use the LAN settings in the system registry. This is the default preference. You can review the current LAN settings by clicking Start > Control Panel > Internet Options > Connections Tab > LAN Settings.
Use Direct ConnectionClick this option to override the system LAN settings and try to connect directly to the Internet (not through a proxy server).
Use Proxy Server Click this option to set and use the proxy server settings to connect to the Internet.
SettingsClick this button to set the proxy server options. See Setting the Custom Proxy Server Preferences on page 143 for instructions on completing these settings.
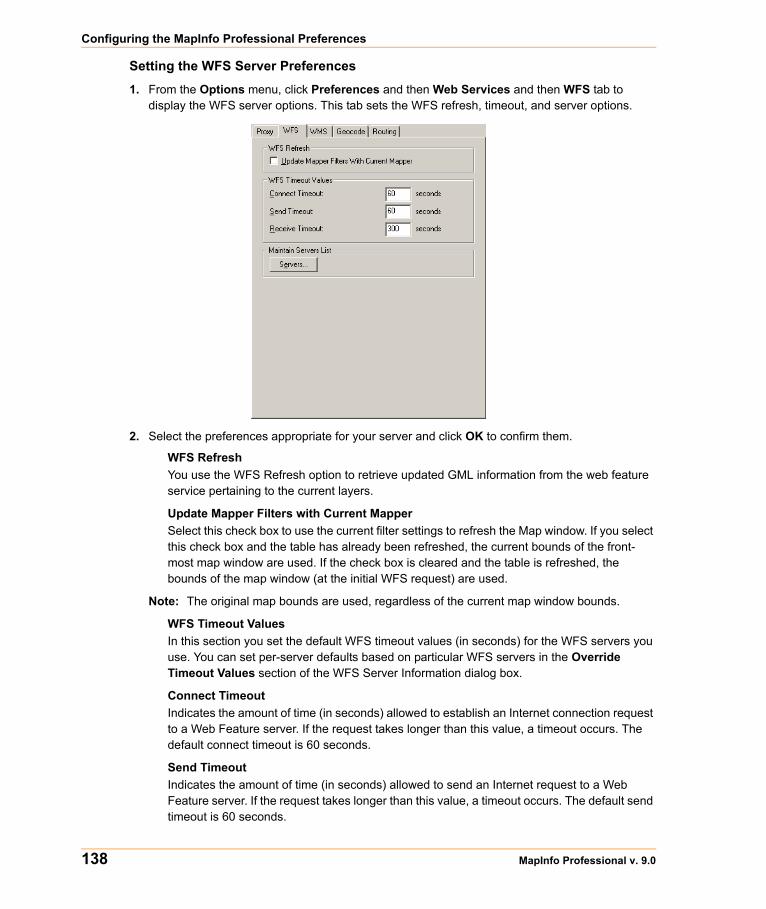
Configuring the MapInfo Professional Preferences
138 MapInfo Professional v. 9.0
Setting the WFS Server Preferences
1. From the Options menu, click Preferences and then Web Services and then WFS tab to display the WFS server options. This tab sets the WFS refresh, timeout, and server options.
2. Select the preferences appropriate for your server and click OK to confirm them.
WFS RefreshYou use the WFS Refresh option to retrieve updated GML information from the web feature service pertaining to the current layers.
Update Mapper Filters with Current MapperSelect this check box to use the current filter settings to refresh the Map window. If you select this check box and the table has already been refreshed, the current bounds of the front-most map window are used. If the check box is cleared and the table is refreshed, the bounds of the map window (at the initial WFS request) are used.
Note: The original map bounds are used, regardless of the current map window bounds.
WFS Timeout ValuesIn this section you set the default WFS timeout values (in seconds) for the WFS servers you use. You can set per-server defaults based on particular WFS servers in the Override Timeout Values section of the WFS Server Information dialog box.
Connect TimeoutIndicates the amount of time (in seconds) allowed to establish an Internet connection request to a Web Feature server. If the request takes longer than this value, a timeout occurs. The default connect timeout is 60 seconds.
Send TimeoutIndicates the amount of time (in seconds) allowed to send an Internet request to a Web Feature server. If the request takes longer than this value, a timeout occurs. The default send timeout is 60 seconds.
Chapter 3: Installing and Configuring MapInfo Professional
User Guide 139
Receive TimeoutIndicates the amount of time (in seconds) allowed to begin to receive a response from a request from a Web Feature server. The download can take longer than the timeout, but the response has to occur within the timeout setting. The default receive timeout is 300 seconds.
Maintain Servers ListClick the Servers button to display the WFS Servers List, where you can add, edit, and delete WFS servers.
Setting the WMS Server Preferences
1. From the Options menu, click Preferences and then Web Services and then WMS tab to display the WMS server options. This tab sets the WMS timeout, and server options.
2. Select the preferences appropriate for your server and click OK to confirm them.
WMS Timeout ValuesIn this section you set the default WMS timeout values (in seconds) for the WMS servers you use. You can set per-server defaults based on particular WMS servers in the Override Timeout Values section of the WMS Server Information dialog box.
Connect TimeoutIndicates the amount of time (in seconds) allowed establish an Internet connection request to a Web Map server. If request takes longer than this value, a timeout occurs. The default connect timeout is 60 seconds.
Send TimeoutIndicates the amount of time (in seconds) allowed to send an Internet request to a Web Map server. If the request takes longer than this value, a timeout occurs. The default send timeout is 60 seconds.
Receive TimeoutIndicates the amount of time (in seconds) allowed to begin to receive a response from a request to a Web Map server. The download can take longer than the timeout, but the response has to occur within the timeout setting. The default Receive Timeout setting is 300 seconds.
WMS GetMap Pixel LimitsThe GetMap Pixel Limits option represents the maximum number of pixels (in width/height) that a map request is limited to. The GetMap request is designed to retrieve the highest resolution map image as is necessary to render the image on the screen, for a printer, or for an export file. This option prevents the request from going higher than the specified values. Different servers have different limits, so you can set the limit that works best for your environment.
Note: You can set per-server defaults for GetMap Pixel Limits in the WMS Server Information dialog box.
Unfortunately, servers do not report their limits to us, so if the GetMap request fails, it means that you have entered a value that is too large.
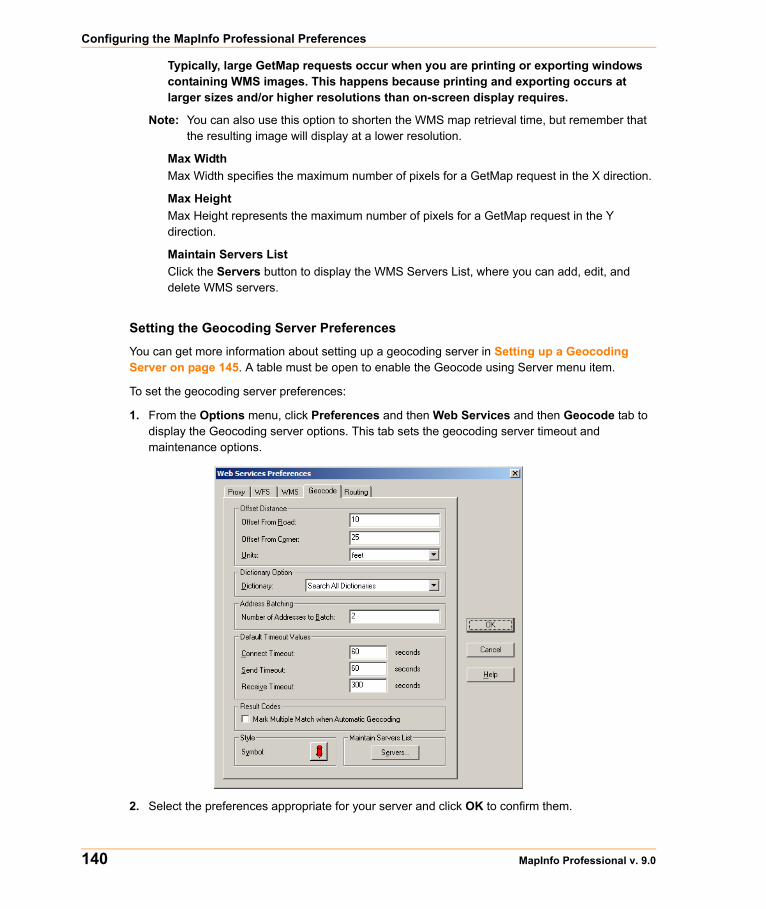
Configuring the MapInfo Professional Preferences
140 MapInfo Professional v. 9.0
Typically, large GetMap requests occur when you are printing or exporting windows containing WMS images. This happens because printing and exporting occurs at larger sizes and/or higher resolutions than on-screen display requires.
Note: You can also use this option to shorten the WMS map retrieval time, but remember that the resulting image will display at a lower resolution.
Max WidthMax Width specifies the maximum number of pixels for a GetMap request in the X direction.
Max HeightMax Height represents the maximum number of pixels for a GetMap request in the Y direction.
Maintain Servers ListClick the Servers button to display the WMS Servers List, where you can add, edit, and delete WMS servers.
Setting the Geocoding Server Preferences
You can get more information about setting up a geocoding server in Setting up a Geocoding Server on page 145. A table must be open to enable the Geocode using Server menu item.
To set the geocoding server preferences:
1. From the Options menu, click Preferences and then Web Services and then Geocode tab to display the Geocoding server options. This tab sets the geocoding server timeout and maintenance options.
2. Select the preferences appropriate for your server and click OK to confirm them.
Chapter 3: Installing and Configuring MapInfo Professional
User Guide 141
Offset From RoadUse this field to indicate the default distance the geocoded point should be from the road, if applicable.
Offset From CornerUse this field to indicate the default distance the geocoded point should be from the corner, if applicable.
UnitsUse this field to indicate the units for the previous entries.
DictionaryUse this drop-down list to select the dictionary options you want the geocoder to use (Address or User). These libraries exist on the service. Not all dictionary types may exist on all services. There are a maximum of 5 options:
Select All Dictionaries - Select this option to use both the user and address dictionaries.
Address Dictionary Only - Select this option to use only the service’s address dictionary and not the user’s dictionary.
User Dictionary Only - Select this option to use only the user’s address dictionary and not the service’s address dictionary
Prefer Address over User - Select this option to use the service’s address dictionary before the user’s address dictionary.
Prefer User over Address - Select this option to use the user’s address dictionary before the service’s address dictionary.
Number of Addresses to BatchUse this option to specify how many addresses you want to send to the geocoding service at a time. The number of addresses you send at a time can affect performance. If you are using the EOLS, the batch size can also affect billing of geocoding transactions if you cancel a geocoding operation during processing.
Default Timeout ValuesUse these timeout values to set the communication parameters for the geocoding service. You can override these defaults on a per-service basis locally by editing the service in the Services list and specifying the override.
Note: When you set the time out values locally, you may want to keep in mind the size of your request. The more complicated your request, the more time may be required for connection/sending/receiving.
Connect Time OutUse this setting to indicate the amount of time allowed establish an Internet connection to the geocoding service. If the request takes longer than this value, a timeout occurs. The default connect time out is 60 seconds.
Send Time OutUse this setting to indicate the amount of time allowed to send an Internet request to the geocoding service. If the request takes longer than this value, a timeout occurs. The default send time out is 60 seconds.
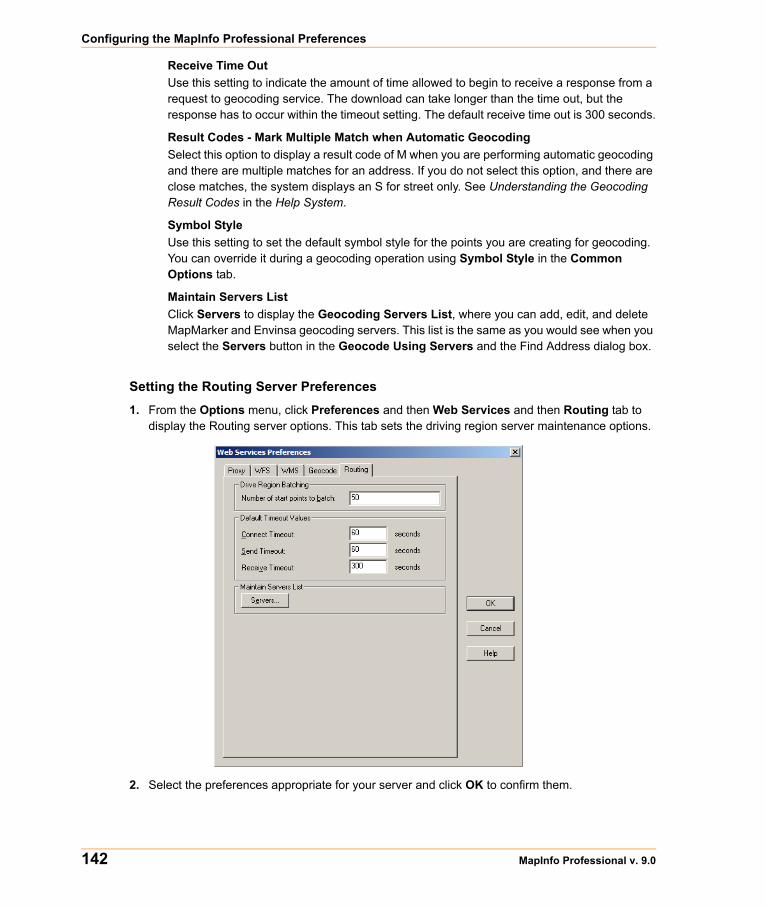
Configuring the MapInfo Professional Preferences
142 MapInfo Professional v. 9.0
Receive Time OutUse this setting to indicate the amount of time allowed to begin to receive a response from a request to geocoding service. The download can take longer than the time out, but the response has to occur within the timeout setting. The default receive time out is 300 seconds.
Result Codes - Mark Multiple Match when Automatic GeocodingSelect this option to display a result code of M when you are performing automatic geocoding and there are multiple matches for an address. If you do not select this option, and there are close matches, the system displays an S for street only. See Understanding the Geocoding Result Codes in the Help System.
Symbol StyleUse this setting to set the default symbol style for the points you are creating for geocoding. You can override it during a geocoding operation using Symbol Style in the Common Options tab.
Maintain Servers ListClick Servers to display the Geocoding Servers List, where you can add, edit, and delete MapMarker and Envinsa geocoding servers. This list is the same as you would see when you select the Servers button in the Geocode Using Servers and the Find Address dialog box.
Setting the Routing Server Preferences
1. From the Options menu, click Preferences and then Web Services and then Routing tab to display the Routing server options. This tab sets the driving region server maintenance options.
2. Select the preferences appropriate for your server and click OK to confirm them.
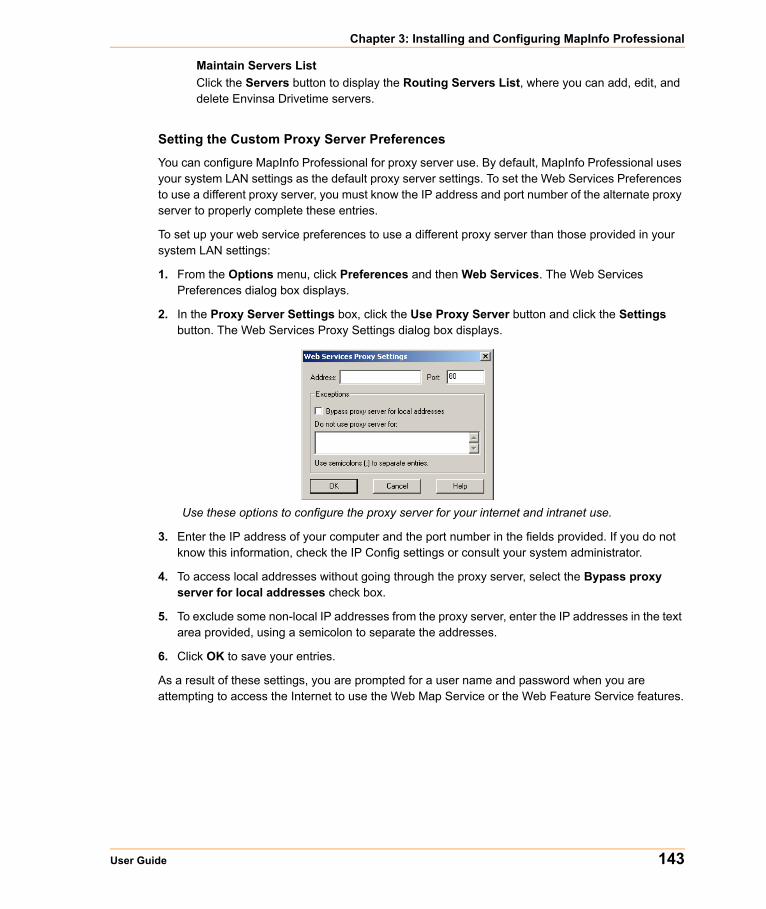
Chapter 3: Installing and Configuring MapInfo Professional
User Guide 143
Maintain Servers ListClick the Servers button to display the Routing Servers List, where you can add, edit, and delete Envinsa Drivetime servers.
Setting the Custom Proxy Server Preferences
You can configure MapInfo Professional for proxy server use. By default, MapInfo Professional uses your system LAN settings as the default proxy server settings. To set the Web Services Preferences to use a different proxy server, you must know the IP address and port number of the alternate proxy server to properly complete these entries.
To set up your web service preferences to use a different proxy server than those provided in your system LAN settings:
1. From the Options menu, click Preferences and then Web Services. The Web Services Preferences dialog box displays.
2. In the Proxy Server Settings box, click the Use Proxy Server button and click the Settings button. The Web Services Proxy Settings dialog box displays.
Use these options to configure the proxy server for your internet and intranet use.
3. Enter the IP address of your computer and the port number in the fields provided. If you do not know this information, check the IP Config settings or consult your system administrator.
4. To access local addresses without going through the proxy server, select the Bypass proxy server for local addresses check box.
5. To exclude some non-local IP addresses from the proxy server, enter the IP addresses in the text area provided, using a semicolon to separate the addresses.
6. Click OK to save your entries.
As a result of these settings, you are prompted for a user name and password when you are attempting to access the Internet to use the Web Map Service or the Web Feature Service features.
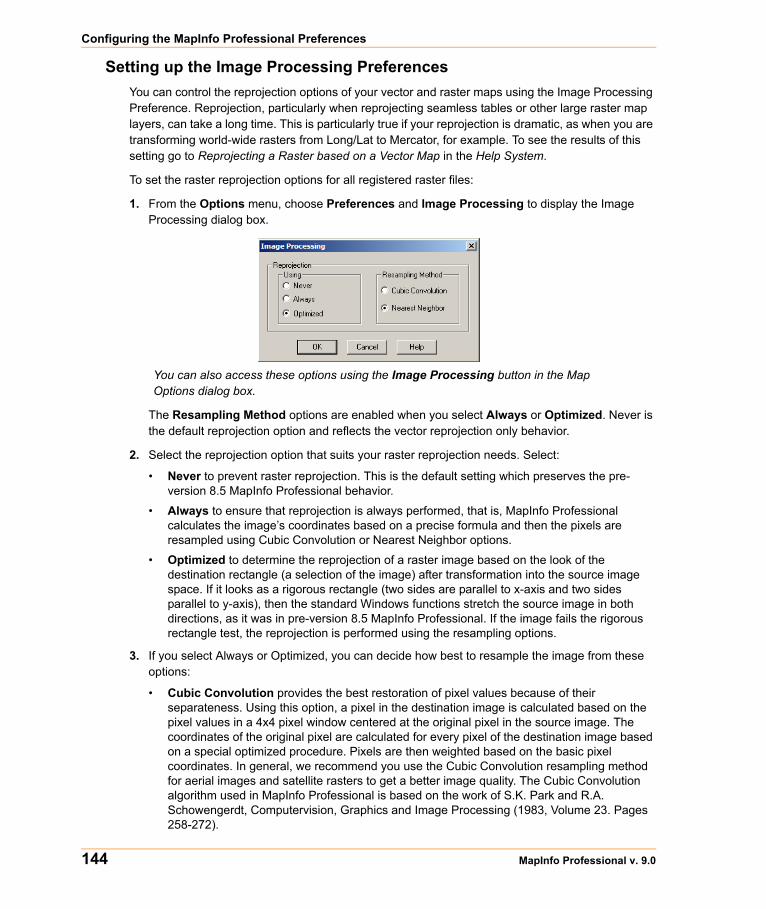
Configuring the MapInfo Professional Preferences
144 MapInfo Professional v. 9.0
Setting up the Image Processing PreferencesYou can control the reprojection options of your vector and raster maps using the Image Processing Preference. Reprojection, particularly when reprojecting seamless tables or other large raster map layers, can take a long time. This is particularly true if your reprojection is dramatic, as when you are transforming world-wide rasters from Long/Lat to Mercator, for example. To see the results of this setting go to Reprojecting a Raster based on a Vector Map in the Help System.
To set the raster reprojection options for all registered raster files:
1. From the Options menu, choose Preferences and Image Processing to display the Image Processing dialog box.
You can also access these options using the Image Processing button in the Map Options dialog box.
The Resampling Method options are enabled when you select Always or Optimized. Never is the default reprojection option and reflects the vector reprojection only behavior.
2. Select the reprojection option that suits your raster reprojection needs. Select:
• Never to prevent raster reprojection. This is the default setting which preserves the pre-version 8.5 MapInfo Professional behavior.
• Always to ensure that reprojection is always performed, that is, MapInfo Professional calculates the image’s coordinates based on a precise formula and then the pixels are resampled using Cubic Convolution or Nearest Neighbor options.
• Optimized to determine the reprojection of a raster image based on the look of the destination rectangle (a selection of the image) after transformation into the source image space. If it looks as a rigorous rectangle (two sides are parallel to x-axis and two sides parallel to y-axis), then the standard Windows functions stretch the source image in both directions, as it was in pre-version 8.5 MapInfo Professional. If the image fails the rigorous rectangle test, the reprojection is performed using the resampling options.
3. If you select Always or Optimized, you can decide how best to resample the image from these options:
• Cubic Convolution provides the best restoration of pixel values because of their separateness. Using this option, a pixel in the destination image is calculated based on the pixel values in a 4x4 pixel window centered at the original pixel in the source image. The coordinates of the original pixel are calculated for every pixel of the destination image based on a special optimized procedure. Pixels are then weighted based on the basic pixel coordinates. In general, we recommend you use the Cubic Convolution resampling method for aerial images and satellite rasters to get a better image quality. The Cubic Convolution algorithm used in MapInfo Professional is based on the work of S.K. Park and R.A. Schowengerdt, Computervision, Graphics and Image Processing (1983, Volume 23. Pages 258-272).
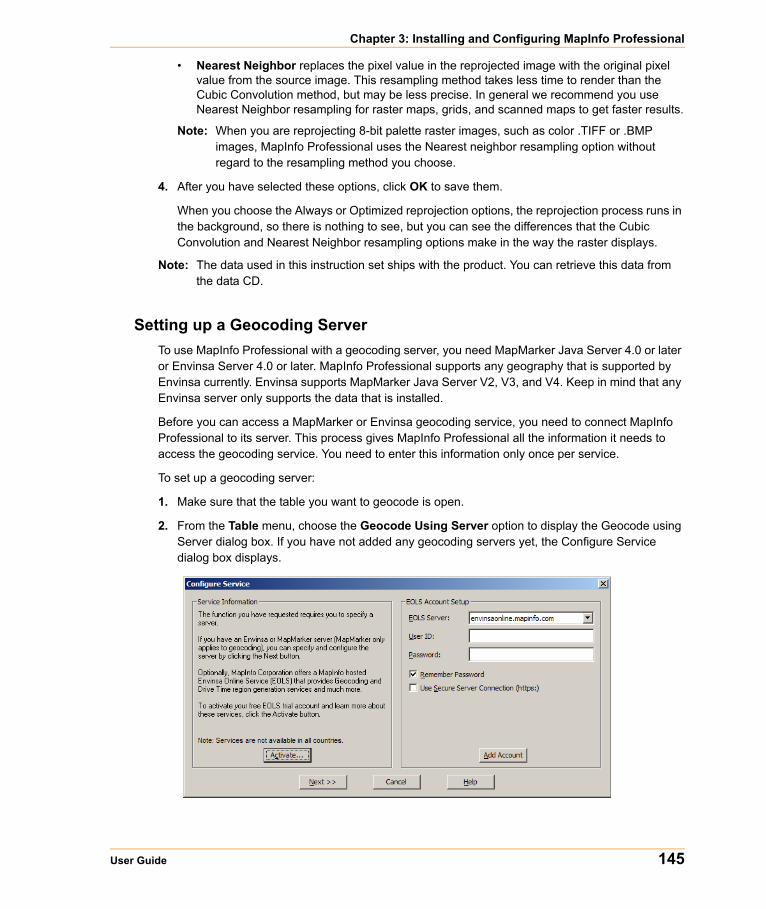
Chapter 3: Installing and Configuring MapInfo Professional
User Guide 145
• Nearest Neighbor replaces the pixel value in the reprojected image with the original pixel value from the source image. This resampling method takes less time to render than the Cubic Convolution method, but may be less precise. In general we recommend you use Nearest Neighbor resampling for raster maps, grids, and scanned maps to get faster results.
Note: When you are reprojecting 8-bit palette raster images, such as color .TIFF or .BMP images, MapInfo Professional uses the Nearest neighbor resampling option without regard to the resampling method you choose.
4. After you have selected these options, click OK to save them.
When you choose the Always or Optimized reprojection options, the reprojection process runs in the background, so there is nothing to see, but you can see the differences that the Cubic Convolution and Nearest Neighbor resampling options make in the way the raster displays.
Note: The data used in this instruction set ships with the product. You can retrieve this data from the data CD.
Setting up a Geocoding ServerTo use MapInfo Professional with a geocoding server, you need MapMarker Java Server 4.0 or later or Envinsa Server 4.0 or later. MapInfo Professional supports any geography that is supported by Envinsa currently. Envinsa supports MapMarker Java Server V2, V3, and V4. Keep in mind that any Envinsa server only supports the data that is installed.
Before you can access a MapMarker or Envinsa geocoding service, you need to connect MapInfo Professional to its server. This process gives MapInfo Professional all the information it needs to access the geocoding service. You need to enter this information only once per service.
To set up a geocoding server:
1. Make sure that the table you want to geocode is open.
2. From the Table menu, choose the Geocode Using Server option to display the Geocode using Server dialog box. If you have not added any geocoding servers yet, the Configure Service dialog box displays.
Configuring the MapInfo Professional Preferences
146 MapInfo Professional v. 9.0
3. Do one of the following:
• If you do not have a MapMarker or Envinsa geocoding server, you can use MapInfo's hosted Envinsa Online Service to try this functionality. Click Activate to sign up for a geocoding service near you. See Accessing Online Services at MapInfo in the Help System for more instructions in signing on to this service.
• If you have a MapMarker or Envinsa geocoding server, click Next to display the Geocoding Using Server dialog box.
After you add geocoding servers to MapInfo Professional, this box displays your default server.
4. Click Servers to display the Geocoding Servers List dialog box.
This list is empty by default until you add a geocoding server either using the Servers button in the Geocode Using Server dialog box or in the geocoding web services preferences.
Note: When you have entered a server that you will use most frequently, highlight it in the list. Click Set Default. A check mark displays to indicate that the server you selected will open by default.
Chapter 3: Installing and Configuring MapInfo Professional
User Guide 147
5. To add a new server, click Add. The Geocoding Server Information dialog box displays.
6. Type the service URL and description in the fields provided. You can connect to either a MapMarker or Envinsa geocoding service by making a selection in the Type of Service drop-down list.
When you select an Envinsa service, enter a user ID and password in the fields provided. Select the Remember Password check box to save the password in encrypted format in the server list. This option is selected by default. If you prefer to enter the password each time you access this server, clear this check box.
CAUTION: Anyone knowing this password will be able to use the Envinsa geocoding service.
7. Consider whether the default timeout settings are appropriate for the service you are adding. The default settings that display in each field are set in the geocoding web services preferences. You can change these global defaults using the instructions in Setting the Geocoding Server Preferences on page 140.
To reset these entries for the current server, select the Override Default Values check box and enter new timeout settings using these definitions:
Connect TimeoutIndicates the amount of time (in seconds) allowed to establish an Internet connection request to a geocoding service. If the request takes longer than this value, a timeout occurs. The default connect timeout is 60 seconds.
Send TimeoutIndicates the amount of time (in seconds) allowed to send an request to a geocoding service. If the request takes longer than this value, a timeout occurs. The default send timeout is 60 seconds.
Receive TimeoutIndicates the amount of time (in seconds) allowed to begin to receive a response from a request from a geocoding service. The download can take longer than the timeout, but the response has to occur within the timeout setting. This default timeout is 300 seconds.
If the default timeout settings are appropriate for the new service, clear this check box.
Configuring the MapInfo Professional Preferences
148 MapInfo Professional v. 9.0
8. When you have completed these entries, click Test URL to ensure that the connection is made. When you click Test URL and MapInfo Professional can connect to the service, the Geocoding Server Details dialog box displays.
If the URL is valid, the Engine Info list displays the service’s available, country data, the supported geocoding types (Street, Postcode, Geographic), and the version information. Click the column headings to sort the entries alphabetically. Click Close to return to the Geocoding Server Information dialog box.
Note: If you select Test URL and no service connection is found, an error message displays.
9. When all of these fields and options are complete, click OK to save the new geocoding server.
Setting up the Routing Server Before you can access an Envinsa Drivetime service, you need to show MapInfo Professional where to find the Routing server it is housed on. This process gives MapInfo Professional all the information it needs to access the server. You need to enter this information only once per server. To set the routing server preferences, see Setting the Routing Server Preferences on page 142.
To add a Routing server:
1. From the Options menu, choose the Preferences option and then select Web Services. Click the Routing tab to set the web service preference options.
2. To add a new routing server, click Servers to display the Routing Servers List dialog box.
3. Click Add. The Routing Server Information dialog box displays.
MapInfo Professional supports server-side and proxy server authentication. If you use a proxy server for Internet access and your routing server also requires user/password authentication, you authenticate with the proxy server first. As a result, the Connection dialog box displays twice -- once for the proxy server and once for the routing server.
4. Type the server URL, the server description, the default user name and password in the fields provided. Click the check box to remember the password when you enter the correct user name.
5. Consider whether the default timeout settings are appropriate for the server you are adding. The default settings display in each field. The options you select in this dialog box determine the Routing server’s default settings. To change these entries, select the Override Default Values check box and enter new timeout settings using the same definitions.
Note: When you have entered a server that you will use most frequently, highlight it in the list. Click Set Default. A check mark displays beside the server you selected.
6. When you have completed these entries, click Test URL to ensure that the connection is available. The Routing Server Details dialog box displays.
If the URL is valid, the Countries list displays the server’s available country data. Click Close to return to the Routing Server Information dialog box.
Note: If you select Test URL and no server connection is found, an error message displays.
7. When these fields and options are complete, click OK to save the new routing server.
Chapter 3: Installing and Configuring MapInfo Professional
User Guide 149
Starting up and Leaving MapInfo ProfessionalIn this section we cover the very basics of starting MapInfo Professional, using the STARTUP.WOR, and exiting the program. Since opening a table is basic to getting started in using MapInfo Professional, we cover that topic here, as well.
Starting MapInfo ProfessionalNow that you have MapInfo Professional installed and have read a little about its power and functionality, you are ready to begin mapping and analyzing your data.
To start MapInfo Professional:
• Do one of the following:
• Double-click the MapInfo Professional icon on your desktop. In a few seconds, MapInfo Professional’s Quick Start dialog box displays.
• From the Start menu, select MapInfo Professional 9.0 (or MapInfo Professional 9.0 Client, if this is a network installation) from the Selected Program folder.
Using either method the Quick Start dialog box displays.
Here you can choose how you want to start your mapping session. The Quick Start dialog box displays every time you start MapInfo Professional, but you can change this behavior in the Startup preferences (On the Options menu, point to Preferences and click Startup) using instructions in Setting the Startup Preferences in the MapInfo Professional Help System. In the Startup Preferences dialog box, clear the Display Quick Start dialog box to deactivate the display of the Quick Start dialog box.
If you are returning to MapInfo Professional, you can return to the previous mapping session by choosing Restore Previous Session or use last workspace. If this is your first look at MapInfo Professional, choose the Open a Table option to begin. The Open dialog box displays.
Exiting MapInfo Professional To leave MapInfo Professional:
• On the File menu, click Exit. There is no confirmation message.
CAUTION: If you made changes to a table and did not save them a prompt appears asking you if you want to save the changes. Unless you choose Save, the changes are lost.
File Format Types Supported
150 MapInfo Professional v. 9.0
• For more information, see Leaving MapInfo Professional using the MAPINGOW.WOR Workspace in the Help System.
File Format Types SupportedYou can open the following file types using the File > Open capability in MapInfo Professional:
• TAB: MapInfo .TAB files (*.tab)• WOR: MapInfo workspace files (*.wor)• MDB: Microsoft Access files (*.mdb)• DBF: dBASE DBF files (*.dbf)• TXT: Delimited ASCII files (*.txt) • WKS: Lotus 1-2-3 files (*.wk1, *.wks, *.wk3, *.wk4)• XLS: Microsoft Excel files (*.xls)• SHP: ESRI Shapefiles (*.shp)• Raster image files (*.bil, *.sid, *.gen, *.adf, *.img, *.ntf, *.ecw, *.url, *.tif, *.grc, *.bmp, *.gif, *.tga,
*.jpg, *.pcx, *. jp2, *.j2k, *.png, *.psd, *.wmf, *.emf, *.map)• Grid images (*.adf, *.flt, *.txt, *.asc, *.img, *.dem, *.dt0, *.dt1, *.dt2, *.mig, *.grd)• CSV: Comma Delimited files (*.csv)
Note: Grid Format Direct Support: The following grid handlers support direct read of DEM-USGS Text (.dem); GTOPO30 (.dem) and DTED levels 1, 2, 3 (.dt0, .dt1, .dt2). These grid handlers are read-only; they cannot be used to create grid files during the Create Grid Thematic interpolation process.
Using the Universal Translator, you can import these file format types:
• DWG/DXF: AutoCAD • E00: ESRI ArcInfo format• SHP: ESRI Shapefile format• MID/MIF: MapInfo file formats• TAB: MapInfo .TAB files• DGN: Microstation Design files• CATD.DDF: Spatial Data Transfer Standard (SDTS)• FT: Vector Product Format (VPF)
You can import the following file types into MapInfo Professional using Table > Import:
• MIF: MapInfo Professional Interchange Format. MapInfo Professional’s data interchange format (ASCII file format).
• DXF: The graphic/data interchange format for AutoCAD and other CAD packages.• MBI: MapInfo Professional Boundary Interchange format. An ASCII file for MapInfo DOS
boundary files.• MMI: MapInfo DOS MMI • IMG: A file format for MapInfo Professional for DOS image files.• GML: OS MasterMap format. • GML/XML: Geographic Markup Language 2.1 (*.gml, *.xml)
Chapter 3: Installing and Configuring MapInfo Professional
User Guide 151
Note: You can download raster handlers for NIMA formats such as ADRG, CADRG, ASRP, CIB, USRP, and NITF formats from the MapInfo website or get them from the Installation CD.
MapInfo Professional imports graphics and textual information from MapInfo Professional Interchange Format, DXF, MBI, and MMI files. MapInfo Professional imports only graphics from IMG.
These are the Raster image file formats MapInfo Professional supports:
• MrSID: The MrSID raster handler allows you to open and display raster images compressed in the MrSID format.
• BMP -- Windows Bitmap. Windows format only: Monochrome: 8 Bit Color, 24 Bit Color• GIF -- Graphics Interchange Format• GIF89a Format (non-interlaced only): Monochrome, 8 Bit Color• JPEG-2000 -- Joint Photographic Experts Group: MapInfo Professional supports creating
JPEG 2000 files using Save Window As and viewing JPEG 2000 files using the LeadTools raster handler.
• JPEG -- Joint Photographic Experts Group• JFIF V1.02 (JPEG File Interchange Format): 8 Bit Gray, 24 Bit Color, No Subsampling, 24 Bit
Color, YUV422 Subsampling, 24 Bit Color, YUV411 Subsampling• PCX -- ZSoft Paintbrush• PCX File Format Version 5 (Paintbrush Version 3.0): Monochrome, 8 Bit Gray, 8 Bit Color, 24
Bit Color• SPOT -- Satellite Pour l'Observation de la Terre -- Spot Image Formats 1.5 and 4.0: 8 Bit
Gray, Format 1.5, 8 Bit Gray, Format 4.0, 24 Bit Color, Format 1.5, 24 Bit Color, Format 4.0• TGA -- Truevision TGA Truevision File Format Specification 2.0: 8 Bit Gray, 8 Bit Color, 24
Bit Color• TIFF -- Tagged Image File Format: TIFF Revision 5.0, Monochrome (Class B),
Uncompressed, Monochrome (Class B), PackBits Compression, 8 Bit Gray (Class G), Uncompressed, 8 Bit Color (Class P), Uncompressed, 24 Bit Color (Class R), Uncompressed
• PNG – Portable Network Graphics Format• PSD – Adobe Photoshop Version 3.0• WMF – Windows Metafile: The raster handler will load a rasterized version of the WMF file.• ECW – Enhanced Compression Wavlet by ER Mapper• GRD/GRC – MapInfo Vertical Mapper: GRD files can be treated as either a grid or raster
image. If the associated .TAB file contains a RasterStyle 6 entry, the file will be treated as a grid.• ASRP – ARC Standard Raster Product to 1.2• ADRG – ARC Digitized Raster Graphic• CADRG- Compressed ARC Digitized Raster Graphic• NITF – National Imagery Transmission Format (version 2.x) • CIB – Controlled Image Base• GIF – Graphics Interchange Format• TIFF LZW– Tagged Information File Format LZW• TIFF CCITT Group 4– Tagged Information File Format CCITT Group 4• GeoTIFF

File Format Types Supported
152 MapInfo Professional v. 9.0
The Basics of MapInfo Professional
Now that you have installed MapInfo Professional®, you are probably anxious to get mapping. But, if you are new to MapInfo Professional, take a few minutes to read this chapter to familiarize yourself with the concepts, components, and tools for successful computer mapping.
Sections in this Chapter:
A Tour of the MapInfo Professional Desktop. . . . . . . . . . . . . . . . .94Understanding Your Data in MapInfo Professional . . . . . . . . . . . .99Working with Layers in the Layer Control . . . . . . . . . . . . . . . . . .100Working with Seamless Layers. . . . . . . . . . . . . . . . . . . . . . . . . . . 111Data - Where MapInfo Professional Begins . . . . . . . . . . . . . . . . .114Reviewing the Windows in MapInfo Professional. . . . . . . . . . . .122Saving, Closing, and Exporting Your Work . . . . . . . . . . . . . . . . .130Using the Tools in the Tool Manager . . . . . . . . . . . . . . . . . . . . . .143
4
A Tour of the MapInfo Professional Desktop
154 MapInfo Professional v. 9.0
A Tour of the MapInfo Professional DesktopThis section details the tools and commands that are available to you in the MapInfo Professional product. You may refer to these frequently as you familiarize yourself with MapInfo Professional.
Working with ToolbarsMapInfo Professional provides four toolbars of tool buttons and commands to give you tremendous mapping creativity at the click of a button.
To reshape the toolbars, click and drag on their borders. Drag the title bar to move them. To dock a toolbar, drag it to the area directly underneath the Main menu bar. The toolbar changes shape and positions itself directly under the menu bar. You can easily change it back to the floating view by clicking the background area of the toolbar and dragging it away from its position. The toolbar retains the same shape as it had before you docked it.
You can also dock and undock a toolbar from the Options menu.
1. On the Options menu, click Toolbars, and in the Toolbar Options dialog box.
2. Do one of the following:
• Select the Floating check box for each toolbar that you want to have float and be able to move around.
• Clear the Floating check box for each toolbar you want to dock.
Note: To display or hide the toolbars, select or clear the Show check box. You can also choose whether you want to display color buttons or larger buttons for each toolbar.
3. Choose Save as Default to save your arrangement. To remove a toolbar from the screen, click its Ctrl box.
Reviewing the Standard Toolbar
The Standard toolbar contains tools for commonly performed menu functions from the File, Edit, and Window menus. It also contains tools for quick access to a Redistricting window and online Help. Many of these tools are familiar to you from working with Microsoft Windows.
New Table Open
Open Workspace Open WMS Table (Web Map Service)
Open WFS Table (Web Feature Service) Save Table
Save Workspace Save Window
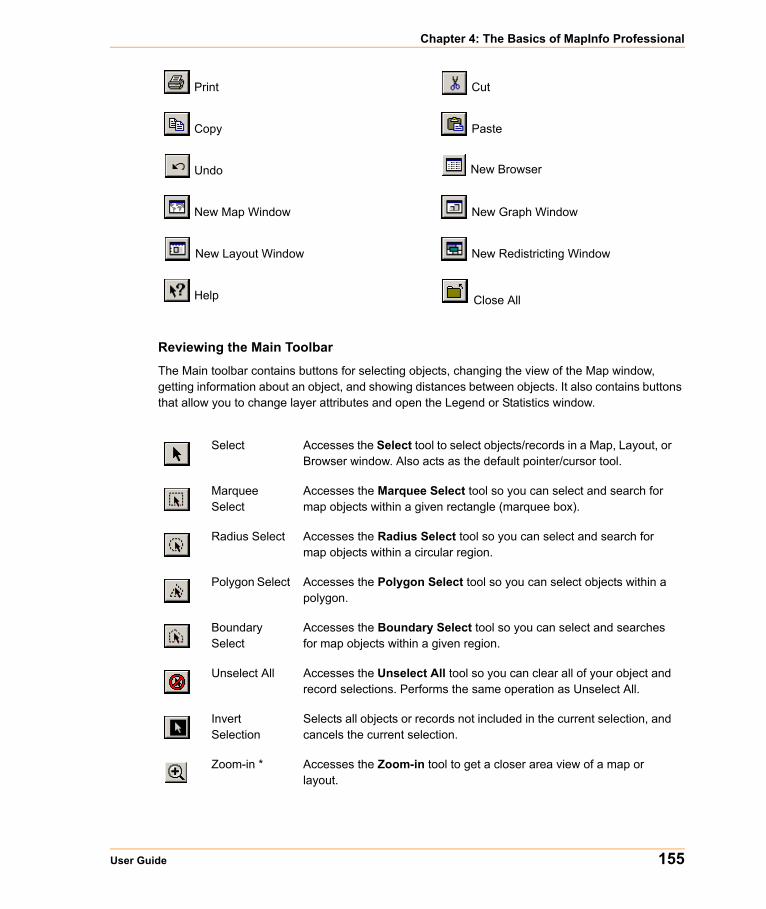
Chapter 4: The Basics of MapInfo Professional
User Guide 155
Reviewing the Main Toolbar
The Main toolbar contains buttons for selecting objects, changing the view of the Map window, getting information about an object, and showing distances between objects. It also contains buttons that allow you to change layer attributes and open the Legend or Statistics window.
Print Cut
Copy Paste
Undo New Browser
New Map Window New Graph Window
New Layout Window New Redistricting Window
Help Close All
Select Accesses the Select tool to select objects/records in a Map, Layout, or Browser window. Also acts as the default pointer/cursor tool.
Marquee Select
Accesses the Marquee Select tool so you can select and search for map objects within a given rectangle (marquee box).
Radius Select Accesses the Radius Select tool so you can select and search for map objects within a circular region.
Polygon Select Accesses the Polygon Select tool so you can select objects within a polygon.
Boundary Select
Accesses the Boundary Select tool so you can select and searches for map objects within a given region.
Unselect All Accesses the Unselect All tool so you can clear all of your object and record selections. Performs the same operation as Unselect All.
Invert Selection
Selects all objects or records not included in the current selection, and cancels the current selection.
Zoom-in * Accesses the Zoom-in tool to get a closer area view of a map or layout.
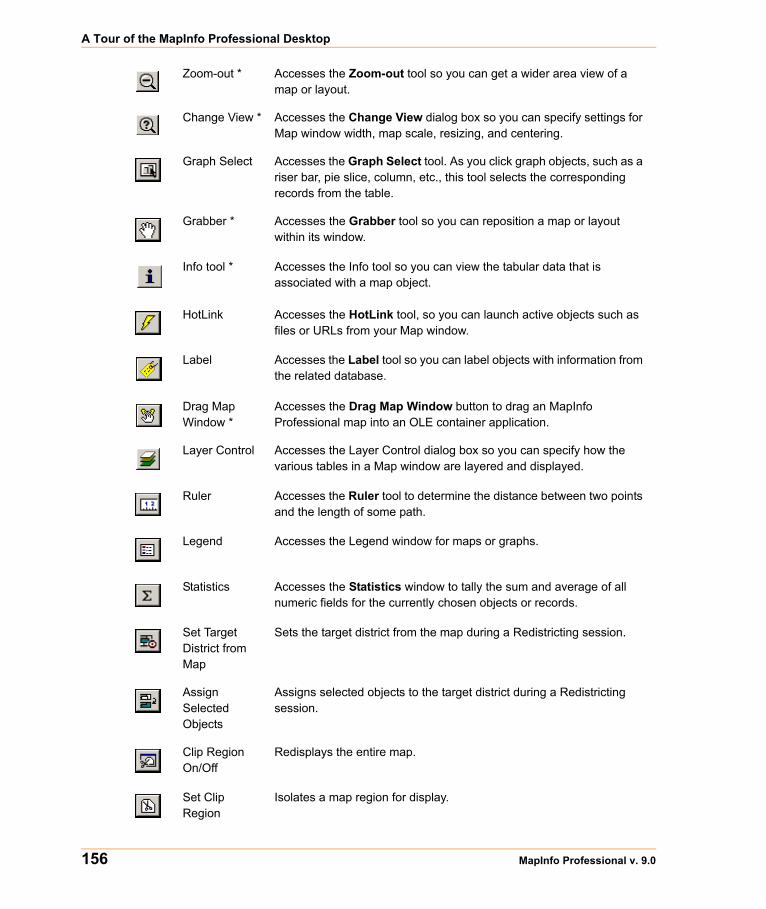
A Tour of the MapInfo Professional Desktop
156 MapInfo Professional v. 9.0
Zoom-out * Accesses the Zoom-out tool so you can get a wider area view of a map or layout.
Change View * Accesses the Change View dialog box so you can specify settings for Map window width, map scale, resizing, and centering.
Graph Select Accesses the Graph Select tool. As you click graph objects, such as a riser bar, pie slice, column, etc., this tool selects the corresponding records from the table.
Grabber * Accesses the Grabber tool so you can reposition a map or layout within its window.
Info tool * Accesses the Info tool so you can view the tabular data that is associated with a map object.
HotLink Accesses the HotLink tool, so you can launch active objects such as files or URLs from your Map window.
Label Accesses the Label tool so you can label objects with information from the related database.
Drag Map Window *
Accesses the Drag Map Window button to drag an MapInfo Professional map into an OLE container application.
Layer Control Accesses the Layer Control dialog box so you can specify how the various tables in a Map window are layered and displayed.
Ruler Accesses the Ruler tool to determine the distance between two points and the length of some path.
Legend Accesses the Legend window for maps or graphs.
Statistics Accesses the Statistics window to tally the sum and average of all numeric fields for the currently chosen objects or records.
Set Target District from Map
Sets the target district from the map during a Redistricting session.
Assign Selected Objects
Assigns selected objects to the target district during a Redistricting session.
Clip Region On/Off
Redisplays the entire map.
Set Clip Region
Isolates a map region for display.
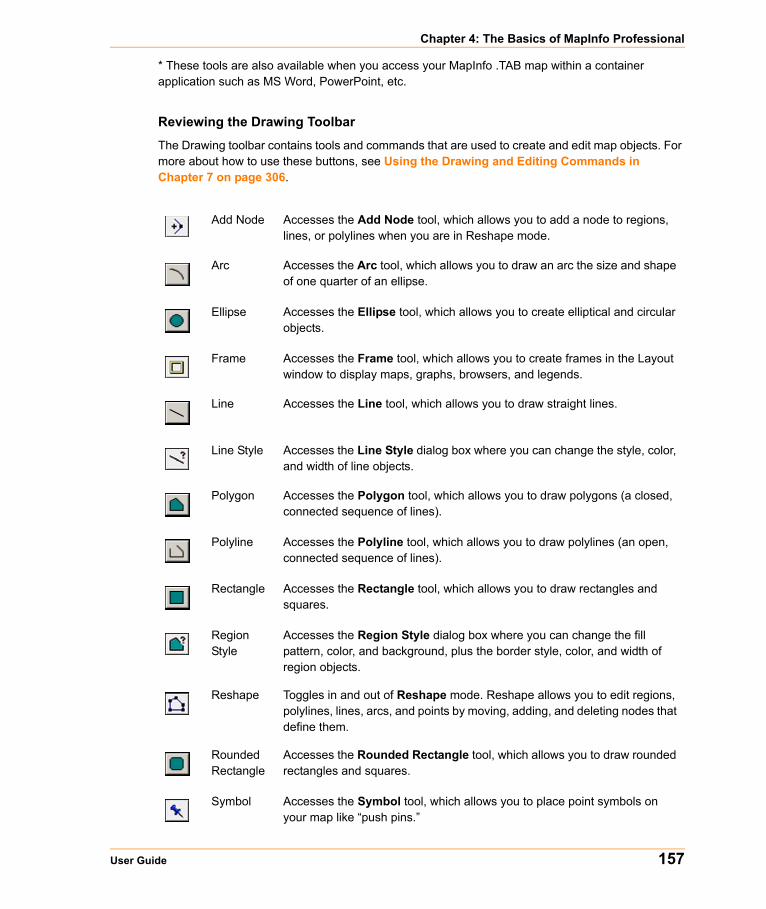
Chapter 4: The Basics of MapInfo Professional
User Guide 157
* These tools are also available when you access your MapInfo .TAB map within a container application such as MS Word, PowerPoint, etc.
Reviewing the Drawing Toolbar
The Drawing toolbar contains tools and commands that are used to create and edit map objects. For more about how to use these buttons, see Using the Drawing and Editing Commands in Chapter 7 on page 306.
Add Node Accesses the Add Node tool, which allows you to add a node to regions, lines, or polylines when you are in Reshape mode.
Arc Accesses the Arc tool, which allows you to draw an arc the size and shape of one quarter of an ellipse.
Ellipse Accesses the Ellipse tool, which allows you to create elliptical and circular objects.
Frame Accesses the Frame tool, which allows you to create frames in the Layout window to display maps, graphs, browsers, and legends.
Line Accesses the Line tool, which allows you to draw straight lines.
Line Style Accesses the Line Style dialog box where you can change the style, color, and width of line objects.
Polygon Accesses the Polygon tool, which allows you to draw polygons (a closed, connected sequence of lines).
Polyline Accesses the Polyline tool, which allows you to draw polylines (an open, connected sequence of lines).
Rectangle Accesses the Rectangle tool, which allows you to draw rectangles and squares.
Region Style
Accesses the Region Style dialog box where you can change the fill pattern, color, and background, plus the border style, color, and width of region objects.
Reshape Toggles in and out of Reshape mode. Reshape allows you to edit regions, polylines, lines, arcs, and points by moving, adding, and deleting nodes that define them.
Rounded Rectangle
Accesses the Rounded Rectangle tool, which allows you to draw rounded rectangles and squares.
Symbol Accesses the Symbol tool, which allows you to place point symbols on your map like “push pins.”
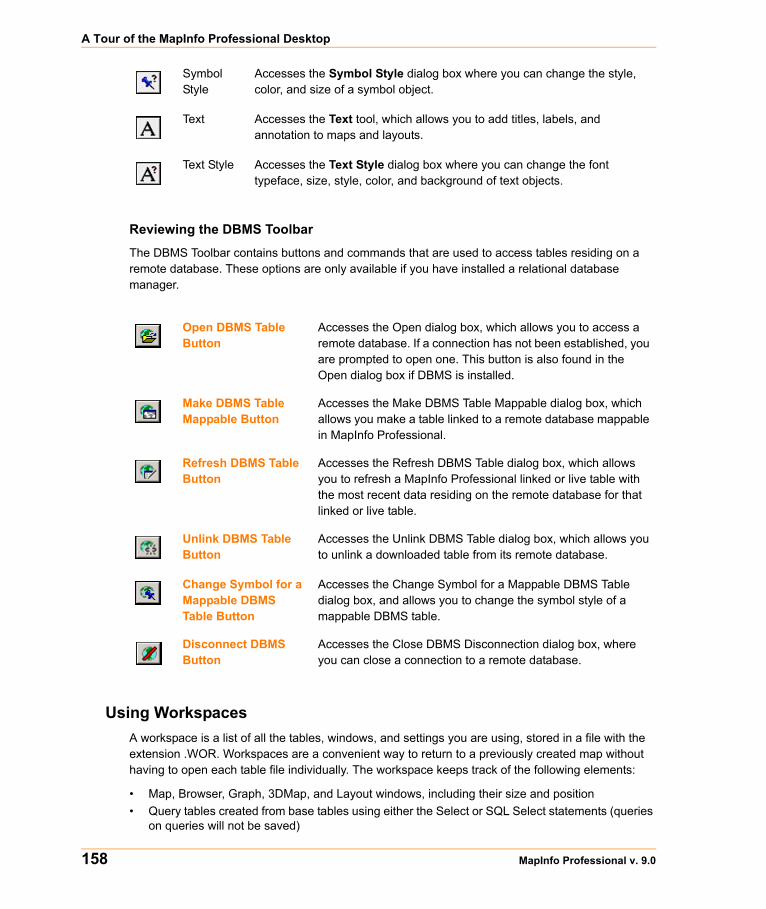
A Tour of the MapInfo Professional Desktop
158 MapInfo Professional v. 9.0
Reviewing the DBMS Toolbar
The DBMS Toolbar contains buttons and commands that are used to access tables residing on a remote database. These options are only available if you have installed a relational database manager.
Using WorkspacesA workspace is a list of all the tables, windows, and settings you are using, stored in a file with the extension .WOR. Workspaces are a convenient way to return to a previously created map without having to open each table file individually. The workspace keeps track of the following elements:
• Map, Browser, Graph, 3DMap, and Layout windows, including their size and position• Query tables created from base tables using either the Select or SQL Select statements (queries
on queries will not be saved)
Symbol Style
Accesses the Symbol Style dialog box where you can change the style, color, and size of a symbol object.
Text Accesses the Text tool, which allows you to add titles, labels, and annotation to maps and layouts.
Text Style Accesses the Text Style dialog box where you can change the font typeface, size, style, color, and background of text objects.
Open DBMS Table Button
Accesses the Open dialog box, which allows you to access a remote database. If a connection has not been established, you are prompted to open one. This button is also found in the Open dialog box if DBMS is installed.
Make DBMS Table Mappable Button
Accesses the Make DBMS Table Mappable dialog box, which allows you make a table linked to a remote database mappable in MapInfo Professional.
Refresh DBMS Table Button
Accesses the Refresh DBMS Table dialog box, which allows you to refresh a MapInfo Professional linked or live table with the most recent data residing on the remote database for that linked or live table.
Unlink DBMS Table Button
Accesses the Unlink DBMS Table dialog box, which allows you to unlink a downloaded table from its remote database.
Change Symbol for a Mappable DBMS Table Button
Accesses the Change Symbol for a Mappable DBMS Table dialog box, and allows you to change the symbol style of a mappable DBMS table.
Disconnect DBMS Button
Accesses the Close DBMS Disconnection dialog box, where you can close a connection to a remote database.
Chapter 4: The Basics of MapInfo Professional
User Guide 159
• Graphs• Thematic maps• Legend windows• Cosmetic objects• Labels• Styles for fonts, symbols, lines, and fill patterns used to display objects
To view the contents in the workspace file, open the .WOR file in MapInfo Professional, a text editor or word processor.
Note: When you save a workspace, you cannot save any references to selections or queries made by the Selection tools or the Query options.
Opening a Workspace
Any previously opened tables and windows will be left untouched when you open a workspace. However, to avoid cluttering up your screen with unnecessary windows, use the Close All command from the File menu before adding the workspace.
When you exit MapInfo Professional, the MapInfo Professional workspace (MAPINFOW.WOR) stores the last session (unless you have set your preferences so that the workspace will not be written).If there are files you don't want added to your workspace, close them before exiting.
To open a workspace:
1. Choose File > Open. The Open dialog box displays.
2. Choose Workspace (*.wor) from the Files of type drop-down list.
3. Specify the name, directory and drive for the workspace you want to open.
4. Click OK.
When you exit MapInfo Professional, the MapInfo Professional workspace (MapInfo.wor) stores your last session. If there are files you don't want added to your workspace, make sure you close them before exiting.
• For more information, see Opening Multiple Workspaces in the Help System.
How Renaming Tables Affects Workspaces
When you change the name of a table listed in a workspace, you invalidate the workspace. Table names are stored in the workspace file, so if change it, the workspace cannot find it.
For example, if you create a workspace called CUSTOMER.WOR that contains the STATES table. If you later rename the STATES table to AMERICA, MapInfo Professional will not be able to open the customer.wor workspace. It will try to open the STATES table and not be able to locate it.
There are two ways to avoid this problem:
• Make any table name changes before you start to build workspaces. • Open the workspace file in any text editor and manually change the table names.• Open a workspace. Rename the table(s) using the Rename Table dialog box and immediately
save the workspace.
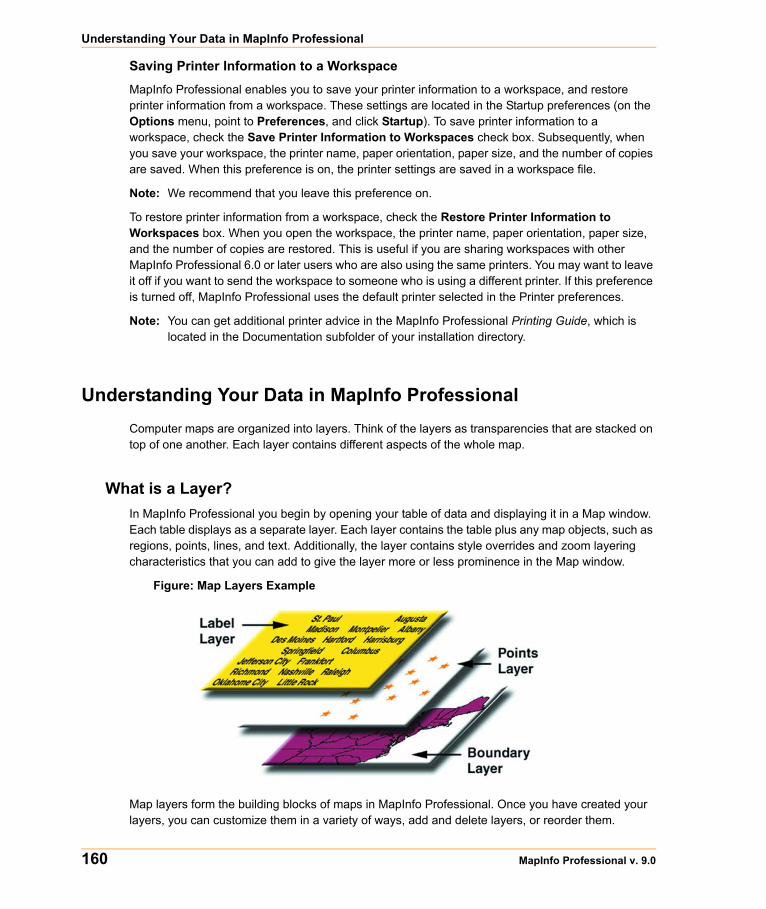
Understanding Your Data in MapInfo Professional
160 MapInfo Professional v. 9.0
Saving Printer Information to a Workspace
MapInfo Professional enables you to save your printer information to a workspace, and restore printer information from a workspace. These settings are located in the Startup preferences (on the Options menu, point to Preferences, and click Startup). To save printer information to a workspace, check the Save Printer Information to Workspaces check box. Subsequently, when you save your workspace, the printer name, paper orientation, paper size, and the number of copies are saved. When this preference is on, the printer settings are saved in a workspace file.
Note: We recommend that you leave this preference on.
To restore printer information from a workspace, check the Restore Printer Information to Workspaces box. When you open the workspace, the printer name, paper orientation, paper size, and the number of copies are restored. This is useful if you are sharing workspaces with other MapInfo Professional 6.0 or later users who are also using the same printers. You may want to leave it off if you want to send the workspace to someone who is using a different printer. If this preference is turned off, MapInfo Professional uses the default printer selected in the Printer preferences.
Note: You can get additional printer advice in the MapInfo Professional Printing Guide, which is located in the Documentation subfolder of your installation directory.
Understanding Your Data in MapInfo Professional Computer maps are organized into layers. Think of the layers as transparencies that are stacked on top of one another. Each layer contains different aspects of the whole map.
What is a Layer?In MapInfo Professional you begin by opening your table of data and displaying it in a Map window. Each table displays as a separate layer. Each layer contains the table plus any map objects, such as regions, points, lines, and text. Additionally, the layer contains style overrides and zoom layering characteristics that you can add to give the layer more or less prominence in the Map window.
Figure: Map Layers Example
Map layers form the building blocks of maps in MapInfo Professional. Once you have created your layers, you can customize them in a variety of ways, add and delete layers, or reorder them.
Chapter 4: The Basics of MapInfo Professional
User Guide 161
For example, one layer may contain state boundaries, a second layer may have symbols that represent capitals, a third layer might consist of text labels. By stacking these layers one on top of the other, you begin to build a complete map. You can display one, two, or many tables at a time.
Map Objects as Part of LayersWe mentioned earlier that maps in MapInfo Professional are made up of layers of map objects. There are five basic types of objects:
• Regions: closed objects that cover a given area. These include polygons, ellipses, and rectangles. For example, country boundaries, postal code boundaries, sales territories.
• Point objects: represent single locations of data. For example, customer locations, restaurants, parking meters. Points can also be combined into multipoint objects.
• Line objects: open objects that cover a given distance. These include lines, polylines, and arcs. Examples are streets, rivers, power lines.
• Text objects: text that describes a map or another object, such as labels and titles.• Collection objects: combination of region, line, and multipoint objects.
You can have each type of object in a separate layer (most common), or you can combine objects in the same layer. MapInfo Professional lets you create, edit, customize, and display these objects to make maps that meet your needs.
For information about drawing and editing map objects, see Drawing and Editing Objects in Chapter 7 on page 305 and see Moving Map Objects in the Help System.
Managing a Map’s LayersThe key to controlling your map layers is the Layer Control dialog box. The dialog box shows all the layers that make up the current Map window and the status of the layer attributes. These attributes are: visible, editable, selectable, and auto label. The icons above each check box column represent the attributes. ToolTips display over the attribute icons when you move your cursor over them to help familiarize yourself with each icon. It is easy to change a layer’s, or multiple layers’, attributes using the check boxes.
You also have options available to change the Display and Label settings; modify any thematic maps you have displayed; and reorder, add, or remove layers.
• For instructions on accessing the Layer Control dialog box, see Accessing Layer Control in the Help System.
• For instructions on changing layer order in the Layer Control dialog box, see Changing the Order of Contiguous Layers or Changing the Order of Random Layers topics in the Help System.
Working with Layers in the Layer Control
162 MapInfo Professional v. 9.0
Working with Layers in the Layer Control The Layer list has multi-select capabilities. To change the order of one or more contiguous layers, hold down the Shift key, select the layers, and drag them up or down. To change the order of one or more layers that are out of sequence, hold down the Ctrl key, select the layers, and drag them up or down.
When you begin to drag the layers, the cursor will change shape to represent the number of layers being dragged. If you are dragging one layer, the cursor becomes an arrow icon with a single layer icon attached to the top. If you are dragging multiple layers, the arrow icon will display multiple layer icons at the top. If you select layers that cannot be dragged or if you are attempting to insert layers where they cannot be inserted, the cursor becomes a circle with a line through it.
Note: A selection of layers that is out of sequence will become contiguous upon insertion.
You can also use the Up or Down buttons to move one or more layers. You cannot reorder or remove the Cosmetic layer. It will always be the top layer.
There is ToolTip associated with field entries in the Layer Control dialog box that allows you to view the whole name of the layer you hover over. This is to make it easier to identify the layers in your map. You can change the way ToolTips display in the using the Map Window Preferences. Select the Show ToolTips in Layer Control Dialog to display the ToolTip message or clear the check box to prevent ToolTips from showing in Layer Control. To access the Map Window Preferences dialog box, select Options > Preferences > Map Window.
Accessing Layer ControlTo access the Layer Control dialog box:
1. In the Map window, do one of the following:
• On the Map menu, click Layer Control
• Click the Layer Control button in the Main toolbar.
Use Layer Control to manipulate the layers and their attributes to determine the map display.
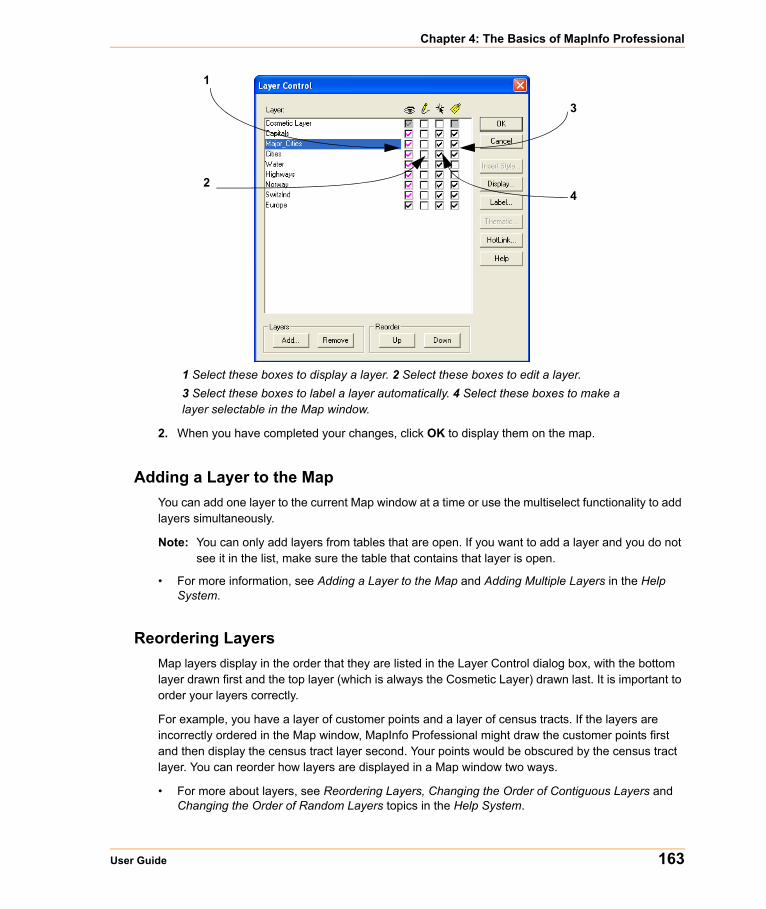
Chapter 4: The Basics of MapInfo Professional
User Guide 163
1 Select these boxes to display a layer. 2 Select these boxes to edit a layer. 3 Select these boxes to label a layer automatically. 4 Select these boxes to make a layer selectable in the Map window.
2. When you have completed your changes, click OK to display them on the map.
Adding a Layer to the MapYou can add one layer to the current Map window at a time or use the multiselect functionality to add layers simultaneously.
Note: You can only add layers from tables that are open. If you want to add a layer and you do not see it in the list, make sure the table that contains that layer is open.
• For more information, see Adding a Layer to the Map and Adding Multiple Layers in the Help System.
Reordering LayersMap layers display in the order that they are listed in the Layer Control dialog box, with the bottom layer drawn first and the top layer (which is always the Cosmetic Layer) drawn last. It is important to order your layers correctly.
For example, you have a layer of customer points and a layer of census tracts. If the layers are incorrectly ordered in the Map window, MapInfo Professional might draw the customer points first and then display the census tract layer second. Your points would be obscured by the census tract layer. You can reorder how layers are displayed in a Map window two ways.
• For more about layers, see Reordering Layers, Changing the Order of Contiguous Layers and Changing the Order of Random Layers topics in the Help System.
1
2
3
4
Working with Layers in the Layer Control
164 MapInfo Professional v. 9.0
Layer order is also important when you use the Select tool. The Select tool selects objects from the topmost Selectable layer. If you have several objects at the same location, it is difficult to select the exact one you want. You can reorder your layers in Layer Control so that the layer you want to select from is the new topmost layer.
MapInfo Professional does not allow you to control the front-to-back ordering of objects within a single map layer. If you are editing a table, and you draw a line on top of a circle, the line might appear in front of or behind the circle; you cannot control whether it is in the front or the back. You can, however, control the front-to-back ordering of objects in a Layout window.
Note: If you need to control the ordering of objects (for example, you need to make sure that your lines display on top of your regions), put the different object types in separate layers. Put your line objects in one table, and put your region objects in another table. Then use the Layer Control dialog box to order the layers.
• For more information, see Removing a Layer from the Map and Changing a Layer’s Display Options in the Help System.
Positioning and Sizing Labels Two features in the Map > Layer Control > Label button > Label Styles dialog box help you with label placement: Anchor Point and Offset.
To label a map object using the Label tool:
First, make sure that the layer containing the objects you want to label is selectable.
1. Click the Label button in the Main toolbar.
2. Click on an object with the Label tool to display a label for that object. MapInfo Professional labels the object with the values (from the column that you specified for that layer in the Label Options dialog box.
3. To change label options, choose Map > Layer Control. The Layer Control dialog box displays.
4. Press the Label button. The Label Options dialog box displays. Specify the desired label options, (Label Partial Objects, Allow Duplicate Text, Allow Overlapping Text, Styles, Position etc.)
The anchor point is the label’s position relative to the map object. Click on one of the buttons in the Label Style dialog box to select an anchor point. You have nine choices.
The anchor point is an ongoing attribute of the label. For example, if you anchor a point object’s label at Center Left and you increase the label’s font size, the text will grow to the left. This way, the text can never overwrite the point.
The default anchor point varies with the type of map object you are labeling:
• Regions default to Center.• Lines default to Below Center.• Points default to Right.
Label offset is how far away a label is from its anchor point. Specify the number of half spaces you want the label to be from the anchor point in the Label Offset box.
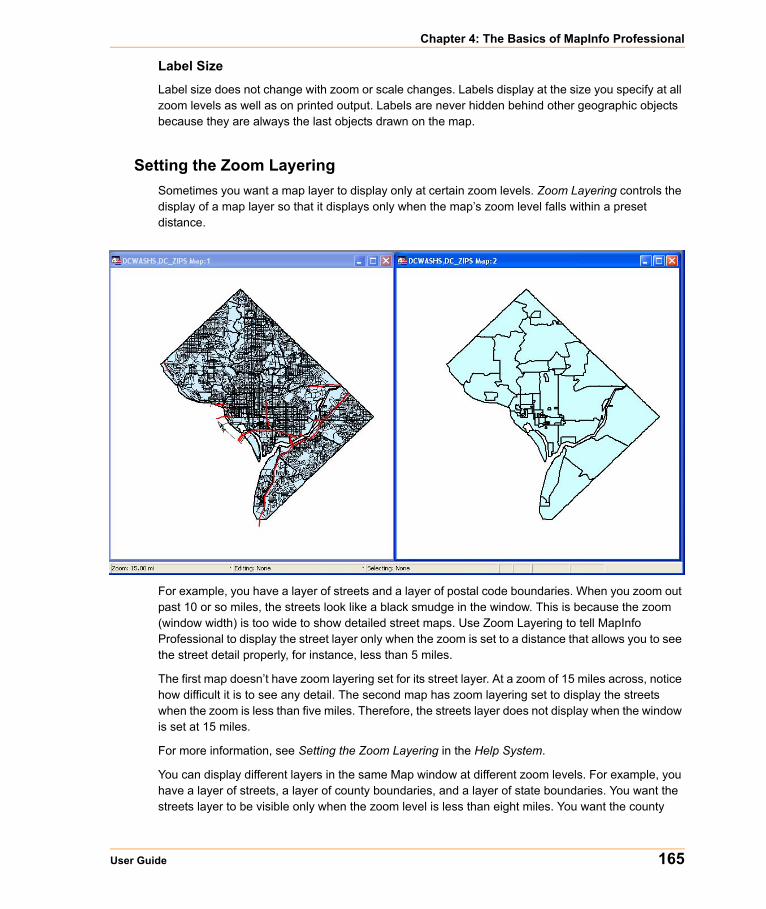
Chapter 4: The Basics of MapInfo Professional
User Guide 165
Label Size
Label size does not change with zoom or scale changes. Labels display at the size you specify at all zoom levels as well as on printed output. Labels are never hidden behind other geographic objects because they are always the last objects drawn on the map.
Setting the Zoom LayeringSometimes you want a map layer to display only at certain zoom levels. Zoom Layering controls the display of a map layer so that it displays only when the map’s zoom level falls within a preset distance.
For example, you have a layer of streets and a layer of postal code boundaries. When you zoom out past 10 or so miles, the streets look like a black smudge in the window. This is because the zoom (window width) is too wide to show detailed street maps. Use Zoom Layering to tell MapInfo Professional to display the street layer only when the zoom is set to a distance that allows you to see the street detail properly, for instance, less than 5 miles.
The first map doesn’t have zoom layering set for its street layer. At a zoom of 15 miles across, notice how difficult it is to see any detail. The second map has zoom layering set to display the streets when the zoom is less than five miles. Therefore, the streets layer does not display when the window is set at 15 miles.
For more information, see Setting the Zoom Layering in the Help System.
You can display different layers in the same Map window at different zoom levels. For example, you have a layer of streets, a layer of county boundaries, and a layer of state boundaries. You want the streets layer to be visible only when the zoom level is less than eight miles. You want the county
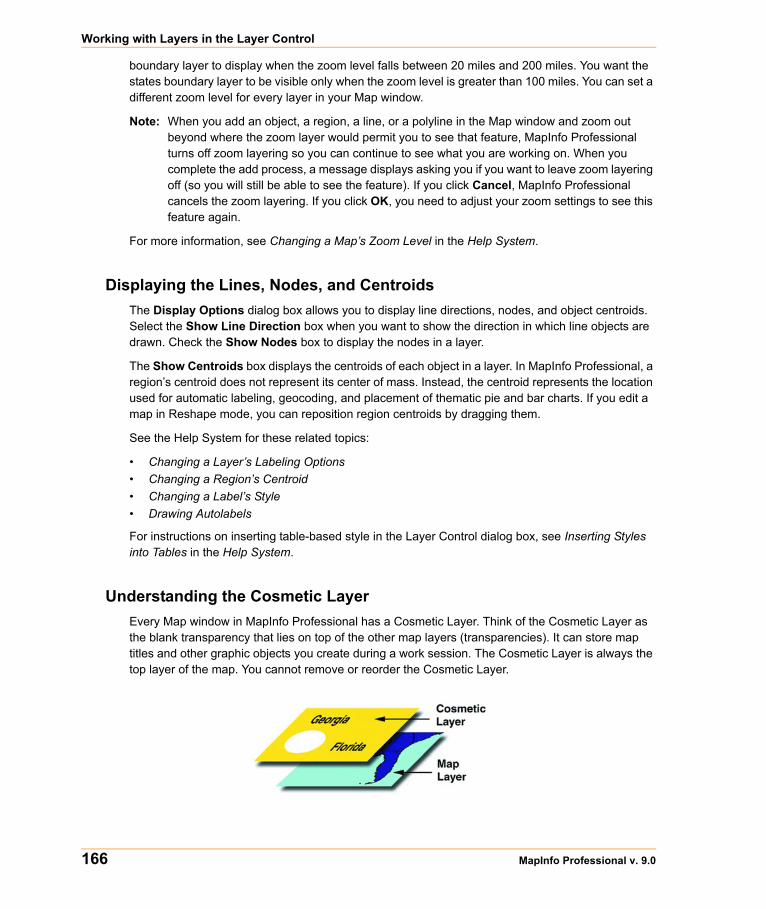
Working with Layers in the Layer Control
166 MapInfo Professional v. 9.0
boundary layer to display when the zoom level falls between 20 miles and 200 miles. You want the states boundary layer to be visible only when the zoom level is greater than 100 miles. You can set a different zoom level for every layer in your Map window.
Note: When you add an object, a region, a line, or a polyline in the Map window and zoom out beyond where the zoom layer would permit you to see that feature, MapInfo Professional turns off zoom layering so you can continue to see what you are working on. When you complete the add process, a message displays asking you if you want to leave zoom layering off (so you will still be able to see the feature). If you click Cancel, MapInfo Professional cancels the zoom layering. If you click OK, you need to adjust your zoom settings to see this feature again.
For more information, see Changing a Map’s Zoom Level in the Help System.
Displaying the Lines, Nodes, and CentroidsThe Display Options dialog box allows you to display line directions, nodes, and object centroids. Select the Show Line Direction box when you want to show the direction in which line objects are drawn. Check the Show Nodes box to display the nodes in a layer.
The Show Centroids box displays the centroids of each object in a layer. In MapInfo Professional, a region’s centroid does not represent its center of mass. Instead, the centroid represents the location used for automatic labeling, geocoding, and placement of thematic pie and bar charts. If you edit a map in Reshape mode, you can reposition region centroids by dragging them.
See the Help System for these related topics:
• Changing a Layer’s Labeling Options • Changing a Region’s Centroid• Changing a Label’s Style• Drawing Autolabels
For instructions on inserting table-based style in the Layer Control dialog box, see Inserting Styles into Tables in the Help System.
Understanding the Cosmetic LayerEvery Map window in MapInfo Professional has a Cosmetic Layer. Think of the Cosmetic Layer as the blank transparency that lies on top of the other map layers (transparencies). It can store map titles and other graphic objects you create during a work session. The Cosmetic Layer is always the top layer of the map. You cannot remove or reorder the Cosmetic Layer.
Chapter 4: The Basics of MapInfo Professional
User Guide 167
You can only make the Cosmetic Layer editable or selectable. Other Layer Control options (labeling, zoom layering, display mode) are not available for the Cosmetic Layer. To select fill patterns, line types, symbols, and text font for the Cosmetic Layer, use the Line Style, Region Style, Symbol Style and Text Style commands from the Options menu. When the Cosmetic Layer is editable, you can access the style options from the Drawing Toolbar.
The contents of the Cosmetic Layer are linked proportionally to the map. Map objects (except for symbols) and text in the Cosmetic Layer are proportionally linked to the zoom level of the map. If you draw objects in the Cosmetic Layer and then change the map’s zoom from 30 to 100 miles, the size of the objects will appear smaller.
See these related topics in the Help System:
• Using the Cosmetic Layer• Saving Cosmetic Layer Objects• Saving Objects on the Cosmetic Layer• Removing Cosmetic Objects• Disabling the Save Cosmetic Objects Warning Dialog Box
Making the Layers “Editable”To make changes to the graphic objects in a layer, you must make the layer editable. You can draw objects on that layer, add text, combine, or delete objects. You can only make one layer editable at a time.
• For specific instructions, see Making Layers Editable in the Help System.
Making a Read-Only Table “Editable”
If you are working with tables that were opened from Excel, Lotus, or ASCII files, you may have noticed that they come in as read-only tables. Because the files are not in native MapInfo Professional formats or standard DBF format, MapInfo Professional is unable to edit the tabular information contained in these tables.
If you wish to modify the table information, you must save a copy of the table.
• For instructions on making read-only map layers editable, see Making Layers Editable in the Help System.
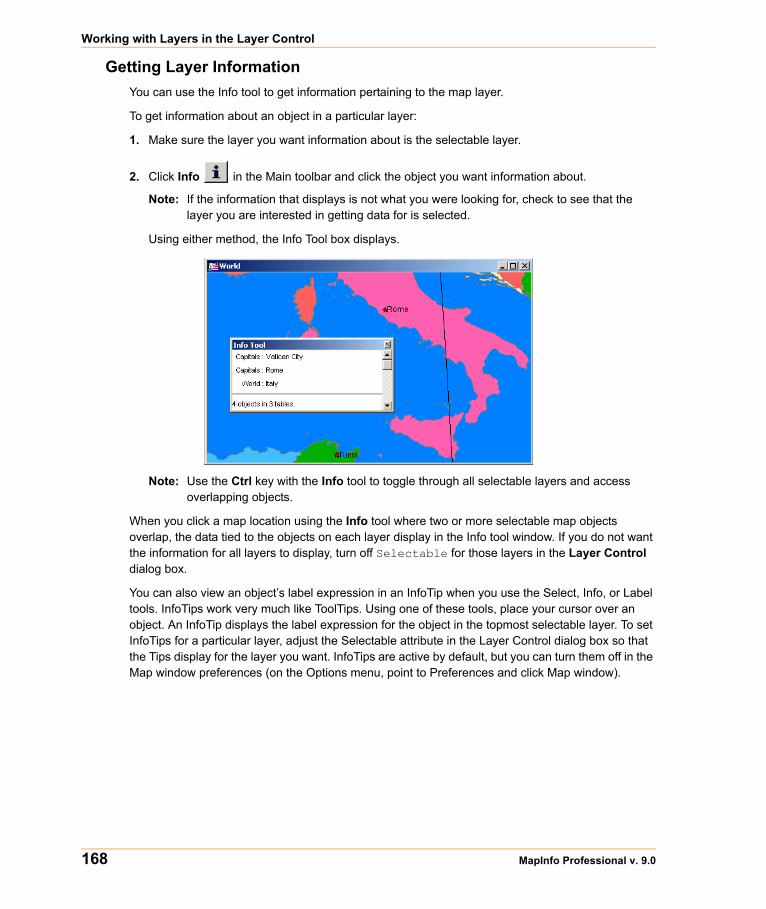
Working with Layers in the Layer Control
168 MapInfo Professional v. 9.0
Getting Layer Information You can use the Info tool to get information pertaining to the map layer.
To get information about an object in a particular layer:
1. Make sure the layer you want information about is the selectable layer.
2. Click Info in the Main toolbar and click the object you want information about.
Note: If the information that displays is not what you were looking for, check to see that the layer you are interested in getting data for is selected.
Using either method, the Info Tool box displays.
Note: Use the Ctrl key with the Info tool to toggle through all selectable layers and access overlapping objects.
When you click a map location using the Info tool where two or more selectable map objects overlap, the data tied to the objects on each layer display in the Info tool window. If you do not want the information for all layers to display, turn off Selectable for those layers in the Layer Control dialog box.
You can also view an object’s label expression in an InfoTip when you use the Select, Info, or Label tools. InfoTips work very much like ToolTips. Using one of these tools, place your cursor over an object. An InfoTip displays the label expression for the object in the topmost selectable layer. To set InfoTips for a particular layer, adjust the Selectable attribute in the Layer Control dialog box so that the Tips display for the layer you want. InfoTips are active by default, but you can turn them off in the Map window preferences (on the Options menu, point to Preferences and click Map window).
Chapter 4: The Basics of MapInfo Professional
User Guide 169
Selecting Objects in a Layer If you only want to select objects for further analysis rather than edit the objects, make the layer selectable. More than one layer can be selectable at a time. If a layer is editable, it is also selectable.
Many MapInfo Professional functions require that map objects be selected before performing the particular operation. To use the Select tool, Label tool or Info tool you must first make the layer selectable. Unlike the editable feature, more than one layer may be selectable at the same time. You may, however, only select from one layer at a time.
The Select tool selects objects from the topmost Selectable layer. To select an object that is not in the top Selectable layer, you can turn off the Selectable option in Layer Control for every layer above the layer you want to select from. Using the multi-select functionality, you can do this in just a few steps. Select the layers, and select a Selectable check box for one of the layers. The Selectable attribute is cleared for the selected layers. As an alternative, you can leave all layers Selectable and use the Ctrl key in combination with the Select tool to cycle through each Selectable layer.
Note: The instructions for making a layer editable are the same, except that you select the check box in the Editable column instead.
• For instructions on making objects in a layer selectable, see Selecting Objects in a Layer in the Help System.
For example, if you want to find all customers who live within a fifty kilometers radius of Paris, make the Street layer selectable. If the map also includes a layer of hospitals (which you do not want to include in the radius search), turn off the Selectable option for the hospital layer.
The Editable or Selectable options only apply to the Map window itself. You can always select objects using the Select or SQL Select commands regardless of whether a layer is selectable.
Working with Thematic LayersWhen you create a thematic map in MapInfo Professional, the thematic shading is added to your map as a separate layer. It is drawn on top of the layer, from which it gets the raw data.Separating a thematic layers from its base layer provides you with several important options:
• Graduated symbol thematic maps do not require that your base layer contain point objects. Instead, graduated symbol objects are built regardless of the map object type. Therefore, even if your base layer contains region or line objects, you will still be able to create a graduated symbols map.
• You can have multiple thematic layers per base layer. In some cases, you do not have to add another base layer to the map to create another thematic layer. You can display more than one thematic layer at a time, as well as perform bivariate thematic mapping.
• You can use Layer Control to turn the display on or off for a given thematic layer. The layer it is based on can continue to display. You can also set individual zoom layers on thematic maps.
Working with Thematic Layers
170 MapInfo Professional v. 9.0
Ordering Thematic LayersTo display thematic layers properly, they must be in a specific order. This is especially important when you want to display more than one thematic layer at a time. For example, you would want pie or bar charts for an area map to display on top of regions that are shaded in order to see them.
The following lists the order of map layers from top to bottom (note that map layers are drawn from the bottom up):
1. Pies, Bars, or Graduated Symbol thematic layer.
2. Dot Density thematic layer.
3. Ranged thematic layer – where Color or Size Attributes are applied.
4. Ranged (or Individual Value) thematic layer – where All Attributes are applied.
5. Major layer or base layer.
6. Grid thematic layer.
When you create a new thematic layer, MapInfo Professional automatically inserts it into its proper place.
• For more information, see Reordering Thematic Layers in the Help System.
Displaying Thematic LayersYou can turn the display on and off for thematic layers the same way you can for other map layers. All the display settings in Layer Control are also applicable to thematic layers, enabling you to set a zoom level for each thematic layer. You can also access the Modify Thematic Layer dialog box through Layer Control by clicking the Thematic button.
Thematic layers are always drawn after their base layer. Therefore, they appear above their base layer in the Layer Control list, and are indented to distinguish them from other map layers.
Thematic layers are displayed in the list with this naming convention:
<Thematic type> with/by <variable-list>
The type of thematic map is noted first, followed by the list of variables used to create the map. For example, a pie thematic layer that uses commuting data is listed this way:
Pies with ComAlone, ComCarpool...
The variable list is truncated if there is not enough room to display each variable used in your thematic analysis. For more information about thematic mapping, see Using Thematic Mapping to Analyze Information on page 414.
Converting Objects into Region Objects When you convert a circle or ellipse into a region, the region contains 101 nodes. When you convert an arc into a region, the number of nodes depends on the starting and ending angle of the arc. If the arc spans 180 degrees (for example, the starting angle is zero and the ending angle is 180), a region based on the arc will contain 52 nodes; if the arc spans 90 degrees, a region based on the arc will contain 27 nodes; etc.
Chapter 4: The Basics of MapInfo Professional
User Guide 171
If you perform extensive map editing, you may need to convert polylines to regions. If you cut or copy a group of selected nodes, MapInfo Professional treats the set of nodes as a polyline object, and places the polyline on the clipboard. If you then paste the object, MapInfo Professional places the polyline on your map. At this point, you may want to perform Convert to Regions, depending on whether you want the finished object to be a region.
Convert to Regions also allows you to perform node-editing operations (for example, adding and moving nodes) on objects that ordinarily do not allow node editing. For example, MapInfo Professional does not allow you to add nodes to rectangle objects; however, if you convert a rectangle object to a region, you can then add nodes to the region.
To convert objects into region objects:
1. Make the Map window active.
2. Choose the layer containing the objects and make it editable.
3. Select one or more objects from the editable layer.
4. Choose Objects > Convert to Regions.
When you choose Convert to Regions, MapInfo Professional converts each of the selected objects into a region object. Each object is converted into a separate region; MapInfo Professional does not combine all selected objects into one region. To combine objects, use the Combine command.
MapInfo Professional automatically assigns the current region style to each of the region objects. To specify a region style, choose Options > Region Style.
Line, polyline, arc, ellipse, rectangle, and rounded rectangle objects may all be converted to regions. The Convert to Regions command does not affect point objects, text objects and region objects.
• For more information, see the Creating Regions from Polygonal Areas Enclosed by Polylines topic in the Help System.
Working with Raster and Grid Layers in Layer ControlA raster image is a type of computerized image that consists of row after row of tiny dots (pixels). If you have a scanner and scanner software, you can create a raster image by scanning a paper map. After you scan a map image and store the image in a file, you can display the file using MapInfo Professional.
In contrast, vector images contain coordinate-based data structures represented by x and y coordinates (most of MapInfo Professional’s data is in vector format).
The Help System contains these related topics:
• Displaying a Raster Image• Registering the Coordinates of a Raster Image • Working with Raster Images• Changing the Display of a Raster Image
Working with Seamless Layers
172 MapInfo Professional v. 9.0
Converting Grid Files to MapInfo Professional Grids (*.mig) The Grid Tools (Create MapInfo Grid from Table of Objects and Create MapInfo Grid from Other Grid Files) In MapInfo Professional allow you to convert Grid Files to MapInfo Professional Grids (*.mig). These tools convert any grid file for which there is a grid handler present with the output being in MapInfo Professional (*.mig) format. You can apply relief shading from a user-specifiable virtual light source and control the color inflection values. The color files are simple text files that you can edit to specify the color inflection values by specific value or as a percentage of the range of data values. You can open and display the new grid after the conversion.
• For specific instructions, see Converting Grid Files to MapInfo Professional Grids and Specifying Inflection Values with the MapInfo Professional Grid Converter in the Help System.
Adjusting the Translucency of a Grid Thematic Map
The Translucency slider control in the Modify Thematic Map dialog box allows you to control the percentage that layers show through raster images. A translucent image allows you to partially see through the image. Translucent images can be layered on top of other layers so that the lower layers are partially visible through the image.
Note: The Grid Appearance dialog box allows you to specify color inflection distribution options for grid maps.
• For specific instructions, see Adjusting the Translucency of a Grid Thematic Map in the Help System.
Working with Seamless LayersUse or create a seamless map layer to treat a group of base tables as if they were one. A seamless layer allows you to change display attributes, apply or change labeling or use the Layer Control dialog box for an entire group of tables at once. You can also retrieve information using the Info tool, and select or browse any one of the layer’s base tables. A base table can be any regular MapInfo Professional table. Grid layers cannot be made seamless.
This feature is especially useful when you want to display a vector or raster backdrop for your maps such as joining street or boundary maps. For example, you may have a seamless layer of county boundaries made up of several individual county tables.
Chapter 4: The Basics of MapInfo Professional
User Guide 173
Features Available with Seamless Layers Since a seamless layer is actually made up of several base tables, MapInfo Professional does treat it a little differently than a regular MapInfo Professional table. You can use the following MapInfo Professional features with a seamless map layer:
• Layer ControlUse any of the functions except Thematic Mapping from the Layer control dialog box on your seamless layer. Add, Remove, or Reorder layers or set Display, Zoom Layering or Label options for the seamless layer (all base tables) at one time. However, you cannot make a seamless layer editable.
• Info ToolRetrieve information about a particular object in a base table.
• Select ToolsSelect objects from the seamless layer. You can only select a group of objects if they reside in the same base table. Press the Shift key while clicking the Select Tool to do so. If you attempt to select several objects that reside in different base tables, MapInfo Professional will only select objects in one base table. If you use the Marquee or Radius select tools and the selected area spreads across two different base tables, MapInfo Professional selects the table in either the center of the circle or polygon.
• Browse TableDisplay a Browser window of a particular seamless table. You are prompted to select a base table.
Turning Seamless Layers On and Off
If you need to edit the structure of your seamless layer, you’ll need to turn your seamless layer off.
To turn your seamless layer off:
1. Choose Options > Show MapBasic Window. The MapBasic Window displays.
2. Type set table “tablename” seamless off. MapInfo Professional turns off the seamless layer.
3. Display the table in a browser to view or edit its table structure. If you edit the table structure, you will need to recompile the seamless layer.
MapInfo Professional turns off the seamless layer. Display the table in a browser to view or edit its table structure. Use the Seamless Table Manager to add or create seamless tables.
To turn the seamless layer on:
1. Choose Options > Show MapBasic Window. The MapBasic Window displays.
2. Type set table “tablename” seamless on. MapInfo Professional turns the seamless layer on again.
Opening a Seamless Map Layer
MapInfo Professional includes sample seamless maps or you can create your own. Some of these data files are available on the MapInfo web site in the MapInfo Professional Tutorial data. We recommend you download this data for use with these examples.
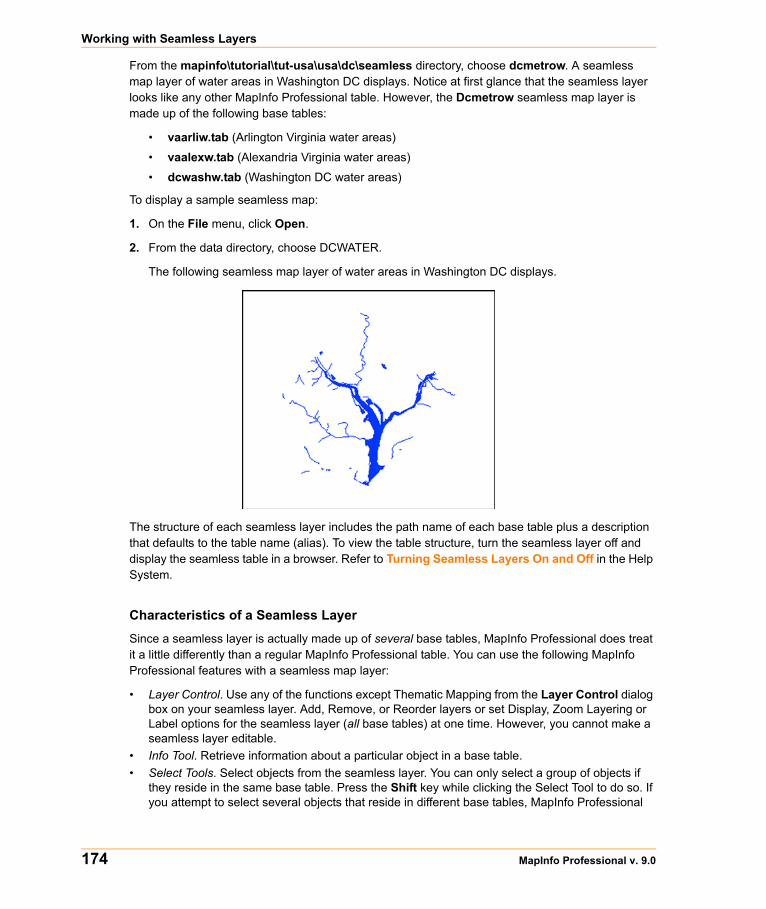
Working with Seamless Layers
174 MapInfo Professional v. 9.0
From the mapinfo\tutorial\tut-usa\usa\dc\seamless directory, choose dcmetrow. A seamless map layer of water areas in Washington DC displays. Notice at first glance that the seamless layer looks like any other MapInfo Professional table. However, the Dcmetrow seamless map layer is made up of the following base tables:
• vaarliw.tab (Arlington Virginia water areas)
• vaalexw.tab (Alexandria Virginia water areas)
• dcwashw.tab (Washington DC water areas)
To display a sample seamless map:
1. On the File menu, click Open.
2. From the data directory, choose DCWATER.
The following seamless map layer of water areas in Washington DC displays.
The structure of each seamless layer includes the path name of each base table plus a description that defaults to the table name (alias). To view the table structure, turn the seamless layer off and display the seamless table in a browser. Refer to Turning Seamless Layers On and Off in the Help System.
Characteristics of a Seamless Layer
Since a seamless layer is actually made up of several base tables, MapInfo Professional does treat it a little differently than a regular MapInfo Professional table. You can use the following MapInfo Professional features with a seamless map layer:
• Layer Control. Use any of the functions except Thematic Mapping from the Layer Control dialog box on your seamless layer. Add, Remove, or Reorder layers or set Display, Zoom Layering or Label options for the seamless layer (all base tables) at one time. However, you cannot make a seamless layer editable.
• Info Tool. Retrieve information about a particular object in a base table. • Select Tools. Select objects from the seamless layer. You can only select a group of objects if
they reside in the same base table. Press the Shift key while clicking the Select Tool to do so. If you attempt to select several objects that reside in different base tables, MapInfo Professional
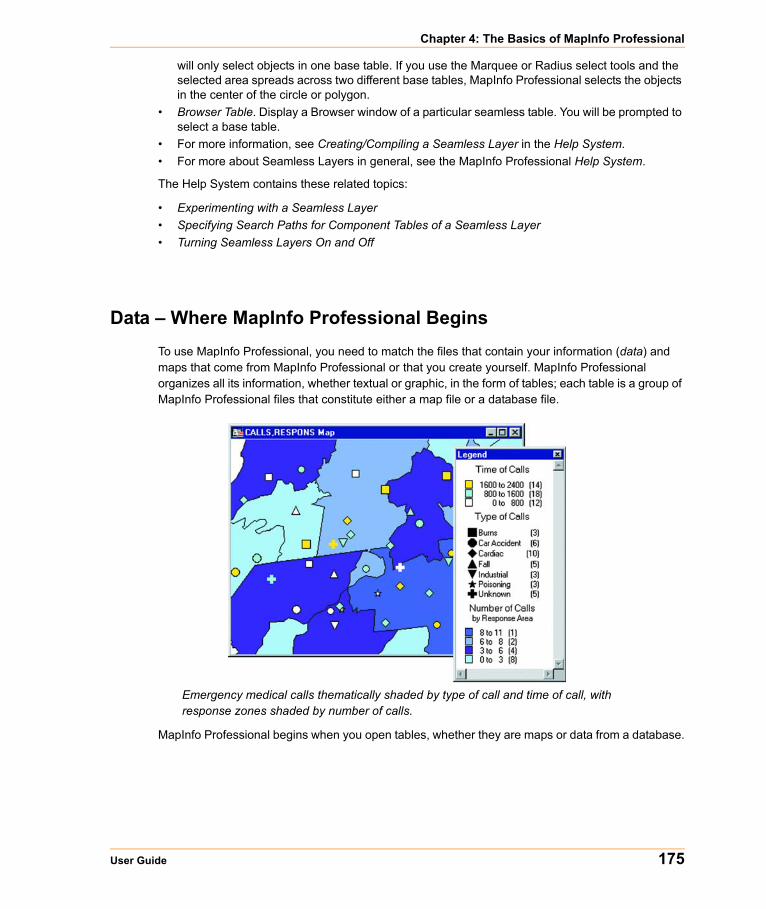
Chapter 4: The Basics of MapInfo Professional
User Guide 175
will only select objects in one base table. If you use the Marquee or Radius select tools and the selected area spreads across two different base tables, MapInfo Professional selects the objects in the center of the circle or polygon.
• Browser Table. Display a Browser window of a particular seamless table. You will be prompted to select a base table.
• For more information, see Creating/Compiling a Seamless Layer in the Help System. • For more about Seamless Layers in general, see the MapInfo Professional Help System.
The Help System contains these related topics:
• Experimenting with a Seamless Layer• Specifying Search Paths for Component Tables of a Seamless Layer• Turning Seamless Layers On and Off
Data – Where MapInfo Professional BeginsTo use MapInfo Professional, you need to match the files that contain your information (data) and maps that come from MapInfo Professional or that you create yourself. MapInfo Professional organizes all its information, whether textual or graphic, in the form of tables; each table is a group of MapInfo Professional files that constitute either a map file or a database file.
Emergency medical calls thematically shaded by type of call and time of call, with response zones shaded by number of calls.
MapInfo Professional begins when you open tables, whether they are maps or data from a database.
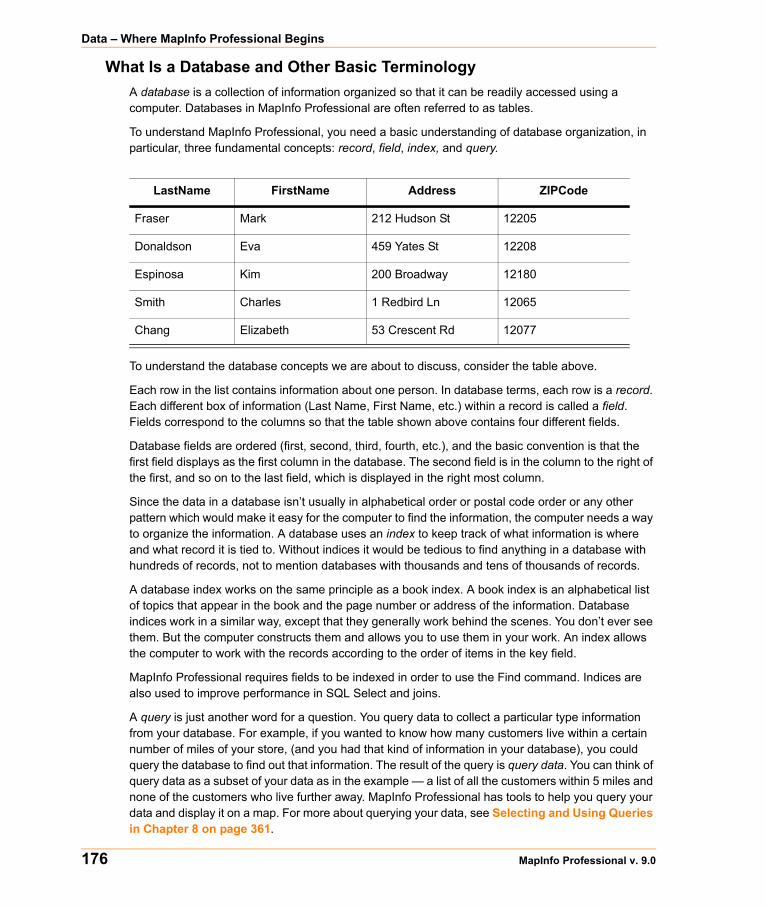
Data – Where MapInfo Professional Begins
176 MapInfo Professional v. 9.0
What Is a Database and Other Basic TerminologyA database is a collection of information organized so that it can be readily accessed using a computer. Databases in MapInfo Professional are often referred to as tables.
To understand MapInfo Professional, you need a basic understanding of database organization, in particular, three fundamental concepts: record, field, index, and query.
To understand the database concepts we are about to discuss, consider the table above.
Each row in the list contains information about one person. In database terms, each row is a record. Each different box of information (Last Name, First Name, etc.) within a record is called a field. Fields correspond to the columns so that the table shown above contains four different fields.
Database fields are ordered (first, second, third, fourth, etc.), and the basic convention is that the first field displays as the first column in the database. The second field is in the column to the right of the first, and so on to the last field, which is displayed in the right most column.
Since the data in a database isn’t usually in alphabetical order or postal code order or any other pattern which would make it easy for the computer to find the information, the computer needs a way to organize the information. A database uses an index to keep track of what information is where and what record it is tied to. Without indices it would be tedious to find anything in a database with hundreds of records, not to mention databases with thousands and tens of thousands of records.
A database index works on the same principle as a book index. A book index is an alphabetical list of topics that appear in the book and the page number or address of the information. Database indices work in a similar way, except that they generally work behind the scenes. You don’t ever see them. But the computer constructs them and allows you to use them in your work. An index allows the computer to work with the records according to the order of items in the key field.
MapInfo Professional requires fields to be indexed in order to use the Find command. Indices are also used to improve performance in SQL Select and joins.
A query is just another word for a question. You query data to collect a particular type information from your database. For example, if you wanted to know how many customers live within a certain number of miles of your store, (and you had that kind of information in your database), you could query the database to find out that information. The result of the query is query data. You can think of query data as a subset of your data as in the example — a list of all the customers within 5 miles and none of the customers who live further away. MapInfo Professional has tools to help you query your data and display it on a map. For more about querying your data, see Selecting and Using Queries in Chapter 8 on page 361.
LastName FirstName Address ZIPCode
Fraser Mark 212 Hudson St 12205
Donaldson Eva 459 Yates St 12208
Espinosa Kim 200 Broadway 12180
Smith Charles 1 Redbird Ln 12065
Chang Elizabeth 53 Crescent Rd 12077

Chapter 4: The Basics of MapInfo Professional
User Guide 177
What Data Can I Use in MapInfo Professional?MapInfo Professional allows you to use data that was created in other file formats. When you bring data into MapInfo Professional for the first time, you need to specify its format. For example, if your data is in delimited ASCII format, choose Delimited ASCII from the File Format drop-down list.
Data file choices include:
• Microsoft Access• Microsoft Excel• dBASE DBF
• ESRI ® shapefiles• Raster Image• Grid Images• ASCII Delimited Text• Lotus 1–2–3• Remote Databases (Oracle, Informix, SQL Server, etc.)• Workspace• Comma Delimited CSV files
When you choose a particular file format, the File Name box will only list files that have the appropriate extension. For example, if you choose dBASE DBF from the File Format drop-down list, MapInfo Professional will only list files that are in dBASE format.
When you choose a file other than a MapInfo-formatted file type, MapInfo Professional creates a table structure for that data based on the type of file that it is.
Note: During the .TAB file creation process, the original file is in no way altered. The file retains its original properties.
When you open that table in future work sessions, MapInfo Professional will treat these files as if they were in MapInfo Professional’s native format. The next time you want to open the table, you should choose the .TAB format for the table. If you accidently attempt to open the file again with its original file format, MapInfo Professional prompts you with the message:
Table definition already exists. Overwrite it?
This message displays because MapInfo Professional has already created a table for that file. To use the file you have already created, press Cancel and open the associated .TAB file.
Also keep in mind that MapInfo Professional supports long filenames and UNC paths. The UNC paths allow you to access your data without having to remember your drive mappings from one session to another.
To display your table in the Map window, your data must contain X and Y coordinates. If it doesn’t already, you can add them using MapInfo Professional. Assigning these coordinates is called geocoding. More about geocoding follows later in this chapter and in Chapter 4: Putting Your Data on the Map.
The Help System contains these related topics:
• Displaying your Excel (.XLS) Data• Displaying your Access (.MDB) Data• Displaying your Comma Delimited Data
Data – Where MapInfo Professional Begins
178 MapInfo Professional v. 9.0
• Displaying your dBase Data• Displaying your Lotus 1-2-3 Data• Displaying your ESRI Shapefile Data• Registering and Displaying your ASCII Data• Importing and Displaying GML File Data• Displaying Your Remote DBMS Data• Displaying and Importing Data from a Web Map Service
Support for Raster ImagesMapInfo Professional supports raster image display. Raster images are computerized pictures. These graphic images can be used as backgrounds for maps you create in MapInfo Professional and can serve as a reference for your displayed data.
When you bring in a raster image to MapInfo Professional, you may need to register it (specify its map coordinates) so MapInfo Professional can display it properly. Choosing the Raster Image file format from the Open dialog box will bring you to the Image Registration dialog box where you can specify the appropriate map coordinates. Once you register the image, a process that creates a .TAB file for the image, you can open it as you would open any table in a Map window. Images that you purchase from MapInfo Professional will already be registered.
If a raster image is georeferenced it will be automatically opened. If a raster image has an associated world file, you will be prompted to choose the projection. If you open a raster image that does not have any georeferencing data, you will be prompted to display or register the image.
For a full discussion of raster image display, see Registering SPOT Images in Appendix C on page 861.
The MapInfo Professional raster handlers support:
• LeadTools to version 15• MrSID SDK (3.2), to provide support for MG3 files• Multi-threading; specifically for ECW and the Government handlers (ADRG, ASRP, CADRG, CIB,
NITF)
AirPhotoUSA provides raster images at different elevations for particular areas in the United States. The AirPhotoUSA map handler allows MapInfo Professional users to open and display the imagery contained in AirPhotoUSA Map files as a layer. These files are treated just like any other raster file in MapInfo Professional. The MAPINFOW.PRJ file contains AirPhotoUSA information.
You can use the AirPhotoUSA Conterminous U.S. coordinate system without making any changes. However, if you want MapInfo Professional to recognize and give a name to that coordinate system, or to use it for other purposes, you must add it to the MAPINFOW.PRJ.
Understanding the Files Associated with MapInfo Professional Tables
When you open your data file, MapInfo Professional creates a table. This table consists of at least two separate files. The first file contains the structure of the data. The second file contains the raw data. All MapInfo Professional tables have the following two files:
• <SOMEFILE>.tab: This file describes the structure of your table. It is a small text file describing the format of the file containing your data.
Chapter 4: The Basics of MapInfo Professional
User Guide 179
• <SOMEFILE>.DAT or <SOMEFILE>.WKS, .DBF, .XLS: These files contain your tabular data. If you are working with a dBASE/FoxBASE, delimited ASCII, Lotus 1–2–3, Microsoft Excel, or Microsoft Access file, your MapInfo Professional table will consist of a .TAB file and your data or spreadsheet file. For raster tables, the equivalent extension might be BMP, TIF, or GIF.
Your data may also contain graphic objects. Once you assign X and Y coordinates to your data records, your table will also contain graphic objects. In Geocoding – Assigning Coordinates to Records on page 203, you will learn how to assign X and Y coordinates to your data records so you can display them on a map. If you already have graphic objects in your table, there are two more files associated with the table:
• <SOMEFILE>.MAP: This file describes the graphic objects.• <SOMEFILE>.ID: This file is a cross reference file that links the data with the objects.
For a Microsoft Access table, there will be a file SOMEFILE.AID associated with the table instead of SOMEFILE.ID. This file is a cross reference file that links the data with the objects for a Microsoft Access table.
Your table may also include an index file. The index file allows you to search for map objects using the Find command. If you want to locate an address, city, or state using the Find command, those fields must be indexed in your table. The index is located in:
• <SOMEFILE>.IND
Opening Your Data in MapInfo Professional
You can open your Excel (.XLS), dBase (.DBF), Microsoft Access (.MDB), and ASCII (.TXT) in MapInfo Pro and display that data on a map. There are three steps to accomplishing this:
1. Creating a copy of your data in MapInfo format.
2. Creating points on a map using either coordinates in your data or by matching your data to a search file (see When Do I Geocode vs. Create Points? in Chapter 4 on page 192 for this process).
3. Display your data on the map (see Displaying Your Data on the Map in Chapter 4 on page 216 to complete this process).
If you are accessing your data remotely or use SpatialWare or other ODBC supported database product, see Understanding Remote Tables and Databases in Chapter 6 on page 278and Working with the MapBasic Window in the MapInfo Professional Help System for additional support. For more information about converting, displaying, and printing your data, see Understanding Your Data in Chapter 5 on page 257.
Opening MapInfo TablesTo work with the data in your database, you open the file or table that contains the data. MapInfo provides some free introductory data you can open as soon as you get MapInfo Professional.
Note: When you open a table and select a new Preferred View from the drop-down list, MapInfo Professional remembers your selection and uses it the next time you open a table.
• For instructions on opening the free introductory data provided by MapInfo, see Opening the MapInfo Professional Introductory Data in the Help System.
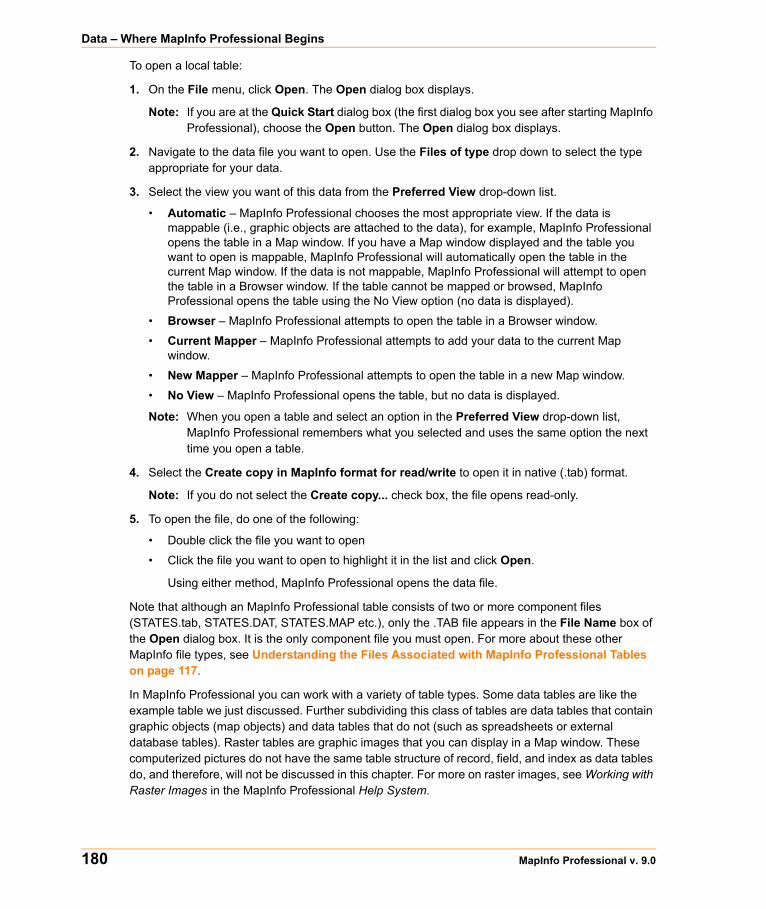
Data – Where MapInfo Professional Begins
180 MapInfo Professional v. 9.0
To open a local table:
1. On the File menu, click Open. The Open dialog box displays.
Note: If you are at the Quick Start dialog box (the first dialog box you see after starting MapInfo Professional), choose the Open button. The Open dialog box displays.
2. Navigate to the data file you want to open. Use the Files of type drop down to select the type appropriate for your data.
3. Select the view you want of this data from the Preferred View drop-down list.
• Automatic – MapInfo Professional chooses the most appropriate view. If the data is mappable (i.e., graphic objects are attached to the data), for example, MapInfo Professional opens the table in a Map window. If you have a Map window displayed and the table you want to open is mappable, MapInfo Professional will automatically open the table in the current Map window. If the data is not mappable, MapInfo Professional will attempt to open the table in a Browser window. If the table cannot be mapped or browsed, MapInfo Professional opens the table using the No View option (no data is displayed).
• Browser – MapInfo Professional attempts to open the table in a Browser window.
• Current Mapper – MapInfo Professional attempts to add your data to the current Map window.
• New Mapper – MapInfo Professional attempts to open the table in a new Map window.
• No View – MapInfo Professional opens the table, but no data is displayed.
Note: When you open a table and select an option in the Preferred View drop-down list, MapInfo Professional remembers what you selected and uses the same option the next time you open a table.
4. Select the Create copy in MapInfo format for read/write to open it in native (.tab) format.
Note: If you do not select the Create copy... check box, the file opens read-only.
5. To open the file, do one of the following:
• Double click the file you want to open
• Click the file you want to open to highlight it in the list and click Open.
Using either method, MapInfo Professional opens the data file.
Note that although an MapInfo Professional table consists of two or more component files (STATES.tab, STATES.DAT, STATES.MAP etc.), only the .TAB file appears in the File Name box of the Open dialog box. It is the only component file you must open. For more about these other MapInfo file types, see Understanding the Files Associated with MapInfo Professional Tables on page 117.
In MapInfo Professional you can work with a variety of table types. Some data tables are like the example table we just discussed. Further subdividing this class of tables are data tables that contain graphic objects (map objects) and data tables that do not (such as spreadsheets or external database tables). Raster tables are graphic images that you can display in a Map window. These computerized pictures do not have the same table structure of record, field, and index as data tables do, and therefore, will not be discussed in this chapter. For more on raster images, see Working with Raster Images in the MapInfo Professional Help System.
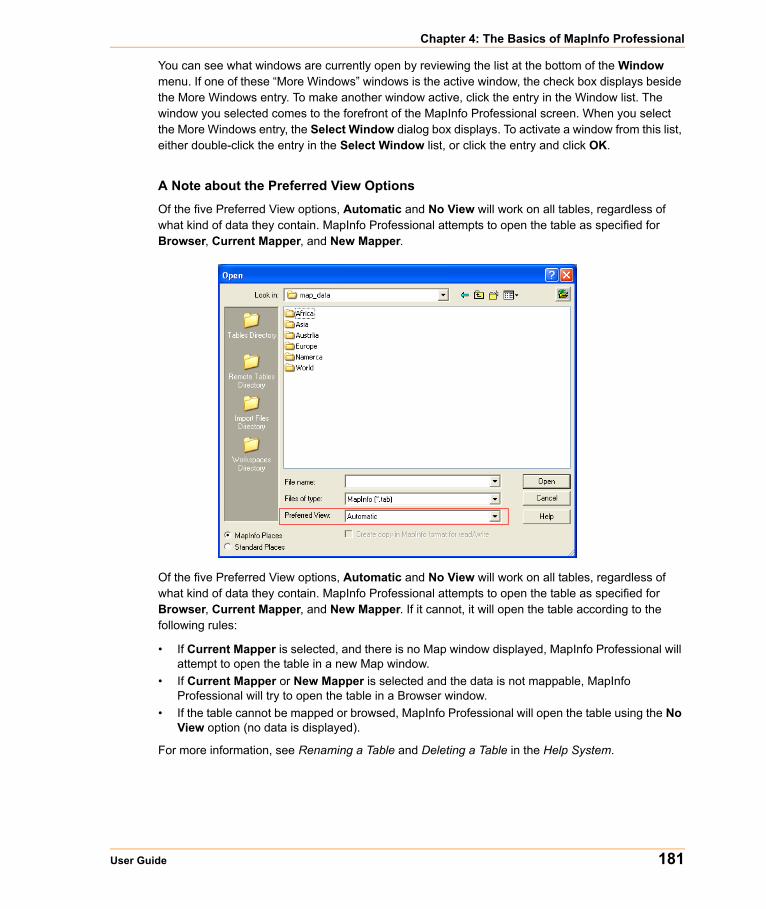
Chapter 4: The Basics of MapInfo Professional
User Guide 181
You can see what windows are currently open by reviewing the list at the bottom of the Window menu. If one of these “More Windows” windows is the active window, the check box displays beside the More Windows entry. To make another window active, click the entry in the Window list. The window you selected comes to the forefront of the MapInfo Professional screen. When you select the More Windows entry, the Select Window dialog box displays. To activate a window from this list, either double-click the entry in the Select Window list, or click the entry and click OK.
A Note about the Preferred View Options
Of the five Preferred View options, Automatic and No View will work on all tables, regardless of what kind of data they contain. MapInfo Professional attempts to open the table as specified for Browser, Current Mapper, and New Mapper.
Of the five Preferred View options, Automatic and No View will work on all tables, regardless of what kind of data they contain. MapInfo Professional attempts to open the table as specified for Browser, Current Mapper, and New Mapper. If it cannot, it will open the table according to the following rules:
• If Current Mapper is selected, and there is no Map window displayed, MapInfo Professional will attempt to open the table in a new Map window.
• If Current Mapper or New Mapper is selected and the data is not mappable, MapInfo Professional will try to open the table in a Browser window.
• If the table cannot be mapped or browsed, MapInfo Professional will open the table using the No View option (no data is displayed).
For more information, see Renaming a Table and Deleting a Table in the Help System.
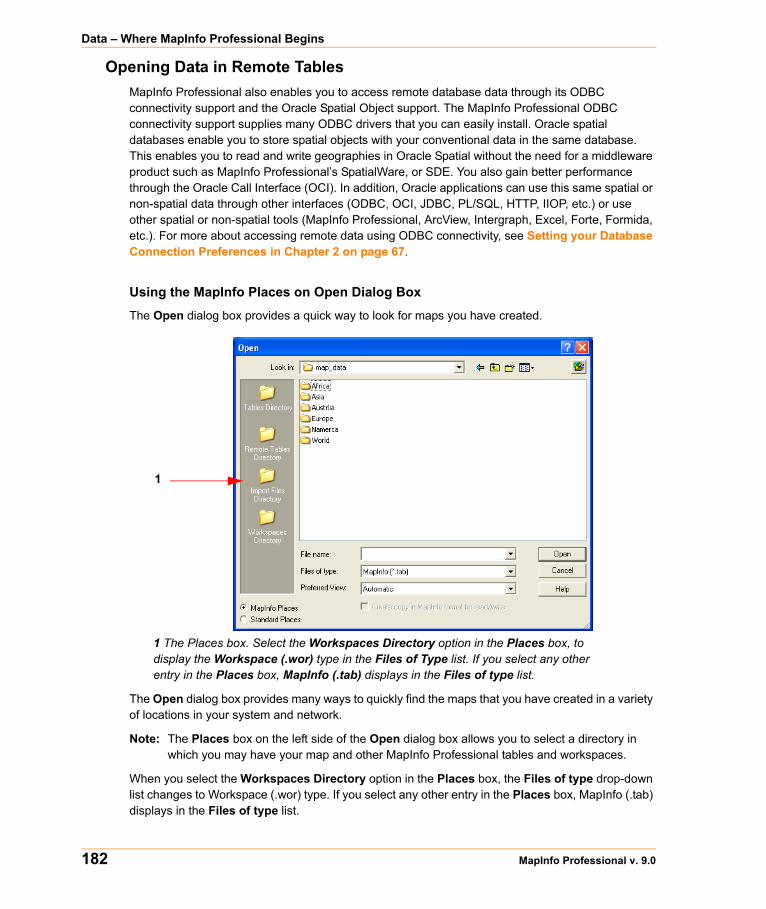
Data – Where MapInfo Professional Begins
182 MapInfo Professional v. 9.0
Opening Data in Remote TablesMapInfo Professional also enables you to access remote database data through its ODBC connectivity support and the Oracle Spatial Object support. The MapInfo Professional ODBC connectivity support supplies many ODBC drivers that you can easily install. Oracle spatial databases enable you to store spatial objects with your conventional data in the same database. This enables you to read and write geographies in Oracle Spatial without the need for a middleware product such as MapInfo Professional’s SpatialWare, or SDE. You also gain better performance through the Oracle Call Interface (OCI). In addition, Oracle applications can use this same spatial or non-spatial data through other interfaces (ODBC, OCI, JDBC, PL/SQL, HTTP, IIOP, etc.) or use other spatial or non-spatial tools (MapInfo Professional, ArcView, Intergraph, Excel, Forte, Formida, etc.). For more about accessing remote data using ODBC connectivity, see Setting your Database Connection Preferences in Chapter 2 on page 67.
Using the MapInfo Places on Open Dialog Box
The Open dialog box provides a quick way to look for maps you have created.
1 The Places box. Select the Workspaces Directory option in the Places box, to display the Workspace (.wor) type in the Files of Type list. If you select any other entry in the Places box, MapInfo (.tab) displays in the Files of type list.
The Open dialog box provides many ways to quickly find the maps that you have created in a variety of locations in your system and network.
Note: The Places box on the left side of the Open dialog box allows you to select a directory in which you may have your map and other MapInfo Professional tables and workspaces.
When you select the Workspaces Directory option in the Places box, the Files of type drop-down list changes to Workspace (.wor) type. If you select any other entry in the Places box, MapInfo (.tab) displays in the Files of type list.
1
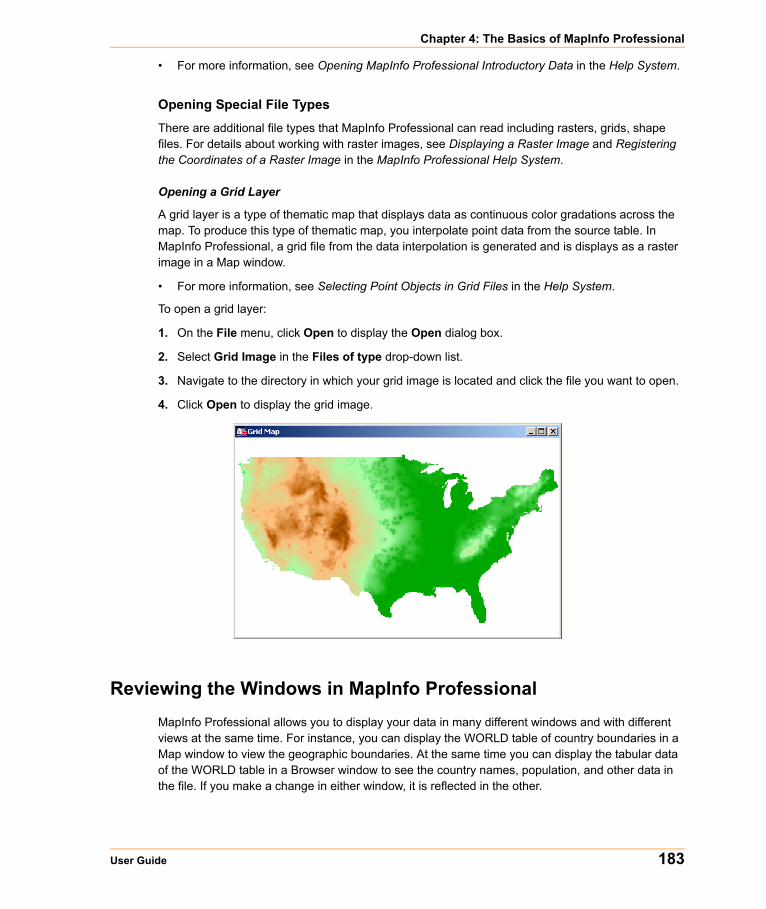
Chapter 4: The Basics of MapInfo Professional
User Guide 183
• For more information, see Opening MapInfo Professional Introductory Data in the Help System.
Opening Special File Types
There are additional file types that MapInfo Professional can read including rasters, grids, shape files. For details about working with raster images, see Displaying a Raster Image and Registering the Coordinates of a Raster Image in the MapInfo Professional Help System.
Opening a Grid Layer
A grid layer is a type of thematic map that displays data as continuous color gradations across the map. To produce this type of thematic map, you interpolate point data from the source table. In MapInfo Professional, a grid file from the data interpolation is generated and is displays as a raster image in a Map window.
• For more information, see Selecting Point Objects in Grid Files in the Help System.
To open a grid layer:
1. On the File menu, click Open to display the Open dialog box.
2. Select Grid Image in the Files of type drop-down list.
3. Navigate to the directory in which your grid image is located and click the file you want to open.
4. Click Open to display the grid image.
Reviewing the Windows in MapInfo ProfessionalMapInfo Professional allows you to display your data in many different windows and with different views at the same time. For instance, you can display the WORLD table of country boundaries in a Map window to view the geographic boundaries. At the same time you can display the tabular data of the WORLD table in a Browser window to see the country names, population, and other data in the file. If you make a change in either window, it is reflected in the other.
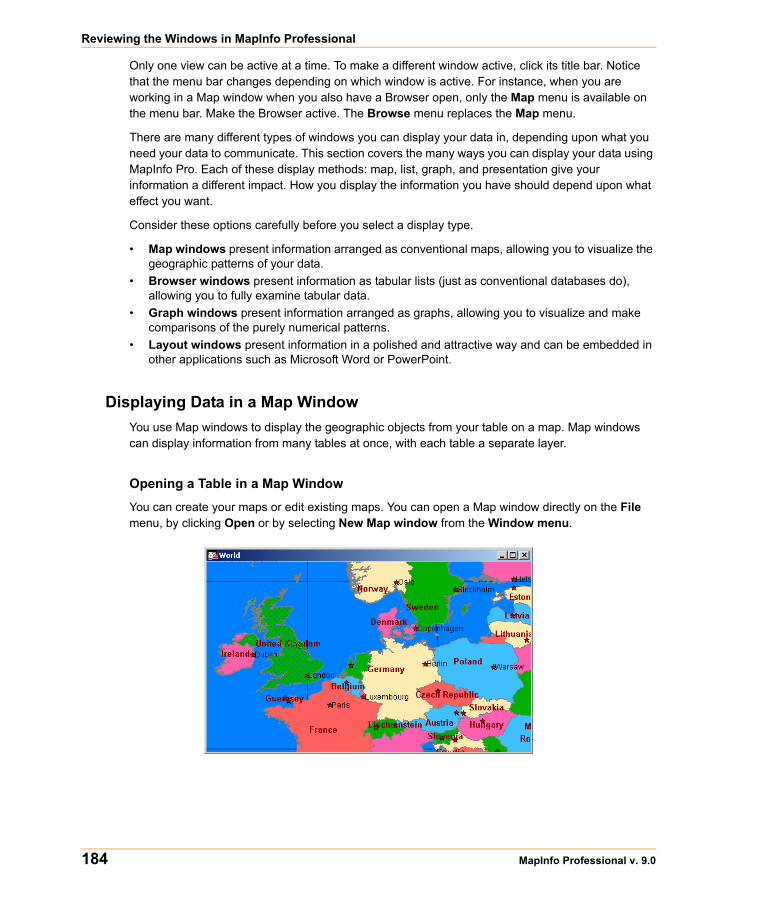
Reviewing the Windows in MapInfo Professional
184 MapInfo Professional v. 9.0
Only one view can be active at a time. To make a different window active, click its title bar. Notice that the menu bar changes depending on which window is active. For instance, when you are working in a Map window when you also have a Browser open, only the Map menu is available on the menu bar. Make the Browser active. The Browse menu replaces the Map menu.
There are many different types of windows you can display your data in, depending upon what you need your data to communicate. This section covers the many ways you can display your data using MapInfo Pro. Each of these display methods: map, list, graph, and presentation give your information a different impact. How you display the information you have should depend upon what effect you want.
Consider these options carefully before you select a display type.
• Map windows present information arranged as conventional maps, allowing you to visualize the geographic patterns of your data.
• Browser windows present information as tabular lists (just as conventional databases do), allowing you to fully examine tabular data.
• Graph windows present information arranged as graphs, allowing you to visualize and make comparisons of the purely numerical patterns.
• Layout windows present information in a polished and attractive way and can be embedded in other applications such as Microsoft Word or PowerPoint.
Displaying Data in a Map WindowYou use Map windows to display the geographic objects from your table on a map. Map windows can display information from many tables at once, with each table a separate layer.
Opening a Table in a Map Window
You can create your maps or edit existing maps. You can open a Map window directly on the File menu, by clicking Open or by selecting New Map window from the Window menu.
Chapter 4: The Basics of MapInfo Professional
User Guide 185
Getting Around in the Map Window
There are a wide variety of tools that allow you to zoom, pan, and move objects around the Map window. Zooming allows you to look more closely or more widely at a particular geography. Panning allows you to move around a map left, right, up, and down. Moving selected objects in an editable layer is useful when you want to get your map right.
You can zoom using the mouse wheel or using the keyboard. For more about zooming using the mouse wheel, see Using the Microsoft IntelliMouse to Move Around the Windows in the MapInfo Professional User Guide Help System.
In addition to the usual zoom keys on your Main Toolbar ( , , and ), you can use the + and - keys on the keyboard, to zoom in and out more precisely.
• When you press +, you zoom in by a factor of 2. • When you press -, you zoom out by a factor of .5.
You can pan in your Map window using the scroll bars or the Arrow keys Up, Down, Left, and Right.
Further, you can move an object in an editable layer more precisely by selecting it and using the following key combinations.
• <CTRL + Arrow> - moves the editable, selected objects 1 pixel at a time• <CTRL + Shift Arrow> - moves the editable, selected objects 10 pixels at a time
Note: These tools also apply to the Layout window.
Changing a Map's Zoom Level
You change a map's zoom level by specifying certain parameters in the Change View dialog box.
To change a map's zoom level do one of the following:
• Choose Map > Change View. The Change View dialog box displays.
• Click the Change View button on the Main toolbar. The Change View dialog box displays.
The Change View dialog box allows you to set various parameters of the map including:
• Display the current zoom, scale or cursor position in the status bar (the default unit of distance is miles which is specified in Map > Options).
• Change the zoom, scale, and the center point of the current map view.
• Behavior of the map when you resize the window.
• Resize the map to fit the new window, keeping the view the same.
• Set the map to preserve the current scale, so that resizing the window has the effect of letting you see more or less of the map.
The Help System contains the following related topics:
• Opening MapInfo Professional Introductory Data• Setting Margins for a Map Window when Printing• Editing Text in a Map or Layout
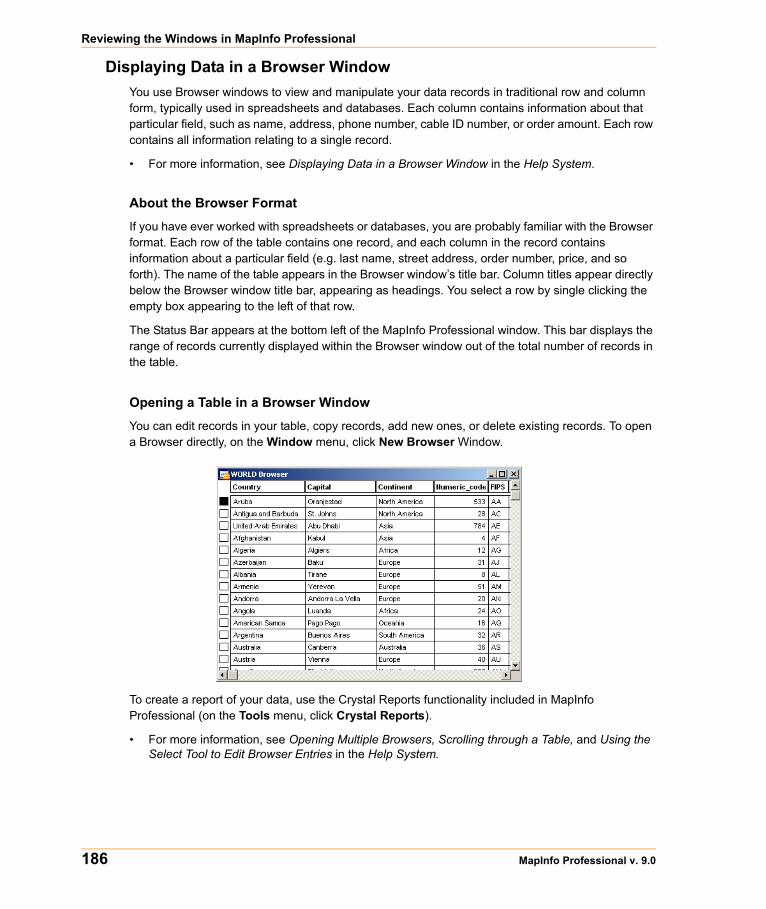
Reviewing the Windows in MapInfo Professional
186 MapInfo Professional v. 9.0
Displaying Data in a Browser WindowYou use Browser windows to view and manipulate your data records in traditional row and column form, typically used in spreadsheets and databases. Each column contains information about that particular field, such as name, address, phone number, cable ID number, or order amount. Each row contains all information relating to a single record.
• For more information, see Displaying Data in a Browser Window in the Help System.
About the Browser Format
If you have ever worked with spreadsheets or databases, you are probably familiar with the Browser format. Each row of the table contains one record, and each column in the record contains information about a particular field (e.g. last name, street address, order number, price, and so forth). The name of the table appears in the Browser window’s title bar. Column titles appear directly below the Browser window title bar, appearing as headings. You select a row by single clicking the empty box appearing to the left of that row.
The Status Bar appears at the bottom left of the MapInfo Professional window. This bar displays the range of records currently displayed within the Browser window out of the total number of records in the table.
Opening a Table in a Browser Window
You can edit records in your table, copy records, add new ones, or delete existing records. To open a Browser directly, on the Window menu, click New Browser Window.
To create a report of your data, use the Crystal Reports functionality included in MapInfo Professional (on the Tools menu, click Crystal Reports).
• For more information, see Opening Multiple Browsers, Scrolling through a Table, and Using the Select Tool to Edit Browser Entries in the Help System.
Chapter 4: The Basics of MapInfo Professional
User Guide 187
How a Browser Displays in a Layout
A Browser window displays with the column headings at the very top of the frame. Immediately below, it displays the contents of the table, starting with the row and column at the upper-left corner of the table. It displays as many columns and rows as it can fit in the frame, regardless of how many are displayed in the table. When you resize the frame, the number of rows and columns displayed are adjusted accordingly. However, fields removed from the table with the Pick Fields command are not displayed in a table frame.
The number of rows and columns that can be displayed in a frame depends on font size and column width. The frame displays Table text using the font style and size for that Browser window. When you want a different type style in the frame, you have to make the change in the Browser window using Options > Text Style dialog box. When you use smaller type, you can get more rows and columns in a frame.
You can also manually adjust column width in a Browser window without affecting the underlying field size for the base table. You do this by clicking and dragging the short vertical bars separating the column names in the Browser window.
The Help System contains the following related topics:
• Adding a New Row to a Browser• Adding and Editing Text in a Browser• Adding Fields to a Browser• Choosing a Font for your Browser• Creating a Default Browser View• Preserving Column and Expression Settings in a Browser Window• Removing Fields from a Browser• Resizing a Browser’s Columns• Setting Margins for a Browser Window when Printing• Showing or Hiding a Browser’s Grid• Using the HotLink Tool in a Browser Window
Changing a Record's Data, Font, and Style The Info tool allows you to choose an object or row and see a window displaying information from the table about that object. Click another object with the Info tool and its information appears in the same window. Click the Ctrl-menu box [Close box] of the Info window to make it disappear.
Mouse Wheel Support for Browser Window
When you are working in the Browser window, you can use the mouse wheel to scroll through the records. Roll the mouse button down to scroll down the list, and roll the mouse button up to scroll up the list. You can use the Tab key to scroll right and the <Shift Tab> keys to scroll left in the Browser window.
Reviewing the Windows in MapInfo Professional
188 MapInfo Professional v. 9.0
Displaying Data in a Graph Window The Graph window allows you to visualize statistical relationships in graph format. You can create many different kinds of graphs: 3D, bar, line, area, histogram, scatter, bubble, and pie graphs. You can also choose from a number of different graph templates.
To display a table as a graph:
1. From the File menu, click Open and select the table that you want to display as a graph.
2. Choose Window > New Graph Window. The Create Graph Step 1 of 2 dialog box displays.
3. Choose the chart type and the template for your graph.
4. Click Next. The Create Graph Step 2 of 2 dialog box displays.
5. Choose the field, or create an expression that contains the data values fields that you want used when creating your graph.
Note: For more information about using the graph features of MapInfo Professional, see Graph Help System available by selecting Help > MapInfo Graphing Help Topics.
6. If you want labels for your graph, choose the column that the records are to be labeled with.
7. Choose how you want your graph data organized in rows or series.
8. Click OK to display a Graph window.
After the graph displays you can invoke one of several editing dialog boxes to modify an extensive array of attributes. You can also move and resize objects within the graph window until the desired graph is achieved.
The Help System contains these related topics:
• Editing a Graph• Saving a Graph• Saving a Graph Window as a Template File• Setting Margins for a Graph Window when Printing• When Should I use Label Axis Options?• When Should I use Value Axis Options?
Displaying Data in a Layout Window The Layout window allows you to combine Browsers, Map windows, Graph windows, and other graphic objects into one layout which can then be sent to a printer or plotter. You use this type of window to create presentation graphics. Layout windows have scroll bars at the right and at the bottom like Map windows and Browser windows.
You can display rulers at the top and to the left to help you in positioning, sizing and aligning objects.
The Zoom displayed in the status bar indicates the magnification factor that is currently applied to the Layout. When the zoom is 37.46%, then the Layout is being displayed 37.46% of its actual size. When the zoom is at 123%, then the Layout is being displayed at 123% of its actual size.
Chapter 4: The Basics of MapInfo Professional
User Guide 189
Opening a Map in a Layout Window
To use a Layout window, on the Window menu, click New Layout Window.
Note: MapInfo Professional has some excellent tools to assist you in moving around the Layout window. See Getting Around in the Map Window on page 124 for these details.
The Help System contains these related topics:
• Sending Objects to the Back of a Layout • Sending Objects to the Front of the Layout• Printing a Layout• Setting Printing Margins for a Layout• How a Map Legend Displays in a Layout• Printing a Legend in a Layout• Changing a Map Scale in a Layout• Moving a Map or a Layout• For instructions in sending objects to the back of a layout, see the Displaying Data in the Layout
topic in the Help System.•• For instructions in sending objects to the front of a layout, see the Displaying Data in the Layout
topic in the Help System.
Other Windows for Displaying DataThere are two other ways of displaying data that are used less often or can be used in conjunction with display options we have already reviewed.
• Legend Windows are the key boxes at the bottom of the map that explain what the map symbols mean. There are two different kinds of legend windows:
a. The Thematic Legend window is automatically created and details the meaning of colors, symbols and styles on a thematic map. Display or hide this legend in the Options menu, by clicking the Show/Hide Theme Legend Window menu option.
b. The Cartographic Legend displays legend frames for any map layer, not just thematic map layers. The legend window displays the legend, or key, to the cartographic data on your map.
The legend frames can all be in one window, or can be split among several legend windows for the same map. Therefore, each map can have one or more cartographic legend windows containing the frames of your choice. Additionally, you can customize the text and style of the information presented. Modifications to the legend can be made through shortcut menus you access by right-clicking in the legend window or through the Legend menu. You can learn more about legends in Working with Legends in Chapter 9 on page 442.
• Redistricting Windows are allow you to create groupings of spatial information. This is a little more complex than these other options. For more information about redistricting windows, see Redistricting in the MapInfo Professional Help System.
Saving, Closing, and Exporting Your Work
190 MapInfo Professional v. 9.0
Saving, Closing, and Exporting Your WorkPreserving your work is an important part of being productive. MapInfo Professional has a wide variety of ways you can save what you are working on, depending upon what needs to be saved and how you need to retrieve it.
Saving a WorkspaceIf you work with the same tables repeatedly, you know that opening each one individually every time you use it can be tedious. With MapInfo Professional’s workspace feature, you can automate this process so you can get back to the business of creating maps and analyzing data sooner.
When you work with MapInfo Professional you generally use many different tables and windows. A Map window, for instance, is likely to be built of several layers. MapInfo Professional uses workspaces to save your work setup from session to session. Workspaces prevent you from having to reassemble all the pieces of your earlier setup from scratch. So, you don’t have to reopen tables, re-create maps or layouts, resize windows, or do anything else just to duplicate what was on your desktop the last time you were using MapInfo Professional.
CAUTION: Saving a workspace will not save edits you have made to tables in the workspace.
If you close a window or table and you have thematic maps, graphs, label settings or label edits, or cosmetic objects pending, MapInfo Professional will prompt you to save the session to a workspace.
• For more information, see Saving a Workspace and Saving a Map Window as a .TAB File in the Help System.
For instructions on saving a Map window as a .TAB file, see the Help System.
Saving Your Workspace as an XML-Based MWS File
You can save the maps in your workspace out to an XML format for use with MapXtreme 2004 applications. When saving a workspace to MWS format, only the map windows and legends are saved. All other windows are discarded as MapXtreme 2004 applications cannot read that information. Once your workspace is saved in this format, it can be opened with the Workspace Manager utility that is included in the MapXtreme 2004 installation or with an application developed using MapXtreme 2004. The file is valid XML you can view it using any XML viewer or editor. MWS files created with MapInfo Professional 7.8 or later can be validated using schemas supplied with MapXtreme 2004.
Note: You will not be able to read files saved in MWS format in pre-8.0 versions of MapInfo Professional.
You can set the visibility of a modifier theme without regard to its reference feature layer, so you can turn the visibility of the main reference layer off but still display the theme. In MapXtreme2004, the modifier themes (Dot Density, Ranges, Individual Value) are only drawn if the reference feature layer is visible. To ensure that modifiers marked as visible in MapInfo Professional display in tools like Workspace Manager, we force the visibility of the reference feature layer so that its modifier themes display.
Chapter 4: The Basics of MapInfo Professional
User Guide 191
• For specific instructions, see Saving your Workspace as an XML-Based MWS File in the Help System.
• For more information, see Caveats for Saving Label Expressions to MWS and Caveats for Saving Thematic Expressions to MWS in the Help System.
Saving a Table or a Copy of a TableTo save changes to map objects or data, you must save the table. (On the File menu, click Save Table.) A dialog box displays asking you to choose which table you want to save.
You can also save a copy of the table under a new name, using Save Copy As. This, in essence, creates a new table. This is helpful in several instances, as when you want to:
• Retain any changes while preserving the original table. • Save a table with a temporary column (from Update Column).• Create a new table before you make editing changes to the original table.• Save spreadsheet files that you wish to modify in MapInfo Professional.• Save a table in a different projection.
To save a copy of the table:
1. On the File menu, click Save Copy As. The Save Copy of Table dialog box displays.
2. Choose the file to save and click OK.
3. Give the file a new name.
The original table remains unchanged and open for all further changes. The new table does not open immediately after its creation, but can be opened for use at any time. When choosing a name for your new table that begins with a number, MapInfo Professional adds an underscore to the beginning of the table name. For instance, your table 1STREETS.tab. will become 1STREETS.tab.
Saving a copy of a raster table only saves a copy of the *.tab file, not the image. You cannot change the projection of a raster or grid table using Save Copy As. To do this go to the Table menu, point to Raster and click Modify Image Registration and click the Projection button. Then save the file from there.
Since MapInfo Professional supports long filenames, it is easier to give the new table a name that is descriptive and at the same time distinguishes it from the original file.
The Help System contains these related topics:
• Saving a Copy of your Table as a New Table• Saving a Copy of Your Table as a New Table• Tables you Cannot Update• Choosing Ascending vs. Descending Sorts• Column Name Syntax in the Order By Columns Field• Rearranging a Table's Column Order
Saving, Closing, and Exporting Your Work
192 MapInfo Professional v. 9.0
Closing a Table Closing a table removes it from active use in your current session. Choose the Close command from the File menu to close tables. When you close a table, you automatically close all views of that table. If you close a table that is displayed in a Map window with other tables, MapInfo Professional removes that table from the window, but the Map window remains open.
In addition, any subset tables of the original table (known as query tables) also close. You can use the Close command for any table, whether or not it is displayed in a window. Opening and closing tables is different from opening and closing windows in which you view your tables. You can open a table without opening any views of the data. Similarly, closing a window does not close the table (or tables) you are viewing in the window. They are still open and available for use. To close a window, click the Ctrl-menu box in the upper-left corner of any window and select Close.
If you have made changes to a table but have not yet saved those changes, MapInfo Professional will ask you if you want to save them before closing the table. To save your changes, choose Save Table from the File menu.
• For more information, see Closing a Table, Closing All Open Tables, and Closing Multiple Tables in the Help System.
Opening vs. Importing You must open a table before you can use it. The Open command activates a dialog box for opening tables, (opening a table is described below). Choose the appropriate table by double-clicking on it in the dialog box.
Most programs require you to import files created in some other programs. MapInfo Professional allows you to work directly with files created in other programs. When you have a file in one of the following non-MapInfo Professional formats, you do not have to import it:
• dBase DBF• Delimited ASCII• Lotus 1-2-3• Microsoft Access Database• Microsoft Excel
By not importing data you save time; opening a file is quicker than importing it. You also save disk space. When you import a file, you make a copy of it. Since MapInfo Professional works directly with files from other programs, it does not have to make a copy.
When MapInfo Professional opens a file from some other program, it creates a file with a .TAB extension. This file describes the format of the file that actually contains the data. When you have opened a non-MapInfo Professional file, such as a Lotus file, in a previous session and attempt to open it again, the following prompt appears:
Table definition already exists. Overwrite it?
The table definition referred to is the .TAB file. It does not hurt anything if you continue. MapInfo Professional overwrites the .TAB file and opens the file.
Chapter 4: The Basics of MapInfo Professional
User Guide 193
Exporting Your Data to a New FormatYou can export your Map window to other file formats with the Save Window As command (on the File menu, click Save Window As). This enables you to use your map in another application, such as word processing, presentation, or computer publishing packages.
Supported Export Formats
You can save data in a number of formats in MapInfo Professional. Windows .bmp is the initial default. The Save Window to File dialog box sets the last-used format as the default. Formats include:
• Windows Bitmap (*.BMP)
• Windows Metafile (*.WMF)
• Windows Enhanced Metafile (*.EMF)
• JPEG File Interchange Format (*.JPG)
• JPEG 2000 (*.JP2)
• Portable Network Graphics Format (*PNG)
• Tagged Image File Format (*TIF)
• TIFF CMYK (*.TIF)
• TIFF CCITT Group 4 (*.tif)
• TIFF LZW (*.tif)
• Graphic Interchange Format (*.gif)
• Photoshop 3.0 (*.PSD)
• Comma Delimited Format (.CSV)• See Understanding the Advanced Exporting Options in the MapInfo Professional Help System.• For more information, see Understanding the Advanced Exporting Options and Setting your
Output Setting Preferences in the Help System
.Importing and Exporting Data in AutoCAD Format Because CAD packages represent drawings in non-earth coordinates, all drawings imported or exported between MapInfo Professional and CAD suffer some distortion. This comes from trying to display non-earth information on a spherical coordinate system (like the globe).Coordinate conversions are used to assign longitude/latitude coordinates to CAD drawings that were created using non-earth coordinates. Conversions near the equator are more exact than conversions at the extremes of the hemispheres. To minimize distortion, import and export with no coordinate conversions and avoid translating maps that cover large areas.
• For more information, see Importing DXF Attributes into MapInfo Professional and Importing Attributes with Nested Blocks in the Help System.
• For more information, see DXF Exporting Notes in the Help System.
Saving, Closing, and Exporting Your Work
194 MapInfo Professional v. 9.0
Cropping Images When MapInfo Professional exports a window, it does not clip objects that extend beyond the edges of the windows, but it does export information about where the clipping is.
Other programs always honor the clipping of bitmap files. As for other formats, the behavior varies depending on the program that is used to display and print the file. Many programs, such as drawing programs, "explode" the file into individual objects. A file containing several country boundaries would explode into several polygon objects, one for each country. Programs like these usually ignore the clipping information that MapInfo Professional stores in the file.
Other programs, such as word processing programs and spreadsheets, typically open files as one compound object, without trying to explode them into component objects. These programs usually honor the clipping information and clip the contents appropriately.
For example, if you are exporting a Map window that displays part of Germany, but not all of it, the exported file contains the entire image of Germany. It also contains information about where MapInfo Professional clipped that image in its Map window. But when you open the exported window in your target application, a drawing package for example, the image of Germany may not be clipped.
Exporting to ASCII Format MapInfo Professional also allows you to export your tabular data to a delimited ASCII file. This file can later be edited with a text editor or imported into another package. When you export to ASCII, MapInfo Professional displays the Delimited ASCII Information dialog box, where you choose your delimiter character. You can also choose to have the first row of the ASCII file become column titles.
MapInfo Professional also displays a dialog box that you use to indicate the character set for the exported ASCII file. Different platforms use different character sets. MapInfo Professional must know the platform where you are going to use the exported file in order to provide the appropriate character set. No graphical data is exported to ASCII.
Exporting to dBase (*.DBF) Format MapInfo Professional can export tabular data into dBASE DBF format. Exporting to DBF creates only the .DBF file. No graphical data is exported to dBASE. When you save your table in DBF format, you create a .DBF file, as well as some other files. These other files contain graphic information (for example, MapInfo Professional indices and other information that MapInfo Professional uses).
MapInfo Professional also displays the dBASE DBF Information dialog box that you use to indicate the character set for the exported DBF file. Different platforms use different character sets. MapInfo Professional must know the platform where you are going to use the exported file in order to provide the appropriate character set.
Smoothing Map Images During ExportYou can anti-alias a table during the export process to give you more control over your map images. This is particularly important when you are saving maps created in MapInfo Professional for use in other Windows-based applications, in particular in slide presentations or for web pages.
Chapter 4: The Basics of MapInfo Professional
User Guide 195
Anti-aliasing allows you to smooth images in all types of windows such as Map windows, layouts, legends, and graphs.
Note: You cannot anti-alias images you are exporting to .EMF or .WMF format, because these are not true raster formats.
There are three smoothing options you can use to customize your raster image:
1. Smooth using a Filter value. You can set a flag that selects one of six filters that allow you to choose the direction the filter is applied to the image from.
2. Smooth using a Mask value. You can select a value that indicates the size of the area you want to smooth. For example, to create a 3x3 pixel mask value, you would enter a 3 in this field. This would limit the amount of change in the color of the pixels. Typically mask sizes would be 2-3 pixels when exporting at screen resolution. If you are exporting at a higher resolution, a larger mask might be appropriate.
3. Smooth using a Threshold value. You can select a threshold value to indicate which pixels to smooth. Each pixel in an image has a value based on its color. The smaller the pixel value, the darker the color. Select this option to smooth all of the pixels above the threshold you enter in this field. When you set this value to 0, MapInfo Professional will smooth all of the pixels.
You must either set a global preference for these anti-aliasing options or set them locally during the export process (using the Advanced button).
• For specific instructions, see Smoothing Map Images During Export in the Help System.
Using the Tools in the Tool ManagerMapInfo Professional contains many additional tools that simplify mapping tasks, convert MapInfo Professional files to different file formats and vice versa, automate tasks for working with DBMS tables, and more. The Tool Manager helps you run and manage these many utilities easily.
Use the Tool Manger to run, add, edit, or remove tools from the currently registered list of tools in the Tools menu. You can also configure a tool to run automatically upon startup. If you performed a Custom installation, you may have elected to not install the tools. In this case when you open the Tool Manager dialog box, the list box will be empty (on the Tools menu, click Tool Manager).
For information about using the tools in MapInfo Professional, see the MapInfo Professional Help System.
What are the MapInfo Professional Tools? These tools are covered in more depth in the Help System.
AutoLabeler – Use this tool to place text object style labels in the Cosmetic Layer of the active Map window.
CoordSys Bounds Manager – Use this tool to check and set the coordinate system bounds for mappable MapInfo Professional base tables.
Using the Tools in the Tool Manager
196 MapInfo Professional v. 9.0
Concentric Ring Buffer – Creates concentric ring buffers around one or more map objects. This tool also computes aggregated values for underlying data that occur within each ring. Therefore, it can be used to count how many customers occur within each ring and their total sales. You can graph the results. See Concentric Ring Buffer Tool in the Tools section of the Help System.
Coordinate Extractor – Allows you to add two columns to an open table and updates each column with x and y coordinates in the table’s native projection. For objects other that points, the x and y coordinates will represent CentroidX and CentroidY locations. See Coordinate Extractor Tool in the Tools section of the Help System.
Create Line by Length (Cogoline) – Draws lines in the Cosmetic Layer of a specific length and angle. You can also use DMS coordinates and create polylines with this tool. See Create Line by Length (COGOLine) Tool in the Tools section of the Help System.
DBMS Catalog – Use this tool to create a MapInfo Professional MapCatalog table in a remote database. You need the catalog to download coordinate information to MapInfo Professional from a remote database. This tool should be used by a qualified DBA.
DBMS Count Rows in Table – Allows you to optimize opening large tables (million or more rows) using the DBMS Live Access method (unlinked tables). This will update an entry for a table in the MapCatalog, correctly setting the number of rows for that table.
Degree Converter – Converts a column of data containing DMS coordinates to Decimal Decimals and Decimal Degrees to degrees/minutes/seconds. See Degree Converter Tool in the Tools section of the Help System.
Delete Duplicates – Use this tool to delete duplicate records from a table while retaining map objects. This tool does not change the original table in any way. See Delete Duplicates Tool in the Tools section of the Help System.
Disperse Points – Disperses points located in the same position. Points can be dispersed systematically or can be used to calculate the distance from a selected object (or group of objects) to the closest or farthest object(s). You can also specify criteria to limit the results. See Disperse Points Tool in the Tools section of the Help System.
Distance Calculator – The Distance Calculator tool (DistanceCalc.MBX) is used to calculate the distance from a selected object (or group of objects) to the closest or farthest object(s). You can also specify criteria to limit the results. See Distance Calculator Tool in the Tools section of the Help System.
EasyLoader – EasyLoader is a Windows-only utility that is loaded using the Tool Manager. EasyLoader allows you to upload MapInfo Professional tab files to a remote database. Online help is available for using EasyLoader. See EasyLoader Tool in the Tools section of the Help System.
GeoTracker Tool – This is a GPS tool to be used with MapInfo Professional, which supports up to 12 com ports, sophisticated error message management for Disconnect and Reconnect features, and superior installation and help support features. See GeoTracker Tool in the Tools section of the Help System.
Grid Maker – Draws a Graticule: a grid of latitude/longitude lines. See the Grid Maker Tool in the Tools section of the Help System.
Chapter 4: The Basics of MapInfo Professional
User Guide 197
Grid Tools – Use these tools to create a MapInfo Professional native grid file from a table of points, convert grids from any format that MapInfo Professional can read into MapInfo Professional grid format (.MIG), and display x, y, and z coordinates, and row and column, of the grid you selected.
HTML Image Map – HTML Image Map allows you to create a web page based on any MapInfo Professional Map window that includes a layer of polygons. The resulting HTML page includes an Image Map (JPG or PNG) and applies a user designated title and copyright. See the HTML Image Map Tool in the Tools section of the Help System.
Labeler – Transfer layer's labels into permanent text objects; label current selection; make individual labels created with the Label tool into permanent text objects. See the Labeler Tool in the Tools section of the Help System.
Legend Manager – Takes control of how MapInfo Professional displays Legend windows. Includes the ability to have multiple Legend windows open, and to associate each legend with a specific Map window. See the Legend Manager Tool in the Tools section of the Help System.
Link Utility for Google Earth – Use this tool to display your map data on Google Earth Maps. See the Link Utility for Google Earth™ in the Tools section of the Help System.
Mapping Wizard Tool – Use this tool to open data, maps, perform analysis, and generate output using a wizard. This tool is set to load automatically when you start MapInfo Professional.
MapX Geoset Tool – Allows you to read a MapX Geoset into a MapInfo Professional Map window, and write a MapX Geoset from the contents of the MapInfo Professional Map window. See the MapX Geoset Utility in the Tools section of the Help System.
Named Views – Use this tool to save a Map window’s current zoom and center as a named view. Return to that view by selecting the view name from a dialog box.
North Arrow – Add North Arrows of various styles and optionally add a Magnetic Declination arrow. A North Arrow can be added to a Map or Layout. You can either specify from the dialog box which corner to position the North Arrow, or use the toolbar button to drag a rectangle and place the North Arrow at the specified location. See the North Arrow Tool in the Tools section of the Help System.
Overview – Use this tool to open a new Map window to provide an overview of another Map window.
Register Vector – Use this tool to put control points into a vector image and reference points into a Map window and then performs an affine transformation to line them up.
Rotate Labels – Use this tool to rotate all the labels in a map layer at once.
Rotate Map Window – Use this tool to rotate the contents of the current Map window a specific number of degrees. It calculates and sets an Affine transformation for the Map window.
Rotate Symbols – Use this tool to rotate all the symbols in a map layer at once.
ScaleBar – Use this tool to create a custom distance scalebar to annotate a Map window. This tool can also be used in Layout windows.
Seamless Table Manager – Use this tool to create and manage seamless map sheets.
Search and Replace – Search a character column for a specific string and replace it with another string or to search and replace multiple column entries. See the Search and Replace Tool in the Tools section of the Help System.
Using the Tools in the Tool Manager
198 MapInfo Professional v. 9.0
Send to MapX Mobile – Use this tool to write a custom MapX geoset and associated .TAB files to create a user-defined subset of a map window’s background data for display on a mobile device.
Set the Minimum Bounding Rectangle – Use this tool to set the Minimum Bounding Rectangle for ODBC live access based tables. See the Set the Minimum Bounding Rectangle Tool in the Tools section of the Help System.
Shields – Use this tool to draw decorative frames around text objects.
Spatialize SQLServer Table – Use this tool to accommodate spatial data in an existing SQL table.
SpiderGraph – This tool draws lines between objects in a single table, or the objects from two tables based on a join. It then creates a new table of lines that connect the objects from the original table(s) based on matching column names. See the Spider Graph Tool in the Tools section of the Help System.
Symbol Maker – Use this tool to create, edit, and delete MapInfo Professional symbols. These symbols become part of the standard MapInfo Professional symbol set.
Synchronize Windows – This tool provides toolbar icons that allow you to automatically share changes made in one mapper window to all other mapper windows in a given MapInfo Professional session. See the Synchronize Windows Tool in the Tools section of the Help System.
Table Manager – Use this tool to get information about all currently open tables, including table metadata.
TOC Tool – Builds a seamless table of all the files listed in a TOC file. This utility will create one or more seamless tables, grouped by zone and resolution. See the TOC Tool in the Tools section of the Help System.
Universal Translator – Import and export MapInfo Professional data to and from other popular mapping file formats. Provides a log file viewer to confirm log file changes. See the Universal Translator Utility in the Tools section of the Help System.
Window Manager – Use this tool to assign the title of Map, Browser, Graph, Layout, and Redistricter window and the default table view. The Set Default View option allows you to select a layer from an open Map window and make the default zoom and center settings for the layer's base table match those of the Map window. The default center and zoom settings are written to the table's .MAP file. See the Window Manager Tool in the Tools section of the Help System.
Workspace Packager – Use this tool to create a copy of a workspace in a new location or folder, and copies all the data referenced by the workspace to the same location. MapInfo Professional updates the internal references in the workspace and .TAB files to point only to the "packaged" copies of the data, so you can open the new workspace no matter where the folder is moved or copied, even if the folder is moved or copied to a different computer. See the Workspace Packager in the Tools section of the Help System.
Workspace Resolver – Use this tool to find missing .TAB files while you are opening a workspace. See the Workspace Resolver in the Tools section of the Help System.
• Instructions for adding a tool to the Tool Manager, editing, and removing a tool from the Tool Manager are available in the Help System.

Putting Your Data on the Map
As we saw in Chapter 4: Data – Where MapInfo Professional Begins, you can convert your existing data to a format that MapInfo Professional can use to display it on a map. Now you’re getting somewhere! But how does MapInfo Professional know where to put the information on a map? That is the subject of this section of the User Guide.
Sections in this Chapter:
How Do I Get My Data on the Map? . . . . . . . . . . . . . . . . . . . . . . .200Displaying your Data on a Map . . . . . . . . . . . . . . . . . . . . . . . . . . .200Geocoding – Assigning Coordinates to Records . . . . . . . . . . . .211Putting Latitude/Longitude Coordinates on a Map . . . . . . . . . . .223Displaying Your Data on the Map . . . . . . . . . . . . . . . . . . . . . . . . .225Printing Your Results . . . . . . . . . . . . . . . . . . . . . . . . . . . . . . . . . . .226
5
How Do I Get My Data on the Map?
200 MapInfo Professional v. 9.0
How Do I Get My Data on the Map?There are three steps to putting your organization’s data on a map:
• Creating a MapInfo .tab file of your data• Geocoding or creating points for the data• Displaying your points on a map
When Do I Geocode vs. Create Points?There are two processes that MapInfo Professional uses to identify and plot your data on a map.
During Geocoding, MapInfo Professional reads data such as street data, postal code data, and other non-coordinate information from your database and matches it against street or postal code information on a MapInfo data table.
During the Create Points process, MapInfo Professional reads X and Y coordinate data (such as longitude and latitude data from a Global Positioning System) and plots data using those coordinates. Use the appropriate process to the type of data you have collected.
• For more about the geocoding process, see Geocoding – Assigning Coordinates to Records on page 211
• For more about the create points process, see Putting Latitude/Longitude Coordinates on a Map on page 223.
Note: If your data is in non-MapInfo format before you geocode or create points, you must convert it before using either of these processes.
• For more specific instructions on creating points, see Putting Longitude/Latitude Coordinates on a Map in the Help System.
Displaying your Data on a MapThe first step in using your data in MapInfo Professional is to create that .tab file from your data. This process takes the data you have created (either a spreadsheet or database) and extracts the information into a .tab file that MapInfo Professional can use. Your data remains in tact as we go through this process. The process that MapInfo Professional uses depends upon the type of format your data is in. You can create a MapInfo table of the following data file format types:
• Microsoft Excel (.XLS)• Microsoft Access (.MDB)• d-Base (.DBF)• Lotus 123 (.WKS, WK1)• ASCII (.TXT)
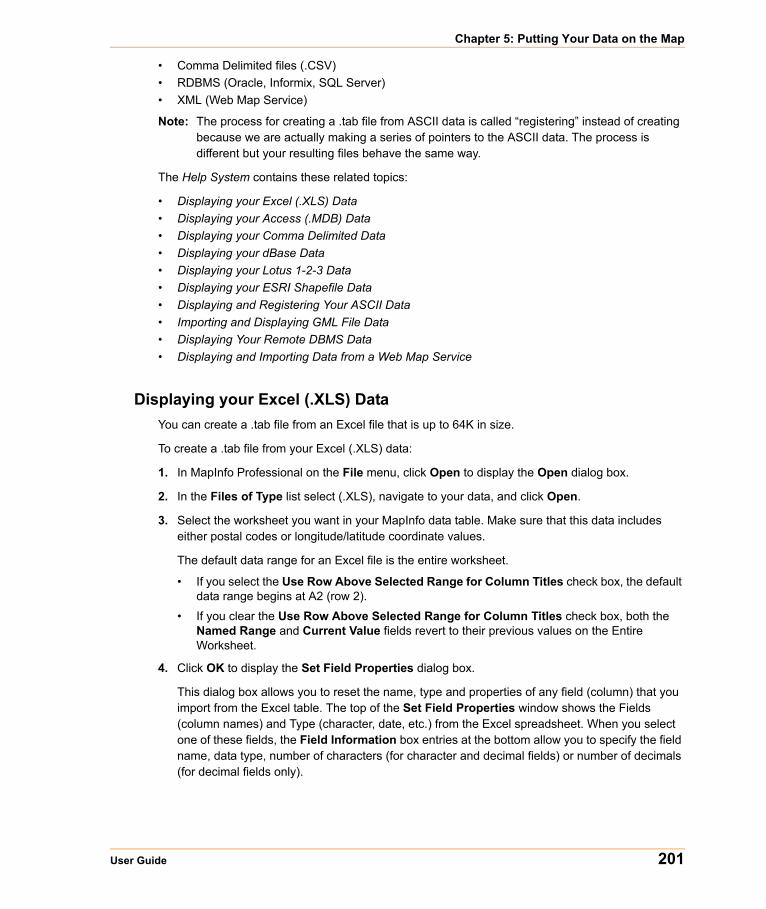
Chapter 5: Putting Your Data on the Map
User Guide 201
• Comma Delimited files (.CSV)• RDBMS (Oracle, Informix, SQL Server)• XML (Web Map Service)
Note: The process for creating a .tab file from ASCII data is called “registering” instead of creating because we are actually making a series of pointers to the ASCII data. The process is different but your resulting files behave the same way.
The Help System contains these related topics:
• Displaying your Excel (.XLS) Data• Displaying your Access (.MDB) Data• Displaying your Comma Delimited Data• Displaying your dBase Data• Displaying your Lotus 1-2-3 Data• Displaying your ESRI Shapefile Data• Displaying and Registering Your ASCII Data• Importing and Displaying GML File Data• Displaying Your Remote DBMS Data• Displaying and Importing Data from a Web Map Service
Displaying your Excel (.XLS) Data You can create a .tab file from an Excel file that is up to 64K in size.
To create a .tab file from your Excel (.XLS) data:
1. In MapInfo Professional on the File menu, click Open to display the Open dialog box.
2. In the Files of Type list select (.XLS), navigate to your data, and click Open.
3. Select the worksheet you want in your MapInfo data table. Make sure that this data includes either postal codes or longitude/latitude coordinate values.
The default data range for an Excel file is the entire worksheet.
• If you select the Use Row Above Selected Range for Column Titles check box, the default data range begins at A2 (row 2).
• If you clear the Use Row Above Selected Range for Column Titles check box, both the Named Range and Current Value fields revert to their previous values on the Entire Worksheet.
4. Click OK to display the Set Field Properties dialog box.
This dialog box allows you to reset the name, type and properties of any field (column) that you import from the Excel table. The top of the Set Field Properties window shows the Fields (column names) and Type (character, date, etc.) from the Excel spreadsheet. When you select one of these fields, the Field Information box entries at the bottom allow you to specify the field name, data type, number of characters (for character and decimal fields) or number of decimals (for decimal fields only).
Displaying your Data on a Map
202 MapInfo Professional v. 9.0
Note: If you click Cancel, MapInfo Professional cancels the import operation.
5. Click OK to convert the data to a MapInfo table (.tab) format. Now that you have converted your data, you can plot your data; see the next section to continue.
• For more information, see Default Range Options When Importing MS Excel Files and Controlling Treatment of Imported Excel Tables in the Help System.
• For more specific instructions on creating points, see Putting Longitude/Latitude Coordinates on a Map in the Help System.
Displaying your Access (.MDB) Data To convert your Microsoft Access (.MDB) data into a MapInfo Professional table:
1. Choose File > Open. The Open dialog box displays.
2. Choose Microsoft Access Database from the Files of type menu. The Access databases (.mdb) for the specified location display.
3. Choose an Access database to open. If security is turned on, you will be prompted to give user and password information to open the database.
4. The Open Access Table dialog box displays the tables for the opened database.
5. Choose an Access table or tables to open. The table or tables are opened in MapInfo Professional. (Please note that for a table name with a space such as Order Details can be saved in MapInfo Professional but subsequently will not be visible to MapInfo Professional.)
After you open an Access table in MapInfo Professional for the first time, MapInfo Professional creates a definition for the table and gives it a .TAB extension. This enables you to it treat it like any other MapInfo Professional table. For example, to open this file you would now open it like any other MapInfo Professional table.
Note: Even though the table has the .TAB extension in MapInfo Professional, your data is still in your original Access database table and is not a duplicate.
Chapter 5: Putting Your Data on the Map
User Guide 203
The Help System contains these related topics:
• Microsoft Access Table Specifications• Creating an Access Table in MapInfo Professional• Saving a MapInfo Professional Table as an Access Table• Saving an Access Table as Another Access Table• Limitations of Working Directly with Access Tables• IFor more specific instructions on creating points, see Putting Longitude/Latitude Coordinates on
a Map in the Help System.
Displaying your Comma Delimited DataYou can create native .tab files for comma delimited data in MapInfo Professional.
Opening Comma Delimited Files in MapInfo Professional
You can export tables to comma delimited .csv text files. You can open .csv files from our File > Open dialog box as well.
To open a comma delimited file:
1. From the File menu, click Open to display the Open dialog box.
2. From the Files of type dialog box, select Comma delimited CSV (.csv).
3. Navigate to the folder that contains the file you want to open and click it to select it.
4. Click Open to display the Comma Delimited CSV Information dialog box.
The Delimiter option buttons in this dialog box are disabled intentionally because commas are the only expected delimiters in this file format.
5. Select the File Character Set for this file from the drop-down list and select the Use First Line for Column Titles check box if applicable.
6. Click OK to open the file.
Exporting to a Comma Delimited CSV Format
When you export a file to a comma delimited (CSV) format, a Comma Delimited CSV Information dialog box displays. In this dialog box, you can select a new delimiter, choose the file character set, and choose to use the first column in the file for column headings. When you have made your selections, click OK.
• For more specific instructions on creating points, see Putting Longitude/Latitude Coordinates on a Map in the Help System.
Displaying your Data on a Map
204 MapInfo Professional v. 9.0
Displaying your dBase Data When you convert your data to a MapInfo Professional table, you do not in any way change the original data. MapInfo Professional simply creates a conversion table (.tab) of your data.
To open your dBase (.DBF) data into a MapInfo Professional table:
1. On the File menu, click Open to display the Open dialog box.
2. In the Files of Type list, select the format (.DBF), navigate to your data, and click Open.
3. Select the appropriate character set for your MapInfo data table. Windows U.S. and Western Europe (“ANSI”) is the default option.
4. Click OK to convert your selected data to a MapInfo table (.tab) format.
5. On the File menu, click Save Copy As to make an editable copy of your table. Then, on the File menu, click Close Table and close the original table. Finally open the editable copy.
• For more information, see Saving Data in DBF File Format in the Help System.
Displaying your Lotus 1-2-3 DataTo open your Lotus (.WKS, WK1) data into a MapInfo Professional:
1. On the File menu, click Open to display the Open dialog box.
2. In the Files of Type list, select the format (.WK1,.WKS), navigate to your data, and click Open.
3. Choose the worksheet you want to convert to a MapInfo data table.
Note: If there are column headings above each column in this worksheet, select the Use Row Above Selected Range for Column Titles check box. Then, select Other from the drop-down box and specify the cell range of the data you want to include in the MapInfo Professional table.
4. Click OK to convert your data to MapInfo Professional table format.
Displaying your ESRI Shapefile Data One of the prominent graphical formats in our industry is the ESRI shapefile.
To open a shapefile in MapInfo Professional:
1. On the File menu, click Open to display the Open dialog box.
2. Select ESRI shapefile in the Files of type drop-down list.
3. Navigate to the file’s directory and click it to open it.
4. Click Open to display the Please specify a TAB filename file. This dialog box saves the shapefile into a format that MapInfo Professional can read. The file has the same name as the file you selected but has a .tab extension.
5. Click Save to display the Shapefile Information dialog box.
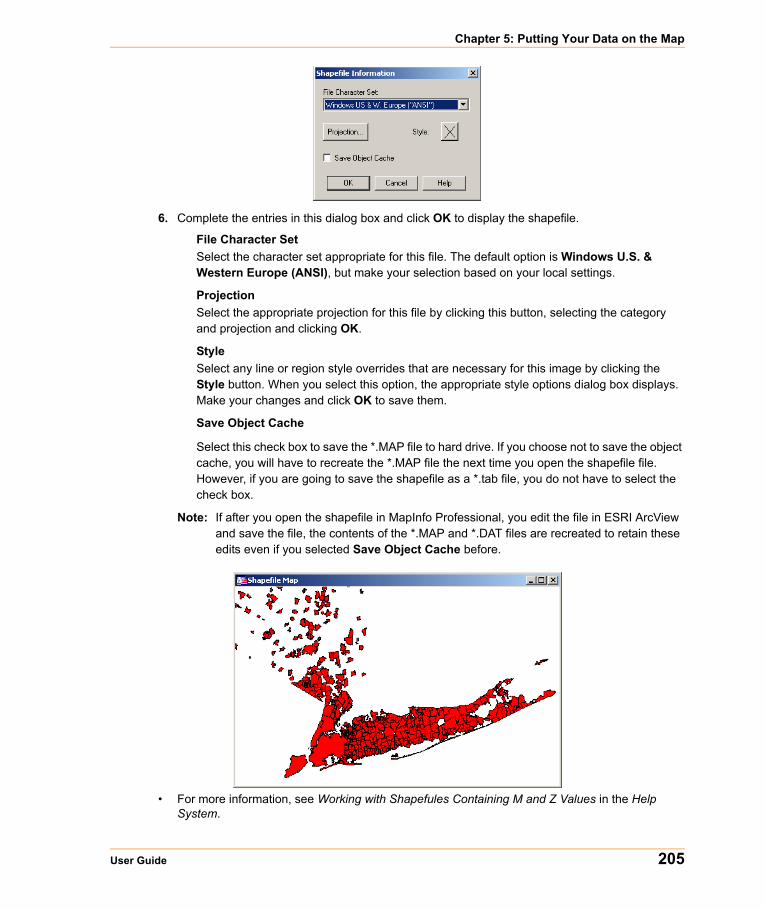
Chapter 5: Putting Your Data on the Map
User Guide 205
6. Complete the entries in this dialog box and click OK to display the shapefile.
File Character SetSelect the character set appropriate for this file. The default option is Windows U.S. & Western Europe (ANSI), but make your selection based on your local settings.
ProjectionSelect the appropriate projection for this file by clicking this button, selecting the category and projection and clicking OK.
StyleSelect any line or region style overrides that are necessary for this image by clicking the Style button. When you select this option, the appropriate style options dialog box displays. Make your changes and click OK to save them.
Save Object Cache
Select this check box to save the *.MAP file to hard drive. If you choose not to save the object cache, you will have to recreate the *.MAP file the next time you open the shapefile file. However, if you are going to save the shapefile as a *.tab file, you do not have to select the check box.
Note: If after you open the shapefile in MapInfo Professional, you edit the file in ESRI ArcView and save the file, the contents of the *.MAP and *.DAT files are recreated to retain these edits even if you selected Save Object Cache before.
• For more information, see Working with Shapefules Containing M and Z Values in the Help System.
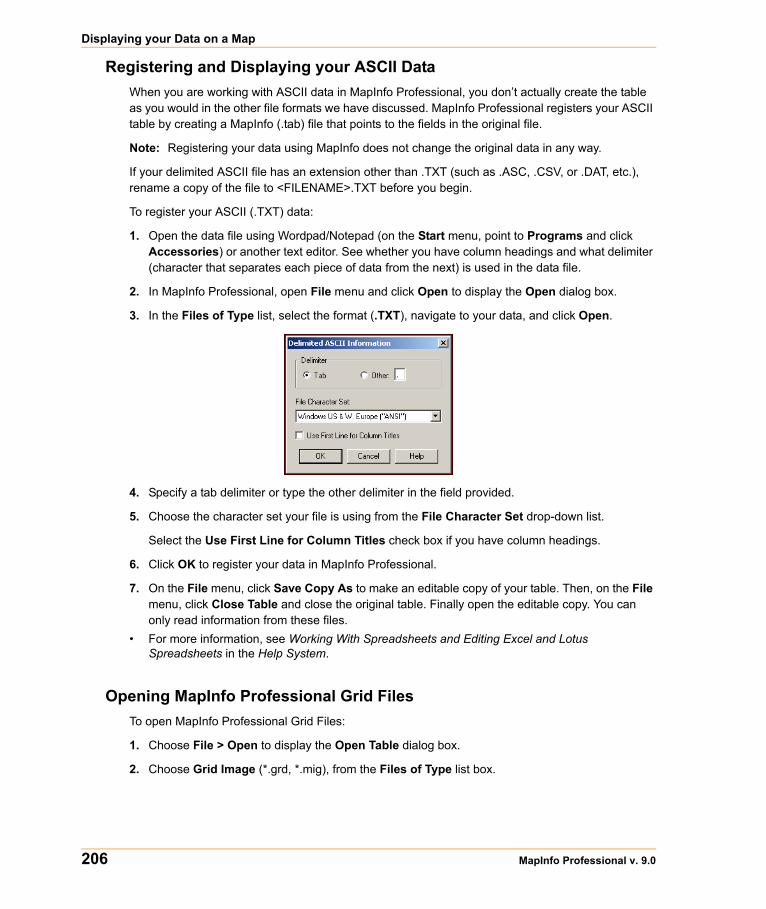
Displaying your Data on a Map
206 MapInfo Professional v. 9.0
Registering and Displaying your ASCII Data When you are working with ASCII data in MapInfo Professional, you don’t actually create the table as you would in the other file formats we have discussed. MapInfo Professional registers your ASCII table by creating a MapInfo (.tab) file that points to the fields in the original file.
Note: Registering your data using MapInfo does not change the original data in any way.
If your delimited ASCII file has an extension other than .TXT (such as .ASC, .CSV, or .DAT, etc.), rename a copy of the file to <FILENAME>.TXT before you begin.
To register your ASCII (.TXT) data:
1. Open the data file using Wordpad/Notepad (on the Start menu, point to Programs and click Accessories) or another text editor. See whether you have column headings and what delimiter (character that separates each piece of data from the next) is used in the data file.
2. In MapInfo Professional, open File menu and click Open to display the Open dialog box.
3. In the Files of Type list, select the format (.TXT), navigate to your data, and click Open.
4. Specify a tab delimiter or type the other delimiter in the field provided.
5. Choose the character set your file is using from the File Character Set drop-down list.
Select the Use First Line for Column Titles check box if you have column headings.
6. Click OK to register your data in MapInfo Professional.
7. On the File menu, click Save Copy As to make an editable copy of your table. Then, on the File menu, click Close Table and close the original table. Finally open the editable copy. You can only read information from these files.
• For more information, see Working With Spreadsheets and Editing Excel and Lotus Spreadsheets in the Help System.
Opening MapInfo Professional Grid Files To open MapInfo Professional Grid Files:
1. Choose File > Open to display the Open Table dialog box.
2. Choose Grid Image (*.grd, *.mig), from the Files of Type list box.
Chapter 5: Putting Your Data on the Map
User Guide 207
3. Click the file you want to open and click the Open button.
Note: There are some grid files in the introductory data provided on the MapInfo Professional data CD.
Importing Graphic Files To import a graphic file:
1. Choose Table > Import to display the Import File dialog box. Specify the location, name, and format of the file you want to import.
2. Click Import to display the Import into Table dialog box.
3. Specify the name and new table format for the table you are creating.
4. Click Save. The file is imported into the file you named with the specified format.
Importing and Displaying GML File Data You can import OSGB MasterMap GML Files into MapInfo Professional. Each layer in the GML file is imported into a separate .TAB file. We provide support for some of the Topography features (OSGB version 2.0), Topographic Area, Lines and Points, Cartographic Symbols and Boundary Lines. Currently, we maintain support for these features and add support for Cartographic Text and Departed Features.
Currently, we support the OSGB recommended styles by mapping the style definitions to existing MapInfo Professional styles. Where it is not possible to render complicated fill patterns, we use the simple dot screen that the OSGB recommended to us. You cannot change the OSGB style mapping to MapInfo styles.
• For more information, see Importing and Displaying GML File Data in the Help System.
Importing and Displaying GML 2.1 Files
You can import GML 2.1 files into MapInfo Professional directly. To import successfully, the XML must contain a reference to a valid schema that MapInfo Professional can read. For example, the schema location could be a path relative to the XML file:
xsi:schemaLocation="http://www.mapinfo.com/wfs_XX .\mi_usa.xsd"
Or, it could be a URI:
xsi:schemaLocation="http://www.lm.se/xml/namespace/abc http://www2.xxx.se/xml/scheman/abc.xsd"• For more specific instructions, see Importing and Displaying GML 2.1 Files in the Help System.

Displaying your Data on a Map
208 MapInfo Professional v. 9.0
Understanding MapInfo Professional’s Use of the Topography LayerOSGB MasterMap’s Topographic Layer contains nine themes including roads, tracks and paths, buildings, landforms, water, height, heritage, structures, and administrative boundaries. You can import these themes as TopographicArea, LandformArea, TopographicLine, TopograpicPoint, CartographicText, CartographicSymbols, BoundaryLines, and DepartedFeatures. The TopographicArea feature type contains two 'complexes', Topography and Landform, which contain different polygons of information. The Landform polygons overlap the Topography polygons (which represent land features like slopes and cliffs).
We split the TopographicArea feature type output into two layers so it is possible to save them in different tables. The TopographicArea table contains only output whose areas defined in the OSGB user guide as being part of the Topography complex or Structuring Layer. There is a feature type in the GML Import dialog box called LandformArea, which allows the creation of the LandformArea table. See Importing GML File Data into .tab Files on page 203 for a clearer picture of this process in action.
Viewing a List of Open TablesYou can view a list of open tables but you cannot add or remove tables from this list in any way. This list is view-only.
Note: Hover over an entry in the Tables List to display the path of the open table.
To view a list of open tables:
1. From the Table menu, choose List Open Tables to display the Table List dialog box.
2. Select the Group by Type check box to display the tables by format type. Click OK to close the dialog box.
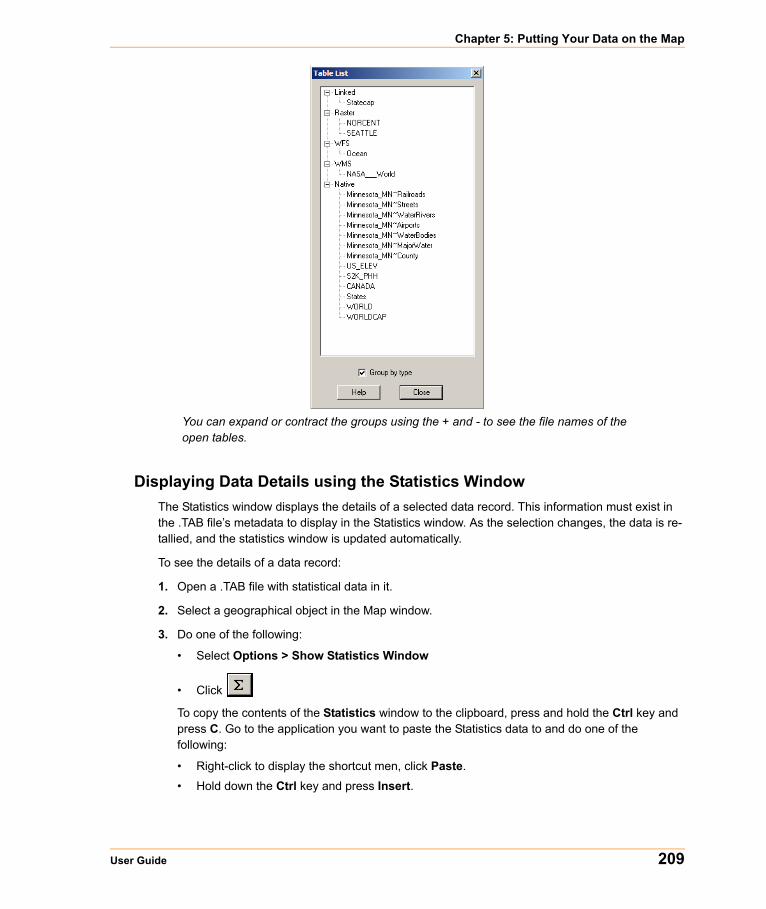
Chapter 5: Putting Your Data on the Map
User Guide 209
You can expand or contract the groups using the + and - to see the file names of the open tables.
Displaying Data Details using the Statistics Window
The Statistics window displays the details of a selected data record. This information must exist in the .TAB file’s metadata to display in the Statistics window. As the selection changes, the data is re-tallied, and the statistics window is updated automatically.
To see the details of a data record:
1. Open a .TAB file with statistical data in it.
2. Select a geographical object in the Map window.
3. Do one of the following:
• Select Options > Show Statistics Window
• Click
To copy the contents of the Statistics window to the clipboard, press and hold the Ctrl key and press C. Go to the application you want to paste the Statistics data to and do one of the following:
• Right-click to display the shortcut men, click Paste.
• Hold down the Ctrl key and press Insert.
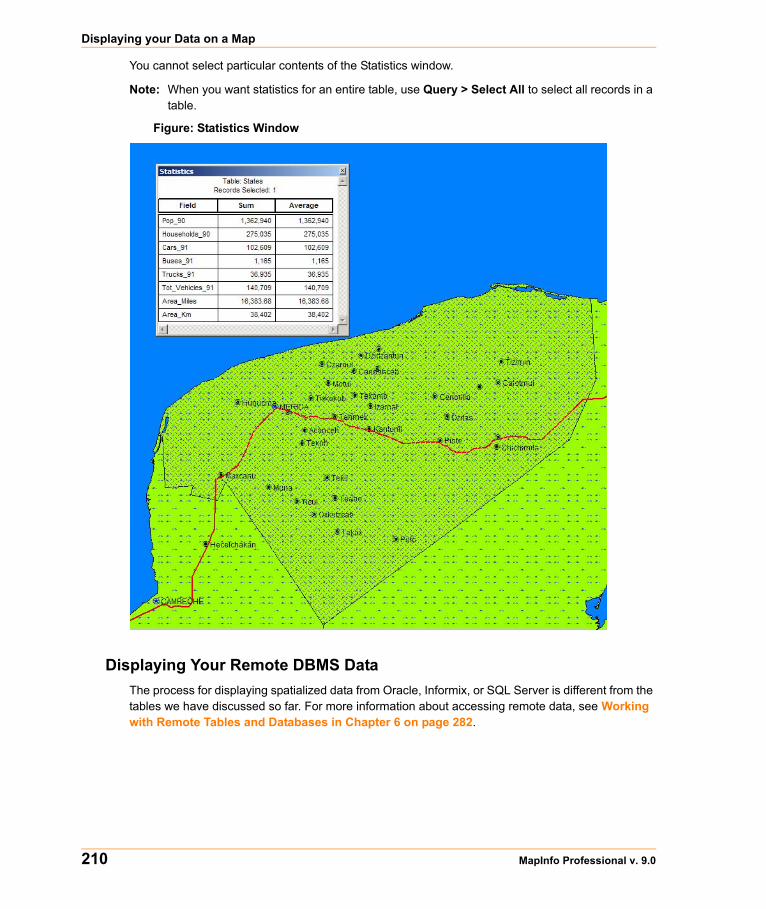
Displaying your Data on a Map
210 MapInfo Professional v. 9.0
You cannot select particular contents of the Statistics window.
Note: When you want statistics for an entire table, use Query > Select All to select all records in a table.
Figure: Statistics Window
Displaying Your Remote DBMS DataThe process for displaying spatialized data from Oracle, Informix, or SQL Server is different from the tables we have discussed so far. For more information about accessing remote data, see Working with Remote Tables and Databases in Chapter 6 on page 282.
Chapter 5: Putting Your Data on the Map
User Guide 211
Displaying and Importing Data from a Web Map ServiceA Web Map Service (WMS) is a technology that gives you a source for data over your Intranet or over the Internet. This innovation is based on a specification from the Open GIS Consortium (OGC) and allows you to use raster map images from servers that also comply with the specification. You must specify the coordinate system within your data request to ensure that the images you retrieve “sync up” or register with your other map data.
This specification supports transparent pixel definition for image formats as well. This allows you to use the images you retrieve as overlays and not solely as the bottom layer of your map.
WMS data may not exist for the geography you are looking for. Further, the data that is provided is determined by the WMS server.
Note: You must have a working Internet connection to retrieve or use WMS data.
• For instructions on retrieving and displaying data from a Web Map Service, see Retrieving Map Data from Web Map Services in the Help System.
Geocoding – Assigning Coordinates to Records To display your data on a map, you must first assign X and Y coordinates to each record. One way that MapInfo Professional assigns these coordinates is by matching geographic information in your database table to geographic information in another table (referred to as a search table) that already has X and Y coordinates associated with it.
For example, you want to assign X and Y coordinates to a customer record whose address is 127 Winston Ave. MapInfo Professional reads that address and looks for a matching address in the search table, such as a StreetPro table. (This search table already has X and Y coordinates associated with its records.)
When MapInfo Professional matches 127 Winston Ave in your table to 127 Winston Ave in the search table, it assigns the corresponding X and Y coordinates to your record. The geocoded point becomes part of your database. You can then view these points by displaying your table in a Map window.
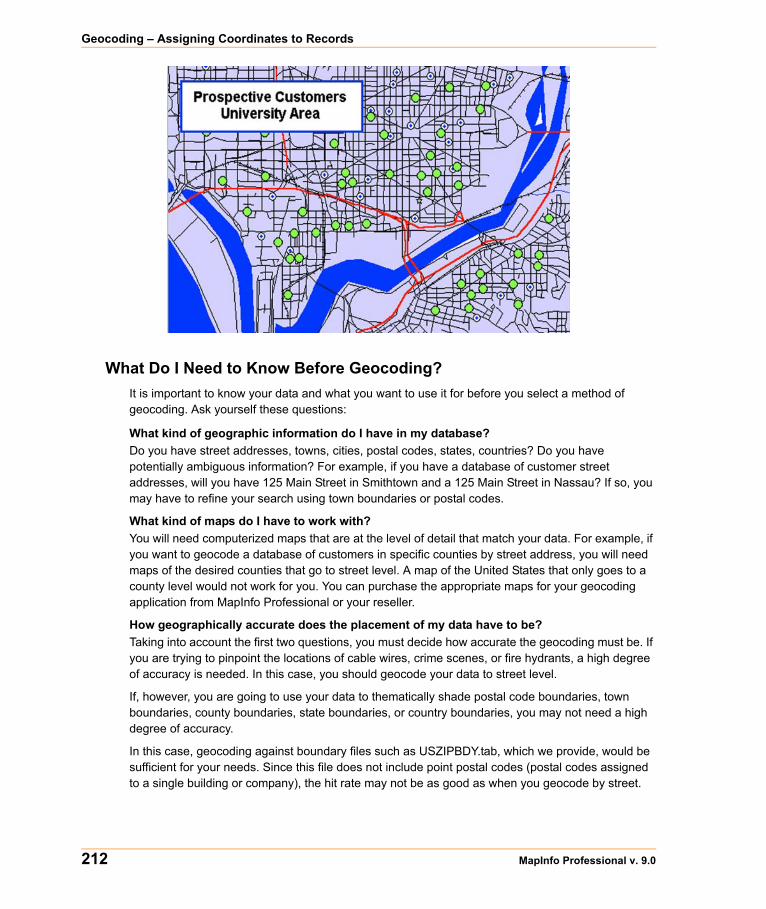
Geocoding – Assigning Coordinates to Records
212 MapInfo Professional v. 9.0
What Do I Need to Know Before Geocoding?It is important to know your data and what you want to use it for before you select a method of geocoding. Ask yourself these questions:
What kind of geographic information do I have in my database? Do you have street addresses, towns, cities, postal codes, states, countries? Do you have potentially ambiguous information? For example, if you have a database of customer street addresses, will you have 125 Main Street in Smithtown and a 125 Main Street in Nassau? If so, you may have to refine your search using town boundaries or postal codes.
What kind of maps do I have to work with? You will need computerized maps that are at the level of detail that match your data. For example, if you want to geocode a database of customers in specific counties by street address, you will need maps of the desired counties that go to street level. A map of the United States that only goes to a county level would not work for you. You can purchase the appropriate maps for your geocoding application from MapInfo Professional or your reseller.
How geographically accurate does the placement of my data have to be? Taking into account the first two questions, you must decide how accurate the geocoding must be. If you are trying to pinpoint the locations of cable wires, crime scenes, or fire hydrants, a high degree of accuracy is needed. In this case, you should geocode your data to street level.
If, however, you are going to use your data to thematically shade postal code boundaries, town boundaries, county boundaries, state boundaries, or country boundaries, you may not need a high degree of accuracy.
In this case, geocoding against boundary files such as USZIPBDY.tab, which we provide, would be sufficient for your needs. Since this file does not include point postal codes (postal codes assigned to a single building or company), the hit rate may not be as good as when you geocode by street.

Chapter 5: Putting Your Data on the Map
User Guide 213
Understanding the Geocoding ProcessTo assign X and Y coordinates to the records in your table, choose Geocode from the Table menu. MapInfo Professional displays the Geocode dialog box, where you enter the following information:
• The name of your table for which you want to assign X and Y coordinates. • The column in your table that contains the geographic information that will be used for matching.• The name of the search table containing the geographic information that will be used for
matching.• The search table column containing the geographic information for matching:
The dialog box also offers you the option of geocoding your data in two modes: automatically or interactively. When you geocode a table automatically, MapInfo Professional geocodes exact matches only and ignores all other records. It is the faster method, since MapInfo Professional requires no user interaction once the geocoding process begins. When you geocode a table interactively, MapInfo Professional pauses when it fails to match a record and lets you select from a list of close matches. For more about the automatic and interactive geocoding modes, see Modes of Geocoding on page 214.
Note: We recommend that you geocode your table automatically first and then go back and geocode interactively to match the remaining records.
Not Getting Geocoding? Try this Example...
The objective of geocoding is to place data from your database accurately on a map. Let us call your data the source table. You can think of the geographical coordinates on a map as a target table.
To geocode a record:
• MapInfo has to match an address in the source table with a location on the target table
Most of the problems in geocoding occur in trying to take the address data in the source file and match it to addresses in the target tables.
Geocoding – Assigning Coordinates to Records
214 MapInfo Professional v. 9.0
Modes of GeocodingMapInfo has two geocoding modes: automatic and interactive. The process MapInfo uses to match target addresses with source addresses is the same in both modes.
Automatic mode matches addresses based on the choices in the Geocode dialog box.
When Geocoding is in automatic mode, only exact matches are geocoded. When some of your data fails to match exactly (due, perhaps, to typographical errors), you need to geocode in Interactive mode to match the near misses by hand. It is generally best to do two passes through your table, with the first pass set on Automatic and the second pass set on Interactive. This approach takes less processing time.
• For instructions on geocoding in automatic mode, see Geocoding Automatically in the Help System.
Interactive mode stops at each address that does not meet the geocode parameters and permits you to assist in the matching process. When you geocode interactively, you are not changing the data. You are merely redirecting MapInfo Professional to look for different information.
• For more information, see Geocoding Interactively in the Help System.
In most cases, the best geocoding strategy is to geocode in automatic mode and then geocode in interactive mode to deal with the records MapInfo was unable to handle automatically.
Manual mode. Automatic and interactive geocoding work well for databases with “clean” data. Sometimes, however, you know where a point should be on the map, but the location data does not allow for a match. Manual geocoding is the process of placing your data records on the map by clicking its location on the map. This method works best when you have a small table which contains data that you are very familiar with.
• For more information, see Geocoding Manually in the Help System.
Methods of GeocodingIn addition to geocoding automatically and manually, you have choices in how precise you want the geocoded record to be. Let’s look at the variety of ways you can geocode your table.
Geocoding by Address
Street addresses typically consist of two or three components:
• Street number• Street name• Apartment, Suite, Floor, Room number or some other piece of information. Many addresses do
not have this component
MapInfo has one procedure for dealing with the street number and another procedure for dealing with the street name. MapInfo deals with the third component, if present, as though it were a part of the street name.
When you geocode your table with street addresses, MapInfo Professional matches the addresses in your table to the street names and address ranges in a street table, such as StreetPro (MapInfo’s premier streets data product) and assigns X and Y coordinates to your records. When you display
Chapter 5: Putting Your Data on the Map
User Guide 215
your records, MapInfo Professional will spot the record at the location of the record’s address. MapInfo Professional places the record on the proper side of the street, offsets it from the side of the street to the specified distance, and insets it from the end of the street the specified percentage of the line. The Options dialog box controls these parameters. For more about setting the street offset in the Options dialog box, see Street Offset on page 219.
Geocoding by Boundary
In computer mapping, the term boundary is used to designate enclosed regions or areas such as countries, cities, and postal codes. When you geocode your table with boundaries, MapInfo Professional matches the boundary name in your table with the boundary name in the search table. MapInfo Professional assigns the boundary centroid X and Y coordinates to your data records. The centroid of a boundary is its approximate center point.
For example, you have a table of wholesale outlet stores. You want to assign X and Y coordinates to each record according to county. MapInfo Professional reads the county name from your table, matches it with the county name in the search table, and assigns the county centroid coordinates to each of your records. The outlet locations will display at the county centroid in a Map window.
Geocoding by US_ZIPS.tab (Postal Code Centroid File)
US_ZIPS.tab is a point file that is included with the base MapInfo Professional package. The file consists of postal code centroid points for every postal code in the United States. This file can be used to geocode any database that includes postal code information. This file includes point postal codes that are assigned to single buildings or companies.
You can use any of the above methods to geocode your records, or you can use a combination of address and boundary geocoding to increase the potential for a successful match.
Geocoding by Server
If you have access to a geocoding server such as MapMarker or Envinsa Server, you can geocode using a more extensive data set.
Refining Your Geocoding Search When geocoding, you might refer to objects whose names are used for other objects that do not interest you (for example, a city name that is common to two or more states). To eliminate this problem, refine your search by selecting another column (from, typically, another table). To further refine the search, specify the state for each city, rather than just the city name.
If your area of interest isn't unique enough for MapInfo Professional to automatically determine the position or location, you will need to refine your geocode search by specifying a particular boundary that contains your area of interest. This will provide MapInfo Professional with geographic locations on where to position your points.
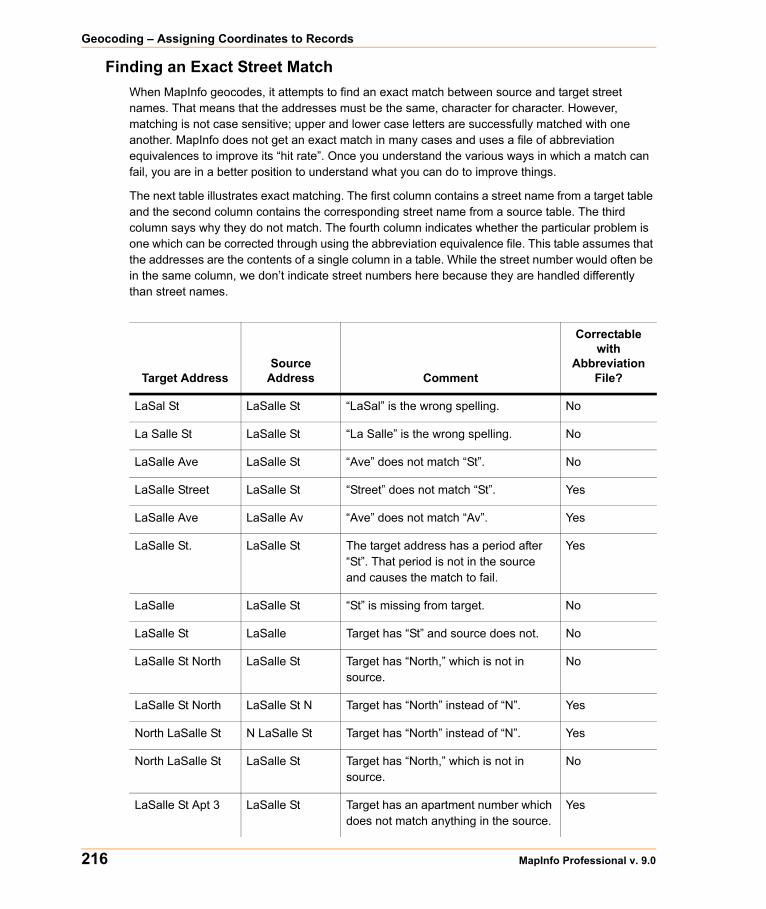
Geocoding – Assigning Coordinates to Records
216 MapInfo Professional v. 9.0
Finding an Exact Street MatchWhen MapInfo geocodes, it attempts to find an exact match between source and target street names. That means that the addresses must be the same, character for character. However, matching is not case sensitive; upper and lower case letters are successfully matched with one another. MapInfo does not get an exact match in many cases and uses a file of abbreviation equivalences to improve its “hit rate”. Once you understand the various ways in which a match can fail, you are in a better position to understand what you can do to improve things.
The next table illustrates exact matching. The first column contains a street name from a target table and the second column contains the corresponding street name from a source table. The third column says why they do not match. The fourth column indicates whether the particular problem is one which can be corrected through using the abbreviation equivalence file. This table assumes that the addresses are the contents of a single column in a table. While the street number would often be in the same column, we don’t indicate street numbers here because they are handled differently than street names.
Target AddressSource
Address Comment
Correctable with
Abbreviation File?
LaSal St LaSalle St “LaSal” is the wrong spelling. No
La Salle St LaSalle St “La Salle” is the wrong spelling. No
LaSalle Ave LaSalle St “Ave” does not match “St”. No
LaSalle Street LaSalle St “Street” does not match “St”. Yes
LaSalle Ave LaSalle Av “Ave” does not match “Av”. Yes
LaSalle St. LaSalle St The target address has a period after “St”. That period is not in the source and causes the match to fail.
Yes
LaSalle LaSalle St “St” is missing from target. No
LaSalle St LaSalle Target has “St” and source does not. No
LaSalle St North LaSalle St Target has “North,” which is not in source.
No
LaSalle St North LaSalle St N Target has “North” instead of “N”. Yes
North LaSalle St N LaSalle St Target has “North” instead of “N”. Yes
North LaSalle St LaSalle St Target has “North,” which is not in source.
No
LaSalle St Apt 3 LaSalle St Target has an apartment number which does not match anything in the source.
Yes
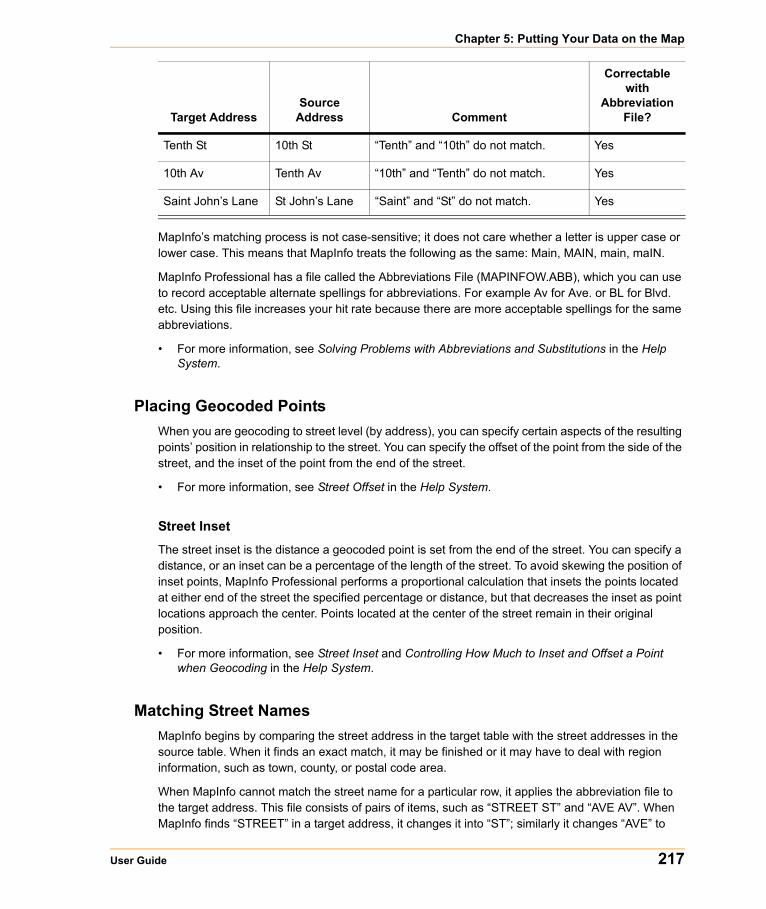
Chapter 5: Putting Your Data on the Map
User Guide 217
MapInfo’s matching process is not case-sensitive; it does not care whether a letter is upper case or lower case. This means that MapInfo treats the following as the same: Main, MAIN, main, maIN.
MapInfo Professional has a file called the Abbreviations File (MAPINFOW.ABB), which you can use to record acceptable alternate spellings for abbreviations. For example Av for Ave. or BL for Blvd. etc. Using this file increases your hit rate because there are more acceptable spellings for the same abbreviations.
• For more information, see Solving Problems with Abbreviations and Substitutions in the Help System.
Placing Geocoded PointsWhen you are geocoding to street level (by address), you can specify certain aspects of the resulting points’ position in relationship to the street. You can specify the offset of the point from the side of the street, and the inset of the point from the end of the street.
• For more information, see Street Offset in the Help System.
Street Inset
The street inset is the distance a geocoded point is set from the end of the street. You can specify a distance, or an inset can be a percentage of the length of the street. To avoid skewing the position of inset points, MapInfo Professional performs a proportional calculation that insets the points located at either end of the street the specified percentage or distance, but that decreases the inset as point locations approach the center. Points located at the center of the street remain in their original position.
• For more information, see Street Inset and Controlling How Much to Inset and Offset a Point when Geocoding in the Help System.
Matching Street NamesMapInfo begins by comparing the street address in the target table with the street addresses in the source table. When it finds an exact match, it may be finished or it may have to deal with region information, such as town, county, or postal code area.
When MapInfo cannot match the street name for a particular row, it applies the abbreviation file to the target address. This file consists of pairs of items, such as “STREET ST” and “AVE AV”. When MapInfo finds “STREET” in a target address, it changes it into “ST”; similarly it changes “AVE” to
Tenth St 10th St “Tenth” and “10th” do not match. Yes
10th Av Tenth Av “10th” and “Tenth” do not match. Yes
Saint John’s Lane St John’s Lane “Saint” and “St” do not match. Yes
Target AddressSource
Address Comment
Correctable with
Abbreviation File?
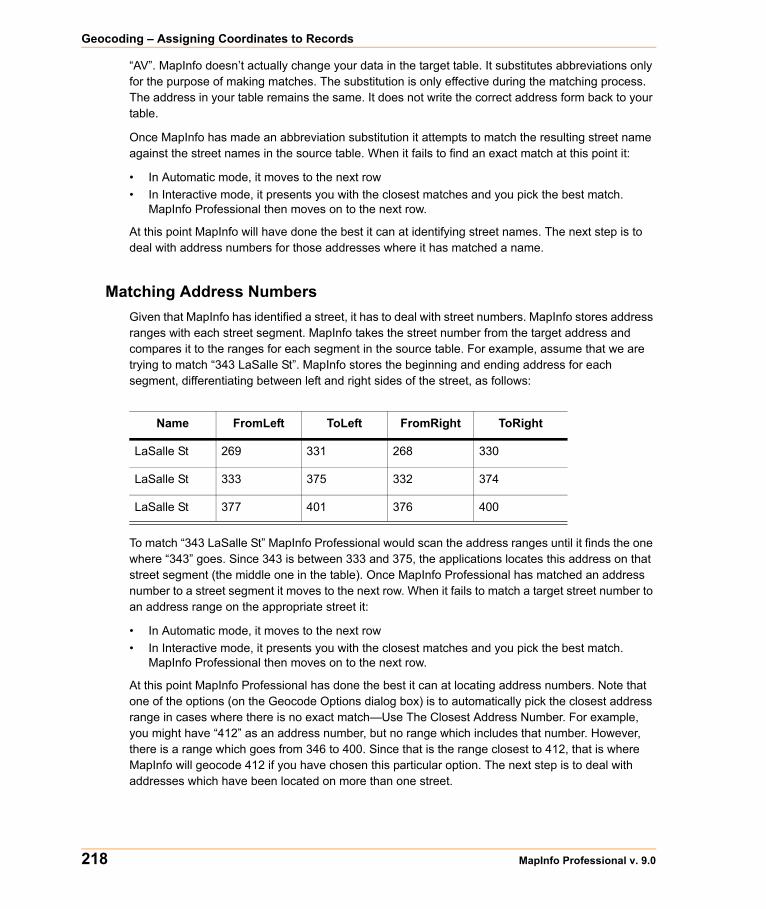
Geocoding – Assigning Coordinates to Records
218 MapInfo Professional v. 9.0
“AV”. MapInfo doesn’t actually change your data in the target table. It substitutes abbreviations only for the purpose of making matches. The substitution is only effective during the matching process. The address in your table remains the same. It does not write the correct address form back to your table.
Once MapInfo has made an abbreviation substitution it attempts to match the resulting street name against the street names in the source table. When it fails to find an exact match at this point it:
• In Automatic mode, it moves to the next row• In Interactive mode, it presents you with the closest matches and you pick the best match.
MapInfo Professional then moves on to the next row.
At this point MapInfo will have done the best it can at identifying street names. The next step is to deal with address numbers for those addresses where it has matched a name.
Matching Address NumbersGiven that MapInfo has identified a street, it has to deal with street numbers. MapInfo stores address ranges with each street segment. MapInfo takes the street number from the target address and compares it to the ranges for each segment in the source table. For example, assume that we are trying to match “343 LaSalle St”. MapInfo stores the beginning and ending address for each segment, differentiating between left and right sides of the street, as follows:
To match “343 LaSalle St” MapInfo Professional would scan the address ranges until it finds the one where “343” goes. Since 343 is between 333 and 375, the applications locates this address on that street segment (the middle one in the table). Once MapInfo Professional has matched an address number to a street segment it moves to the next row. When it fails to match a target street number to an address range on the appropriate street it:
• In Automatic mode, it moves to the next row• In Interactive mode, it presents you with the closest matches and you pick the best match.
MapInfo Professional then moves on to the next row.
At this point MapInfo Professional has done the best it can at locating address numbers. Note that one of the options (on the Geocode Options dialog box) is to automatically pick the closest address range in cases where there is no exact match—Use The Closest Address Number. For example, you might have “412” as an address number, but no range which includes that number. However, there is a range which goes from 346 to 400. Since that is the range closest to 412, that is where MapInfo will geocode 412 if you have chosen this particular option. The next step is to deal with addresses which have been located on more than one street.
Name FromLeft ToLeft FromRight ToRight
LaSalle St 269 331 268 330
LaSalle St 333 375 332 374
LaSalle St 377 401 376 400
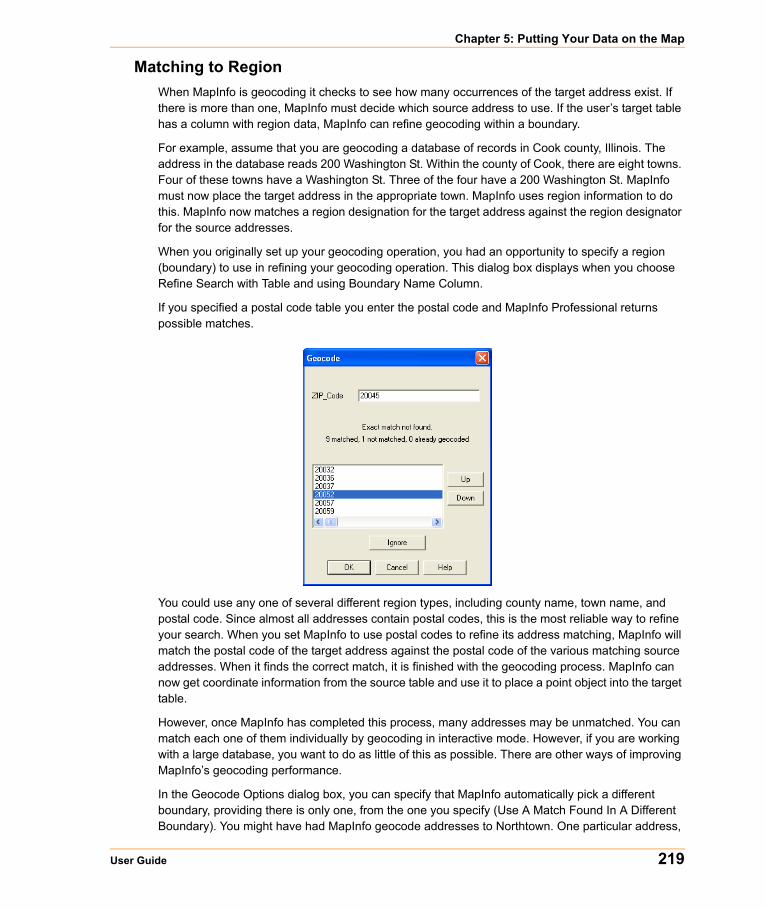
Chapter 5: Putting Your Data on the Map
User Guide 219
Matching to RegionWhen MapInfo is geocoding it checks to see how many occurrences of the target address exist. If there is more than one, MapInfo must decide which source address to use. If the user’s target table has a column with region data, MapInfo can refine geocoding within a boundary.
For example, assume that you are geocoding a database of records in Cook county, Illinois. The address in the database reads 200 Washington St. Within the county of Cook, there are eight towns. Four of these towns have a Washington St. Three of the four have a 200 Washington St. MapInfo must now place the target address in the appropriate town. MapInfo uses region information to do this. MapInfo now matches a region designation for the target address against the region designator for the source addresses.
When you originally set up your geocoding operation, you had an opportunity to specify a region (boundary) to use in refining your geocoding operation. This dialog box displays when you choose Refine Search with Table and using Boundary Name Column.
If you specified a postal code table you enter the postal code and MapInfo Professional returns possible matches.
You could use any one of several different region types, including county name, town name, and postal code. Since almost all addresses contain postal codes, this is the most reliable way to refine your search. When you set MapInfo to use postal codes to refine its address matching, MapInfo will match the postal code of the target address against the postal code of the various matching source addresses. When it finds the correct match, it is finished with the geocoding process. MapInfo can now get coordinate information from the source table and use it to place a point object into the target table.
However, once MapInfo has completed this process, many addresses may be unmatched. You can match each one of them individually by geocoding in interactive mode. However, if you are working with a large database, you want to do as little of this as possible. There are other ways of improving MapInfo’s geocoding performance.
In the Geocode Options dialog box, you can specify that MapInfo automatically pick a different boundary, providing there is only one, from the one you specify (Use A Match Found In A Different Boundary). You might have had MapInfo geocode addresses to Northtown. One particular address,

Geocoding – Assigning Coordinates to Records
220 MapInfo Professional v. 9.0
“223 Locust Ct.” is not in Northtown, but it is in Westville, and no place else. In this case, MapInfo would geocode “223 Locust Ct.” to Westville. However, if MapInfo had found a “223 Locust Ct.” in Westville and another one in Center Valley, it would not geocode the address to either town. It would leave “223 Locust Ct.” ungeocoded.
For more information, see After Geocoding in the Help System. This section contains the following topics:
• Finding and Examining Ungeocoded Records• Extracting Longitude and Latitude from a Geocoded Table• Extracting Longitude and Latitude into a New Table• Extracting Longitude and Latitude into the Original Table• Extracting a Table in a Projection Other than Longitude/Latitude
Selecting Records Not Geocoded
Your geocoded table may have records that did not geocode, or you may have added new data to your table that have yet to be geocoded. There is a simple selection that can be performed to get a Browser list of the records not geocoded.
1. Open your table if it is not open already, and on the Query menu, click Select.
2. Fill in the Select dialog box. The expression used is “NOT OBJ.” This selects all of the records that are not objects, i.e., not geocoded. Click OK.
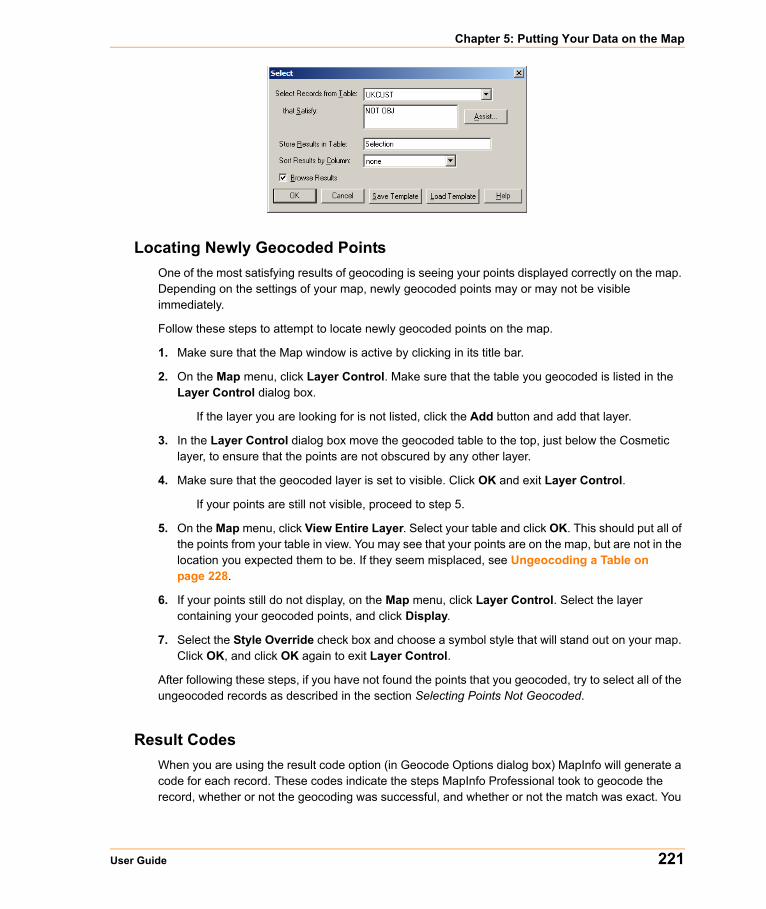
Chapter 5: Putting Your Data on the Map
User Guide 221
Locating Newly Geocoded PointsOne of the most satisfying results of geocoding is seeing your points displayed correctly on the map. Depending on the settings of your map, newly geocoded points may or may not be visible immediately.
Follow these steps to attempt to locate newly geocoded points on the map.
1. Make sure that the Map window is active by clicking in its title bar.
2. On the Map menu, click Layer Control. Make sure that the table you geocoded is listed in the Layer Control dialog box.
If the layer you are looking for is not listed, click the Add button and add that layer.
3. In the Layer Control dialog box move the geocoded table to the top, just below the Cosmetic layer, to ensure that the points are not obscured by any other layer.
4. Make sure that the geocoded layer is set to visible. Click OK and exit Layer Control.
If your points are still not visible, proceed to step 5.
5. On the Map menu, click View Entire Layer. Select your table and click OK. This should put all of the points from your table in view. You may see that your points are on the map, but are not in the location you expected them to be. If they seem misplaced, see Ungeocoding a Table on page 228.
6. If your points still do not display, on the Map menu, click Layer Control. Select the layer containing your geocoded points, and click Display.
7. Select the Style Override check box and choose a symbol style that will stand out on your map. Click OK, and click OK again to exit Layer Control.
After following these steps, if you have not found the points that you geocoded, try to select all of the ungeocoded records as described in the section Selecting Points Not Geocoded.
Result CodesWhen you are using the result code option (in Geocode Options dialog box) MapInfo will generate a code for each record. These codes indicate the steps MapInfo Professional took to geocode the record, whether or not the geocoding was successful, and whether or not the match was exact. You
Geocoding – Assigning Coordinates to Records
222 MapInfo Professional v. 9.0
can use return codes to diagnose MapInfo’s geocoding performance. It will help you spot “false positives” resulting from using various geocoding options and to analyze why some records have not been geocoded.
Ungeocoding a Table Ungeocoding is the process of removing objects that have been attached to data records. There are times when it will be necessary to ungeocode an entire table or selected records in a table. For example, you have geocoded a database of customers using US_ZIPS.tab. Later, you want to geocode the database again, using street addresses instead of postal code centroids since the geocoding will be more precise. MapInfo Professional allows you to delete all graphic objects associated with this table. You can then geocode your database again, using more specific coordinates. Ungeocoding only selected records from your table is useful when the location information changes for a relatively small number of records, such as address changes in a geocoded list of customers.
To ungeocode and remove one or more of the objects in a table:
1. Make the table you are working with the editable layer of the active Map window.
2. Select the object or objects.
3. Click the Map window to make it active.
4. Choose Edit > Clear Map Objects Only.
To ungeocode an entire table:
1. On the Table menu, point to Maintenance and click Table Structure. The Modify Table Structure dialog box displays.
2. Clear the Table Is Mappable check box. Click OK.
CAUTION: This action will remove all graphic objects from your table. This action cannot be undone. If you are unsure of losing your points, save a copy of the table first.
3. A warning dialog box appears. If you are sure about removing all the objects, click OK.
All graphic objects have been removed from your table.
Make sure that you don’t ungeocode your source tables. Unless you have created a backup of that table, you will no longer be able to display that table as a map or use it for geocoding.
Ungeocoding Selected Records
To ungeocode and remove one or more of the objects in a table:
1. Make the table you are working with the editable layer of the active Map window.
2. Select the object or objects.
3. Choose Edit > Clear Map Objects Only.
For more information about trouble shooting your geocoding issues, see Resolving Geocoding Issues in the Help System. This section contains the following topics:
Chapter 5: Putting Your Data on the Map
User Guide 223
• Resolving Spelling Errors in your Data Records• Resoving Incorrect Address Numbers in your Data Records• Working with the Abbreviations File• When an Input Address Finds More than One Location• Solving Problems of Space-Delimited Simple Substitution• Resolving Simple Truncation• Resolving Space-Delimited Truncation• Resolving Simple Substitution• Handling Legitimate Spaces• Handling Special Characters• Resolving Alternate Street Names, Street Names have Changed• Resolving Incorrect Address Ranges• Geocoding Post Office Boxes• Correcting Inaccurate Town Names• Correcting Geocoding Errors using Result Codes• Examples of Geocoding Result Codes
Putting Latitude/Longitude Coordinates on a Map
You may have a file that already contains X and Y coordinates, but not the point objects themselves that you want to display in MapInfo Professional. While the geographic information exists in the table, MapInfo Professional needs to create points to represent these coordinates before displaying them in a Map window. The Create Points command under the Table menu allows you to create points for each record in your database that has X-Y coordinate information.
Note: MapInfo Professional uses the coordinate fields in your table to create point objects. Records that already have graphic objects associated with them will be skipped during the Create Points operation.
For example, you have a table showing transmitter tower locations that was created by recording coordinates using a global positioning system. You want to display the locations on a map in MapInfo Professional. The table already has X and Y coordinate information but MapInfo Professional cannot display this information until you create points for that coordinate data that MapInfo Professional can read.
For more information, see the Putting Latitude/Longitude Coordinates on a Map in the Help System. This section also contains these topics:
• Creating Points from an Excel or Lotus Table• Creating Points from a Longitude/Latitude• Creating Points in a Projection
For more about the Degree Converter tool, see the Tools section of the Help System.
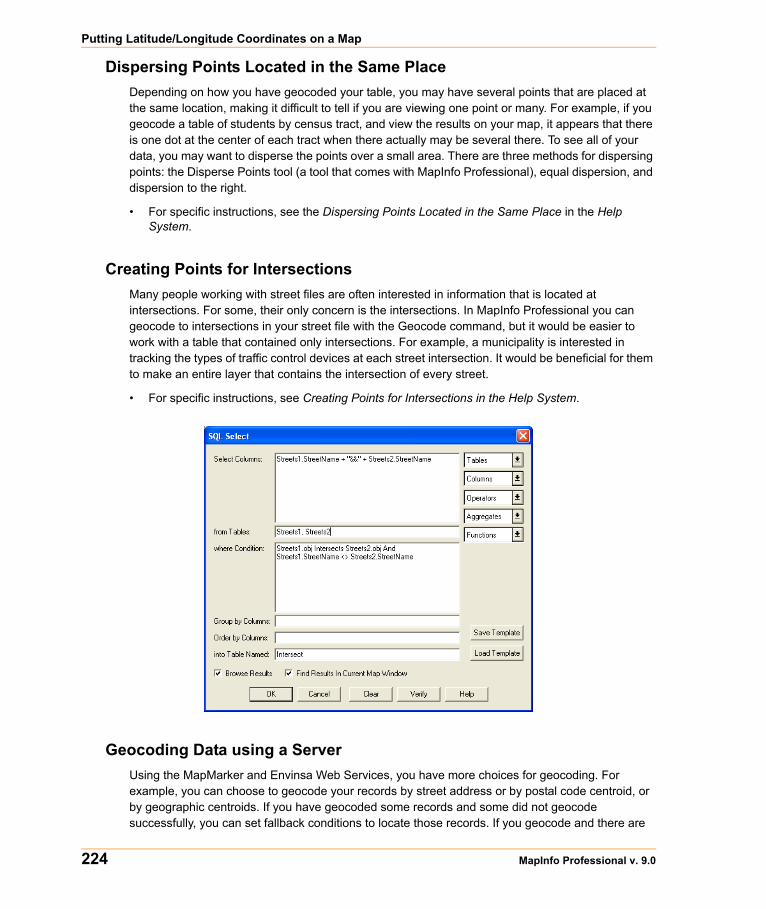
Putting Latitude/Longitude Coordinates on a Map
224 MapInfo Professional v. 9.0
Dispersing Points Located in the Same PlaceDepending on how you have geocoded your table, you may have several points that are placed at the same location, making it difficult to tell if you are viewing one point or many. For example, if you geocode a table of students by census tract, and view the results on your map, it appears that there is one dot at the center of each tract when there actually may be several there. To see all of your data, you may want to disperse the points over a small area. There are three methods for dispersing points: the Disperse Points tool (a tool that comes with MapInfo Professional), equal dispersion, and dispersion to the right.
• For specific instructions, see the Dispersing Points Located in the Same Place in the Help System.
Creating Points for IntersectionsMany people working with street files are often interested in information that is located at intersections. For some, their only concern is the intersections. In MapInfo Professional you can geocode to intersections in your street file with the Geocode command, but it would be easier to work with a table that contained only intersections. For example, a municipality is interested in tracking the types of traffic control devices at each street intersection. It would be beneficial for them to make an entire layer that contains the intersection of every street.
• For specific instructions, see Creating Points for Intersections in the Help System.
Geocoding Data using a ServerUsing the MapMarker and Envinsa Web Services, you have more choices for geocoding. For example, you can choose to geocode your records by street address or by postal code centroid, or by geographic centroids. If you have geocoded some records and some did not geocode successfully, you can set fallback conditions to locate those records. If you geocode and there are
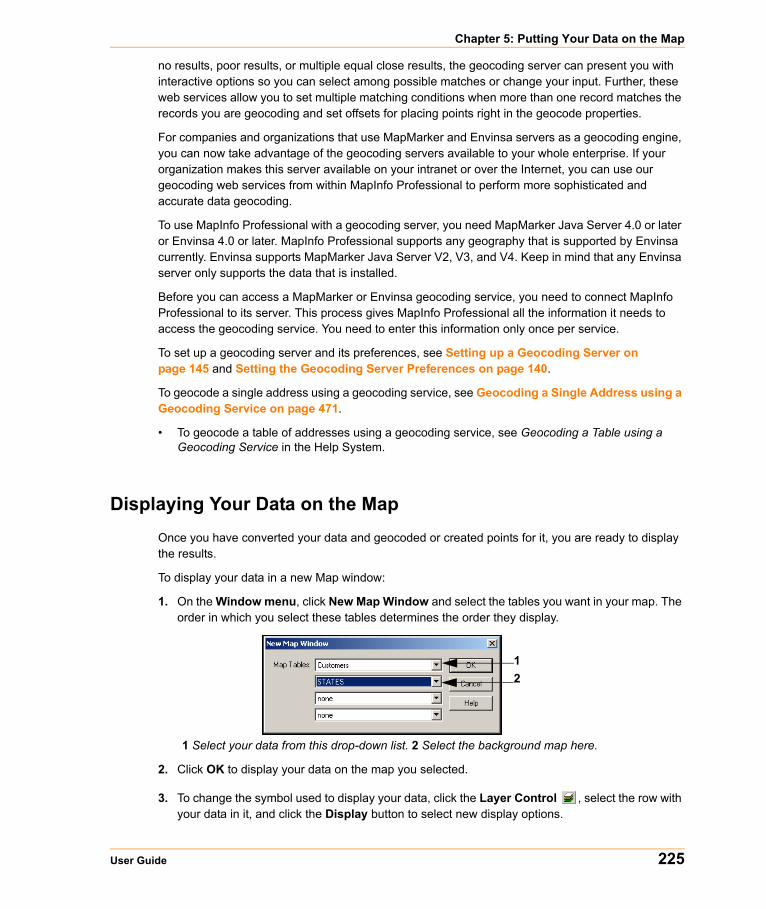
Chapter 5: Putting Your Data on the Map
User Guide 225
no results, poor results, or multiple equal close results, the geocoding server can present you with interactive options so you can select among possible matches or change your input. Further, these web services allow you to set multiple matching conditions when more than one record matches the records you are geocoding and set offsets for placing points right in the geocode properties.
For companies and organizations that use MapMarker and Envinsa servers as a geocoding engine, you can now take advantage of the geocoding servers available to your whole enterprise. If your organization makes this server available on your intranet or over the Internet, you can use our geocoding web services from within MapInfo Professional to perform more sophisticated and accurate data geocoding.
To use MapInfo Professional with a geocoding server, you need MapMarker Java Server 4.0 or later or Envinsa 4.0 or later. MapInfo Professional supports any geography that is supported by Envinsa currently. Envinsa supports MapMarker Java Server V2, V3, and V4. Keep in mind that any Envinsa server only supports the data that is installed.
Before you can access a MapMarker or Envinsa geocoding service, you need to connect MapInfo Professional to its server. This process gives MapInfo Professional all the information it needs to access the geocoding service. You need to enter this information only once per service.
To set up a geocoding server and its preferences, see Setting up a Geocoding Server on page 145 and Setting the Geocoding Server Preferences on page 140.
To geocode a single address using a geocoding service, see Geocoding a Single Address using a Geocoding Service on page 471.
• To geocode a table of addresses using a geocoding service, see Geocoding a Table using a Geocoding Service in the Help System.
Displaying Your Data on the MapOnce you have converted your data and geocoded or created points for it, you are ready to display the results.
To display your data in a new Map window:
1. On the Window menu, click New Map Window and select the tables you want in your map. The order in which you select these tables determines the order they display.
1 Select your data from this drop-down list. 2 Select the background map here.
2. Click OK to display your data on the map you selected.
3. To change the symbol used to display your data, click the Layer Control , select the row with your data in it, and click the Display button to select new display options.
12
Printing Your Results
226 MapInfo Professional v. 9.0
To display your data on an existing Map window:
1. Open the .tab files or .WOR files you want to plot your converted data onto.
2. Open the .tab files or .WOR files you just created and in the Preferred View drop-down box select the Current Mapper option.
3. Click Open.
After Displaying Your Data on the Map
Now that your data is there to see, make it say something to your audience. The whole world of MapInfo Professional functionality is open to you. For details on analyzing your data, see Creating Thematic Maps, Legends, and Other Maps in Chapter 9 on page 399 or see Drawing and Editing Objects in Chapter 7 on page 325 for more about customizing your map.
Finding Data on your MapThe Find Selection in Current Map Window command allows you to search and display a selection in the currently active Map window. You can not search for the selection in other types of windows (Browser or Layout, for example) using this command. You can access this option by pressing the <Ctrl G>.
The Find Selection in All Windows command allows you to locate the selection in all open windows (including a Browser window) that are currently open.
To access Find Selection in Current Map Window:
1. Perform the Query > Find or Query > Find Selection.
2. Choose Query > Find Selection > In Current Map Window.
Note: Choosing the In Current Map Window option shortens the search time.
To access Find Selection in All Windows:
1. Perform the Query > Find or Query > Find Selection.
2. Choose Query > Find Selection > In All Windows.• For more information, see Saving and Closing Query Tables in the Help System.
Printing Your ResultsOnce you have created the perfect map or graph, you can easily print the individual windows. For presentation, use the Layout menu to bring together all views of your mapping session. Here, you can combine different types of windows to create an attractive and more informative presentation. On the Window menu, click New Layout Window to display a Layout window that you can use to arrange your maps, browse tables, graphs, legends, titles, logos, etc. See Working in the Layout Window in Chapter 12 on page 541, for tips and techniques about working in the Layout window.
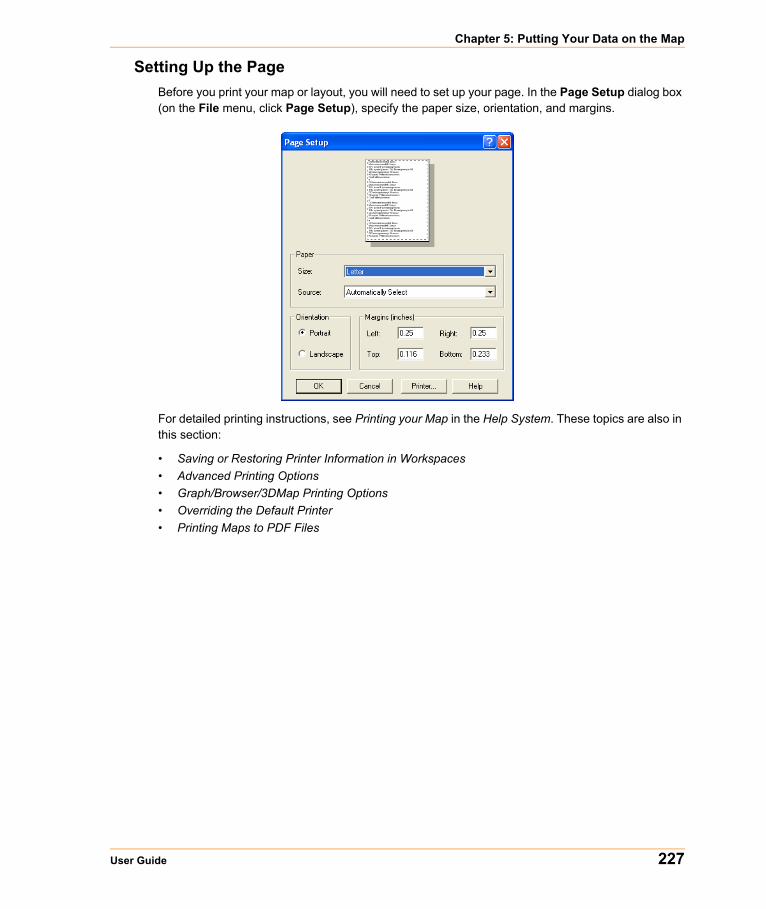
Chapter 5: Putting Your Data on the Map
User Guide 227
Setting Up the PageBefore you print your map or layout, you will need to set up your page. In the Page Setup dialog box (on the File menu, click Page Setup), specify the paper size, orientation, and margins.
For detailed printing instructions, see Printing your Map in the Help System. These topics are also in this section:
• Saving or Restoring Printer Information in Workspaces• Advanced Printing Options• Graph/Browser/3DMap Printing Options• Overriding the Default Printer• Printing Maps to PDF Files
Printing Your Results
228 MapInfo Professional v. 9.0
Printing Your Map When you have your page set up the way you want, you are ready to print.
To print your map:
1. On the File menu, click Print to display the Print dialog box. This dialog box allows you to specify printer properties, a page range for printing, and the number of copies to print.
Note: You can override the default printer setting by selecting another print from the Name drop-down list.
2. If you need to change the size of the map, the orientation of your map or want to specify the scale or a custom width or height, click the Options button. If you are printing a map, the Map Print Options dialog box displays.
Note: If you are printing a graph or a browser or a 3DMap, your options will be different. See Graph/Browser/3DMap Printing Options for more information.
Note: The Map Window Preference setting Use Cartographic Scale affects the entries in this dialog box.
3. Here you can specify the size of the map, how its contents will display, the scale, and its width and height. For details on the other print options, see Graph/Browser/3DMap Printing Options on page 255. When you have completed your selections in this dialog box, click OK to continue.
• Map Size — Select the size of the map you are producing in this group; the options are Window Size, Fit to Page, and Custom. As you make selections, the Custom Scale, Custom Width and Custom Height entries change.
Chapter 5: Putting Your Data on the Map
User Guide 229
• Window Size — Click this button to print the map as it displays on your computer screen.
• Fit to Page — Click this button to fit the current map to the page size you have selected in your preferences.
• Custom — Click this button to enter your own custom scale, width, and height entries in the fields provided. Then, type the appropriate entries in the Custom Scale, Custom Width and Height fields.
• Map Contents — Select an option in this group to determine the map contents you want to print; the options are Same as Window and Centered on Window.
• Same as Window — Click this button to print the map contents as it appears in the Map window, with the same proportions and content as you see.
• Centered on Window — Click this button to center as much of the current map that fits on the page. When you select this option, the image may print on more than one page depending upon fit. In general when you select this option, MapInfo Professional assumes you want to select the Fit to Page radio button and selects this for you.
4. If your map is particularly complex (a large map, 3D, or one with 10 or more colors) there are more options available using the Advanced button. The Advanced Printing Options dialog box displays. (See Advanced Printing Options in the MapInfo Professional User Guide, which is located in the Documentation subfolder of your installation directory). When you have completed your selections, click OK to continue.
5. After you complete your selections, click OK on the Print dialog box to print your results.
Printing your Map to a PDF File
MapInfo redistributes a third-party tool that allows you to print your MapInfo Professional maps to PDF files for sharing and distribution. When you install this utility, you can select it as a printer in your Windows Print menu.
Any customer or co-worker who has Adobe® Reader® can view and print this PDF file. Click here to go to the Adobe Reader download page or retrieve it from the installation CD.
• For more information, see Printing your Map to a PDF File in the Help System.
Viewing and Printing Text Text size is handled differently in maps and layouts. You should keep these differences in mind when printing maps and layouts containing text objects and when fine tuning text.
Text Size in Layouts
In the Layout, the point size of the text is specified relative to the actual size of the page (that is, the size in which it will print), just as it is in word processing and desktop publishing programs. When you zoom in and out on a Layout, the text will be larger or smaller on the screen, but its specified point size (as indicated in its attributes box) remains the same.
The font and size of text objects in the Layout Window may not appear as they do on the printed page. There are several possible reasons for this: fonts available for screen display are not available for your printer, screen character width is different than printer character width, and screen resolution is different than printer resolution.
Printing Your Results
230 MapInfo Professional v. 9.0
To find out the true size of a text object in the Layout Window, use the Select tool and click on the object. The edit handles indicate the object's true size.
Text Size in MapsIn maps, text size is specified relative to the screen. When you zoom in and out on a map, the size of the text on the screen and the specified point size of the text will change. If you zoom in, text will appear larger, as will all visible elements of the map. The point size of the text (as indicated in its attributes box) will be appropriate to the text being displayed on screen.
Troubleshooting Print ProblemsGood first steps in troubleshooting a printing problem are to make sure you have downloaded and installed the latest patch for MapInfo Professional and are using the latest printer driver for your printer/operating system. You can get additional printer advice in the MapInfo Professional Printing Guide, which is located in the Documentation subfolder of your installation directory.
When we discuss printer issues, we make the following assumptions about your print environment:
• The printer/plotter has been installed properly
• The printer/plotter drivers have been installed correctly
• The printer/plotter is connected to the computer or to the network properly
• There is sufficient memory (on the print device and on the computer) to print your files
Any of these issues can affect your ability to print/plot your MapInfo Professional output. Our Technical Support professionals may be able to identify the these difficulties, but they are not within their control.
Note: Whenever we use the terms print or printer we also mean plotter.
When Printing a MapInfo Professional Object From Another ApplicationWhen you embed a MapInfo map or graph in another application (such as Word or PowerPoint), click outside the map/graph before you use the Print or Print Preview commands. This allows the container application to take over previewing or printing properly. This is particularly true if you have just made changes to the map or graph you are printing.
Working with Fill PatternsNote that fill patterns on the first row of the Region Style dialog box are Windows standard and tend to print faster. The other patterns are bitmaps MapInfo has created for your use. You might want to consider this when you are selecting fill patterns. See also Recommendations for Effective Pattern Scaling in the MapInfo Professional Help System for more information regarding scaling and printing fill patterns.
Translucent Raster Maps/Grids and Windows 9X Don’t MixYou cannot print a translucent raster map or grid on Windows 9X platforms or export them to EMF or WMF file formats. You need to use a non-metafile (for example, .BMP or .GIF) format to export raster images on Windows 9X.
Customers printing large images (such as destination page size D, E, or A0) no longer have the 28,000 pixel limitation. If you experienced printer difficulties in the past due to this limitation, you should notice a significant improvement in your printed images.
Chapter 5: Putting Your Data on the Map
User Guide 231
Sometimes the Older Driver is BetterWhen in doubt, if an older driver worked and the new one does not, go back to the older driver.
Make Room for the MetafileMake sure you have plenty of temporary disk space, particularly if you are using the Print using the Enhanced Metafile option. The system is trying to create a layered bitmap locally on disk.
Spool Locally, Print GloballyTry spooling print jobs locally rather than at the plotter. This allows the computer to rasterize your output rather than the printer, which can be more efficient.
• For print spooling instructions, see Troubleshooting Printing Problems in the Help System.
Note: Speeding up the Printer: If your printer has Fast, Normal, Best print quality options, we suggest you select Fast to improve printer speed.

Printing Your Results
232 MapInfo Professional v. 9.0

Understanding Your Data
You cannot work for long in MapInfo Professional® without wanting to add more or enhance your own data in some way. This chapter teaches you how to get the most from your MapInfo tables and how to create reports with your data.
Sections in this Chapter:
Working with MapInfo Tables . . . . . . . . . . . . . . . . . . . . . . . . . . . .234Creating a Report of your Data . . . . . . . . . . . . . . . . . . . . . . . . . . .245
6
Working with MapInfo Tables
234 MapInfo Professional v. 9.0
Working with MapInfo TablesAfter you have brought your data into MapInfo and created .tab files, you can manage them within MapInfo Professional. You can view any database table in MapInfo Professional, once you have converted it to MapInfo format. Additionally you can add or remove fields, change the order, name, type, width, or index of any field. You can also specify or determine the projection of the table from this dialog box. You can also check if the table is mappable (contains map objects). To make these types of changes, see Editing a Table’s Structure on page 242.
Keep in mind that you can only view the structure of a spreadsheet or database file that you convert into MapInfo Professional’s table structure. See Displaying your Data on a Map in Chapter 5 on page 200 for these instructions.
To view the structure of a table:
• On the Table menu, point to Maintenance and click Table Structure. The View/Modify Table Structure dialog box displays.
• For more information, see Accessing StreetPro Data in the Help System.
Adding to a TableOne important operation in maintaining tables is the ability to update the data contained in the table. MapInfo Professional’s Update Column feature allows you to:
• Add a temporary column or update an existing column with data from another table
• Update a table
• Place graphic information into visible columns
Updating Information in a Subset of a Table
Use Update Column to update information in a subset of a table. For example, you could marquee the southeast of the United States, then use Update Column to set the "sales rep" field to the name of your sales representative for the Selection table.
You can update all the rows in a table or a selection of rows. To update a selection of rows you need to select the rows using Select, SQL Select, the Select tool, the Boundary Select tool, or the Radius Select tool, and then update the selection.
Adding a Temporary Column using Update Column
If you need to bring data from one table into another, you can use the Update Column command in MapInfo Professional. In fact to bring this data into the table, you can either add a temporary column or you can update an existing column. In both cases, use the Table menu to click Update Column to bring over the information.
You have tremendous flexibility with how information is imported and what information is transferred. You can perform aggregate functions to transfer averages, minima, maxima, sums, weighted averages, and proportional sums. You can also create expressions to derive additional information from the data.
Chapter 6: Understanding Your Data
User Guide 235
• For specific instructions and an example, see Adding a Temporary Column using Update Column in the Help System.
1 Select this table to update from this list. 2 Select this column to update from this list or select Add new temporary column.3 Select the table that contains the update values in this list.
Geographic and Descriptive Joins
A join allows you to join two tables. To do this, MapInfo Professional must know how to associate records in the two tables.
For example, assume you are shading STATES by the values in SALES. Obviously, you want all Pennsylvania sales to be associated with Pennsylvania, all Maryland sales to be associated with Maryland, etc. MapInfo Professional has two ways of doing this:
1. From a common descriptive field.
2. Geographically/graphically.
In this case, the most likely descriptive field contains the state name or an abbreviation for the state name. Thus the STATES table might have a field called Abbr, containing the abbreviation of the state name, and SALES might have a field called State, that contains the state abbreviation. MapInfo Professional matches the entries in these two fields so that information in the SALES State field is matched to the record having the same entry in the Abbr field of STATE, thus matching NY (sales) to NY (state), PA (sales) to PA (state), etc.
However, if both tables contain graphic information, MapInfo Professional can also make a graphic match.
For example, if you are a conservation official and you want to shade a map of COUNTIES according to the number of FIRES that occurred in the last year. Your FIRES database has been geocoded. In this case MapInfo Professional could examine the coordinates of each fire location and determine the county where the fire had occurred. That would allow MapInfo Professional to associate each fire record with the appropriate county.
• For more information, see Specifying a Join Based on Descriptive Criteria and Specifying a Join Based on Geographic Criteria in the Help System.
Updating a TableFor a quick visual way to update your table, select the objects in the Map window and use Update Column to update the table with the new value. This would be useful when you want to update a number of objects with the same value.
To include the District column in the STATES table:
1. Create the District column (on the Table menu, point to Maintenance and click Table Structure) in the States table.
2. Add a field for Districts.
3. Redisplay the STATES table in a Map window.
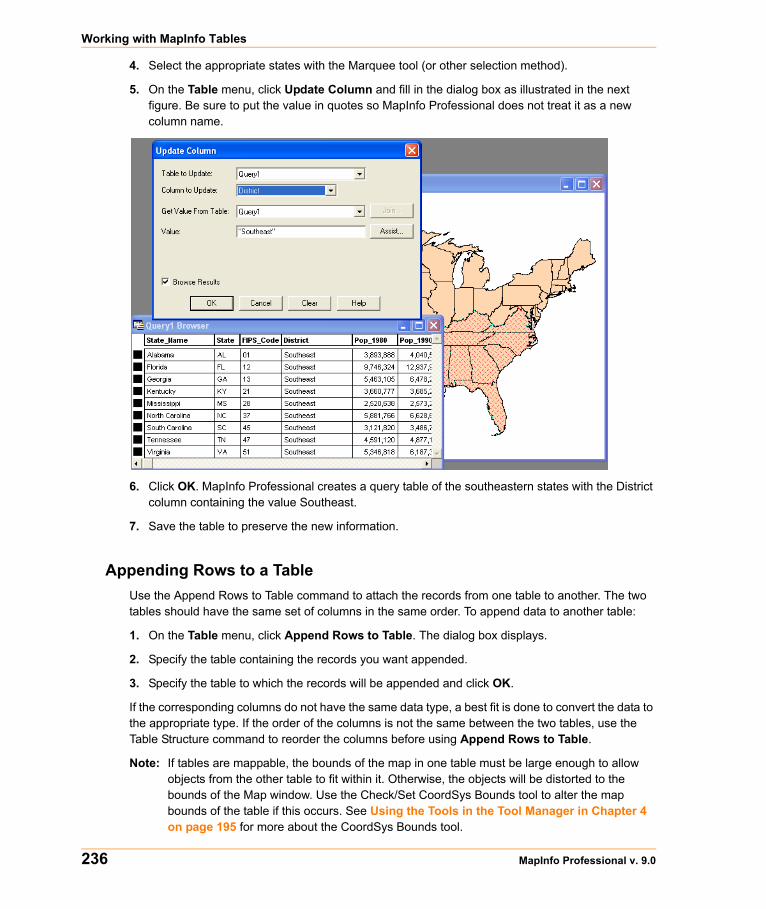
Working with MapInfo Tables
236 MapInfo Professional v. 9.0
4. Select the appropriate states with the Marquee tool (or other selection method).
5. On the Table menu, click Update Column and fill in the dialog box as illustrated in the next figure. Be sure to put the value in quotes so MapInfo Professional does not treat it as a new column name.
6. Click OK. MapInfo Professional creates a query table of the southeastern states with the District column containing the value Southeast.
7. Save the table to preserve the new information.
Appending Rows to a TableUse the Append Rows to Table command to attach the records from one table to another. The two tables should have the same set of columns in the same order. To append data to another table:
1. On the Table menu, click Append Rows to Table. The dialog box displays.
2. Specify the table containing the records you want appended.
3. Specify the table to which the records will be appended and click OK.
If the corresponding columns do not have the same data type, a best fit is done to convert the data to the appropriate type. If the order of the columns is not the same between the two tables, use the Table Structure command to reorder the columns before using Append Rows to Table.
Note: If tables are mappable, the bounds of the map in one table must be large enough to allow objects from the other table to fit within it. Otherwise, the objects will be distorted to the bounds of the Map window. Use the Check/Set CoordSys Bounds tool to alter the map bounds of the table if this occurs. See Using the Tools in the Tool Manager in Chapter 4 on page 195 for more about the CoordSys Bounds tool.
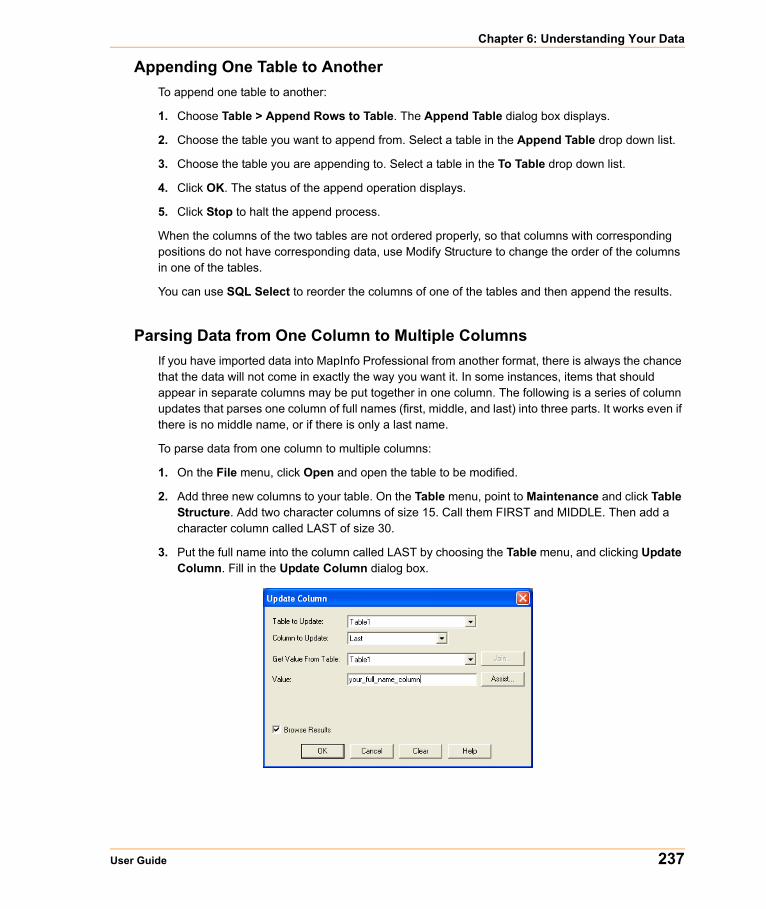
Chapter 6: Understanding Your Data
User Guide 237
Appending One Table to AnotherTo append one table to another:
1. Choose Table > Append Rows to Table. The Append Table dialog box displays.
2. Choose the table you want to append from. Select a table in the Append Table drop down list.
3. Choose the table you are appending to. Select a table in the To Table drop down list.
4. Click OK. The status of the append operation displays.
5. Click Stop to halt the append process.
When the columns of the two tables are not ordered properly, so that columns with corresponding positions do not have corresponding data, use Modify Structure to change the order of the columns in one of the tables.
You can use SQL Select to reorder the columns of one of the tables and then append the results.
Parsing Data from One Column to Multiple ColumnsIf you have imported data into MapInfo Professional from another format, there is always the chance that the data will not come in exactly the way you want it. In some instances, items that should appear in separate columns may be put together in one column. The following is a series of column updates that parses one column of full names (first, middle, and last) into three parts. It works even if there is no middle name, or if there is only a last name.
To parse data from one column to multiple columns:
1. On the File menu, click Open and open the table to be modified.
2. Add three new columns to your table. On the Table menu, point to Maintenance and click Table Structure. Add two character columns of size 15. Call them FIRST and MIDDLE. Then add a character column called LAST of size 30.
3. Put the full name into the column called LAST by choosing the Table menu, and clicking Update Column. Fill in the Update Column dialog box.
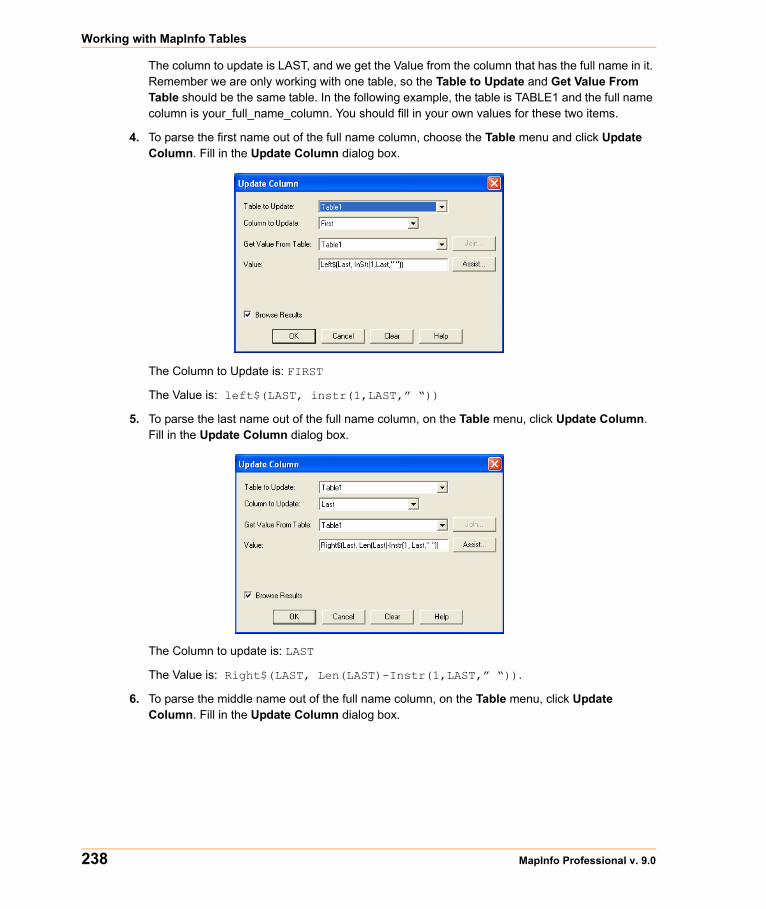
Working with MapInfo Tables
238 MapInfo Professional v. 9.0
The column to update is LAST, and we get the Value from the column that has the full name in it. Remember we are only working with one table, so the Table to Update and Get Value From Table should be the same table. In the following example, the table is TABLE1 and the full name column is your_full_name_column. You should fill in your own values for these two items.
4. To parse the first name out of the full name column, choose the Table menu and click Update Column. Fill in the Update Column dialog box.
The Column to Update is: FIRST
The Value is: left$(LAST, instr(1,LAST,” “))
5. To parse the last name out of the full name column, on the Table menu, click Update Column. Fill in the Update Column dialog box.
The Column to update is: LAST
The Value is: Right$(LAST, Len(LAST)-Instr(1,LAST,” “)).
6. To parse the middle name out of the full name column, on the Table menu, click Update Column. Fill in the Update Column dialog box.

Chapter 6: Understanding Your Data
User Guide 239
Update the MIDDLE column with the Value: Left$(LAST, Instr(1,LAST,” “))
7. Then update the LAST column again by returning to the Table menu, clicking Update Column, and filling in the dialog box.
The Value is: Right$(LAST, Len(LAST)-Instr(1,LAST,” “))
8. Click OK to update the column.
Placing Graphic Information in Visible ColumnsUpdate Column is also useful to put graphic information into columns so that it is visible. Tables that contain map objects store the graphic information about these objects invisibly. Using Update Column, you can bring some of that information into a column so it can be viewed in a Browser. Update Column with CentroidX(Obj), CentroidY(Obj) uses the Session Projection Preferences (if set), otherwise it defaults to Longitude/Latitude. For example, you want to display the longitude and latitude coordinates of a table of radio station point locations in a Browser. In this example, you are only working with one table, RADIOLOC, but you still use Update Column as in the Add Temporary Column example.
• For more information, see Placing Geographic Information in Visible Columns in the Help System.
Working with MapInfo Tables
240 MapInfo Professional v. 9.0
Mouse Wheel Support for Browser Window
When you are working in the Browser window, you can use the mouse wheel to scroll through the records. Roll the mouse button down to scroll down the list, and roll the mouse button up to scroll up the list. You can still use the Tab key to scroll right and the <Shift Tab> keys to scroll left in the Browser window.
Adding a Row to a Table
You can add a temporary row to an editable MapInfo table.
To add a row:
1. On the Window menu, click New Browser window.
2. Choose an editable table from the drop-down list.
3. Click OK to display the table in a Browser window.
4. On the Edit menu, click New Row to add a row to the bottom of the table.
5. Type the new data into each appropriate column of the new row.
6. When you are finished adding rows, on the File menu, click Save Table to save the new data. The Save Table dialog box displays.
7. Click Save to save the new row(s).
Creating a New Table You can bring in data tables from several outside sources: dBASE, Excel, Access, Lotus 1–2–3, shapefiles, Grid, comma delimited, and delimited ASCII. You can also create your own database directly in MapInfo Professional. These databases can be opened and displayed as maps (providing they contain graphic objects), Browsers, or graphs.
To create a table in MapInfo Professional:
1. On the File menu, click New Table. The New Table dialog box displays.
2. Choose one or more from the following:
• Open New Browser — Click this check box to display the new buffer in a new Browser window only.
• Open New Mapper — Click this check box to display the new buffer in a new Map window.
• Add to Current Mapper — Click this check box to display the new buffer in the current Map window.
3. Do one of the following and click OK:
• To create a new table and new table structure, click Create New.
• To create a new table based on the structure of an existing table, click Using Table and select from the list of open tables.
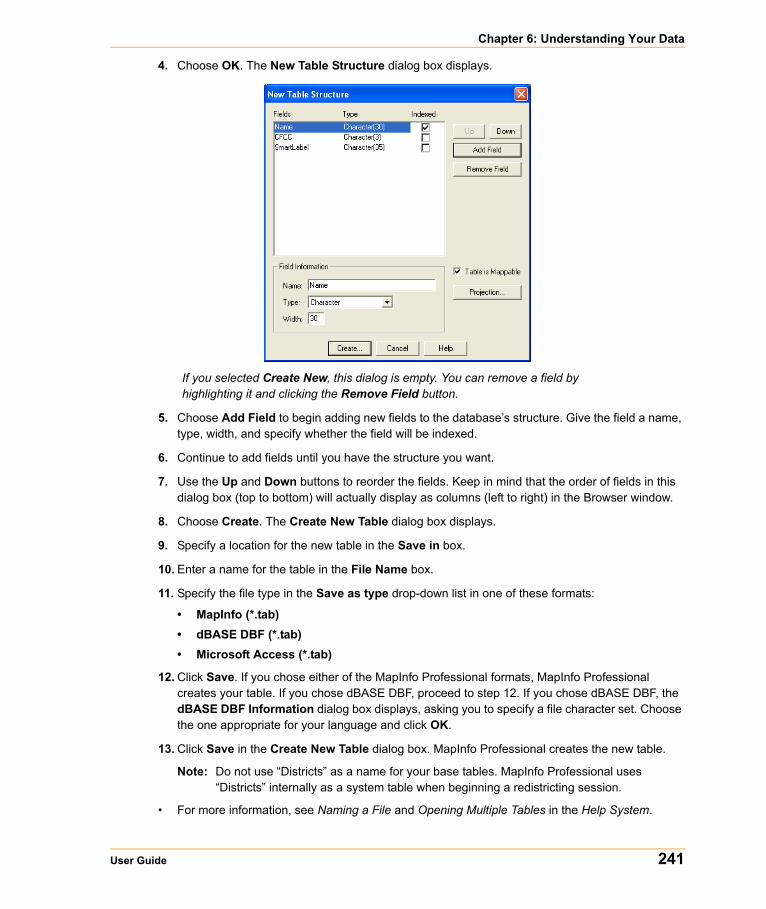
Chapter 6: Understanding Your Data
User Guide 241
4. Choose OK. The New Table Structure dialog box displays.
If you selected Create New, this dialog is empty. You can remove a field by highlighting it and clicking the Remove Field button.
5. Choose Add Field to begin adding new fields to the database’s structure. Give the field a name, type, width, and specify whether the field will be indexed.
6. Continue to add fields until you have the structure you want.
7. Use the Up and Down buttons to reorder the fields. Keep in mind that the order of fields in this dialog box (top to bottom) will actually display as columns (left to right) in the Browser window.
8. Choose Create. The Create New Table dialog box displays.
9. Specify a location for the new table in the Save in box.
10. Enter a name for the table in the File Name box.
11. Specify the file type in the Save as type drop-down list in one of these formats:
• MapInfo (*.tab)• dBASE DBF (*.tab)• Microsoft Access (*.tab)
12. Click Save. If you chose either of the MapInfo Professional formats, MapInfo Professional creates your table. If you chose dBASE DBF, proceed to step 12. If you chose dBASE DBF, the dBASE DBF Information dialog box displays, asking you to specify a file character set. Choose the one appropriate for your language and click OK.
13. Click Save in the Create New Table dialog box. MapInfo Professional creates the new table.
Note: Do not use “Districts” as a name for your base tables. MapInfo Professional uses “Districts” internally as a system table when beginning a redistricting session.
• For more information, see Naming a File and Opening Multiple Tables in the Help System.
Working with MapInfo Tables
242 MapInfo Professional v. 9.0
Creating a New Table by Combining Objects Using Column
If you want to make a new map of the U.S. based on areas such as Midwest, Pacific Coast, Northeast, etc., you could combine all of the state data and create new objects where some common data value is the key to which the new map object states will belong.
To do this, you could draw a rectangle somewhere on the States map. Select some states around the rectangle and specify them as the target. Select the rectangle and do a split operation. The new objects will be created and each split object will have its same state initials. Then, use Combine Objects Using Column and specify the state initials fields as the grouping value. The states will be re-created.
The Combine Objects Using Column feature gives you the option of creating a new table for the newly combined objects:
1. Choose Table > Combine Objects using Column to display the Combine Objects using Column dialog box.
2. Choose the objects from the table you want to combine.
3. Choose the column you want the objects to be grouped by.
4. Choose New In the Store results in table drop-down list.
5. Press the Next button to display the New Table dialog box.
6. Press the Create button to display the New/Modify Table Structure dialog box.
7. Press the Create button to display the Create New Table dialog box.
8. Press Save and a new table is created.
Editing a Table’s Structure You can make changes to the structure of your table directly in MapInfo Professional. You can add or remove fields, change the order, name, type, width, or index of any field. You can also specify or determine the projection of the table from this dialog box. You can also check if the table is mappable (contains map objects).
The Table is Mappable option in the Modify Table Structure dialog box allows you to modify a table so you can map it or, when left cleared, it will ungeocode your table.
To change the structure of the table:
1. Choose Table > Maintenance > Table Structure. The View/Modify Table Structure dialog box displays.
2. Click the View/Modify Table drop-down list, a list of available tables displays.
3. Choose the table you want to modify.
4. Click OK.
Chapter 6: Understanding Your Data
User Guide 243
The Modify Table Structure dialog box displays for editable tables and allows you to change the structure of a table. The View Table Structure dialog box displays for read-only tables and is only for viewing the table's structure.
Note: Keep in mind that you can only view the structure of a file that you bring into MapInfo Professional.
Copying and Renaming a TableBecause a MapInfo Professional table consists of two or more component files (STATES.tab, STATES.DAT, STATES.MAP, etc.), all of these files for a particular table must be in the same directory. If you move any of the component files to a different directory, you must move all of them. When you want to back up a table to diskette, you must back up all of the component files.
Because each table has at least two files associated with it, you cannot change one file name without changing all the other associated file names. Otherwise, MapInfo Professional would not know where to find all the files that constitute the table.
• For more specific instructions, see Copying and Renaming a Table in the Help System.
Deleting a TableDeleting a table allows you to remove the .tab file and all component files associated with the table.
To delete a table:
1. On the Table menu, point to Maintenance and click Delete Table.
2. Choose the table to delete and click OK. A message displays to inform you that the table will be permanently deleted and the operation cannot be undone.
3. Click OK and MapInfo Professional deletes the table.
Deleting a raster table only deletes the *.tab file. Deleting a grid file removes both the *.tab and grid file.
Packing a Table Packing a table allows you to compress tables to take up less disk space. You can choose to pack only tabular data or graphic objects or both. Packing tabular data removes deleted records. When you pack a table, MapInfo Professional requires that you have twice as much free space as the table takes up to handle a copy of the database as a scratch file.
To pack a table:
1. On the Table menu, point to Maintenance and click Pack Table. The Pack Table dialog box displays.
2. Choose a table from the Pack Table drop-down list.
3. Click the appropriate radio button to specify the type(s) of data.
Working with MapInfo Tables
244 MapInfo Professional v. 9.0
4. Click OK.
Note: Packing a table can corrupt customized labels saved to a workspace. If you are going to be working with customized labels, pack the table before you create the labels.
Collecting Data into the Table using Update ColumnMapInfo Professional provides a number of powerful aggregating functions that allow you to derive new information. These features are available in Update Column when you specify two tables in the Update Column dialog box. The aggregate expressions include Average, Count, Minimum, Maximum, Sum, Weighted Average, Proportion Sum, Proportion Average, and Proportion Weighted Average. Each is defined in the next table.
Note that average, count, min, max, sum, and weighted average operate on data values only. The proportion functions take geographic relationships into account.
Note: To find instructions for using the Update Column feature, see Adding a Temporary Column using Update Column on page 234.
• For more examples, see Collecting Data into the Table using Update Column in the Help System.
Aggregate Expressions Description
Average Calculates the average of the values for all records in a group.
Count Counts the number of records in a group.
Minimum Finds the lowest value for all records in a group.
Maximum Finds the highest value for all records in a group.
Sum Calculates the sum of the values for all records in a group.
Weighted Average Gives more weight to one value over another when averaging.
Proportion Sum A sum calculation that is adjusted based on how much of one object is within another object.
Proportion Average An average calculation that is adjusted based on how much of one object is within another object.
Proportion Weighted Average
A weighted average calculation that is adjusted based on how much of one object is within another object.
Chapter 6: Understanding Your Data
User Guide 245
Browsing a TableThere are times when viewing the tabular data in a table is necessary. In MapInfo Professional, this is called browsing the table.
To browse a table:
1. On the Window menu, click New Browser Window.
2. Choose the table you wish to browse and click OK.
The Browser shows the fields of the data table (column headings) and the records of data (rows).
A Browse menu item gives you further functionality. On the Browse menu, click Pick Fields to display only the columns of data you want to see. If you wish to show information that is only implicit in the base table, in the Pick Fields dialog box choose Expression from the Fields in Table list. For more on expressions see Deriving Columns in Chapter 9 on page 327, or Creating Query Expressions in Chapter 9 on page 315.
To show or hide the Browser window grid, on the Browse menu, click Options.
To add new records to the Browser:
1. On the Edit menu, click New Row to add a row (or use Ctrl-E).
2. Enter text directly into each field. As you type, press Tab or Shift-Tab to move from field to field.
3. You must remember to save the new information to the base table before exiting the program.
The square box to the left of each record in the Browser window is the select box. Click it to select the record in the Browser window. If the Map window for the table is open, the record is selected as well. To add records to the selection, Shift and drag to select consecutive records, or Shift-Click non-consecutive records.
Selecting records creates a subset of the table that you can browse, map, or graph, just like the full table. More on selecting is found later in Chapter 9: Selecting and Querying Data. You can also create a report of your tabular data using the Crystal Reports functionality included with MapInfo Professional. The Crystal Reports User Guide, which is located in the Documentation subfolder of your installation directory to help you get the most out of this powerful report writing program.
Creating a Report of your Data MapInfo Professional includes the full report-writing functionality of Crystal Reports. Crystal Reports enables you to create reports of your tabular data. The Crystal Reports User Guide is included online so that you can get the most from this program.
To create a report and print it:
1. On the Tools menu, point to Crystal Reports and click New Report. The New Report dialog box displays. It lists all the open tables.
2. Click the table you want to create a report for, and click Report. The Crystal Reports user interface displays.
Creating a Report of your Data
246 MapInfo Professional v. 9.0
3. In Crystal Reports, Choose Report > Report Expert to display the Create Report Expert dialog box. The Report Expert walks you through the selection of data, fields, fields to sort by, fields to total, and styles for your report. Click Preview Sample to see a sample of your report on the screen.
4. On the File menu, click Print to print your report.
Note: Tables with columns containing underscores, temporary column, do not display in the default Crystal Report. Use the Expert Wizard to access columns containing these elements.
Opening an Existing Report To open an existing report:
1. Choose Tools > Open Report. The Choose Crystal Report dialog box displays.
2. Select the report from the dialog box.
Saving a Report When you save a report, an .rpt extension is assigned to the report. The report is assigned the default name: (tablename) report.rpt. You may rename the report using the Crystal Reports Save As feature.
All .rpt files are saved in the directory specified in Options> Preferences > Directories > Crystal Report files.
Accessing Remote Data
When your data is remote, whether it is a remote Excel file or an Oracle table, the issue of retrieving it gets more complex. This chapter addresses the special circumstances that surround remote data access for use with MapInfo Professional®.
Sections in this Chapter:
Understanding Remote Tables and Databases . . . . . . . . . . . . . .248Accessing Data in Remote Spatial Databases. . . . . . . . . . . . . . .251
• For information in using Oracle Workspaces, see Using Oracle Workspace Tables in MapInfo Professional in the Help System.
7

Understanding Remote Tables and Databases
248 MapInfo Professional v. 9.0
Understanding Remote Tables and DatabasesNot all of the data you may need to work with is local. Sometimes you need to graph or display spatially data that is on several different computers in different locations. And this data can be in different formats and configurations. What MapInfo Professional has to do is synchronize all of that data to ensure that it displays properly on a map.
To access data that is located on a remote Oracle or other SQL Server based DBMS systems, your system requires:
• A database management system such as Oracle, MS Access, Informix, etc.
• Network support required by your DBMS (Oracle-SQL*NET; MS Access-none required)
If these resources are not in place, you will not be able to access the remote data from MapInfo Professional. If you try to connect to this data, warning messages display to explain that you do not have the required DLLs.
Supported Databases and VersionsMapInfo Professional supports the following spatial database servers:
• SQL Server 2000/2005• Informix 9.x
• Solaris 32-bit
• HPUX• Oracle Spatial 10G, 9iR2, 9iR1
Further, using ODBC drivers, you can access your data from MapInfo Professional using:
• Oracle ODBC Driver 9x
• SQL Server 2000/2005*
• Informix 3.x
To make your database work more productive, MapInfo Professional provides an interface for opening remote tables in EasyLoader. This utility gives you the ability to save tables to a remote database using Save Copy As and to create new tables on remote databases. Additionally it gives you the means to create a new table from existing tables. EasyLoader is available on the MapInfo web site. You can also open tables of data from the following databases and make them mappable but only for point data:
• Oracle 9iR2• Oracle 10G• MS Access XP• MS SQL Server 2000/2005*• Informix 9.4
Chapter 7: Accessing Remote Data
User Guide 249
About Linked and Live DBMS Tables A linked table is a MapInfo Professional table that is downloaded from a remote database and retains links to its remote database table. The remote database table is known as a DBMS table. When MapInfo Professional downloads a table, it copies the entire contents of the table to the local machine. Any changes you make to the copy can be committed to the server table at any time. We often recommend that you use linked tables rather than live tables to improve performance.
Note: If you are linking to a large table, it will significantly slow down the performance of your system.
You can perform most operations on a linked table that you do for a regular MapInfo Professional table. For instance, you can view, edit, copy, and save a linked table just as you could a regular MapInfo Professional table. However, there are some things you can’t do to a linked table. For instance, you can’t pack a linked table. You can’t modify the table structure of a linked.
You can download tables from a relational database management system such as Oracle, Informix, or Access. These downloaded tables can be used stand-alone or remain linked to the original server database. You can refresh these linked tables to rerun queries on a regular basis using the refresh button or menu button. After editing in MapInfo Professional, the data in a linked table is saved to the relational database management system in a manner that resolves any multi-editing conflicts.
A linked table may use one style for all objects within a table, or contain different styles for each row, called per row styles. There are two requirements for setting up per row styles:
• A row must exist in the DBMS table• You must set up a map catalog entry to activate the row style.
Note: Setting up a per row styles is optional.
DBMS Drivers
Before you can access an SQL database, you must have the appropriate DBMS driver for the type of database, and set up a DBMS data source for the data. The DBMS drivers were installed during MapInfo Professional installation, or afterwards, using the DBMS Administrator in your Windows Control Panel. You can install additional DBMS drivers at anytime using the DBMS Administrator. A DBMS driver is a dynamic–link library (.DLL) file that MapInfo Professional uses to connect to an SQL database. Each type of SQL database requires a different DBMS driver.
Linked Tables and Metadata
MapInfo Professional stores information about a linked table in the TAB file’s metadata, which is not displayed on the map. MapInfo Professional uses metadata to manage transactions between MapInfo Professional and the server database. Two of the most important kinds of information stored in the metadata include the connection string and the query you build from the DBMS Table Wizard, or Expert dialog box.
• For more information, see Resolving Editing Conflicts when Saving a Linked Table in the Help System.
Understanding Remote Tables and Databases
250 MapInfo Professional v. 9.0
About Live Access Tables
You can access remote data as a live access table using MapInfo Professional. It is called a live access because there is no local copy of the data, that is, all operations against the data go directly to the server. This differs from linked tables, which download a snapshot from the remote database into a native MapInfo Professional table.
You can perform most operations on a live access table that you do for a regular MapInfo Professional table. For example, you can view, edit, copy, and save a live access layer just as you can a regular MapInfo Professional table. However, you cannot pack or modify a live access table’s structure.
You can create live access tables with or without a cache. The cache is a memory cache, which contains only the rows that are in the map display for that window. This optimizes certain operations such as ToolTips, labeling, etc. on the map. The cache is automatically updated when the view of the map changes, (for example, zooming or panning).
When the live access table is creating a new Map window, the initial view is determined by the entry in the MapInfo_MapCatalog table. The columns DB_X_LL_DB_X_UR_DB_Y_UR describe a rectangular area that is the initial map display. If the live access table is being added as a layer to an existing Map window, the layer will be fit to that Map window.
MapInfo Professional stores information about a live access table in a TAB file. This information is known as metadata. MapInfo Professional uses metadata to store information about the live access table that is needed to manage transactions between MapInfo Professional and the server database. Two of the most important kinds of information stored in the metadata include the connection string and the query you build from the DBMS Table Wizard, or Expert dialog box.
Limitations in Creating a Live Table
This is a list of known problems/issues with live access:
• Every table must have a single unique key column.
• FastEdit is not supported.
• With MS Access if the key is character, it will not display rows where the key value is less than the full column width for example, if the key is char(5) the value ‘aaaa’ will look like a deleted row.
• Changes made by another user are not visible until the data is refreshed from the server. In addition, if cache is on another user’s updates may not appear until the cache is invalidated by a pan or zooming out.
• There will be a problem if a client-side join (through the SQL Select menu item or MapBasic) is performed against two or more SpatialWare tables that are stored in different coordinate systems. This is inefficient (it is better to do the join in the SQL statement that defines the table).
Limitations of Live Access to Remote DBMS Tables
Using live access tables to determine the number of rows is not appropriate for all tables. It works best on large tables, where the number of rows remains stable; that is, new insertions or deletions in the table do not occur on a regular basis.
Chapter 7: Accessing Remote Data
User Guide 251
If the total number of rows stored in the MapCatalog is out of sync with the actual number of rows in the table, problems occur. The map will always include all of the map objects, but other things may not work correctly. For example:
• The row count displayed in the Browser will be incorrect.
• The MapBasic statement to fetch last will not return the correct row.
Thematic maps, particularly ranged thematic maps, may be wrong.
• For more information, see Improving Live Access Performance in the Help System.
Accessing Data in Remote Spatial Databases To use your RDBMS tables with MapInfo Professional most effectively, you need to set them up so that you can store coordinates or more complex spatial data and then retrieve them. This will also allow you to geocode your remote table and assign coordinates to each record in the table.
There are four prerequisites for storing and retrieving spatial objects in a DBMS table:
• Coordinate values for the objects must be stored in columns of the remote table as numbers, or as a spatial column if the database supports it, such as SpatialWare, or Oracle Spatial. See Storing Coordinate Values in a Remote Table for these instructions.
• A spatial index column may be included to increase performance on queries against the coordinates. See Creating a Spatial Index Column for these instructions.
• You must create a special table on the DBMS system known as the MapInfo_MapCatalog. (MapInfo Professional creates this automatically when you use the EasyLoader.) You create only one catalog per database. See Creating a MapInfo_MapCatalog for these instructions.
• You must supply information about mappable tables to the MapInfo MapCatalog using the Make Table Mappable command. (This is for tables the EasyLoader does not upload.) See Making a Remote Table Mappable for these instructions.
Storing Coordinate Values in a Remote TableThe coordinate values for the spatial data must be stored in columns of the remote table. This is a data creation task and can be done at any time. Possible methods for adding the spatial columns include:
• There may already be existing coordinate data.• Use the EasyLoader application to upload a MapInfo Professional table to a database
supported by MapInfo Professional.
• Make a remote table mappable in order to geocode. See Making a Remote Table Mappable in this chapter.
• Add coordinate values to a MapInfo Professional table, export it to a text file, and import it to your database.
For more information on how to use the EasyLoader tool, please view the Tools section of the Help System.
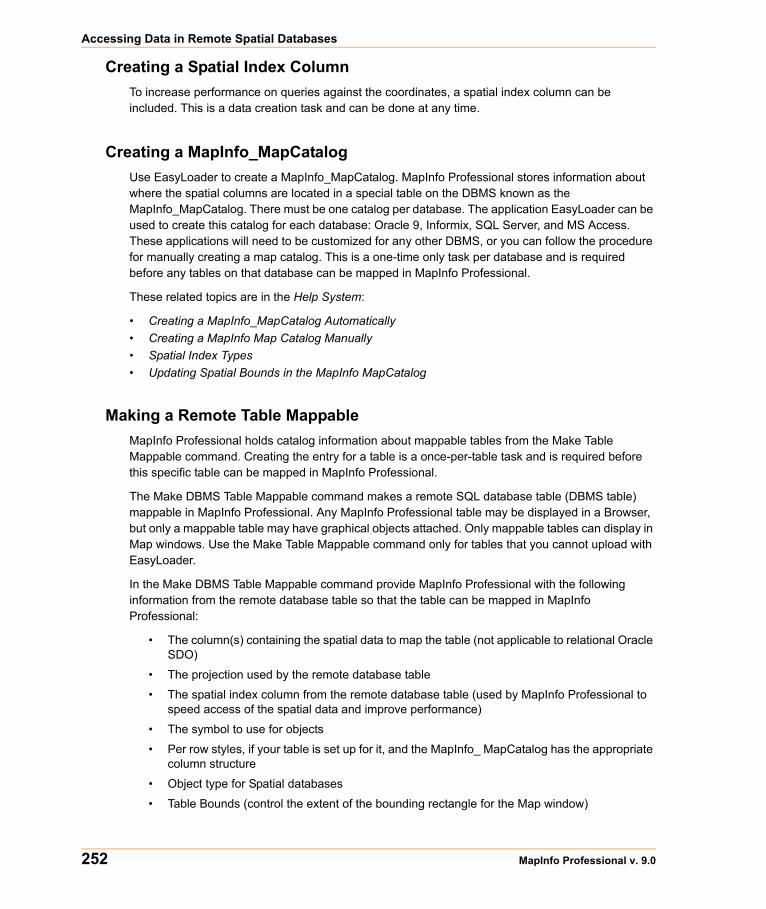
Accessing Data in Remote Spatial Databases
252 MapInfo Professional v. 9.0
Creating a Spatial Index ColumnTo increase performance on queries against the coordinates, a spatial index column can be included. This is a data creation task and can be done at any time.
Creating a MapInfo_MapCatalogUse EasyLoader to create a MapInfo_MapCatalog. MapInfo Professional stores information about where the spatial columns are located in a special table on the DBMS known as the MapInfo_MapCatalog. There must be one catalog per database. The application EasyLoader can be used to create this catalog for each database: Oracle 9, Informix, SQL Server, and MS Access. These applications will need to be customized for any other DBMS, or you can follow the procedure for manually creating a map catalog. This is a one-time only task per database and is required before any tables on that database can be mapped in MapInfo Professional.
These related topics are in the Help System:
• Creating a MapInfo_MapCatalog Automatically • Creating a MapInfo Map Catalog Manually• Spatial Index Types• Updating Spatial Bounds in the MapInfo MapCatalog
Making a Remote Table MappableMapInfo Professional holds catalog information about mappable tables from the Make Table Mappable command. Creating the entry for a table is a once-per-table task and is required before this specific table can be mapped in MapInfo Professional.
The Make DBMS Table Mappable command makes a remote SQL database table (DBMS table) mappable in MapInfo Professional. Any MapInfo Professional table may be displayed in a Browser, but only a mappable table may have graphical objects attached. Only mappable tables can display in Map windows. Use the Make Table Mappable command only for tables that you cannot upload with EasyLoader.
In the Make DBMS Table Mappable command provide MapInfo Professional with the following information from the remote database table so that the table can be mapped in MapInfo Professional:
• The column(s) containing the spatial data to map the table (not applicable to relational Oracle SDO)
• The projection used by the remote database table
• The spatial index column from the remote database table (used by MapInfo Professional to speed access of the spatial data and improve performance)
• The symbol to use for objects
• Per row styles, if your table is set up for it, and the MapInfo_ MapCatalog has the appropriate column structure
• Object type for Spatial databases
• Table Bounds (control the extent of the bounding rectangle for the Map window)

Chapter 7: Accessing Remote Data
User Guide 253
MapInfo Professional takes this information and stores it in a table called the MapInfo_MapCatalog. Every time you use a DBMS table MapInfo Professional checks the catalog to see if the table is mappable. As a result, you only have to make a DBMS table mappable once. It will always remain mappable. However, one spatial index column entry per table is allowed in the Map Catalog. Therefore, only one spatial column can be mappable at a time. If the table has more than one spatial column and you want to map another spatial column, you must drop the spatial column currently in the Map Catalog and make the table mappable using the new column.
Once you have the prerequisites in place you are ready to connect to your datasources and the database tables you want to work with. If you are not familiar with the details of your remote database type, discuss your needs with your database administrator to find out the basic information required to connect to your database.
• For more information, see Making a DBMS Table Mappable and Changing the Symbol Style in a Mappable DBMS Table in the Help System.
The Help System contains these additional related topics:
• Understanding Per Row Object Styles• Making a DBMS Table Mappable for Geocoding• Changing the Symbol Style in a Mappable DBMS Table
Opening a Connection to an ODBC Data Source A data source is the location of a specific database. For example, CUSTOMERS could be the name of the data source that provides access to one or more Oracle tables located in a specific directory on a specific network drive. Once connected to the CUSTOMERS data source, you could download information from any of the Oracle tables into a MapInfo Professional linked table or use the information directly by opening the table as live access. You could have several data sources, each providing access to different databases in different locations.
Open Database Connectivity is a standard for accessing disparate database systems. It is the oil that moves the wheels of inter-database communication. MapInfo is committed to making this important interface work for your organization.
Before you can download a DBMS table, you must connect to the specific data source where the data to be downloaded resides.
To connect to a new data source through ODBC:
1. Choose File > Open DBMS Connection. One of the following happens:
• If you installed the Oracle Spatial (OCI) and ODBC support, this dialog displays. Choose whether to create an ODBC or Oracle connection and click New. When you select Oracle Spatial, a different process occurs, see Opening a Connection to an Oracle Spatial Data Source, p. 255 for these instructions. When you select ODBC, the Select Data Source dialog box displays.
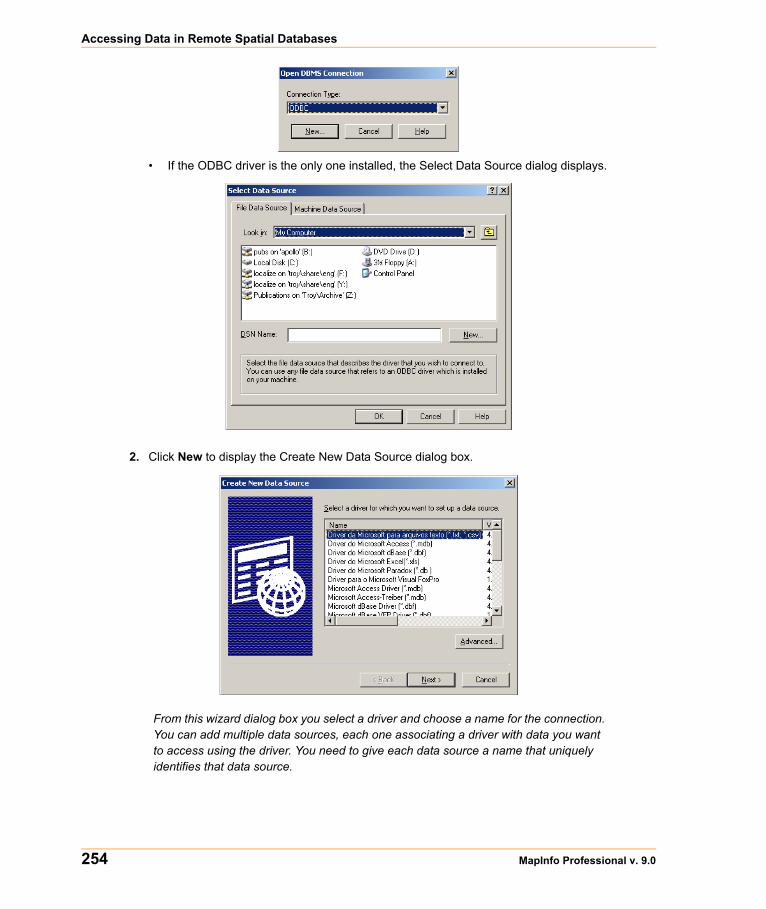
Accessing Data in Remote Spatial Databases
254 MapInfo Professional v. 9.0
• If the ODBC driver is the only one installed, the Select Data Source dialog displays.
2. Click New to display the Create New Data Source dialog box.
From this wizard dialog box you select a driver and choose a name for the connection. You can add multiple data sources, each one associating a driver with data you want to access using the driver. You need to give each data source a name that uniquely identifies that data source.
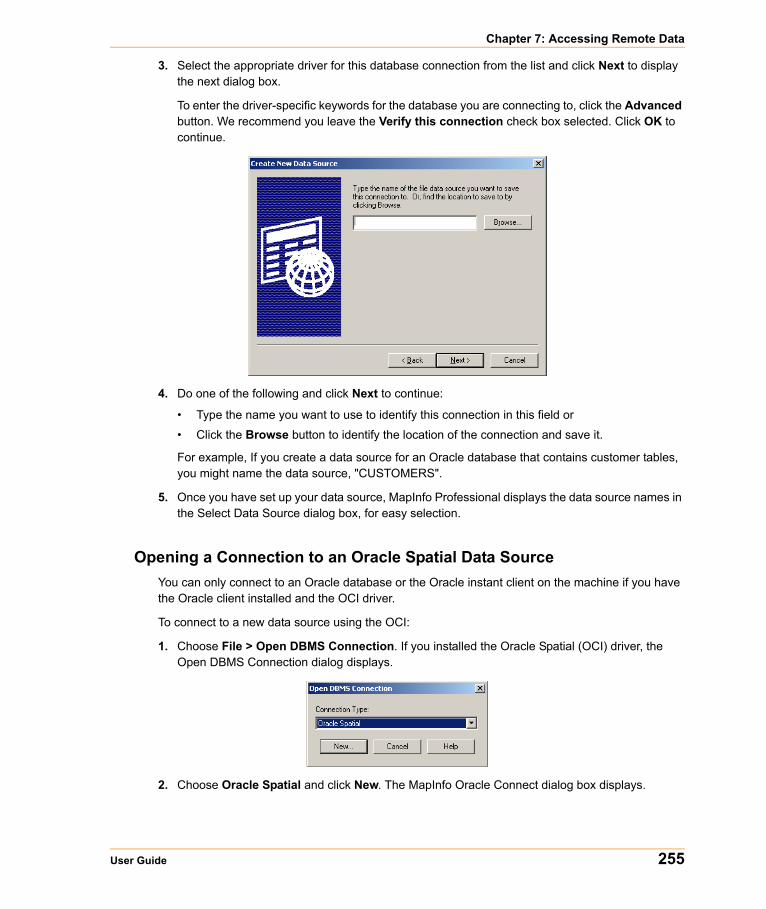
Chapter 7: Accessing Remote Data
User Guide 255
3. Select the appropriate driver for this database connection from the list and click Next to display the next dialog box.
To enter the driver-specific keywords for the database you are connecting to, click the Advanced button. We recommend you leave the Verify this connection check box selected. Click OK to continue.
4. Do one of the following and click Next to continue:
• Type the name you want to use to identify this connection in this field or
• Click the Browse button to identify the location of the connection and save it.
For example, If you create a data source for an Oracle database that contains customer tables, you might name the data source, "CUSTOMERS".
5. Once you have set up your data source, MapInfo Professional displays the data source names in the Select Data Source dialog box, for easy selection.
Opening a Connection to an Oracle Spatial Data SourceYou can only connect to an Oracle database or the Oracle instant client on the machine if you have the Oracle client installed and the OCI driver.
To connect to a new data source using the OCI:
1. Choose File > Open DBMS Connection. If you installed the Oracle Spatial (OCI) driver, the Open DBMS Connection dialog displays.
2. Choose Oracle Spatial and click New. The MapInfo Oracle Connect dialog box displays.
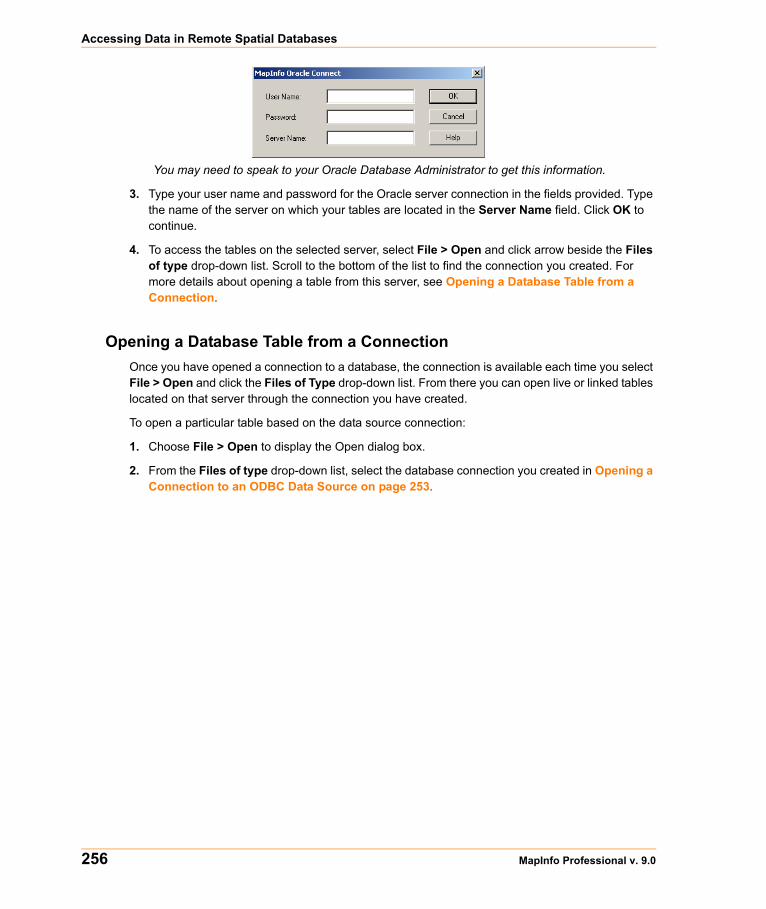
Accessing Data in Remote Spatial Databases
256 MapInfo Professional v. 9.0
You may need to speak to your Oracle Database Administrator to get this information.
3. Type your user name and password for the Oracle server connection in the fields provided. Type the name of the server on which your tables are located in the Server Name field. Click OK to continue.
4. To access the tables on the selected server, select File > Open and click arrow beside the Files of type drop-down list. Scroll to the bottom of the list to find the connection you created. For more details about opening a table from this server, see Opening a Database Table from a Connection.
Opening a Database Table from a Connection Once you have opened a connection to a database, the connection is available each time you select File > Open and click the Files of Type drop-down list. From there you can open live or linked tables located on that server through the connection you have created.
To open a particular table based on the data source connection:
1. Choose File > Open to display the Open dialog box.
2. From the Files of type drop-down list, select the database connection you created in Opening a Connection to an ODBC Data Source on page 253.
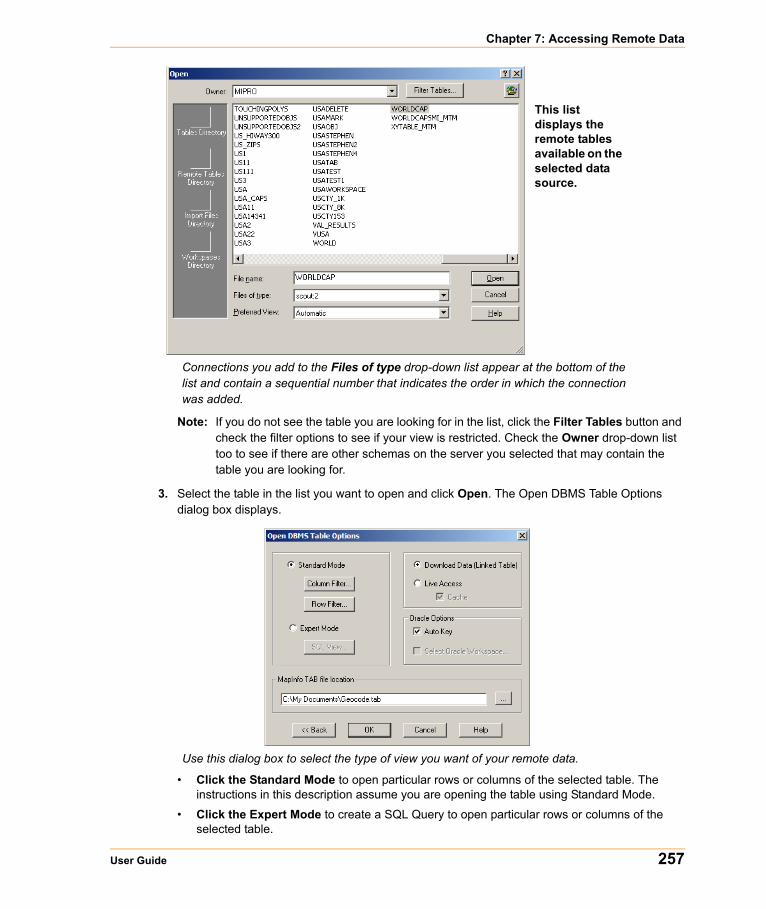
Chapter 7: Accessing Remote Data
User Guide 257
Connections you add to the Files of type drop-down list appear at the bottom of the list and contain a sequential number that indicates the order in which the connection was added.
Note: If you do not see the table you are looking for in the list, click the Filter Tables button and check the filter options to see if your view is restricted. Check the Owner drop-down list too to see if there are other schemas on the server you selected that may contain the table you are looking for.
3. Select the table in the list you want to open and click Open. The Open DBMS Table Options dialog box displays.
Use this dialog box to select the type of view you want of your remote data.
• Click the Standard Mode to open particular rows or columns of the selected table. The instructions in this description assume you are opening the table using Standard Mode.
• Click the Expert Mode to create a SQL Query to open particular rows or columns of the selected table.
This list displays the remote tables available on the selected data source.

Accessing Data in Remote Spatial Databases
258 MapInfo Professional v. 9.0
4. Click the Column Filter button to specify the columns to download. The Column Picker dialog box displays.
An asterisk (*) appears in the Selected list when you first open this dialog box. If you leave the asterisk, MapInfo Professional retrieves all the columns in the table from the remote database.
a. To move the columns you want to display from the table from the Available group to the Selected group using the arrow buttons. The single arrow keys move one selected column at a time. The double arrow buttons move all the columns at once from one list to the other.
b. To change the order of the selected columns in the Selected list, highlight the column you want to move and click the Up and Down buttons until the column is positioned correctly.
c. Click OK to complete your selections.
Note: If the table is mappable, the Available list also displays an additional column called OBJECT, which refers to the spatial column. You can select it to download point objects from the table. If the table is spatialized, MapInfo Professional downloads lines, points, and polygons depending on what the table contains.
5. Click the Row Filter button to select the row data that you want MapInfo Professional to download.
Leave this dialog box as it is to retrieve all of the rows pertaining to the columns you selected.
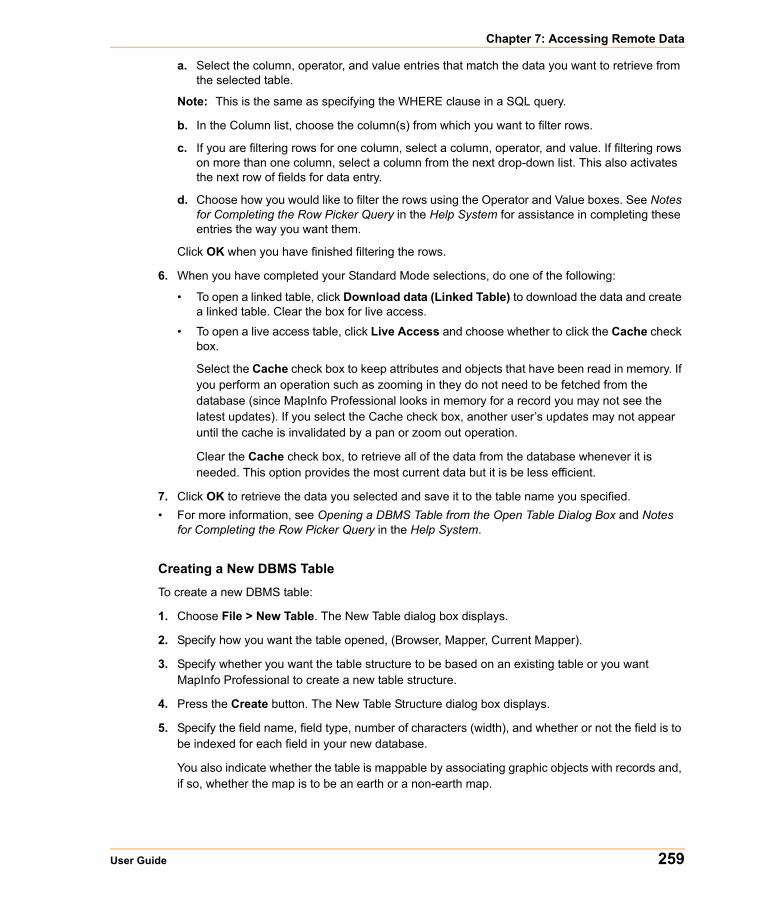
Chapter 7: Accessing Remote Data
User Guide 259
a. Select the column, operator, and value entries that match the data you want to retrieve from the selected table.
Note: This is the same as specifying the WHERE clause in a SQL query.
b. In the Column list, choose the column(s) from which you want to filter rows.
c. If you are filtering rows for one column, select a column, operator, and value. If filtering rows on more than one column, select a column from the next drop-down list. This also activates the next row of fields for data entry.
d. Choose how you would like to filter the rows using the Operator and Value boxes. See Notes for Completing the Row Picker Query in the Help System for assistance in completing these entries the way you want them.
Click OK when you have finished filtering the rows.
6. When you have completed your Standard Mode selections, do one of the following:
• To open a linked table, click Download data (Linked Table) to download the data and create a linked table. Clear the box for live access.
• To open a live access table, click Live Access and choose whether to click the Cache check box.
Select the Cache check box to keep attributes and objects that have been read in memory. If you perform an operation such as zooming in they do not need to be fetched from the database (since MapInfo Professional looks in memory for a record you may not see the latest updates). If you select the Cache check box, another user’s updates may not appear until the cache is invalidated by a pan or zoom out operation.
Clear the Cache check box, to retrieve all of the data from the database whenever it is needed. This option provides the most current data but it is be less efficient.
7. Click OK to retrieve the data you selected and save it to the table name you specified. • For more information, see Opening a DBMS Table from the Open Table Dialog Box and Notes
for Completing the Row Picker Query in the Help System.
Creating a New DBMS Table
To create a new DBMS table:
1. Choose File > New Table. The New Table dialog box displays.
2. Specify how you want the table opened, (Browser, Mapper, Current Mapper).
3. Specify whether you want the table structure to be based on an existing table or you want MapInfo Professional to create a new table structure.
4. Press the Create button. The New Table Structure dialog box displays.
5. Specify the field name, field type, number of characters (width), and whether or not the field is to be indexed for each field in your new database.
You also indicate whether the table is mappable by associating graphic objects with records and, if so, whether the map is to be an earth or a non-earth map.
Accessing Data in Remote Spatial Databases
260 MapInfo Professional v. 9.0
If you are using the structure from another mappable table, then MapInfo Professional sets the new table projection to the projection of the source table. Collectively, this information is the structure of your database.
6. Press the Create button to display the Create New Table dialog box.
7. Select a DBMS database from the Save as type: drop-down list. The DBMS connection controls display, (Owner: box and Filter Tables: button).
8. Specify a file name and press the Save button. The New DBMS Table Options dialog box displays.
This dialog box has three tabs, General, Spatial, and Styles. However, If you cleared the Make Table Mappable check box in step 4 then the DBMS Table Options dialog box will only have the General tab. Press the Help button to display specific information corresponding to the tab you are currently in.
Follow the instructions listed below, depending upon the tabs that display.
9. Click the General tab and complete the appropriate selections.
TAB file locationDisplays the name and path of the .tab file that will be created. You can manually type a filename or use the Save As dialog box (via Browse button) to choose a filename. MapInfo Professional uses the last directory where you saved a DBMS .tab when constructing the default filename full path. If this directory does not exist, then the Remote Tables preference directory is used. The filename part of the default path is based on the name of the specified DBMS table name.
Browse (…) buttonDisplays the Save As dialog box so the user can choose a .tab filename. Initialized with the text in the .tab filename edit box.
Download Data (Linked Table)/Live Access/Cache buttons
Download Data When the Download Data (Linked Table button is selected) you have a linked table. Unchecked provides Live Access. MapInfo Professional will remember the last used settings and continue to use them until you change the settings.
CacheWhen the Cache check box is selected, you are using the local buffer. Access time to data is faster but you don’t get the most current version.
When the Cache check box is cleared, you are always reading the remote data, which is the most recent version.
Note: The Cache check box should only be enable if the Live option is selected. Refresh occurs when you zoom, pan, or pack.
Key Column:Allows you to specify a key column for the new table. Without a key column a DBMS table cannot be open as live access and can only be opened read only as Linked.
Chapter 7: Accessing Remote Data
User Guide 261
If the Key Column check box is selected, then the corresponding combo box is enabled. You can either choose a column that was specified in the New Table Structure dialog box or specify a new column by typing into the combo box’s edit control.
By default the Key Column check box is selected and a new column is specified. The default name of the new column depends on the DBMS connection: MI_PRINX for Oracle Spatial, SW_MEMBER for all others.
10. Click the Spatial tab and specify the index type and coordinate column selections.
Index Type:This setting determines the type of spatial indexing used on the table. Types MapInfo (MICODE) and XY are always available. Server specific types may also be listed. The index type selection affects the state of the other three controls in this tab.
Index Column:This control is used to specify the primary spatial index column. It's always available, except when the index type is XY.
X Coordinate:This control is used to specify the X or latitude column in the database. It's only available for MapInfo (MICODE) or XY types. You can either choose a float column that was specified in the New Table Structure dialog box or specify a new column by typing into the combo box’s edit control.
Y Coordinate:This control is used to specify the Y or longitude column in the database. It's only available for MapInfo (MICODE) or XY types. You can either choose a float column that was specified in the New Table Structure dialog box or specify a new column by typing into the combo box’s edit control.
11. Click the Styles tab and complete the appropriate selections.
Per Row StyleCheck the Per Row Style box to enable per row symbology. The style info for each object is maintained in a character column of the table. If unchecked, then the style of all objects in the table is determined by the default object styles (maintained in the Map Catalog). If Per Row Style is checked, then the Style Column combo box is enabled. By default Per Row Style is checked and a new column named MI_STYLE is specified.
Style Column: You can either choose a character column that was specified in the New Table Structure dialog box or specify a new column by typing into the combo box’s edit control.
Default Object Styles:
Symbol/Line/Region The default object styles are used when Per Row Style is not turned on for a table, or the style info for a particular object does not exist (the style column for that row is empty). The default style info specified here is entered into the map catalog. The default symbol, line and region settings within MapInfo Professional are used to initialize these controls.
12. Press OK to open the DBMS table according to your specifications above.
Accessing Data in Remote Spatial Databases
262 MapInfo Professional v. 9.0
Refreshing Live and Linked Remote Tables
When you open a remote table as a “Live” table, MapInfo Professional enables the Refresh toolbar button so you can refresh the data in that table. This same functionality is available for linked remote database tables.
You can refresh a MapInfo Professional linked table with the most recent data residing on the remote database for that linked table.
To refresh a linked or live table:
1. Do one of the following:
• Use the Refresh DBMS Table button on the DBMS toolbar
• On the Table menu, point to Maintenance and click Refresh DBMS Table.
Using either method, the Refresh Table dialog box displays.
2. Choose the name of the table to be refreshed from the refresh table list.
3. Choose OK. The specified table is refreshed.
Unlinking a Table from a Remote Database You can unlink a table from its remote database with the Unlink DBMS Table command. Unlinking a table removes the link to the remote database. This command does not work if edits are pending on the linked table. You must first update any pending edits with the Save Table command. The table linkage is removed. Fields that were marked non-editable are now editable. The end product is a normal MapInfo Professional base table.
To unlink a table:
1. On the Table menu, point to Maintenance and click Unlink DBMS Table. The Unlink Table dialog box displays.
2. Choose the name of the table to be unlinked from the Unlink table list.
3. Choose OK. The specified table is unlinked.
Saving a DBMS Table You save changes to an MapInfo Professional linked or live table the same way you save a regular MapInfo Professional table, with the Save Table command.
Saving a linked or live table results saves the records on the remote database. But before MapInfo Professional allows records from a linked or live table to be updated, it evaluates the records in a process called conflict resolution.
If MapInfo Professional finds conflicts between the data on the remote database and any records in the linked table since it was downloaded, the Resolve Conflicts dialog box automatically appears. Use this dialog box to resolve conflicts.
• For more information, see Saving Changes Made to a DBMS Table in the Help System.
Chapter 7: Accessing Remote Data
User Guide 263
Conflict Resolution for Linked or Live Tables
Because the records in a remote table are from a remote database, it is possible that other users may have changed or deleted them on the remote database since the table was downloaded into MapInfo Professional. As a result, conflicts may exist between the data residing on the remote database and the new data that you want to upload to the remote database.
When saving a remote table, if MapInfo Professional finds conflicts between the data on the remote database and any records in the remote table since it was downloaded, the Resolve Conflicts dialog box automatically displays. Use this dialog box to resolve conflicts as explained in the next table.
This process will be invoked whenever an attempt to save a remote table detects a conflict in an update. The dialog box allows the user to choose which fields from the conflicting records will be used to update the database. Three instances of the record being updated must be considered:
• The original server state of the record (the record as it appeared when initially extracted from the database).
• The current local state of the record (the record as it appears in the session of MapInfo Professional making the update, possibly after editing by the user).
• The current server state of the record (the record as it appears in the database at the time of the update).
A conflict exists when the original state of the record does not match the server state. This implies that another user has updated this database since it was extracted by MapInfo Professional.
The Conflict Resolution dialog box displays once for each conflicting record. At any point in this process, you may choose to leave this interactive mode and have the rest of the conflicts resolved automatically. In that case, you can use all local values or all server values to resolve the conflicts in the records.
For each conflict found during a commit, a modal dialog box displays. This box will display enough information for you to decide which data values to use to update the row in question.
Type of conflict Default resolution
Value changed on server, local value unchanged Use server value
Value changed on server, local value changed Use local value
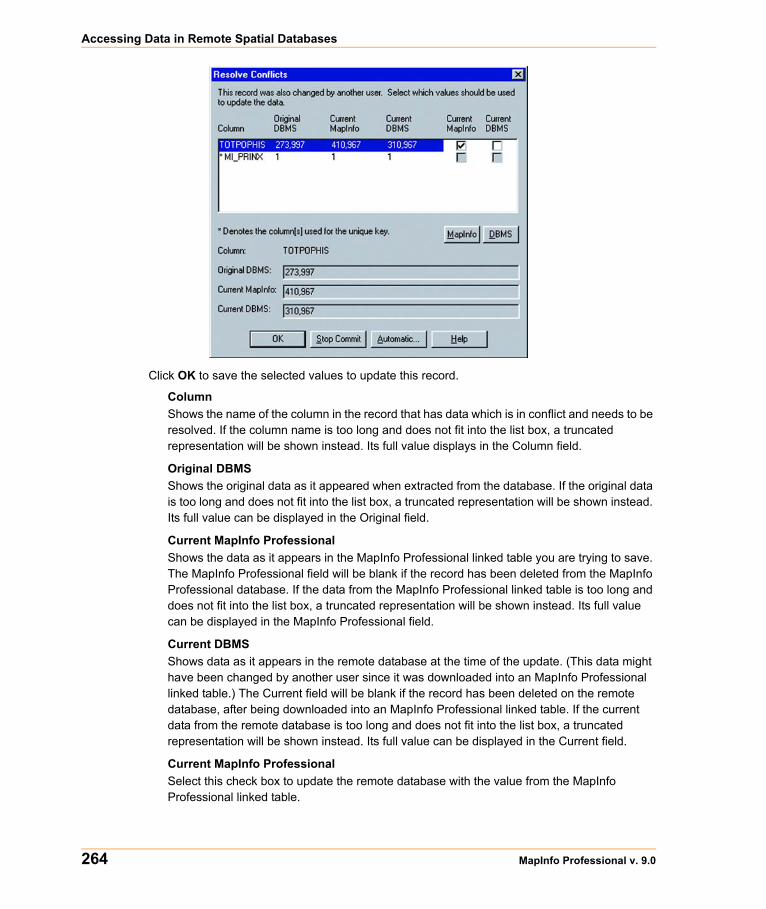
Accessing Data in Remote Spatial Databases
264 MapInfo Professional v. 9.0
Click OK to save the selected values to update this record.
ColumnShows the name of the column in the record that has data which is in conflict and needs to be resolved. If the column name is too long and does not fit into the list box, a truncated representation will be shown instead. Its full value displays in the Column field.
Original DBMSShows the original data as it appeared when extracted from the database. If the original data is too long and does not fit into the list box, a truncated representation will be shown instead. Its full value can be displayed in the Original field.
Current MapInfo ProfessionalShows the data as it appears in the MapInfo Professional linked table you are trying to save. The MapInfo Professional field will be blank if the record has been deleted from the MapInfo Professional database. If the data from the MapInfo Professional linked table is too long and does not fit into the list box, a truncated representation will be shown instead. Its full value can be displayed in the MapInfo Professional field.
Current DBMSShows data as it appears in the remote database at the time of the update. (This data might have been changed by another user since it was downloaded into an MapInfo Professional linked table.) The Current field will be blank if the record has been deleted on the remote database, after being downloaded into an MapInfo Professional linked table. If the current data from the remote database is too long and does not fit into the list box, a truncated representation will be shown instead. Its full value can be displayed in the Current field.
Current MapInfo ProfessionalSelect this check box to update the remote database with the value from the MapInfo Professional linked table.
Chapter 7: Accessing Remote Data
User Guide 265
If the current record on the database or the MapInfo Professional record was deleted, then this check box is not available. Instead, you must use the MapInfo Professional or Current button.
Current DBMSSelect to retain the current value on the remote database. If the current record on the database or the MapInfo Professional record was deleted, then this check box is not available. Instead, you must use the MapInfo Professional or Current button.
MI Pro buttonThis button selects all the MapInfo Professional values. If the record you are trying to resolve was deleted from the MapInfo Professional database, selecting the MI Pro button will delete the record from the remote database. If the record you are trying to resolve was deleted from the remote database, selecting the MI Pro button will insert the new record into the remote database.
Current buttonThis button selects all the current DBMS values. If the record you are trying to resolve was deleted from the MapInfo Professional database, selecting the Current button will ignore the deletion and retain the current record in the remote database. If the record you are trying to resolve was deleted from the remote database, selecting the MI Pro button will insert the new record into the remote database.
ColumnShows the full name of the column highlighted in the list box.
Original DBMSShows the full value of the original data highlighted in the list box.
Current MI ProShows the full value of the MapInfo Professional data highlighted in the list box.
Current DBMSShows the full value of the current remote database data highlighted in the list box.
Stop CommitThe Stop Commit button terminates the entire update. A second dialog box confirms that this is what you really want.
AutomaticThe Automatic button causes the interactive conflict resolution to end. A dialog box displays to allow you to select the automatic conflict-resolution modes you want to use for the remainder of this update. You can select one two automatic modes from the dialog box. You can accept MapInfo Professional values, or the values currently residing on the remote database.
• For more information, see Saving a Copy of a Table to a DBMS Table in the Help System.

Accessing Data in Remote Spatial Databases
266 MapInfo Professional v. 9.0
Disconnecting from a Remote DatabaseDisconnecting from a remote database server is a simple operation.
To disconnect from a remote database server:
1. From the DBMS Toolbar, do one of the following:
• Click the DBMS Disconnect button.
• On the File menu, click Close DBMS Connection.
Both operations display the Close DBMS Connection dialog box. The Connection list displays all the open connections.
2. Select the connection(s) you want to close and click OK. The selected connection(s) close.
Understanding OCI and ODBC Connectivity Error MessagesYou must have the OCI and ODBC support installed for MapInfo Professional to connect to remote databases. If you see the following messages, then you have installed the MapInfo DLLs for these features correctly but the drivers are missing:
OCI (Oracle Call Interface)The MapInfo Oracle OCI Database driver (MIDLOCI.DLL) failed to load.This is most commonly caused by not having an installation of Oracle's OCI client, which is necessary for the MapInfo Oracle OCI Database driver to load.To fix this issue, please install the Oracle OCI Database driver or rerun the MapInfo Professional Installer to remove the MapInfo Oracle OCI Database client.Clicking "OK" will allow you to run MapInfo Professional without the ability to open Oracle tables through Oracle's Oracle Call Interface.If you need more information, please contact MapInfo Technical Support.
ODBC (Open DataBase Connectivity)The MapInfo ODBC Database driver (MIDLODBC.DLL) failed to load.This is most commonly caused by an incomplete installation of MapInfo ODBC Connectivity Support. To fix this issue, please rerun the MapInfo Professional Installer to repair or remove the MapInfo ODBC Connectivity Support.Clicking "OK" will allow you to run MapInfo Professional without the ability to open remote database tables through ODBC.If you need more information, please contact MapInfo Technical Support.
A combined message displays if you attempt to add both of these options and neither of them have access to the appropriate database drivers.
Chapter 7: Accessing Remote Data
User Guide 267
Working with Styles in DBMS Tables
Using Per Row Styles for DBMS Table Layers
Per Row Styles allows the use of different object styles on a remote database. You can modify the styles of individual objects or groups of objects and save them to a DBMS table. To use Per Row Styles, the DBMS table must be set up correctly, and your MapInfo MapCatalog must have the appropriate structure:
• The MapCatalog must contain columns that support the use of styles. They are: RENDITIONTYPE, RENDITIONCOLUMN, and RENDITIONTABLE.
• The map table itself must have a character column wide enough to store the complete style string. Style strings vary in width. We recommend a minimum of 50 characters be provided. If you plan to use custom symbols, which use much longer strings, allow 200 characters.
• The entry for the table in the MapCatalog must be set correctly. This means that the RENDITIONTYPE is 1, and the RENDITIONCOLUMN contains the name of the column that will contain the style string. This entry is set by EasyLoader if the MapCatalog contains the new columns, or it may be set using the Make Table Mappable function.
Changing the Symbol Style in a Mappable DBMS Table
The Change DBMS Table Symbol command allows you to change the symbol attributes for the point objects in a mappable DBMS table.
1. On the Table menu, point to Maintenance and click Change DBMS Table Symbol. The Select DBMS Table is displayed. The dialog box only displays mappable DBMS tables.
2. Select a DBMS table to display the Change Table Object Style dialog box. Use the dialog box to specify new style attributes for the objects in the selected table.
3. You must close, reopen, and refresh the linked table for the style change to take effect.
Converting Unsupported Geometries in Oracle, Informix, and SQL ServerSome times when you are creating a Map in MapInfo Professional and you are storing the results in Oracle, Informix, or SQL Server, you create maps which use geometries that are not supported by these DBMS engines. Oracle does not support arcs, ellipses, rectangles, and rounded rectangles. Informix and SQL Server do not support arcs, ellipses, and rounded rectangles.
Note: If you have created a map you do not want to lose but cannot save to the DBMS of your choice due to unsupported geometries, you can use the Save As command and save the map without the unsupported geometries.
Accessing Data in Remote Spatial Databases
268 MapInfo Professional v. 9.0
Oracle Geometry Conversion Behavior
If you try to save a map with unsupported spatial geometry types in Oracle, these are the results:
• Spatial Geometry Types with All Unsupported Objects: If you have created a map that might contain all of the unsupported objects and you are trying to save to Oracle, this message displays:
Table has unsupported objects (rounded rectangles, rectangles, ellipses or arcs). Convert to regions and/or polylines?
Click Yes to convert the unsupported objects to regions or polylines; you would select No to decline to convert the unsupported objects. If you decline, you cannot save the map you have created to the Oracle database. A confirmation message explains that the operation is canceled.
• Spatial Geometry types with Region Objects Only: If you have created a map that contains region objects only and you are trying to save to Oracle, this message displays:
Table has unsupported objects (rounded rectangles, rectangles, or ellipses). Convert to regions?
Click Yes to convert the unsupported objects to regions; you would select No to decline to convert the unsupported objects. If you decline, you cannot save the map you have created to the Oracle database.
• For Spatial Geometry types with Line Objects Only: If you have created a map that contains line objects only and you are trying to save to Oracle, this message displays:
Arc is an unsupported object. Convert to polylines?
Click Yes to convert the unsupported objects to polylines; you would select No to decline to convert the unsupported objects. If you decline, you cannot save the map you have created to the Oracle database.
Informix and SQL Server Geometry Conversion Behavior
If you try to save a map with unsupported spatial geometry types in Informix or SQL Server, these are the results:
• Spatial Geometry Types with All Unsupported Objects: If you have created a map that might contain all of the unsupported objects and you are trying to save to Informix or SQL Server, this message displays:
Table has unsupported objects (rounded rectangles, ellipses or arcs). Convert to regions and/or polylines?
Click Yes to convert the unsupported objects to regions or polylines; you would select No to decline to convert the unsupported objects. If you decline, you cannot save the map you have created to the Informix or SQL Server database.
• Spatial Geometry types with Region Objects Only: If you have created a map that contains region objects only and you are trying to save to Informix or SQL Server, this message displays:
Table has unsupported objects (rounded rectangles or ellipses). Convert to regions?
Chapter 7: Accessing Remote Data
User Guide 269
Click Yes to convert the unsupported objects to regions; you would select No to decline to convert the unsupported objects. If you decline, you cannot save the map you have created to the Informix or SQL Server database.
• For Spatial Geometry types with Line Objects Only: If you have created a map that contains line objects only and you are trying to save to Informix or SQL Server, this message displays:
Arc is an unsupported object. Convert to polylines?
Click Yes to convert the unsupported objects to polylines; you would select No to decline to convert the unsupported objects. If you decline, you cannot save the map you have created to the Informix or SQL Server database.
Supporting Oracle SpatialOracle Spatial is an implementation of a spatial database from Oracle Corporation. You can install it in addition to the MapInfo Professional ODBC Connectivity component. Although it has some similarities to the previous Oracle SDO relational implementation, it is significantly different. Oracle Spatial maintains the Oracle SDO implementation via a relational schema. However, MapInfo Professional does not support the Oracle SDO relational schema via the Oracle Call Interface (OCI). MapInfo Professional does support simultaneous connections to Oracle Spatial through the OCI and to other databases through ODBC.
The Multipoint and Collection object types are translated into the Spatial Objects Oracle MULTIPOINT and COLLECTION, respectively, via Oracle OCI and vice versa. However, Oracle's COLLECTION object is broader in scope than MapInfo Professional’s Collection, which only allows one REGION, one polyline and one multipoint. Therefore, conversion from MapInfo Professional object to Oracle objects and the conversion from Oracle objects to MapInfo Professional objects may not be a one-to-one translation.
The following table shows the relationship between MapInfo Professional objects and Oracle objects.
The table indicates how Oracle Spatial objects are translated into MapInfo Professional objects. All point elements in an Oracle COLLECTION will be translated into one multipoint in a MapInfo Professional Collection; all Oracle Line objects (including single and multiple) will be translated into
Oracle Spatial Objects MapInfo Professional Objects
MULTIPOINT Multipoint
COLLECTION Collection
Point (cluster) Multipoint
Line String Polyline
Multiple Line String
Polygon REGION
Multiple Polygons
Accessing Data in Remote Spatial Databases
270 MapInfo Professional v. 9.0
one MapInfo Professional polyline; and all Oracle Polygons (including single and multiple) will be translated into one MapInfo Professional REGION. Therefore, when an Oracle COLLECTION is modified and then saved back into Oracle Server by using MapInfo Professional, the original structure of the Oracle COLLECTION object may be changed if it is more complicated than the MapInfo Professional Collection.
Oracle Spatial Requirements
To connect to Oracle Spatial within MapInfo Professional, you must have the Oracle Spatial or Oracle 9i and 9i release 2, or 10G client installed. See your Oracle documentation for detailed information.
Primary Key used for New Table Creation or When Saving a Remote Copy
An Unique key ensures that an entry does not match any other entry from a different record. If a record does not contain any value, no error is reported. A Primary key requires that every record contains a unique value in that field. By making these values Primary keys, we enforce that every record has a value in this field.
Primary Key Auto-Increment for Oracle Databases
The Primary auto-increment feature manages the Primary key value for you. When you add a new record to a remote Oracle table, MapInfo Professional locks the table, checks for the highest value of the Primary key of the table, increments it by one (1), and then puts that value in the Primary key field. Informix and SQL Server users do not require this feature as the server-side software manages the Primary key automatically.
Use the Auto Key check box in the Open DBMS Table Option dialog box to enable this feature. When you select the Auto Key check box, the Primary key field is uneditable and the Unique key is automatically incremented. If you do not select this check box, the Primary key field remains editable, which supports backwards compatibility.
To access this feature:
1. From the File menu, click Open and select an Oracle database from the Files of Type drop-down list. Click OK to display the Open DBMS Table Options dialog box.
2. Select the Auto Key option to increment the Primary key of the selected table automatically for any new records.
3. Click OK to continue.
Oracle Object Map Verification Supporting Object/Map Validation
The Check Regions command enables you to remove region line segments that intersect each other. You can also think of this as nodes within a single polygon of a region where the polygon intersects itself, as when a node has more than 2 line segments emanating from it.
These cases can be broken down into two other instances.
• If a polygon has 2 looped sections, and the path traced by the nodes of the polygon follow a cursive figure 8 pattern, then we call this a Figure 8 polygon.
Chapter 7: Accessing Remote Data
User Guide 271
• If the same 2 looped polygon can trace its path as a cursive capital letter B, then we call this a Bow Tie polygon.
We think of Figure 8 as worse than Bow Tie because the area of a Figure 8 is always incorrect, while the area of a Bow Tie can be correct and accurate. Both Figure 8's and Bow Ties are detected.
Supporting SpatialWare
SpatialWare is a MapInfo Corporation product that helps users store, access, manage, and manipulate spatial data as a standard part of their business data. You can query both spatial and non-spatial data within a single SQL Server query using SpatialWare. All of the strengths of SQL Server as a relational database are extended to spatial data using SpatialWare. Spatial data may for example be directly managed and edited by many different users simultaneously.
Bound Objects in SpatialWare Spatial Queries
For both linked and live access tables, spatial objects in SpatialWare and Oracle Spatial queries are now submitted as a bound (binary) object. This change has been made for all implementations of SpatialWare: Oracle, Informix, and Oracle Spatial. Previously, a string was generated for the object. Because of the limitations on the string size, polygon complexity was also limited. Submitting spatial objects as bound objects removes this limitation. The string describing the spatial object will be stored in the .tab files and reconstructed into a bound object when the table is opened. The SW SPW lib will be used to construct the bound object from the SpatialWare string.
Creating Legends from/for a Live TableYou can retrieve unique styles from the table using the Create Legend wizard. You can retrieve styles from the map catalog, if performance is your primary concern, but if you prefer a more visually descriptive and appealing graphical representation of the unique map styles in your live table, you can create legends from a live table instead.
When are unique map styles available for a live table?
In general, remote databases have no consistent way of storing styles for geographic data. MapInfo Professional gives you two different ways of associating styles with geographic data for remote databases. The first way is to specify a common style for a database table in the map catalog, which is used for all records in that database table. The second way is to have an additional column for the database table that specifies a style for each record in that table. (MapInfo Professional uses the map catalog to keep track of the style column for a database table.) Unique map styles are available for a database table when it has this designated style column.
To see this functionality:
1. Open a remote DBMS connection and select a live table for display.
2. From the Map menu, click Create Legend to display the Create Legend Step 1 of 3 dialog box.
3. Select a layer to create a legend from and click Next to display the Create Legend Step 2 of 3 dialog box. For purposes of this demonstration, click Next to display the Create Legend Step 3 of 3 dialog box.
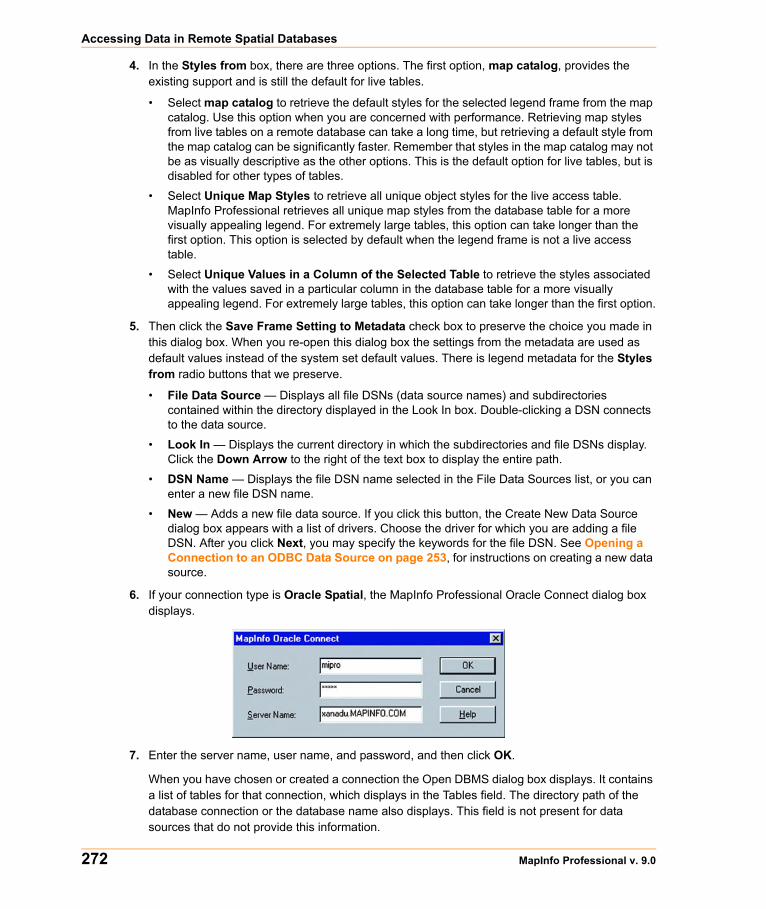
Accessing Data in Remote Spatial Databases
272 MapInfo Professional v. 9.0
4. In the Styles from box, there are three options. The first option, map catalog, provides the existing support and is still the default for live tables.
• Select map catalog to retrieve the default styles for the selected legend frame from the map catalog. Use this option when you are concerned with performance. Retrieving map styles from live tables on a remote database can take a long time, but retrieving a default style from the map catalog can be significantly faster. Remember that styles in the map catalog may not be as visually descriptive as the other options. This is the default option for live tables, but is disabled for other types of tables.
• Select Unique Map Styles to retrieve all unique object styles for the live access table. MapInfo Professional retrieves all unique map styles from the database table for a more visually appealing legend. For extremely large tables, this option can take longer than the first option. This option is selected by default when the legend frame is not a live access table.
• Select Unique Values in a Column of the Selected Table to retrieve the styles associated with the values saved in a particular column in the database table for a more visually appealing legend. For extremely large tables, this option can take longer than the first option.
5. Then click the Save Frame Setting to Metadata check box to preserve the choice you made in this dialog box. When you re-open this dialog box the settings from the metadata are used as default values instead of the system set default values. There is legend metadata for the Styles from radio buttons that we preserve.
• File Data Source — Displays all file DSNs (data source names) and subdirectories contained within the directory displayed in the Look In box. Double-clicking a DSN connects to the data source.
• Look In — Displays the current directory in which the subdirectories and file DSNs display. Click the Down Arrow to the right of the text box to display the entire path.
• DSN Name — Displays the file DSN name selected in the File Data Sources list, or you can enter a new file DSN name.
• New — Adds a new file data source. If you click this button, the Create New Data Source dialog box appears with a list of drivers. Choose the driver for which you are adding a file DSN. After you click Next, you may specify the keywords for the file DSN. See Opening a Connection to an ODBC Data Source on page 253, for instructions on creating a new data source.
6. If your connection type is Oracle Spatial, the MapInfo Professional Oracle Connect dialog box displays.
7. Enter the server name, user name, and password, and then click OK.
When you have chosen or created a connection the Open DBMS dialog box displays. It contains a list of tables for that connection, which displays in the Tables field. The directory path of the database connection or the database name also displays. This field is not present for data sources that do not provide this information.
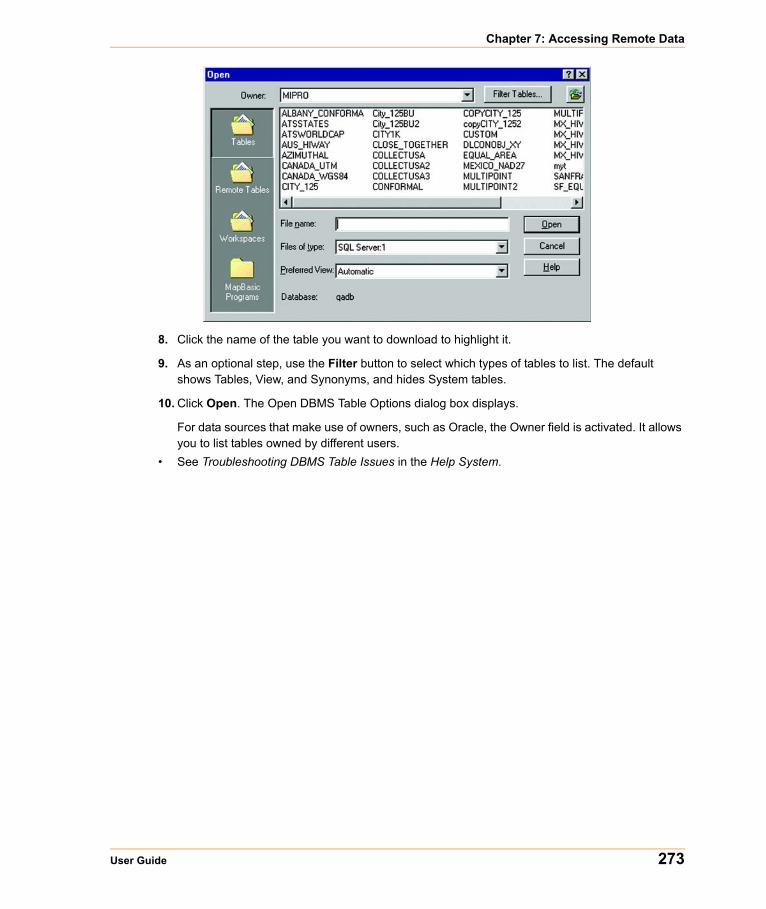
Chapter 7: Accessing Remote Data
User Guide 273
8. Click the name of the table you want to download to highlight it.
9. As an optional step, use the Filter button to select which types of tables to list. The default shows Tables, View, and Synonyms, and hides System tables.
10. Click Open. The Open DBMS Table Options dialog box displays.
For data sources that make use of owners, such as Oracle, the Owner field is activated. It allows you to list tables owned by different users.
• See Troubleshooting DBMS Table Issues in the Help System.

Accessing Data in Remote Spatial Databases
274 MapInfo Professional v. 9.0
Drawing and Editing Objects
The drawing and editing capabilities in MapInfo Professional® allow you to create and customize an unlimited variety of objects for your maps. Easy-to-use drawing tools and commands are accessible from the Drawing Toolbar. You can also display nodes, line directions and centroids to give you better control when editing objects.
In this Chapter:
Understanding the Drawing and Editing Tools . . . . . . . . . . . . . .276Drawing Objects . . . . . . . . . . . . . . . . . . . . . . . . . . . . . . . . . . . . . . .278Drawing Polygons and Polylines . . . . . . . . . . . . . . . . . . . . . . . . .281Drawing Symbols . . . . . . . . . . . . . . . . . . . . . . . . . . . . . . . . . . . . . .284Working with Text on the Map. . . . . . . . . . . . . . . . . . . . . . . . . . . .287Editing Objects . . . . . . . . . . . . . . . . . . . . . . . . . . . . . . . . . . . . . . . .288
8
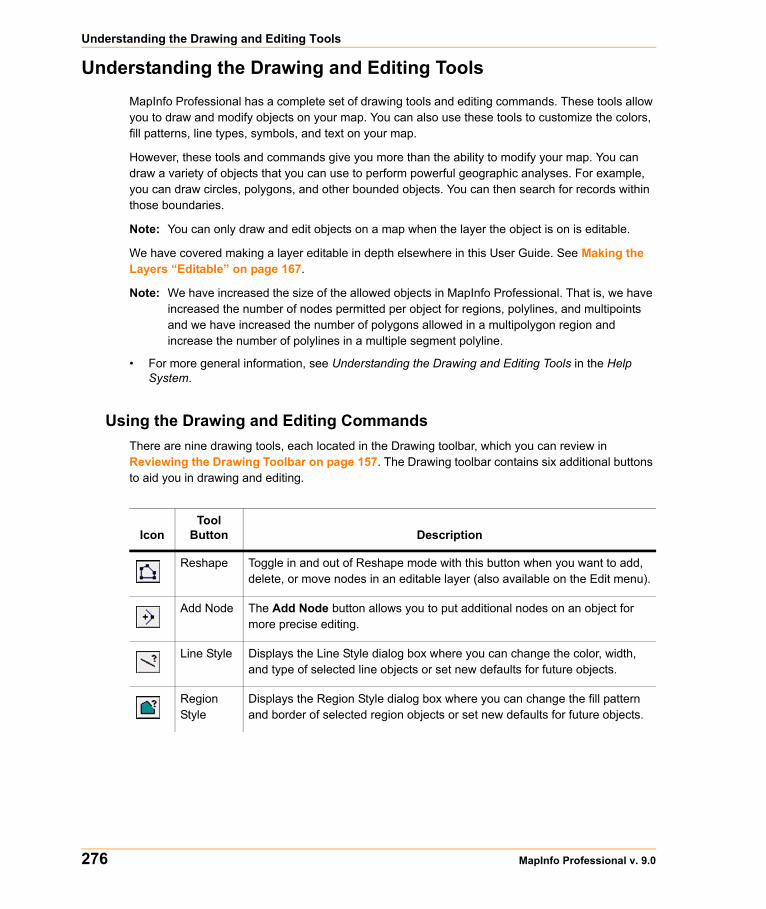
Understanding the Drawing and Editing Tools
276 MapInfo Professional v. 9.0
Understanding the Drawing and Editing ToolsMapInfo Professional has a complete set of drawing tools and editing commands. These tools allow you to draw and modify objects on your map. You can also use these tools to customize the colors, fill patterns, line types, symbols, and text on your map.
However, these tools and commands give you more than the ability to modify your map. You can draw a variety of objects that you can use to perform powerful geographic analyses. For example, you can draw circles, polygons, and other bounded objects. You can then search for records within those boundaries.
Note: You can only draw and edit objects on a map when the layer the object is on is editable.
We have covered making a layer editable in depth elsewhere in this User Guide. See Making the Layers “Editable” on page 167.
Note: We have increased the size of the allowed objects in MapInfo Professional. That is, we have increased the number of nodes permitted per object for regions, polylines, and multipoints and we have increased the number of polygons allowed in a multipolygon region and increase the number of polylines in a multiple segment polyline.
• For more general information, see Understanding the Drawing and Editing Tools in the Help System.
Using the Drawing and Editing CommandsThere are nine drawing tools, each located in the Drawing toolbar, which you can review in Reviewing the Drawing Toolbar on page 157. The Drawing toolbar contains six additional buttons to aid you in drawing and editing.
IconTool
Button Description
Reshape Toggle in and out of Reshape mode with this button when you want to add, delete, or move nodes in an editable layer (also available on the Edit menu).
Add Node The Add Node button allows you to put additional nodes on an object for more precise editing.
Line Style Displays the Line Style dialog box where you can change the color, width, and type of selected line objects or set new defaults for future objects.
Region Style
Displays the Region Style dialog box where you can change the fill pattern and border of selected region objects or set new defaults for future objects.
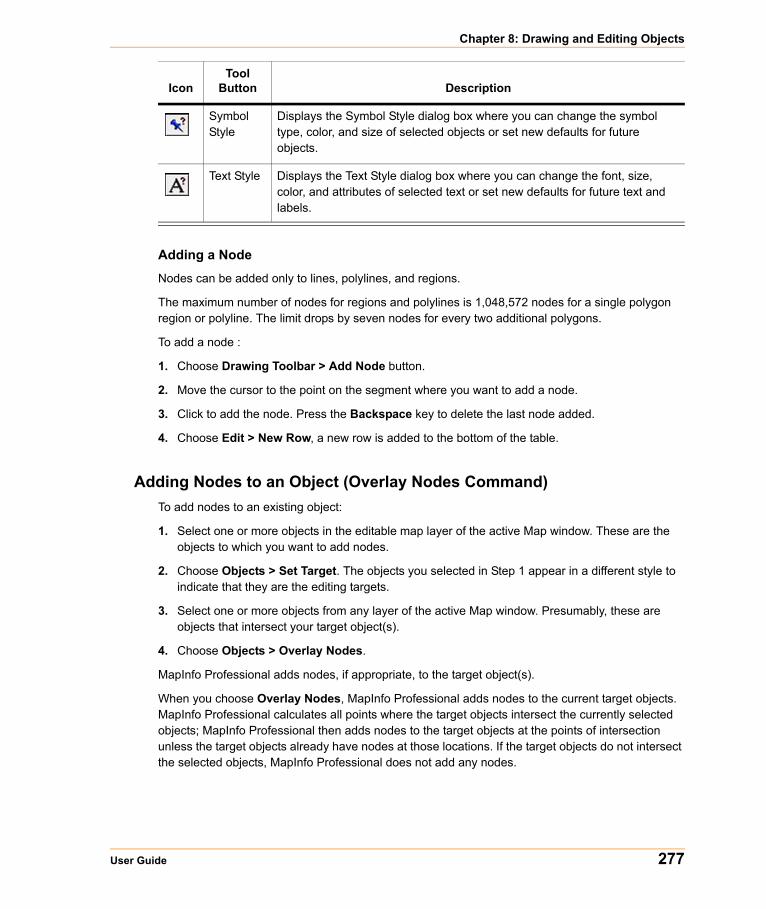
Chapter 8: Drawing and Editing Objects
User Guide 277
Adding a Node
Nodes can be added only to lines, polylines, and regions.
The maximum number of nodes for regions and polylines is 1,048,572 nodes for a single polygon region or polyline. The limit drops by seven nodes for every two additional polygons.
To add a node :
1. Choose Drawing Toolbar > Add Node button.
2. Move the cursor to the point on the segment where you want to add a node.
3. Click to add the node. Press the Backspace key to delete the last node added.
4. Choose Edit > New Row, a new row is added to the bottom of the table.
Adding Nodes to an Object (Overlay Nodes Command)To add nodes to an existing object:
1. Select one or more objects in the editable map layer of the active Map window. These are the objects to which you want to add nodes.
2. Choose Objects > Set Target. The objects you selected in Step 1 appear in a different style to indicate that they are the editing targets.
3. Select one or more objects from any layer of the active Map window. Presumably, these are objects that intersect your target object(s).
4. Choose Objects > Overlay Nodes.
MapInfo Professional adds nodes, if appropriate, to the target object(s).
When you choose Overlay Nodes, MapInfo Professional adds nodes to the current target objects. MapInfo Professional calculates all points where the target objects intersect the currently selected objects; MapInfo Professional then adds nodes to the target objects at the points of intersection unless the target objects already have nodes at those locations. If the target objects do not intersect the selected objects, MapInfo Professional does not add any nodes.
Symbol Style
Displays the Symbol Style dialog box where you can change the symbol type, color, and size of selected objects or set new defaults for future objects.
Text Style Displays the Text Style dialog box where you can change the font, size, color, and attributes of selected text or set new defaults for future text and labels.
IconTool
Button Description
Drawing Objects
278 MapInfo Professional v. 9.0
If you use Overlay Nodes to add nodes to a line, MapInfo Professional converts the line to a polyline. If you use Overlay Nodes to add nodes to an ellipse, rectangle or rounded rectangle object, MapInfo Professional converts the object to a region. Overlay Nodes does not affect text or point objects, and you may not use point or text objects to add nodes to other objects.
Drawing ObjectsDrawing objects in MapInfo Professional is easy. Once you have made the layer editable, choose the appropriate tool. Using the shape tools, you can draw arcs, ellipses, circles, lines, rectangles, and rounded rectangles on your map. You can either draw the object directly on the Cosmetic Layer (and save it to another or new layer later) or make a map layer editable and draw the objects there.
Once you have drawn the object, you can move the object, delete it, copy it to the Clipboard, or paste it to another Map window.
Also, you can delete the last node of the object by pressing the Backspace key. If there is only one node left in the object, it will not be deleted.
Specifying an Object's Geographic Attributes If the selected object is editable (resides in an editable layer) then you can specify attributes for the object by accessing that Objects Attributes dialog box.
Note: If the object is not editable then you can only access a read-only dialog box.
To specify an object's geographical attributes:
1. Choose Map > Layer Control. The Layer Control dialog box displays.
2. Select the layer containing the map object.
3. Check the Editable box.
4. Click OK.
5. Select the map object.
6. Do one of the following:
• Choose Edit > Get Info.
• Double-click the map object with the Select tool.
The Object Attributes dialog box displays.
7. Type in attributes as appropriate.
8. Click OK.
Use the Help search option to locate information for a specific map object (for example, Arcs, Points, Polygons etc.).
Chapter 8: Drawing and Editing Objects
User Guide 279
Reverting to a Previous Version Use Revert Table in the File menu to access a previous version of a table when you have made changes that you do not want to make permanent and haven't saved yet. Revert Table replaces the selected table currently in memory with the last version saved.
To revert to a previous version:
1. Choose File > Revert Table to display the Revert Table dialog box. Here you can choose the table to revert to (that is, return to its previous state).
2. Once you have chosen a table to revert, MapInfo Professional prompts you on whether you wish to discard the changes you have made in the table.
3. Click Discard. MapInfo Professional discards the changes you have made to the table. However, if you have second thoughts, click Cancel.
• For instructions on drawing specific objects such as lines, polylines, squares, etc, see Drawing Objects in the Help System.
Using the Ruler Window as You DrawThe Ruler window will show the distance of line segments as you draw, as well as the cumulative distance of the drawn object. If necessary, a rubber-banding line displays to show what points are being used to computer the distance. The Ruler window also displays what type of calculation is used to compute the distance: Spherical or Cartesian. The type of calculation depends on the projection of the map.
The following drawing tools will display a rubber-banding line:
• Arc
• Ellipse
• Rectangle
• Rounded Rectangle
You can also use the Ruler window with the Marquee Select and Radius Select tools. Just click the Ruler tool to display the Ruler window.
If the Ruler window is not active, the drawing and selection tools noted above do not display distance. The rubber-banding line does not display.
• For more instructions, see the Measuring the Distance between Two Points topic in the Help System.
Drawing Objects
280 MapInfo Professional v. 9.0
Object StylesMapInfo Professional draws objects using the default color, fill pattern, line type, symbol, and text settings for the layer you are drawing on. The default style can be set in the Styles Preferences dialog box.
To change the style of an existing object:
1. On the Map menu, click Layer Control and make the layer editable.
2. Select the object and choose the appropriate style command from the Options menu.
The style commands are also available on the Drawing Toolbar. These commands also set the styles for any subsequent objects to be drawn on the layer.
3. Save your changes.
For closed shapes such as circles and squares, you can change the fill pattern and color, the style and color of the border, and the line width of the border. For arcs and lines, you can change the type of line, its color, and the width of the line. In addition, you can use interleaved line styles to create the appearance of intersections for overlapping intersections and lines within a single layer. Interleaved line styles are available for use with lines of the same style and color (they can be different widths). Interleaved line styles are not available for solid lines or borders.
Any edits to an object’s default settings will be applied during the entire work session until you make new changes. To save the settings, you must save the table where the object resides.
You can also change the display of an object in Layer Control. In the Layer Control dialog box, click the Display button to bring up the Display Options dialog box. Click the Style Override check box to activate the Style Override button. Click the Style button to bring up the appropriate style dialog box.
Note: The settings you specify through the Display Options dialog box are temporary unless you save the table to a workspace.
• For more information, see Using Interleaved Line Styles in the Help System.
Printing Fill PatternsWhen it comes to printing objects, some fill patterns print faster than others. In general, the fill patterns on the top row of the pattern list in the Pattern drop-down list print the fastest. The difference in printing speed varies from printer to printer. The fill patterns on the top row are also the ones most likely to plot correctly on pen plotters, although results depend on which plotter driver you use. For more coaching on printing fill patterns, review the MapInfo Professional Printer Guide, which is located in the Documentation subfolder of your installation directory. To review the list of fill patterns available in the MapInfo Professional product, see Fill Patterns Used in MapInfo Professional in the MapInfo Professional Help System.
Chapter 8: Drawing and Editing Objects
User Guide 281
Drawing Polygons and PolylinesDrawing polygons is different than drawing other shapes because you are creating a region on which you can perform other editing and analysis.
For instance, you want to create school districts for your map. You have a street map of your town to guide you in defining the school district boundaries.
To create a polygon:
1. Choose the Polygon tool. The tool becomes a cross hair.
2. Click a starting point for the polygon.
3. Continue to click to add segments to the polygon.
4. When you are ready to complete the object, double-click the last end point.
You can delete the last node by pressing the Backspace key.
Note: If there is only one node left in the object it will not be deleted.
You can then use the Combine command to combine this region with another, reshape the region, etc.
Polylines are made up of multiple line segments that are treated as one object. Unlike lines created with the Line tool, you can smooth polylines into a continuous curve using the Smooth command. Again, you can delete the last node by pressing the Backspace key.
Note: If there is only one node left in the object it will not be deleted.
Drawing Orthogonal Polygons
You can draw orthogonal (right angle) polygon line segments when you press the Ctrl key. Using this key you can draw the polygon at 45 degree increments relative to the slope of the last line segment. This functionality works for Add Line, Add Polyline, the Ruler Tool, Custom Polyline and Custom Polygon tools, and the Add Polygon operations.
This functionality is useful when you want to draw perpendicular lines at an angle rather than horizontal to the map.
Note: Snap and Autotrace functionality must be turned off to use this feature, because when these features are activated, the Ctrl and Shift keys have other purposes. The Shift and Ctrl keys also do not operate when you are using the Polygon Select tool.
To see this functionality:
1. From the File menu, click Open and select a map to display.
2. Make a layer editable using the Layer Control dialog box.
3. Select the Polygon tool from the Drawing toolbar.
Note: This works with any of the Line, Polyline, the Ruler Tool, Custom Polyline and Custom Polygon tools as well, we are just using the Polygon tool as an example.
Drawing Polygons and Polylines
282 MapInfo Professional v. 9.0
4. Click and draw a single line in any direction other than horizontal following these directions:
• To draw the next segment perpendicular to the last segment, press Ctrl while dragging the cursor.
• To draw the next segment perpendicular to horizontal, press Shift while dragging the cursor.
Tracing Polylines and Polygons
When you are drawing a new polyline or polygon, you can use Autotrace to trace nodes from existing polylines or polygons. The Autotrace tool is only in effect when you are using a polygeometric tool (Add Polyline, Add Polygon, or Select Polygon) and Snap is on.
To trace the nodes of an existing polyline or polygon:
1. Press the S key to activate Snap Mode.
2. Press the T key to activate Autotrace.
3. Click on the first node of the polyline/polygon you want to trace.
4. Move the mouse to another node of the same object. Follow the procedure below for the type of object you are tracing:
• Polyline: Hold down the Shift key or the Ctrl key and click.
• Polygon: Hold down the Shift key for the shorter set of nodes or the Ctrl key for the longer set of nodes and click.
Pressing the Shift or Ctrl keys highlights the trace path. Click to automatically trace the segments between the nodes and add them to the polyline/polygon you are drawing.
5. Continue until you have traced the entire polygon/polyline and right-click to end.
Note: Autotrace only one object at a time; clicking nodes in different objects will produce a straight line between the two nodes.
Converting a Polyline to a RegionTo convert a polyline into a region:
1. Make the Map window active.
2. Open Layer Control and make the layer that contains the polyline editable.
3. Select the polylines you want to convert to a region.
4. On the Objects menu, click Enclose. The Create Region Objects From Enclosed Areas dialog box displays.
5. Click OK to convert the polyline you selected to a region.
You can also convert regions to polylines. For these instructions, see Converting Regions to Polylines on page 298.
Chapter 8: Drawing and Editing Objects
User Guide 283
Splitting Polylines at Nodes
A single-section polyline can be split into two polylines at a selected node.
To split a single-section polyline:
1. From an editable layer, select a single-section polyline
2. Click the Reshape button from the Drawing tools.
3. Select one node (other than the first or last node).
4. Select the Objects menu, then Polyline Split at Node
5. If a layer is not a cosmetic layer or if the polyline is in the Layout window, the Data Disaggregation dialog box will appear. Here the user can specify how data is disaggregated.
6. After selecting the data disaggregation method, click OK. The selected polyline will be split at the node into two polylines.
Error messages display under the following conditions:
• You did not select a node of the polyline.
• You selected a beginning or ending node of the polyline.
• You selected more than one node of the polyline.
• The object that you selected is not a polyline object.
• You attempted to split a multi-segmented polyline (only single-section polylines can be split).
Notice the difference in the way the angle draws between the Ctrl and Shift created polygons in the next figure.
Converting Objects into Polyline Objects If a region contains lakes or islands, and you convert that region to a polyline, the polyline has multiple sections. Each lake or island comprises one section of the polyline. When you convert a circle or ellipse into a polyline, the polyline contains 102 nodes. When you convert an arc into an ellipse, the number of nodes depends on the starting and ending angle of the arc. If the arc spans 180 degrees (for example, the starting angle is zero and the ending angle is 180), a polyline based on the arc will contain 52 nodes; if the arc spans 90 degrees, a polyline based on the arc will contain 26 nodes; etc.
The Help System contains these related topics:
• Displaying Distance while Drawing Objects• Displaying Distance, Length, Perimeter, and Area Calculations• Specifying Distance, Length, Perimeter, and Area Calculations for a Particular Map
Drawing Symbols
284 MapInfo Professional v. 9.0
Drawing SymbolsSymbols on your maps make your map more expressive and easier to understand. This section explains how to change a style currently used by MapInfo Professional and create your own custom symbols. We also discuss in detail the rules governing symbols.
To draw symbols, make the layer you want to draw the symbols to editable and choose the Symbol tool. Place the cursor where you want the symbol to be and click. The symbol displays using the default symbol style settings.
The Help System contains these related topics:
• Adding Point Symbols to your Map• Specifying Symbol Styles of Point Objects• Changing the Location of Point Symbols
Changing a Symbol Style on a MapTo change a symbol’s style on a map:
1. Select the symbol with an appropriate selection tool.
2. Do one of the following:
• Click the Symbol Style button
• On the Options menu, click Symbol Style
Using either method, the Symbol Style dialog box displays.
Note: The options in the Symbol Style dialog box may be different depending upon the size and complexity of the image.
Here you can change the symbol, font, color, and size, as well as create background effects and bold face for symbols.
Select the Display at Actual Size check box to see the symbol you selected at the size it was originally created.
Click the Reload button to refresh the list of custom symbols stored in the Application Data CUSTSYMB directory. Select this button if you added a new custom symbol and do not see the symbol(s) in the list.
Click the Full View button to display the entire view of custom symbol in a separate window. This button displays only when you select the Custom Symbols font type. You use this button when the preview is too large to display completely in the sample area.
3. Make the desired changes, and click OK.
The symbol displays with the style changes you specified. These settings also apply to any subsequent symbols you draw until you change the settings.
Chapter 8: Drawing and Editing Objects
User Guide 285
Supported Fonts for SymbolsYou have many options when drawing symbols. We support a number of TrueType fonts that carry their own symbol sets. We have also organized a number of symbol fonts around different industries, such as real estate and transportation, making it easy for you to find the symbols you need. MapInfo Professional supports the following fonts:
• MapInfo Cartographic
• MapInfo Transportation
• MapInfo Real Estate
• MapInfo Miscellaneous
• MapInfo 3.0 Compatible Symbols (vector symbols, available as a True Type font in MapInfo Professional): the 36 shapes from the MapInfo symbol set
• MapInfo Oil & Gas
• MapInfo Weather
• MapInfo Arrows
• Installed font symbols: symbols available from the installed fonts that offer a symbol set
• Custom symbols: from here you can access user-created bitmap symbols which you have saved to the CUSTSYMB directory. This directory is created during MapInfo Professional installation. See Working with Custom Symbols (page 285) for more about this process.
The MapInfo Symbols font is a TrueType font. When you use these symbols, the Background and Effects options in the Symbol Style dialog box are unavailable.
Working with Custom SymbolsYou can create and use your own custom bitmaps as symbols in MapInfo Professional. To access these custom symbols, place them in the CUSTSYMB directory and select them from the Custom Symbols option in the Font list of the Symbol Style dialog box (Options > Symbol Style). All of the custom symbols in MapInfo Professional are stored in the CUSTSYMB directory. If you cannot find this directory, there are a couple of places you could check. The location of this file depends largely on the administration of your computer, the version of MapInfo Professional you use, and the location of your installation directory.
Usually, this directory is located in Program Files\MapInfo\Professional\ (or one of its subdirectories) or in \Documents and Settings\user’s login directory\Applications Data\MapInfo\MapInfo\version number\. If you cannot find this directory, click Start and Search and search for \CUSTSYMB on your system.
Note: If you add custom symbols while you are working in MapInfo Professional, open the Symbol Style dialog box and click the Reload button to ensure that the new symbol(s) you have added display. Otherwise, you have to exit MapInfo Professional and re-enter it to get the new symbols to display in the Custom Symbols list.
Drawing Symbols
286 MapInfo Professional v. 9.0
When you change the style of a custom symbol, the Effects options in the Symbol Style dialog box change. You can either show a background or apply a color.
• Show Background displays the custom symbol with the background color with which it was created.
• Apply Color replaces all non-white pixels with a color you choose from the color palette.
• Display at Actual Size shows the symbol at its actual size.
When you are creating extended custom symbols we recommend you check the Show Background check box if you do not require transparency. This setting improves performance significantly during exporting and Drag and Drop operations.
MapInfo Professional ships with custom symbols that you can use to enhance your maps.
The Help System contains the following related topics:
• Understanding the Custom Symbol Types• Understanding the Custom Symbol Sizes, Shape, and Color Rules• Adding User-Defined Custom Symbols
Creating a Custom Symbol
To create a custom symbol:
1. Create your own custom symbol and save it as a bitmap.
2. Place the bitmap in the directory you have assigned for symbols.
3. Restart MapInfo Professional if it is running.
4. Open your map and choose Map > Layer Control to display the Layer Control dialog box.
5. Make the map layer where you want to place the symbol editable.
6. Choose Options > Symbol Style to display the Symbol Style dialog box.
7. Click the Font drop-down menu and choose Custom Symbols.
8. You must click the Reload button to view the newly added custom symbol.
9. Select your custom symbol and choose OK.
10. Click on the map using the Symbol tool to display your custom symbol.
Note: The bitmap file has to be 256 color and under 128k in size. Bitmaps should also be the same dimension in x and y.
• For more information, see Finding the Custom Symbol Directory in the Help System.
Chapter 8: Drawing and Editing Objects
User Guide 287
Displaying Overlapping Symbols
When point objects display at the same coordinate, you can miss the significance of their proximity because the data overlaps each other, preventing you from making the connection.
The Dispersed Groups symbol font gives you a way to display symbols that represent different organizations, events, or services that occupy the same coordinate location without overlapping each other. When you zoom out from the coordinate point, these symbols display around the coordinate point side by side. This font is installed when you install MapInfo Professional.
This symbol style is useful in several industries:
• Crime mapping: See multiple incidents at the same address and for traffic incident analysis
• Insurance: See multiple policy holders, policies, claims, or inspection requirements at the same address
• Wireless telecom: See multiple assets on the same mast/tower
• Health care: See multiple incidents at the same address
• Retail: See multiple attributes of a retail store, for example what internal franchised departments it contains or specific services that it offers.
• For specific instructions, see Displaying Overlapping Symbols in the Help System.
Working with Text on the Map Although the labeling feature takes care of most of your text needs, you will still need to create text objects with the Text tool to annotate your map or layout (for example, map titles and subtitles). Unlike labels, text objects have no connection to data.
To create text, make sure the layer you want to draw the text to is editable and choose the Text tool. The cursor changes to an I-beam. Place the cursor where you want the text to be and type in the text you want.
To enter text onto a map:
1. Click the Text button in the Drawing toolbar. The cursor turns into an I-beam when moved over the active window.
2. Click the cursor at the place on the map, layout, or data displayed in the Browser window where you want to enter the text. A blinking cursor appears. In a Browser, press Tab to move to the next cell.
3. Type the desired text. The text will appear at the blinking cursor as you type.
4. When you want to move to a new line of text press Enter.
5. When you are finished entering text, press Esc or click the Select button in the Main toolbar and click the mouse somewhere else on the Map or Layout.
Note: The font used is the current font, as indicated in Options > Text Style.
Editing Objects
288 MapInfo Professional v. 9.0
To change the style of the text:
1. Select the text with the Select tool.
2. Do one of the following:
• Click the Text Style button in the Drawing toolbar
• Choose Options > Text Style
Using either method, the Text Style dialog box displays where you can change the font, the size, color and create various effects such as haloing or drop shadows.
These settings will remain in effect for any text you subsequently draw on the map until you change them.
3. To save changes, on the File menu, click Save. To save objects drawn to the Cosmetic Layer, on the Map menu, click Save Cosmetic Objects.
Editing ObjectsIn all likelihood, you will need to change or edit some of the objects you have drawn or mapped. To begin this process, you need to make the layer that you want to change editable (on the Map menu, click Layer Control).
To edit an object:
1. Select the object with the Select tool.
If the object is a line, edit handles appear at either endpoint.
If the object is a boundary or region, edit handles appear at the outer corners of the object.
2. Drag the object to a new position or change its line style, fill pattern, or symbol.
3. On the File menu, click Save to save your changes.
To delete an object:
1. Click the object with the Select tool.
2. Do one of the following:
• On the Edit menu, click Clear or on the Edit menu, click Cut.• Press the Delete key.
Using either method, MapInfo Professional deletes the object. To view an object’s nodes, centroids, and line direction when editing and drawing, set the conditions in the (Layer Control) Display Options dialog box.
Chapter 8: Drawing and Editing Objects
User Guide 289
Positioning and Sizing your Map ObjectsTo move an object to a new location, make the object’s layer editable and click the object to select it. Hold down the mouse button for at least one second until the cursor turns into a four-headed arrow. Drag the object to its new location and release the button. The object maintains its shape.
To move an object (in an editable layer) one pixel at a time, click it and press and hold the Ctrl key and press the Arrow button corresponding to the direction you want the object to move. To move the object 10 pixels at a time, press and hold the Ctrl and Shift keys and press the Arrow button corresponding to the direction you want the object to move.
Also, if you click the on the fifth edit handle (rotate handle) and hold down the mouse button, you can rotate the highlighted box to the desired angle. A rubber banding box is drawn representing the bounds of the rotated object. If you press and hold Shift key while the rubber banding box is being drawn, the rotation will be limited to 45 degree increments.
Moving Objects on the Map
You can move selected objects within its editable map layer easily.
To move an object on the map:
1. Click your map to make it active.
2. Make the layer where the object is located editable (on the Map menu, click Layer Control).
3. Select the object(s) using the Select tool.
If you select more than one object at a time to move, the objects move in the same way. Take care to ensure that you do not move an object off the map or off land by mistake.
Note: When you move the objects, you move them all at once, maintaining their positions relative to one another.
4. Do one or all of the following:
• To move the selected object(s) using the mouse, hold down the mouse button and drag the object to its new location
• To move the selected object(s) one screen pixel at a time, press and hold the Ctrl key and press the Arrow key in the direction you want the object(s) to move
• To move the selected object(s) 10 screen pixels at a time, press and hold the Ctrl and Shift keys and press the Arrow key in the direction you want the object(s) to move
Note: Since the moves are made in screen pixels, the zoom level affects how far the object is moved.
Offsetting Objects on the Map
The Offset feature makes a copy of the object(s) you select from the original source object(s) and saves them in the original data file.
You can both move and offset the objects you select using this process. The difference between these two operations is whether MapInfo Professional makes a copy of the data (as in the case of copy) or simply moves the objects and stores the new value in the original table.
Editing Objects
290 MapInfo Professional v. 9.0
To move/offset selected objects on the map:
1. Click your map to make it active.
2. Make sure a layer is editable (on the Map menu, click Layer Control).
The offset/move functionality is available when any layer is editable, not just when the objects you want to move or offset are in the editable layer. However, you can only move an object within its editable layer. Copy is always permitted as long as a layer is editable.
3. Select the object(s) using the Select tool.
4. On the Objects menu, click Offset to display the Offset Objects dialog box.
5. To move your selected objects, enter or select from the following options and click OK to apply the changes. To copy your selected objects to offset them, enter or select from the following options and click Next. Then go to step 6.
• Angle — To offset your selected object at an angle, type the angle (in degrees) in this field. The new object is created based on the original object and is offset in the direction of the angle you specified, measured from the positive X-axis. If you enter a positive angle, the object is offset counterclockwise; if you enter a negative angle, the object is offset clockwise.
• Distance/Units — To set the offset distance and units, type the distance and select the units in the Distance box. The list of units is as follows: inches, links, feet, U.S. Survey feet, yards, rods, chains, miles, nautical miles, millimeters, centimeters, meters, and kilometers.
Note: MapInfo Professional takes the default units from the map window in which you've selected the object.
• Create Copy — Click this option to create a copy of the selected object(s) in the data. When you complete this process, MapInfo Professional saves the copy to the editable layer.
• Move Objects — Click this option to move the object without creating a copy in the data. You can only move an object within its own editable layer. When you move objects, the Data Aggregation dialog box does not display, since you are only moving the data within the layer.
Chapter 8: Drawing and Editing Objects
User Guide 291
• Copy or Move Distance Using — The option you select in this box depends largely upon the projection of your source map. If your map has a latitude/longitude projection, MapInfo Professional enables the Spherical type only. If you are working with a non-Earth projection, MapInfo Professional enables the Cartesian type only.
When you click Spherical, MapInfo Professional calculates the copy/move distance by mapping the data into a Latitude/Longitude On Earth projection.
When you click Cartesian, MapInfo Professional calculates the copy/move distance by considering the data to be projected to a flat surface and distances are measured using Cartesian distance calculations.
6. The Data Aggregation dialog box displays if one of these conditions are true:
• You clicked the Create Copy option
• You selected objects in a different table from the table associated with the editable layer
• The editable layer is not the cosmetic layer and has no text associated with the geographical objects in it
You may notice that the only controls available to you in this dialog box are Blank, Value, and No Data.
Type a value you will remember in the Value field of this dialog box. For more information about data aggregation, see Aggregating and Disaggregating Data in Chapter 11 on page 387.
7. Click OK to copy the data and offset the objects you selected.
Rotating Objects on the Map
To rotate an object or objects by a specific angle, use the Rotate Objects tool, which is available whenever you have selected an object(s) in an editable layer in a Map or Layout window.
To rotate an object or objects in a Map or Layout window:
1. On your editable layer, select the object(s) you want to rotate.
2. On the Objects menu, click Rotate to display the Rotate Objects dialog box.
3. In this dialog box, you specify the angle and the anchor point of the rotation. Type the rotation angle in the Rotation field.
Note: The rotation angle can be positive (counter clockwise) or negative (clockwise).
1
Editing Objects
292 MapInfo Professional v. 9.0
4. Determine the anchor point by doing one of the following:
• Accept the default anchor point of the selected object(s) by leaving the X and Y coordinates that display in these field as they are
Note: The default anchor point varies depending upon how many objects you have selected and the kind of objects they are. See Understanding an Object’s Default Anchor Point on page 292 for more about default anchor points.
• Type new entries in the X and Y coordinate fields to select a new anchor point
• Click the Pick from Map button and click the anchor point you want on the Map or Layout window. Click the mouse button only once to establish this point.
Note: When the Pick from Map button is disabled, you can select locations directly from the open map. If a map is not open, you can select another tool (like the Select tool) and use that tool instead of the Pick from Map functionality.
To return to the default anchor point, click the Reset Anchor button.
5. Decide whether or not you want to lock the anchor point. Click the Lock Anchor Point Position check box to lock the anchor point.
When you lock the anchor point, you ensure that the anchor point will not be recalculated when you return to the Map or Layout window. If you do not lock the anchor point, MapInfo Professional recalculates the anchor point in the based on the rotated selection. Once the objects are rotated, they may have a different anchor point.
Note: You cannot maintain an anchor point lock when you change the selection from the Map window to the Layout window or from the Layout to the Map window.
6. When you have completed these entries or selections, click OK to rotate your object(s).
Understanding an Object’s Default Anchor Point
When rotating objects in an editable layer, the default anchor varies depending upon how many objects you are rotating and the kind of objects you select. If you select:
• A single object (not a polyline), the default anchor point is the object's centroid• A single polyline or several objects, the default anchor point is the center of the polyline’s or the
selected objects minimum bounding rectangle (MBR)• Multiple objects, the default anchor point is the center of the MBR of the selected objects
Changing your Map Object AttributesWhen you double-click a region, line, point or text object with the Select tool, MapInfo Professional displays an Object Attribute dialog box. This dialog box gives you the object’s size, its position, and other information specific to the object.
For example, if you double-click a region, MapInfo Professional displays the perimeter, centroid, and area. It also shows the type of distance calculation that was used to obtain these values.
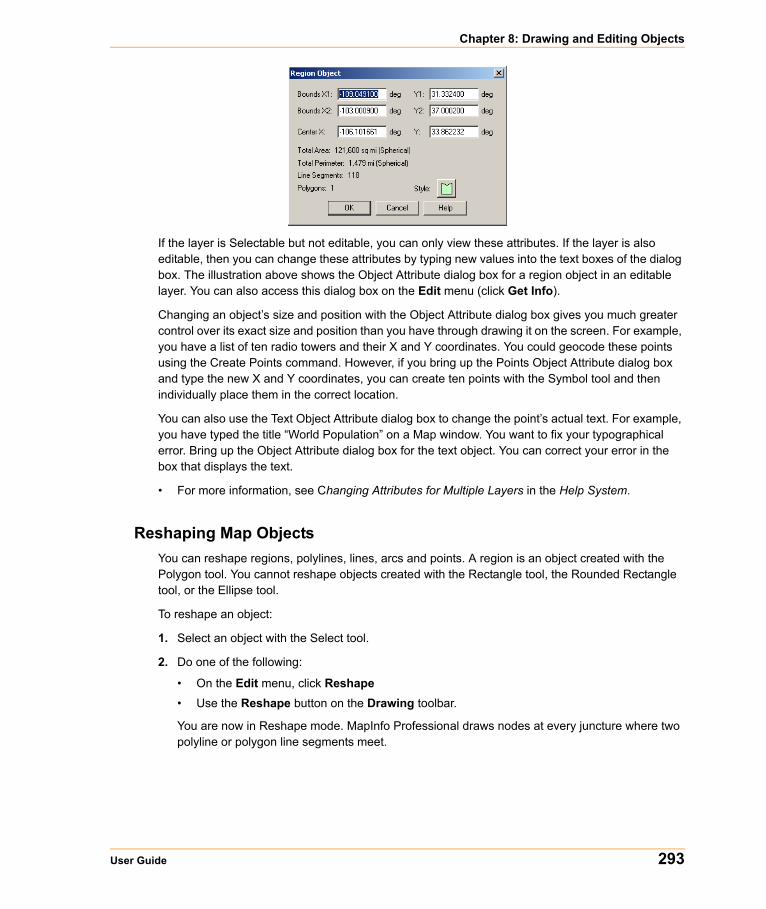
Chapter 8: Drawing and Editing Objects
User Guide 293
If the layer is Selectable but not editable, you can only view these attributes. If the layer is also editable, then you can change these attributes by typing new values into the text boxes of the dialog box. The illustration above shows the Object Attribute dialog box for a region object in an editable layer. You can also access this dialog box on the Edit menu (click Get Info).
Changing an object’s size and position with the Object Attribute dialog box gives you much greater control over its exact size and position than you have through drawing it on the screen. For example, you have a list of ten radio towers and their X and Y coordinates. You could geocode these points using the Create Points command. However, if you bring up the Points Object Attribute dialog box and type the new X and Y coordinates, you can create ten points with the Symbol tool and then individually place them in the correct location.
You can also use the Text Object Attribute dialog box to change the point’s actual text. For example, you have typed the title “World Population” on a Map window. You want to fix your typographical error. Bring up the Object Attribute dialog box for the text object. You can correct your error in the box that displays the text.
• For more information, see Changing Attributes for Multiple Layers in the Help System.
Reshaping Map ObjectsYou can reshape regions, polylines, lines, arcs and points. A region is an object created with the Polygon tool. You cannot reshape objects created with the Rectangle tool, the Rounded Rectangle tool, or the Ellipse tool.
To reshape an object:
1. Select an object with the Select tool.
2. Do one of the following:
• On the Edit menu, click Reshape• Use the Reshape button on the Drawing toolbar.
You are now in Reshape mode. MapInfo Professional draws nodes at every juncture where two polyline or polygon line segments meet.
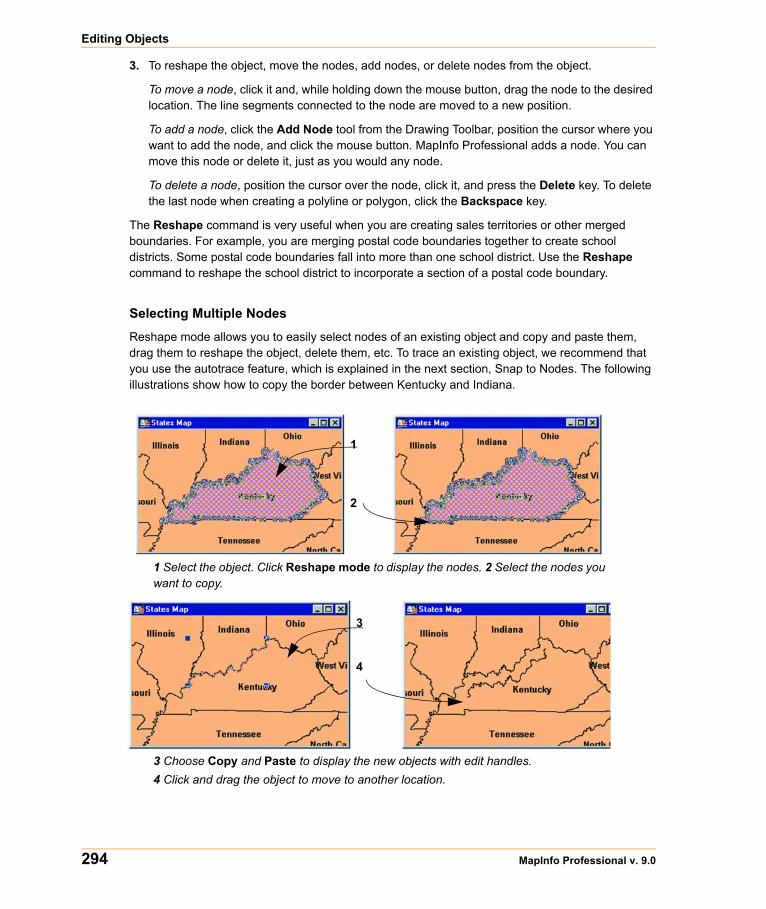
Editing Objects
294 MapInfo Professional v. 9.0
3. To reshape the object, move the nodes, add nodes, or delete nodes from the object.
To move a node, click it and, while holding down the mouse button, drag the node to the desired location. The line segments connected to the node are moved to a new position.
To add a node, click the Add Node tool from the Drawing Toolbar, position the cursor where you want to add the node, and click the mouse button. MapInfo Professional adds a node. You can move this node or delete it, just as you would any node.
To delete a node, position the cursor over the node, click it, and press the Delete key. To delete the last node when creating a polyline or polygon, click the Backspace key.
The Reshape command is very useful when you are creating sales territories or other merged boundaries. For example, you are merging postal code boundaries together to create school districts. Some postal code boundaries fall into more than one school district. Use the Reshape command to reshape the school district to incorporate a section of a postal code boundary.
Selecting Multiple Nodes
Reshape mode allows you to easily select nodes of an existing object and copy and paste them, drag them to reshape the object, delete them, etc. To trace an existing object, we recommend that you use the autotrace feature, which is explained in the next section, Snap to Nodes. The following illustrations show how to copy the border between Kentucky and Indiana.
1 Select the object. Click Reshape mode to display the nodes. 2 Select the nodes you want to copy.
3 Choose Copy and Paste to display the new objects with edit handles.4 Click and drag the object to move to another location.
1
2
3
4
Chapter 8: Drawing and Editing Objects
User Guide 295
To reshape an object (such as the state of Kentucky):
1. Select Kentucky to enable Reshape mode.
2. Select the first node with the Select tool. Shift-click the last node to be copied. MapInfo Professional selects all nodes between following the shortest route. (To select all nodes except those between the shortest distance, use Ctrl-click with the Select tool.)
3. On the Edit menu, click Copy to copy the nodes to the clipboard.
4. Paste the duplicate nodes onto the map. On the File menu, click Paste. The object you copied is drawn on top of the original object as a polyline.
5. To move the polyline click it and drag the polyline to a new location.
Using “Snap To” to Select Nodes and CentroidsYou can use nodes to reshape an object and align objects with each another. MapInfo Professional refers to this process as snapping to a node. In the Map window, regions, polylines, lines, arcs and rectangles all have nodes that can be attached (or snapped) to each other. When the Snap mode is enabled, MapInfo Professional searches for nodes and centroids as you move around a window. MapInfo Professional automatically snaps the cursor to a node or centroid when the cursor comes within the snap tolerance of the node. The crosshairs display when the node is “snapped to”.
Note: You can also use the snap to capability to snap to visible centroids in region objects.
To toggle Snap to Nodes, press the S key. The Status Bar displays with the word “SNAP” when Snap mode is activated. When you activate the Snap mode, a circle displays around your cursor showing the size of the tolerance of the Snap mode in pixels. The S key acts like a toggle on/off switch. You can set the snap tolerance in pixels in the Map Window Preferences dialog box. The Snap Tolerance field allows you to specify a tolerance. If you set the snap tolerance to 3 pixels, whenever you move the cursor within 3 pixels of a node, the cursor will snap to the node.
Snap mode works in the Map Window and Layout window (but not raster layers). It works with all MapInfo Professional tools in the Main and Drawing toolbars except Pan, Drag Map, and Text tool. Additionally, snap mode works on object types, including regions, points, multipoints, collection objects, lines and polylines, rectangles, and arcs. It is not available for text objects, ellipses, and rounded rectangles. You set the Snap in one window at a time and can save it with your workspace.
Snap to Nodes applies to all selectable layers—this is useful if you are drawing an object in one layer and want to attach it to an object in another layer. If you do not want to snap to objects in certain layers, make those layers unselectable.
Snap and Thin Settings Saved in Metadata
The Snap and Thin settings remove self-intersections and overlaps in your data based on values you establish. When you complete your selections and entries in the Set Values for Node Snap & Thinning dialog box, MapInfo Professional saves these values to the table’s metadata. This allows the Snap and Thin changes to be retrieved after the table is saved or you have left MapInfo Professional.
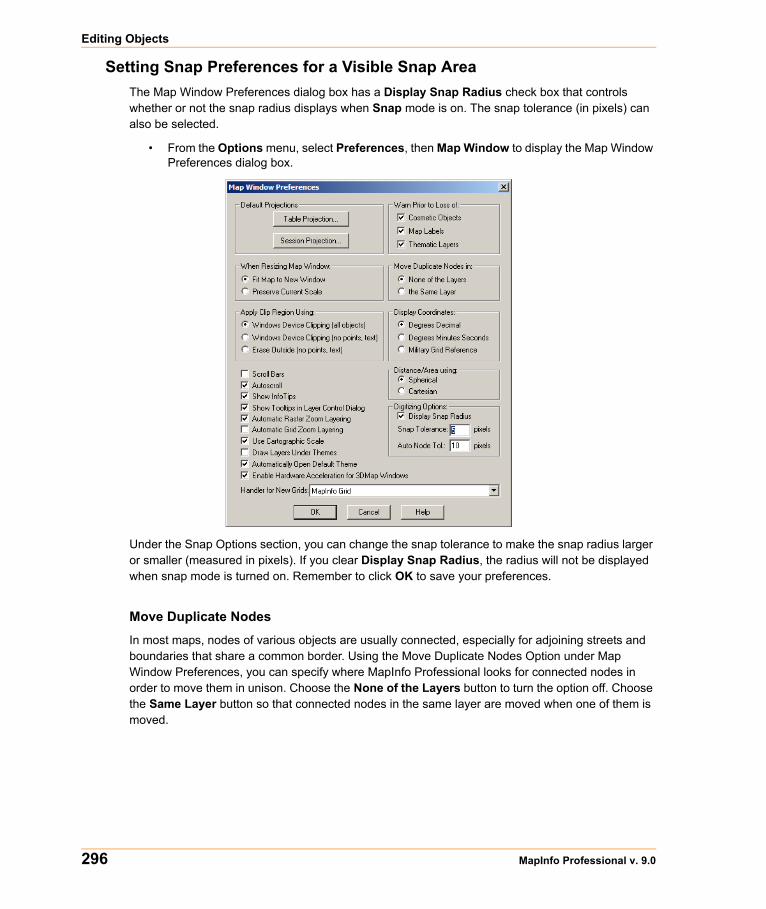
Editing Objects
296 MapInfo Professional v. 9.0
Setting Snap Preferences for a Visible Snap AreaThe Map Window Preferences dialog box has a Display Snap Radius check box that controls whether or not the snap radius displays when Snap mode is on. The snap tolerance (in pixels) can also be selected.
• From the Options menu, select Preferences, then Map Window to display the Map Window Preferences dialog box.
Under the Snap Options section, you can change the snap tolerance to make the snap radius larger or smaller (measured in pixels). If you clear Display Snap Radius, the radius will not be displayed when snap mode is turned on. Remember to click OK to save your preferences.
Move Duplicate Nodes
In most maps, nodes of various objects are usually connected, especially for adjoining streets and boundaries that share a common border. Using the Move Duplicate Nodes Option under Map Window Preferences, you can specify where MapInfo Professional looks for connected nodes in order to move them in unison. Choose the None of the Layers button to turn the option off. Choose the Same Layer button so that connected nodes in the same layer are moved when one of them is moved.
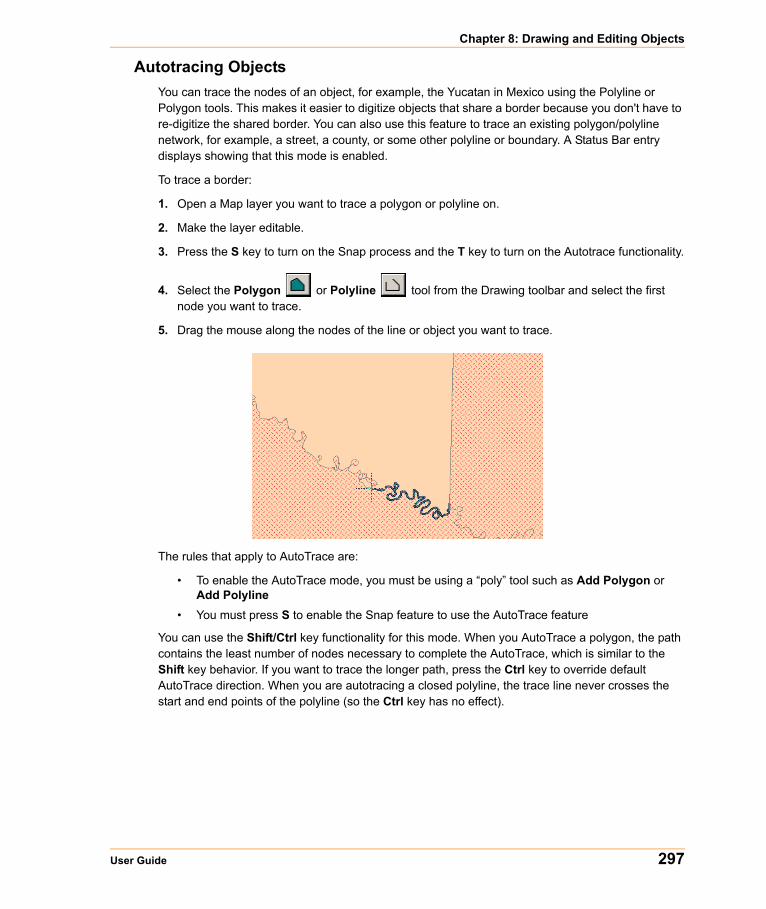
Chapter 8: Drawing and Editing Objects
User Guide 297
Autotracing ObjectsYou can trace the nodes of an object, for example, the Yucatan in Mexico using the Polyline or Polygon tools. This makes it easier to digitize objects that share a border because you don't have to re-digitize the shared border. You can also use this feature to trace an existing polygon/polyline network, for example, a street, a county, or some other polyline or boundary. A Status Bar entry displays showing that this mode is enabled.
To trace a border:
1. Open a Map layer you want to trace a polygon or polyline on.
2. Make the layer editable.
3. Press the S key to turn on the Snap process and the T key to turn on the Autotrace functionality.
4. Select the Polygon or Polyline tool from the Drawing toolbar and select the first node you want to trace.
5. Drag the mouse along the nodes of the line or object you want to trace.
The rules that apply to AutoTrace are:
• To enable the AutoTrace mode, you must be using a “poly” tool such as Add Polygon or Add Polyline
• You must press S to enable the Snap feature to use the AutoTrace feature
You can use the Shift/Ctrl key functionality for this mode. When you AutoTrace a polygon, the path contains the least number of nodes necessary to complete the AutoTrace, which is similar to the Shift key behavior. If you want to trace the longer path, press the Ctrl key to override default AutoTrace direction. When you are autotracing a closed polyline, the trace line never crosses the start and end points of the polyline (so the Ctrl key has no effect).
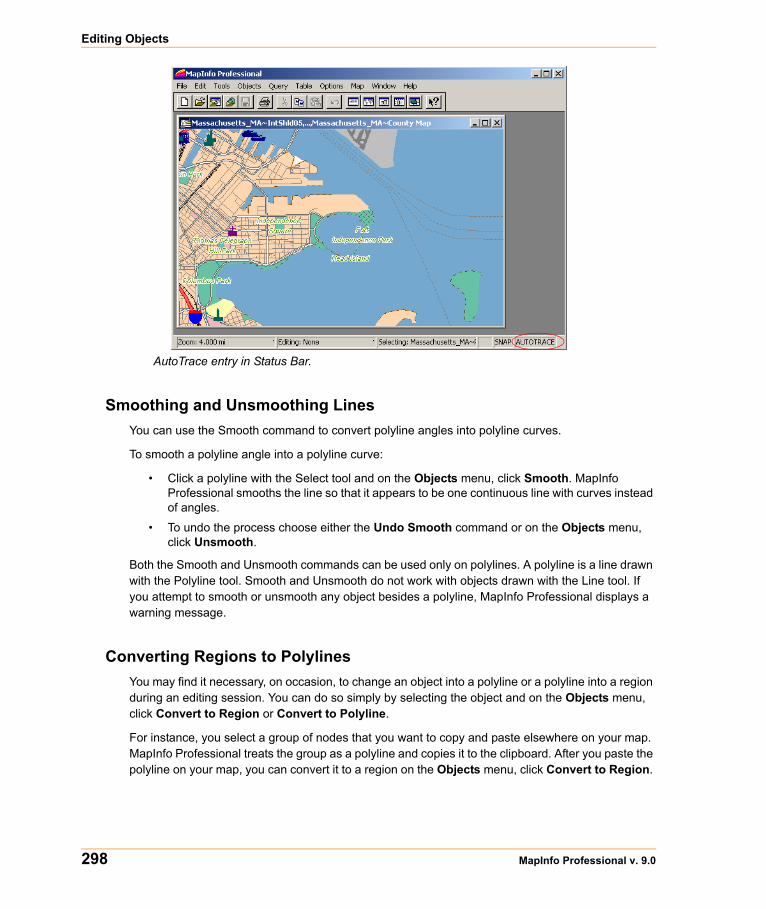
Editing Objects
298 MapInfo Professional v. 9.0
AutoTrace entry in Status Bar.
Smoothing and Unsmoothing LinesYou can use the Smooth command to convert polyline angles into polyline curves.
To smooth a polyline angle into a polyline curve:
• Click a polyline with the Select tool and on the Objects menu, click Smooth. MapInfo Professional smooths the line so that it appears to be one continuous line with curves instead of angles.
• To undo the process choose either the Undo Smooth command or on the Objects menu, click Unsmooth.
Both the Smooth and Unsmooth commands can be used only on polylines. A polyline is a line drawn with the Polyline tool. Smooth and Unsmooth do not work with objects drawn with the Line tool. If you attempt to smooth or unsmooth any object besides a polyline, MapInfo Professional displays a warning message.
Converting Regions to PolylinesYou may find it necessary, on occasion, to change an object into a polyline or a polyline into a region during an editing session. You can do so simply by selecting the object and on the Objects menu, click Convert to Region or Convert to Polyline.
For instance, you select a group of nodes that you want to copy and paste elsewhere on your map. MapInfo Professional treats the group as a polyline and copies it to the clipboard. After you paste the polyline on your map, you can convert it to a region on the Objects menu, click Convert to Region.
Chapter 8: Drawing and Editing Objects
User Guide 299
If you want to create a buffer zone within one mile of a boundary, meaning you want a zone that extends one mile from the boundary to the outside and to the inside, you must first convert the region to a polyline and then create the buffer. If you first create the buffer on the region, you will include too much territory in the buffer (the entire region in the buffer plus the one mile buffer that extends outside of the region).
Converting objects to polylines and regions allows you to perform node-editing operations on objects that ordinarily do not allow node editing. For example, you cannot add nodes to a rectangle object. If, however, you first convert the rectangle into a polyline or region, you can then add nodes to the object.
The Help System contains these related topics:
• Editing Street Maps (StreetPro)• Adding a Segment to an Existing Street • Adding a New Street• Renaming a Street• Editing Street Colors
Merging One Map into Another There are two ways to merge layers from one Map window to another:
1. You can use the Drag Map Window functionality to drag the layers of an existing Map window onto the another Map window. To see this method, see Merging Maps using the Drag Map Window Tool in the Help System.
2. You can copy the map layers you want from one map to the other in the Layer Control dialog box. To see this method, see Merging Maps from Layer Control in the Help System.
When you merge the layers from the source map on top of the destination map, the destination map settings take precedence. This means that the clip regions and coordinate systems, for example, are based on the settings in the destination map. If the destination map does not allow raster reprojection and the source map has a raster layer, the coordinate system of destination map could change.
Consider this example of a vector map and a raster map. Many times you want to add detail to a map by merging it with another open map. You can think of the map you are dragging or copying layers from as the source map.
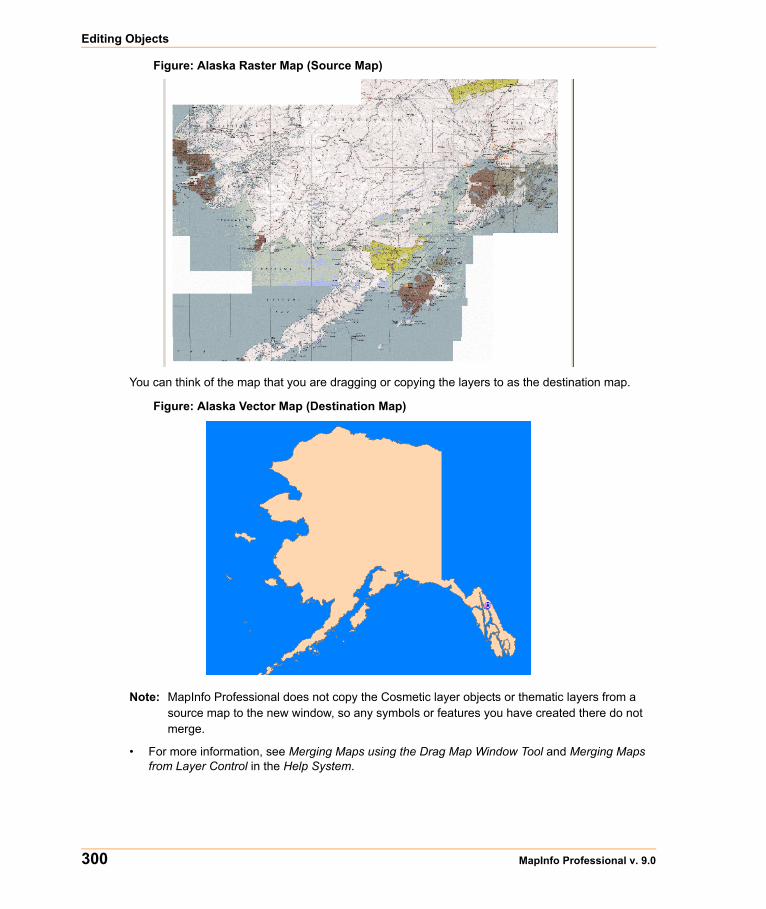
Editing Objects
300 MapInfo Professional v. 9.0
Figure: Alaska Raster Map (Source Map)
You can think of the map that you are dragging or copying the layers to as the destination map.
Figure: Alaska Vector Map (Destination Map)
Note: MapInfo Professional does not copy the Cosmetic layer objects or thematic layers from a source map to the new window, so any symbols or features you have created there do not merge.
• For more information, see Merging Maps using the Drag Map Window Tool and Merging Maps from Layer Control in the Help System.