Manoogian Task 5 Final Report
25
Fall 2015 1 LOYOLA MARYMOUNT UNIVERSITY The Renewal of the Tin Shed Building Santa Barbara, CA Final draft design report Loyola Marymount University Bader Alghunaim November 30, 2015 Civil 305: Structural Analysis
-
Upload
bader-alghunaim -
Category
Documents
-
view
231 -
download
0
Transcript of Manoogian Task 5 Final Report

Fall 2015
1
LOYOLA MARYMOUNT UNIVERSITY
The Renewal of the Tin Shed Building
Santa Barbara, CA
Final draft design report
Loyola Marymount University
Bader Alghunaim
November 30, 2015
Civil 305: Structural Analysis

Fall 2015
2
LOYOLA MARYMOUNT UNIVERSITY
Department of Civil Engineering and Environmental Science
Loyola Marymount University
1 LMU Drive
Los Angeles, CA 90045
Dear Dr. Manoogian,
Final Report of the Tin Shed Building
I have pleasure in submitting the enclosed final report of my structural project. This report satisfies the requirements and instructions you provided. Enclosed is the primary design report and recommendations for the project.
Included in this report is: background information on Santa Barbara’s building codes, the purpose of the building, the building’s design loads, the girder and column layout, the tributary load maps, and the beam and column selections.
It has been a great experience to work on this project. I am glad to say that my structural analysis of the Tin Shed building fulfills the reports requirements. Please review this report and contact me with your questions, comments and concerns so as to proceed to the final stage of the construction of the Tin Shed.
Sincerely,
Bader Alghunaim
Civil Engineering Associate

Fall 2015
3
Table of Contents
1. Introduction 1.1. Background……………………………………………………….4
1.2. Purpose…………………………………………………………….4
2. Design Loads 2.1. Assumptions……………………………………………………….8
2.2. Load Table………………………………………………………...10
2.3. Worst Case LRFD Load Combination Table………..…………….10
2.4. Material Selection………………………………………………….10
3. Tributary Loads 3.1. Column and Girder Layout………………………………...……….11
3.2. Tributary Load Maps……………………………………………….12
3.3. Tributary Load Tables…………………………………………..….15
4. Beam Selections 4.1. Beam Selections For EW Girders………………………………….18
4.2. Beam Selections for NS Girders……………………………………19
4.3. Column Selections……………………………….………………….20
4.4. Column and Girder Layout with Beam Selections………………….21 5. Appendix
5.1. Calculations……………………………….…………………..…….22
5.2. LRFD Load Combination Table………………….………………….24 6. References……………………………….…………………………….25

Fall 2015
4
1. Introduction: 1.1. Background: The new tin shed will be a redesigned version of the previous Engineering Design Center. This new structure will consist mostly of a single floor for machining and material processing, as well as a small second story for light storage. This new design center will replace the previous one located at: 1230 Garden Street, Santa Barbara, CA, 93101
Figure 1: Geographic map of the location of the Engineering Design Center
The new design center will be built with the dimensions 100’ W x 40’L x 30’H, identical to the previous design center dimensions. The newly added second floor will be 50’W x 40’L x 12’H, and will be situated above the machining area. The new design center will be built in Santa Barbara, therefore industry code for standard rain, wind and seismic conditions should be applied. An emphasis on earthquake conditions should be taken into account during construction, since the location is prone to earthquakes. Snow conditions should be ignored, as the area is not prone to snowfall.
1.2. Purpose:
The new design of the Engineering Design Center, nicknamed the “Tin Shed” by students, will create a more student friendly environment with a storage space on a second floor above the machining area. This storage space on the second floor creates a space for the students to work and utilize the machinery in place. The original design did not account for a separate floor for storage and was therefore not as efficiently organized. The new design center will be divided into

Fall 2015
5
three sections. The first half of the first floor will be the student work area, the second half of the first floor will be the machining area, and the third section will be the second floor storage area. Figures 2, 3, 4, 5, 6, and 7 show the skeletal drawing, exterior views, and floor plans of the building.
Figure 2: Skeletal Drawing for new design
Figure 3: Top view of new design

Fall 2015
6
Figure 4: Exterior view of new design
Figure 5: Exterior view with wall removed

Fall 2015
7
Figure 6: 2nd Floor floorplan
Figure 7: 1st Floor floorplan

Fall 2015
8
2. Design Loads: 2.1. Assumptions
The location for the New Design Center is Santa Barbara. The primary sources for the loads on the building are the IBC 2012 and ASCE 7-10. These sources will help determine the minimum design loads caused by the wind, seismic, rain, dead, and live loads acting on the building. The Design Center will be designed as a Risk Category 3, fully exposed, Exposure Category B, Terrain Category B, fully enclosed building. The loads applied to each floor are uniform.
Dead Loads (D)
The dead load assumed for the roof is 60 psf. This assumption was made after calculating the weight of the roof itself and adding it to the weight of the ceiling. Assuming a 4inch thick concrete slab (with 9.6 pounds per square foot per inch of thickness), a steel deck, steel joists, insulation, and a bituminous smooth surface membrane; the roof is calculated to weigh 50.9psf (ASCE 7-10, C3-1). The remaining dead loads are from the ceiling. Assuming a suspended steel channel system, acoustical tile, lights and ducting, the remaining dead load is calculated to 8 psf (ASCE 7-10, C3-1). The total dead load is calculated to be 58.9 psf. This number was then rounded up to 60psf. See Appendix for calculations.
The dead load assumed for the 2nd floor is 60 psf. This assumption was made after calculating the weight of the 2nd floor itself and adding it to the weight of the ceiling. Assuming a 4inch thick concrete slab (with 9.6 pounds per square foot per inch of thickness), a steel deck, steel joists, carpeting and padding; the 2nd floor is calculated to weigh 49.4psf (ASCE 7-10, C3-1). The remaining dead loads are from the ceiling. Assuming a suspended steel channel system, acoustical tile, lights and ducting, the remaining dead load is calculated to 8 psf (ASCE 7-10, C3-1). The total dead load is calculated to be 57.4 psf. This number was then rounded up to 60psf. See Appendix for calculations.
Live Loads (L)
The live load for the 2nd floor is assumed to be 125psf. This is the industry standard loading for light storage areas (IBC 2012, Table 4-1). The live load for the roof is assumed to be 0psf. This is under the assumption that there will be no consistent live loads on the roof.
Roof Live Loads (𝑳𝑹)
The roof live load is assumed to be 20psf. This is the industry standard minimum design load for all roofs (IBC 2012).

Fall 2015
9
Rain Loads (R)
The flow rate is dependent of the area of the building and the rain intensity (i), which was taken form Figure 1611.1 to be 3 in/hr. The total area (A) of the roof is 4000𝑓𝑡!. Implementing a two-drain system, the area served by each drain will then be 2000 𝑓𝑡!. Therefore flow rate (Q) of rain was calculated to be 62.4 gpm. Assuming 4 inch drain diameters and using table 2.5 (Mike 11), dh=1’’ A ds of 2’’ was then assumed and the rain load was calculated to be 15.6psf. See Appendix for calculations.
Rain loads on the 2nd floor are assumed to be 0psf since the design center is a fully enclosed building.
Snow Loads (S)
Snow Loads on the roof were calculated to be 0 psf. For snow loads, the snow importance factor 𝐼!, exposure factor 𝐶!, thermal factor 𝐶!, and ground snow load 𝑝! are all required to calculate snow load (S). The design center is assumed to be a risk category 3 building and will therefore have an 𝐼!of 1.1 (ASCE 7-10 1.5-2). It is also assumed to be a Category B fully exposed building and will therefore have a 𝐶!of 0.9 (ASCE 7-10, Table 7-2). Since the structure is heated and is not a greenhouse, its 𝐶!is 1.0 (ASCE 7-10, Table 7-3). As for the ground snow loads, since Santa Barbara has an elevation of 3ft above sea level (far below 1500 ft) 𝑝!=0 (IBC 2012). When all of these factors are taken into consideration the assumed snow load is calculated to be 0psf. Calculations in Appendix
Snow loads on the 2nd floor are assumed to be 0psf since the design center is a fully enclosed building.
Wind Loads (W)
The wind loads were calculated to be 25.8psf. In order to calculate this load the wind speed of Santa Barbara was determined to be 115mph (IBC 2012, Figure 1609B). The topographical factor (𝑘!") was assumed to be 1.0 since the design center was built on flat land. And k1 and k2 were taken from ASCE 27.3.1 to be 0.6 and 0.7 respectively. With all of these assumptions taken into consideration, the calculated wind load was 25.8psf.
Wind loads on the 2nd floor are assumed to be 0psf since the design center is a fully enclosed building.
Earthquake Loads (E)
The seismic/earthquake loads were assumed to be 10psf. These values were given.

Fall 2015
10
2.2. Load Table
Table 1, below, presents the calculated loads given by dead (D), live (L), live roof (𝐿!), rain(R), snow (S), wind (W), and seismic stresses (E). Calculations can be found in the Appendix (section 5.1).
Table 1: Load Table
Load 2nd Floor (psf) Roof (psf) Source D 60 60 ASCE 7-‐10, Table C3-‐
1 L 125 0 IBC 2012, pg19,
Table 4-‐1 Lr 0 20 IBC 2012, pg 333 R 0 15.6 IBC 2012, pg 360 S 0 0 ASCE 7-‐10, 29-‐34 W 0 25.8
ASCE 7-‐10, 27.3.1,pg
261 IBC Figure 1609B pg
351 E 10 10 Given
2.3. Worst Case LRFD Load Combination Table
Table 2, below, uses the highest valued combination of the values in Table 1 to predict the LRFD worst-case load combination for both the roof and 2nd floor. Calculations can be found in the Appendix (section 5.2).
Table 2: Worst Case Scenario LRFD Table
Floor Design Load (psf) Roof 116.9
2nd Floor 272
2.4. Material Selection
The material used for this building are Wide-flange Steel beams, and columns made out of Structural Steel, ASTM A529 Grade 50, Yield Stress of 50,000 lb/in2

Fall 2015
11
3. Tributary Loads 3.1. Column and Girder Layout
The column and girder layouts for the roof and 2nd floor can be seen in frame format in Figures 8 and 9, respectively. Each column is 1ft by 1ft. Girders in the North-South direction are 20 ft long, and girders in the East-West direction are 25 ft long.
Figure 8: Frame of Roof
Figure 9: Frame of 2nd Floor

Fall 2015
12
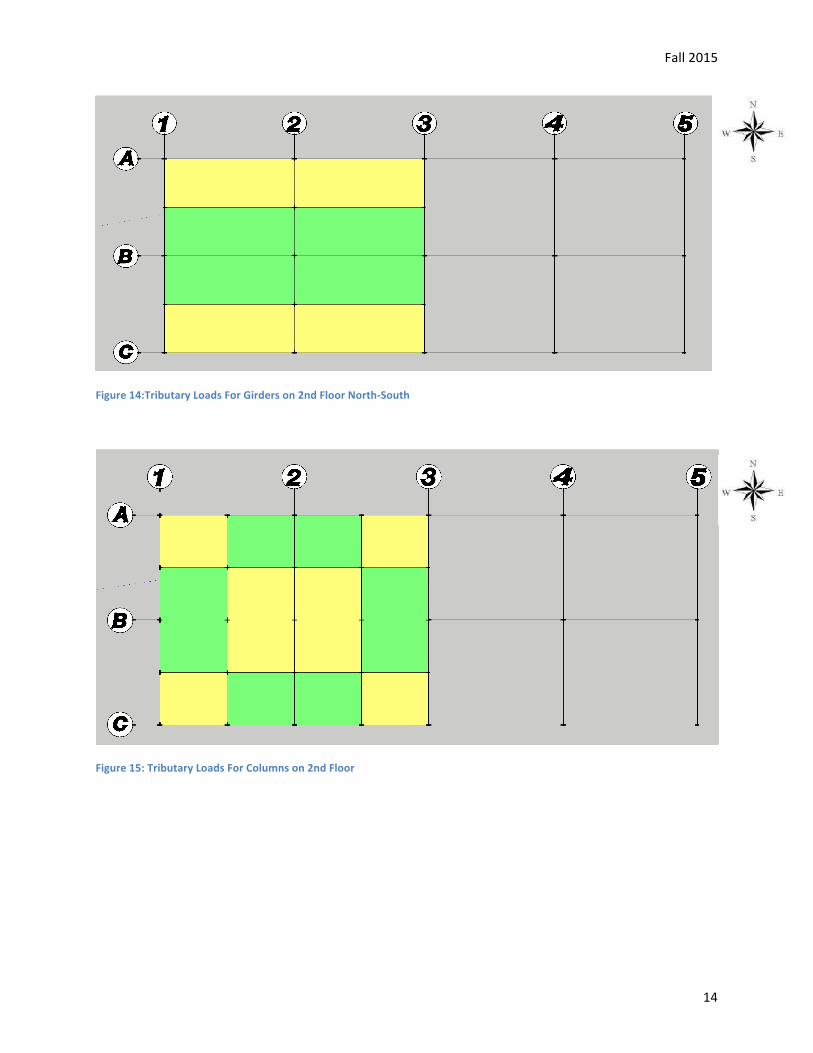
3.2. Tributary Load Maps This section contains the tributary load maps. Figures 10 and 11 show the tributary loads on the EW and NS girders on the roof respectively. Figure 12 shows the tributary loads on the columns of the roof. The 2nd floor tributary girder load maps are shown in figures 13 and 14, and the 2nd floor tributary load map for the columns is shown in figure 15.
Figure 10:Tributary Load For Girders on Roof East-‐West
Figure 11:Tributary Loads For Girders on Roof North-‐South

Fall 2015
13
Figure 12:Tributary Loads For Columns on Roof
Figure 13: Tributary Loads For Girders on 2nd Floor East-‐West
Fall 2015
14
Figure 14:Tributary Loads For Girders on 2nd Floor North-‐South
Figure 15: Tributary Loads For Columns on 2nd Floor

Fall 2015
15
3.3. Tributary Load Tables
The implemented design load combination for the 272psf for the 2nd floor and 116.9psf for the roof. The implemented load combinations take into account the live, dead, snow, wind, earthquake and rain loads acting on the building. Tables 3 and 4 depict the tributary load effect on the EW girders on the roof and second floor respectively. Tables 5 and 6 show the tributary load effect on the NS girders on the roof and second floor respectively. These four tables show the calculated weight and moment due to the tributary load on each girder. Table 7 shows the force on each column due to the tributary loads.
Table 3: Tributary Loads For EW Girders on Roof
Design Load
Length Weight Moment
Girder (kip/ft^2)
(ft) (kips/ft) (kips-‐ft)
A1B1 0.1169
20 1.46 73.1
A2B2 0.1169
20 2.92 146
A3B3 0.1169
20 2.92 146
A4B4 0.1169
20 2.92 146
A5B5 0.1169
20 1.46 73.1
B1C1 0.1169
20 1.46 73.1
B2C2 0.1169
20 2.92 146
B3C3 0.1169
20 2.92 146
B4C4 0.1169
20 2.92 146
B5C5 0.1169
20 1.46 73.1

Fall 2015
16
Table 4: Tributary Loads for EW Girders on 2nd Floor
Design Load Length Weight Moment
Girder (kip/ft^2) (ft) (kips/ft) (kips-‐ft)
A1B1 0.272 20 3.4 170
A2B2 0.272 20 6.8 340
A3B3 0.272 20 3.4 170
B1C1 0.272 20 3.4 170
B2C2 0.272 20 6.8 340
B3C3 0.272 20 3.4 170
Table 5: Tributary Load Table for NS Girders on Roof
Design Load Length Weight Moment
Girder (kip/ft^2) (ft) (kips/ft) (kips-‐ft)
A12 0.1169 25 1.169 91.3
A23 0.1169 25 1.169 91.3
A34 0.1169 25 1.169 91.3
A45 0.1169 25 1.169 91.3
B12 0.1169 25 2.338 183
B23 0.1169 25 2.338 183
B34 0.1169 25 2.338 183
B45 0.1169 25 2.338 183
C12 0.1169 25 1.169 91.3
C23 0.1169 25 1.169 91.3
C34 0.1169 25 1.169 91.3
C45 0.1169 25 1.169 91.3

Fall 2015
17
Table 6: Tributary Loads for NS Girders on 2nd Floor
Girder Design Load
Length Weight Moment
(kip/ft^2)
(ft) (kips/ft) (kips-‐ft)
A12 0.272
25 2.72 213
A23 0.272
25 2.72 213
B12 0.272
25 5.44 425
B23 0.272
25 5.44 425
C12 0.272
25 2.72 213
C23 0.272
25 2.72 213
Table 7: Tributary Loads on Columns
Columns Pr (kips) Ps(kips) Pt(kips) Eff. Length (ft)
A1 14.6 34 48.6 18
A2 29.2 68 97.2 18
A3 29.2 34 63.2 18
A4 29.2 0 29.2 30
A5 14.6 0 14.6 30
B1 29.2 68 97.2 18
B2 58.4 136 194.4 18
B3 58.4 68 126.4 18
B4 58.4 0 58.4 30
B5 29.2 0 29.2 30
C1 14.6 34 48.6 18
C2 29.2 68 97.2 18

Fall 2015
18
C3 29.2 34 63.2 18
C4 29.2 0 29.2 30
C5 14.6 0 14.6 30
4. Beam Selection 4.1. Beam Selections for EW Girders
Using the calculated moments from the previous section, beams were selected for the EW girders based on the moment due to the tributary load acting on the beams. The beams were selected using the AISC Steel Manual, 14th edition. Tables 8 and 9 show the beams selected for each girder, on the roof and second floor respectively, as well its maximum bending moment, moment of inertia, and maximum displacement due to the load acting on it.
Table 8: EW Beam Selection Table for Roof
Girder Length (ft)
Weight (kip/ft)
Selection Bending Moment (kips-‐ft)
E (ksi)
Moment of inertia (in^4)
Max Displacement
(in) A1B1 20 1.169 W12 x 16 75.4 29000 103 1.76 A2B2 20 1.169 W14 x 26 151 29000 245 1.48 A3B3 20 1.169 W14 x 26 151 29000 245 1.48 A4B4 20 1.169 W14 x 26 151 29000 245 1.48 A5B5 20 2.338 W12 x 16 75.4 29000 103 1.76 B1C1 20 2.338 W12 x 16 75.4 29000 103 1.76 B2C2 20 2.338 W14 x 26 151 29000 245 1.48 B3C3 20 2.338 W14 x 26 151 29000 245 1.48 B4C4 20 1.169 W14 x 26 151 29000 245 1.48 B5C5 20 1.169 W12 x 16 75.4 29000 103 1.76
Table 9: EW Beam Selection Table for 2nd Floor
Girder Length (ft)
Weight (kip/ft)
Selection Bending Moment (kips-‐ft)
E (ksi)
Moment of inertia (in^4)
Max Displacement
(in) A1B1 20 3.4 W14 x 30 177 29000 291 1.45 A2B2 20 6.8 W21 x 44 358 29000 843 1.00 A3B3 20 3.4 W14 x 30 177 29000 291 1.45 B1C1 20 3.4 W14 x 30 177 29000 291 1.45 B2C2 20 6.8 W21 x 44 358 29000 843 1.00 B3C3 20 3.4 W14 x 30 177 29000 291 1.45

Fall 2015
19
4.2. Beam Selections for NS Girders
Using the calculated moments from the previous section, beams were selected for the NS girders based on the moment due to the tributary load acting on the beams. The beams were selected using the AISC Steel Manual, 14th edition. Tables 10 and 11 show the beams selected for each girder, on the roof and second floor respectively, as well its maximum bending moment, moment of inertia, and maximum displacement due to the load acting on it.
Table 10: NS Beam Selection Table for Roof
Girder Length (ft)
Weight (kip/ft)
Selection Bending Moment (kips-‐ft)
E (ksi)
Moment of inertia (in^4)
Max Displacement
(in) A12 25 1.169 W12 x 19 92.6 29000 130 2.73 A23 25 1.169 W12 x 19 92.6 29000 130 2.73 A34 25 1.169 W12 x 19 92.6 29000 130 2.73 A45 25 1.169 W12 x 19 92.6 29000 130 2.73 B12 25 2.338 W16 x 31 203 29000 375 1.89 B23 25 2.338 W16 x 31 203 29000 375 1.89 B34 25 2.338 W16 x 31 203 29000 375 1.89 B45 25 2.338 W16 x 31 203 29000 375 1.89 C12 25 1.169 W12 x 19 92.6 29000 130 2.73 C23 25 1.169 W12 x 19 92.6 29000 130 2.73 C34 25 1.169 W12 x 19 92.6 29000 130 2.73 C45 25 1.169 W12 x 19 92.6 29000 130 2.73
Table 11: NS Beam Selection Table for 2nd Floor
Girder Length (ft)
Weight (kip/ft)
Selection Bending Moment (kips-‐ft)
E (ksi)
Moment of inertia (in^4)
Max Displacement
(in) A12 25 2.72 W18 x 35 249 29000 510 1.62 A23 25 2.72 W18 x 35 249 29000 510 1.62 B12 25 5.44 W21 x 55 473 29000 1330 1.24 B23 25 5.44 W21 x 55 473 29000 1330 1.24 C12 25 2.72 W18 x 35 249 29000 510 1.62 C23 25 2.72 W18 x 35 249 29000 510 1.62

Fall 2015
20
4.3. Column Selections
Using the calculated forces from the previous section, columns were. The beams were selected using the AISC Steel Manual, 14th edition. Table 12 shows the selected columns.
Table 12: Column Selections
Columns Pr (kips) Ps(kips) Pt(kips) Eff. Length (ft) Selection
A1 14.6 34 48.6 18 W8 x 31
A2 29.2 68 97.2 18 W8 x 31
A3 29.2 34 63.2 18 W8 x 31
A4 29.2 0 29.2 30 W8 x 31
A5 14.6 0 14.6 30 W8 x 31
B1 29.2 68 97.2 18 W8 x 31
B2 58.4 136 194.4 18 W8 x 35
B3 58.4 68 126.4 18 W8 x 31
B4 58.4 0 58.4 30 W8 x 31
B5 29.2 0 29.2 30 W8 x 31
C1 14.6 34 48.6 18 W8 x 31
C2 29.2 68 97.2 18 W8 x 31
C3 29.2 34 63.2 18 W8 x 31
C4 29.2 0 29.2 30 W8 x 31
C5 14.6 0 14.6 30 W8 x 31

Fall 2015
21
4.4. Column and Girder Layout with Beam Selections
Figures 16 and 17 show the girder layout with their selected beams for the roof and second floor respectively. Figure 18 shows the column layout with the selected columns.
Figure 16: Girder Layout for Roof with Labeled Girders
Figure 17: Girder Layout for 2nd Floor with Labeled Girders
Figure 18:Column Layout with labeled columns

Fall 2015
22
5. Appendix 5.1. Load Calculations
• Dead Loads:
♦ 𝑅𝑜𝑜𝑓 𝐷𝑒𝑎𝑑 𝐿𝑜𝑎𝑑 = 𝑅𝑜𝑜𝑓 𝑊𝑒𝑖𝑔ℎ𝑡 + 𝐶𝑒𝑖𝑙𝑖𝑛𝑔 𝑊𝑒𝑖𝑔ℎ𝑡 Ø Roof:
§ 4in thick concrete slab (9.6 psf per inch of thickness) § Steel deck = 5psf § Steel Joists = 5 psf § Insulation = 1 psf § Bituminous smooth surface membrane (1.5psf) § 𝑤𝑒𝑖𝑔ℎ𝑡 = 9.6 !"#
!"4𝑖𝑛 + 5𝑝𝑠𝑓 + 5𝑝𝑠𝑓 + 1𝑝𝑠𝑓 + 1.5𝑝𝑠𝑓
§ 𝑤𝑒𝑖𝑔ℎ𝑡 = 50.9𝑝𝑠𝑓 Ø Ceiling
§ Suspended steel channel system = 2 psf § Acoustic tile = 1 psf § Ducting = 4psf § Lighting = 1psf § 𝑤𝑒𝑖𝑔ℎ𝑡 = 2𝑝𝑠𝑓 + 1𝑝𝑠𝑓 + 4𝑝𝑠𝑓 + 1𝑝𝑠𝑓 § 𝑤𝑒𝑖𝑔ℎ𝑡 = 8𝑝𝑠𝑓
♦ 𝐷𝑒𝑎𝑑 𝐿𝑜𝑎𝑑 = 50.9𝑝𝑠𝑓 + 8𝑝𝑠𝑓 ♦ 𝐷𝑒𝑎𝑑 𝐿𝑜𝑎𝑑 = 58.9𝑝𝑠𝑓~60𝑝𝑠𝑓
• 2nd floor Dead Loads ♦ 𝐷𝑒𝑎𝑑 𝐿𝑜𝑎𝑑 = 2𝑛𝑑 𝐹𝑙𝑜𝑜𝑟 𝑊𝑒𝑖𝑔ℎ𝑡 + 𝐶𝑒𝑖𝑙𝑖𝑛𝑔 𝑊𝑒𝑖𝑔ℎ𝑡
Ø 2nd floor: § 4in thick concrete slab (9.6 psf per inch of thickness) § Steel deck = 5psf § Steel Joists = 5 psf § Carpeting and padding = 1 psf § 𝑤𝑒𝑖𝑔ℎ𝑡 = 9.6 !"#
!"4𝑖𝑛 + 5𝑝𝑠𝑓 + 5𝑝𝑠𝑓 + 1𝑝𝑠𝑓
§ 𝑤𝑒𝑖𝑔ℎ𝑡 = 49.4𝑝𝑠𝑓 Ø Ceiling
§ Suspended steel channel system = 2 psf § Acoustic tile = 1 psf § Ducting = 4psf § Lighting = 1psf § 𝑤𝑒𝑖𝑔ℎ𝑡 = 2𝑝𝑠𝑓 + 1𝑝𝑠𝑓 + 4𝑝𝑠𝑓 + 1𝑝𝑠𝑓 § 𝑤𝑒𝑖𝑔ℎ𝑡 = 8𝑝𝑠𝑓
♦ 𝐷𝑒𝑎𝑑 𝐿𝑜𝑎𝑑 = 49.4𝑝𝑠𝑓 + 8𝑝𝑠𝑓 ♦ 𝐷𝑒𝑎𝑑 𝐿𝑜𝑎𝑑 = 57.4𝑝𝑠𝑓~60𝑝𝑠𝑓
• Roof Live Loads: ♦ 𝐿! = 20𝑝𝑠𝑓
Ø Industry standard • Live Load Second Floor:
♦ Light storage

Fall 2015
23
♦ 𝐿 = 125 𝑝𝑠𝑓 • Rain Loads:
♦ 𝑄 = 0.0104𝐴𝑖 Ø A= Total area of roof =100!𝑥 40! = 4000 𝑓𝑡!
§ Implement 2 drain system § Area served by drain = 2000𝑓𝑡!
Ø 𝑖= rainfall intensity= 3 inches per hour ♦ 𝑄 = 0.0104(2000)(3) ♦ 𝑄 = 62.4 𝑔𝑝𝑚 ♦ Using Table 2.5 in notes, 𝑑! = 1𝑖𝑛, and assuming 4 inch diameter drain ♦ 𝑅 = 5.2(𝑑! + 𝑑!)
Ø 𝑑! = 1 𝑖𝑛, from table 2.5 in Mike 11. Ø 𝑑! = 2 𝑖𝑛, given in example Mike 11.
♦ 𝑅 = 5.2 1+2 ♦ 𝑅 = 15.6 𝑝𝑠𝑓
• Snow Loads ♦ 𝑆 = 𝑝! = 0.7𝐶!𝐶!𝐼!𝑝!
Ø 𝐶! = 0.9 § Since the Engineering design center is a Category B, Fully Exposed structure.
(ASCE 7-‐10, 26.7.3, pg 251) Ø 𝐶! = 1 Ø 𝐼! = 1.1
§ Since the structure is a risk category 3 building Ø 𝑝! = 0
§ Since the elevation of the building is 3 ft and well below the threshold elevation of 1500 ft required for a basic ground snow load in Santa Barbara.
♦ 𝑆 = 𝑝! = 0.7 0.9 1 1.1 0 ♦ 𝑆 = 0𝑝𝑠𝑓
• Wind Loads: ♦ Done using excel table below. Highest absolute value was selected (highlighted
below)
♦ • Seismic Loads:
♦ 𝑆 = 10𝑝𝑠𝑓 ♦ Given
Constants h"18 h""30Risk"Category"IIIV=115"mph 115Kzt=1.0 1Kz"(18')=0.60 0.6Kz"(30')=0.70 0.7Cnet"Windward"Wall"+"Int"Pressure 0.43 8.734848 10.190656Cnet"Windward"Wall"K"Internal"Pressure 0.73 0.00112128 17.300416Cnet"Leeward"Wall"+"Int"Pressure K0.51 K12.086592Cnet"Leeward"Wall"K"Int"Pressure K0.21 K4.976832Cnet"Side"Walls"+"Internal"Pressure K0.66 K15.641472Cnet"Side"Walls"K"Internal"Pressure K0.35 K8.29472Flat"Roof"+"Internal"Pressure K1.09 K25.832128Flat"Roof"K"Internal"Pressure K0.79 K18.722368
2nd"Floor Roof

Fall 2015
24
5.2. LRFD Load Combination Table
Table 13: LRFD Worst Case Scenario Excel Sheet
Roof (psf)D 60L 0Lr 20R 15.6W 25.8S 0f1 0.5f2 0.2H 0E Assumed 101.4D 841.2D+1.6(L+H)+.5Lr 821.2D+1.6(L+H)+.5S 721.2D+1.6(L+H)+.5R 79.81.2D+1.6Lr+1.6H+f1(L) 1041.2D+1.6S+1.6H+f1L 721.2D+1.6R+1.6H+f1L 97.01.2D+1.6Lr+1.6H+0.5W 116.91.2D+1.6S+1.6H+0.5W 84.91.2D+1.6R+1.6H+0.5W 109.91.2D+W+f1L+1.6H+.5*Lr 108.61.2D+W+f1L+1.6H+.5*S 97.81.2D+W+f1L+1.6H+.5*R 105.61.2D+1E+f1L++1.6H+f2S 820.9D+W+1.6H 95.3.9D+1.0E+1.6H 64
2nd floor Storage Area (psf)
D 60L 125E 10f1 0.51.4D 841.2D+1.6L 2721.2D+E+f1L 144.5

Fall 2015
25
6. References
American Institute of Steel Construction. Steel Construction Manual. 14th ed. N.p.: American Institute of Steel Construction, 2010. Print.
American Society of Civil Engineers. Minimum Design Loads for Buildings and Other
Structures. Reston, VA: American Society of Civil Engineers/Structural Engineering Institute, 2010. Print.
International Code Council. 2012 International Building Code. Country Club Hills, IL:
International Code Council, 2011. Print.