Malaysian Economy - Kementerian Kewangan · PDF fileQuarterly Update on the Malaysian Economy...
34
M INISTRY O F F INANCE M ALAYSIA Malaysian Economy First Quarter 2015
Transcript of Malaysian Economy - Kementerian Kewangan · PDF fileQuarterly Update on the Malaysian Economy...

MINISTRY OF FINANCEMALAYSIA
Malaysian EconomyFirst Quarter 2015

Quarterly Updateon the Malaysian Economy – 1st Quarter 2015
❐ Global economy expands at moderate pace
❐ Malaysian economy remains resilient
❐ Growth driven by firm domestic economic activities
❐ Malaysian economy is expected to remain on a steady growth path
Highlights
International Performance
Moderate global growth
Global growth continued at a moderate pace in the first quarter of 2015. The US economy continued to lead growth in advanced economies backed by private consumption and investment. The euro area has shown an encouraging improvement as a result of monetary stimulus packages by the European Central Bank (ECB), lower global oil prices, increased household spending and a weaker euro that has stimulated exports. Likewise, in Japan there were indications of a gradual recovery backed by export growth amid a weak yen. However, China’s economy grew at its slowest pace in six years mainly due to a moderation in external trade.
In the first quarter of 2015, the US economy grew by 3% (Q4 2014: 2.4%) mainly driven by increases in private consumption expenditure of 3% (Q4 2014: 2.9%) and private investment at 7.8% (Q4 2014: 5.4%) despite downward pressure from severe weather and the stronger dollar. Housing market indicators such as housing starts picked up at 4.3% (Q4 2014: 2%),
while building permits increased significantly to 6.2% (Q4 2014: 0.7%). However, the Institute for Supply Management’s (ISM) manufacturing index weakened to 52.6 points (Q4 2014: 57.7 points), largely due to a slowdown in textile production. Similarly, the non–manufacturing index fell to 56.7 points (Q4 2014: 57.5 points) mainly due to a contraction in the mining industry. The unemployment rate was lower at 5.6% (Q4 2014: 5.7%) following increases in employment in the healthcare sector. Meanwhile, declining energy and gasoline prices led to deflation of 0.2% (Q4 2014: 1.3%).

2
Economic activity in the euro area increased marginally by 1% (Q4 2014: 0.9%) in the first quarter of 2015, supported by improved per for mances in some of the major economies in the region. Growth was largely contributed by lower oil prices, positive business and consumer sentiments as well as the implementation of the ECB quantitative easing (QE) programmes. Improvements were also seen in the labour market with the unemployment rate moderating to 11.3% (Q4 2014: 11.5%). Meanwhile, the region fell into deflation at 0.3% (Q4 2014: 0.2%), mainly from plummeting global oil prices.
In Germany, GDP grew, albeit at a slower pace of 1% (Q4 2014: 1.5%), supported by lower oil prices and increased private consumption as consumers benefited from rising employment opportunities and improving wages. However, on the supply side, industrial output increased by 0.5% (Q4 2014: 0.7%). The unemployment rate was slightly lower at 4.8% (Q4 2014: 4.9%), while deflation was at 0.2% (Q4 2014: 0.4%) mainly due to a slump in global oil prices.
GDP growth in France was higher at 0.7% (Q4 2014: 0%), mainly supported by improved performance of the industrial sectors. Industrial output rose by 1% (Q4 2014: -1.3%), particularly due to higher production in the mining, quarrying, energy and water supply industries. Activities in the construction sector declined further by 6% (Q4 2014: -3.6%) as large fixed capital investments were postponed. Meanwhile, the economy registered a deflation of 0.2% (Q4 2014: 0.3%) on account of falling global oil prices.
Economic activity in the UK slowed down, registering a growth of 2.4% in the first quarter of 2015 (Q4 2014: 3%). The slower growth was largely attributed to lower activity across the main economic sectors, especially construction. Output of the construction sector declined by 0.8% (Q4 2014: 4.5%), mainly due to lower demand for new orders, repair
and maintenance works. Similarly, industrial output growth decelerated further to 0.5% (Q4 2014: 1%). Nevertheless, the services sector continued to support the overall expansion with output increasing by 3.1% (Q4 2014: 3.4%), backed by healthy performance of the transport, storage and communication as well as the distribution, hotel and restaurant subsectors. Meanwhile, inflation was at its lowest at 0.1% (Q4 2014: 0.9%) following lower fuel and food prices.
Japan showed a gradual recovery during the first quarter of 2015. Growth was supported by stable increase in exports with continued depreciation of the yen. Inflation moderated to 2.1% (Q4 2014: 2.7%) on account of lower fuel and energy prices.
China’s economy grew at a slower pace of 7% (Q4 2014: 7.3%) mainly due to the moderation in external trade. Export growth was lower at 4.9% (Q4 2014: 8.9%) as weak domestic and foreign demand significantly affected the output of factories. Investment in fixed assets increased by 14.5% (Q4 2014: 11.5%), largely supported by activities of state-holding enterprises despite a slower growth of foreign investment by 33.5%. The manufacturing sector weakened as reflected in the Purchasing Managers’ Index (PMI) which averaged 49.9 points (Q4 2014: 50.4 points) as new businesses were affected by weak demand. The Consumer Price Index (CPI) eased to 1.2% (Q4 2014: 1.5%) due to sluggish consumer demand. The People’s Bank of China cut its key interest rate by 25 basis points to 2.50% to mitigate deflationary pressures and support the economy.
Korea’s GDP growth moderated slightly to 2.4% (Q4 2014: 2.7%), as facility investment and exports remained flat while private consumption grew marginally by 1.5% (Q4 2014: 1.4%). The economy also benefited from the turnaround in the construction sector at 0.7%
3
(Q4 2014: -1.5%), mainly due to the increase in residential building projects. Growth in the manufacturing sector was slower at 0.7% (Q4 2014: 2.4%). Meanwhile, the services sector grew at a stable pace of 3.1% (Q4 2014: 3.1%) supported by the increase in finance and insurance, real estate and leasing as well as health and social work subsectors.
In the ASEAN region, Indonesia’s GDP moderated to 4.7% (Q4 2014: 5%). Growth was affected by slower expansion in private consumption and government spending. The inflation rate remained high at 6.5% (Q4 2014: 6.5%) contributed by increases in prices of transportation and communication services, as well as food. Bank Indonesia lowered its policy interest rate by 25 basis points to 7.50% in February 2015 as it expected inflation to trend down.
Singapore’s GDP grew by 2.1% (Q4 2014: 2.1%) due to strong growth in the construction industry and services sector. The construction industry expanded strongly by 3.3% (Q4 2014: 0.7%), contributed by an increase in pr ivate const ruct ion act iv i t ies . The services sector maintained its growth at 3.1% (Q4 2014: 3.1%), following increases in the wholesale and retail trade as well as b u s i n e s s s e r v i c e s s e c t o r s . H o w e v e r, t h e m a n u f a c t u r i n g i n d u s t r y contracted further by 3.4% during the quarter (Q4 2014: -1.3%). The contraction was mainly due to reduction in output in the transport engineering, electronics and precis ion engineering clusters.
Malaysian Economy
Economy continues to expand
The Malaysian economy remained resilient to record a steady growth of 5.6% in the first quarter of 2015 (Q4 2014: 5.7%), despite uncertainties in the external environment.
Growth was supported by strong domestic economic activity, part icularly private consumption and investment. On the supply side, the services sector sustained a growth of 6.4% (Q4 2014: 6.6%) supported mainly by wholesale and retail trade, information and communication as well as business services subsectors. Meanwhile, growth in the manufacturing sector further strengthened by 5.6% (Q4 2014: 5.4%), boosted by better performance of export-oriented industries, particularly the electrical and electronics (E&E) as well as transport equipment subsectors. The construction sector grew at a stronger pace of 9.7% (Q4 2014: 8.8%) on account of higher activity in the non-residential and residential subsectors. Similarly, the mining and quarrying sector recorded a robust growth of 9.6% (Q4 2014: 9.5%) following higher production of crude oil. However, the agriculture sector declined further by 4.7% (Q4 2014: -3.7%) due to lower production of oil palm as well as forestry and logging activities.
Strong domestic economic activity
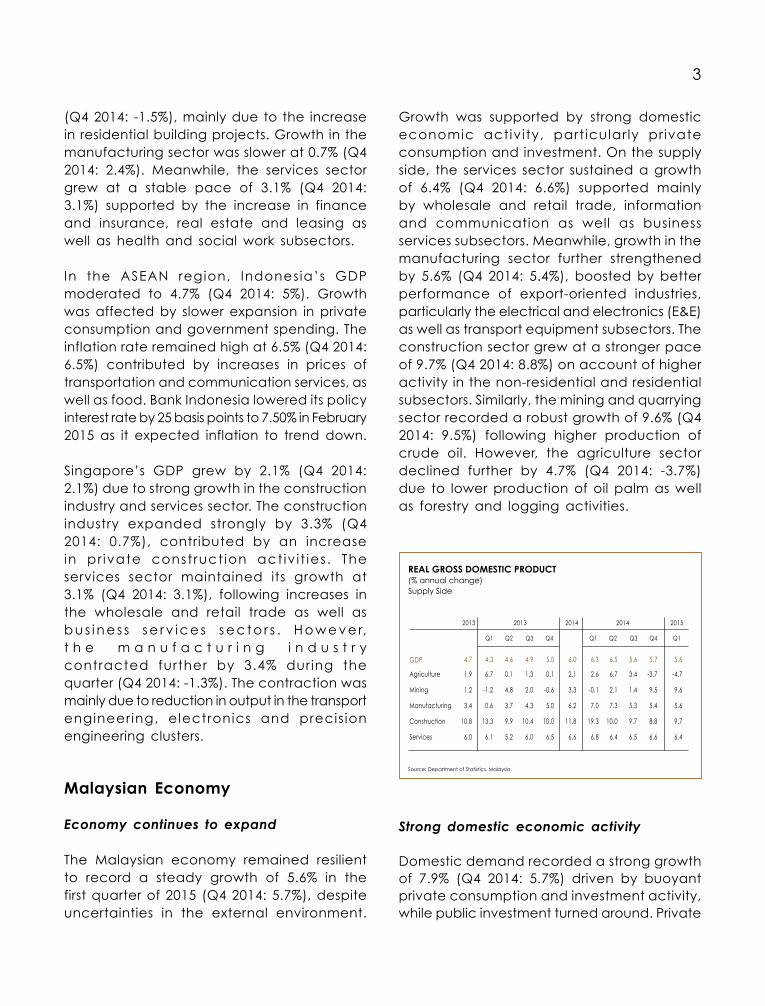
Domestic demand recorded a strong growth of 7.9% (Q4 2014: 5.7%) driven by buoyant private consumption and investment activity, while public investment turned around. Private

4
consumption strengthened by 8.8% (Q4 2014: 7.6%) supported by continued wage growth and lower inflation as well as pre-Goods and Services Tax (GST) spending. Private consumption was also supported by increased spending especially on food and beverage as well as other daily necessities following the massive floods in the east coast. The increased private consumption was reflected in major consumption indicators such as credit card spending, passenger car sales and imports of consumption goods. Meanwhile, public consumption grew by 4.1% (Q4 2014: 2.5%) attributed to higher overall Government spending on supplies and services.
PRIVATE CONSUMPTION INDICATORS
'000 units '000 units RM million%
Source:
rightscale
‘11 ‘12 ‘13 ‘14 ‘15‘11 ‘12 ‘13 ‘14 ‘15
0
10
20
30
40
50
60
70
Passenger car sales
JOJAJOJAJOJAJOJAJ0
10
20
30
40
50
60
70
Motorcycle sales
Malaysian Automotive Association (MAA), Motorcycle and Scooter Assemblers and DistributorsAssociation of Malaysia (MASAAM), Department of Statistics, Malaysia and Bank Negara Malaysia.
0
3
6
9
12
15
Consumption credit
JOJAJOJAJOJAJOJAJ0
1,000
2,000
3,000
4,000
5,000
Imports of consumption goodsSales tax
Growth driven by services sector
Growth in the services sector was sustained at 6.4% during the first quarter of 2015 (Q4 2014: 6.6%), with all subsectors remaining strong led by wholesale and retail trade. The final services group increased by 7.8% (Q4 2014: 7.7%) mainly supported by wholesale and retail trade. Likewise, the intermediate services group grew by 5.7% (Q4 2014: 6.1%) supported by the information and communication as well as real estate and business services subsectors.
The wholesale and retail trade subsector expanded at a stronger pace of 9.8% (Q4 2014: 9.4%), supported by the wholesale,
Gross Fixed Capital Formation (GFCF) registered a higher growth of 7.9% (Q4 2014: 4.3%) supported by both private and public sectors. Private investment expanded further by 11.7% (Q4 2014: 11.1%) mainly supported by capital spending in the manufacturing and services sectors. The expansion in investment activities was reflected by indicators such as sales of commercial vehicles, imports of capital goods as well as banking system loans and advances. Public investment turned around by 0.5% (Q4 2014: -1.9%) driven by Federal Government investment in existing projects especially in the transport and education subsectors.

5
SERVICES SECTOR(% annual change)
Source: Department of Statistics, Malaysia.
Intermediate services
Transport and storage Information and communicationFinance and insuranceReal estate and business services
Final services
UtilitiesWholesale and retail tradeFood & beverages and accommodationOther services
Government services
Total services
5.4
4.69.12.08.0
5.9
4.46.35.95.6
7.6
6.0
5.9
5.29.82.38.0
7.3
3.88.96.54.8
6.1
6.6
6.1
4.810.3
2.78.2
7.0
3.28.56.35.3
7.6
6.8
5.2
4.89.60.97.6
7.2
2.99.35.94.3
6.8
6.4
6.4
3.87.16.18.2
5.7
4.45.86.65.7
6.5
6.1
4.7
4.29.10.47.7
5.1
4.35.05.05.8
7.0
5.2
5.5
5.110.6
1.18.1
5.5
4.15.75.95.5
8.7
6.0
5.1
5.39.60.88.1
7.2
4.78.45.95.3
7.8
6.5
6.2
5.29.63.27.8
7.1
5.08.46.14.7
5.8
6.5
6.1
6.09.82.48.3
7.7
3.99.47.54.7
4.7
6.6
2013 2014 201520142013
Q1 Q2 Q3 Q4 Q1
5.7
5.79.61.97.6
7.8
3.79.87.34.6
3.9
6.4
Q1Q2 Q3 Q4
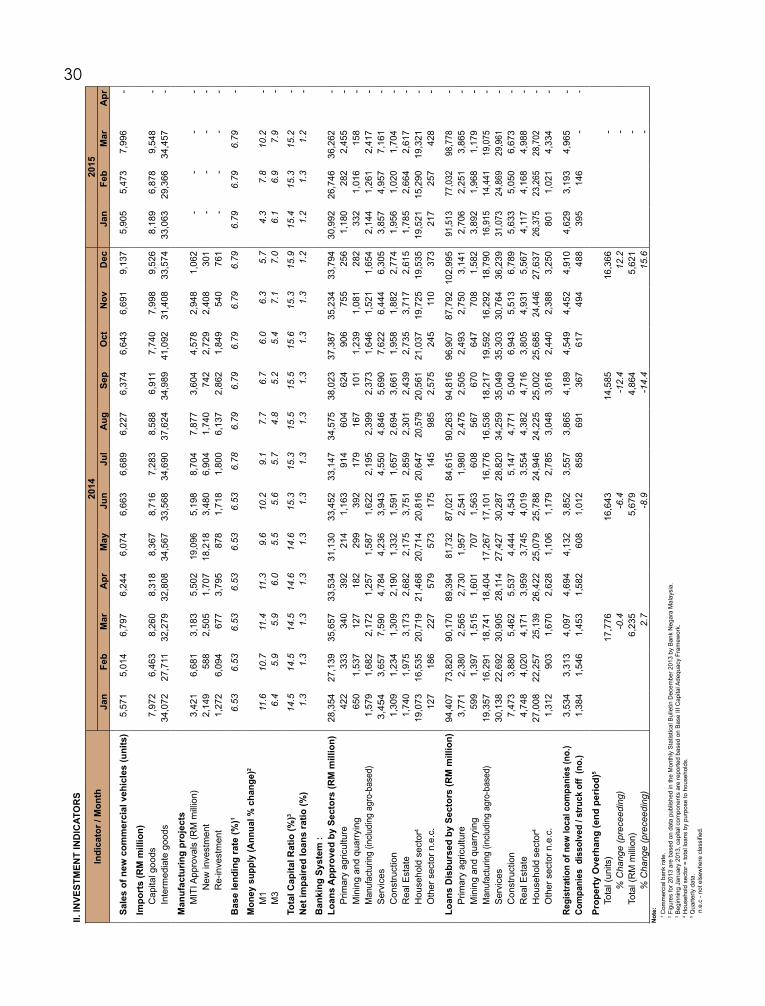
The information and communication subsector remained resilient with growth of 9.6% (Q4 2014: 9.8%) led by data communication activities and computer services. The subsector’s expansion was due to higher demand for communication services as well as GST software.
The transport and storage subsector expanded by 5.7% (Q4 2014: 6%) supported by strong water transport activity. During the quarter, the total volume of containers handled at seven major ports rose by 11.5% to 5.7 million twenty-foot equivalent units (TEUs) (Q4 2014: 11.7%; 5.8 million TEUs). Port Klang recorded an increase in volume handled at 3 million TEUs and Port of Tanjung Pelepas 2.1 million TEUs (Q4 2014: 2.9 million TEUs; 2.3 million TEUs), contributing 51.4% and 37.2%, respectively to total container throughput (Q4 2014: 49.2%; 38.7%).
The land transport segment rose by 5.8% (Q4 2014: 6%) supported by road transport and highway operation activities. Traffic volume on tolled highways increased by 8.2% to 444.2 million vehicles (Q4 2014: 5.1%; 444.4 million) attributed to higher usage during festivities and lower fuel price. Total ridership on urban rail services in the Klang Valley rose by 4.4% to 56.3 million (Q4 2014: 7.3%; 58.8 million). Meanwhile, Keretapi Tanah Melayu Berhad (KTMB) Intercity Services continued to decline by 36.9% to 399,469 passengers (Q4 2014: -16.8%; 539,695) largely due to the temporary disruption in east coast service caused by the floods early this year. The Electric Train Service (ETS) ridership on the Kuala Lumpur – Ipoh route contracted to 2.9% to 375,480 passengers (Q4 2014: 4.8%, 451,583) partly due to disruption to the ETS ticketing system in January and February. However, KTMB cargo tonnage increased at a slower pace of 3.4% to 1.5 million tonnes (Q4 2014: 8.6%, 1.7 million tonnes) on account of slower freight transport.
The air transport segment grew by 2.2% during the quarter (Q4 2014: 3%) with total air cargo handled at all airports expanding by 3% to
retail and motor vehicle segments. The retail segment recorded the highest growth of 10.7% (Q4 2014: 10%) due to stronger sales at non-specialised and specialised stores. The wholesale trade segment grew by 9.6% (Q4 2014: 9.4%) driven by other specialised wholesale, non-specialised wholesale trade and wholesale on a fee or contract basis. The motor vehicle segment rose at a stronger rate of 7.6% (Q4 2014: 7.5%) in line with attractive incentives offered by dealers ahead of the GST implementation. Meanwhile, the food & beverages and accommodation subsector expanded by 7.3% (Q4 2014: 7.5%) owing to stronger performance of food & beverage (8.5%) and accommodation (3.4%) segments.
The finance and insurance subsector increased by 1.9% (Q4 2014: 2.4%) supported by commercial banking activities. The insurance segment moderated to 3.6% (Q4 2014: 4.3%) on account of higher claims in life and general insurance while the finance segment increased by 1.3% (Q4 2014: 1.8%). The real estate and business services subsector expanded by 7.6% (Q4 2014: 8.3%), with the real estate segment increasing by 5.8% (Q4 2014: 5.7%) driven by non-residential building activities. Meanwhile, the business services segment recorded a 8.4% growth (Q4 2014: 9.6%) supported by professional services especially accounting services following the transition to the GST system.

6
238,405 tonnes (Q4 2014: 7.3%; 272,430 tonnes) in line with strong growth in E&E exports. Meanwhile, total passenger traffic at airports nationwide continued to contract by 0.8% to 21 million (Q4 2014: -0.2%, 22.8 million) due to the decline in foreign passenger arrivals.
The utilities subsector moderated to 3.7% (Q4 2014: 3.9%) due to slower demand from industries and households. The electricity and gas segment grew by 2.9% (Q4 2014: 3.3%) while the water segment increased by 7.2% (Q4 2014: 6.2%). Electricity sales rose by 1.4% to 25,152 gigawatt hours (Q4 2014: 2.7%; 25,992) with maximum demand for electricity peaking at 8,627 megawatts in February 2015 (Q4 2014: 8,806 megawatts in November 2014). The other services subsector grew by 4.6% (Q4 2014: 4.7%) mainly driven by private education which increased by 7.5% (Q4 2014: 6.9%) and private health which rose by 5.4% (Q4 2014: 5.2%). Meanwhile, the government services subsector moderated to 3.9% (Q4 2014: 4.7%).
Export-oriented industries propel growth
Value-added of the manufacturing sector rose slightly higher by 5.6% during the first quarter of 2015 (Q4 2014: 5.4%), supported by the stronger performance of export-oriented industries. Meanwhile, sales of manufacturing products grew moderately by 1.6% to RM167.7 billion (Q4 2014: 2.4%; RM165.7 billion), while the capacity u t i l i sa t ion ra te eased to 76 .8% (Q4 2014: 79.5%).
Production of export-oriented industries expanded by 6.3% (Q4 2014: 5.4%) driven by the strong growth of the E&E cluster at 11.3%, chemicals and chemical products (9.9%), refined petroleum (2.1%), wood and wood products (10.7%) as well as textile, apparels, leather products and footwear (9.7%). In line with the improved global growth of semiconductor sales reflected by the book-to-bill ratio which has stood above

7
construction-related subsectors increased by 6.9% (Q4 2014: 3.3%) with higher output of non-metallic mineral and other related products as well as basic and fabricated metals at 10.3%, 5.4% and 4.7%, respectively (Q4 2014: 7.1%; 1.8%; 0.6%). This was attributed to the robust performance of construction activity, particularly non-residential and residential buildings. Transport equipment grew at a stronger pace of 9.2% (Q4 2014: 1.1%) supported by manufacture of parts and accessories for motor vehicles (30.7%) as well as motorcycles (24.9%) and building of ships and boats (10.6%). The performance of these subsectors helped to cushion the decline in manufacture of passenger cars (-7.9%). Meanwhile, beverages and tobacco products registered a double-digit growth of 17.1% and 13.8%, respectively (Q4 2014: 12.8%; 36.5%). However, food and other manufactured products contracted by 9.1% and 6.2%, respectively during the quarter (Q4 2014: 5.8%; -4.3%).
Output of domestic-oriented industries was sustained at 3.8% during the first quarter of 2015 (Q4 2014: 3.8%). Production of
Strong construction activities
The construction sector registered a strong growth of 9.7% during the first quarter of 2015 (Q4 2014: 8.8%) supported by the non-residential and residential subsectors. The non-residential subsector rose by 17.4% (Q4 2014: 16.9%) bolstered by the construction of
1 for three consecutive months since January 2015, output of consumer electronics increased significantly by 113.4%, printed circuit boards (20.4%) as well as machinery and equipment (8%). Meanwhile, growth of chemicals and chemical products was driven by higher output of liquefied or compressed inorganic industrial or medical gases (26.9%) and basic organic chemicals (12.7%). However, resourced-based products such as manufacture of crude palm oil (CPO) as well as rubber remilling and latex processing declined by 11.8% and 10.1%, respectively.

8
factories, particularly in Sabah and Sarawak as well as the construction of buildings for education. The residential subsector increased by 15.3% (Q4 2014: 15%) mainly due to higher housing construction activities amid favourable economic and business conditions.
The civil engineering subsector staged a rebound at 1.7% (Q4 2014: -5%) supported by construction of the MRT project and roads. During the quarter, the total value of construction works recorded a double-digit growth of 15.1% to RM28.7 billion with 9,982 projects registered (Q4 2014: 9.7%; RM27.1 billion; 10,000 projects). The highest share was contributed by the non-residential building subsector with 34.8% or RM10 billion, followed by the civil engineering subsector (30.5%), residential buildings (29.9%) and special trades (4.8%). The private sector continued to dominate construction activities with a share of 68.4% during the quarter.
(Q4 2014: 14.6%; 650,989 bpd), following the acceleration of production from Gumusut-Kakap oil field in offshore Sabah. In contrast, production of natural gas contracted by 2% to 6,424 million standard cubic feet per day (mmscfd) (Q4 2014: 1.7%; 6,562 mmscfd). During the quarter, the price of Dated Brent and Tapis continued to decline averaging USD54.05 per barrel (pb) and USD56.51 pb, respectively (Q4 2014; USD75.96 pb; USD79.75 pb).
‘11 ‘12 ‘13 ‘14 ‘15
CONSTRUCTION SECTOR- Housing Starts
('000 units)('000 units)
Source: NAPIC, Valuation & Property Services Department. P = Preliminary
0
10
20
30
40
50
0
10
20
30
40
50
2-3 Storey terracedSingle storey terraced
Condominiums, apartments & flats
Low-cost flatsLow-cost houses
Others
Q1Q4Q3Q2Q1Q4Q3Q2Q1Q4Q3Q2Q1Q4Q3Q2Q1
Mining sector remains strong
The mining and quarrying sector continued to post a st rong growth of 9.6% (Q4 2014: 9.5%) supported by higher crude oil production. Crude oil output remained high registering a double-digit growth of 18.1% to average 690,028 barrels per day (bpd)
Output of rubber rebounds
The agriculture sector contracted for the second consecutive quarter by 4.7% (Q4 2014: -3.7%) due to lower production of oil palm

9
caused by the floods in the east coast, as well as slower forestry and logging activities. Value-added of oil palm declined further by 11.7% (Q4 2014: -8%) mainly due to lower production of CPO by 11.8%. Likewise, value-added of the forestry and logging subsector declined sharply by 20.4% (Q4 2014: 4.3%) on account of lower production of saw logs. Despite lower prices of rubber, value-added of the subsector rebounded to post a positive growth of 5% (Q4 2014: -25.5%). The price of natural rubber remained low at RM5.05 per kilogramme (Q4 2014: RM4.98 per kilogramme). The other agriculture subsector moderated to 3.5% (Q4 2014: 7.1%) with value-added of fruits and vegetables growing by 9.7% and 6.8%, respectively, thereby offsetting the impact of lower paddy production (-6.2%). Meanwhile, the livestock subsector grew by 4.3% (Q4 2014: 8.8%) supported by higher output of poultry while the fishing subsector rose by 4.4% (Q4 2014: 2.2%) on account of higher production of marine fishing (5.1%) and aquaculture (3%).
(Q4 2014: 2.8%). This was largely attributed to the slower price increases of food and non-alcoholic beverage as well as housing, water, electricity, gas and other fuels. The two groups contributed 1.3 percentage points to the CPI increase. However, prices of transport declined on account of lower pump prices following the implementation of a managed float mechanism introduced on 1 December 2014, amid lower global crude oil prices. Subsequently, the transport group offset the CPI growth by 1.15 percentage point.
Prices of food and non-alcoholic beverage increased at a slower pace of 2.5% in the first quarter of 2015 (Q4 2014: 2.7%) and accounted for 0.82 percentage point of the CPI increase. This was attributed to a slight price increase in the food at home category at 2.3% (Q4 2014: 2.2%) following higher prices of milk, cheese and eggs at 6.3%, vegetables at 4.2% and fruits at 2.5% (Q4 2014: 5.6%; 3.1%; 2.3). The supply disruptions following the flood disaster in several states also contributed to higher prices of food. Prices in the housing, water, electricity, gas and other fuels group also rose at a slower pace of 2.2% (Q4 2014: 3.4%) and resulted in a 0.48 percentage point increase in the CPI. Within the group, actual rental paid by tenants as well as maintenance
Prices
Inflation eases further
Headline inflation, as measured by the annual change in the Consumer Price Index (CPI), eased to 0.7% in the first quarter of 2015

10
and repai r of dwel l ing increased by 3 .4% and 3%, respect ively (Q4 2014: 3.6%; 2.9%).
paid by importers, decreased by 5.4% in the first quarter of 2015 (Q4 2014: -2.1%) amid weaker commodity prices. The lower PPI was contributed by price declines in both local production at 7.9% as well as import components by 0.3% (Q4 2014: -3%;0.8%).
The decline in the total PPI for local production was due to lower prices of mineral fuels and lubricants as well as crude materials, inedible at 23.2% and 11%, respectively (Q4 2014: -10.3%; -8.8%), which contributed 6.9 percentage points to the decline. For the stage of processing category, prices of crude materials for further processing as well as intermediate materials, supplies and components dropped by 27.4% and 3.6%, respectively (Q4 2014: -16%, 0.3%). However, processing of finished goods increased by 0.9% (Q4 2014: 0.5%). Meanwhile, the main factor for the decline in the PPI for imports was the price decrease in the mineral fuels and lubricants as well as animals, vegetable oils and fats at 10.7% and 3.5%, respectively (Q4 2014: -5.5%; -1.6%). The PPI for imports by stage of processing also registered a price drop in crude materials for further processing at 8%. However, this was offset by the price increase of intermediate materials, supplies and components (0.8%) and finished goods (0.4%).
Employment
Stable labour market
Labour market conditions remained stable, although the unemployment rate edged up to 3.1% in the first quarter of 2015 (Q4 2014: 2.8%). The total labour force increased slightly to 14.14 million persons (Q4 2014: 14.08 million persons) while total employment recorded 13.70 million (Q4 2014: 13.69 million).
Prices in the transport group, registered a sharp decline of 7.6% (Q4 2014: 4.8%) under the implementation of a managed float mechanism following falling crude oil prices. Under the mechanism, the subsidy on RON95 petrol and diesel was abolished and the average change of petrol price in the previous month will determine the pricing for the current month. For March 2015, the pump price of RON95, RON97 and diesel was lowered to RM1.95 per litre, RM2.25 per litre and RM1.95 per litre, respectively (End-2014: RM2.26 per litre; RM2.46 per litre; RM2.23 per litre). Prices of the repair and maintenance of personal transport subgroup recorded an increase of 6.2%, while fuels and lubricants for personal and transport equipment dragged down the transport group with a decline of 13.1% (Q4 2014: 7%; 6.7%). As in the previous quarter, prices of communication as well as clothing and footwear continued to decrease by 1% and 0.3%, respectively (Q4 2014: -0.9%; -0.4%), amid strong market competition.
The Producer Price Index (PPI), which measures changes in the prices of commodities charged by domestic producers and those

11
The services sector remained as the major contributor to total employment with 8.2 million or 59.5%, mainly in wholesale and retail trade as well as accommodation and food and beverage services subsectors. This was followed by the manufacturing (2.2 million; 16.1%) and agriculture (1.7 million; 12.7%) sectors.
elementary occupations continued to r e c o r d t h e h i g h e s t v a c a n c i e s a t 147,701 or 68.9% of total job vacancies (Q4 2014: 165,370; 65.9%).
Meanwhile, the number of active job seekers declined to 354,939 as at end-March 2015 amid stable labour market conditions (end-December 2014: 367,826). In addition, the number of retrenchments moderated to 2,789 (Q4 2014: 2,915) with the majority in the services (1,388) and manufacturing (1,040) sectors.
Monetary and Financial Developments
Monetary aggregates expand steadily
Monetary aggregates increased further during the first quarter of 2015. M1 or narrow money, registered a double-digit growth of 10.2% to RM360.3 billion as at end-March 2015 (end-December 2014: 5.7%; RM346.4 billion) due to higher placement of demand deposits. Meanwhile, M3 or broad money, increased by 7.9% to RM1,589.7 billion as at end-March 2015 (end-December 2014: 7%; RM1,553.8 billion). The expansion in M3 was mainly contributed by an increase in lending to the private sector by the banking system.
Job vacancies registered via JobsMalaysia decreased to 214,472 in the first quarter of 2015 (Q4 2014: 250,976). On a sectoral basis, the manufacturing, services and construction sectors recorded the highest job openings with 63,266; 50,276 and 51,789, respectively (Q4 2014: 70,817; 68,566; 44,754). However, on a quarterly basis, job vacancies in the manufacturing and services sectors were lower compared to the fourth quarter of 2014. This was partly attributed to several factors such as business closure or relocation, offshoring of production as well as shifting towards capital-intensive operation. In contrast, the increase of job vacancies in the construction sector was mainly contributed by rapid development of non-residential and residential buildings. In te r ms o f occupat iona l category ,

12
Interest rates remain stable
The Overnight Policy Rate (OPR) was unchanged at 3.25% in the first quarter of 2015 (end-December 2014: 3.25%) and remained supportive of economic growth. Consequently, the base lending rate (BLR) of commercial banks held steady at 6.79% (end-December 2014: 6.79%), while the weighted average lending rate (ALR) of commercial banks stood at 5.48% as at end-March 2015, easing three basis points (end-December 2014: 5.51%). The Base Rate (BR) was introduced to replace the BLR on 2 January 2015 as the main reference rate for new retail floating rate loans. The BR has remained at 3.90% since it was introduced. The savings deposit rate edged up one basis point to 1.08% (end-December 2014: 1.07%), while interest rates for 6-month, 9-month and 12-month fixed deposits dropped by one basis point each to 3 .18%, 3 .22% and 3 .30%, respectively.
Meanwhile, interest rates on fixed deposits for 1-month and 3-month maturities were maintained at 3.08% and 3.13%. The real return on fixed deposits of all maturities remained positive as inflation increased at a slower pace of 0.7% in the first quarter of 2015 (Q4 2014: 2.8%).
[At the Monetary Policy Committee meeting on 7 May 2015, the OPR was left unchanged at 3.25%. This was based on the assessment that the Malaysian economy would stay on a steady growth path with underlying inflation remaining contained.]
Higher loan disbursements
Gross private sector financing raised through the banking system and capital market grew by 0.1% year-on-year (y-o-y) to RM282.5 billion in the first quarter of 2015 (Q4 2014: 3.3%; RM309.8 billion). This was mainly due to lower gross private debt securities (PDS) issuance excluding Cagamas by 46.5% to RM10.5 billion (Q4 2014: -41.2%; RM21.2 billion). However, loan disbursements in the banking system increased by 3.5% to RM267.3 billion (Q4 2014: 12.2%; RM287.7 billion) while equity issuances rose by 11.3% to RM4.7 billion (Q4 2014: -87.1%; RM1 billion).
In the first quarter of 2015, bank lending indicators continued to increase steadily. While loan applications recorded a further decline of 3.9% to RM178.5 billion (Q4 2014: -0.2%; RM210.1 billion), loan approvals grew by 3.1% to RM94 billion (Q4 2014: 8.6%, RM106.4 billion). Loan disbursements also grew further by 3.5% to RM267.3 billion (Q4 2014: 12.2%, RM287.7 billion) with the household sector remaining as the

13
major contributor to total loans disbursed by the banking system at RM78.3 billion or 29.3% (Q4 2014: RM77.8 billion, 27%). The manufacturing sector accounted for the largest portion of loans disbursed to businesses at 18.9% or RM50.4 billion (Q4 2014: 19.9%; RM54.7 billion). This was followed by loans disbursed to the wholesale and retail trade, accommodation and restaurant sector at 17.6% or RM47 billion (Q4 2014: 20.8%; RM59.8 billion).
BANKING SYSTEM: LOANS OUTSTANDING AND GROWTHRM billion Annual change (%)
Source: Bank Negara Malaysia.
‘11 ‘12 ‘13 ‘14 ‘15
400
600
800
1,000
1,200
1,400
Loans outstanding
MarDecSeptJunMarDecSeptJunMarDecSeptJunMarDecSeptJunMar4
6
8
10
12
14
Loan growth
1,361.9
9.2%
Sound banking system
During the first quarter of 2015, the banking system remained well-capitalised with the common equity tier 1 capital ratio (12.5%), tier 1 capital ratio (13.2%) and total capital ratio (15.2%) remaining well above the minimum regulatory levels as at end-March 2015 (end-December 2014: 12.6%;13.3%;15.2%). The banking sector recorded a pre-tax profit of RM7.1 billion (Q4 2014: RM7.8 billion) due to lower contribution of revenue from the dividend income segment. The quality of loans in the banking system remained stable with the net impaired loans ratio unchanged at 1.2% as at end-March 2015 (end-December 2014: 1.2%).
Ringgit tracks regional trend
The ringgit eased by 6% against the US dollar in the first quarter of 2015. The ringgit also depreciated between 1% and 7% against other major and regional currencies. However, the ringgit gained by 5.9% and 1.2% against the euro and the Australian dollar, respectively. On the whole, the ringgit’s weak performance against the US dollar was mainly attributed to investors’ concern over the impact of plummeting crude oil prices amid a strengthening US dollar.
Total loans outstanding in the banking system continued to expand by 9.2% to RM1,361.9 billion as at end-March 2015 (end-December 2014: 9.3%; RM1,339.7 billion). The household sector accounted for the largest share of total loans outstanding in the banking system totalling 57.1% or RM778.3 billion (end-December 2014: 57%; RM760.3 billion).

14
funds raised by the public sector at RM13.2 billion and the private sector, RM7.8 billion (Q4 2014: RM15.3 billion; RM11.2 billion).
Yields on 1-year Malaysian Government Securities (MGS) declined by 27 basis points to 3.21% during the first quarter of 2015 (Q4 2014: +22 basis points ; 3.48%). Likewise, the yield on 5-year and 10-year MGS also decreased by 25 basis points each to 3.59% and 3.89%, respectively (Q4 2014: +17 basis points, +23 basis points; 3.84%, 4.15%). This was due to the resumption of non-resident inflows amounting to RM6.1 billion into the MGS market during the quarter. Meanwhile, the yield on 5-year AAA-rated PDS declined by 5 basis points to 4.22% (Q4 2014: +6 basis points; 4.27%). However, yields on the 5-year
Source: Bank Negara Malaysia.
1 including Cagamas.
FUNDS RAISED IN THE CAPITAL MARKET(RM million)
BY PUBLIC SECTOR
Government securities (net) Malaysia Government Securities Government Investment Issues Less: Redemptions Khazanah Bonds (net)Merdeka Saving Bonds (net)Government Housing Sukuk (net) BY PRIVATE SECTOR
Shares/WarrantsDebt Securities (net)
Private Debt Securities1
Less: Redemptions
TOTAL
--
4,000
39,377
24,012
20,01214,4939,0193,500
15,365
20,5479,393
2014 2015
Q1
--
2,600
17,183
8,523
5,92311,91610,05016,043
8,660
5,1633,497
4,21111,154
--
4,000
20,986
13,183
9,18313,4799,500
13,797
7,803
10,9417,824
Q1Q1
4,6853,118
18,51315,016
Q2
--
1,500
17,110
2,101
60112,2798,222
19,900
15,009
8,8326,177
24,85918,682
Q3
Note: Total may not add up due to rounding.
--
3,400
26,420
15,258
11,85812,7296,6297,500
11,162
95710,205
21,58311,378
Q4
PRIVATE DEBT SECURITIES (PDS) 5-YEAR YIELDS 1
%
4.224.64
6.99
11.53
‘11 ‘12 ‘13 ‘14 ‘15
1 End-period.Source: Fully Automated System for Issuing/Tendering (FAST), Bank Negara Malaysia.
2
4
6
8
10
12
BBBAAAAAA
MarDecSepJunMarDecSepJunMarDecSepJunMarDecSepJunMar
[From end-March 2015 to 15 May 2015, the ringgit strengthened by 4.2% against the US dollar and by 3.4% against the yen. The ringgit also gained in the range of 1.4% and 7.5% against regional currencies. However, the ringgit eased against the pound sterling (-2.3%), the Australian dollar (-1.5%) and the euro (-1.3%), while remaining unchanged against the Singapore dollar. The ringgit’s performance improved following the stronger-than-expected GDP growth of 5.6% in the first quarter of 2015 as well as the increase in global crude oil prices which eased concerns over Government revenue. The ringgit also benefited from the softer US dollar amid weaker US economic data coupled with speculation that the US Federal Reserve (Fed) will delay interest rate hike.]
Fund raising moderates
Fund raising activity in the capital market declined in the first quarter of 2015. Gross funds raised decreased by 18.5% y-o-y to RM42.6 billion (Q4 2014: -29.1%; RM45.3 billion). This was due to a significant drop in PDS totalling RM10.9 billion (Q4 2014: RM21.6 billion). After adjusting for redemptions, total net funds raised declined by 46.7% to RM20.9 billion (Q4 2014: -21.7%; RM26.4 billion), with net

15
billion). Similarly, total turnover increased to 124.3 billion units valued at RM128.5 billion (Q4 2014: 122.5 billion units; RM126 billion).
[The FBM KLCI eased slightly in April despite higher foreign fund buying and ringgit appreciation amid increasing crude oil prices. The FBM KLCI posted a new year-to-date high on 21 April 2015 following positive remarks on the country’s fiscal direction. The market remained stable in May due to positive domestic economic data. The FBM KLCI stood at 1,811.92 points on 15 May 2015.]
Federal Government Finance
Steady revenue growth
Federal Government revenue registered a moderate growth of 4.8% to RM51.5 billion in the first quarter of 2015 (Q4 2014: -2.3%; RM59.6 billion). Tax revenue, comprising 71.9% of total revenue, grew by 5% to RM37.1 billion (Q4 2014: 11.3%; RM47.4 billion) in tandem with GDP growth of 5.6%.
AA-rated and A-rated PDS increased by 4 basis points and 12 basis points to 4.64% and 6.99%, respectively (Q4 2014: +2 basis points, -7 basis points; 4.6%, 6.87%).
FBM KLCI ends firmer
The FBM KLCI rebounded to register a gain of 4% in the first quarter of 2015 (Q4 2014: -4.6%). The market began the quarter on a stable note despite concerns over declining crude oil prices and a weakening ringgit which continued to weigh on the market. The FBM KLCI saw a slight monthly increase in January tracking other regional indices following the ECB’s stimulus expansion announcement. The market continued to edge higher in February and March as investors’ sentiment was lifted by crude oil prices which recovered from recent lows coupled with easing concerns over an early interest rate hike by the Fed. The market also reacted towards the uptrend in global markets amid monetary easing measures adopted by major central banks in Europe, Japan and China. Overall, the FBM KLCI ended the first quarter of 2015 at 1,830.78 points (end-December 2014: 1,761.25 points).
Market capitalisation rebounded with a positive growth of 5.2% or RM86.4 billion to RM1,737.52 billion as at end-March 2015 (end-December 2014: -6.9%; RM122.9 bil l ion; RM1,651.17
Direct tax recorded a growth of 1.2% to RM27.6 billion compared to a contraction of 0.4% in the first quarter of 2014 (Q4 2014: 14.6%; RM37.3

16
billion). This was mainly contributed by higher corporate income tax. However, individual income tax and petroleum income tax (PITA) collection decreased by 27.5% to RM8 billion (Q4 2014: 147.3%; RM4.7 billion) and 42.3% to RM3 billion, respectively (Q4 2014: -31.1%; RM8.2 billion). The lower receipts from PITA was mainly due to the significant decline in crude oil prices, which averaged USD54 per barrel during the quarter (Q4 2014: USD76 per barrel).
during the corresponding quarter in 2014 (Q4 2014: 1.7%; RM76.7 billion). Operating expenditure, which accounted for 87.4% of total expenditure, recorded a marginal increase of 0.4% to RM55.4 billion (Q4 2014: 1.6%; RM59.7 billion), largely on account of substantial reduction in fuel subsidy payments despite higher emoluments. Emoluments, the largest component of operating expenditure, increased by 5.1% to RM18.1 billion (Q4 2014: 3.3%; RM16.6 billion).
The decline in fuel subsidies was mainly due to the implementation of a managed float fuel pricing mechanism effective from 1 December 2014. In addition, lower spending on supplies and services as well as debt service charges also resulted in a slower operating expenditure growth compared to the corresponding quarter in 2014.
Development expenditure increased by 12.4% to RM8 billion (Q4 2014: 1.9%; RM17 billion) with all sectors registering positive growth. In terms of share to the total development expenditure, the transport subsector was the largest component with 25.1%, followed by trade and industry (24.7%) and education (13%).
With total expenditure continuing to exceed total revenue col lect ion, the Federal Government registered a deficit of RM11.8 billion during the quarter (Q4 2014: -RM16.5 billion). However, this was lower than the deficit in the first quarter of 2014 at RM13 billion.
Domestic sources of borrowing
Federal Government gross borrowing for the first three months of 2015 amounted to RM26.7 billion, comprising mainly MGS and Government Investment Issues at RM13.5 billion and RM9.5 billion, respectively. The Federal Government debt, after netting out repayments, stood at RM596.8 billion or
Indirect tax rose by 17.7% to RM9.5 billion (Q4 2014: 0.3%, RM10.1 billion) primarily contributed by an increase in sales tax collection of 66.4% to RM3.6 billion. In addition, receipts from import duty and service tax recorded an increase of 3% and 9.2% to RM0.6 billion and RM1.5 billion, respectively. Meanwhile, excise duties decreased marginally by 0.4% to RM2.8 billion.
Proceeds from non-tax revenue, constituting 28.1% of total revenue, rose by 4.4% to RM14.5 billion (Q4 2014: -33.6%; RM12.3 billion). The increase was mainly attributed to higher receipts from investment income.
Slightly higher expenditure
Federal Government total expenditure grew slightly by 1.8% to RM63.4 billion in the first quarter of 2015 compared to RM62.3 billion

17
52.1% of GDP (end-December 2014: RM582.8 billion; 52.7% of GDP). Of this, domestic debt constituted 97% of total Federal Government debt. Debt service charges increased to RM5.8 bil l ion and accounted for 10.5% of total operating expenditure (Q4 2014: RM5 billion; 8.4%).
contraction in the exports of non-E&E products. Tepid demand for petroleum products (-33.8%) and manufactures of metal (-14.4%) were the major contributors to the sluggish performance of non-E&E exports. However, receipts from E&E products remained favourable, growing by 6.9% to RM64.2 billion (Q4 2014: 5.5%; RM67.7 billion) in line with higher demand for semiconductors (10.3%) and automatic data processing equipment (10.8%). The book-to-bill ratio has been consistently above 1 for the past few months indicating positive growth in this segment. Shipment of E&E products to the main trading partners, the US (18.2%), the Netherlands (19%) and Hong Kong (9.7%) continued to remain strong.
Low crude oil and LNG prices continued to impact export earnings of mining products which declined by 6.9% to RM25 billion (Q4 2014: -0.5%; RM26.8 billion). Receipts from crude petroleum and LNG declined by 15.7% and 4.7%, respectively (Q4 2014: -10.3%; 4.4%) despite higher export volume. During the quarter, export prices of crude petroleum fell by 44% to average RM1,600 per tonne, while LNG prices declined by 7.6% to average RM2,440 per tonne. This was mainly due to lacklustre demand from major LNG importing countries such as Japan (4.6%), Korea (7.7%) and Taiwan (7.8%). Similarly, export receipts of agriculture goods contracted by 16% to RM14.3 billion (Q4 2014: -8.8%; RM16.9 billion) following lower demand and export value for
External Position
Total trade contracts
Amid uneven growth in key export markets, total trade declined by 1.2% to RM345.1 billion (Q4 2014: 2.4%; RM371.4 billion) though the trade surplus remained steady at RM21.3 billion (Q4 2014: RM21.5 billion). During the quarter, gross exports contracted by 2.5% to RM183.2 billion (Q4 2014: 0.5%; RM196.5 billion). This was largely due to declining receipts from agriculture (-16%) and mining (-6.9%) exports following weak external demand, lower commodity prices and a depreciating ringgit. Gross imports amounted to RM161.9 billion (Q4 2014: RM175 billion) supported by positive growth in intermediate (3%), capital (8.5%) and consumption goods (4.4%).
Export receipts of manufactured goods, which comprised 77.9% of total exports, moderated to RM142.8 billion (Q4 2014: 75.9%; RM151.7 billion) mainly weighed down by a 4.7%

18
rubber and palm oil. Export earnings of palm oil, the largest contributor to the agriculture sector at about 63%, fell sharply to China (-53.7%), the US (-31%) and the Netherlands (-25.7%).
industrial supplies (10.2%); parts and accessories of capital goods and transport equipment (5.4%); as well as food and beverage (21.6%). This bodes well for future exports. Boosted by festivities during the quarter, imports of consumption goods also improved by 4.4% (Q4 2014: 2.9%) underpinned by increased demand for food and beverage (8.4%) as well as consumer durables (2%). Pre-emptive buying before the implementation of GST on 1 April 2015 also contributed to import growth.
Higher current account surplus
The current account surplus was higher at RM10 billion or 3.7% of GNI during the first quarter of 2015 (Q4 2014: RM5.7 billion; 2.1%). This was primarily contributed by a smaller deficit in the services and primary income accounts.
The surplus in the goods and services account remained steady at RM23.8 billion (Q4 2014: RM23.8 billion) despite weak external demand. While the goods account recorded a lower surplus of RM27.5 billion (Q4 2014: RM29.4 billion), the deficit in the services account improved to RM3.8 billion (Q4 2014: -RM5.5 billion) due to lower net payments for transport and construction services. Meanwhile, the surplus in the travel account narrowed marginally due to lower tourist arrivals and spending during the quarter. However, outbound travel remained steady with gross payments amounting to RM10.2 bi l l ion, reflecting strong business and leisure activities abroad.
The deficit in the primary income account improved significantly to register a lower deficit of RM8.5 billion (Q4 2014: -RM13.2 billion). This was largely due to lower investment income accruing to foreign investors in Malaysia which more than offset higher investment income repatriated by Malaysian companies operating abroad, mainly in the mining and quarrying as well as financial and insurance sectors. The weaker ringgit also supported the
EXPORTS OF MANUFACTURED GOODS(% annual change)
Source: Department of Statistics, Malaysia.
Total manufacturing exports
Electronics & electrical products (E&E)Petroleum�productsChemicals�and chemical�productsMachinery,�appliances�and�partsOptical�and scientific�equipmentManufactures�of�metalRubber�products�Processed�foodWood�productsTextiles,�clothings�and footwearManufactures�of�plasticsIron�and steel�productsTransport�equipmentJewellery�Non-metallic�mineral�productsBeverages�and tobacco�Paper�and pulp�productsOther�manufactures
0.6-4.933.3-2.3-2.70.8
20.50.03.1
-4.8-0.40.5
-35.20.4
-11.1-10.7
9.75.01.9
-2.3-3.80.40.70.7
-17.916.2-9.06.5
-7.91.60.6
-28.06.6
19.3-11.2
6.01.80.9
5.530.07.5
10.0-17.968.1
-10.09.4
-7.316.612.6-6.711.721.8-3.85.84.4
-4.7
8.8 12.913.233.04.5
20.91.6
53.3-4.58.30.0
13.713.4
-25.8-28.9
5.1-1.819.61.2
10.1
12.512.514.58.6
15.09.6
24.4-9.516.16.4
19.615.915.521.414.17.07.34.9
19.6
7.18.12.98.5
10.913.4-6.1-5.916.33.9
13.011.628.210.0
-11.96.95.21.8
19.9
5.12.5
24.62.56.9
-9.139.2-5.96.9
-5.07.96.7
-24.8-5.88.8
-7.010.33.02.0
2013 2013 2014 2014 2015
13.813.032.57.4
19.225.10.2
-7.618.27.7
24.415.942.04.5
-26.45.8
11.47.8
22.5
Q1 Q2 Q3
2.7-3.85.87.4
18.0-29.5
0.619.80.40.36.9
26.79.7
-23.810.82.1
-1.219.0
1.9
Q4 Q1
0.16.9
-33.82.8
14.112.1
-14.42.16.7
-1.26.23.9
27.6-3.1
-11.31.8
15.45.7
13.1
Q1Q2 Q3 Q4
1.85.5
-19.112.12.92.4
-8.7-2.911.41.5
10.28.5
27.95.1
-2.64.01.1
-3.818.6
Gross imports remained positive, albeit growing at a slower pace, to record RM161.9 billion (Q4 2014: RM175 billion). Robust investment activity in the economy saw imports of capital goods register a strong growth of 8.5% (Q4 2014: 0.1%). Items imported included telecommunication and transport-related equipment as well as floating structures for the oil and gas industry. Likewise, imports of intermediate goods, which accounted for 59.8% of total imports, rose by 3% (Q4 2014: 60.6%; 12.5%) supported by higher imports of

19
improved earnings of these companies. During the quarter, net outflows from the secondary income account were marginally higher at RM5.3 billion (Q4 2014: -RM5 billion) driven by higher remittances by foreign workers, while remittances from Malaysian workers abroad were sustained at RM2.4 billion.
The financial account recorded a larger net outflow of RM29.7 billion (Q4 2014: -RM26.6 billion), mainly due to higher placement of currency and deposits abroad as well as increased extension of interbank short-term loans by resident financial institutions. However, net outflows of portfolio investments decelerated significantly to RM7.9 billion (Q4 2014: -RM20.3 billion) despite continued uncertainty in the global financial markets. During the quarter, inward direct investment (direct investment liabilities) was higher at RM8.6 billion (Q4 2014: RM7.5 billion) largely due to higher investment and reinvestment in the mining and quarrying, financial and insurance as well as manufacturing sectors. Investments were mainly from the US, Indonesia, Bahamas, Singapore and Japan.
[As at 30 April 2015, the international reserves amounted to RM392.4 billion (equivalent to USD105.8 billion). The reserves position is sufficient to finance 8 months of retained imports and is 1.1 times the short-term external debt]
retained earnings, which more than offset higher extension of equity capital to subsidiaries of Malaysian companies abroad. Direct investment abroad was mainly channelled into mining and quarrying, agriculture as well as the financial and insurance sectors in Papua New Guinea, Canada, Luxembourg, Iraq and the UK. Consequently, Malaysia’s overall balance of payments recorded a deficit of RM15.7 billion with net errors and omissions lower at RM4 billion (Q4 2015: -RM11.5 billion; RM9.1 billion).
Ample international reserves
Malaysia’s international reserves amounted to RM389.7 billion (equivalent to USD105.1 billion) as at 31 March 2015 (end-Dec 2014: RM405.4 billion; USD115.9 billion). The reserves level has taken into account the quarterly adjustment for foreign exchange revaluation changes. The reserves position is sufficient to finance 8.1 months of retained imports and is 1.1 times the redefined short-term external debt.
Outward direct investment (direct investment assets) remained firm at RM9.8 billion (Q4 2014: -RM9.9 billion) primarily due to smaller extension of intercompany loans and lower

20
Outlook
Uneven moderate growth to continue
Global growth is expected to expand moderately with uneven prospects across major countries. Oil-exporting developing economies are expected to register a slower growth. China is also expected to maintain a moderate growth path. Advanced economies are expected to expand benefiting from lower oil prices. The US is expected to remain robust while the euro area is projected to
grow at a modest pace. The downside risks to the economic outlook include a short-lived overall increase in global demand due to a rebound in oil prices, strengthening of the US dollar which could negatively impact emerging market economies. Furthermore, geopolitical risks in Eastern Europe, the Middle East and Africa could impact the global economy.
The Malaysian economy is expected to remain on a steady growth path in 2015. This is reflected by the Leading Index, which grew by an average of 1.96% from October 2014 to February 2015. The underlying macroeconomic fundamentals, supportive monetary policy as well as ongoing economic transformation will continue to strengthen the resilience of the economy.
On the supply side, the continued expansion in the construction and manufacturing sectors as well as services activities will contribute strongly to the overall GDP growth. On the demand side, growth is expected to emanate from resilient domestic demand, supported by strong private investment and higher development expenditure.
GDP AND THE LEADING & COINCIDENT INDICES(% annual change)
% %
‘09 ‘10 ‘11 ‘12 ‘13 ‘14 ‘15
Source: Department of Statistics, Malaysia.
right scale
-15
-10
-5
0
5
10
15
GDP
Q1Q4Q3Q2Q1Q4Q3Q2Q1Q4Q3Q2Q1Q4Q3Q2Q1Q4Q3Q2Q1Q4Q3Q2Q1 -15
-10
-5
0
5
10
15
Coincident index
Leading index

Key Datahttp://www.treasury.gov.my


23
KEY DATAAREA (Square kilometres) 330,290
20131 20141 20152
POPULATION (million) 29.9 30.3 30.6
RM million
% growth
RM million
% growth
RM million
% growth
DOMESTIC PRODUCTION3
Gross Domestic Product (constant 2010 prices) 955,260 4.7 1,012,506 6.0 877,174 4.5 - 5.5
USD million 303,171 309,361 244,474
Agriculture 91,097 1.9 92,979 2.1 57,675 0.3
Mining and quarrying 87,789 1.2 90,645 3.3 67,525 3.0
Manufacturing 219,216 3.4 232,868 6.2 215,323 4.9
Construction 38,646 10.8 43,190 11.8 36,380 10.3
Services 507,935 6.0 541,249 6.6 487,887 5.6
Gross Domestic Product (current prices) 1,018,821 4.9 1,106,580 8.6 1,127,358 5.4
USD million 323,342 338,108 314,202
NATIONAL INCOME AND EXPENDITURE3
Gross National Income (current prices) 984,846 5.3 1,069,258 8.6 1,089,396 5.5
USD million 312,559 326,704 303,622
Consumption expenditure: Public 139,822 4.0 147,646 5.6 146,527 3.6
Private 527,749 9.4 579,908 9.9 599,431 8.1
Gross fixed capital formation: Public 106,999 2.8 103,595 -3.2 111,123 9.9
Private 162,815 14.4 183,902 13.0 201,072 10.8
Exports of goods and services 770,368 0.0 817,176 6.1 861,338 1.1
Imports of goods and services 683,408 2.7 714,950 4.6 783,504 4.8
Gross National Income (constant 2010 prices) 916,903 5.2 971,916 6.0 814,895 5.2
USD million 290,996 296,982 227,117
Gross National Savings (current prices) 299,777 -0.2 324,118 8.1 324,981 1.8
Per Capita Income (current prices) RM 32,921 3.9 35,334 7.3 35,572 4.2
USD 10,448 10,796 9,914
Purchasing Power Parity USD 22,530 5.0 22,378 -0.4 23,5125 2.4
FEDERAL GOVERNMENT FINANCE4
Revenue 213,370 2.6 220,6266 3.4 222,865 1.0
Operating expenditure 211,270 2.8 219,5896 3.9 212,421 -3.3
Current account surplus 2,100 1,0376 10,444
Development expenditure (net) 40,684 -8.2 38,4516 -5.5 47,467 23.4
Overall deficit/surplus -38,584 -37,4146 -37,023
% to GDP -3.8 -3.46 -3.2
Domestic borrowing (net) 39,526 37,5576 -
Foreign borrowing (net) -221 -4276 -
Change in assets -721 2836 -
RM million % GDP RM million % GDP RM million % GDP
Federal Government debt2 539,858 53.0 582,828 52.7 - -
Domestic debt 523,095 51.3 566,052 51.2 - -
Offshore borrowing 16,763 1.6 16,776 1.5 - -
Memorandum item:Non-residents holdings of ringgit-denominated Government debt securities
141,669 13.9 151,377 13.7 - -

24
KEY DATA1
2013 2014 20157
RM million RM million RM millionBALANCE OF PAYMENTS (NET)
Balance on current account 35,485 47,317 9,968
USD million 11,262 14,457 2,778
Goods 96,552 113,414 27,547
Services -9,592 -11,188 -3,762
Primary income -33,975 -37,322 -8,539
Secondary income -17,498 -17,586 -5,278
Balance on capital and financial accounts -20,231 -81,325 -29,666
Net errors and omissions -605 -2,500 4,002
Overall balance 14,649 -36,507 -15,696
RM million
% growth
% share
RM million
% growth
% share
RM million
% growth
% share
EXTERNAL TRADE
Gross exports 719,992 2.5 766,129 6.4 183,240 -2.5
USD million 228,503 234,085 50,633
Manufactured 548,146 5.1 76.1 587,250 7.1 76.7 142,755 0.1 77.9
Agriculture 68,799 -14.4 9.6 69,204 0.6 9.0 14,321 -16 7.8
Mining 97,937 3.7 13.6 104,594 6.8 13.7 25,014 -6.9 13.7
Gross imports 648,695 6.9 682,982 5.3 161,906 0.2
USD million 205,876 208,681 44,738
Intermediate goods 379,455 4.3 58.5 408,383 7.6 59.8 96,886 3.0 59.8
Capital goods 98,202 2.2 15.1 96,142 -2.1 14.1 24,615 8.5 15.2
Consumption goods 47,584 8.8 7.3 50,317 5.7 7.4 12,669 4.4 7.8
PRICESIndex % growth Index % growth Index % growth
Counsumer Price Index (2010=100) 107.1 2.1 110.5 3.2 110.5 0.7
Producer Price Index (2010=100) 107.8 -1.7 109.3 1.4 105.0 -5.4
Thousands % growth Thousands % growth Thousands % growthLABOUR
Labour force 13,634.6 3.9 14,082.59 1.39 14,144.210 1.910
Unemployed (Unemployment rate) 424.6 (3.1) 396.99 (2.8)9 442.210 (3.1)10
Total trade 1,368,687 1,449,111 345,146
Trade balance 71,298 83,146 21,334
Gross international reserves (RM billion) 441.9 405.4 392.48
USD billion 134.9 116.0 105.88
Months of retained imports 9.5 8.4 8.08
Short-term external debt (times) 1.3 1.1 1.18
Trading partners (% share to total trade)
ASEAN 27.4 26.8 26.8
European Union 9.9 9.9 10.2
USA 7.9 8.1 8.6
Japan 9.9 9.5 10.2
China 14.9 14.3 14.2
Others 30.0 31.4 30.0

25
KEY DATA
2014 2015
End-March End-March
RM million
% annual change
RM million
% annual change
MONEY AND BANKING3
Money supply M1 327,064.2 11.4 360,340.5 10.2
M2 1,459,864.1 6.3 1,583,570.8 8.5
M3 1,473,982.2 5.9 1,589,743.6 7.9
Banking system
Deposits 1,544,342.7 6.9 1,683,611.2 9.0
Loans 1,246,659.4 10.2 1,361,908.0 9.2
Loan-deposits ratio11 (end of period) 85.1 86.6
Interest rates (average rates at end of period, %)
3-month interbank 3.29 3.73
Commercial banks
Fixed deposits: 3-month 2.97 3.13
12-month 3.15 3.30
Savings deposit 0.98 1.08
Base lending rate (BLR) 6.53 6.79
Treasury bills (3-month) 3.01 2.99
Malaysian Government securities: 1-year 3.07 3.21
5-year 3.66 3.59
End-April 2014 End-April 2015Movement of ringgit12 (end-period)
RM per SDR; % annual change 5.0659 -9.7 4.9881 1.6
RM per USD; % annual change 3.2671 -7.2 3.5705 -8.5
RM per Euro; % annual change 4.5107 -12.0 3.9659 13.7
RM per 100 Yen; % annual change 3.1908 -3.0 3.0016 6.3
Bursa Malaysia (end-period)
FBM KLCI 1,871.52 1,818.27
Market capitalisation (RM billion) 1,738.23 1,738.53
SOCIAL INDICATORS 2014 2015
Life expectancy at birth1 : Male (years) 72.5 n.a
Female (years) 77.2 n.a
Infant mortality1 (per 1000 live births) n.a n.a
Literacy rate1 n.a n.a
Water coverage13 (% of population) n.a n.a
Rural electricity coverage14(% of housing unit) 97.6 n.a
Fixed line telephone subscribers15 (per 100 households) 30.3 n.a
Cellular phone subscribers15 (per 100 population) 148.5 n.a
Broadband subscribers15 (per 100 households) 68.9 n.a
Tourist arrivals (million persons) 22.9 n.a
1 Department of Statistics, Malaysia. 2 Bank Negara Malaysia. 3 Figures in 2015 are rebased at 2005 prices. 4 Ministry of Finance, Malaysia. 5 Economic Report 2014/2015. 6 Preliminary. 7 For the period of January to March 2015. 8 As at 30 April 2015. 9 For the fourth quarter of 2014. 10 Preliminary data for the first quarter of 2015. 11 Excludes transactions by financial institutions. 12 Annual rate of appreciation (+) or depreciation (-). 13 Ministry of Rural and Regional Development. 14 Ministry of Energy, Green Technology and Water, and National Water Services Commission. 15 Malaysian Communications and Multimedia Commission. Note : Urban electricty coverage has reached 100%. Data has been revised by Economic Planning Unit.


Key Economic Indicators


29I.
CO
NS
UM
PT
ION
IND
ICA
TO
RS
Ind
icat
or
/ Mo
nth
2014
2015
Jan
Feb
Mar
Ap
rM
ayJu
nJu
lA
ug
Sep
Oct
No
vD
ecJa
nF
ebM
arA
pr
Sal
es o
f n
ew p
asse
ng
er
cars
(u
nit
s)44
,702
45,7
0452
,127
52,4
8849
,865
51,8
9853
,578
44,8
9841
,397
47,5
4448
,622
55,5
2344
,697
44,9
1759
,318
-
Pro
du
ctio
n o
f ve
hic
les
(un
its)
59,9
29
61,3
30
67,6
58
79,2
07
79,1
62
69,5
30
48,5
27
48,4
76
52,3
46
47,5
24
49,3
47
51,7
46
37,4
6829
,390
39,5
9334
,454
Sal
es o
f m
oto
rcyc
les
(un
its)
34
,230
29,2
7840
,946
42
,65
241
,482
40,0
5634
,587
38,4
8637
,473
35,2
9735
,666
32,5
9632
,876
31,6
1139
,361
29,6
99
Pro
du
ctio
n o
f m
oto
rcyc
les
(un
its)
35
,384
26,0
0438
,188
41,8
8939
,800
41,3
2035
,757
39,4
7335
,734
38,0
9536
,275
32,2
3837
,468
29,3
9039
,593
-
Imp
ort
s o
f co
nsu
mp
tio
ng
oo
ds
(RM
mill
ion
)4,
299
3,47
64,
365
4,32
14,
253
4,25
14,
194
4,21
73,
973
4,33
64,
049
4,58
34,
385
3,90
24,
382
-
Bu
rsa
Mal
aysi
a
(en
d-p
erio
d)
FB
M K
LCI
1,80
4.03
1,83
5.66
1,84
9.21
1,87
1.52
1,87
3.38
1,88
2.71
1,87
1.36
1,86
6.11
1,84
6.31
1,85
5.15
1,82
0.89
1,76
1.25
1,78
1.26
1,82
1.21
1,83
0.78
1,81
8.27
Mar
ket c
apita
lisat
ion
(RM
bill
ion)
1,66
8.56
1,69
8.52
1,71
9.11
1,73
8.23
1,73
6.50
1,77
0.42
1,78
3.69
1,77
6.28
1,77
4.09
1,77
5.51
1,73
1.43
1,65
1.17
1,68
7.84
1,73
3.14
1,73
7.52
1,73
8.53
Pri
ces
(201
0=10
0)
- A
nn
ual
ch
ang
e (%
)
Con
sum
er P
rice
Inde
x3.
43.
53.
53.
43.
23.
33.
23.
32.
62.
83.
02.
71.
00.
10.
9-
Pro
duce
r P
rice
Inde
x1 (D
omes
tic)
2.6
2.6
3.6
3.5
3.7
2.4
1.8
0.5
0.6
-0.7
-1.2
-4.4
-4.8
-5.4
-6.1
-
Lab
ou
r M
arke
t
Ret
renc
hmen
t (no
.)74
083
186
653
291
557
01,
883
440
705
817
551
1,54
71,
259
843
687
-
Vac
anci
es (
no.)
102,
363
133,
543
117,
124
86,3
2271
,837
88,7
2578
,331
78,7
8666
,011
94,0
2683
,763
73,1
8769
,988
52,7
4191
,743
-1
Fig
ures
in 2
014
are
in b
ase
year
200
5=10
0.
30II.
INV
ES
TM
EN
T IN
DIC
AT
OR
S
No
te:
1
Com
mer
cial
ban
k ra
te.
2
Fig
ures
for
2013
are
bas
ed o
n da
ta p
ublis
hed
in th
e M
onth
ly S
tatis
tical
Bul
letin
Dec
embe
r 20
13 b
y B
ank
Neg
ara
Mal
aysi
a.
3 B
egin
ning
Jan
uary
201
3, c
apita
l com
pone
nts
are
repo
rted
bas
ed o
n B
ase
III C
apita
l Ade
quac
y F
ram
ewor
k.
4
Hou
seho
ld s
ecto
r =
tota
l loa
ns b
y pu
rpos
e to
hou
seho
lds.
5
Qua
rter
ly d
ata.
n.e.
c -
not e
lsew
here
cla
ssifi
ed.
Ind
icat
or
/ Mo
nth
2014
2015
Jan
Feb
Mar
Ap
rM
ayJu
nJu
lA
ug
Sep
Oct
No
vD
ecJa
nF
ebM
arA
pr
Sal
es o
f n
ew c
om
mer
cial
veh
icle
s (u
nit
s)
5,5
71
5,01
46,
797
6,24
46,
074
6,66
36,
689
6,22
76,
374
6,64
36,
691
9,13
75,
905
5,47
37,
996
-
Imp
ort
s (R
M m
illio
n)
Cap
ital g
oods
7,97
26,
463
8,26
08,
318
8,36
78,
716
7,28
38,
588
6,91
17,
740
7,99
89,
526
8,18
96,
878
9,54
8-
Inte
rmed
iate
goo
ds34
,072
27,7
1132
,279
32,8
0834
,567
33,5
6834
,690
37,6
2434
,989
41,0
9231
,408
33,5
7433
,063
29,3
6634
,457
-
Man
ufa
ctu
rin
g p
roje
cts
MIT
I App
rova
ls (
RM
mill
ion)
3,42
16,
681
3,18
35,
502
19,0
965,
198
8,70
47,
877
3,60
44,
578
2,94
81,
062
--
--
N
ew in
vest
men
t2,
149
588
2,50
51,
707
18,2
183,
480
6,90
41,
740
742
2,72
92,
408
301
--
--
R
e-in
vest
men
t1,
272
6,09
467
73,
795
878
1,71
81,
800
6,13
72,
862
1,84
954
076
1-
--
-
Bas
e le
nd
ing
rat
e (%
)16.
536.
536.
536.
536.
536.
536.
786.
796.
796.
796.
796.
796.
796.
796.
79-
Mo
ney
su
pp
ly (
An
nu
al %
ch
ang
e)2
M1
11.6
10.7
11.4
11.3
9.6
10.2
9.1
7.7
6.7
6.0
6.3
5.7
4.3
7.8
10.2
-M
36.
45.
95.
96.
05.
55.
65.
74.
85.
25.
47.
17.
06.
16.
97.
9-
Tota
l Cap
ital
Rat
io (
%)3
14.5
14.5
14.5
14.6
14.6
15.3
15.3
15.5
15.5
15.6
15.3
15.9
15.4
15.3
15.2
-N
et im
pai
red
loan
s ra
tio
(%
)1.
31.
31.
31.
31.
31.
31.
31.
31.
31.
31.
31.
21.
21.
31.
2-
Ban
kin
g S
yste
m :
Lo
ans
Ap
pro
ved
by
Sec
tors
(R
M m
illio
n)
28,3
5427
,139
35,6
5733
,534
31,1
3033
,452
33,1
4734
,575
38,0
2337
,387
35,2
3433
,794
30,9
9226
,746
36,2
62-
Prim
ary
agric
ultu
re42
233
334
039
221
41,
163
914
604
624
906
755
256
1,18
028
22,
455
-M
inin
g an
d qu
arry
ing
650
1,53
712
718
229
939
217
916
710
11,
239
1,08
128
233
21,
016
158
-M
anuf
actu
ring
(incl
udin
g ag
ro-b
ased
)1,
579
1,68
22,
172
1,25
71,
587
1,62
22,
195
2,39
92,
373
1,64
61,
521
1,65
42,
144
1,26
12,
417
-S
ervi
ces
3,4
54
3,65
77,
590
4,78
44,
236
3,94
34,
550
4,84
65,
690
7,62
26,
444
6,30
53,
857
4,95
77,
161
-C
onst
ruct
ion
1,30
91,
234
1,30
92,
190
1,33
21,
591
1,65
72,
694
3,66
11,
958
1,88
22,
774
1,95
61,
020
1,70
4-
Rea
l Est
ate
1,74
01,
975
3,17
32,
682
2,17
53,
751
2,85
92,
301
2,43
92,
735
3,71
72,
615
1,78
52,
664
2,61
7-
Hou
seho
ld s
ecto
r419
,073
16,5
3520
,719
21,4
6820
,714
20,8
1620
,647
20,5
7920
,561
21,0
3719
,725
19,5
3519
,521
15,2
9019
,321
-O
ther
sec
tor
n.e.
c.12
718
622
757
957
317
514
598
52,
575
245
110
373
217
257
428
-
Lo
ans
Dis
bu
rsed
by
Sec
tors
(R
M m
illio
n)
94,4
0773
,820
90,1
7089
,394
81,7
3287
,021
84,6
1590
,263
94,8
1696
,907
87,7
9210
2,99
591
,513
77,0
3298
,778
-P
rimar
y ag
ricul
ture
3,77
12,
380
2,56
52,
730
1,95
72,
541
1,98
02,
475
2,50
52,
493
2,75
03,
141
2,70
62,
251
3,86
5-
Min
ing
and
quar
ryin
g59
91,
397
1,51
51,
601
707
1,56
360
856
767
064
770
81,
582
3,89
21,
968
1,17
9-
Man
ufac
turin
g (in
clud
ing
agro
-bas
ed)
19,3
5716
,291
18,7
4118
,404
17,2
6717
,101
16,7
7616
,536
18,2
1719
,592
16,2
9218
,790
16,9
1514
,441
19,0
75-
Ser
vice
s 3
0,13
8 2
2,69
2 3
0,90
5 2
8,11
4 2
7,42
7 3
0,28
7 2
8,82
0 3
4,25
9 3
5,04
9 3
5,30
3 3
0,76
4 3
6,23
9 3
1,07
3 2
4,86
9 2
9,96
1 -
Con
stru
ctio
n7,
473
3,88
05,
462
5,53
74,
444
4,54
35,
147
4,77
15,
040
6,94
35,
513
6,78
95,
633
5,05
06,
673
-R
eal E
stat
e4,
748
4,02
04,
171
3,95
93,
745
4,01
93,
554
4,38
24,
716
3,80
54,
931
5,56
74,
117
4,16
84,
988
-H
ouse
hold
sec
tor4
27,0
0822
,257
25,1
3926
,422
25,0
7925
,788
24,9
4624
,225
25,0
0225
,685
24,4
4627
,637
26,3
7523
,265
28,7
02-
Oth
er s
ecto
r n.
e.c.
1,31
290
31,
670
2,62
81,
106
1,17
92,
785
3,04
83,
616
2,44
02,
388
3,25
080
11,
021
4,33
4-
Reg
istr
atio
n o
f n
ew lo
cal c
om
pan
ies
(no
.)3,
534
3,31
34,
097
4,69
44,
132
3,85
23,
557
3,86
54,
189
4,54
94,
452
4,91
04,
629
3,19
34,
965
-C
om
pan
ies
dis
solv
ed /
stru
ck o
ff (
no
.)1,
384
1,54
61,
453
1,58
260
81,
012
858
691
367
617
494
488
395
146
--
Pro
per
ty O
verh
ang
(en
d p
erio
d)5
Tota
l (un
its)
17,7
7616
,643
14,5
8516
,366
-%
Cha
nge
(pre
ceed
ing)
-0.4
-6.4
-12.
412
.2-
Tota
l (R
M m
illio
n)6,
235
5,67
94,
864
5,62
1-
% C
hang
e (p
rece
edin
g)2.
7-8
.9-1
4.4
15.6
-
31III
. PR
OD
UC
TIO
N IN
DIC
AT
OR
S
Ind
icat
or
/ Mo
nth
2014
2015
Jan
Feb
Mar
Ap
rM
ayJu
nJu
lA
ug
Sep
Oct
No
vD
ecJa
nF
ebM
arA
pr
Ag
ricu
ltu
re S
ecto
rP
alm
Oil
('000
tonn
es)
1,5
09
1,2
76
1,4
97
1,5
56
1,6
57
1,5
70
1,6
66
2,0
32
1,8
97
1,8
93
1,7
51
1,3
65
1,16
11,
122
1,49
51,
693
Pric
e (R
M/to
nne)
2,52
8.50
2,63
2.00
2,85
5.00
2,68
9.50
2,59
3.00
2,43
4.50
2,40
0.00
2,17
3.50
2,05
5.50
2,17
2.00
2,21
9.00
2,14
4.00
2,29
4.00
2,26
4.50
2,24
0.00
2,16
0.00
Rub
ber
(ton
nes)
92,
217
73,
428
41,
734
36,
261
43,
757
55,
384
60,
111
50,
529
60,
187
47,
788
52,
733
53,
198
81,
754
74,
469
60,9
18-
Pric
e (s
en/k
g)70
3.16
623.
3262
3.55
578.
2154
4.13
543.
8853
4.35
523.
2648
5.65
485.
7450
3.55
505.
2750
3.64
499.
8051
2.93
-C
ocoa
, exp
ort u
nit v
alue
(R
M/to
nne)
9,4
57
9,9
87
9,9
38
10,
008
9,6
75
10,
007
10,
475
10,
743
10,
381
10,
828
10,
859
11,
254
11,
201
10,
254
11,
398
-F
ish
land
ing
('000
tonn
es)
100
110
122
133
129
121
132
141
141
142
114
9910
610
712
4-
Live
stoc
k1 :
Pou
ltry
('000
) 16
,974
12
,959
15
,437
15
,947
15
,939
15
,018
13
,556
18
,567
15
,099
34
,565
14
,710
16
,480
16
,374
14,2
9416
,369
16,8
45C
attle
3,
059
1,55
81,
743
2,01
71,
905
3,46
04,
340
4,54
53,
349
3,83
42,
532
3,18
81,
621
1,78
51,
798
1,62
3G
oats
1,19
71,
621
1,68
31,
876
1,81
32,
759
2,84
22,
667
2,62
77,
005
1,63
11,
824
1,15
51,
470
1,65
91,
709
Co
nst
ruct
ion
Sec
tor
No.
of h
ouse
s ap
prov
ed11
,258
15
,769
15
,540
18
,119
18
,327
22
,096
18
,857
13
,633
11
,812
13
,981
11
,605
14
,024
11
,511
-
--
New
adv
ertis
ing
& s
ales
per
mits
(no
.)10
5 82
95
13
1 11
1 91
14
5 12
3 99
10
1
106
83
61
--
-Tr
ansp
ort
Sec
tor
Hig
hway
(no
. of v
ehic
les
‘000
)13
7,70
912
7,70
414
5,05
814
0,89
214
5,88
314
6,19
214
1,37
414
9,88
214
5,36
914
7,32
914
5,81
815
1,24
714
9,53
413
5,30
415
9,39
9-
Urb
an R
ail (
no. o
f pas
seng
ers
'000
)A
mpa
ng L
ine
5,00
64,
793
5,57
35,
461
5,38
75,
336
5,50
85,
253
5,08
85,
239
5,12
95,
498
5,26
54,
490
5,44
6-
Kel
ana
Jaya
Lin
e6,
338
6,10
26,
938
6,96
56,
839
6,79
06,
978
7,03
06,
766
7,06
66,
925
7,23
46,
978
5,91
57,
149
-K
TM
Kom
uter
3,91
63,
379
3,98
43,
890
3,87
13,
969
3,85
53,
757
3,90
44,
103
3,99
64,
333
4,10
93,
891
4,37
6-
KL
Mon
orai
l2,
160
1,87
52,
152
1,87
12,
085
2,08
51,
408
2,05
82,
021
2,13
22,
086
2,37
12,
202
1,93
42,
152
-K
LIA
Eks
pres
& T
rans
it55
253
062
959
683
385
979
186
986
089
787
894
578
773
186
9-
KT
M In
terc
ity T
rain
(no
. of p
asse
nger
s)20
4,45
119
5,55
423
3,23
318
5,54
617
4,89
318
4,66
815
9,73
117
3,05
717
1,83
518
4,77
917
2,02
318
2,89
313
9,80
511
8,49
514
1,16
9-
Ele
ctric
Tra
in S
ervi
ce (
no. o
f pas
seng
ers)
125,
972
118,
295
142,
293
131,
988
144,
166
157,
603
141,
328
139,
672
138,
857
145,
671
139,
048
166,
864
119,
219
108,
051
148,
210
-K
TM
Car
go T
onna
ge (
'000
)46
046
355
469
767
078
958
561
156
254
959
959
755
047
250
5-
Air
(MA
HB
and
Sen
ai)
No.
of p
asse
nger
s (‘0
00)
7,15
96,
694
7,35
06,
856
6,92
47,
454
6,56
07,
088
6,77
57,
030
7,23
08,
548
6,82
56,
677
7,52
4-
Car
go (
tonn
es)
77,2
4463
,516
90,6
4984
,036
85,2
1783
,575
83,1
2486
,362
86,2
4488
,160
93,7
0290
,568
81,6
9073
,749
82,9
65-
Por
t - C
onta
iner
TE
Us
(‘000
)21,
728
1,57
11,
837
1,78
01,
876
1,86
21,
876
1,89
91,
885
1,89
91,
973
1,96
91
,98
31,
767
1,97
6-
Tou
rism
Sec
tor
Tour
ist a
rriv
als
('000
)2,
447
2,11
92,
525
2,17
52,
266
2,34
22,
230
2,27
32,
234
2,24
82,
130
2,44
8-
--
-C
om
mu
nic
atio
n S
ecto
r (s
ub
scib
ers
‘000
)3
Fix
ed L
ine
3,70
13,
671
3,59
73,
564
-C
ellu
lar
42,2
4843
,878
43,7
8944
,972
-B
road
band
(in
clud
es w
irele
ss L
AN
) 6,
412
6,89
37,
544
9,59
9-
Ind
ust
rial
Pro
du
ctio
n In
dex
- A
nn
ual
ch
ang
e (%
)3.
16.
74.
34.
75.
97.
00.
66.
55.
45.
14.
87.
47.
05.
26.
9-
Min
ing
Sec
tor
Pro
duct
ion
Inde
x - A
nnua
l cha
nge
(%)
-0.6
-1.6
-0.8
3.9
0.4
1.4
-7.8
3.6
7.1
11.5
7.6
6.9
8.3
9.2
9.2
-C
rude
Oil
& C
onde
nsat
es (
'000
bpd
)458
358
059
059
058
758
656
056
257
761
367
067
168
069
369
7-
Tapi
s B
lend
(U
SD
/bar
rel)
115.
2411
4.41
113.
4011
4.21
116.
4211
6.42
110.
6810
6.03
101.
8191
.07
82.2
765
.91
50.6
660
.73
58.1
361
.18
Dat
ed B
rent
(U
SD
/bar
rel)
107.
5710
8.81
107.
4110
7.88
109.
6811
1.87
106.
9810
1.92
97.3
487
.27
78.4
462
.16
48.4
257
.93
55.7
958
.90
Nat
ural
Gas
(m
msc
fd)5
6,56
76,
562
6,52
96,
310
6,28
96,
615
5,09
56,
294
6,36
06,
489
6,64
86,
553
6,49
36,
423
--
Tin
(to
nnes
)28
828
631
927
432
034
531
432
734
829
630
533
5-
--
-E
lect
rici
ty S
ecto
rP
rodu
ctio
n In
dex
- Ann
ual c
hang
e (%
)0.
28.
74.
63.
94.
65.
84.
98.
46.
23.
43.
33.
06.
31.
93.
8-
Max
imum
dem
and
(MW
)15
,416
15,9
3716
,294
16,3
5416
,583
16,9
0116
,443
15,9
9816
,299
16,2
6016
,194
15,7
9315
,772
16,2
2016
,719
-S
ales
(G
W h
our)
8,40
08,
393
8,00
38,
711
8,74
68,
869
8,96
38,
792
8,58
18,
638
8,80
68,
548
8,49
2 8
,627
8
,034
-
Man
ufa
ctu
rin
g S
ecto
rP
rodu
ctio
n In
dex
- Ann
ual c
hang
e (%
)4.
99.
96.
45.
08.
09.
23.
27.
44.
73.
23.
97.
96.
64.
06.
3-
Sal
es -
Ann
ual c
hang
e (%
)11
.416
.18.
97.
85.
53.
81.
65.
0 4
.2
2.5
2
.6
2.2
2.
8-2
.64.
4-
No
te:
1
Tota
l sla
ught
ered
.
2 C
over
s on
ly K
lang
, Pen
ang,
Joh
or, K
uant
an, T
anju
ng P
elep
as, B
intu
lu a
nd K
uchi
ng (
TE
Us:
Tw
enty
-foo
t equ
ival
ent u
nits
).
3 E
nd o
f per
iod.
4
Bar
rels
per
day
.
5 M
illio
n st
anda
rd c
ubic
foot
per
day
.
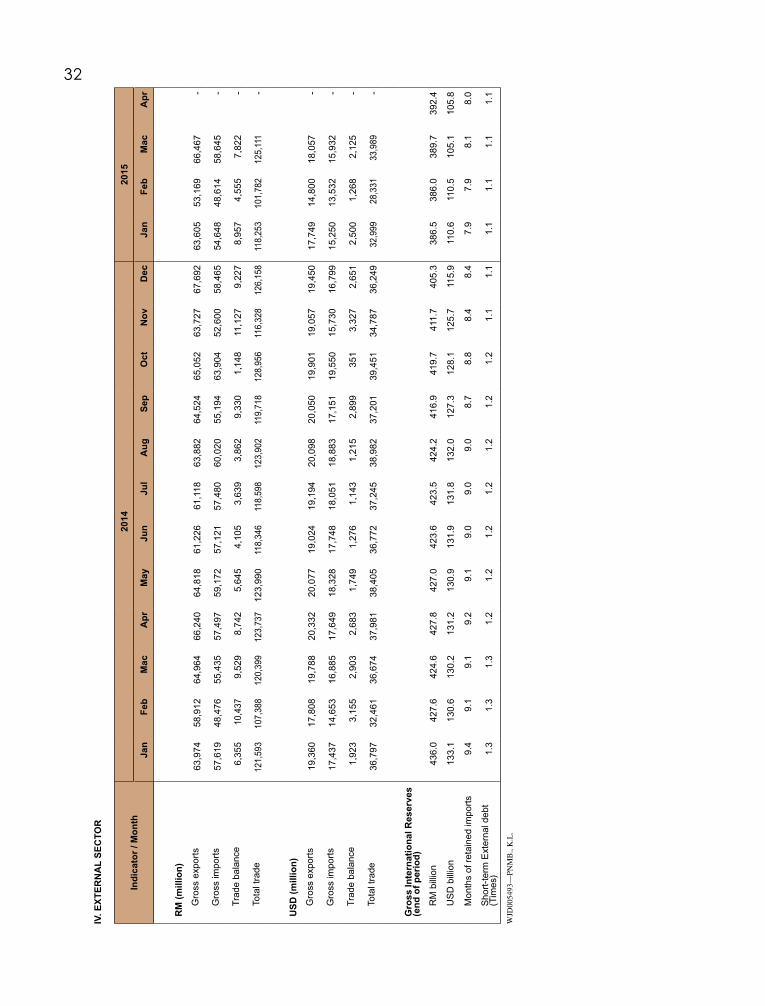
32
Ind
icat
or
/ Mo
nth
2014
2015
Jan
Feb
Mac
Ap
rM
ayJu
nJu
lA
ug
Sep
Oct
No
vD
ecJa
nF
ebM
acA
pr
RM
(m
illio
n)
Gro
ss e
xpor
ts63
,974
58,9
1264
,964
66,2
4064
,818
61,2
2661
,118
63,8
8264
,524
65,0
5263
,727
67,6
9263
,605
53,1
6966
,467
-
Gro
ss im
port
s57
,619
48
,476
55,4
35
57,4
97
59,1
72
57,1
21
57,4
80
60,0
20
55,1
94
63,9
04
52,6
00
58,4
65
54,6
48
48,6
14
58,6
45
-
Tra
de b
alan
ce 6
,355
1
0,43
7 9
,529
8
,742
5
,645
4
,105
3
,639
3
,862
9
,330
1
,148
1
1,12
7 9
,227
8
,957
4
,555
7
,822
-
Tota
l tra
de
121
,593
1
07,3
88
120
,399
1
23,7
37
123
,990
1
18,3
46
118
,598
1
23,9
02
119
,718
1
28,9
56
116
,328
1
26,1
58
118
,253
1
01,7
82
125
,111
-
US
D (
mill
ion
)
Gro
ss e
xpor
ts 1
9,36
0 1
7,80
8 1
9,78
8 2
0,33
2 2
0,07
7 1
9,02
4 1
9,19
4 2
0,09
8 2
0,05
0 1
9,90
1 1
9,05
7 1
9,45
0 1
7,74
9 1
4,80
0 1
8,05
7 -
Gro
ss im
port
s 1
7,43
7 1
4,65
3 1
6,88
5 1
7,64
9 1
8,32
8 1
7,74
8 1
8,05
1 1
8,88
3 1
7,15
1 1
9,55
0 1
5,73
0 1
6,79
9 1
5,25
0 1
3,53
2 1
5,93
2 -
Tra
de b
alan
ce 1
,923
3
,155
2
,903
2
,683
1
,749
1
,276
1
,143
1
,215
2
,899
3
51
3,3
27
2,6
51
2,5
00
1,2
68
2,1
25
-
Tota
l tra
de
36,
797
32,
461
36,
674
37,
981
38,
405
36,
772
37,
245
38,
982
37,
201
39,
451
34,
787
36,
249
32,
999
28,
331
33,
989
-
Gro
ss In
tern
atio
nal
Res
erve
s(e
nd
of
per
iod
)
RM
bill
ion
436.
042
7.6
424.
642
7.8
427.
042
3.6
423.
542
4.2
416.
941
9.7
411.
740
5.3
386.
538
6.0
389.
739
2.4
US
D b
illio
n13
3.1
130.
613
0.2
131.
213
0.9
131.
913
1.8
132.
012
7.3
128.
112
5.7
115.
911
0.6
110.
510
5.1
105.
8
Mon
ths
of r
etai
ned
impo
rts
9.4
9.1
9.1
9.2
9.1
9.0
9.0
9.0
8.7
8.8
8.4
8.4
7.9
7.9
8.1
8.0
Sho
rt-t
erm
Ext
erna
l deb
t (T
imes
)1.
31.
31.
31.
21.
21.
21.
21.
21.
21.
21.
11.
11.
11.
11.
11.
1
IV. E
XT
ER
NA
L S
EC
TO
R
WJD
0054
93—
PNM
B.,
K.L
.