Managing the Malaysian - MIR · Managing the Malaysian 1 Economy Overview When Budget 2001 was...
187
5
Transcript of Managing the Malaysian - MIR · Managing the Malaysian 1 Economy Overview When Budget 2001 was...
5
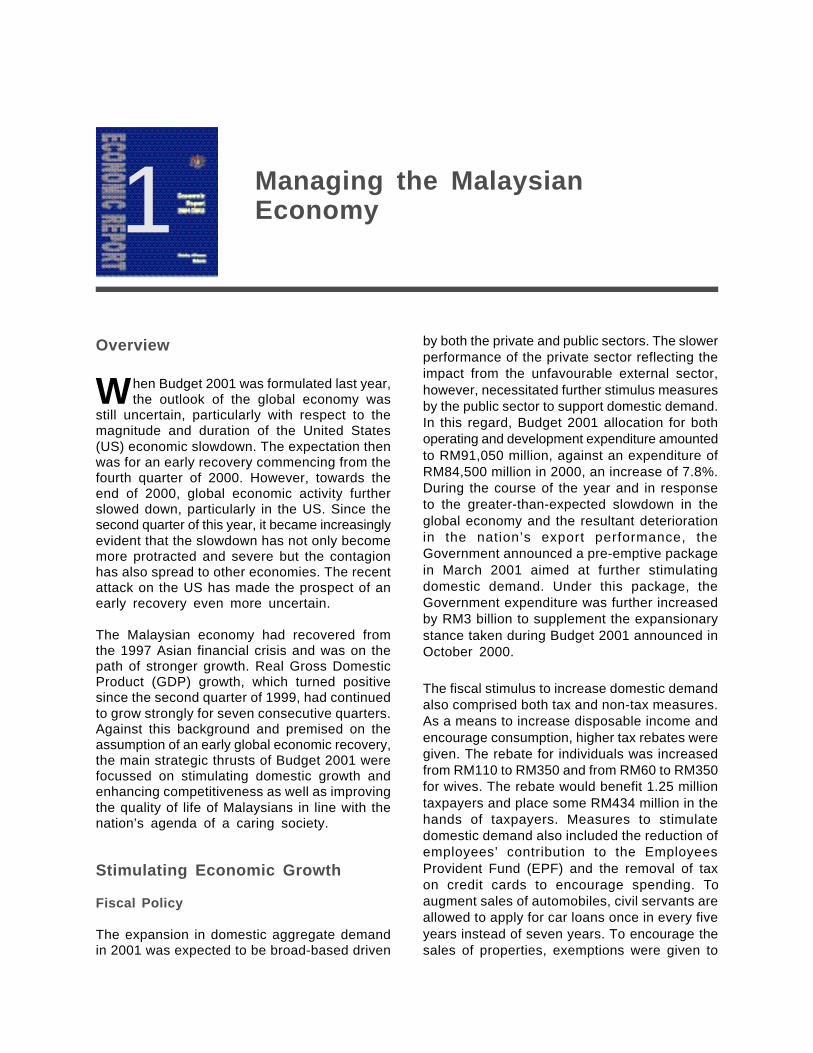
Managing the MalaysianEconomy1
Overview
When Budget 2001 was formulated last year,the outlook of the global economy was
still uncertain, particularly with respect to themagnitude and duration of the United States(US) economic slowdown. The expectation thenwas for an early recovery commencing from thefourth quarter of 2000. However, towards theend of 2000, global economic activity furtherslowed down, particularly in the US. Since thesecond quarter of this year, it became increasinglyevident that the slowdown has not only becomemore protracted and severe but the contagionhas also spread to other economies. The recentattack on the US has made the prospect of anearly recovery even more uncertain.
The Malaysian economy had recovered fromthe 1997 Asian financial crisis and was on thepath of stronger growth. Real Gross DomesticProduct (GDP) growth, which turned positivesince the second quarter of 1999, had continuedto grow strongly for seven consecutive quarters.Against this background and premised on theassumption of an early global economic recovery,the main strategic thrusts of Budget 2001 werefocussed on stimulating domestic growth andenhancing competitiveness as well as improvingthe quality of life of Malaysians in line with thenation’s agenda of a caring society.
Stimulating Economic Growth
Fiscal Policy
The expansion in domestic aggregate demandin 2001 was expected to be broad-based driven
by both the private and public sectors. The slowerperformance of the private sector reflecting theimpact from the unfavourable external sector,however, necessitated further stimulus measuresby the public sector to support domestic demand.In this regard, Budget 2001 allocation for bothoperating and development expenditure amountedto RM91,050 million, against an expenditure ofRM84,500 million in 2000, an increase of 7.8%.During the course of the year and in responseto the greater-than-expected slowdown in theglobal economy and the resultant deteriorationin the nation’s export performance, theGovernment announced a pre-emptive packagein March 2001 aimed at further stimulatingdomestic demand. Under this package, theGovernment expenditure was further increasedby RM3 billion to supplement the expansionarystance taken during Budget 2001 announced inOctober 2000.
The fiscal stimulus to increase domestic demandalso comprised both tax and non-tax measures.As a means to increase disposable income andencourage consumption, higher tax rebates weregiven. The rebate for individuals was increasedfrom RM110 to RM350 and from RM60 to RM350for wives. The rebate would benefit 1.25 milliontaxpayers and place some RM434 million in thehands of taxpayers. Measures to stimulatedomestic demand also included the reduction ofemployees’ contribution to the EmployeesProvident Fund (EPF) and the removal of taxon credit cards to encourage spending. Toaugment sales of automobiles, civil servants areallowed to apply for car loans once in every fiveyears instead of seven years. To encourage thesales of properties, exemptions were given to
18
stamp duty for the sales and purchase, transferand loan agreements while for civil servants,processing fees were exempted for purchasesof completed properties up to the end of 2001.At the same time, the housing loan eligibility ofcivil servants was increased. Additional criticalallowances were also given to doctors and nurses,headmasters and principals while incentive andmeal allowances were given or increased forthe personnel of the Armed Forces and Police.
Monetary Policy
The thrust of monetary policy in 2001 continuesto focus on complementing the fiscal stimulusin supporting economic activities. Given the lessfavourable external environment, in particularthe slowdown of the US and Japanese economiesat the beginning of the year, the pursuit of aneasier monetary stance is necessary to mitigatethe slack in external demand. The policy stancehas been facilitated by the low inflationaryenvironment as well as the global easing ofinterest rates. The ample liquidity in the bankingsystem helped to maintain low interest rates toensure the financing of economic activities atreasonable costs. Despite the low interest rates,depositors continue to enjoy positive real ratesof return on savings.
The banking sector expanded their financingactivities through loans and private debt securities(PDS) financing, which grew by 4% in the firsteight months of the year. Lending was broad-based, with loans extended for the purchase ofresidential property, manufacturing sector,wholesale trade and the purchase of passengercars. Meanwhile, measures continue to be takento improve the financing of small- and medium-enterprises (SMEs), an important mainstay ofthe economy.
In the foreign exchange market, the ringgit, whichis pegged to the US dollar since September1998, remained relatively strong against mostmajor and regional currencies in tandem withthe strong US dollar in the first seven monthsof 2001. By virtue of the peg, the ringgit mirrorsthe movements of the US dollar. As such, theringgit has since 11 September, depreciated bybetween 0.2% to 3% against major and regional
currencies, following the weakening of the USdollar. Nevertheless, the ringgit peg will be closelymonitored against both domestic and externaldevelopments to ensure that it remains consistentwith macroeconomic fundamentals. Meanwhile,the ringgit peg continues to provide anenvironment of stability and predictability tofacilitate economic activities.
Capital Market
The equity market remains generally lacklustrein 2001, in line with other major and regionalmarkets on concerns of the global economicslowdown. In July and August, the equity marketbegan to improve, but the uptrend was eventuallyaffected by the September attacks on the USand the subsequent fall in stock prices worldwide.The bond market, however, continues to growin 2001, reflecting its increasing significance asan alternative to financing by the banking system.In this regard, the Securities Commission (SC),as the sole regulator of the bond market, continuesto undertake measures to promote the bondmarket, in particular Islamic debt issues andasset-backed securities. The issuance of IslamicPDS has been rising, reflecting its growingacceptance to account for 37% of total new PDSissues approved by SC in the first half of 2001(2000: 25%). The issuance of asset-backedsecurities, however, has yet to pick up. In addition,further amendments were made to the SecuritiesCommission Act, aimed at establishing an efficientregulatory regime for capital raising and in tandemwith developing the capital market as the preferredfund-raising centre for domestic companies.
Knowledge-based Economy
Recognising that technology, skills and innovationare the main drivers to enhance future growth,Budget 2001 further reinforced the strategy totransform the economy from a production-basedto a knowledge-based economy. The knowledge-based economy or K-based economy presentsa strategy to generate and exploit knowledgeto create new value in the economy, therebycontributing to increasing total factor productivityand raising the long-term growth potential. Toenable the transition to the new economy and
19
address present challenges, the Governmentcommissioned the Knowledge-based EconomyMaster Plan in 2000. The Master Plan, recentlycompleted, is holistic in approach and outlinesthe key strategies to transform the economy tobe highly competitive and resilient.
Measures to expedite Malaysia’s transition intoa K-based economy focussed on efforts to attractthe best brains into the country to create a world-class workforce and enhancing computer literacyand information and communications technologies(ICT) through the greater use of computers.Towards this end, Malaysians who are abroadand with the required expertise were givenincentives to return, in particular through thegranting of permanent status to spouse andchildren and tax exemptions on personal effectsand income remitted into the country. By mid-September 2001, of the 356 applications receivedfrom professionals working overseas, 122 wereapproved in the areas of finance, industries,ICT and medicine.
With regard to enhancing computer literacy, ofthe 4,400 schools identified to be equipped withcomputer laboratories, 50 projects have beencompleted, 1,354 are under various stages ofconstruction and the rest are under the planningstage. To enhance accessibility to computers inline with the one-computer-per-family policy,amendments to the EPF Act were made, allowingwithdrawals for the purchase of computers. Byend-August, EPF has approved 467,832applications totall ing RM1,555 mill ion.Government employees also took advantage ofthe more flexible loan facility, which permits thepurchase of computers once in every five yearsfrom just once, previously.
Developing ICT Industries and Venture Capital
The development of the Multimedia Super Corridor(MSC) marked the beginning of initiatives towardsthe development of a K-based economy. In orderto promote the development of world-class ICTcompanies, various incentives have been providedto attract ICT companies to the MSC. As atSeptember, 563 companies have been awardedMSC-status, of which 48 are world-classcompanies, exceeding the target of 500 and
ahead of the scheduled timeframe of 2003. Thesecompanies have, thus far, invested RM6 billionwhile their exports have increased more thansix times from USD19 million in 1997 to USD127million in 2000 and increasing further to anestimated USD260 million this year. In addition,these companies have also expended a sum of26% of their total expenditure on research anddevelopment (R&D). In terms of employmentgeneration, a total of 11,911 workers wereemployed, of which 82.6% or 9,842 wereknowledge-workers in 2000. The number isexpected to increase to 14,438 and 12,169workers, respectively in 2001.
Further progress in fostering synergy has beenmade with the addition of an eighth MSC flagshipapplication on Technopreneur Development. Thenetwork of incubators set up via this flagshipis expected to provide the necessary impetusto the development of technopreneurship.
New high-technology and knowledge-based aswell as idea-based startups for SMEs requiredifferent and more creative modes of funding.Collateral-based traditional bank lending maynot be forthcoming for activities based onpromising ideas or intangible collaterals. Venturecapital financing provides a viable alternative totraditional lending as it provides seed capital forearly startups and acts as business angels forhigh-risk growth sectors. To close the financinggap, the Government announced theestablishment of a venture capital fund totallingRM500 million in Budget 2001. The fund hasbeen channelled to a newly-formed Governmentcompany, namely the Malaysian Venture CapitalManagement Berhad (MAVCAP) in the form ofinterest-free soft loans for a period of 10 years.MAVCAP will implement the Government’sstrategic mandate to drive the developmentand empowerment of innopreneurs andtechnopreneurs to create wealth in the K-basedeconomy as well as development of the venturecapital industry. MAVCAP is expected to launchits financing facilities to the market in October2001. MAVCAP is negotiating to secure a RM1.9billion soft loan from Japan as a source ofadditional funding. A significant portion of thisfunding would be utilised for debt ventures suchas project-based loans, guarantee to banks andexport finance for the ICT industry and high-
20
KNOWLEDGE-BASED ECONOMY :THE WAY FORWARD
Introduction
The world is fast becoming a single borderless global marketplace which is expedited by rapidadvancements in information and communications technologies (ICT). The global economy ischaracterised by high-technology diffusion, information accessibility, capital mobility and the increasinglysophisticated demands of consumers. As such, competing in the current environment is becomingmore and more knowledge-driven. Growth and wealth creation of economies are increasingly propelledby the knowledge, skills and creativity of the workforce, as evident from the experience of highlyproductive countries.
In the case of Malaysia, the imperative to develop into a knowledge-based (K-based) economyis crucial as a strategy to sustain high growth and to remain competitive in order to achieve Vision2020. The nation’s move to a K-based economy is influenced by challenges from increasing globalisationas well as concerns about intense competition for foreign direct investment from relatively labour-surplus and low-waged economies in the region and elsewhere. The move towards a K-basedeconomy is part of a wider plan to become a fully developed and knowledge-rich nation by 2020.
Understanding the Knowledge-based Economy
A K-based economy is one in which knowledge, creativity and innovation play an increasing andimportant role in generating and sustaining growth. While traditional factors of production willcontinue to remain important, knowledge will be the key factor in driving growth through the creationof value added and enhancing productivity and competitiveness. The nucleus of the K-based economyis human capital with its capacity to create, innovate and commercialise knowledge, while ICT willbe a key enabling tool to facilitate the transformation to a K-based economy. In a broad sense,all sectors of the economy will become K-based through productivity-driven strategies to enhancethe application of knowledge vis-à-vis input-driven strategies involving increased inputs of capitalor labour.
The K-based economy essentially comprises two important types of knowledge industries: the firstbeing industries with knowledge as the major product and the second being industries managing,processing and disseminating information. The first category includes industries such as software,biotechnology and information technology (IT) hardware and occupations such as engineers, scientists,programmers and designers, whose major output is research that translates into new products andservices. The second category comprises industries such as telecommunications, banking, insurance,law, medicine, education and the government services. Occupations in this category include managers,bankers, accountants, doctors and teachers. These industries are typically required to handle andmanage information effectively, rather than breakthrough knowledge creation.
Current Status
Malaysia started to lay down the foundation for the K-based economy in the mid-1990s. Amongothers, measures taken include the launching of the Multimedia Super Corridor (MSC), whichrepresents the first phase of the K-based economy agenda. Meanwhile, continuous efforts havebeen taken to enhance several key areas to effect the transformation towards the K-based economy.These include human resource development, science and technology (S&T), R&D, infrastructure
21
and infostructure as well as incentives and financing. At the same time, with the comprehensiveworld-class infrastructure and infostructure in place, MSC offers an excellent and conducive ICTenvironment to spearhead the development of a K-based economy, in particular in attracting knowledgeworkers and high technology industries. To date, MSC has attracted a total of 563 companies,including 48 world-class companies. In addition, MSC promotes several flagship applications, includingelectronic government, smart schools, multipurpose card and telehealth as well as the new technopreneurdevelopment flagship.
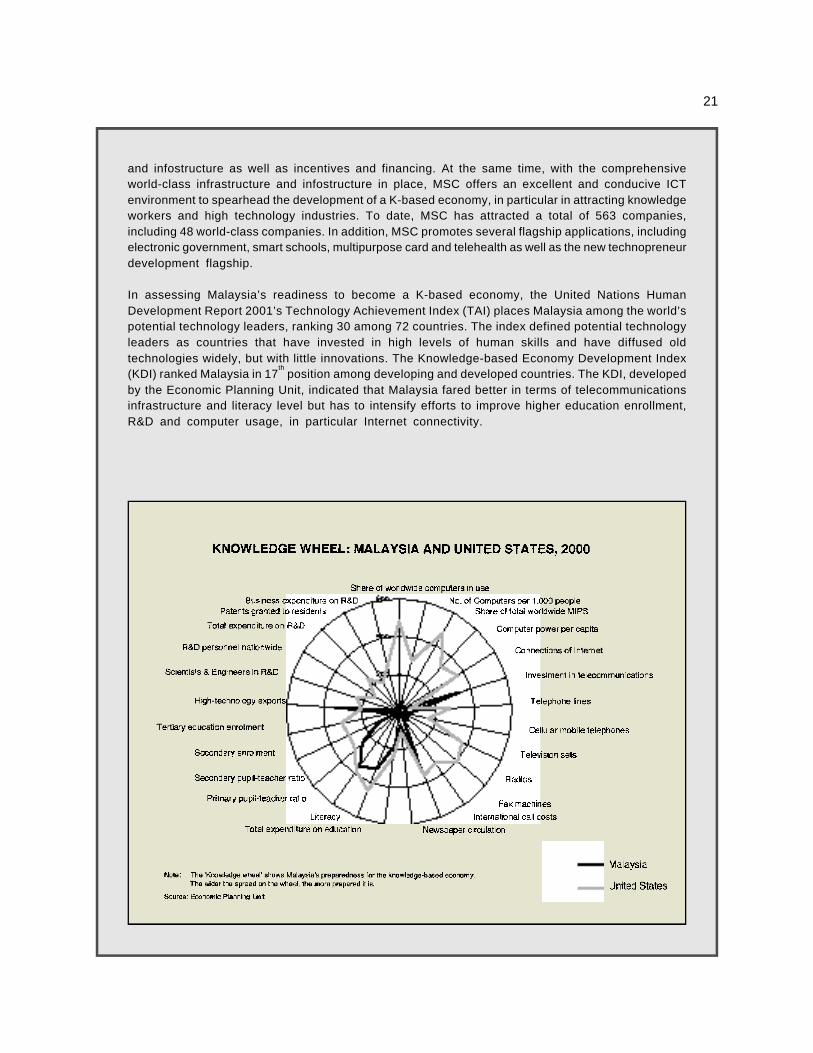
In assessing Malaysia’s readiness to become a K-based economy, the United Nations HumanDevelopment Report 2001’s Technology Achievement Index (TAI) places Malaysia among the world’spotential technology leaders, ranking 30 among 72 countries. The index defined potential technologyleaders as countries that have invested in high levels of human skills and have diffused oldtechnologies widely, but with little innovations. The Knowledge-based Economy Development Index(KDI) ranked Malaysia in 17
th position among developing and developed countries. The KDI, developed
by the Economic Planning Unit, indicated that Malaysia fared better in terms of telecommunicationsinfrastructure and literacy level but has to intensify efforts to improve higher education enrollment,R&D and computer usage, in particular Internet connectivity.
22
Knowledge-based Economy Master Plan
The Government embarked on the project to develop a Knowledge-based Economy Master Planfollowing its announcement in Budget 2000 on the need for a paradigm shift from a production-based economy to a K-based economy. Further initiatives to promote the development to a K-basedeconomy were introduced in Budget 2001. Among others, they included tax incentives to enhancethe usage of ICT, withdrawals from EPF for the purchase of computers and the establishment ofthe Malaysia Venture Capital Management (MAVCAP) in the Ministry of Finance to manage anadditional RM500 million venture capital fund, aimed at promoting the financing of start-ups of hightechnology industries.
The Knowledge-based Economy Master Plan outlines seven strategic thrusts, comprising 155recommendations to expedite the development towards the K-based economy. The seven strategicthrusts with the main salient features are as follows:
i . Cultivating and securing the necessary human resources
- Enhancing human resource development to build the knowledge-human resources. Theemphasis is on education, training and retraining and life-long learning, in particularcomputer literacy.
- Brain gain programme which is aimed at attracting global talent and encouraging Malaysianexperts to return.
ii. Establishing the institutions to drive the K-based economy
- Setting up institutions to drive the development of the K-based economy. In this regard,a National K-based Economy Development Council is proposed to champion and mobiliseefforts as well as monitor the progress towards the development of the K-based economy.
iii. Ensuring the necessary infostructure and infrastructure
- Improving the communications and multimedia infrastructure, such as the availability ofcomputers, integrated high-bandwith and connectivity to the Internet, computer labs andEnglish language learning centres.
- Enhancing infostructure such as networks, local content, incentives and legislation tocreate an enabling environment infrastructure.
iv. Building S&T capacity
- Increasing S&T capacity in terms of expanding the supply of manpower and fosteringthe appreciation of science in schools and tertiary education, aimed at developing innovativeand creative capabilities.
- Enhancing R&D in terms of increased expenditure and forging greater collaboration betweenresearch institutions, universities and industries to create and commercialise knowledgeand technology.
v. Private sector spearheading the K-based economy
- The private sector will continue to be the engine of growth in the K-based economy.
- Promoting greater use of e-commerce, in particular among the small- and medium-industriesand enterprises.
- Harnessing the entrepreneurial skills of the private sector to promote new economicactivities.
23
vi. Developing the K-based civil service
- The civil service will continue to facilitate the development of the K-based economy interms of providing leadership, strategising and drawing up policies, implementing programmes,regulating the economy and fostering collaboration between the public and private sectors.
- Emphasis will be given to the development of human resources in the civil service, inparticular the instilling of a culture of innovation, improving English language capabilitiesand enhancing the absorption and application of ICT.
vii. Bridging the knowledge and digital divides
- Ensuring the K-based economy does not widen disparities between various segmentsof Malaysian society.
- Empowering the rakyat with knowledge through providing access to education.
- Enhancing the affordability of computers and Internet access.
- Addressing the digital gap among races, rural-urban areas, gender and disadvantagedgroups.
Conclusion
The K-based economy is an imperative that Malaysia cannot afford to ignore in order to achievesustainable economic growth and remain globally competitive. The experience of developed countriesfurther attest to growth and wealth being increasingly driven by knowledge. Although measureshave and continue to be taken in progressing towards the K-based economy, more concerted andaccelerated efforts need to be instituted, particularly in human resource development, S&T, R&D,infrastructure, infostructure and the digital divide in order to leapfrog to the K-based economy.
growth sectors. Requirements for these lendingfacilities would be flexible and less conditionaland the provision of hard collateral is notnecessary.
The Government has also established the VentureCapital Fund for Technology Acquisition (VCTA),totalling RM190 million to finance activities relatedto venture capital and technology acquisition.The fund is channelled through a newly-formedGovernment company, namely Kumpulan ModalPerdana Sdn. Bhd. (KMPSB) in the form ofinterest-free soft loans for a period of 10 years.KMPSB will be involved in the formulation of amaster plan and the management of programmesfor investment linkages in high-technologyindustries. It will also play a role in the investmentof high-growth and high-technology startups andbe involved in the expansion of companies andidentification of investment opportunities forMalaysia as well as suitable technologies abroadto be transferred to Malaysia.
To facilitate ICT companies to tap funds in thecapital market, the listing requirements of theMalaysian Exchange of Securities Dealing andAutomated Quotation (MESDAQ) were furtherliberalised. The requirement that 70% of listingproceeds be used in Malaysia was replaced.Under the new requirements, applicants arerequired to provide proof that benefit accruesto Malaysia if more than 50% of the listingproceeds is utilised outside Malaysia. As at end-August 2001, there were four companies listedon MESDAQ, with seven more companiesapproved for listing.
Enhancing the Nation’sCompetitiveness
Strengthening the Financial System
The Government continues with efforts tostrengthen the financial system with a view to
24
investors, the Kuala Lumpur Stock Exchange(KLSE) has set up an internationalcommunications team to disseminate accurate,timely and effective information on the equitymarket. In the light of improvements in the equitymarket, the 10% exit levy on repatriations ofportfolio profits within one year was withdrawnon 2 May 2001. With this, the remaining capitalcontrol restriction on portfolio investment wascompletely removed.
Developing Strategic Partnerships
Establishing strategic partnerships withinternational and global players in the servicessector, particularly in ports, airports,telecommunications and ICT, are critical toensuring sustained competitiveness and resiliencewithin the context of a borderless market. Strategicalliances and partnerships are important inbringing about higher technological andmanagerial skills via technology transfers andinvestment in human capital by foreign partners.Smart partnerships also broaden domesticmarkets with increased access to internationalmarkets provided by marketing links of globalnetwork players. During the year, a number ofdiscussions were held to identify strategic partnersfor the Malaysian airport operator as well as thenational air carrier. In this respect, SchipolInternational B.V. of Holland has entered intoa Memorandum of Understanding to acquire anequity stake in Malaysian Airport Holding Berhad(MAHB). Malaysia Airlines (MAS) has also broughton board foreign management expertise tospearhead efforts at turning around its operations.With regard to West Port of Port Klang, thecountry’s leading port is expected to derivesynergistic benefits from the 30% stake held byHutchinson Whampoa. Similarly, the TanjungPelepas Port (PTP) in Johore, which sold 30%of its equity to Maersk Sealand, is expected tobenefit from the increase in cargo handling.
Improving Corporate Governance
Efforts towards enhancing transparency andaccountability continue to be undertaken in orderto further improve investor confidence. By July,29 or 41% out of the 70 recommendations oncorporate governance proposed by the Finance
creating a more competitive, strong and resilientfinancial sector. The Capital Market Master Planand the Financial Sector Master Plan werelaunched on 22 February and 1 March 2001,respectively. Both the master plans chart thestrategic directions of the capital market andfinancial sectors over the next 10 years, aimedat enhancing their efficiency, resilience andcompetitiveness in an increasingly globalisedand integrated environment. The master plansencompass a change programme to beimplemented in phases.
In line with the objective to enhance domesticcapacity to develop a core of strong domesticinstitutions, further progress was achieved inthe restructuring of the financial sector. The bankmerger programme was successfully implementedwith 52 out of the 54 domestic banking institutionsconsolidated into 10 banking groups, resultingin 98% of total assets of the domestic bankingsector rationalised and consolidated by end-September 2001. The two remaining bankinginstitutions are expected to finalise their mergernegotiations soon.
The capital position of the banking systemcontinues to remain strong with the new capitalfund requirement increased to RM2,000 millionfor domestic banking groups and RM300 millionfor the locally-incorporated foreign banks. As atend-August 2001, nine banking groups and eightforeign banking institutions have complied withthis requirement. The risk-weighted capital ratio(RWCR) increased to 12.6% as at end-August2001 (end-2000: 12.3%), well exceeding the Basleminimum requirement of 8%. Non-performingloans (NPLs) ratio on a 6-month classification,which was 6.3% as at end 2000, have risen to8.3% at end-August, following the slowing downin economic activities and the reclassification ofNPLs previously given indulgence. The level is,however, still below the peak of 9% experiencedduring the financial crisis.
In order to further strengthen the capital market,efforts were undertaken to consolidate thestockbroking industry. As at end-August 2001,seven stockbroking companies had entered intoagreements to acquire or merge with three othercompanies. In addition, as a measure to forgebetter communication with investors and tocounteract misperceptions especially by foreign
25
Committee on Corporate Governance have beenimplemented. To ensure smooth and effectiveexecution, an Implementation Project Teamcomprising representatives from the Ministry ofFinance, BNM, the Registrar of Companies andKLSE was set up. Legislation, rules andregulations are being reviewed and updated ona continuous basis to further improve corporategovernance.
In addition, the KLSE listing requirements wererevamped on 22 January to address, amongothers, the issue of corporate governance. Inparticular, the requirements on the reporting ofextent of compliance with the Malaysian Codeon Corporate Governance, disclosure by directorson the state of internal controls, independenceof the board of directors as well as mandatoryaccreditation were emphasised. Directors of publiclisted companies are also required to attendprescribed training programmes as a prerequisiteto continued listing, aimed at enhancing thecompetency and professionalism of companydirectors. Meanwhile, a Minority ShareholdersWatchdog Group, comprising EPF, LembagaTabung Angkatan Tentera, Lembaga Tabung Haji,Social Security Organisation (SOCSO) andPermodalan Nasional Berhad (PNB), has beenset up, aimed at encouraging proactiveshareholders participation in public listedcompanies.
Eliminating Bureaucratic Delays
The Government continues to step up efforts toeliminate bureaucratic delays as a measure toaccelerate project implementation and completionin order to sustain economic growth as well asimprove delivery of public goods and services.In this context, a task force in the Ministry ofFinance was established to closely monitor theprogress, identify and troubleshoot problem areasin order to ensure smooth implementation of allthe measures announced in Budget 2001. A FlyingSquad was also formed in the Ministry to ensureboth public sector development and privatisedprojects proceed as scheduled.
To further reduce red tape and in line with theneed to empower ministries and agencies withbigger financial authority, tender boards at theministerial and departmental levels can nowapprove tenders of up to RM50 million for works
and RM30 million for supplies and services. Thetender boards are also allowed to approverestricted tenders of up to RM5 million. Forquotations, authority has been delegated toministries to approve up to RM200,000. Forstatutory authorities, the ceiling for the approvalof tender awards for all supplies, services andworks has been increased to RM100 million,while for restricted tenders, they have been givenauthority of up to RM10 million.
In order to accelerate project implementation aswell as reduce processes, the Governmentappointed project management consultants(PMCs) to supervise public sector projects.Projects were also awarded on turnkey anddesign-and-build basis to shorten processing timeas well as expedite project completion.
In terms of expediting payments, all ministriesand agencies are required to make paymentsup to 50% of the value claimed within 14 daysand full payment within 30 days upon receiptof full documentation as per contract requirement.For projects undertaken through PMCs, the latterare allowed to submit claims for payment directto the Accountant General’s office, for whichpayment will be made within 10 days. To facilitateearly project startups, all contractors implementinggovernment projects are given advance paymentsof 15%, while for those implementing smallprojects under the pre-emptive package, advancepayments of up to 75% are allowed.
The Government also implemented the two-yearbudgeting process for the 2002-2003 Budget,with a view to improving the efficiency in thepreparation and examination of the annual budget.The two-year system will facilitate efficientplanning for fund utilisation and programmeimplementation while enabling greater efforts tobe directed towards project monitoring andevaluation.
Continuing the Agenda for CaringSociety
As in previous years, Budget 2001 incorporateda policy on caring society as a national agendain line with the Government’s empathy to theneeds of the less fortunate. In this respect, the
26
CORPORATE GOVERNANCE :AN UPDATE
Introduction
The importance of good corporate governance is increasingly recognised worldwide, particularlyin the context of enhancing investor confidence. Investment inflows are generally drawn to countrieswith credible corporate governance practices. In light of the keen competition for investment, theadherence to good corporate governance practices is an imperative that cannot be ignored. Evenwithin the country, good corporate governance practices will help boost the confidence of domesticinvestors and ultimately induce more stable sources of financing for industries and the capitalmarket. A recent survey on emerging markets also indicated the strong correlation between corporategovernance and price performance of stocks.
Efforts to address corporate governance in Malaysia began way before the Asian financial crisis,although the crisis provided the impetus to accelerate corporate governance reforms. A high levelFinance Committee was established in 1998, comprising both government and industry representatives.The committee was tasked with establishing a framework for corporate governance and settingbest practices for the industry.
Understanding Corporate Governance
There is no one standard definition of corporate governance. The Finance Committee Report defines“Corporate governance as the process and structure used to manage the business and affairs ofthe company towards enhancing business prosperity and corporate accountability, with the ultimateobjective of realising long-term shareholder value, whilst taking into account the interests of otherstakeholders”.
Corporate governance is premised on the principles of transparency, accountability, fairness andresponsibility, which are universal in their application. The implementation of corporate governanceis usually a combination of regulation by the appropriate authorities and self-regulation by themarket. It is, however, observed that statutory regulation alone cannot promote effective governance.Corporate governance initiatives tend to win most support when driven from the bottom up vis-à-vis from the top down.
Finance Committee Report on Corporate Governance
The Finance Committee on Corporate Governance released the Report on Corporate Governancein March 1999, comprising 70 recommendations. The thrust of reform efforts is focussed on strengtheningthe influence of minority shareholders, enhancing the role of boards of public listed companies(PLCs), strengthening regulatory enforcement and promoting high standards of corporate governancethrough training and education. The key recommendations of the Finance Committee Report centredon effecting legal reforms alongside the introduction of a Malaysian Code on Corporate Governanceas well as facilitating training and education at all levels and promoting active participation of minorityshareholders.
An Implementation Project Team (IPT) was also formed and tasked to lead and oversee the implementationof the recommendations of the Report. The progress of the IPT is monitored by the FinanceCommittee to ensure the necessary balance between public and private sector interests in addressingthe various implementation issues. Significant progress has been made in the implementation ofthe Report’s recommendations, particularly in respect of disclosure requirements as well as enhancedstandards of corporate governance and investor protection.
27
■ Malaysian Code on Corporate Governance
The Malaysian Code on Corporate Governance was released in March 2000. The code essentiallyaims at setting out best practices in corporate governance. Although compliance to the code isvoluntary, it is coupled with a requirement in the Listing Requirements of the Kuala Lumpur StockExchange (KLSE), which mandates disclosure of the extent of compliance with principles and bestpractices.
■ Legal and Regulatory Reforms
Effective 1 July 2000, amendments to the securities legislation were made to enhance primarymarket disclosures. The amendments have effectively delineated and streamlined the responsibilitiesof the Securities Commission and the Registrar of Companies with regard to prospectuses, thusresulting in greater legal and regulatory certainty in the area of public offerings of securities.
Further changes have been recommended to the securities and company laws. Among the intendedchanges include the requirement for auditors to report suspected breaches of securities laws, thecodification of key duties of directors and provisions to curb a controlling shareholder’s right tovote in cases involving related party transactions. The implementation of these measures is currentlyunder way.
The revamped Kuala Lumpur Stock Exchange (KLSE) Listing Requirements, released on 22 January2001 are primarily aimed at enhancing standards of corporate governance and investor protection.New provisions have been introduced with existing provisions strengthened in areas relating todisclosure, internal controls, continuing listing obligations, financial reporting and protection ofminority shareholders.
■ Minority Shareholder Watchdog Group
A Minority Shareholder Watchdog Group has been set up to encourage proactive shareholderparticipation in PLCs. It comprises the Employees Provident Fund (EPF), Armed Forces Fund,Pilgrims Fund Board, Social Security Organisation (SOCSO) and Permodalan Nasional Berhad(PNB), representing the largest institutional funds in the country. The Watchdog Group, which isintended to harness the ability of large, albeit minority institutional investors to monitor and institutechange where necessary in the companies they have invested, is expected to be fully operationalin the near future.
■ Training and Education
Amendments were made to the KLSE Listing Requirements to introduce the mandatory accreditationof directors of PLCs as a prerequisite to continued listing. As a measure to enhance standardsof competency and professionalism amongst company directors, directors of PLCs are requiredto attend a prescribed training programme. In this regard, the Malaysian Institute of CorporateGovernance (MICG) is currently undertaking on-going training and education for directors as wellas company secretaries, auditors and investors on corporate governance.
■ Capital Market Master Plan
The Capital Market Master Plan (CMP), which was released in February 2001, comprehensivelycharts the strategic positioning of the Malaysian capital market over the next 10 years. Of the152recommendations in the CMP, there are 10 recommendations related directly to corporate governance.The CMP builds on the Finance Committee Report’s recommendations and further develops thecorporate governance reform agenda in a number of key areas relating to the disclosure of timelyand accurate corporate information, accountability of company directors, financial controllers andmanagement as well as strengthening the role of auditors, encouraging greater institutional investor
28
participation in corporate governance and promoting shareholder activism. The CMP further reinforcesthe corporate governance agenda as a strategic thrust to further enhance investor confidence aswell as developing an efficient and competitive capital market.
Conclusion
It is imperative to move forward in addressing corporate governance issues, particularly in the lightof investors being driven more by sentiment and perception, rather than fundamentals. This is evenmore pertinent given the increasing integration and dynamism of global financial markets, wherelarge flows of funds can be easily transferred across the globe within seconds, facilitated bytechnology advancements. Although notable progress has been achieved in corporate governance,companies need to institute measures to continuously innovate and adapt their corporate governancepractices in order to meet new challenges and seize opportunities. The Government, on its part,is committed towards the enhancement of corporate governance. Measures have and will continueto be taken to further accelerate the corporate governance agenda towards developing the Malaysiancapital market as the preferred fund raising centre for Malaysian companies as well as in attractingforeign investment.
Government has intensified efforts to ensure amore equitable distribution of wealth and benefits,and avoid marginalisation of the disadvantagedgroups. Thus, higher allocations have beenchannelled towards programmes aimed atincreasing the incomes of the poor, enhancingrural accessibility to public utilities and amenities,upgrading rural health facilities and services aswell as improving opportunities for better educationand employment prospects.
In recognition of the contributory role of womenin development, the Government has establishedthe Ministry of Women and Family Development.With the formation of the Ministry, issues andproblems specific to women, including childrenand family, will be given greater focus andattention. Since its establishment, a significantachievement was the amendment of Article 8(2)of the Federal Constitution to include the word‘gender’ so that there would no longer be anylaw or policy which discriminates against women.The Ministry also launched the Women AgainstViolence or WAVE campaign in July 2001, whichis targetted to eliminate all forms of violence,especially violence against women. Efforts willcontinue to be undertaken to further theparticipation and involvement of women in thesocial and economic development of the countryas well as develop Malaysia into a nation of
character, built by families that are resilient, ethical,healthy, knowledgeable and harmonious.
Attack on the US - - - Managing Uncertainties
Following the attack on the US, the outlook ofthe global economy becomes increasinglyuncertain. The attack has not only altered theprospects for an early recovery, but also increasedthe risk of the US economy entering into arecession. The US being the largest economyin the world and accounting for about one-fifthof world output and exports, the contagion onthe economies of major industrialised countriesand the rest of the world would be significant.
Even before the attack, there was increasedevidence of a more protracted slowdown of theworld economy, primarily on account of the sharperdecline in output growth in the three maineconomic blocks, namely the US, Japan andthe euro area. The decline in the US manufacturingoutput continued to worsen, its equity marketbecame increasingly volati le, while theunemployment rate edged upwards and businesssentiment deteriorated. At the same time, Japan,the second largest economy, has not shown anysign of recovery. Depressed consumer demand,
29
weak external sector and a lacklustre pace offinancial and corporate sector restructuring havepointed towards a contraction in Japan’s outputgrowth. The outlook for the euro area becamemore pessimistic with Germany, its largesteconomy, experiencing a stronger downturn,particularly in its industrial sector. The rigiditiesin the labour market and constraints in theEuropean Central Bank (ECB) monetary policyalso contributed to the greater pessimism.
In the aftermath of the attack, the US equitymarket was badly affected with the Dow Jonesdeclining by 684.8 points when it reopened on17 September to close below 9,000 points, thelargest one-day fall ever recorded. There werealso heavy sell-offs across major bourses andfinancial markets. On the day of the attack, stockprices worldwide fell sharply lower, with amongothers, the DAX index plunging by 8.5% in itsbiggest one-day fall and the FTSE index by5.7%, marking its largest single-day fall since1987. The Nikkei index, which had already fallento a 17-year low of 10,196 points on 10 September,declined further by 5.7% to a new low of 9,610.1points on 11 September. Other regional bourses,such as the Hang Seng and the STI also declinedby 8.9% and 7.4%, respectively. Similarly, indicesof the Taiwan, Thailand and Kuala Lumpur stockmarkets, which reopened on 13 September, fellby between 3.8% and 6.7%.
The US dollar has shown signs of greaterpressures as investors liquidate into other ‘safehaven’ currencies. The dollar has beendepreciating against the euro and yen since Julythis year, triggered by changing marketperceptions that the US stance on a strong dollarpolicy had softened as well as the weakeninginvestor sentiment, as reflected by the declinein the US stock market. Since the attack, thedollar has further weakened, declining by 2.4%and 2.5% against the yen and euro, respectivelyas at 27 September.
In response to these adverse developments,the US Administration has put in place a seriesof measures to arrest the slide in investorsentiment and consumer confidence as well asto contain any further decline in the equity markets.The US Fed has injected liquidity into the financialsystem and undertook a further cut in interest
rates. The US Congress has approved USD40billion fiscal allocations for reconstruction, reliefwork and security. A bail-out package of USD15billion has also been approved for the airlines.
In response to the US move, other monetaryauthorities have also taken measures to containand ease the immediate adverse impact on theireconomies. In this regard, a coordinated actionby major central banks has also been taken toreduce interest rates to improve confidence. TheECB has reduced the repo rate by 50 basispoints to 3.75% while the Bank of Japan (BOJ)reduced the discount rate by 15 basis points to0.10%. In addition, with the US dollar depreciatingbroadly against all major currencies, there areexpectations of joint foreign exchange interventionby the G7 authorities, particularly should excessivevolatility occur.
In addition to the impact on global equity andfinancial markets as well as the real economy,the September 11 attack has also clouded effortsin international financial cooperation. Theinternational community’s attention has now beendiverted to address issues pertaining to security,combatting terrorism as well as immediaterecovery measures to counter the deteriorationin the global economic environment. Severalmajor international meetings, such as the WorldBank and International Monetary Fund (IMF)Meetings as well as the Commonwealth meetingsat the level of Finance Ministers and Heads ofGovernments have either been cancelled orpostponed. In the light of these developments,progress on important international financial issuesof concern for developing countries could facea setback, such as efforts in reforming theinternational financial architecture, enhancingsupport for least developed countries (LDCs)through debt relief and leveraging trade fordevelopment, combatting money laundering,strengthening corporate governance as well asother initiatives in the pipeline. The turn of eventshas cast further uncertainty over future effortsto deliberate on collaborative initiatives, includingthe possibility of depriving developing countriesthe opportunity of putting forth issues of concern,particularly relating to the multilateral tradingsystem at the upcoming Fourth World TradeOrganisation (WTO) Ministerial Conferencescheduled in November 2001 in Doha, Qatar.The impact of such delays could have far-reachingimplications for developing countries.
30
Malaysia, being an open economy, where tradeaccounts for more than 200% of GDP, was alsoadversely affected by these externaldevelopments. The growth forecast of theMalaysian economy, which was reviseddownwards to 5-6% for 2001 in March from theBudget 2001 estimate of 7.5%, is being furtheradjusted to 1-2%, following primarily the recentdevelopments in the US.
Notwithstanding this, the strong fundamentalsof the Malaysian economy continue to providesufficient policy flexibility to implement growth-supporting measures to stimulate domesticeconomic activities without jeopardising thesustainability of the nation’s potential growthprospects in the medium- and long-term. Thenation’s current account in the balance ofpayments continues to register strong surplusessince 1998. The external reserves has stabilizedat a higher level and is sufficient to finance 4.6months of retained imports and is 6.2 timesshort-term liabilities, while external debt remainslow and inflation subdued.
In response to the adverse developments in theexternal sector and with a view to minimisingits immediate adverse spillover effects, theGovernment announced another stimulus packageof RM4.3 billion on 25 September 2001. Apartfrom adding further stimulus to domestic economicactivities, the package also aims to cushion theimplications on the poor and other less advantagedsegments of the society from the impact of theeconomic slowdown, generating business andincome opportunities for small enterprises aswell as providing skills training. The largestallocation of RM1 billion is provided for smallprojects in rural and selected urban areasincluding, among others, the construction andupgrading of roads, bridges, water and electricitysupply, and community-based projects. In addition,computer laboratories will be constructed in 2,000more schools, while maintenance works ongovernment buildings and facilities will be steppedup. The package also provides for the doublingof current rates of welfare payments, monthlyallowance for degree and diploma holders tolearn IT, mathematics and languages as well asthe promotion of tourism.
Monetary policy continues to be accommodativeto reinforce fiscal stimulus to sustain economicgrowth. The adoption of an easier monetary stancewill continue to be monitored against domesticand external developments. Following the cuts
in interest rates in the US, BNM reduced its3-month intervention rate on 20 September by50 basis points to 5%. The reduction marks thefirst cut by BNM in more than two years, andis in line with the action taken by several othercentral banks, following the worsening externalenvironment. It is also aimed at enhancingdomestic business sentiment and consumerconfidence to support economic activities.
On the medium-term impact, the prospects remainuncertain as events continue to unfold. ForMalaysia, the diff iculties in the externalenvironment have emerged at the time whenthe nation is just at its first year of the ThirdOutline Perspective Plan (OPP3), 2001-2010 andthe Eighth Malaysia Plan, 2001-2005. To achievethe long-term objective of Vision 2020 of attaininga developed nation status, both Plans projectedan average GDP growth of 7.5% per annum.The slower growth of 1-2% this year and moderaterecovery of 4-5% anticipated next year, however,would necessitate greater efforts at acceleratinggrowth in the subsequent years to recoup lostground during the first two years of the Plans.Given the strong foundation already in place forthe economy, the prospects of accelerating GDPgrowth remain plausible. The Asian financial crisishas shown that despite experiencing the worst-ever recession with the economy contracting by7.4% in 1998, Malaysia was able to recoverstrongly in the following years, with growth ratesof 6.1% and 8.3% in 1999 and 2000, respectively,thereby achieving the growth target of 7.5 % ofthe Second Outline Perspective Plan (OPP2).
Conclusion
The recent development in the US has led togreater uncertainties. As events continue to unfold,the prospect of an early recovery in the US andthe global economy, generally, has becomeincreasingly difficult. In the light of this, theGovernment will constantly monitor and assessdevelopments in the external sector and theirimpact on the economy. Further measuresprimarily premised on promoting growththrough strengthening resil ience andenhancing competitiveness will be put inplace to contain and minimise any immediateadverse spillover effects on the economy and,thus, avoiding further slide in the nation’sgrowth. With the strong economic fundamentalscoupled with flexible and pragmatic policyresponses, the nation will be able to return toits stronger growth path.
Performance and Prospects of theMalaysian Economy2
Overview Of The MalaysianEconomy In 2001
T he performance of the Malaysian economyin 2001 has been adversely affected by the
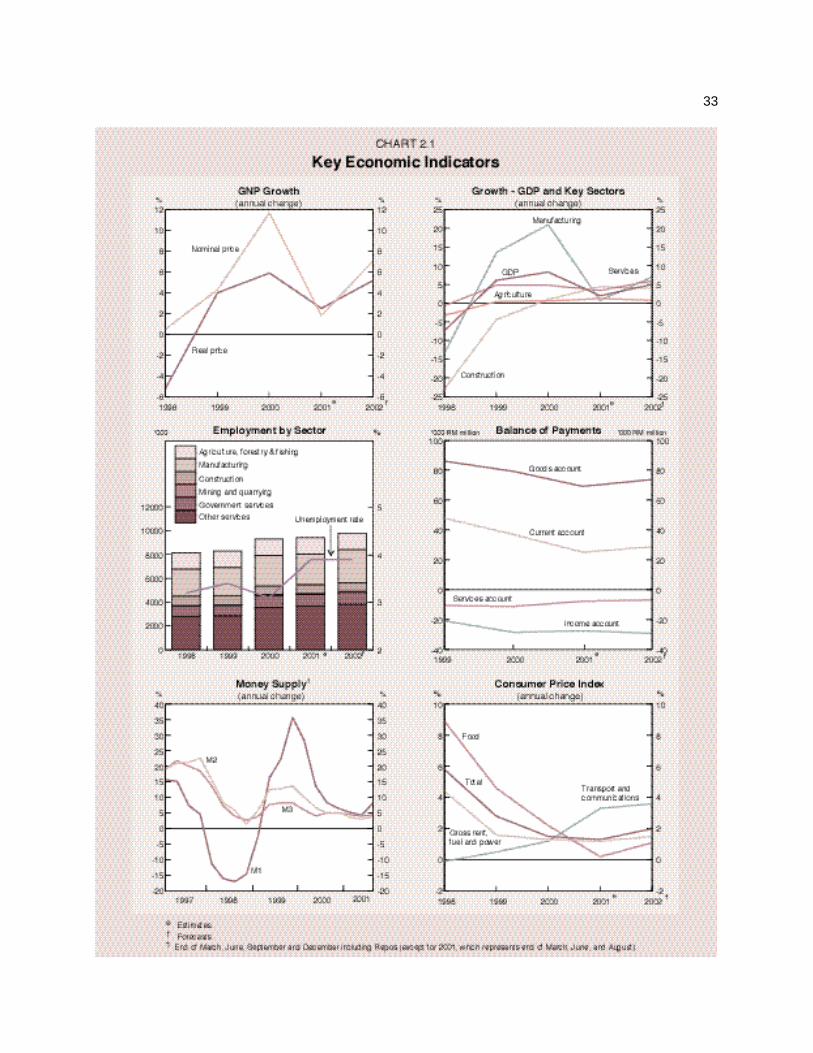
greater-than-expected slowdown in the worldeconomy, particularly in the United States (US)as well as the continuing weak performance ofthe Japanese economy. The recent attack onthe US has led to greater uncertainties withrespect to the severity and duration of the recoveryin the US. There are concerns on the risks ofthe US economy entering into a recession andits contagion on other industrialised anddeveloping economies. In the light of the moredifficult environment, real GDP growth of theMalaysian economy is projected to grow by 1-2% for 2001. Following the lower growth in nominalvalue, Gross National Product (GNP) of 1.8%,GNP per capita is forecast to be somewhat lowerat RM13,333 or USD3,509 (2000: RM13,411 orUSD3,529). In terms of purchasing power parity,however, per capita income is expected toincrease by 1.3% to USD8,944 (2000: USD8,831),after taking into account lower domestic inflation.
All major sectors are expected to be adverselyaffected by the slower growth in the economy,particularly manufacturing which is estimated torecord a sharp deterioration in output growth.The steep decline in value added of themanufacturing sector has, however, to someextent been offset by the better performancefrom the agriculture, construction and servicessectors. The services sector has provided thelead in the growth of the economy on accountof better performance of government servicesand other services sub-sectors. In the construction
sector, fiscal stimulus efforts by the Government,particularly for infrastructure projects coupledwith the construction of low-and medium- costresidential houses, have contributed towards itshigher growth. In the agriculture sector, the higheroutput from palm oil has resulted in a higherrate of growth for the sector.
Given the growing difficulties in the externalenvironment, growth in real GDP has been largelydomestic-led. Expansion in aggregate domesticdemand is driven largely by public sectorinvestment and consumption on account of largerfiscal expansion. Private sector demand in nominalvalue is expected to decline markedly, given theweaker-than-expected external demand whichhas affected investment in manufacturing activitiesas well as the continued reduction in investmentin the property sector, particularly office space,hotels and retail outlets. Given the significantslowdown in private investment activities, thepublic sector implemented additional fiscalstimulus packages to stimulate domestic activities.Consequently, public expenditure, both investmentand consumption, expanded significantly tocontinue registering double-digit growth.Notwithstanding the rapid expansion in publicsector expenditure, the nation’s resource positionremains in surplus although gross national savingsis estimated to decline on account of slowergrowth in income.
The balance of payments position continues toremain favourable. The current account surplus,while narrowing, remains strong. The lower surplusin the current account is partly attributable to asmaller surplus in the goods account against awidening deficit in the transfers account. Thegoods account is expected to register a smaller
32
surplus due to the sharp contraction in exports,while the transfers account deficit continue towiden as a result of higher remittance by foreignworkers. Nevertheless, the services account deficitis likely to improve due to higher net inflow inthe travel account and lower net outflow in thetransport account. Consequently, the currentaccount of the balance of payments is projectedto record a smaller surplus of 7.9% of GNP.With the deficit in the financial account likely toimprove due to smaller net outflows of portfolioand other investments, the overall balance ofpayments is expected to turn around to recorda surplus of RM459 million.
Malaysia’s economic growth continues to beachieved within an environment of low inflationand unemployment. Inflation remains subduedand stable largely on account of the moderationin private sector demand as well as measuresimplemented by the Government to contain priceincreases. In spite of higher retrenchments, thenation still enjoys full employment.
Sectoral Output Performance
The output of major sectors in the economy isexpected to register a slower growth, with thesharpest deterioration expected in themanufacturing sector. The performance of theprimary sector is mixed, with agriculture registeringhigher growth and the mining sector almoststagnating. In the secondary sector, the mostaffected sector is manufacturing with growthdeteriorating significantly, while the constructionsector has benefitted from the fiscal expansionof the public sector. The services sectorperformance is also mixed with sub-sectors suchas electricity and gas and transportation affectedby the slowdown in the manufacturing sector toregister moderate growth, while the governmentservices and other services sub-sectors areanticipated to register higher rates of growth.
The manufacturing sector is expected todecelerate significantly to 0.2% in 2001 (2000:21%) after seven consecutive quarters of robustdouble-digit growth. The decline is largelyattributable to a depressed global market forelectronic products. Given that electronics accountfor close to half of Malaysian manufactured
exports, the output performance of the electronicsindustry, which has deteriorated to 13.1% duringthe first seven months of 2001 (January-July2000: 15.1%), has impacted significantly on thegrowth of the manufacturing sector. While theexport-oriented industries have been adverselyaffected by weak external demand, the domestic-oriented industries have shown greater resilience,largely due to the expansion of output of industriesproducing construction-related materials, transportequipment and consumer products as well asresource-based industries. The growth in theseindustries has provided the support to growthand somewhat cushioned the contraction in themanufacturing sector. The overall decelerationin the sector’s growth has resulted in itscontribution to GDP declining sharply to 0.1percentage point to real GDP growth (2000: 6.3percentage points).
The agriculture, livestock, forestry and fishingsector is envisaged to expand at a higher rateof 1.2% (2000: 0.6%), largely on account ofhigher palm oil output. The output of rubber andsaw logs, however, continues to decline.
In the mining sector, the higher production ofnatural gas is expected to offset the decline incrude oil production. As such, the sector’s outputis projected to increase marginally by 0.9%(2000: 3.1%).
Value added of the construction sector, on theother hand, is expected to expand at a higherrate of 4.9% (2000: 1.0%), spurred by theGovernment’s fiscal expansion programme,particularly for infrastructure projects and theconstruction of low- and medium-cost residentialhousing.
The services sector is projected to continue tosustain its growth at 4.4% (2000: 4.8%). Whilethe electricity, gas and water, wholesale andretail trade and hotels and restaurants sub-sectorsare expected to record moderation in growth intandem with the slowdown in the manufacturingsector and the generally subdued consumersentiment, the finance, insurance, real estateand business services sub-sector is estimatedto achieve strong growth, mainly attributable tothe low interest rates which resulted in higherbank lending especially for housing and consumer
33
34
durables as well as higher demand for insuranceproducts. Given that the services sectoraccounts for 54.6% of GDP, the overall strongergrowth from the sector and the anticipated markeddeterioration in the contribution from themanufacturing sector will result in the servicessector providing the leading contribution to overallgrowth of 2.3 percentage points to GDP growth(2000: 2.6 percentage points).
Domestic Demand
After registering a strong growth of 19.5% in2000, aggregate domestic demand (excludingchanges in stocks) is expected to moderatesignificantly to 7.1%. The relatively slower growthis attributable to weaker private sectorexpenditure, with growth deteriorating sharplyto 3.6% compared with 20.4% in the previousyear. The deterioration in private sector spendingwas somewhat offset by the large fiscal expansionof the public sector with public sectorexpenditure projected to expand strongly by15.4% (2000: 17.6%).
Public investment is envisaged to maintain itsdouble-digit growth of 15.4% (2000: 26.6%). TheFederal Government expenditure in Budget 2001was further augmented by the implementationof a pre-emptive package of RM3 billion in Marchas well as an additional RM4.3 billion inSeptember, in response to the anticipated growingdifficulties following the attack on the US. Apartfrom the Federal Government, the non-financialpublic enterprises (NFPEs), in particular PetroliamNasional Berhad, Tenaga Nasional Berhad andTelekom Malaysia Berhad, also expanded theirexpenditure in new investments for purposes ofupgrading services and capacity expansion. Theexpansion in public sector expenditure is expectedto result in the share of public sector investmentincreasing to 53.2% in 2001 from 50.1% in 2000of total investment, and accounting for 2.4percentage points of GDP growth (2000: 2.8percentage points).
Public consumption which accounts for 45.3%of total public expenditure is expected to registerhigher growth of 15.3% (2000: 8.3%) to supportthe expansion in public investment. The increase
is largely for supplies and services andemolument. The stronger growth in publicconsumption is expected to increase its shareof total consumption to 21.7% in 2001 (2000:20%).
Private sector investment has been adverselyaffected, particularly by the deterioration in theoutput growth of the manufacturing sector aswell as the continued reduction in investmentoutlay in the property sector, especially in officespace, hotels and retail outlets. Consequently,growth in private investment is expected todecelerate sharply to 2% from its strong double-digit growth of 35.9% in 2000. Its share of totalinvestment is, therefore, expected to decline to46.8% compared with 49.9% in 2000.
Private consumption spending is also expectedto expand by 4.1% (2000: 16.4%). This is onaccount of the slight contraction in private sector’sdisposable income attributable to the lowercorporate earnings of the export-orientedindustries and the negative wealth effect fromthe subdued stock market as well as greateruncertainties in employment prospects, whichhave led to more cautious consumer sentiment.To promote private consumption, the Governmenthas introduced several measures in Budget 2001,including providing higher tax rebates to individualtaxpayers, relaxing Government employees’eligibility for car loans, reducing employees’contribution to the Employees Provident Fund(EPF) as well as removing the RM50 charge oncredit cards.
External Demand
The performance of the nation’s external demandhas been severely affected by the markedslowdown in the industrialised economies,particularly by the sharper-than-expecteddownturn in the global electronics cycle. Exportof goods and non-factor services is expectedto contract sharply by 9.3% (2000: 17%), afterfifteen years of sustainable strong growth.Consequently, the share from external demandto GDP is expected to reduce to 112.3%(2000: 125.5%).
35
Export of goods is envisaged to decline by10.8% to RM333,464 million after a strong double-digit growth of 17% in 2000, led by a significantcontraction in the exports of manufactured goods,particularly electronics. The weak global demandfor electronics has led to sales of electronicsdeclining sharply, resulting in a large inventoryoverhang. The export performance of majorcommodities is also expected to remainunfavourable, primarily attributable to lower pricesfor all major commodities, including palm oiland crude oil. Export of non-factor services isexpected to decelerate to 1.7% compared with16.8% in 2000. This is in tandem with lowerexports of goods. Within the non-factor services,the stronger contribution from tourism has,however, continued to support the sector’s output.For the period January-August 2001, touristarrivals totalled 9.5 million, an increase of 44.1%over the same period in 2000.
Similarly, the import of goods and non-factorservices is expected to reduce by 9.2% comparedwith a strong double-digit of 23.9% in 2000. Thedecline reflects mainly moderation in domesticdemand conditions as well as the reduction inimports of intermediate inputs for themanufacturing sector. The slower growth in privateinvestment also resulted in lower imports forcapital goods, while the more cautious consumersentiment has led to a more subdued import ofconsumption goods. The import of intermediategoods is expected to register a significantcontraction of 11.4%, while the import of capitaland consumption goods are anticipated to registera relatively smaller decline of 1% and 5.3%,respectively.
Balance of Payments
Malaysia’s balance of payments position isenvisaged to remain strong despite continuedweakening in the external environment. Thesurplus in the current account remains large atRM25,070 million or 7.9% of GNP (2000: 10.2%of GNP), registering the fourth consecutive surplussince 1998. The smaller surplus is partly dueto a lower net inflow in the goods account andthe continued larger net outflow in the transfersaccount.
The goods account is expected to continue toregister a surplus of RM69,175 million, albeitsmaller than RM79,247 million in 2000. Thesmaller surplus is attributable to the sharperdecline in exports (10.8%) relative to imports(10.3%). In the services account, lower importsas well as the contraction in exports are expectedto reduce the outflow in transportation and otherservices. At the same time, the higher receiptfrom travel, largely from the significant increasein the number of incoming tourists, is expectedto contribute to the significant narrowing of thedeficit in the services account to RM7,694 million(2000: -RM11,212 million).
With lower corporate earnings arising from weakerexports, especially of multinational companiesin the electronics industries, the income account(mainly investment income) is expected to registera smaller deficit of RM27,627 million (2000:-RM28,554 mill ion) on account of lowerrepatriation of profits. The deficit in the transfersaccount is, however, envisaged to increase toRM8,784 million (2000: -RM7,522 million),following higher remittances abroad by foreignworkers.
The financial account, which comprises direct,portfolio and other investments, including loans,trade credits and bank deposits, is expected toperform better with a smaller net outflow ofRM17,948 million (2000: -RM23,848 million). Thebetter outcome is attributable to continuing netinflows of direct investment (RM5,642 million)as well as the lower net outflows of portfolioinvestment (-RM3,329 million) and otherinvestment (-RM20,261 million). The net inflowof direct investment reflects continuing investmentcommitment by foreign investors as well as foreignequity acquisition in selected services sub-sectors,such as shipping and transportation industries.As for other investment, the smaller net outflowis partly due to narrowing interest differentialsbetween domestic and international rates,particularly in the US, thus reducing the incentivefor Malaysians to retain funds abroad over alonger period. Reverse investment by Malaysiancompanies is expected to decline due to thestringent approval criteria by Bank NegaraMalaysia (BNM) as well as liquidation of businessoverseas, following corporate restructuringexercises undertaken by Malaysian companies.
36
The overall position of the balance of paymentsis expected to improve slightly to register a surplusof RM459 million after experiencing a large deficitof RM3,703 million in 2000. This surplus issignificant considering that net outflows due toerrors and omissions, which included foreignexchange revaluation loss, amounted to RM6,663million (2000: -RM11,814 million). Thus, the netinternational reserves is expected to remain strongduring the year. As at 29 September 2001, thelevel of reserves amounted to RM112,934 millionor USD29,720 million, a significant increase fromits lowest level in May 2001 (RM98,536 millionor USD25,931 million). The current reservesposition is adequate to finance 4.6 months ofretained imports and is 6.2 times the short-termexternal debt.
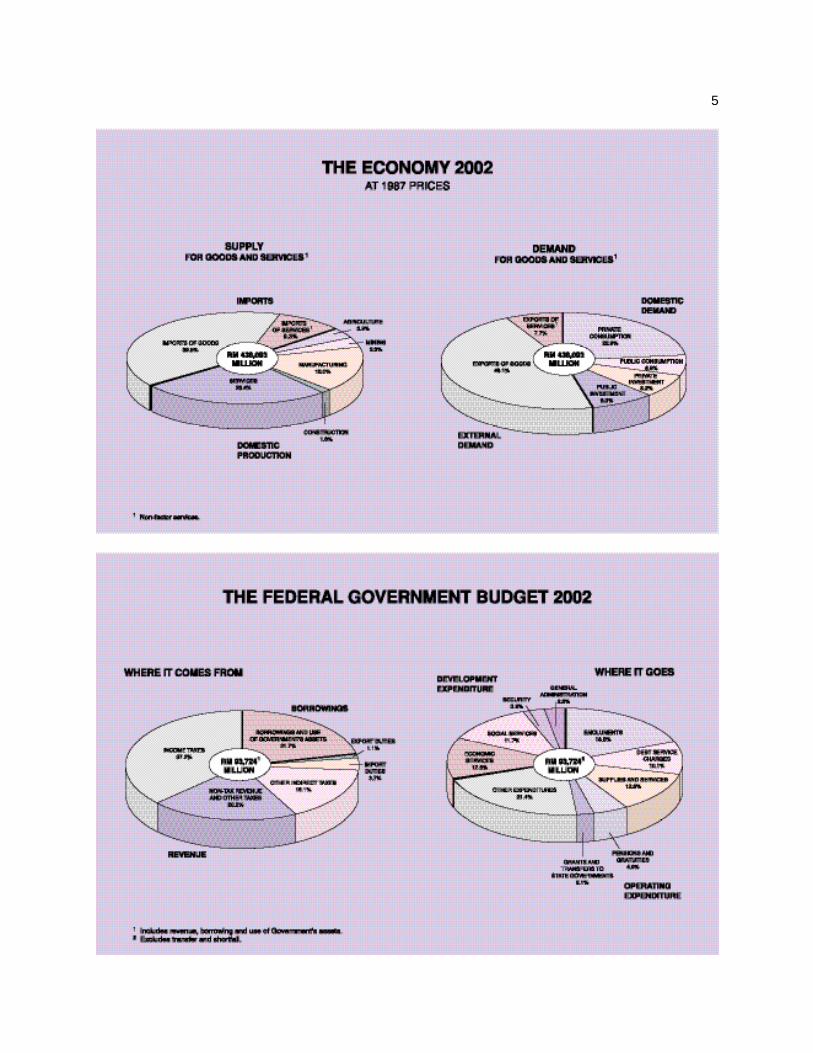
Federal Government Financial Position
The continued weakening in the externalenvironment and its adverse impact on domesticprivate demand necessitated the Governmentto pursue a stronger expansionary fiscal stimulusto revive domestic economic activit ies.Consequently, the overall deficit of the FederalGovernment is estimated to register a largerdeficit of RM22,379 million or 6.5% of GDP,compared with RM19,715 million or 5.8% of GDPin 2000. Despite the larger deficit, the Governmentremains prudent and ensures financial disciplinein managing its financial resources. The deficitis still manageable and sustainable, given thatit is mainly financed from non-inflationary domesticsources and, hence, external debt and debtservicing ratio remain low.
Federal Government revenue is expected toregister a strong performance of 11.6% to reachRM69,011 million, the highest growth achievedsince 1998, mainly attributable to higher collectionof corporate and petroleum income taxes. Thehigher corporate income tax is due to fewerlosses carried forward from previous years tooffset current year profits, while the highercollection from petroleum income tax is on accountof better petroleum prices, which increased fromUSD18 per barrel in 1999 to USD30 per barrelin 2000. Other major revenue sources include
sales tax, excise duties and service tax are alsoexpected to increase moderately. Non-taxrevenue, which includes investment income andfees from licenses and permits, is expected toperform well given the improved performance ofgovernment companies and buoyant sales ofmotor vehicles.
Operating expenditure is expected to increaseby 8.1% (2000: 21.2%), largely for emoluments,debt service charges and supplies and services.The bulk of expenditure is for supplies andservices as well as the increase in emolumentresulting from increased allowances, particularlyfor the police and armed forces personnel aswell as nurses, doctors and headmasters. Theexpenditure for debt service charges remainslow, mainly for domestic interest payments. Giventhe stronger performance in revenue and thesmaller increase in operating expenditure, thecurrent account of the Federal Government is,therefore, expected to record a higher surplusof RM7,879 million (2000: RM5,317 million). TheFederal Government has always maintained asurplus in its current account, reflecting continuedfiscal prudence and discipline in the managementof its finance.
Arising from the additional stimulus packagesimplemented by the Government, developmentexpenditure is expected to increase significantlyby 14.7% to RM32,058 million (2000: 23.6%,RM 27,941 million). The Government announcedthe first pre-emptive package in March of RM3billion for enhancing training capacity throughbuilding universities, community colleges andsingle-session schools as well as topping upfunds for the development of small- and medium-scale enterprises. In September, an additionalpackage of RM4.3 billion was announced, largelyfor rural and selected urban development projectsand training of unemployed graduates andretrenched workers. After taking into accountthe higher expenditure, the overall deficit isexpected to increase to 6.5% of GDP. Given theample liquidity in the financial system, about82.2% of the deficit will be financed from domesticsources, largely Malaysian Government Securities(MGS) and Government Investment Issues (GII),with the balance from external borrowings.
37
National Resource Position
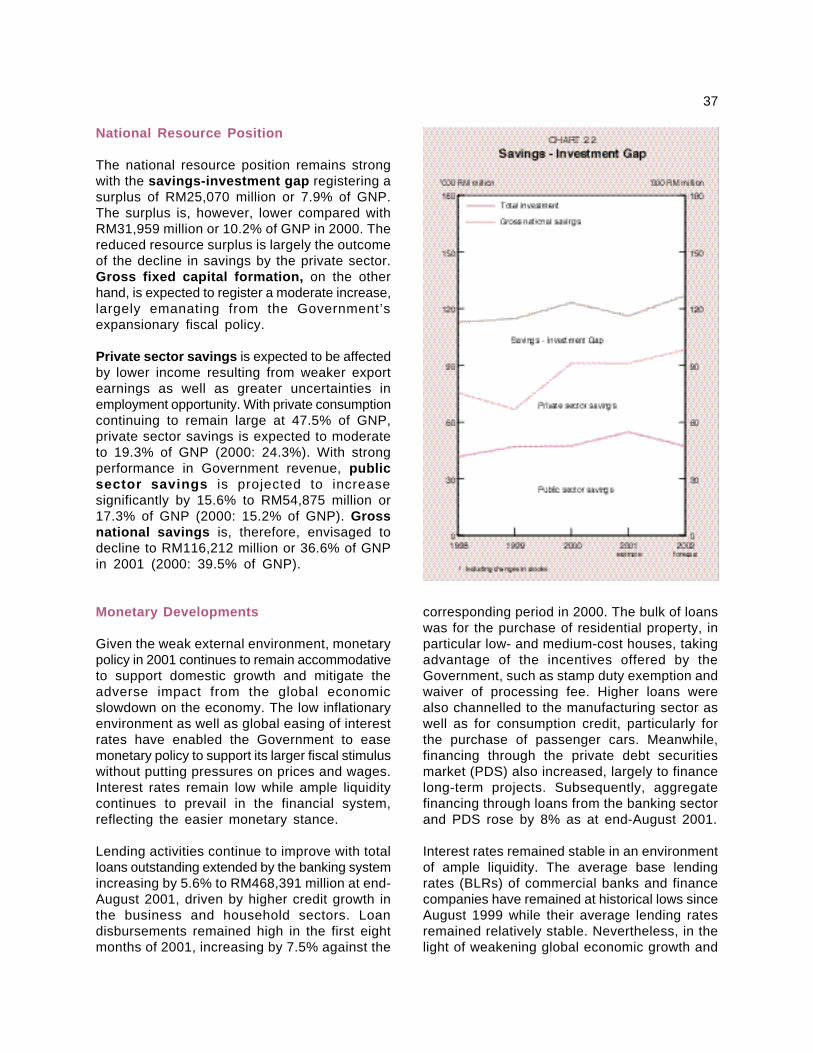
The national resource position remains strongwith the savings-investment gap registering asurplus of RM25,070 million or 7.9% of GNP.The surplus is, however, lower compared withRM31,959 million or 10.2% of GNP in 2000. Thereduced resource surplus is largely the outcomeof the decline in savings by the private sector.Gross fixed capital formation, on the otherhand, is expected to register a moderate increase,largely emanating from the Government’sexpansionary fiscal policy.
Private sector savings is expected to be affectedby lower income resulting from weaker exportearnings as well as greater uncertainties inemployment opportunity. With private consumptioncontinuing to remain large at 47.5% of GNP,private sector savings is expected to moderateto 19.3% of GNP (2000: 24.3%). With strongperformance in Government revenue, publicsector savings is projected to increasesignificantly by 15.6% to RM54,875 million or17.3% of GNP (2000: 15.2% of GNP). Grossnational savings is, therefore, envisaged todecline to RM116,212 million or 36.6% of GNPin 2001 (2000: 39.5% of GNP).
Monetary Developments
Given the weak external environment, monetarypolicy in 2001 continues to remain accommodativeto support domestic growth and mitigate theadverse impact from the global economicslowdown on the economy. The low inflationaryenvironment as well as global easing of interestrates have enabled the Government to easemonetary policy to support its larger fiscal stimuluswithout putting pressures on prices and wages.Interest rates remain low while ample liquiditycontinues to prevail in the financial system,reflecting the easier monetary stance.
Lending activities continue to improve with totalloans outstanding extended by the banking systemincreasing by 5.6% to RM468,391 million at end-August 2001, driven by higher credit growth inthe business and household sectors. Loandisbursements remained high in the first eightmonths of 2001, increasing by 7.5% against the
corresponding period in 2000. The bulk of loanswas for the purchase of residential property, inparticular low- and medium-cost houses, takingadvantage of the incentives offered by theGovernment, such as stamp duty exemption andwaiver of processing fee. Higher loans werealso channelled to the manufacturing sector aswell as for consumption credit, particularly forthe purchase of passenger cars. Meanwhile,financing through the private debt securitiesmarket (PDS) also increased, largely to financelong-term projects. Subsequently, aggregatefinancing through loans from the banking sectorand PDS rose by 8% as at end-August 2001.
Interest rates remained stable in an environmentof ample liquidity. The average base lendingrates (BLRs) of commercial banks and financecompanies have remained at historical lows sinceAugust 1999 while their average lending ratesremained relatively stable. Nevertheless, in thelight of weakening global economic growth and
38
in response to similar interest rate cuts by othercentral banks, BNM has reduced its 3-monthintervention rate by 50 basis points to 5% on 20September 2001. With the reduction, the BLRceiling of commercial banks and financecompanies will decline to 6.42% and 7.46%,respectively (from 6.83% and 7.98%). Thereduction is aimed at enhancing business andconsumer sentiment to support economicactivities.
Equity Market
In tandem with the developments in major worldand regional bourses, the performance of theKuala Lumpur Stock Exchange (KLSE) duringthe first nine months of 2001 was affected byweaker investor sentiment on concerns of theglobal economic slowdown. KLSE began the yearwith a Chinese New Year rally, with the KualaLumpur Composite Index (KLCI), closing at 727.73points at end-January. It trended downwardsfrom April before recovering to close at 659.40points at end-July, following several optimisticdevelopments in corporate mergers andacquisitions. The attack on the US, however,triggered a fall in share prices worldwide, includingthe KLCI, which declined to 615.34 points as atend-September. Nevertheless, the KLCI continuesto outperform other selected regional bourses.During the period end-2000 to end-September2001, the KLCI declined by 9.5% against thePhilippines Composite Index (-24.6%), the STI(-31.5%) and the Nikkei Index (-29.1%).
Inflation
Inflation continues to remain subdued at below2% since 1999. The Consumer Price Index (CPI)registered a small increase of 1.5% during thefirst eight months of 2001, the lowest since 1999,attributable mainly to the relative stability of theexchange rate, low inflation abroad, lower oiland commodity prices as well as excess capacityin several sectors of the domestic economy.The expectation of continued moderation ineconomic activit ies, the less favourableemployment prospects and relatively weakerconsumer confidence will continue to have amoderating effect on domestic prices. As such,inflation is expected to decline to 1.3% in2001.
The moderation in CPI is reflected in most majorsub-indices, largely for food, which accounts formore than a third of the total weightage of theCPI. The food sub-index increased marginallyby 0.6% during the first eight months of 2001while that of gross rent, fuel and power by 1.6%.The marginal increase in food prices is largelyon account of favourable weather conditions aswell as the success of the Government’s measuresto contain price increases of essential goods,particularly food items.
Labour Market
The slower economic activities have somewhataffected labour market conditions. Withemployment creation projected to increase by1.5% and labour force rising by 2.4%, theunemployment rate is expected to increase to3.9% from 3.1% in 2000. Although higher, theunemployment rate is below 4% and as such,the nation is still at its full employment level.The number of workers retrenched stood at20,038, mainly in the electronics sub-sector.Notwithstanding these retrenchments, the nationcontinues to experience shortage of workers,reflecting skill mismatches, job preferences aswell as labour immobility in some regions.
The nation still continues to depend on foreignworkers with the number of registered foreignworkers increasing to 810,695 from 732,588 in2000. Reflecting the easier labour marketconditions, wage pressures were subdued, asreflected by the slower rate of increase in thewages of all categories of workers in themanufacturing sector.
Prospects for 2002
The outlook of the external sector in 2002 remainsuncertain, particularly in the light of the aftermathof the attack on the US. While it is generallyviewed that the US may avoid a recession, therecovery would be delayed with an upturn takingplace gradually in the later part of 2002. Theprospect for a growth in Japan continues to bediscouraging, with the economy not expected towitness a rapid growth. Given the weakerperformance of the US and Japan, world growth
39
has subsequently been revised downwards to2.6%, with the GDP growth for the majorindustrialised countries decelerating to 1.3%.
Taking cognisance of the uncertainties in theexternal environment, growth for the Malaysianeconomy will continue to be spearheaded bydomestic activities. In this regard, the Governmentwill continue to adopt an expansionary fiscalpolicy to further strengthen domestic demand togenerate growth. At the same time, to increasebusiness confidence and commitment, theGovernment will ensure a more conducivebusiness environment for the private sector’sexpansion and initiatives.
Sectoral Performance
The Malaysian economy is forecast to grow by4-5% in 2002, led by stronger performances inthe manufacturing and services sectors. Therecovery in global electronics demand willcontribute towards growth in the manufacturingsector while the pace of expansion in the servicessector will be driven by higher economic activitiesand the Government fiscal stimulus.
Slower growth is projected in the agriculturesector at 0.8% (2001: 1.2%) due to declines inproduction of crude palm oil, rubber and sawlogs. Crude palm oil production is expected todecline by 2.1% on account of low biologicalyield cycle of the crop and the large hectaragewhich has been taken out of production due toreplanting. Rubber production is also projectedto contract by 1.7% in line with Malaysia’sobligation to the tripartite agreement betweenMalaysia, Indonesia and Thailand to reduce outputby 4%, aimed at reducing oversupply andincreasing prices. Saw logs production,meanwhile, is envisaged to decline by 2.9% intandem with the policy of sustainable forestmanagement. On the other hand, other agriculturesuch as aquaculture, fishing and miscellaneouscrops like tobacco, pepper and herbs is expectedto register higher output.
In line with the expected increase in economicactivities and the greater utilisation of gas asa source of energy, natural gas output is expectedto expand significantly to 11.4% to meet the
anticipated increase in demand from both localas well as export markets. This, together withhigher crude oil output of 2.4% to 695,900 barrelsper day will contribute to the higher value addedgrowth in the mining sector of 4.3%.
Manufacturing sector is projected to expandby 6.5% (2001: 0.2%), following the recovery inglobal electronics demand which is alreadyreflected in the considerable reduction in thestock overhang of chips. The recovery processwill be further enhanced by higher US fiscalspending on military electronic equipment forsurveillance and communications network whichwill lead to higher demand for chips in the lightof the 11 September attack. Improved domesticdemand arising from the fiscal stimulus will alsoenhance output from the sector, in particularconstruction-related industries. Consumerspending on passengers cars and householddurables such as washing machines, refrigeratorsand audio visual products is also envisaged tobe higher with the improvement in the overalleconomy. The manufacturing sector, therefore,is expected to contribute to 2.1 percentage pointsto real GDP growth.
The recovery in private sector investment andfiscal expansion will contribute to growth in theconstruction sector by 4.3%. The demand forhousing, in particular low- and medium-cost unitsas well as infrastructure projects in the healthand education sub-sectors and rural developmentfrom the RM3 billion pre-emptive measures inMarch and the recent RM4.3 billion package inSeptember will also contribute towards furthergrowth in this sector.
Value added of the services sector is expectedto grow by 5.3% (2001: 4.4%) in line with thegenerally better performance of the primary andsecondary sectors of the economy. Higher outputfrom the manufacturing sector will contributetowards the expansion in the related servicessub-sectors, in particular electricity, gas and waterwhich is expected to increase by 6.9% andtransportation, storage and telecommunications,by 7%. With higher public sector expenditure tobe generated from the fiscal stimulus, growthfrom the Government services sub-sector is
40
expected to expand by 6.1% while higher touristarrivals, in particular from this region, will generategreater activities in the wholesale and retail trade,hotel and restaurants sub-sector of 3.9%. Thefinance, insurance, real estate and businessservices sub-sector is also expected to expandby 5.6% as the low interest rate environment isexpected to sustain the demand for housing andconsumer durables in addition to the growingdemand for insurance products. Consequently,the services sector is expected to contribute to2.9 percentage points to real GDP growth.
Domestic Demand
Aggregate domestic demand (excludingchanges in stocks) in current prices is expectedto increase by 5.5% in line with the anticipatedimprovement in export earnings and the fiscalstimulus in supporting domestic economicactivities. Private consumption is estimated toincrease by 5.5% given higher incomes from theimprovement in the economy. Private investmentis also projected to register a strong growth of10% after a slow growth of 2% in 2001. Theincrease in private investment is reflected in theapprovals in manufacturing investment by theMalaysian Industrial and Development Authority,which increased to RM18,183 million during thefirst seven months of 2001 (January-July 2000:to RM17,316 million). Investment in Informationand Communications Technology (ICT) andrelated industries is also expected to increase.The number of companies given MSC-statushas expanded to 563 as at end-September 2001(end-2000: 429 companies), reflecting theincreasing investment in ICT activities.
Although fiscal policy remains expansionary, thesize of the development allocation is projectedto be smaller as part of a deliberate policy toensure prudency and sustainability of publicsector finance. Public investment is, therefore,expected to contract slightly by 0.4% toRM50,147 million (2001: 15.4%) on account oflower Federal Government expenditure. However,public consumption is envisaged to increaseby 7.4% (2001: 15.3%) on account of higherexpenditure for supplies and services as well asemolument.
External Demand
Contribution from the external sector is expectedto turn positive, contributed by improvements inthe trade sector. Export of goods and non-factor services is envisaged to turn around by6.4% (2001: -9.3%), while that of imports by5.9% (2001: -9.2%). With the growth of exportsexceeding imports, the net external demand isexpected to contribute positively by 0.8 percentagepoint to GDP growth (2001: -1.5 percentagepoints).
Export of goods is envisaged to recovermoderately by 6% (2001: -10.8%), supportedlargely by an increase in export of manufacturedgoods. The increase in exports will largelyemanate from electronics, in view of the recoveryin global electronics demand as well as fromprimary commodities, particularly palm oil andliquefied natural gas. Export of non-factorservices is also expected to increase by 8.6%(2001: 1.7%), with higher earnings anticipatedfrom transportation and travel, mainly fromregional tourists, despite some moderationexpected in tourist arrivals, especially from theUS and Europe, following the September attackon the US.
Import of goods and non-factor services isexpected to increase by 5.9% (2001: -9.2%). Inline with stronger domestic economic activitiesand higher exports, import of goods, is envisagedto increase by 5.8%, comprising largelyintermediate goods. Higher pace of investmentactivities is expected to generate demand forcapital goods. Import of non-factor servicesis projected to increase by 6.5% (2001: -4.1%),mainly on account of higher payments fromtransportation and other services.
Balance of Payments
Malaysia’s current account is envisaged tocontinue to register a sizeable surplus for thefifth consecutive year. The higher surplus ofRM73,775 in the goods account is more thansufficient to offset the deficit in the services,income and transfer accounts. The services deficitis expected to improve slightly to RM7,013 million(2001: -RM7,694 million), mainly attributable to
41
higher net inflows in the travel account ofRM14,168 million (2001: RM12,782 million).
The income account, however, is projected toregister a higher net outflow of RM29,120 million(2001: -RM27,627 million), arising from bettercorporate performance in the light of theanticipated improvement in economic activities.After taking into account the net outflows ofRM8,966 million in the transfers account (2001:-RM8,784 million) due to higher repatriation byforeign workers, the current account is expectedto register a higher surplus of RM28,676 millionor 8.4% of GNP (2001: RM25,070 million or7.9% of GNP).
Federal Government Financial Position
The Government will continue with its fiscalstimulus, marking its fifth year of deficit budgetting,as a measure to support domestic economicactivities. The expansionary budget will befinanced mainly from non-inflationary domesticsources. The strong revenue growth is anticipatedto result in a larger current account surplusdespite higher operating expenditure. After takinginto consideration development expenditure, theoverall fiscal deficit is expected to improve to5% of GDP (2001: 6.5% GDP).
Growing strongly at 6.4%, revenue growth isexpected to emanate mainly from higher corporateand individual income taxes as well as servicesand sales tax collections resulting from bettercorporate performance, higher income andincreased consumption. Apart from emoluments,supplies and services and debt service charges,the higher operating expenditure will be forpurposes of upgrading and maintenance work,training assistance to unemployed graduates andretrenched workers as well as increased welfarepayments.
In terms of development allocation, priority willcontinue to be given to human resourcedevelopment, agriculture and rural developmentand social services. The smaller grossdevelopment expenditure, amounting toRM28,382 million, will be expended for educationand training, particularly training for K-workers,enhancing computer literacy and the use of ICT,
agriculture development, upgrading of basicamenities and facilities such as rural and villageroads as well as water and electricity supply,housing, medical and health services andinfrastructure projects including highways, bridgesand rail-based projects.
National Resource Position
In line with higher export earnings and greaterdomestic economic activities, GNP is expectedto increase strongly by 7.3% in 2002 (2001:1.8%). Consumption expenditure is envisagedto increase by 5.9% (2001: 6.3%), attributableto the fiscal expansion and greater privateconsumption, following higher disposable income.As a result, the share of gross national savingsto GNP is expected to improve slightly to 37.4%(2001: 36.6% of GNP). Subsequently, thesavings-investment gap is expected to registera higher surplus of RM28,676 million or 8.4% ofGNP (2001: RM25,070 million or 7.9% of GNP).
Monetary policy
Monetary policy will continue to remainaccommodative to complement the fiscal stimulusin supporting economic growth in the light of thedeteriorating external developments. Followingthe greater uncertainty of global economicrecovery, an easier monetary stance is necessaryto support domestic economic activities. Therecent further global easing in interest rates willpermit greater flexibility for the pursuit of anaccommodative domestic monetary policy. Inaddition, Malaysia’s strong economicfundamentals and sound financial system willalso provide greater policy flexibility in pursuingan easier monetary stance.
With regard to the ringgit exchange rate, theprevailing peg of RM3.80 to the US dollar willcontinue to be closely monitored against bothdomestic and external developments to ensurethat it remains consistent with macroeconomicfundamentals. Given the volatility in internationalcurrency markets, the Government’s policy is tomaintain a stable and fundamentally soundexchange rate so as to provide stability andpredictability in facilitating planning and investmentdecisions.
42
Inflation
Inflation is expected to continue to remain lowwith the increase in CPI anticipated to be lessthan 2%. However, the recent hike in freightrates, insurance premiums and othertransportation-related costs is of concern as theymay translate into higher costs. Strong domesticdemand could also generate inflationary pressuresif supply shortages, particularly food, are notimmediately resolved. Given these risks, theGovernment will remain vigilant to take thenecessary measures in containing inflation. Amongthe measures already in place include efforts toincrease domestic food production and reducethe cost of doing business.
Employment Situation
With the economy forecast to grow moderately,employment is projected to increase by 4% from9.4 million in 2001 to 9.8 million in 2002. Theeconomy will continue to experience fullemployment, with the unemployment rateremaining low, while the labour market continuesto remain stable. New employment prospects
are likely to be from IT-related areas, with themanufacturing sector continuing to contributethe bulk of employment.
Conclusion
Growth in real GDP in 2001 has been adverselyaffected by the unfavourable external environment,precipitated by the slowdown in the US economy.Despite this, the Malaysian economy, supportedby domestic demand, is expected to record GDPgrowth of 1-2%.
Prospects for an improved world economicperformance remain uncertain with world recoveryexpected to be delayed to the later part of 2002.Although uncertainties regarding the US recoveryand, hence, world growth have increased, thesetback has been minimised through concertedactions taken by the major economies inenhancing liquidity as well as adopting continuedmonetary and fiscal easing. For the Malaysianeconomy, it is expected to recover from a slowergrowth in 2001 to register a higher real GDPgrowth of 4-5% in 2002.
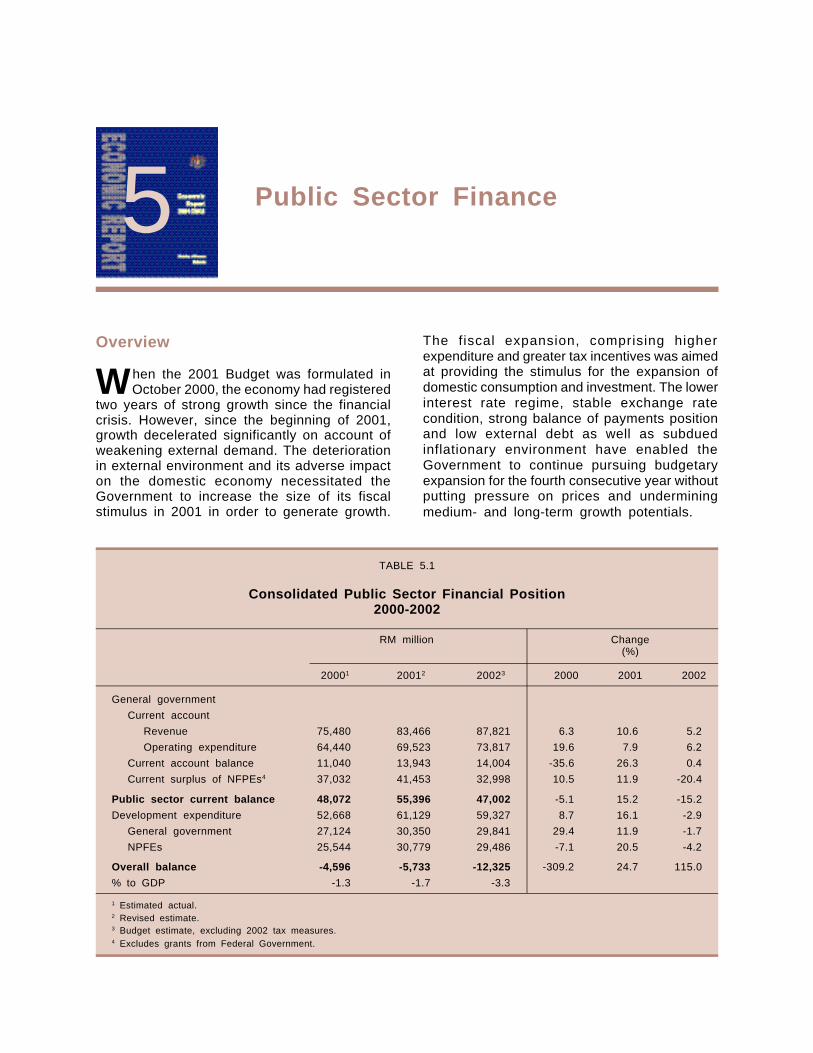
Public Sector Finance
Overview
When the 2001 Budget was formulated inOctober 2000, the economy had registered
two years of strong growth since the financialcrisis. However, since the beginning of 2001,growth decelerated significantly on account ofweakening external demand. The deteriorationin external environment and its adverse impacton the domestic economy necessitated theGovernment to increase the size of its fiscalstimulus in 2001 in order to generate growth.
The fiscal expansion, comprising higherexpenditure and greater tax incentives was aimedat providing the stimulus for the expansion ofdomestic consumption and investment. The lowerinterest rate regime, stable exchange ratecondition, strong balance of payments positionand low external debt as well as subduedinflationary environment have enabled theGovernment to continue pursuing budgetaryexpansion for the fourth consecutive year withoutputting pressure on prices and underminingmedium- and long-term growth potentials.
TABLE 5.1
Consolidated Public Sector Financial Position2000-2002
RM million Change(%)
20001 20012 20023 2000 2001 2002
General government
Current account
Revenue 75,480 83,466 87,821 6.3 10.6 5.2
Operating expenditure 64,440 69,523 73,817 19.6 7.9 6.2
Current account balance 11,040 13,943 14,004 -35.6 26.3 0.4
Current surplus of NFPEs4 37,032 41,453 32,998 10.5 11.9 -20.4
Public sector current balance 48,072 55,396 47,002 -5.1 15.2 -15.2
Development expenditure 52,668 61,129 59,327 8.7 16.1 -2.9
General government 27,124 30,350 29,841 29.4 11.9 -1.7
NPFEs 25,544 30,779 29,486 -7.1 20.5 -4.2
Overall balance -4,596 -5,733 -12,325 -309.2 24.7 115.0
% to GDP -1.3 -1.7 -3.3
1 Estimated actual.2 Revised estimate.3 Budget estimate, excluding 2002 tax measures.4 Excludes grants from Federal Government.
5
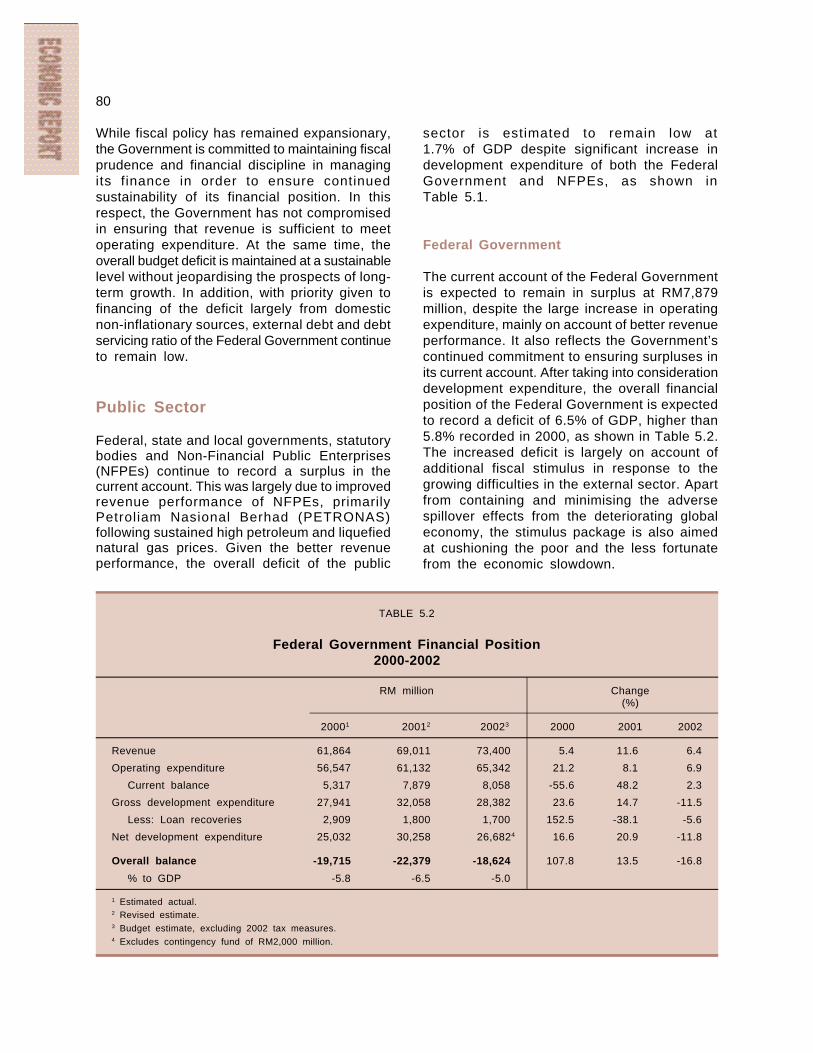
80
While fiscal policy has remained expansionary,the Government is committed to maintaining fiscalprudence and financial discipline in managingits finance in order to ensure continuedsustainability of its financial position. In thisrespect, the Government has not compromisedin ensuring that revenue is sufficient to meetoperating expenditure. At the same time, theoverall budget deficit is maintained at a sustainablelevel without jeopardising the prospects of long-term growth. In addition, with priority given tofinancing of the deficit largely from domesticnon-inflationary sources, external debt and debtservicing ratio of the Federal Government continueto remain low.
Public Sector
Federal, state and local governments, statutorybodies and Non-Financial Public Enterprises(NFPEs) continue to record a surplus in thecurrent account. This was largely due to improvedrevenue performance of NFPEs, primarilyPetroliam Nasional Berhad (PETRONAS)following sustained high petroleum and liquefiednatural gas prices. Given the better revenueperformance, the overall deficit of the public
TABLE 5.2
Federal Government Financial Position2000-2002
RM million Change(%)
20001 20012 20023 2000 2001 2002
Revenue 61,864 69,011 73,400 5.4 11.6 6.4
Operating expenditure 56,547 61,132 65,342 21.2 8.1 6.9
Current balance 5,317 7,879 8,058 -55.6 48.2 2.3
Gross development expenditure 27,941 32,058 28,382 23.6 14.7 -11.5
Less: Loan recoveries 2,909 1,800 1,700 152.5 -38.1 -5.6
Net development expenditure 25,032 30,258 26,6824 16.6 20.9 -11.8
Overall balance -19,715 -22,379 -18,624 107.8 13.5 -16.8
% to GDP -5.8 -6.5 -5.0
1 Estimated actual.2 Revised estimate.3 Budget estimate, excluding 2002 tax measures.4 Excludes contingency fund of RM2,000 million.
sector is estimated to remain low at1.7% of GDP despite significant increase indevelopment expenditure of both the FederalGovernment and NFPEs, as shown inTable 5.1.
Federal Government
The current account of the Federal Governmentis expected to remain in surplus at RM7,879million, despite the large increase in operatingexpenditure, mainly on account of better revenueperformance. It also reflects the Government’scontinued commitment to ensuring surpluses inits current account. After taking into considerationdevelopment expenditure, the overall financialposition of the Federal Government is expectedto record a deficit of 6.5% of GDP, higher than5.8% recorded in 2000, as shown in Table 5.2.The increased deficit is largely on account ofadditional fiscal stimulus in response to thegrowing difficulties in the external sector. Apartfrom containing and minimising the adversespillover effects from the deteriorating globaleconomy, the stimulus package is also aimedat cushioning the poor and the less fortunatefrom the economic slowdown.
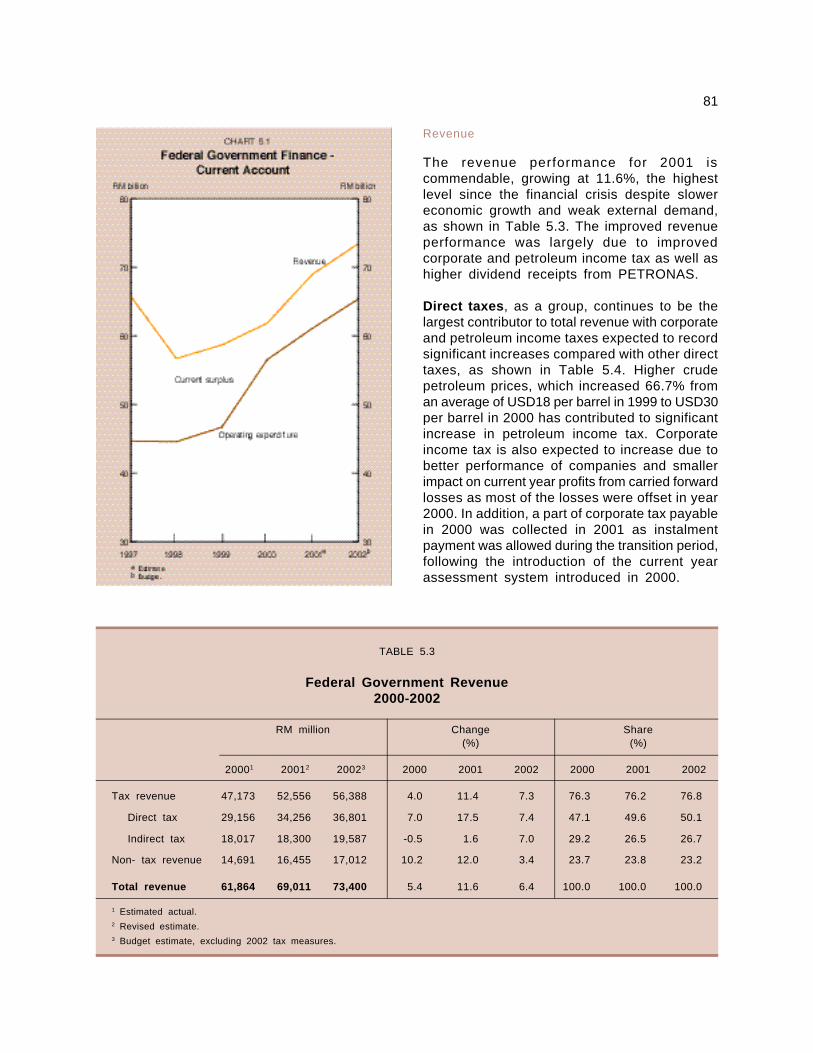
81
TABLE 5.3
Federal Government Revenue2000-2002
RM million Change Share(%) (%)
20001 20012 20023 2000 2001 2002 2000 2001 2002
Tax revenue 47,173 52,556 56,388 4.0 11.4 7.3 76.3 76.2 76.8
Direct tax 29,156 34,256 36,801 7.0 17.5 7.4 47.1 49.6 50.1
Indirect tax 18,017 18,300 19,587 -0.5 1.6 7.0 29.2 26.5 26.7
Non- tax revenue 14,691 16,455 17,012 10.2 12.0 3.4 23.7 23.8 23.2
Total revenue 61,864 69,011 73,400 5.4 11.6 6.4 100.0 100.0 100.0
1 Estimated actual.2 Revised estimate.3 Budget estimate, excluding 2002 tax measures.
Revenue
The revenue performance for 2001 iscommendable, growing at 11.6%, the highestlevel since the financial crisis despite slowereconomic growth and weak external demand,as shown in Table 5.3. The improved revenueperformance was largely due to improvedcorporate and petroleum income tax as well ashigher dividend receipts from PETRONAS.
Direct taxes, as a group, continues to be thelargest contributor to total revenue with corporateand petroleum income taxes expected to recordsignificant increases compared with other directtaxes, as shown in Table 5.4. Higher crudepetroleum prices, which increased 66.7% froman average of USD18 per barrel in 1999 to USD30per barrel in 2000 has contributed to significantincrease in petroleum income tax. Corporateincome tax is also expected to increase due tobetter performance of companies and smallerimpact on current year profits from carried forwardlosses as most of the losses were offset in year2000. In addition, a part of corporate tax payablein 2000 was collected in 2001 as instalmentpayment was allowed during the transition period,following the introduction of the current yearassessment system introduced in 2000.
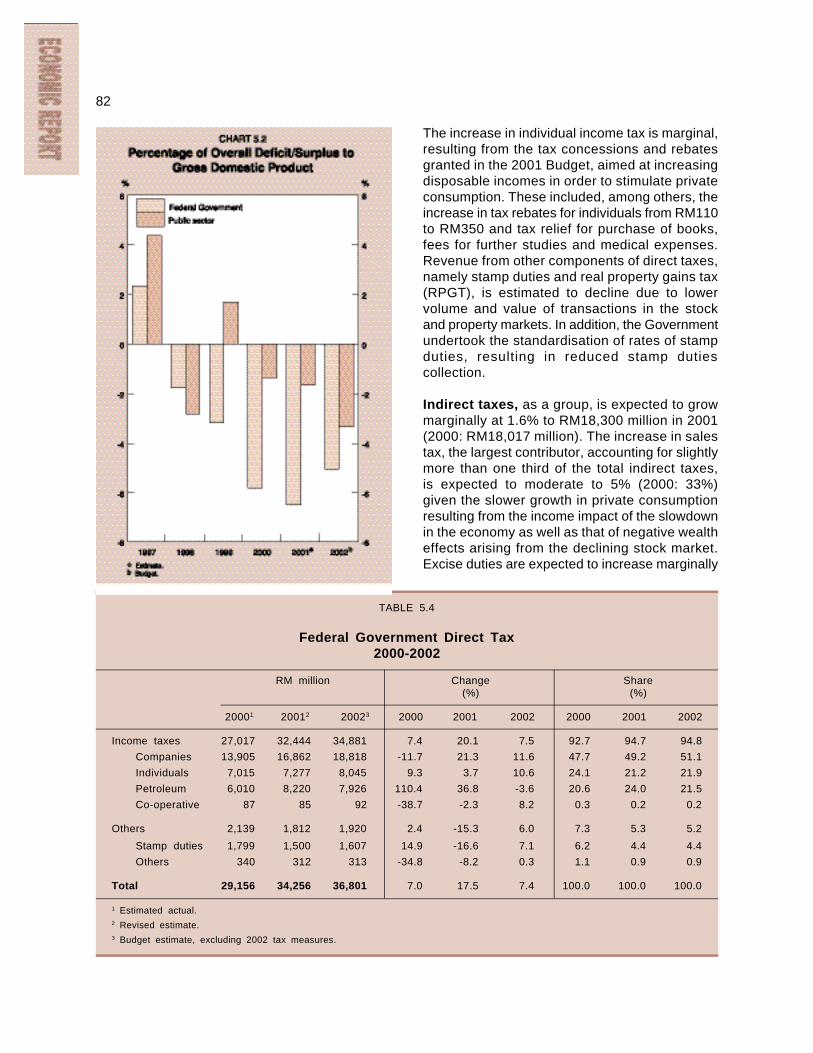
82
The increase in individual income tax is marginal,resulting from the tax concessions and rebatesgranted in the 2001 Budget, aimed at increasingdisposable incomes in order to stimulate privateconsumption. These included, among others, theincrease in tax rebates for individuals from RM110to RM350 and tax relief for purchase of books,fees for further studies and medical expenses.Revenue from other components of direct taxes,namely stamp duties and real property gains tax(RPGT), is estimated to decline due to lowervolume and value of transactions in the stockand property markets. In addition, the Governmentundertook the standardisation of rates of stampduties, resulting in reduced stamp dutiescollection.
Indirect taxes, as a group, is expected to growmarginally at 1.6% to RM18,300 million in 2001(2000: RM18,017 million). The increase in salestax, the largest contributor, accounting for slightlymore than one third of the total indirect taxes,is expected to moderate to 5% (2000: 33%)given the slower growth in private consumptionresulting from the income impact of the slowdownin the economy as well as that of negative wealtheffects arising from the declining stock market.Excise duties are expected to increase marginally
TABLE 5.4
Federal Government Direct Tax2000-2002
RM million Change Share(%) (%)
20001 20012 20023 2000 2001 2002 2000 2001 2002
Income taxes 27,017 32,444 34,881 7.4 20.1 7.5 92.7 94.7 94.8
Companies 13,905 16,862 18,818 -11.7 21.3 11.6 47.7 49.2 51.1
Individuals 7,015 7,277 8,045 9.3 3.7 10.6 24.1 21.2 21.9
Petroleum 6,010 8,220 7,926 110.4 36.8 -3.6 20.6 24.0 21.5
Co-operative 87 85 92 -38.7 -2.3 8.2 0.3 0.2 0.2
Others 2,139 1,812 1,920 2.4 -15.3 6.0 7.3 5.3 5.2
Stamp duties 1,799 1,500 1,607 14.9 -16.6 7.1 6.2 4.4 4.4
Others 340 312 313 -34.8 -8.2 0.3 1.1 0.9 0.9
Total 29,156 34,256 36,801 7.0 17.5 7.4 100.0 100.0 100.0
1 Estimated actual.2 Revised estimate.3 Budget estimate, excluding 2002 tax measures.
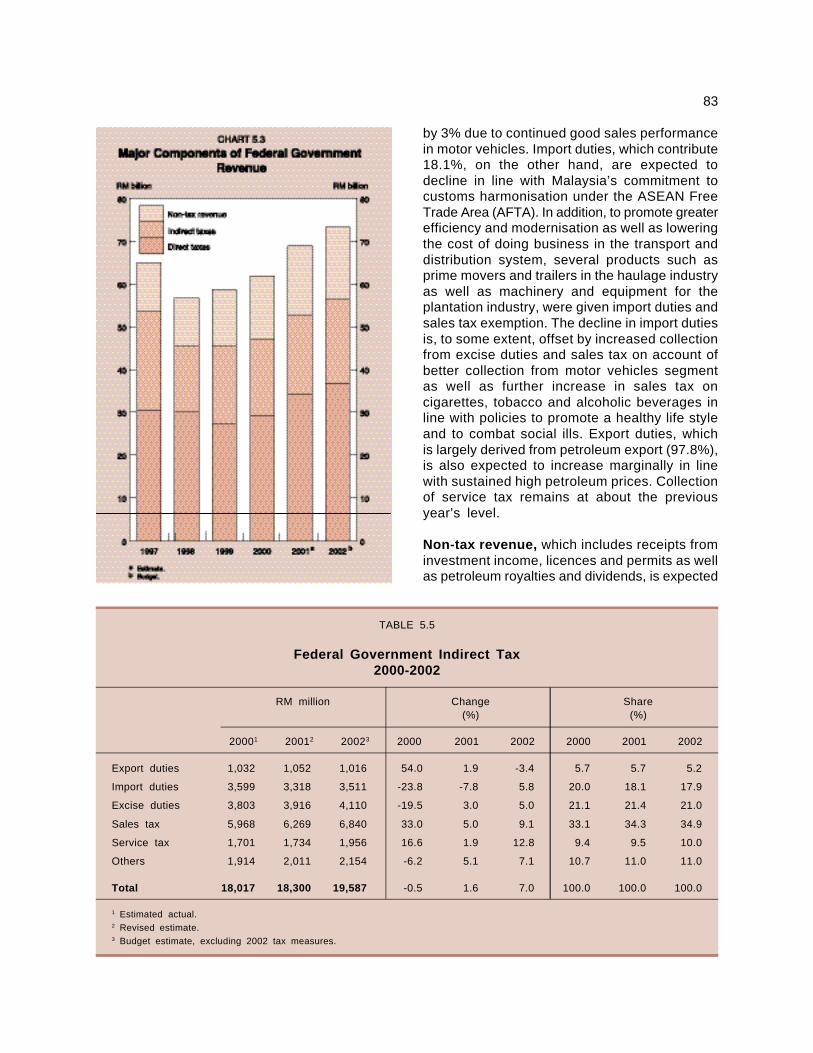
83
by 3% due to continued good sales performancein motor vehicles. Import duties, which contribute18.1%, on the other hand, are expected todecline in line with Malaysia’s commitment tocustoms harmonisation under the ASEAN FreeTrade Area (AFTA). In addition, to promote greaterefficiency and modernisation as well as loweringthe cost of doing business in the transport anddistribution system, several products such asprime movers and trailers in the haulage industryas well as machinery and equipment for theplantation industry, were given import duties andsales tax exemption. The decline in import dutiesis, to some extent, offset by increased collectionfrom excise duties and sales tax on account ofbetter collection from motor vehicles segmentas well as further increase in sales tax oncigarettes, tobacco and alcoholic beverages inline with policies to promote a healthy life styleand to combat social ills. Export duties, whichis largely derived from petroleum export (97.8%),is also expected to increase marginally in linewith sustained high petroleum prices. Collectionof service tax remains at about the previousyear’s level.
Non-tax revenue, which includes receipts frominvestment income, licences and permits as wellas petroleum royalties and dividends, is expected
TABLE 5.5
Federal Government Indirect Tax2000-2002
RM million Change Share(%) (%)
20001 20012 20023 2000 2001 2002 2000 2001 2002
Export duties 1,032 1,052 1,016 54.0 1.9 -3.4 5.7 5.7 5.2
Import duties 3,599 3,318 3,511 -23.8 -7.8 5.8 20.0 18.1 17.9
Excise duties 3,803 3,916 4,110 -19.5 3.0 5.0 21.1 21.4 21.0
Sales tax 5,968 6,269 6,840 33.0 5.0 9.1 33.1 34.3 34.9
Service tax 1,701 1,734 1,956 16.6 1.9 12.8 9.4 9.5 10.0
Others 1,914 2,011 2,154 -6.2 5.1 7.1 10.7 11.0 11.0
Total 18,017 18,300 19,587 -0.5 1.6 7.0 100.0 100.0 100.0
1 Estimated actual.2 Revised estimate.3 Budget estimate, excluding 2002 tax measures.
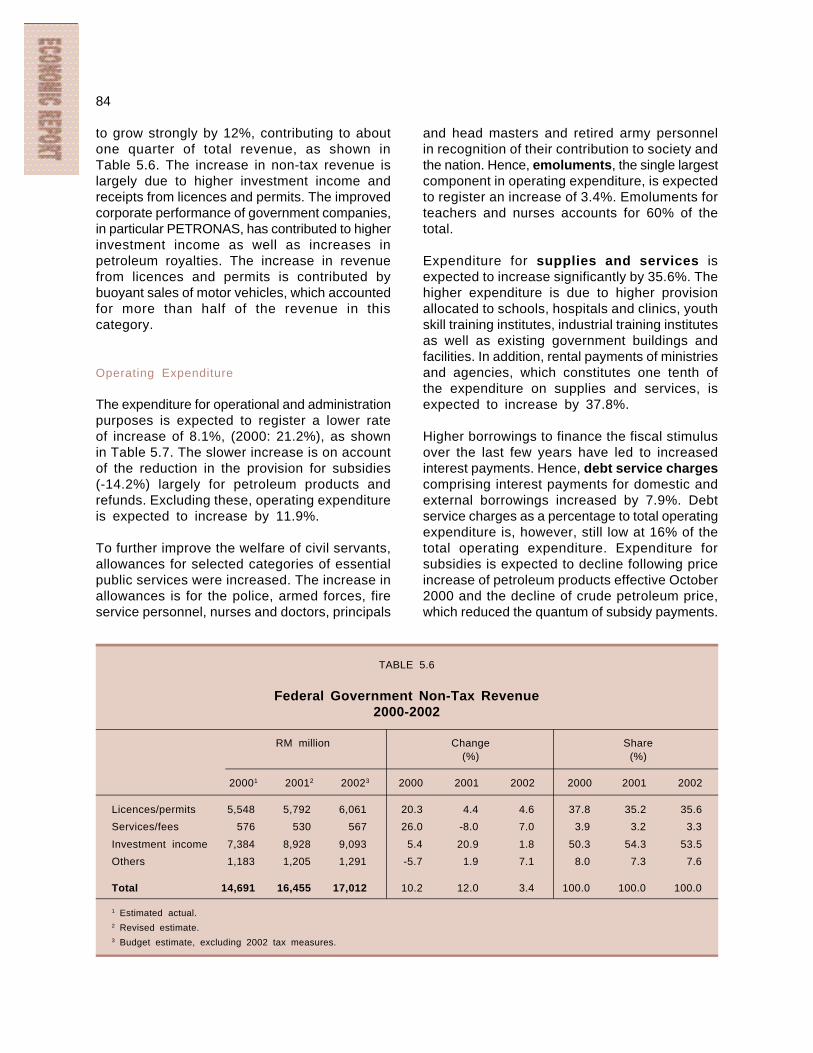
84
to grow strongly by 12%, contributing to aboutone quarter of total revenue, as shown inTable 5.6. The increase in non-tax revenue islargely due to higher investment income andreceipts from licences and permits. The improvedcorporate performance of government companies,in particular PETRONAS, has contributed to higherinvestment income as well as increases inpetroleum royalties. The increase in revenuefrom licences and permits is contributed bybuoyant sales of motor vehicles, which accountedfor more than half of the revenue in thiscategory.
Operating Expenditure
The expenditure for operational and administrationpurposes is expected to register a lower rateof increase of 8.1%, (2000: 21.2%), as shownin Table 5.7. The slower increase is on accountof the reduction in the provision for subsidies(-14.2%) largely for petroleum products andrefunds. Excluding these, operating expenditureis expected to increase by 11.9%.
To further improve the welfare of civil servants,allowances for selected categories of essentialpublic services were increased. The increase inallowances is for the police, armed forces, fireservice personnel, nurses and doctors, principals
TABLE 5.6
Federal Government Non-Tax Revenue2000-2002
RM million Change Share(%) (%)
20001 20012 20023 2000 2001 2002 2000 2001 2002
Licences/permits 5,548 5,792 6,061 20.3 4.4 4.6 37.8 35.2 35.6
Services/fees 576 530 567 26.0 -8.0 7.0 3.9 3.2 3.3
Investment income 7,384 8,928 9,093 5.4 20.9 1.8 50.3 54.3 53.5
Others 1,183 1,205 1,291 -5.7 1.9 7.1 8.0 7.3 7.6
Total 14,691 16,455 17,012 10.2 12.0 3.4 100.0 100.0 100.0
1 Estimated actual.2 Revised estimate.3 Budget estimate, excluding 2002 tax measures.
and head masters and retired army personnelin recognition of their contribution to society andthe nation. Hence, emoluments, the single largestcomponent in operating expenditure, is expectedto register an increase of 3.4%. Emoluments forteachers and nurses accounts for 60% of thetotal.
Expenditure for supplies and services isexpected to increase significantly by 35.6%. Thehigher expenditure is due to higher provisionallocated to schools, hospitals and clinics, youthskill training institutes, industrial training institutesas well as existing government buildings andfacilities. In addition, rental payments of ministriesand agencies, which constitutes one tenth ofthe expenditure on supplies and services, isexpected to increase by 37.8%.
Higher borrowings to finance the fiscal stimulusover the last few years have led to increasedinterest payments. Hence, debt service chargescomprising interest payments for domestic andexternal borrowings increased by 7.9%. Debtservice charges as a percentage to total operatingexpenditure is, however, still low at 16% of thetotal operating expenditure. Expenditure forsubsidies is expected to decline following priceincrease of petroleum products effective October2000 and the decline of crude petroleum price,which reduced the quantum of subsidy payments.
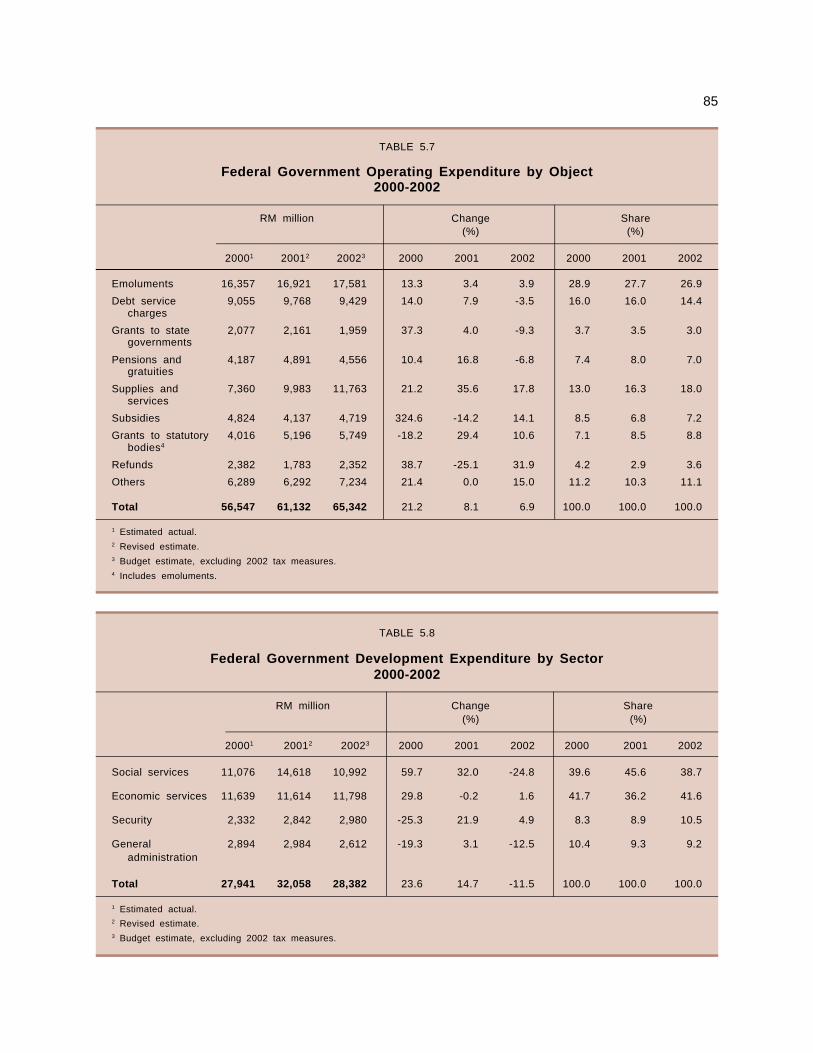
85
TABLE 5.7
Federal Government Operating Expenditure by Object2000-2002
RM million Change Share(%) (%)
20001 20012 20023 2000 2001 2002 2000 2001 2002
Emoluments 16,357 16,921 17,581 13.3 3.4 3.9 28.9 27.7 26.9
Debt service 9,055 9,768 9,429 14.0 7.9 -3.5 16.0 16.0 14.4charges
Grants to state 2,077 2,161 1,959 37.3 4.0 -9.3 3.7 3.5 3.0governments
Pensions and 4,187 4,891 4,556 10.4 16.8 -6.8 7.4 8.0 7.0gratuities
Supplies and 7,360 9,983 11,763 21.2 35.6 17.8 13.0 16.3 18.0services
Subsidies 4,824 4,137 4,719 324.6 -14.2 14.1 8.5 6.8 7.2
Grants to statutory 4,016 5,196 5,749 -18.2 29.4 10.6 7.1 8.5 8.8bodies4
Refunds 2,382 1,783 2,352 38.7 -25.1 31.9 4.2 2.9 3.6
Others 6,289 6,292 7,234 21.4 0.0 15.0 11.2 10.3 11.1
Total 56,547 61,132 65,342 21.2 8.1 6.9 100.0 100.0 100.0
1 Estimated actual.2 Revised estimate.3 Budget estimate, excluding 2002 tax measures.4 Includes emoluments.
TABLE 5.8
Federal Government Development Expenditure by Sector2000-2002
RM million Change Share(%) (%)
20001 20012 20023 2000 2001 2002 2000 2001 2002
Social services 11,076 14,618 10,992 59.7 32.0 -24.8 39.6 45.6 38.7
Economic services 11,639 11,614 11,798 29.8 -0.2 1.6 41.7 36.2 41.6
Security 2,332 2,842 2,980 -25.3 21.9 4.9 8.3 8.9 10.5
General 2,894 2,984 2,612 -19.3 3.1 -12.5 10.4 9.3 9.2administration
Total 27,941 32,058 28,382 23.6 14.7 -11.5 100.0 100.0 100.0
1 Estimated actual.2 Revised estimate.3 Budget estimate, excluding 2002 tax measures.
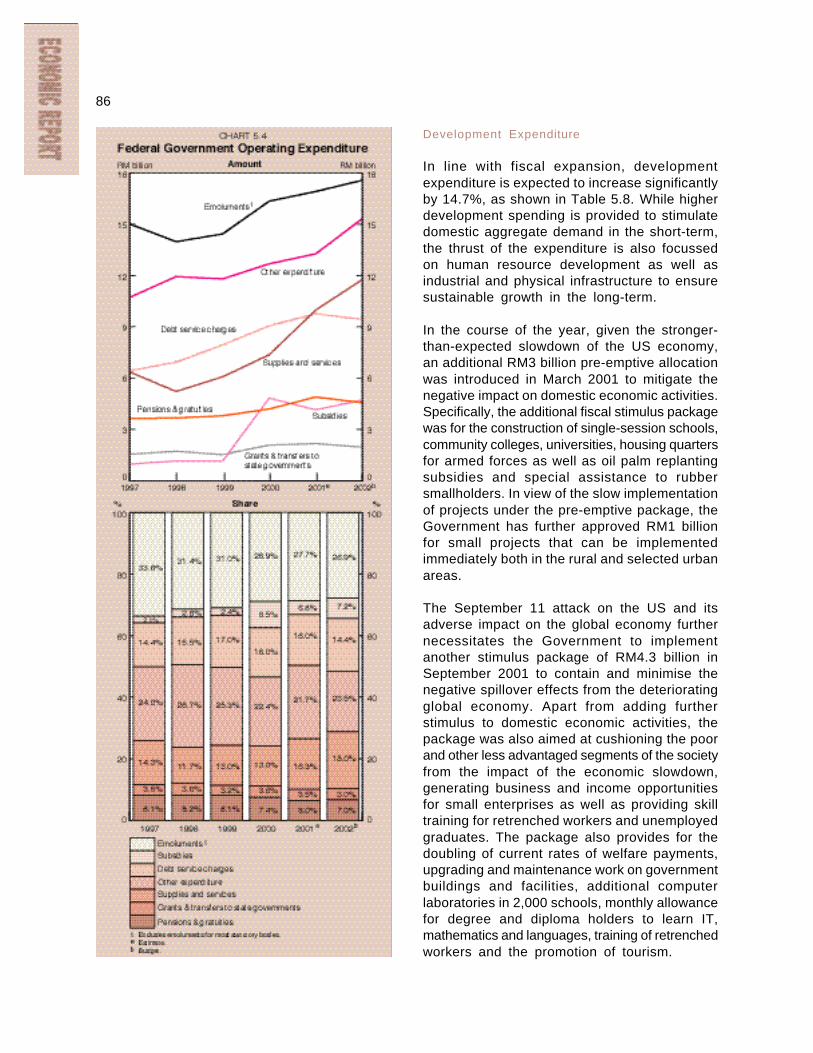
86
Development Expenditure
In line with fiscal expansion, developmentexpenditure is expected to increase significantlyby 14.7%, as shown in Table 5.8. While higherdevelopment spending is provided to stimulatedomestic aggregate demand in the short-term,the thrust of the expenditure is also focussedon human resource development as well asindustrial and physical infrastructure to ensuresustainable growth in the long-term.
In the course of the year, given the stronger-than-expected slowdown of the US economy,an additional RM3 billion pre-emptive allocationwas introduced in March 2001 to mitigate thenegative impact on domestic economic activities.Specifically, the additional fiscal stimulus packagewas for the construction of single-session schools,community colleges, universities, housing quartersfor armed forces as well as oil palm replantingsubsidies and special assistance to rubbersmallholders. In view of the slow implementationof projects under the pre-emptive package, theGovernment has further approved RM1 billionfor small projects that can be implementedimmediately both in the rural and selected urbanareas.
The September 11 attack on the US and itsadverse impact on the global economy furthernecessitates the Government to implementanother stimulus package of RM4.3 billion inSeptember 2001 to contain and minimise thenegative spillover effects from the deterioratingglobal economy. Apart from adding furtherstimulus to domestic economic activities, thepackage was also aimed at cushioning the poorand other less advantaged segments of the societyfrom the impact of the economic slowdown,generating business and income opportunitiesfor small enterprises as well as providing skilltraining for retrenched workers and unemployedgraduates. The package also provides for thedoubling of current rates of welfare payments,upgrading and maintenance work on governmentbuildings and facilities, additional computerlaboratories in 2,000 schools, monthly allowancefor degree and diploma holders to learn IT,mathematics and languages, training of retrenchedworkers and the promotion of tourism.
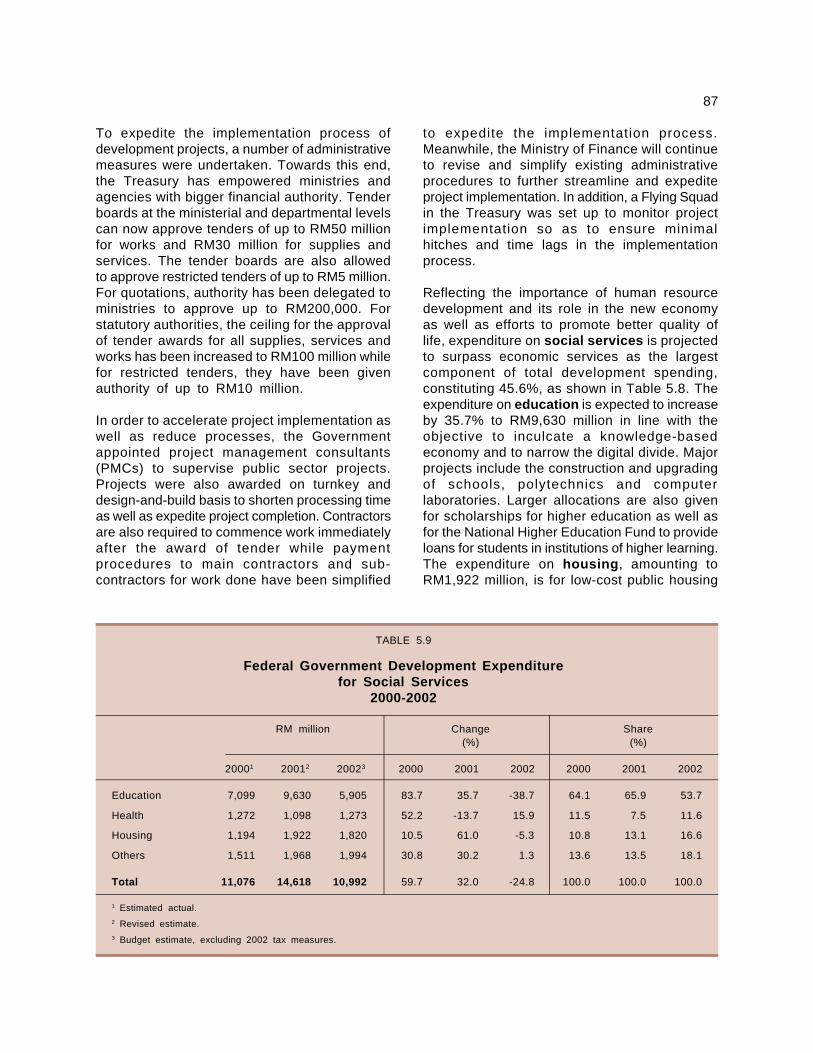
87
To expedite the implementation process ofdevelopment projects, a number of administrativemeasures were undertaken. Towards this end,the Treasury has empowered ministries andagencies with bigger financial authority. Tenderboards at the ministerial and departmental levelscan now approve tenders of up to RM50 millionfor works and RM30 million for supplies andservices. The tender boards are also allowedto approve restricted tenders of up to RM5 million.For quotations, authority has been delegated toministries to approve up to RM200,000. Forstatutory authorities, the ceiling for the approvalof tender awards for all supplies, services andworks has been increased to RM100 million whilefor restricted tenders, they have been givenauthority of up to RM10 million.
In order to accelerate project implementation aswell as reduce processes, the Governmentappointed project management consultants(PMCs) to supervise public sector projects.Projects were also awarded on turnkey anddesign-and-build basis to shorten processing timeas well as expedite project completion. Contractorsare also required to commence work immediatelyafter the award of tender while paymentprocedures to main contractors and sub-contractors for work done have been simplified
to expedite the implementation process.Meanwhile, the Ministry of Finance will continueto revise and simplify existing administrativeprocedures to further streamline and expediteproject implementation. In addition, a Flying Squadin the Treasury was set up to monitor projectimplementation so as to ensure minimalhitches and time lags in the implementationprocess.
Reflecting the importance of human resourcedevelopment and its role in the new economyas well as efforts to promote better quality oflife, expenditure on social services is projectedto surpass economic services as the largestcomponent of total development spending,constituting 45.6%, as shown in Table 5.8. Theexpenditure on education is expected to increaseby 35.7% to RM9,630 million in line with theobjective to inculcate a knowledge-basedeconomy and to narrow the digital divide. Majorprojects include the construction and upgradingof schools, polytechnics and computerlaboratories. Larger allocations are also givenfor scholarships for higher education as well asfor the National Higher Education Fund to provideloans for students in institutions of higher learning.The expenditure on housing, amounting toRM1,922 million, is for low-cost public housing
TABLE 5.9
Federal Government Development Expenditurefor Social Services
2000-2002
RM million Change Share(%) (%)
20001 20012 20023 2000 2001 2002 2000 2001 2002
Education 7,099 9,630 5,905 83.7 35.7 -38.7 64.1 65.9 53.7
Health 1,272 1,098 1,273 52.2 -13.7 15.9 11.5 7.5 11.6
Housing 1,194 1,922 1,820 10.5 61.0 -5.3 10.8 13.1 16.6
Others 1,511 1,968 1,994 30.8 30.2 1.3 13.6 13.5 18.1
Total 11,076 14,618 10,992 59.7 32.0 -24.8 100.0 100.0 100.0
1 Estimated actual.2 Revised estimate.3 Budget estimate, excluding 2002 tax measures.
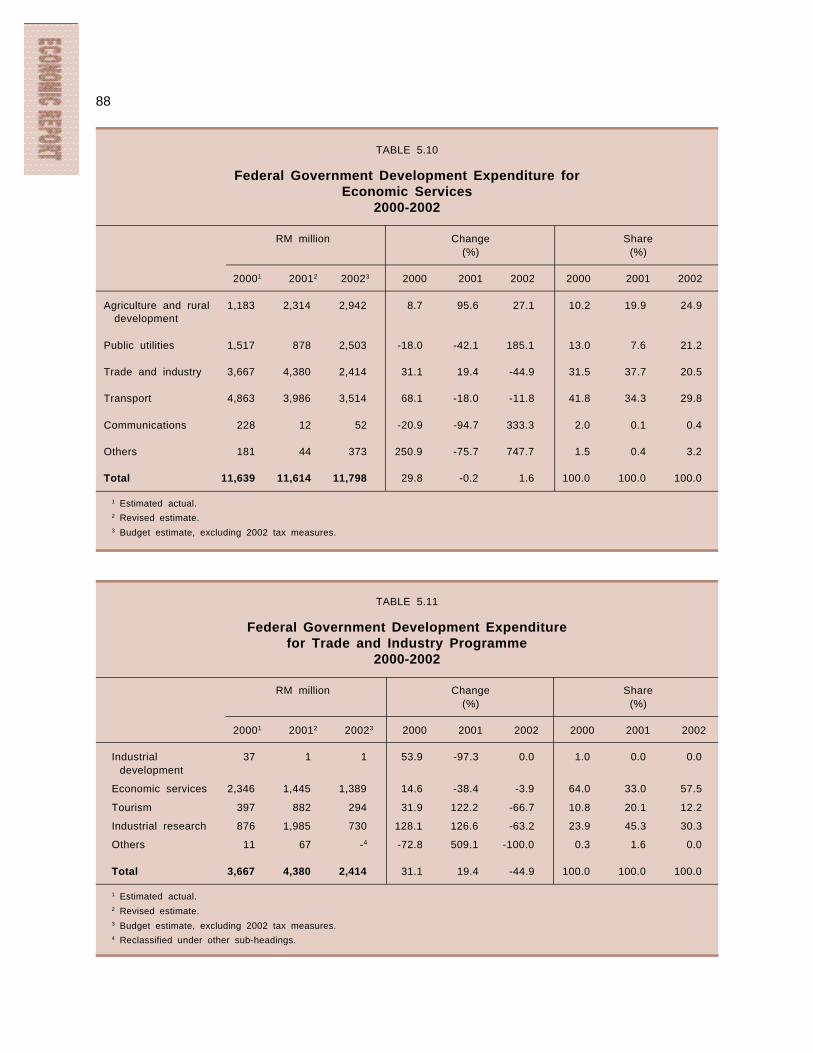
88
TABLE 5.11
Federal Government Development Expenditurefor Trade and Industry Programme
2000-2002
RM million Change Share(%) (%)
20001 20012 20023 2000 2001 2002 2000 2001 2002
Industrial 37 1 1 53.9 -97.3 0.0 1.0 0.0 0.0development
Economic services 2,346 1,445 1,389 14.6 -38.4 -3.9 64.0 33.0 57.5
Tourism 397 882 294 31.9 122.2 -66.7 10.8 20.1 12.2
Industrial research 876 1,985 730 128.1 126.6 -63.2 23.9 45.3 30.3
Others 11 67 -4 -72.8 509.1 -100.0 0.3 1.6 0.0
Total 3,667 4,380 2,414 31.1 19.4 -44.9 100.0 100.0 100.0
1 Estimated actual.2 Revised estimate.3 Budget estimate, excluding 2002 tax measures.4 Reclassified under other sub-headings.
TABLE 5.10
Federal Government Development Expenditure forEconomic Services
2000-2002
RM million Change Share(%) (%)
20001 20012 20023 2000 2001 2002 2000 2001 2002
Agriculture and rural 1,183 2,314 2,942 8.7 95.6 27.1 10.2 19.9 24.9development
Public utilities 1,517 878 2,503 -18.0 -42.1 185.1 13.0 7.6 21.2
Trade and industry 3,667 4,380 2,414 31.1 19.4 -44.9 31.5 37.7 20.5
Transport 4,863 3,986 3,514 68.1 -18.0 -11.8 41.8 34.3 29.8
Communications 228 12 52 -20.9 -94.7 333.3 2.0 0.1 0.4
Others 181 44 373 250.9 -75.7 747.7 1.5 0.4 3.2
Total 11,639 11,614 11,798 29.8 -0.2 1.6 100.0 100.0 100.0
1 Estimated actual.2 Revised estimate.3 Budget estimate, excluding 2002 tax measures.
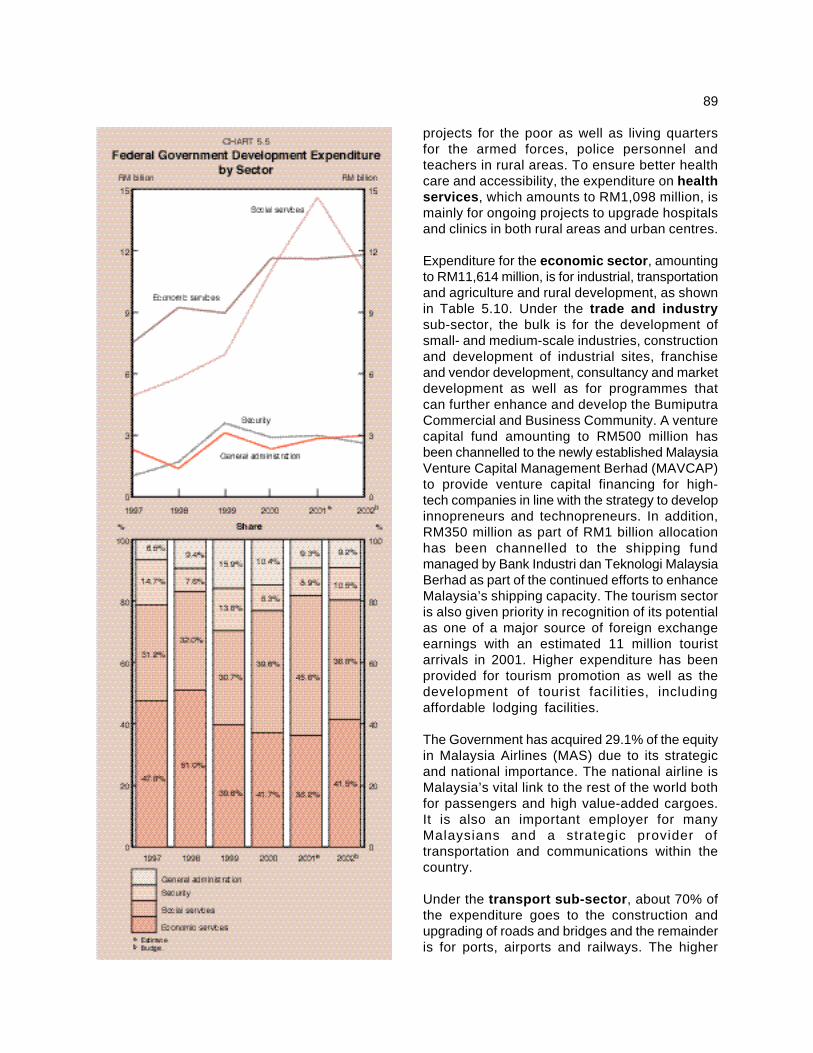
89
projects for the poor as well as living quartersfor the armed forces, police personnel andteachers in rural areas. To ensure better healthcare and accessibility, the expenditure on healthservices, which amounts to RM1,098 million, ismainly for ongoing projects to upgrade hospitalsand clinics in both rural areas and urban centres.
Expenditure for the economic sector, amountingto RM11,614 million, is for industrial, transportationand agriculture and rural development, as shownin Table 5.10. Under the trade and industrysub-sector, the bulk is for the development ofsmall- and medium-scale industries, constructionand development of industrial sites, franchiseand vendor development, consultancy and marketdevelopment as well as for programmes thatcan further enhance and develop the BumiputraCommercial and Business Community. A venturecapital fund amounting to RM500 million hasbeen channelled to the newly established MalaysiaVenture Capital Management Berhad (MAVCAP)to provide venture capital financing for high-tech companies in line with the strategy to developinnopreneurs and technopreneurs. In addition,RM350 million as part of RM1 billion allocationhas been channelled to the shipping fundmanaged by Bank Industri dan Teknologi MalaysiaBerhad as part of the continued efforts to enhanceMalaysia’s shipping capacity. The tourism sectoris also given priority in recognition of its potentialas one of a major source of foreign exchangeearnings with an estimated 11 million touristarrivals in 2001. Higher expenditure has beenprovided for tourism promotion as well as thedevelopment of tourist facilities, includingaffordable lodging facilities.
The Government has acquired 29.1% of the equityin Malaysia Airlines (MAS) due to its strategicand national importance. The national airline isMalaysia’s vital link to the rest of the world bothfor passengers and high value-added cargoes.It is also an important employer for manyMalaysians and a strategic provider oftransportation and communications within thecountry.
Under the transport sub-sector, about 70% ofthe expenditure goes to the construction andupgrading of roads and bridges and the remainderis for ports, airports and railways. The higher
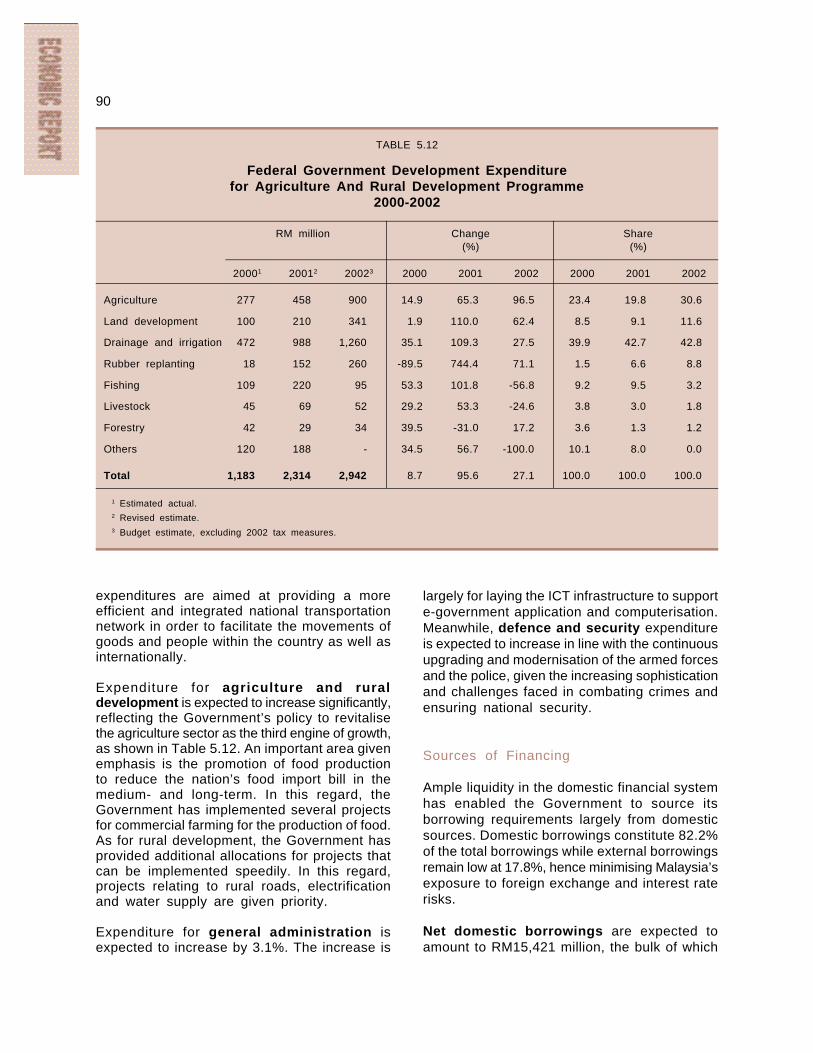
90
TABLE 5.12
Federal Government Development Expenditurefor Agriculture And Rural Development Programme
2000-2002
RM million Change Share(%) (%)
20001 20012 20023 2000 2001 2002 2000 2001 2002
Agriculture 277 458 900 14.9 65.3 96.5 23.4 19.8 30.6
Land development 100 210 341 1.9 110.0 62.4 8.5 9.1 11.6
Drainage and irrigation 472 988 1,260 35.1 109.3 27.5 39.9 42.7 42.8
Rubber replanting 18 152 260 -89.5 744.4 71.1 1.5 6.6 8.8
Fishing 109 220 95 53.3 101.8 -56.8 9.2 9.5 3.2
Livestock 45 69 52 29.2 53.3 -24.6 3.8 3.0 1.8
Forestry 42 29 34 39.5 -31.0 17.2 3.6 1.3 1.2
Others 120 188 - 34.5 56.7 -100.0 10.1 8.0 0.0
Total 1,183 2,314 2,942 8.7 95.6 27.1 100.0 100.0 100.0
1 Estimated actual.2 Revised estimate.3 Budget estimate, excluding 2002 tax measures.
expenditures are aimed at providing a moreefficient and integrated national transportationnetwork in order to facilitate the movements ofgoods and people within the country as well asinternationally.
Expenditure for agriculture and ruraldevelopment is expected to increase significantly,reflecting the Government’s policy to revitalisethe agriculture sector as the third engine of growth,as shown in Table 5.12. An important area givenemphasis is the promotion of food productionto reduce the nation’s food import bill in themedium- and long-term. In this regard, theGovernment has implemented several projectsfor commercial farming for the production of food.As for rural development, the Government hasprovided additional allocations for projects thatcan be implemented speedily. In this regard,projects relating to rural roads, electrificationand water supply are given priority.
Expenditure for general administration isexpected to increase by 3.1%. The increase is
largely for laying the ICT infrastructure to supporte-government application and computerisation.Meanwhile, defence and security expenditureis expected to increase in line with the continuousupgrading and modernisation of the armed forcesand the police, given the increasing sophisticationand challenges faced in combating crimes andensuring national security.
Sources of Financing
Ample liquidity in the domestic financial systemhas enabled the Government to source itsborrowing requirements largely from domesticsources. Domestic borrowings constitute 82.2%of the total borrowings while external borrowingsremain low at 17.8%, hence minimising Malaysia’sexposure to foreign exchange and interest raterisks.
Net domestic borrowings are expected toamount to RM15,421 million, the bulk of which
91
THE FORWARD-LOOKING BUDGETARY PROCESS
Introduction
The preparation of the national Budget is an integral part of financial and fiscal management. Thusfar, the national Budget has been prepared and approved on an annual basis. The process beginswith the Treasury issuing the call circular, usually in January, to all ministries or agencies requestingfor the submission of budget proposals for the following year. Apart from highlighting the short-term economic scenario of the nation, the Treasury call circular spells out broad budget strategiesand macroeconomic targets to be achieved.
After submission of budget proposals, the Treasury begins the budget examination process witheach ministry or agency by reviewing the progress of existing programmes and projects as wellas ensuring that new programmes and projects comply with the broad strategies and criteria setin the call circular. After elaborate consultations and reviews, which take into account, among others,the financial position of the Government such as revenue and debt profile, the national consolidatedBudget is finalised and submitted to the Parliament for consideration and approval in late October.
The New Process – Preparing and Examining The Budget Once Every Two Years
Beginning 2002, with the effect of Circular No. 2/2001, the budget preparation and examinationprocess will be carried out once every two years instead of annually. The change in the budgetaryprocedure, however, is purely administrative and does not involve amendments to the FederalConstitution or the Financial Procedure Act, 1957. In this regard, the national Budget will continueto be submitted to the Parliament for consideration and approval annually. Although the Treasurywill still have to prepare the allocation annually for submission to the Parliament, the detail examinationsand reviews of ministries’ proposals will be carried out once every two years.
Rationale
The administrative change in budget examinations and reviews to once in every two years as againstannually helps to increase the quality and efficiency of budget allocations. The new process injectsa medium-term policy focus to an otherwise short-term budgetary process. It provides the flexibilityto take into account both the shorter-term annual fiscal policies and the medium-term objectivesand policies within the context of the five-year development plans and outline perspective plans.With Government spending determined two years ahead, the new process facilitates the assessmentof the fiscal position of the Government and, hence, improves cash flow planning and management.In particular, Government borrowing programmes and requirements can be more accurately determinedin advance to minimise either over or under borrowing.
Through the two-year budgeting process, resources such as manpower, time and money at boththe Treasury and the 50 ministries and agencies for budget examination purposes, will be reduced.The resources released can be redirected and applied for tasks such as ensuring faster projectimplementation, identifying and rectifying implementation weaknesses as well as suggesting proposalsand feedback for improvement. In setting the budget two years ahead, ministries and agenciesare able to plan and implement programmes and projects with greater certainty, discipline andtransparency.
The success of the forward-looking budgetary process lies in budget allocations premised on aclear understanding of national policy thrusts and strategies. In addition, the new process allowsfor expeditious budgetary reallocations to be effected to take into account unanticipated changesin local and international environments. Therefore, even though the allocations have been determinedtwo years ahead, there is enough flexibility to meet unforeseen developments.
Conclusion
The national Budget as an effective planning tool in financial management has been long recognised.The recent change in budgetary process is to further enhance that role. The forward-lookingbudgetary process is the result of the continuous efforts of the Government towards streamliningadministrative procedures, reducing red tape and delegating powers. The new process frees resources,improves efficiency in spending, enhances programme and project effectiveness and strengthensmechanisms for control, monitoring and accountability.
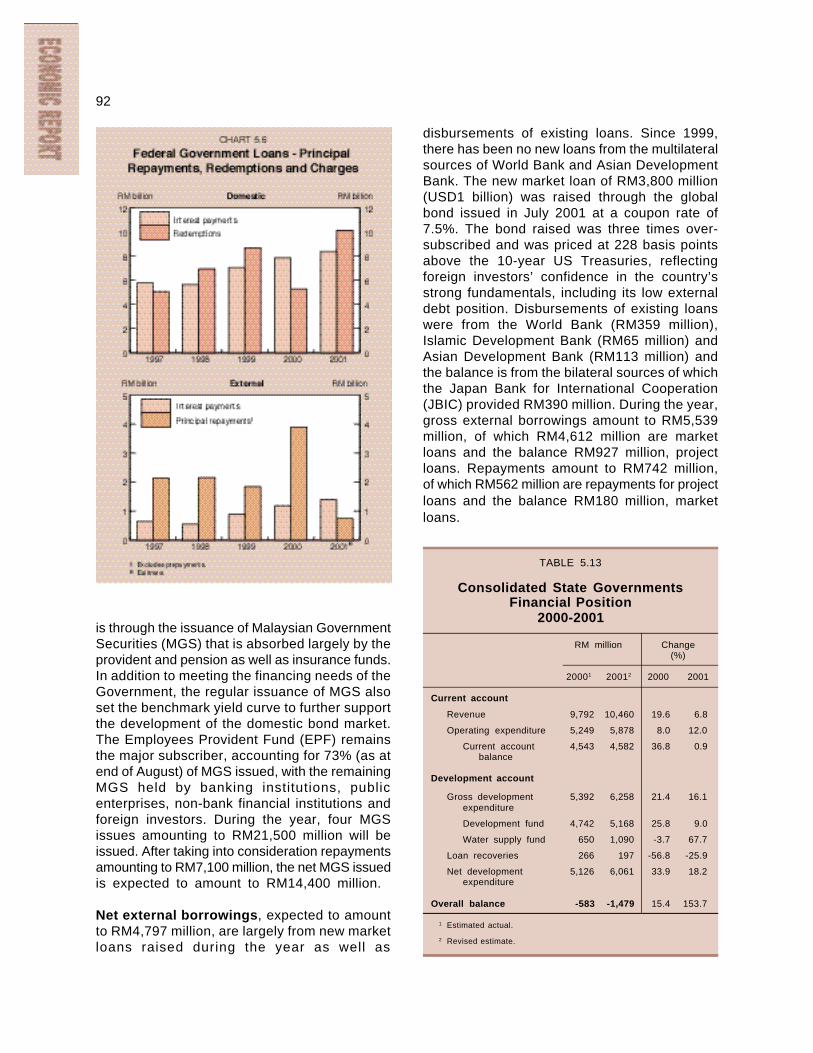
92
is through the issuance of Malaysian GovernmentSecurities (MGS) that is absorbed largely by theprovident and pension as well as insurance funds.In addition to meeting the financing needs of theGovernment, the regular issuance of MGS alsoset the benchmark yield curve to further supportthe development of the domestic bond market.The Employees Provident Fund (EPF) remainsthe major subscriber, accounting for 73% (as atend of August) of MGS issued, with the remainingMGS held by banking institutions, publicenterprises, non-bank financial institutions andforeign investors. During the year, four MGSissues amounting to RM21,500 million will beissued. After taking into consideration repaymentsamounting to RM7,100 million, the net MGS issuedis expected to amount to RM14,400 million.
Net external borrowings, expected to amountto RM4,797 million, are largely from new marketloans raised during the year as well as
TABLE 5.13
Consolidated State GovernmentsFinancial Position
2000-2001
RM million Change(%)
20001 20012 2000 2001
Current account
Revenue 9,792 10,460 19.6 6.8
Operating expenditure 5,249 5,878 8.0 12.0
Current account 4,543 4,582 36.8 0.9balance
Development account
Gross development 5,392 6,258 21.4 16.1expenditure
Development fund 4,742 5,168 25.8 9.0
Water supply fund 650 1,090 -3.7 67.7
Loan recoveries 266 197 -56.8 -25.9
Net development 5,126 6,061 33.9 18.2expenditure
Overall balance -583 -1,479 15.4 153.7
1 Estimated actual.
2 Revised estimate.
disbursements of existing loans. Since 1999,there has been no new loans from the multilateralsources of World Bank and Asian DevelopmentBank. The new market loan of RM3,800 million(USD1 billion) was raised through the globalbond issued in July 2001 at a coupon rate of7.5%. The bond raised was three times over-subscribed and was priced at 228 basis pointsabove the 10-year US Treasuries, reflectingforeign investors’ confidence in the country’sstrong fundamentals, including its low externaldebt position. Disbursements of existing loanswere from the World Bank (RM359 million),Islamic Development Bank (RM65 million) andAsian Development Bank (RM113 million) andthe balance is from the bilateral sources of whichthe Japan Bank for International Cooperation(JBIC) provided RM390 million. During the year,gross external borrowings amount to RM5,539million, of which RM4,612 million are marketloans and the balance RM927 million, projectloans. Repayments amount to RM742 million,of which RM562 million are repayments for projectloans and the balance RM180 million, marketloans.
93
State Governments
The consolidated financial position of the 13state governments is expected to record a surplusin the current account balance. However, theiroverall balance is expected to continue to bein deficit. The larger overall deficit in 2001, whichis expected to increase by 153.7% to RM1,479million from the level in 2000, is on account ofhigher development expenditure, as shown inTable 5.13. The deficit is largely financed byloans from the Federal Government and thedrawdown of state accumulated assets.
States’ own sources of revenue account for86% of the total revenue, derived mainly fromnon-tax sources such as royalties from petroleum,gas and forestry, sales of goods and services,dividends and interests on investment as wellas fees from licences and permits. Tax revenuesources which constitute only 13.5%, are mainlyland-related and entertainment taxes. FederalGovernment grants and reimbursements tostate governments contribute 14% of the staterevenue.
Total operating expenditure of stategovernments is estimated to increase by 12%to RM5,878 million (2000: RM5,249 million) withemoluments and supplies and servicesconstituting the largest components. With regardto development expenditure, in addition toexpansion and upgrading of infrastructure,housing and public amenities, about 23.2% isfor water supply projects aimed at improvingrural accessibility to potable water.
Non-Financial Public Enterprises
Non-Financial Public Enterprises (NFPEs)continue to play an important role in the economythrough their commercial activities, naturalresource development and the provision of publicutilities. The performance of NFPEs, as a group,continues to remain strong despite the slowdownin the external and domestic sectors. The strongposition of NFPEs is attributable to the sustaineddemand for petroleum products, electricity andtelecommunications services associated with thethree major companies, namely PETRONAS,Tenaga Nasional Berhad (TNB) and TelekomMalaysia Berhad (TMB).
Reflecting the better performance, theconsolidated revenue of NFPEs is expected togrow significantly by 14.2% compared with 2.5%in the previous year, as shown in Table 5.14.Although both current and developmentexpenditures will increase substantially by 12.9%and 20.5%, respectively, the overall balance ofNFPEs is projected to register a higher surpluson account of better revenue performance. Thissurplus represents a marked improvement overthe previous year, increasing by 8.5% comparedwith a decline of 7.1% in 2000.
The improved performance of the 37 NFPEs ison account of the higher earnings of PETRONAS,which is expected to contribute to almost twothird of total revenue. PETRONAS records thebest performance among the NFPEs registeringa 21% increase in earnings, accruing largelyfrom sustained high prices of petroleum products,including liquefied natural gas (LNG) as well asfavourable returns from strategic investments in25 countries worldwide. Exports and returns frominternational business constitute about 80% ofPETRONAS’ earnings. Revenue of TNB isexpected to increase marginally to RM14,379million mainly due to higher electricity supply to
TABLE 5.14
Consolidated NFPEs Financial Position2000-20011
RM million Change(%)
20003 20014 2000 2001
Revenue 102,308 116,833 2.5 14.2
Current expenditure 62,786 70,893 3.2 12.9
Retained income 39,522 45,940 1.4 16.2
% to GDP 11.6 13.3
Development 25,544 30,779 6.8 20.5expenditure2
Overall balance 13,978 15,161 -7.1 8.5
% to GDP 4.1 4.4
1 Refer to 37 NFPEs.2 Includes grant from the Federal Government.3 Actual.4 Estimate.
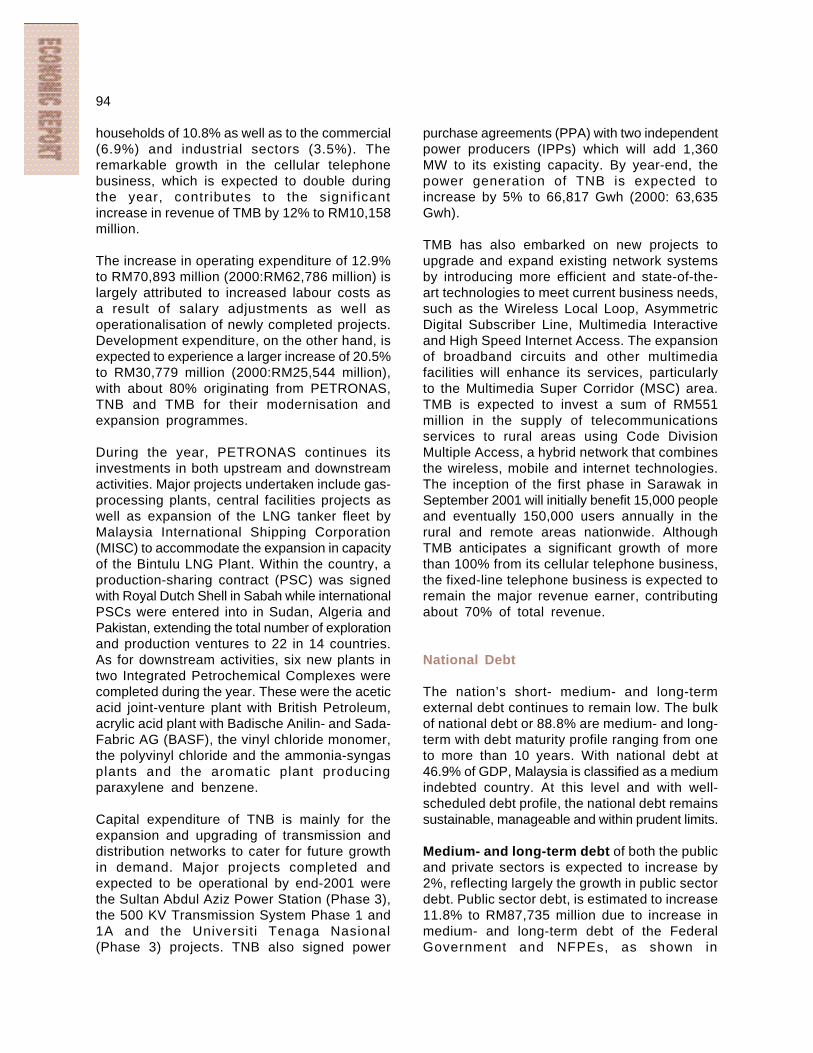
94
households of 10.8% as well as to the commercial(6.9%) and industrial sectors (3.5%). Theremarkable growth in the cellular telephonebusiness, which is expected to double duringthe year, contributes to the significantincrease in revenue of TMB by 12% to RM10,158million.
The increase in operating expenditure of 12.9%to RM70,893 million (2000:RM62,786 million) islargely attributed to increased labour costs asa result of salary adjustments as well asoperationalisation of newly completed projects.Development expenditure, on the other hand, isexpected to experience a larger increase of 20.5%to RM30,779 million (2000:RM25,544 million),with about 80% originating from PETRONAS,TNB and TMB for their modernisation andexpansion programmes.
During the year, PETRONAS continues itsinvestments in both upstream and downstreamactivities. Major projects undertaken include gas-processing plants, central facilities projects aswell as expansion of the LNG tanker fleet byMalaysia International Shipping Corporation(MISC) to accommodate the expansion in capacityof the Bintulu LNG Plant. Within the country, aproduction-sharing contract (PSC) was signedwith Royal Dutch Shell in Sabah while internationalPSCs were entered into in Sudan, Algeria andPakistan, extending the total number of explorationand production ventures to 22 in 14 countries.As for downstream activities, six new plants intwo Integrated Petrochemical Complexes werecompleted during the year. These were the aceticacid joint-venture plant with British Petroleum,acrylic acid plant with Badische Anilin- and Sada-Fabric AG (BASF), the vinyl chloride monomer,the polyvinyl chloride and the ammonia-syngasplants and the aromatic plant producingparaxylene and benzene.
Capital expenditure of TNB is mainly for theexpansion and upgrading of transmission anddistribution networks to cater for future growthin demand. Major projects completed andexpected to be operational by end-2001 werethe Sultan Abdul Aziz Power Station (Phase 3),the 500 KV Transmission System Phase 1 and1A and the Universiti Tenaga Nasional(Phase 3) projects. TNB also signed power
purchase agreements (PPA) with two independentpower producers (IPPs) which will add 1,360MW to its existing capacity. By year-end, thepower generation of TNB is expected toincrease by 5% to 66,817 Gwh (2000: 63,635Gwh).
TMB has also embarked on new projects toupgrade and expand existing network systemsby introducing more efficient and state-of-the-art technologies to meet current business needs,such as the Wireless Local Loop, AsymmetricDigital Subscriber Line, Multimedia Interactiveand High Speed Internet Access. The expansionof broadband circuits and other multimediafacilities will enhance its services, particularlyto the Multimedia Super Corridor (MSC) area.TMB is expected to invest a sum of RM551million in the supply of telecommunicationsservices to rural areas using Code DivisionMultiple Access, a hybrid network that combinesthe wireless, mobile and internet technologies.The inception of the first phase in Sarawak inSeptember 2001 will initially benefit 15,000 peopleand eventually 150,000 users annually in therural and remote areas nationwide. AlthoughTMB anticipates a significant growth of morethan 100% from its cellular telephone business,the fixed-line telephone business is expected toremain the major revenue earner, contributingabout 70% of total revenue.
National Debt
The nation’s short- medium- and long-termexternal debt continues to remain low. The bulkof national debt or 88.8% are medium- and long-term with debt maturity profile ranging from oneto more than 10 years. With national debt at46.9% of GDP, Malaysia is classified as a mediumindebted country. At this level and with well-scheduled debt profile, the national debt remainssustainable, manageable and within prudent limits.
Medium- and long-term debt of both the publicand private sectors is expected to increase by2%, reflecting largely the growth in public sectordebt. Public sector debt, is estimated to increase11.8% to RM87,735 million due to increase inmedium- and long-term debt of the FederalGovernment and NFPEs, as shown in
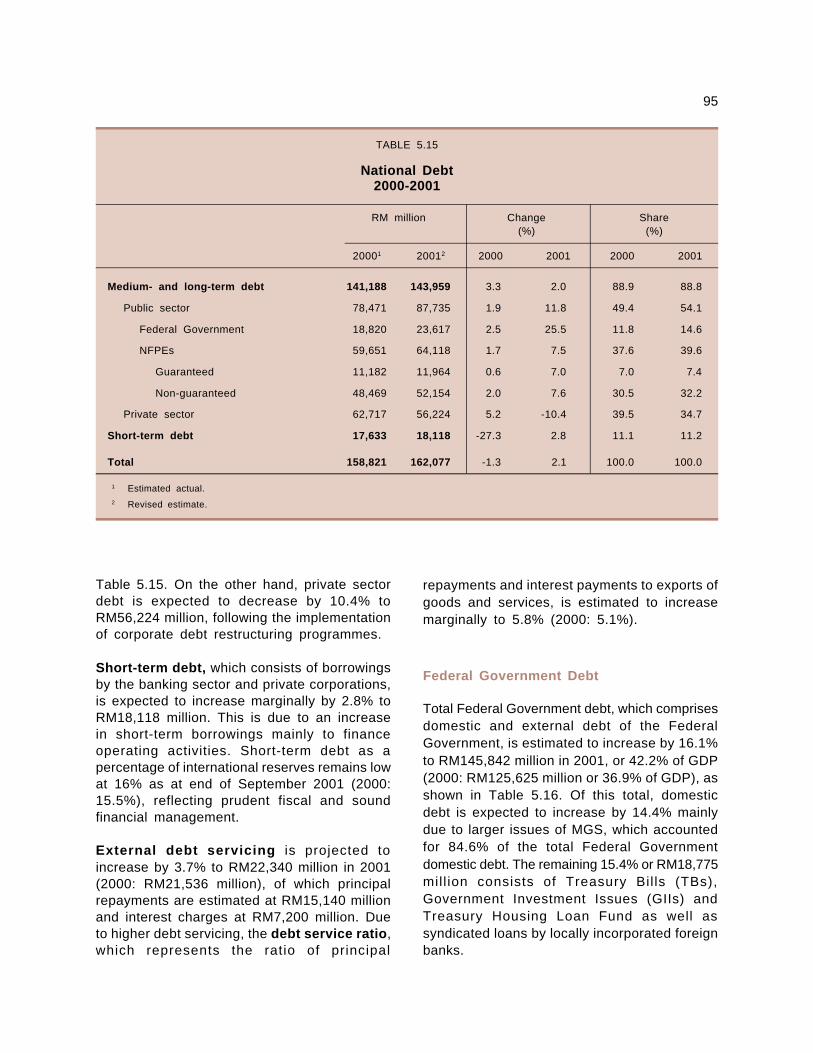
95
TABLE 5.15
National Debt2000-2001
RM million Change Share(%) (%)
20001 20012 2000 2001 2000 2001
Medium- and long-term debt 141,188 143,959 3.3 2.0 88.9 88.8
Public sector 78,471 87,735 1.9 11.8 49.4 54.1
Federal Government 18,820 23,617 2.5 25.5 11.8 14.6
NFPEs 59,651 64,118 1.7 7.5 37.6 39.6
Guaranteed 11,182 11,964 0.6 7.0 7.0 7.4
Non-guaranteed 48,469 52,154 2.0 7.6 30.5 32.2
Private sector 62,717 56,224 5.2 -10.4 39.5 34.7
Short-term debt 17,633 18,118 -27.3 2.8 11.1 11.2
Total 158,821 162,077 -1.3 2.1 100.0 100.0
1 Estimated actual.2 Revised estimate.
Table 5.15. On the other hand, private sectordebt is expected to decrease by 10.4% toRM56,224 million, following the implementationof corporate debt restructuring programmes.
Short-term debt, which consists of borrowingsby the banking sector and private corporations,is expected to increase marginally by 2.8% toRM18,118 million. This is due to an increasein short-term borrowings mainly to financeoperating activities. Short-term debt as apercentage of international reserves remains lowat 16% as at end of September 2001 (2000:15.5%), reflecting prudent fiscal and soundfinancial management.
External debt servicing is projected toincrease by 3.7% to RM22,340 million in 2001(2000: RM21,536 million), of which principalrepayments are estimated at RM15,140 millionand interest charges at RM7,200 million. Dueto higher debt servicing, the debt service ratio,which represents the ratio of principal
repayments and interest payments to exports ofgoods and services, is estimated to increasemarginally to 5.8% (2000: 5.1%).
Federal Government Debt
Total Federal Government debt, which comprisesdomestic and external debt of the FederalGovernment, is estimated to increase by 16.1%to RM145,842 million in 2001, or 42.2% of GDP(2000: RM125,625 million or 36.9% of GDP), asshown in Table 5.16. Of this total, domesticdebt is expected to increase by 14.4% mainlydue to larger issues of MGS, which accountedfor 84.6% of the total Federal Governmentdomestic debt. The remaining 15.4% or RM18,775mill ion consists of Treasury Bil ls (TBs),Government Investment Issues (GIIs) andTreasury Housing Loan Fund as well assyndicated loans by locally incorporated foreignbanks.
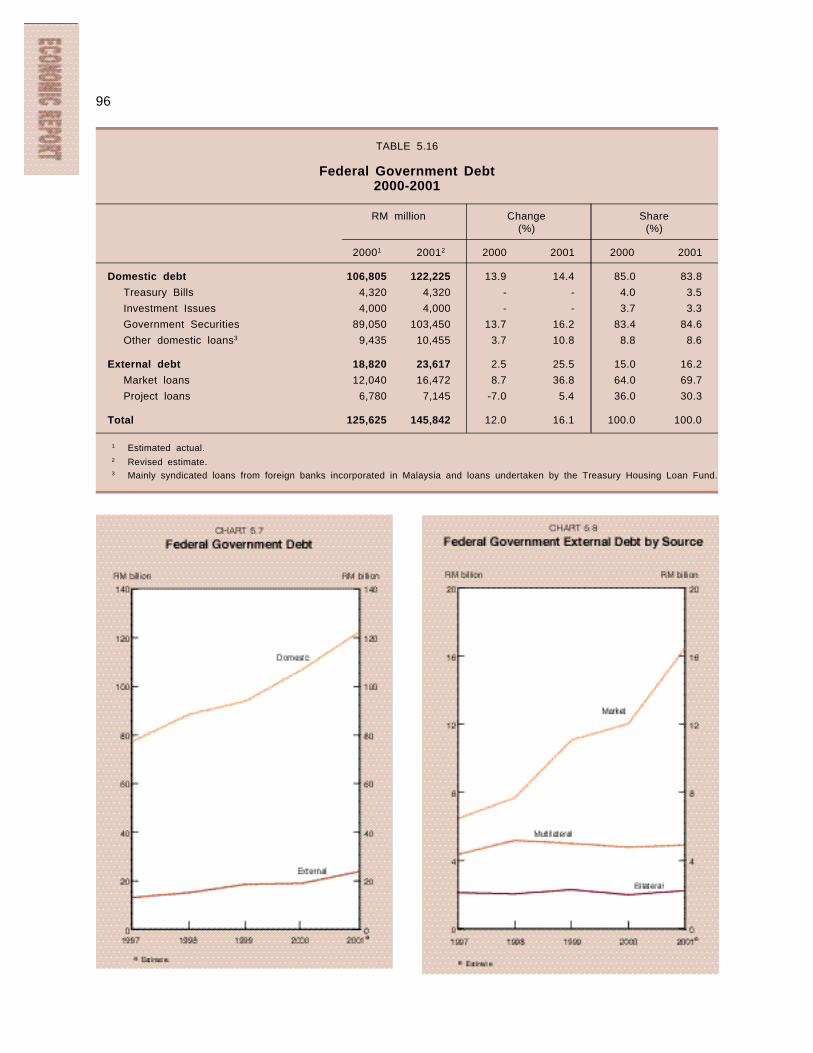
96
TABLE 5.16
Federal Government Debt2000-2001
RM million Change Share(%) (%)
20001 20012 2000 2001 2000 2001
Domestic debt 106,805 122,225 13.9 14.4 85.0 83.8
Treasury Bills 4,320 4,320 - - 4.0 3.5
Investment Issues 4,000 4,000 - - 3.7 3.3
Government Securities 89,050 103,450 13.7 16.2 83.4 84.6
Other domestic loans3 9,435 10,455 3.7 10.8 8.8 8.6
External debt 18,820 23,617 2.5 25.5 15.0 16.2
Market loans 12,040 16,472 8.7 36.8 64.0 69.7
Project loans 6,780 7,145 -7.0 5.4 36.0 30.3
Total 125,625 145,842 12.0 16.1 100.0 100.0
1 Estimated actual.2 Revised estimate.3 Mainly syndicated loans from foreign banks incorporated in Malaysia and loans undertaken by the Treasury Housing Loan Fund.
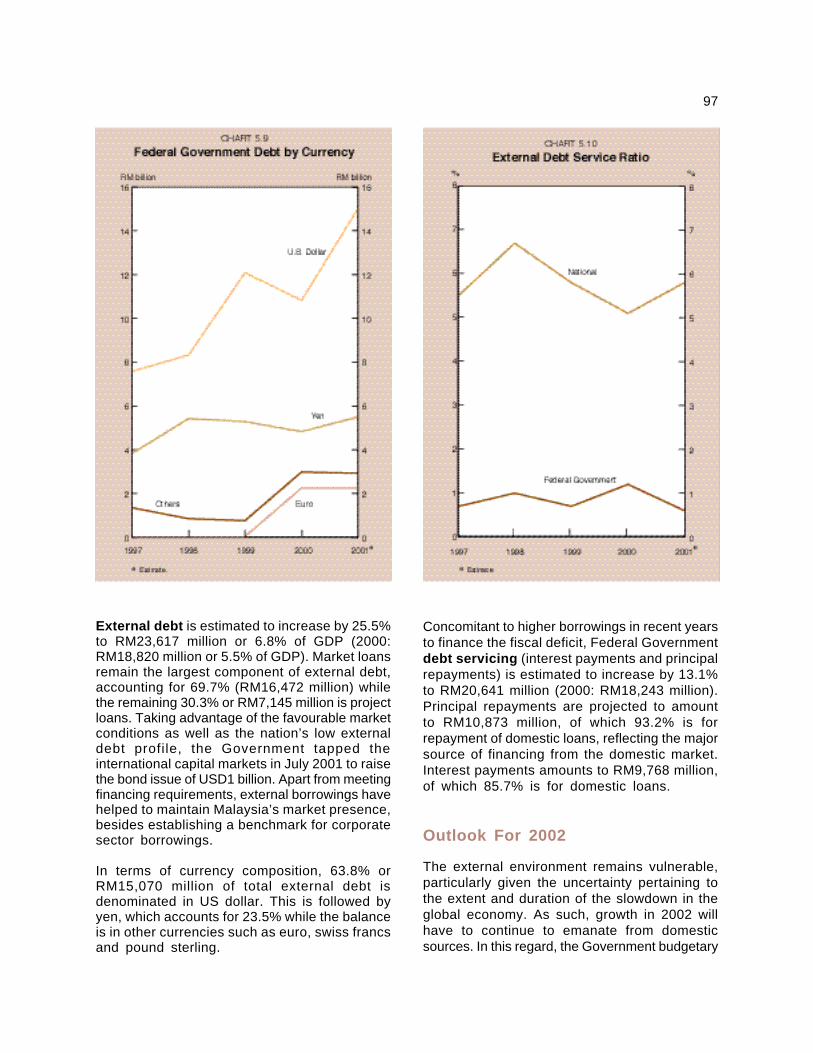
97
External debt is estimated to increase by 25.5%to RM23,617 million or 6.8% of GDP (2000:RM18,820 million or 5.5% of GDP). Market loansremain the largest component of external debt,accounting for 69.7% (RM16,472 million) whilethe remaining 30.3% or RM7,145 million is projectloans. Taking advantage of the favourable marketconditions as well as the nation’s low externaldebt profile, the Government tapped theinternational capital markets in July 2001 to raisethe bond issue of USD1 billion. Apart from meetingfinancing requirements, external borrowings havehelped to maintain Malaysia’s market presence,besides establishing a benchmark for corporatesector borrowings.
In terms of currency composition, 63.8% orRM15,070 million of total external debt isdenominated in US dollar. This is followed byyen, which accounts for 23.5% while the balanceis in other currencies such as euro, swiss francsand pound sterling.
Concomitant to higher borrowings in recent yearsto finance the fiscal deficit, Federal Governmentdebt servicing (interest payments and principalrepayments) is estimated to increase by 13.1%to RM20,641 million (2000: RM18,243 million).Principal repayments are projected to amountto RM10,873 million, of which 93.2% is forrepayment of domestic loans, reflecting the majorsource of financing from the domestic market.Interest payments amounts to RM9,768 million,of which 85.7% is for domestic loans.
Outlook For 2002
The external environment remains vulnerable,particularly given the uncertainty pertaining tothe extent and duration of the slowdown in theglobal economy. As such, growth in 2002 willhave to continue to emanate from domesticsources. In this regard, the Government budgetary
98
operation will remain expansionary. However,with better revenue performance and lowerdevelopment expenditure, the overall deficit isexpected to be smaller. Apart from reflectingfiscal prudence to ensure long-termmacroeconomic sustainability, the smaller sizeof fiscal stimulus is also based on the anticipationthat the domestic private sector activities willsomewhat recover from its slower growth in 2001.
Public Sector
Despite the higher operating expenditure of thegeneral government, the better revenueperformance is expected to result in a largercurrent surplus at RM14,004 million (2001:RM13,943 million). On the other hand, with currentsurplus of NFPEs projected to decrease by 20.4%to RM32,998 million due to lower revenueprospects of major NFPEs, particularly in theexport and utility sectors, the consolidated currentaccount position of the public sector is projectedto be lower at RM47,002 million or 12.7% ofGDP (2001: RM55,396 million or 16% of GDP).Development expenditure of the public sectoris expected to decline by 2.9% to RM59,327million (2001: RM61,129 million). Despite lowerdevelopment expenditure, the overall financialposition of the public sector is expected to recorda larger deficit at RM12,325 million or 3.3% ofGDP due to smaller current surplus.
Federal Government
Taking into consideration the need to stimulatethe economy, while at the same time maintaininglong-term fiscal sustainability and macroeconomicstability, the size of the stimulus and hence theoverall deficit is expected to be lower in 2002.The overall Federal Government deficit isexpected at RM18,624 million or 5% of GDP.The Federal Government budget allocation willcontinue to emphasise on programmes andprojects that will have immediate multiplier effectson domestic activities as well as strengthen long-term growth potentials of the economy.
Revenue
Revenue is projected to increase by 6.4% toRM73,400 million, due to better corporateperformance and thus, increased corporateincome tax collection. Petroleum income tax, onthe other hand, is expected to decline slightly,due to lower production of crude oil in 2001 aspetroleum income tax is assessed based onprevious year’s income. Indirect taxes areexpected to increase by 7% on account of highersales and service taxes and excise duties, intandem with the overall growth of theeconomy.
Non-tax revenue is expected to increase by3.4% to RM17,012 million with licenses andpermits expected to increase by 4.6% to RM6,061million, largely on account of increased revenuefrom motor vehicle licences and permits due tocontinued favourable market demand.
Operating Budget
Operating budget will be higher by 6.9% toRM65,342 million, largely to meet higheremoluments, debt service charges and suppliesand services. The increase in allocation foremoluments is due to annual salary incrementswhile the allocation for supplies and servicesis expected to increase in line with the completionof development projects as well as increasedallocation for repairs and maintenance. Anadditional allocation is also provided for themaintenance of small rural roads and drainsthroughout the country. In addition, a sizeableproportion of the operating expenditure, amountingto RM4,719 million will be for subsidy paymentsfor rice and fertilisers, petroleum products, foodand school text books.
Development Budget
Development allocation for the economic sectorwill continue to emphasise on industrial,infrastructure and agriculture and ruraldevelopment. On industrial development, the focus
99
will remain on small- and medium-scaleenterprises (SMEs), development of e-commerce,research and development as well as furtherpromotion and development of the BumiputraCommercial and Business Community. The majorinfrastructure projects to be undertaken includethe construction of the East Coast Highway andButterworth Outer Ring Road and the upgradingof trunk roads such as Muar-Melaka, JalanBalakong, Kapar-Sabak Bernam and Klang-Banting. In Sabah and Sarawak, the major roadprojects will include the upgrading of JalanKuching-Serian, Jalan Nengoh-Kanibungan andJalan Merotai-Kalabakan. Other infrastructureprojects include the Rawang-Ipoh electric doubletracking project, construction of bridges, floodmitigation, channel deepening at Tanjung PelepasPort, and construction of new airports atLimbang and Bintulu as well as upgrading ofMiri Airport.
Development allocation for the social servicessector will remain focused on education and
training, housing, health and welfare services.An allocation amounting to RM1,561 million willbe for the construction of primary and secondarysingle-session schools. Other projects includevocational and technical institutes, quarters forteachers and allocation for higher education loanfund. An allocation amounting to RM1,820 millionwill be allocated for housing. The constructionof quarters for the armed forces, police andother civil servants as well as housing for thepoor and the relocation of squatters will remainthe priority. The health sub-sector will be allocatedRM1,273 million. The allocation will be used forseveral ongoing projects as well as new projectssuch as the construction of new hospitals andupgrading of existing hospitals and clinics. Amongthe major hospitals under construction are thosein Serdang, Alor Setar, Sungai Buloh, Ampang,Sungai Petani, Pandan and Lahad Datu. TheTotal Health Information System (THIS) will alsobe implemented in all hospitals and clinics.
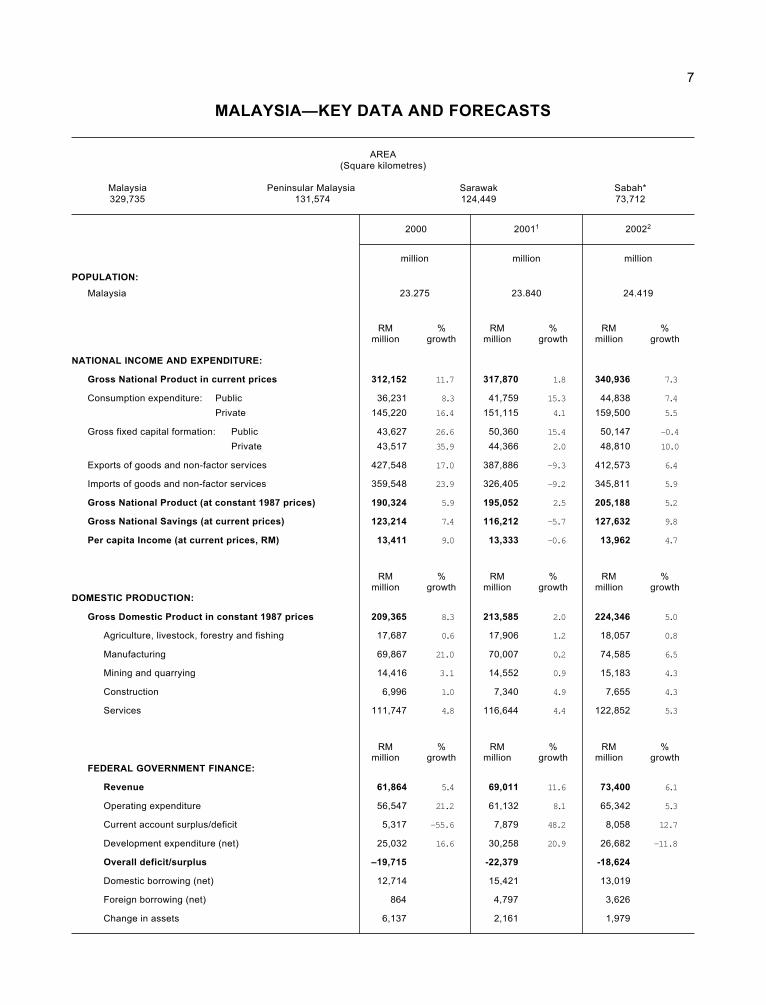
7
MALAYSIA—KEY DATA AND FORECASTS
AREA
(Square kilometres)
Malaysia Peninsular Malaysia Sarawak Sabah*
329,735 131,574 124,449 73,712
2000 20011 20022
million million million
POPULATION:
Malaysia 23.275 23.840 24.419
RM % RM % RM %million growth million growth million growth
NATIONAL INCOME AND EXPENDITURE:
Gross National Product in current prices 312,152 11.7 317,870 1.8 340,936 7.3
Consumption expenditure: Public 36,231 8.3 41,759 15.3 44,838 7.4
Private 145,220 16.4 151,115 4.1 159,500 5.5
Gross fixed capital formation: Public 43,627 26.6 50,360 15.4 50,147 –0.4
Private 43,517 35.9 44,366 2.0 48,810 10.0
Exports of goods and non-factor services 427,548 17.0 387,886 –9.3 412,573 6.4
Imports of goods and non-factor services 359,548 23.9 326,405 –9.2 345,811 5.9
Gross National Product (at constant 1987 prices) 190,324 5.9 195,052 2.5 205,188 5.2
Gross National Savings (at current prices) 123,214 7.4 116,212 –5.7 127,632 9.8
Per capita Income (at current prices, RM) 13,411 9.0 13,333 –0.6 13,962 4.7
RM % RM % RM %million growth million growth million growth
DOMESTIC PRODUCTION:
Gross Domestic Product in constant 1987 prices 209,365 8.3 213,585 2.0 224,346 5.0
Agriculture, livestock, forestry and fishing 17,687 0.6 17,906 1.2 18,057 0.8
Manufacturing 69,867 21.0 70,007 0.2 74,585 6.5
Mining and quarrying 14,416 3.1 14,552 0.9 15,183 4.3
Construction 6,996 1.0 7,340 4.9 7,655 4.3
Services 111,747 4.8 116,644 4.4 122,852 5.3
RM % RM % RM %million growth million growth million growth
FEDERAL GOVERNMENT FINANCE:
Revenue 61,864 5.4 69,011 11.6 73,400 6.1
Operating expenditure 56,547 21.2 61,132 8.1 65,342 5.3
Current account surplus/deficit 5,317 –55.6 7,879 48.2 8,058 12.7
Development expenditure (net) 25,032 16.6 30,258 20.9 26,682 –11.8
Overall deficit/surplus –19,715 -22,379 -18,624
Domestic borrowing (net) 12,714 15,421 13,019
Foreign borrowing (net) 864 4,797 3,626
Change in assets 6,137 2,161 1,979
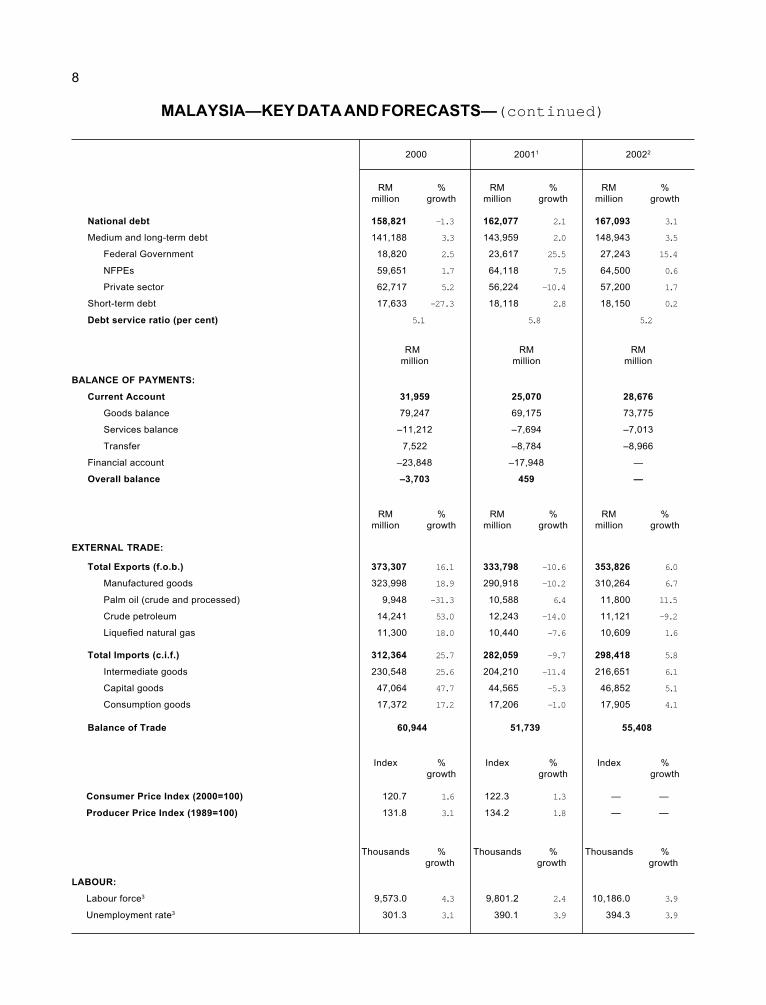
8
MALAYSIA—KEY DATA AND FORECASTS—(continued)
2000 20011 20022
RM % RM % RM %
million growth million growth million growth
National debt 158,821 –1.3 162,077 2.1 167,093 3.1
Medium and long-term debt 141,188 3.3 143,959 2.0 148,943 3.5
Federal Government 18,820 2.5 23,617 25.5 27,243 15.4
NFPEs 59,651 1.7 64,118 7.5 64,500 0.6
Private sector 62,717 5.2 56,224 –10.4 57,200 1.7
Short-term debt 17,633 –27.3 18,118 2.8 18,150 0.2
Debt service ratio (per cent) 5.1 5.8 5.2
RM RM RM
million million million
BALANCE OF PAYMENTS:
Current Account 31,959 25,070 28,676
Goods balance 79,247 69,175 73,775
Services balance –11,212 –7,694 –7,013
Transfer 7,522 –8,784 –8,966
Financial account –23,848 –17,948 —
Overall balance –3,703 459 —
RM % RM % RM %
million growth million growth million growth
EXTERNAL TRADE:
Total Exports (f.o.b.) 373,307 16.1 333,798 –10.6 353,826 6.0
Manufactured goods 323,998 18.9 290,918 –10.2 310,264 6.7
Palm oil (crude and processed) 9,948 –31.3 10,588 6.4 11,800 11.5
Crude petroleum 14,241 53.0 12,243 –14.0 11,121 –9.2
Liquefied natural gas 11,300 18.0 10,440 –7.6 10,609 1.6
Total Imports (c.i.f.) 312,364 25.7 282,059 –9.7 298,418 5.8
Intermediate goods 230,548 25.6 204,210 –11.4 216,651 6.1
Capital goods 47,064 47.7 44,565 –5.3 46,852 5.1
Consumption goods 17,372 17.2 17,206 –1.0 17,905 4.1
Balance of Trade 60,944 51,739 55,408
Index % Index % Index %
growth growth growth
Consumer Price Index (2000=100) 120.7 1.6 122.3 1.3 — —
Producer Price Index (1989=100) 131.8 3.1 134.2 1.8 — —
Thousands % Thousands % Thousands %
growth growth growth
LABOUR:
Labour force3 9,573.0 4.3 9,801.2 2.4 10,186.0 3.9
Unemployment rate3 301.3 3.1 390.1 3.9 394.3 3.9
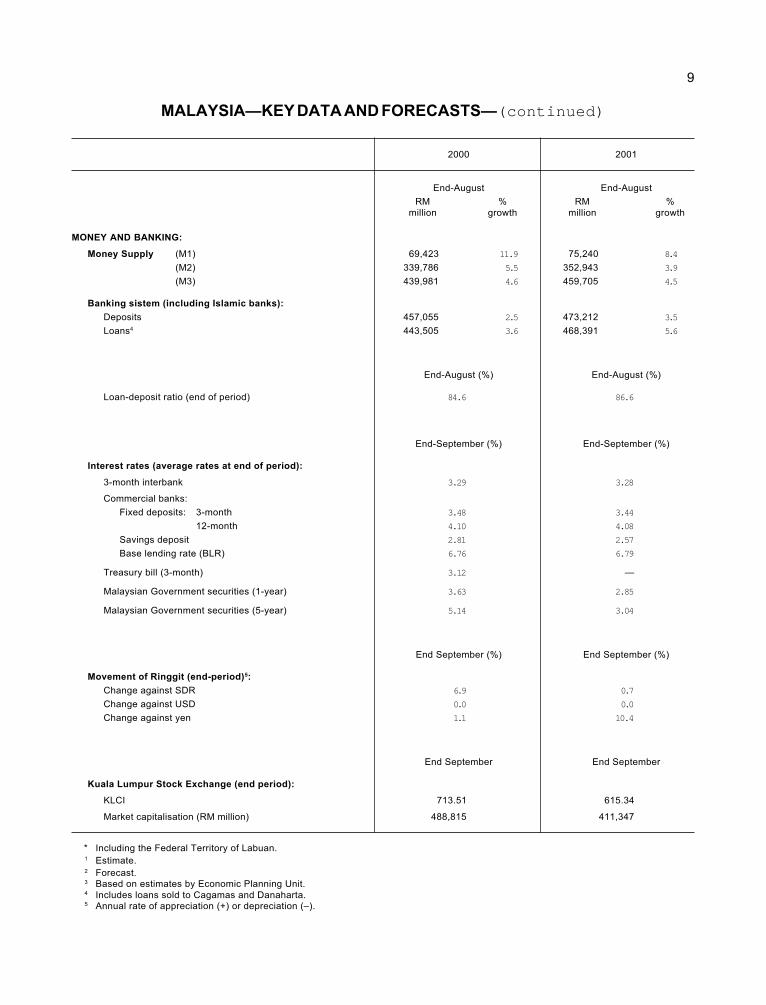
9
MALAYSIA—KEY DATA AND FORECASTS—(continued)
2000 2001
End-August End-August
RM % RM %
million growth million growth
MONEY AND BANKING:
Money Supply (M1) 69,423 11.9 75,240 8.4
(M2) 339,786 5.5 352,943 3.9
(M3) 439,981 4.6 459,705 4.5
Banking sistem (including Islamic banks):
Deposits 457,055 2.5 473,212 3.5
Loans4 443,505 3.6 468,391 5.6
End-August (%) End-August (%)
Loan-deposit ratio (end of period) 84.6 86.6
End-September (%) End-September (%)
Interest rates (average rates at end of period):
3-month interbank 3.29 3.28
Commercial banks:
Fixed deposits: 3-month 3.48 3.44
12-month 4.10 4.08
Savings deposit 2.81 2.57
Base lending rate (BLR) 6.76 6.79
Treasury bill (3-month) 3.12 —
Malaysian Government securities (1-year) 3.63 2.85
Malaysian Government securities (5-year) 5.14 3.04
End September (%) End September (%)
Movement of Ringgit (end-period)5:
Change against SDR 6.9 0.7
Change against USD 0.0 0.0
Change against yen 1.1 10.4
End September End September
Kuala Lumpur Stock Exchange (end period):
KLCI 713.51 615.34
Market capitalisation (RM million) 488,815 411,347
* Including the Federal Territory of Labuan.1 Estimate.2 Forecast.3 Based on estimates by Economic Planning Unit.4 Includes loans sold to Cagamas and Danaharta.5 Annual rate of appreciation (+) or depreciation (–).
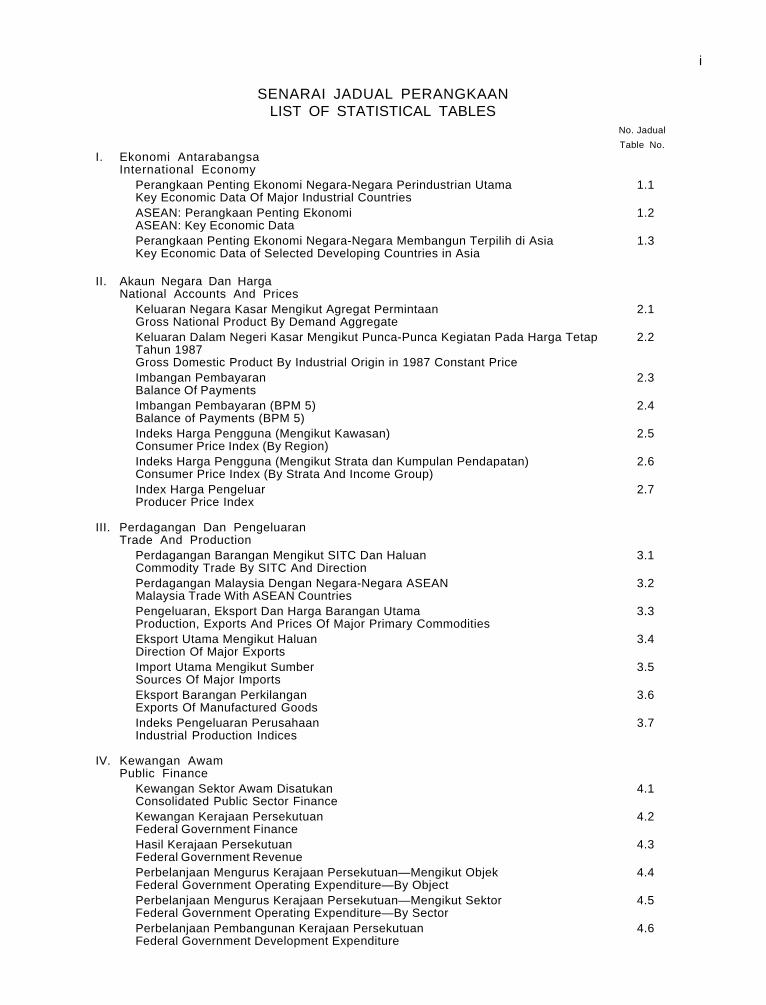
i
SENARAI JADUAL PERANGKAANLIST OF STATISTICAL TABLES
No. Jadual
Table No.I. Ekonomi Antarabangsa
International EconomyPerangkaan Penting Ekonomi Negara-Negara Perindustrian Utama 1.1Key Economic Data Of Major Industrial CountriesASEAN: Perangkaan Penting Ekonomi 1.2ASEAN: Key Economic DataPerangkaan Penting Ekonomi Negara-Negara Membangun Terpilih di Asia 1.3Key Economic Data of Selected Developing Countries in Asia
II. Akaun Negara Dan HargaNational Accounts And Prices
Keluaran Negara Kasar Mengikut Agregat Permintaan 2.1Gross National Product By Demand AggregateKeluaran Dalam Negeri Kasar Mengikut Punca-Punca Kegiatan Pada Harga Tetap 2.2Tahun 1987Gross Domestic Product By Industrial Origin in 1987 Constant PriceImbangan Pembayaran 2.3Balance Of PaymentsImbangan Pembayaran (BPM 5) 2.4Balance of Payments (BPM 5)Indeks Harga Pengguna (Mengikut Kawasan) 2.5Consumer Price Index (By Region)Indeks Harga Pengguna (Mengikut Strata dan Kumpulan Pendapatan) 2.6Consumer Price Index (By Strata And Income Group)Index Harga Pengeluar 2.7Producer Price Index
III. Perdagangan Dan PengeluaranTrade And Production
Perdagangan Barangan Mengikut SITC Dan Haluan 3.1Commodity Trade By SITC And DirectionPerdagangan Malaysia Dengan Negara-Negara ASEAN 3.2Malaysia Trade With ASEAN CountriesPengeluaran, Eksport Dan Harga Barangan Utama 3.3Production, Exports And Prices Of Major Primary CommoditiesEksport Utama Mengikut Haluan 3.4Direction Of Major ExportsImport Utama Mengikut Sumber 3.5Sources Of Major ImportsEksport Barangan Perkilangan 3.6Exports Of Manufactured GoodsIndeks Pengeluaran Perusahaan 3.7Industrial Production Indices
IV. Kewangan AwamPublic Finance
Kewangan Sektor Awam Disatukan 4.1Consolidated Public Sector FinanceKewangan Kerajaan Persekutuan 4.2Federal Government FinanceHasil Kerajaan Persekutuan 4.3Federal Government RevenuePerbelanjaan Mengurus Kerajaan Persekutuan—Mengikut Objek 4.4Federal Government Operating Expenditure—By ObjectPerbelanjaan Mengurus Kerajaan Persekutuan—Mengikut Sektor 4.5Federal Government Operating Expenditure—By SectorPerbelanjaan Pembangunan Kerajaan Persekutuan 4.6Federal Government Development Expenditure
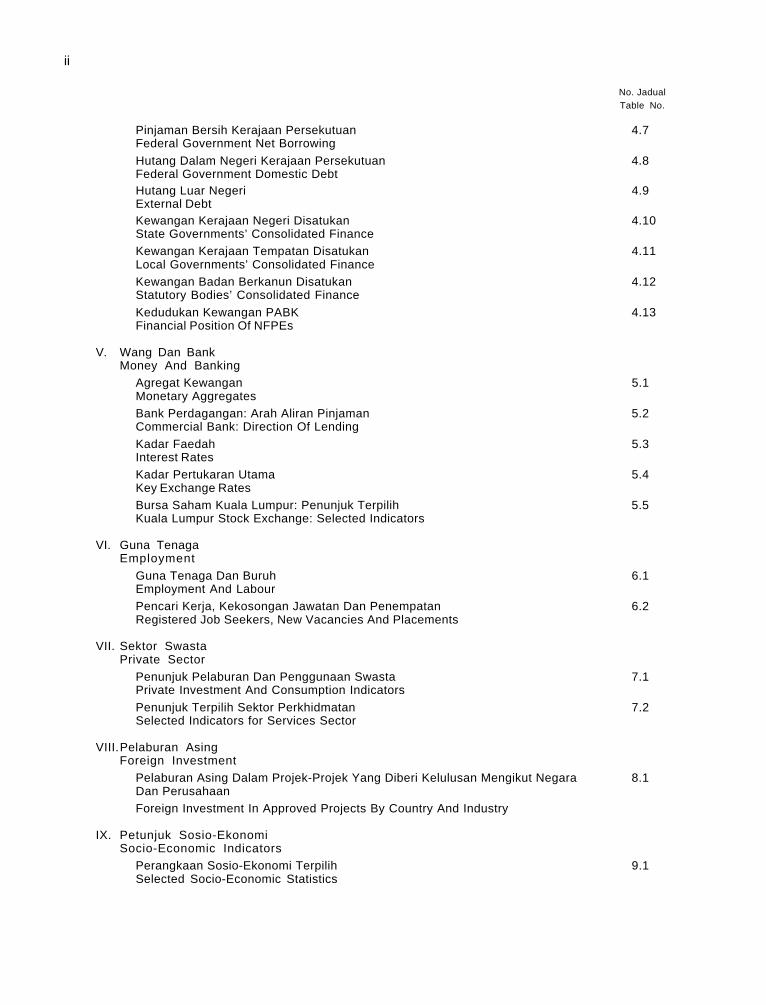
ii
No. JadualTable No.
Pinjaman Bersih Kerajaan Persekutuan 4.7Federal Government Net Borrowing
Hutang Dalam Negeri Kerajaan Persekutuan 4.8Federal Government Domestic DebtHutang Luar Negeri 4.9External DebtKewangan Kerajaan Negeri Disatukan 4.10State Governments’ Consolidated FinanceKewangan Kerajaan Tempatan Disatukan 4.11Local Governments’ Consolidated FinanceKewangan Badan Berkanun Disatukan 4.12Statutory Bodies’ Consolidated Finance
Kedudukan Kewangan PABK 4.13Financial Position Of NFPEs
V. Wang Dan BankMoney And Banking
Agregat Kewangan 5.1Monetary AggregatesBank Perdagangan: Arah Aliran Pinjaman 5.2Commercial Bank: Direction Of Lending
Kadar Faedah 5.3Interest RatesKadar Pertukaran Utama 5.4Key Exchange RatesBursa Saham Kuala Lumpur: Penunjuk Terpilih 5.5Kuala Lumpur Stock Exchange: Selected Indicators
VI. Guna TenagaEmployment
Guna Tenaga Dan Buruh 6.1Employment And LabourPencari Kerja, Kekosongan Jawatan Dan Penempatan 6.2Registered Job Seekers, New Vacancies And Placements
VII. Sektor SwastaPrivate Sector
Penunjuk Pelaburan Dan Penggunaan Swasta 7.1Private Investment And Consumption Indicators
Penunjuk Terpilih Sektor Perkhidmatan 7.2Selected Indicators for Services Sector
VIII.Pelaburan AsingForeign Investment
Pelaburan Asing Dalam Projek-Projek Yang Diberi Kelulusan Mengikut Negara 8.1Dan PerusahaanForeign Investment In Approved Projects By Country And Industry
IX. Petunjuk Sosio-EkonomiSocio-Economic Indicators
Perangkaan Sosio-Ekonomi Terpilih 9.1Selected Socio-Economic Statistics
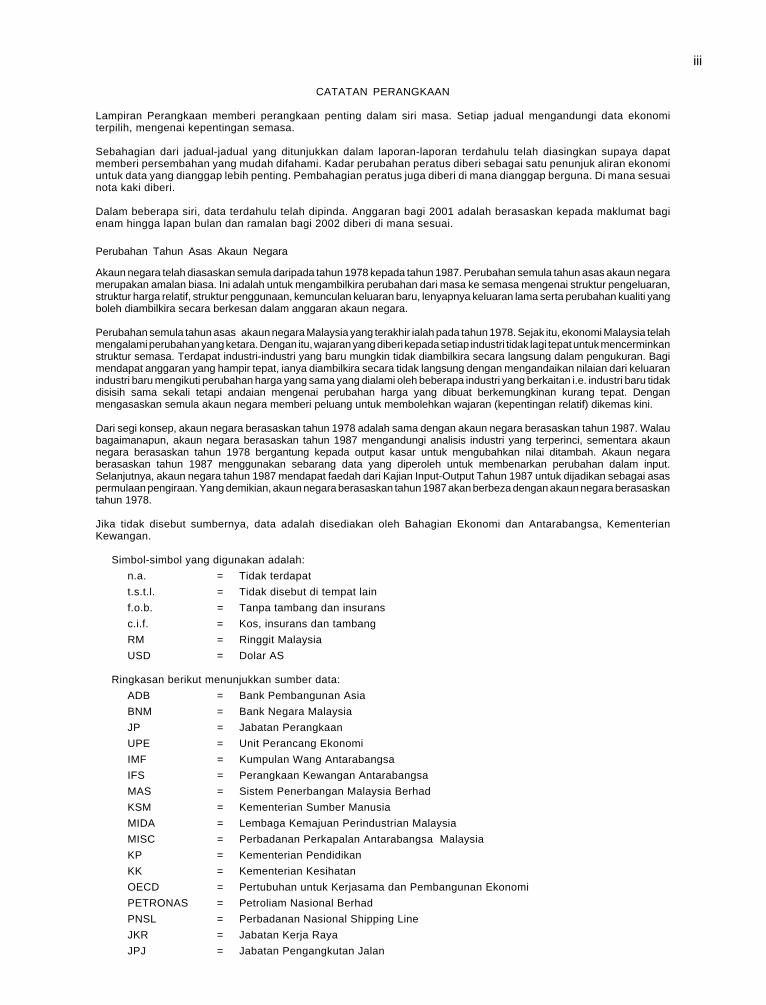
iii
CATATAN PERANGKAAN
Lampiran Perangkaan memberi perangkaan penting dalam siri masa. Setiap jadual mengandungi data ekonomiterpilih, mengenai kepentingan semasa.
Sebahagian dari jadual-jadual yang ditunjukkan dalam laporan-laporan terdahulu telah diasingkan supaya dapatmemberi persembahan yang mudah difahami. Kadar perubahan peratus diberi sebagai satu penunjuk aliran ekonomiuntuk data yang dianggap lebih penting. Pembahagian peratus juga diberi di mana dianggap berguna. Di mana sesuainota kaki diberi.
Dalam beberapa siri, data terdahulu telah dipinda. Anggaran bagi 2001 adalah berasaskan kepada maklumat bagienam hingga lapan bulan dan ramalan bagi 2002 diberi di mana sesuai.
Perubahan Tahun Asas Akaun Negara
Akaun negara telah diasaskan semula daripada tahun 1978 kepada tahun 1987. Perubahan semula tahun asas akaun negaramerupakan amalan biasa. Ini adalah untuk mengambilkira perubahan dari masa ke semasa mengenai struktur pengeluaran,struktur harga relatif, struktur penggunaan, kemunculan keluaran baru, lenyapnya keluaran lama serta perubahan kualiti yangboleh diambilkira secara berkesan dalam anggaran akaun negara.
Perubahan semula tahun asas akaun negara Malaysia yang terakhir ialah pada tahun 1978. Sejak itu, ekonomi Malaysia telahmengalami perubahan yang ketara. Dengan itu, wajaran yang diberi kepada setiap industri tidak lagi tepat untuk mencerminkanstruktur semasa. Terdapat industri-industri yang baru mungkin tidak diambilkira secara langsung dalam pengukuran. Bagimendapat anggaran yang hampir tepat, ianya diambilkira secara tidak langsung dengan mengandaikan nilaian dari keluaranindustri baru mengikuti perubahan harga yang sama yang dialami oleh beberapa industri yang berkaitan i.e. industri baru tidakdisisih sama sekali tetapi andaian mengenai perubahan harga yang dibuat berkemungkinan kurang tepat. Denganmengasaskan semula akaun negara memberi peluang untuk membolehkan wajaran (kepentingan relatif) dikemas kini.
Dari segi konsep, akaun negara berasaskan tahun 1978 adalah sama dengan akaun negara berasaskan tahun 1987. Walaubagaimanapun, akaun negara berasaskan tahun 1987 mengandungi analisis industri yang terperinci, sementara akaunnegara berasaskan tahun 1978 bergantung kepada output kasar untuk mengubahkan nilai ditambah. Akaun negaraberasaskan tahun 1987 menggunakan sebarang data yang diperoleh untuk membenarkan perubahan dalam input.Selanjutnya, akaun negara tahun 1987 mendapat faedah dari Kajian Input-Output Tahun 1987 untuk dijadikan sebagai asaspermulaan pengiraan. Yang demikian, akaun negara berasaskan tahun 1987 akan berbeza dengan akaun negara berasaskantahun 1978.
Jika tidak disebut sumbernya, data adalah disediakan oleh Bahagian Ekonomi dan Antarabangsa, KementerianKewangan.
Simbol-simbol yang digunakan adalah:
n.a. = Tidak terdapat
t.s.t.l. = Tidak disebut di tempat lain
f.o.b. = Tanpa tambang dan insurans
c.i.f. = Kos, insurans dan tambang
RM = Ringgit Malaysia
USD = Dolar AS
Ringkasan berikut menunjukkan sumber data:
ADB = Bank Pembangunan Asia
BNM = Bank Negara Malaysia
JP = Jabatan Perangkaan
UPE = Unit Perancang Ekonomi
IMF = Kumpulan Wang Antarabangsa
IFS = Perangkaan Kewangan Antarabangsa
MAS = Sistem Penerbangan Malaysia Berhad
KSM = Kementerian Sumber Manusia
MIDA = Lembaga Kemajuan Perindustrian Malaysia
MISC = Perbadanan Perkapalan Antarabangsa Malaysia
KP = Kementerian Pendidikan
KK = Kementerian Kesihatan
OECD = Pertubuhan untuk Kerjasama dan Pembangunan Ekonomi
PETRONAS = Petroliam Nasional Berhad
PNSL = Perbadanan Nasional Shipping Line
JKR = Jabatan Kerja Raya
JPJ = Jabatan Pengangkutan Jalan
iv
STATISTICAL ANNOTATION
The Statistical Appendix provides key economic data in a time series. Each table contains selected economic data ofcurrent interest.
Some of the tables shown in previous Reports have been separated to provide a comprehensive yet simplerpresentation. Percentage rates of change have been provided for the more important variables as a quick indicationof economic trends. In addition, percentage proportions of totals have been given where deemed useful. Wherevernecessary, footnotes have been provided.
In some series, historical figures have been revised. Estimates for 2000 are based on six to eight months data andforecasts for 2001 have been provided where appropriate.
Changing the Base year of the National Account
The national accounts have recently been rebased from 1978 to 1987. Rebasing the national accounts is standard internationalpractice. This is to take into account for structural changes over time in production structure, structural changes in relativeprices, structural changes in consumption patterns, appearance of new products and disappearance of old products and largequality changes that can effectively be incorporated in the national accounts estimates.
The last re-base in the Malaysian national accounts was done in 1978. Since then the Malaysian economy has undergonesignificant changes. As such, the weight given to each industry no longer accurately reflects the current structure. Newindustries that have started may not have been included directly in the measure. As an approximation, they have been includedindirectly by assuming that the value of the new industry output has followed the same price changes as some related industryi.e. the new industries have not been omitted altogether but assumptions on price change have had to be made which mightbe inappropriate. The re-base provides an opportunity to bring the weights (relative importance) up to date.
Conceptually, the 1978 based national accounts is similar to the 1987 based national accounts. The 1987 based nationalaccounts, however, has a more detailed industry analysis while the 1978 based national accounts relied on gross output tomove value added, the 1987 based national accounts make use of wherever data is available to allow for variations in input.In addition, the 1987 based national accounts have the advantage of the 1987 Input-Output Study as a starting point. Hencethe 1987 based national accounts will differ from the 1978 based national accounts.
Unless otherwise stated, the source of data is the Economics and International Division of the Ministry of Finance.
Symbols used are:
n.a. = Not available
n.e.s. = Not elsewhere stated
f.o.b. = Free on board
c.i.f. = Cost, insurance and freight
RM = Malaysian Ringgit
USD = US Dollar
The following abbreviations refer to sources of data:
ADB = Asian Development Bank
BNM = The Central Bank of Malaysia
DOS = Department of Statistics
EPU = Economic Planning Unit
IMF = International Monetary Fund
IFS = International Financial Statistics
MAS = Malaysia Airlines System Berhad
MHR = Ministry of Human Resources
MIDA = Malaysian Industrial Development Authority
MISC = Malaysian International Shipping Corporation
ME = Ministry of Education
MH = Ministry of Health
OECD = Organisation for Economic Cooperation and Development
PETRONAS = Petroliam Nasional Berhad
PNSL = Perbadanan Nasional Shipping Line
PWD = Public Works Department
RTD = Road Transport Department
SDR = Special Drawing Rights
TNB = Tenaga Nasional Berhad
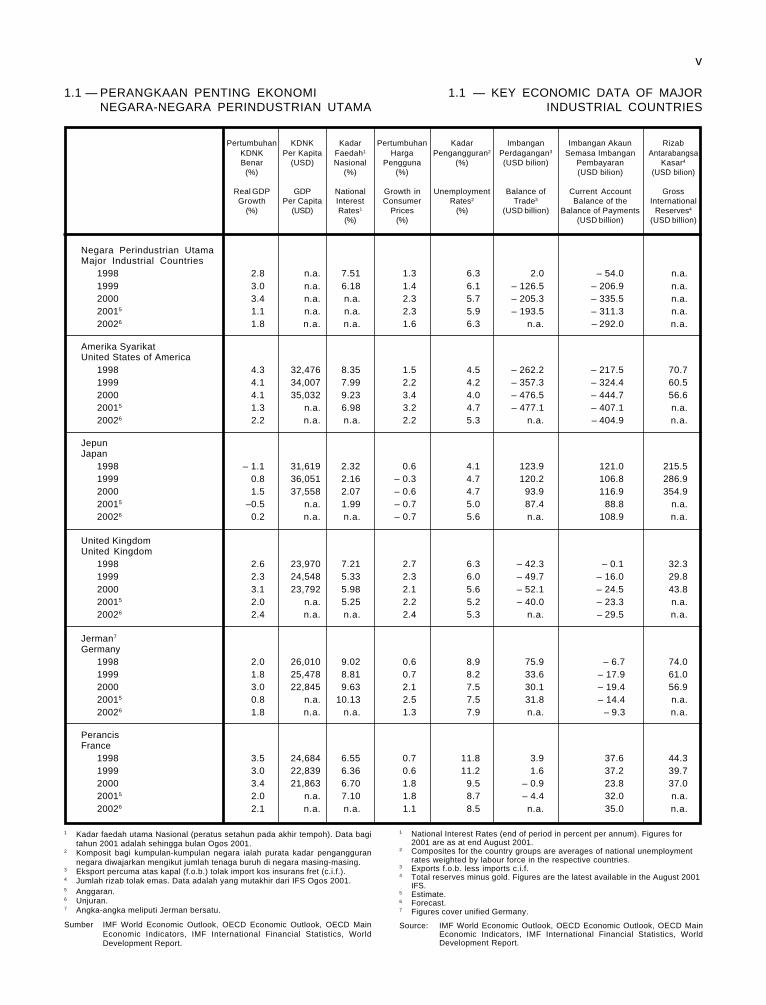
v
1.1 — PERANGKAAN PENTING EKONOMINEGARA-NEGARA PERINDUSTRIAN UTAMA
Pertumbuhan KDNK Kadar Pertumbuhan Kadar Imbangan Imbangan Akaun RizabKDNK Per Kapita Faedah1 Harga Pengangguran2 Perdagangan3 Semasa Imbangan AntarabangsaBenar (USD) Nasional Pengguna (%) (USD bilion) Pembayaran Kasar4
(%) (%) (%) (USD bilion) (USD bilion)
Real GDP GDP National Growth in Unemployment Balance of Current Account GrossGrowth Per Capita Interest Consumer Rates2 Trade3 Balance of the International
(%) (USD) Rates1 Prices (%) (USD billion) Balance of Payments Reserves4
(%) (%) (USD billion) (USD billion)
Negara Perindustrian UtamaMajor Industrial Countries
1998 2.8 n.a. 7.51 1.3 6.3 2.0 – 54.0 n.a.1999 3.0 n.a. 6.18 1.4 6.1 – 126.5 – 206.9 n.a.2000 3.4 n.a. n.a. 2.3 5.7 – 205.3 – 335.5 n.a.20015 1.1 n.a. n.a. 2.3 5.9 – 193.5 – 311.3 n.a.20026 1.8 n.a. n.a. 1.6 6.3 n.a. – 292.0 n.a.
Amerika SyarikatUnited States of America
1998 4.3 32,476 8.35 1.5 4.5 – 262.2 – 217.5 70.71999 4.1 34,007 7.99 2.2 4.2 – 357.3 – 324.4 60.52000 4.1 35,032 9.23 3.4 4.0 – 476.5 – 444.7 56.620015 1.3 n.a. 6.98 3.2 4.7 – 477.1 – 407.1 n.a.20026 2.2 n.a. n.a. 2.2 5.3 n.a. – 404.9 n.a.
JepunJapan
1998 – 1.1 31,619 2.32 0.6 4.1 123.9 121.0 215.51999 0.8 36,051 2.16 – 0.3 4.7 120.2 106.8 286.92000 1.5 37,558 2.07 – 0.6 4.7 93.9 116.9 354.920015 –0.5 n.a. 1.99 – 0.7 5.0 87.4 88.8 n.a.20026 0.2 n.a. n.a. – 0.7 5.6 n.a. 108.9 n.a.
United KingdomUnited Kingdom
1998 2.6 23,970 7.21 2.7 6.3 – 42.3 – 0.1 32.31999 2.3 24,548 5.33 2.3 6.0 – 49.7 – 16.0 29.82000 3.1 23,792 5.98 2.1 5.6 – 52.1 – 24.5 43.820015 2.0 n.a. 5.25 2.2 5.2 – 40.0 – 23.3 n.a.20026 2.4 n.a. n.a. 2.4 5.3 n.a. – 29.5 n.a.
Jerman7
Germany1998 2.0 26,010 9.02 0.6 8.9 75.9 – 6.7 74.01999 1.8 25,478 8.81 0.7 8.2 33.6 – 17.9 61.02000 3.0 22,845 9.63 2.1 7.5 30.1 – 19.4 56.920015 0.8 n.a. 10.13 2.5 7.5 31.8 – 14.4 n.a.20026 1.8 n.a. n.a. 1.3 7.9 n.a. – 9.3 n.a.
PerancisFrance
1998 3.5 24,684 6.55 0.7 11.8 3.9 37.6 44.31999 3.0 22,839 6.36 0.6 11.2 1.6 37.2 39.72000 3.4 21,863 6.70 1.8 9.5 – 0.9 23.8 37.020015 2.0 n.a. 7.10 1.8 8.7 – 4.4 32.0 n.a.20026 2.1 n.a. n.a. 1.1 8.5 n.a. 35.0 n.a.
1.1 — KEY ECONOMIC DATA OF MAJORINDUSTRIAL COUNTRIES
1 National Interest Rates (end of period in percent per annum). Figures for2001 are as at end August 2001.
2 Composites for the country groups are averages of national unemploymentrates weighted by labour force in the respective countries.
3 Exports f.o.b. less imports c.i.f.4 Total reserves minus gold. Figures are the latest available in the August 2001
IFS.5 Estimate.6 Forecast.7 Figures cover unified Germany.
Source: IMF World Economic Outlook, OECD Economic Outlook, OECD MainEconomic Indicators, IMF International Financial Statistics, WorldDevelopment Report.
1 Kadar faedah utama Nasional (peratus setahun pada akhir tempoh). Data bagitahun 2001 adalah sehingga bulan Ogos 2001.
2 Komposit bagi kumpulan-kumpulan negara ialah purata kadar penganggurannegara diwajarkan mengikut jumlah tenaga buruh di negara masing-masing.
3 Eksport percuma atas kapal (f.o.b.) tolak import kos insurans fret (c.i.f.).4 Jumlah rizab tolak emas. Data adalah yang mutakhir dari IFS Ogos 2001.5 Anggaran.6 Unjuran.7 Angka-angka meliputi Jerman bersatu.
Sumber IMF World Economic Outlook, OECD Economic Outlook, OECD MainEconomic Indicators, IMF International Financial Statistics, WorldDevelopment Report.
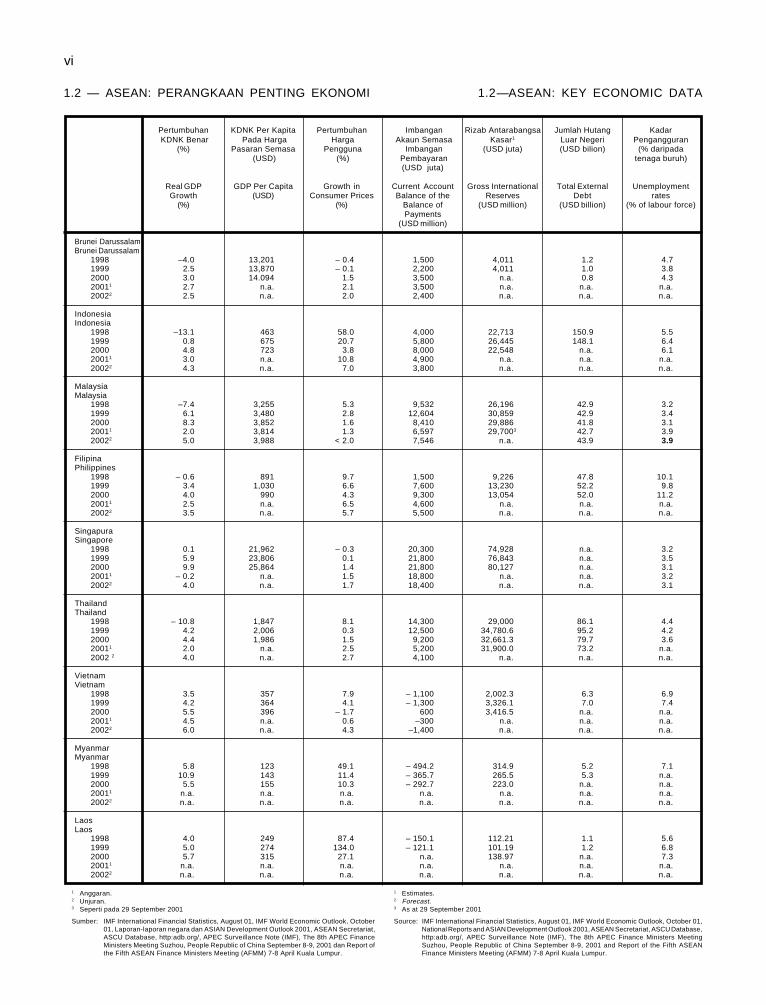
vi
Brunei DarussalamBrunei Darussalam
1998 –4.0 13,201 – 0.4 1,500 4,011 1.2 4.71999 2.5 13,870 – 0.1 2,200 4,011 1.0 3.82000 3.0 14.094 1.5 3,500 n.a. 0.8 4.320011 2.7 n.a. 2.1 3,500 n.a. n.a. n.a.20022 2.5 n.a. 2.0 2,400 n.a. n.a. n.a.
IndonesiaIndonesia
1998 –13.1 463 58.0 4,000 22,713 150.9 5.51999 0.8 675 20.7 5,800 26,445 148.1 6.42000 4.8 723 3.8 8,000 22,548 n.a. 6.120011 3.0 n.a. 10.8 4,900 n.a. n.a. n.a.20022 4.3 n.a. 7.0 3,800 n.a. n.a. n.a.
MalaysiaMalaysia
1998 –7.4 3,255 5.3 9,532 26,196 42.9 3.21999 6.1 3,480 2.8 12,604 30,859 42.9 3.42000 8.3 3,852 1.6 8,410 29,886 41.8 3.120011 2.0 3,814 1.3 6,597 29,7003 42.7 3.920022 5.0 3,988 < 2.0 7,546 n.a. 43.9 3.9
FilipinaPhilippines
1998 – 0.6 891 9.7 1,500 9,226 47.8 10.11999 3.4 1,030 6.6 7,600 13,230 52.2 9.82000 4.0 990 4.3 9,300 13,054 52.0 11.220011 2.5 n.a. 6.5 4,600 n.a. n.a. n.a.20022 3.5 n.a. 5.7 5,500 n.a. n.a. n.a.
SingapuraSingapore
1998 0.1 21,962 – 0.3 20,300 74,928 n.a. 3.21999 5.9 23,806 0.1 21,800 76,843 n.a. 3.52000 9.9 25,864 1.4 21,800 80,127 n.a. 3.120011 – 0.2 n.a. 1.5 18,800 n.a. n.a. 3.220022 4.0 n.a. 1.7 18,400 n.a. n.a. 3.1
ThailandThailand
1998 – 10.8 1,847 8.1 14,300 29,000 86.1 4.41999 4.2 2,006 0.3 12,500 34,780.6 95.2 4.22000 4.4 1,986 1.5 9,200 32,661.3 79.7 3.620011 2.0 n.a. 2.5 5,200 31,900.0 73.2 n.a.2002 2 4.0 n.a. 2.7 4,100 n.a. n.a. n.a.
VietnamVietnam
1998 3.5 357 7.9 – 1,100 2,002.3 6.3 6.91999 4.2 364 4.1 – 1,300 3,326.1 7.0 7.42000 5.5 396 – 1.7 600 3,416.5 n.a. n.a.20011 4.5 n.a. 0.6 –300 n.a. n.a. n.a.20022 6.0 n.a. 4.3 –1,400 n.a. n.a. n.a.
MyanmarMyanmar
1998 5.8 123 49.1 – 494.2 314.9 5.2 7.11999 10.9 143 11.4 – 365.7 265.5 5.3 n.a.2000 5.5 155 10.3 – 292.7 223.0 n.a. n.a.20011 n.a. n.a. n.a. n.a. n.a. n.a. n.a.20022 n.a. n.a. n.a. n.a. n.a. n.a. n.a.
LaosLaos
1998 4.0 249 87.4 – 150.1 112.21 1.1 5.61999 5.0 274 134.0 – 121.1 101.19 1.2 6.82000 5.7 315 27.1 n.a. 138.97 n.a. 7.320011 n.a. n.a. n.a. n.a. n.a. n.a. n.a.20022 n.a. n.a. n.a. n.a. n.a. n.a. n.a.
1.2 — ASEAN: PERANGKAAN PENTING EKONOMI
Pertumbuhan KDNK Per Kapita Pertumbuhan Imbangan Rizab Antarabangsa Jumlah Hutang Kadar KDNK Benar Pada Harga Harga Akaun Semasa Kasar1 Luar Negeri Pengangguran
(%) Pasaran Semasa Pengguna Imbangan (USD juta) (USD bilion) (% daripada (USD) (%) Pembayaran tenaga buruh)
(USD juta)
Real GDP GDP Per Capita Growth in Current Account Gross International Total External UnemploymentGrowth (USD) Consumer Prices Balance of the Reserves Debt rates
(%) (%) Balance of (USD million) (USD billion) (% of labour force)Payments
(USD million)
1.2—ASEAN: KEY ECONOMIC DATA
1 Estimates.2 Forecast.3 As at 29 September 2001
Source: IMF International Financial Statistics, August 01, IMF World Economic Outlook, October 01,National Reports and ASIAN Development Outlook 2001, ASEAN Secretariat, ASCU Database,http:adb.org/, APEC Surveillance Note (IMF), The 8th APEC Finance Ministers MeetingSuzhou, People Republic of China September 8-9, 2001 and Report of the Fifth ASEANFinance Ministers Meeting (AFMM) 7-8 April Kuala Lumpur.
1 Anggaran.2 Unjuran.3 Seperti pada 29 September 2001
Sumber: IMF International Financial Statistics, August 01, IMF World Economic Outlook, October01, Laporan-laporan negara dan ASIAN Development Outlook 2001, ASEAN Secretariat,ASCU Database, http:adb.org/, APEC Surveillance Note (IMF), The 8th APEC FinanceMinisters Meeting Suzhou, People Republic of China September 8-9, 2001 dan Report ofthe Fifth ASEAN Finance Ministers Meeting (AFMM) 7-8 April Kuala Lumpur.
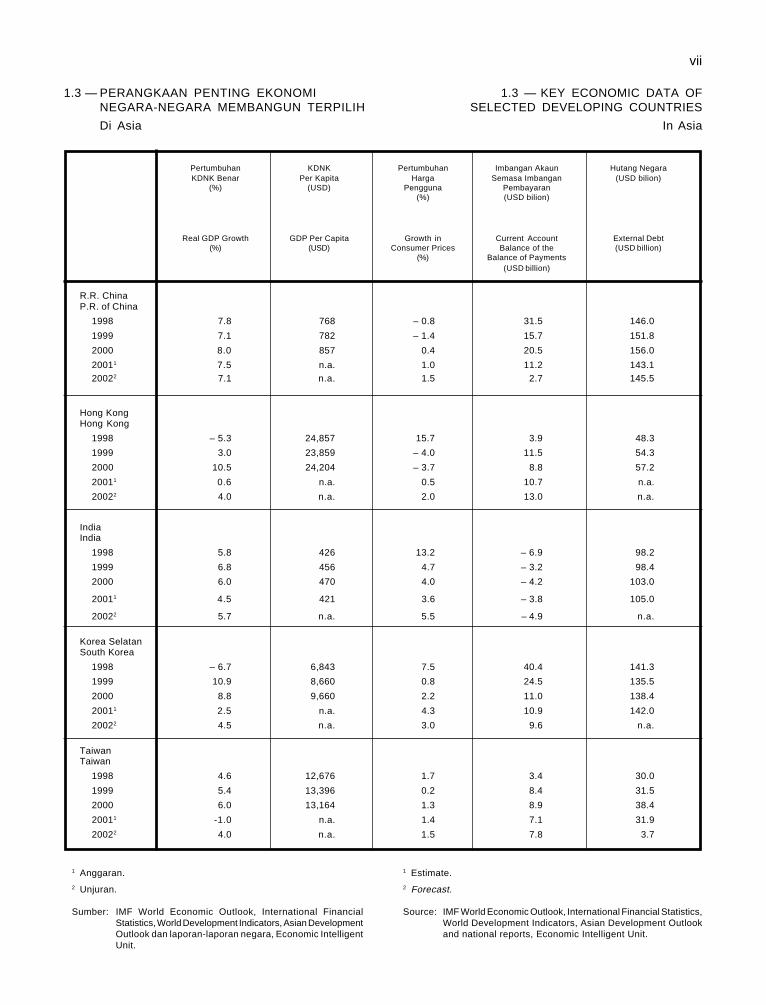
vii
1 Anggaran.2 Unjuran.
Sumber: IMF World Economic Outlook, International FinancialStatistics, World Development Indicators, Asian DevelopmentOutlook dan laporan-laporan negara, Economic IntelligentUnit.
1 Estimate.2 Forecast.
Source: IMF World Economic Outlook, International Financial Statistics,World Development Indicators, Asian Development Outlookand national reports, Economic Intelligent Unit.
1.3 — PERANGKAAN PENTING EKONOMI 1.3 — KEY ECONOMIC DATA OFNEGARA-NEGARA MEMBANGUN TERPILIH SELECTED DEVELOPING COUNTRIES
Di Asia In Asia
Pertumbuhan KDNK Pertumbuhan Imbangan Akaun Hutang NegaraKDNK Benar Per Kapita Harga Semasa Imbangan (USD bilion)
(%) (USD) Pengguna Pembayaran(%) (USD bilion)
Real GDP Growth GDP Per Capita Growth in Current Account External Debt(%) (USD) Consumer Prices Balance of the (USD billion)
(%) Balance of Payments(USD billion)
R.R. ChinaP.R. of China
1998 7.8 768 – 0.8 31.5 146.0
1999 7.1 782 – 1.4 15.7 151.8
2000 8.0 857 0.4 20.5 156.0
20011 7.5 n.a. 1.0 11.2 143.120022 7.1 n.a. 1.5 2.7 145.5
Hong KongHong Kong
1998 – 5.3 24,857 15.7 3.9 48.3
1999 3.0 23,859 – 4.0 11.5 54.3
2000 10.5 24,204 – 3.7 8.8 57.2
20011 0.6 n.a. 0.5 10.7 n.a.
20022 4.0 n.a. 2.0 13.0 n.a.
IndiaIndia
1998 5.8 426 13.2 – 6.9 98.2
1999 6.8 456 4.7 – 3.2 98.4
2000 6.0 470 4.0 – 4.2 103.0
20011 4.5 421 3.6 – 3.8 105.0
20022 5.7 n.a. 5.5 – 4.9 n.a.
Korea SelatanSouth Korea
1998 – 6.7 6,843 7.5 40.4 141.3
1999 10.9 8,660 0.8 24.5 135.5
2000 8.8 9,660 2.2 11.0 138.4
20011 2.5 n.a. 4.3 10.9 142.0
20022 4.5 n.a. 3.0 9.6 n.a.
TaiwanTaiwan
1998 4.6 12,676 1.7 3.4 30.0
1999 5.4 13,396 0.2 8.4 31.5
2000 6.0 13,164 1.3 8.9 38.4
20011 -1.0 n.a. 1.4 7.1 31.9
20022 4.0 n.a. 1.5 7.8 3.7
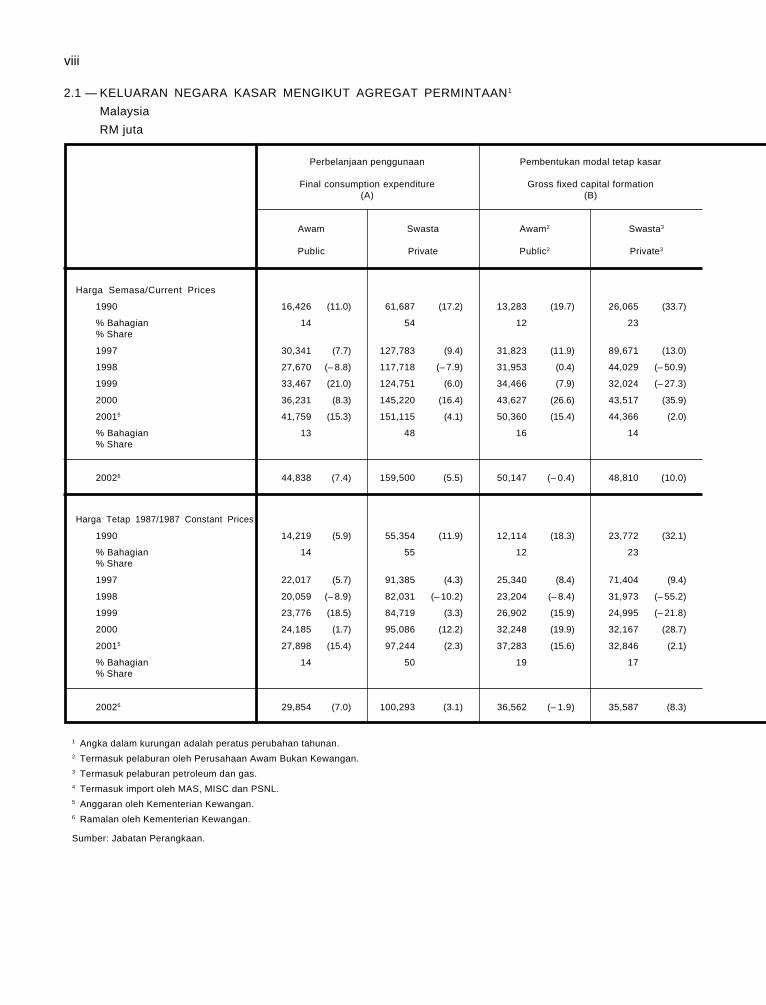
viii
2.1 — KELUARAN NEGARA KASAR MENGIKUT AGREGAT PERMINTAAN1
Malaysia
RM juta
Perbelanjaan penggunaan Pembentukan modal tetap kasar
Final consumption expenditure Gross fixed capital formation(A) (B)
Awam Swasta Awam2 Swasta3
Public Private Public2 Private3
Harga Semasa/Current Prices
1990 16,426 (11.0) 61,687 (17.2) 13,283 (19.7) 26,065 (33.7)
% Bahagian 14 54 12 23% Share
1997 30,341 (7.7) 127,783 (9.4) 31,823 (11.9) 89,671 (13.0)
1998 27,670 (– 8.8) 117,718 (– 7.9) 31,953 (0.4) 44,029 (– 50.9)
1999 33,467 (21.0) 124,751 (6.0) 34,466 (7.9) 32,024 (– 27.3)
2000 36,231 (8.3) 145,220 (16.4) 43,627 (26.6) 43,517 (35.9)
20015 41,759 (15.3) 151,115 (4.1) 50,360 (15.4) 44,366 (2.0)
% Bahagian 13 48 16 14% Share
20026 44,838 (7.4) 159,500 (5.5) 50,147 (– 0.4) 48,810 (10.0)
Harga Tetap 1987/1987 Constant Prices
1990 14,219 (5.9) 55,354 (11.9) 12,114 (18.3) 23,772 (32.1)
% Bahagian 14 55 12 23% Share
1997 22,017 (5.7) 91,385 (4.3) 25,340 (8.4) 71,404 (9.4)
1998 20,059 (– 8.9) 82,031 (– 10.2) 23,204 (– 8.4) 31,973 (– 55.2)
1999 23,776 (18.5) 84,719 (3.3) 26,902 (15.9) 24,995 (– 21.8)
2000 24,185 (1.7) 95,086 (12.2) 32,248 (19.9) 32,167 (28.7)
20015 27,898 (15.4) 97,244 (2.3) 37,283 (15.6) 32,846 (2.1)
% Bahagian 14 50 19 17% Share
20026 29,854 (7.0) 100,293 (3.1) 36,562 (– 1.9) 35,587 (8.3)
1 Angka dalam kurungan adalah peratus perubahan tahunan.2 Termasuk pelaburan oleh Perusahaan Awam Bukan Kewangan.3 Termasuk pelaburan petroleum dan gas.4 Termasuk import oleh MAS, MISC dan PSNL.5 Anggaran oleh Kementerian Kewangan.6 Ramalan oleh Kementerian Kewangan.
Sumber: Jabatan Perangkaan.
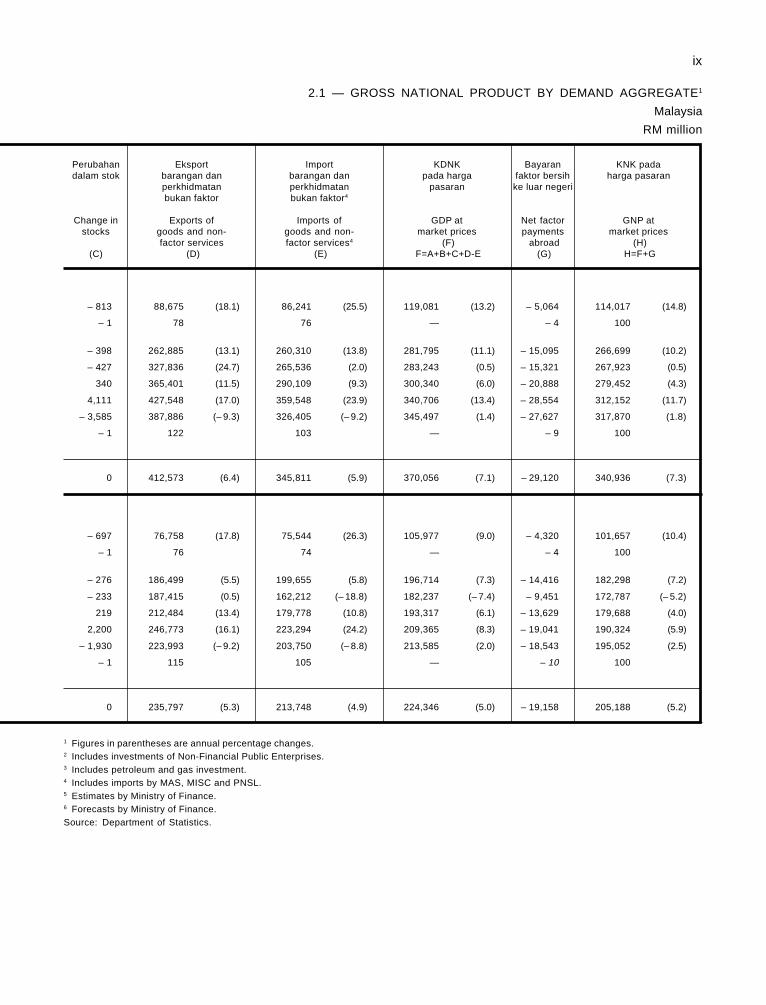
ix
2.1 — GROSS NATIONAL PRODUCT BY DEMAND AGGREGATE1
Malaysia
RM million
Perubahan Eksport Import KDNK Bayaran KNK padadalam stok barangan dan barangan dan pada harga faktor bersih harga pasaran
perkhidmatan perkhidmatan pasaran ke luar negeribukan faktor bukan faktor4
Change in Exports of Imports of GDP at Net factor GNP atstocks goods and non- goods and non- market prices payments market prices
factor services factor services4 (F) abroad (H)(C) (D) (E) F=A+B+C+D-E (G) H=F+G
– 813 88,675 (18.1) 86,241 (25.5) 119,081 (13.2) – 5,064 114,017 (14.8)
– 1 78 76 — – 4 100
– 398 262,885 (13.1) 260,310 (13.8) 281,795 (11.1) – 15,095 266,699 (10.2)
– 427 327,836 (24.7) 265,536 (2.0) 283,243 (0.5) – 15,321 267,923 (0.5)
340 365,401 (11.5) 290,109 (9.3) 300,340 (6.0) – 20,888 279,452 (4.3)
4,111 427,548 (17.0) 359,548 (23.9) 340,706 (13.4) – 28,554 312,152 (11.7)
– 3,585 387,886 (– 9.3) 326,405 (– 9.2) 345,497 (1.4) – 27,627 317,870 (1.8)
– 1 122 103 — – 9 100
0 412,573 (6.4) 345,811 (5.9) 370,056 (7.1) – 29,120 340,936 (7.3)
– 697 76,758 (17.8) 75,544 (26.3) 105,977 (9.0) – 4,320 101,657 (10.4)
– 1 76 74 — – 4 100
– 276 186,499 (5.5) 199,655 (5.8) 196,714 (7.3) – 14,416 182,298 (7.2)
– 233 187,415 (0.5) 162,212 (– 18.8) 182,237 (– 7.4) – 9,451 172,787 (– 5.2)
219 212,484 (13.4) 179,778 (10.8) 193,317 (6.1) – 13,629 179,688 (4.0)
2,200 246,773 (16.1) 223,294 (24.2) 209,365 (8.3) – 19,041 190,324 (5.9)
– 1,930 223,993 (– 9.2) 203,750 (– 8.8) 213,585 (2.0) – 18,543 195,052 (2.5)
– 1 115 105 — – 10 100
0 235,797 (5.3) 213,748 (4.9) 224,346 (5.0) – 19,158 205,188 (5.2)
1 Figures in parentheses are annual percentage changes.2 Includes investments of Non-Financial Public Enterprises.3 Includes petroleum and gas investment.4 Includes imports by MAS, MISC and PNSL.5 Estimates by Ministry of Finance.6 Forecasts by Ministry of Finance.Source: Department of Statistics.
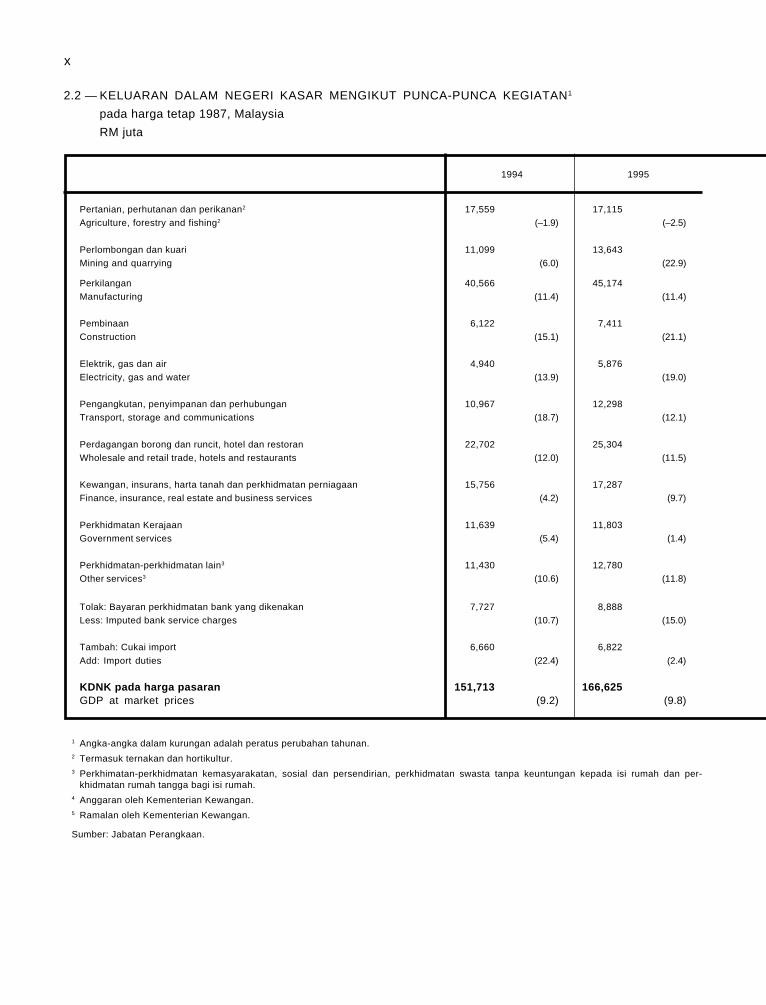
x
1 Angka-angka dalam kurungan adalah peratus perubahan tahunan.2 Termasuk ternakan dan hortikultur.3 Perkhimatan-perkhidmatan kemasyarakatan, sosial dan persendirian, perkhidmatan swasta tanpa keuntungan kepada isi rumah dan per-
khidmatan rumah tangga bagi isi rumah.4 Anggaran oleh Kementerian Kewangan.5 Ramalan oleh Kementerian Kewangan.
Sumber: Jabatan Perangkaan.
2.2 — KELUARAN DALAM NEGERI KASAR MENGIKUT PUNCA-PUNCA KEGIATAN1
pada harga tetap 1987, Malaysia
RM juta
1994 1995
Pertanian, perhutanan dan perikanan2 17,559 17,115Agriculture, forestry and fishing2 (–1.9) (–2.5)
Perlombongan dan kuari 11,099 13,643Mining and quarrying (6.0) (22.9)
Perkilangan 40,566 45,174Manufacturing (11.4) (11.4)
Pembinaan 6,122 7,411Construction (15.1) (21.1)
Elektrik, gas dan air 4,940 5,876Electricity, gas and water (13.9) (19.0)
Pengangkutan, penyimpanan dan perhubungan 10,967 12,298Transport, storage and communications (18.7) (12.1)
Perdagangan borong dan runcit, hotel dan restoran 22,702 25,304Wholesale and retail trade, hotels and restaurants (12.0) (11.5)
Kewangan, insurans, harta tanah dan perkhidmatan perniagaan 15,756 17,287Finance, insurance, real estate and business services (4.2) (9.7)
Perkhidmatan Kerajaan 11,639 11,803Government services (5.4) (1.4)
Perkhidmatan-perkhidmatan lain3 11,430 12,780Other services3 (10.6) (11.8)
Tolak: Bayaran perkhidmatan bank yang dikenakan 7,727 8,888Less: Imputed bank service charges (10.7) (15.0)
Tambah: Cukai import 6,660 6,822
Add: Import duties (22.4) (2.4)
KDNK pada harga pasaran 151,713 166,625GDP at market prices (9.2) (9.8)
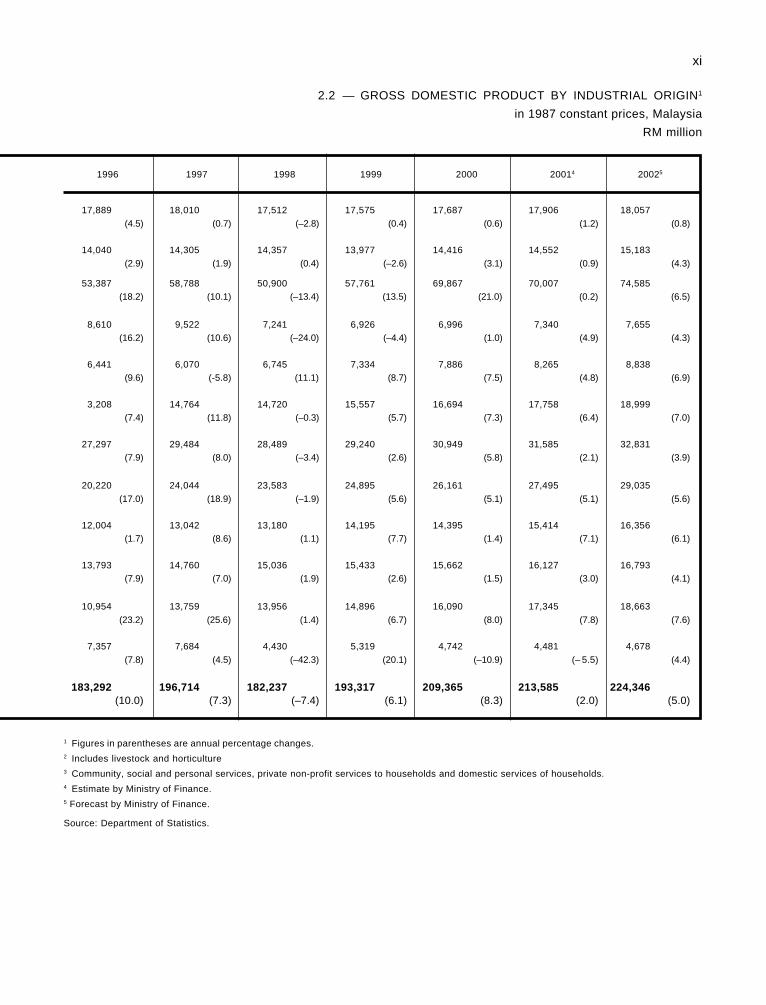
xi
2.2 — GROSS DOMESTIC PRODUCT BY INDUSTRIAL ORIGIN1
in 1987 constant prices, Malaysia
RM million
1996 1997 1998 1999 2000 20014 20025
17,889 18,010 17,512 17,575 17,687 17,906 18,057(4.5) (0.7) (–2.8) (0.4) (0.6) (1.2) (0.8)
14,040 14,305 14,357 13,977 14,416 14,552 15,183(2.9) (1.9) (0.4) (–2.6) (3.1) (0.9) (4.3)
53,387 58,788 50,900 57,761 69,867 70,007 74,585(18.2) (10.1) (–13.4) (13.5) (21.0) (0.2) (6.5)
8,610 9,522 7,241 6,926 6,996 7,340 7,655(16.2) (10.6) (–24.0) (–4.4) (1.0) (4.9) (4.3)
6,441 6,070 6,745 7,334 7,886 8,265 8,838(9.6) (-5.8) (11.1) (8.7) (7.5) (4.8) (6.9)
3,208 14,764 14,720 15,557 16,694 17,758 18,999(7.4) (11.8) (–0.3) (5.7) (7.3) (6.4) (7.0)
27,297 29,484 28,489 29,240 30,949 31,585 32,831(7.9) (8.0) (–3.4) (2.6) (5.8) (2.1) (3.9)
20,220 24,044 23,583 24,895 26,161 27,495 29,035(17.0) (18.9) (–1.9) (5.6) (5.1) (5.1) (5.6)
12,004 13,042 13,180 14,195 14,395 15,414 16,356(1.7) (8.6) (1.1) (7.7) (1.4) (7.1) (6.1)
13,793 14,760 15,036 15,433 15,662 16,127 16,793(7.9) (7.0) (1.9) (2.6) (1.5) (3.0) (4.1)
10,954 13,759 13,956 14,896 16,090 17,345 18,663(23.2) (25.6) (1.4) (6.7) (8.0) (7.8) (7.6)
7,357 7,684 4,430 5,319 4,742 4,481 4,678(7.8) (4.5) (–42.3) (20.1) (–10.9) (– 5.5) (4.4)
183,292 196,714 182,237 193,317 209,365 213,585 224,346(10.0) (7.3) (–7.4) (6.1) (8.3) (2.0) (5.0)
1 Figures in parentheses are annual percentage changes.2 Includes livestock and horticulture3 Community, social and personal services, private non-profit services to households and domestic services of households.4 Estimate by Ministry of Finance.5 Forecast by Ministry of Finance.
Source: Department of Statistics.
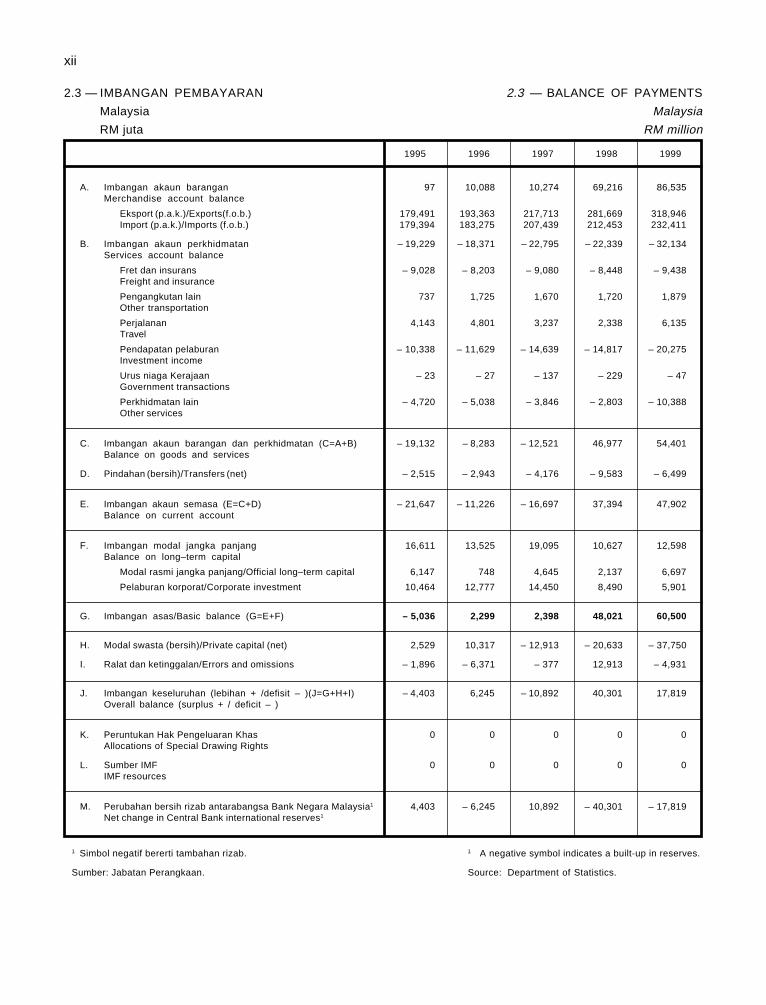
xii
2.3 — IMBANGAN PEMBAYARAN
Malaysia
RM juta
1995 1996 1997 1998 1999
A. Imbangan akaun barangan 97 10,088 10,274 69,216 86,535Merchandise account balance
Eksport (p.a.k.)/Exports(f.o.b.) 179,491 193,363 217,713 281,669 318,946Import (p.a.k.)/Imports (f.o.b.) 179,394 183,275 207,439 212,453 232,411
B. Imbangan akaun perkhidmatan – 19,229 – 18,371 – 22,795 – 22,339 – 32,134Services account balance
Fret dan insurans – 9,028 – 8,203 – 9,080 – 8,448 – 9,438Freight and insurance
Pengangkutan lain 737 1,725 1,670 1,720 1,879Other transportation
Perjalanan 4,143 4,801 3,237 2,338 6,135Travel
Pendapatan pelaburan – 10,338 – 11,629 – 14,639 – 14,817 – 20,275Investment income
Urus niaga Kerajaan – 23 – 27 – 137 – 229 – 47Government transactions
Perkhidmatan lain – 4,720 – 5,038 – 3,846 – 2,803 – 10,388Other services
C. Imbangan akaun barangan dan perkhidmatan (C=A+B) – 19,132 – 8,283 – 12,521 46,977 54,401Balance on goods and services
D. Pindahan (bersih)/Transfers (net) – 2,515 – 2,943 – 4,176 – 9,583 – 6,499
E. Imbangan akaun semasa (E=C+D) – 21,647 – 11,226 – 16,697 37,394 47,902Balance on current account
F. Imbangan modal jangka panjang 16,611 13,525 19,095 10,627 12,598Balance on long–term capital
Modal rasmi jangka panjang/Official long–term capital 6,147 748 4,645 2,137 6,697
Pelaburan korporat/Corporate investment 10,464 12,777 14,450 8,490 5,901
G. Imbangan asas/Basic balance (G=E+F) – 5,036 2,299 2,398 48,021 60,500
H. Modal swasta (bersih)/Private capital (net) 2,529 10,317 – 12,913 – 20,633 – 37,750
I. Ralat dan ketinggalan/Errors and omissions – 1,896 – 6,371 – 377 12,913 – 4,931
J. Imbangan keseluruhan (lebihan + /defisit – )(J=G+H+I) – 4,403 6,245 – 10,892 40,301 17,819Overall balance (surplus + / deficit – )
K. Peruntukan Hak Pengeluaran Khas 0 0 0 0 0Allocations of Special Drawing Rights
L. Sumber IMF 0 0 0 0 0IMF resources
M. Perubahan bersih rizab antarabangsa Bank Negara Malaysia1 4,403 – 6,245 10,892 – 40,301 – 17,819Net change in Central Bank international reserves1
1 Simbol negatif bererti tambahan rizab.
Sumber: Jabatan Perangkaan.
1 A negative symbol indicates a built-up in reserves.
Source: Department of Statistics.
2.3 — BALANCE OF PAYMENTS
Malaysia
RM million
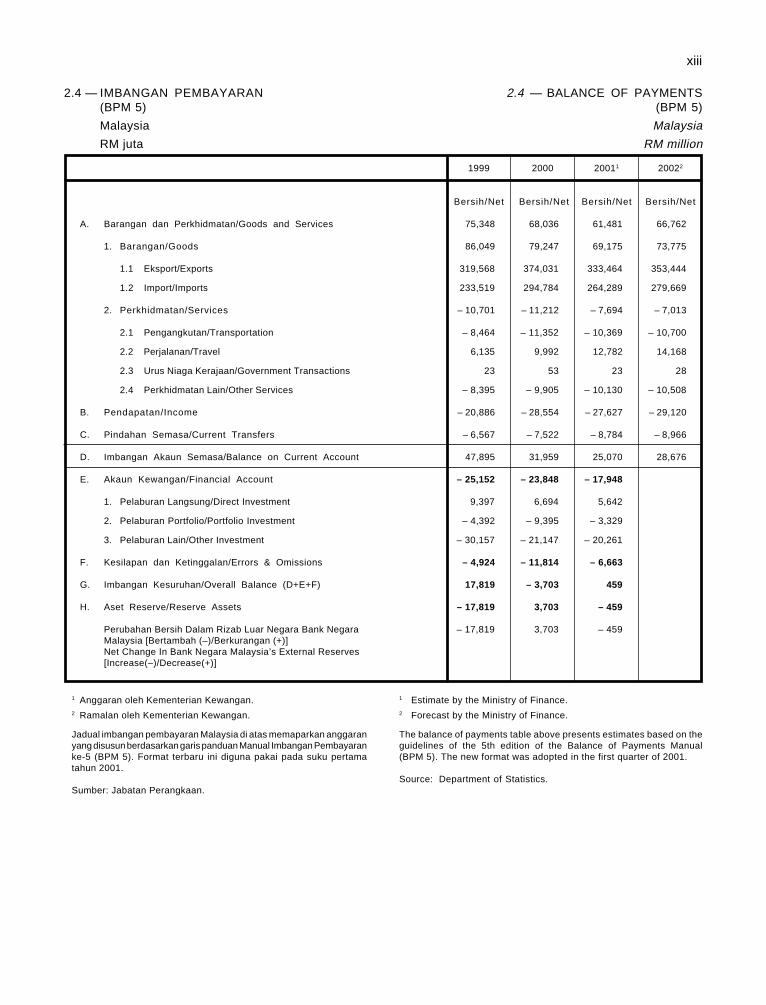
xiii
2.4 — IMBANGAN PEMBAYARAN(BPM 5)
Malaysia
RM juta
1999 2000 20011 20022
Bersih/Net Bersih/Net Bersih/Net Bersih/Net
A. Barangan dan Perkhidmatan/Goods and Services 75,348 68,036 61,481 66,762
1. Barangan/Goods 86,049 79,247 69,175 73,775
1.1 Eksport/Exports 319,568 374,031 333,464 353,444
1.2 Import/Imports 233,519 294,784 264,289 279,669
2. Perkhidmatan/Services – 10,701 – 11,212 – 7,694 – 7,013
2.1 Pengangkutan/Transportation – 8,464 – 11,352 – 10,369 – 10,700
2.2 Perjalanan/Travel 6,135 9,992 12,782 14,168
2.3 Urus Niaga Kerajaan/Government Transactions 23 53 23 28
2.4 Perkhidmatan Lain/Other Services – 8,395 – 9,905 – 10,130 – 10,508
B. Pendapatan/Income – 20,886 – 28,554 – 27,627 – 29,120
C. Pindahan Semasa/Current Transfers – 6,567 – 7,522 – 8,784 – 8,966
D. Imbangan Akaun Semasa/Balance on Current Account 47,895 31,959 25,070 28,676
E. Akaun Kewangan/Financial Account – 25,152 – 23,848 – 17,948
1. Pelaburan Langsung/Direct Investment 9,397 6,694 5,642
2. Pelaburan Portfolio/Portfolio Investment – 4,392 – 9,395 – 3,329
3. Pelaburan Lain/Other Investment – 30,157 – 21,147 – 20,261
F. Kesilapan dan Ketinggalan/Errors & Omissions – 4,924 – 11,814 – 6,663
G. Imbangan Kesuruhan/Overall Balance (D+E+F) 17,819 – 3,703 459
H. Aset Reserve/Reserve Assets – 17,819 3,703 – 459
Perubahan Bersih Dalam Rizab Luar Negara Bank Negara – 17,819 3,703 – 459Malaysia [Bertambah (–)/Berkurangan (+)]Net Change In Bank Negara Malaysia’s External Reserves[Increase(–)/Decrease(+)]
1 Anggaran oleh Kementerian Kewangan.2 Ramalan oleh Kementerian Kewangan.
Jadual imbangan pembayaran Malaysia di atas memaparkan anggaranyang disusun berdasarkan garis panduan Manual Imbangan Pembayaranke-5 (BPM 5). Format terbaru ini diguna pakai pada suku pertamatahun 2001.
Sumber: Jabatan Perangkaan.
1 Estimate by the Ministry of Finance.2 Forecast by the Ministry of Finance.
The balance of payments table above presents estimates based on theguidelines of the 5th edition of the Balance of Payments Manual(BPM 5). The new format was adopted in the first quarter of 2001.
Source: Department of Statistics.
2.4 — BALANCE OF PAYMENTS(BPM 5)
Malaysia
RM million
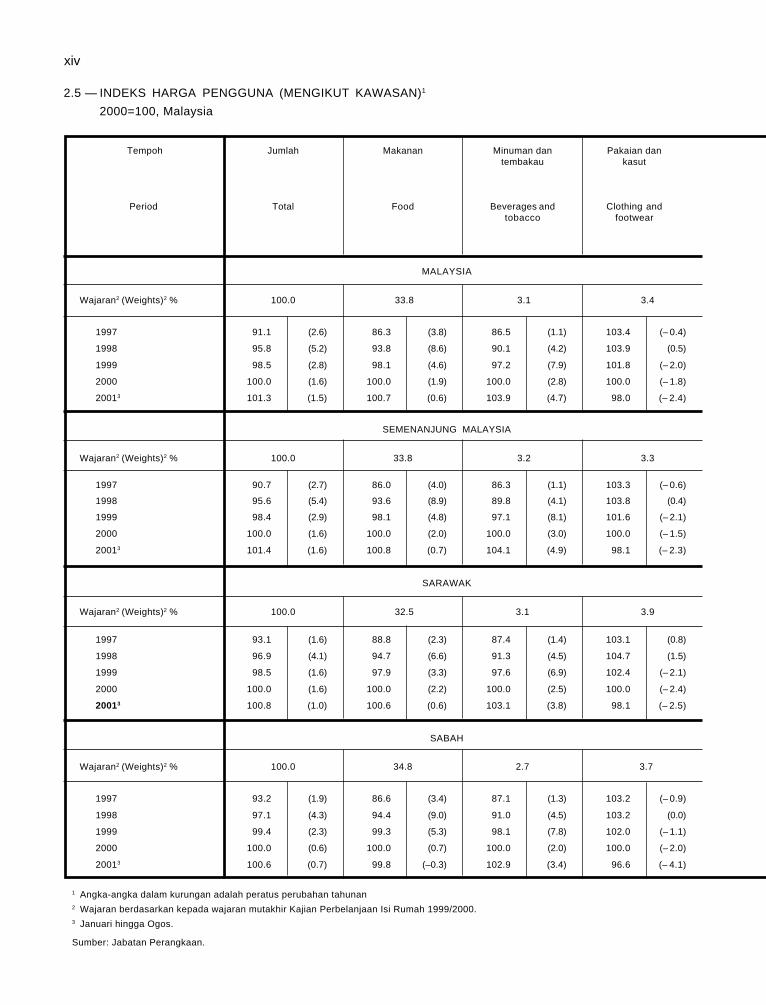
xiv
2.5 — INDEKS HARGA PENGGUNA (MENGIKUT KAWASAN)1
2000=100, Malaysia
Tempoh Jumlah Makanan Minuman dan Pakaian dantembakau kasut
Period Total Food Beverages and Clothing andtobacco footwear
MALAYSIA
Wajaran2 (Weights)2 % 100.0 33.8 3.1 3.4
1997 91.1 (2.6) 86.3 (3.8) 86.5 (1.1) 103.4 (– 0.4)
1998 95.8 (5.2) 93.8 (8.6) 90.1 (4.2) 103.9 (0.5)
1999 98.5 (2.8) 98.1 (4.6) 97.2 (7.9) 101.8 (– 2.0)
2000 100.0 (1.6) 100.0 (1.9) 100.0 (2.8) 100.0 (– 1.8)
20013 101.3 (1.5) 100.7 (0.6) 103.9 (4.7) 98.0 (– 2.4)
SEMENANJUNG MALAYSIA
Wajaran2 (Weights)2 % 100.0 33.8 3.2 3.3
1997 90.7 (2.7) 86.0 (4.0) 86.3 (1.1) 103.3 (– 0.6)
1998 95.6 (5.4) 93.6 (8.9) 89.8 (4.1) 103.8 (0.4)
1999 98.4 (2.9) 98.1 (4.8) 97.1 (8.1) 101.6 (– 2.1)
2000 100.0 (1.6) 100.0 (2.0) 100.0 (3.0) 100.0 (– 1.5)
20013 101.4 (1.6) 100.8 (0.7) 104.1 (4.9) 98.1 (– 2.3)
SARAWAK
Wajaran2 (Weights)2 % 100.0 32.5 3.1 3.9
1997 93.1 (1.6) 88.8 (2.3) 87.4 (1.4) 103.1 (0.8)
1998 96.9 (4.1) 94.7 (6.6) 91.3 (4.5) 104.7 (1.5)
1999 98.5 (1.6) 97.9 (3.3) 97.6 (6.9) 102.4 (– 2.1)
2000 100.0 (1.6) 100.0 (2.2) 100.0 (2.5) 100.0 (– 2.4)
20013 100.8 (1.0) 100.6 (0.6) 103.1 (3.8) 98.1 (– 2.5)
SABAH
Wajaran2 (Weights)2 % 100.0 34.8 2.7 3.7
1997 93.2 (1.9) 86.6 (3.4) 87.1 (1.3) 103.2 (– 0.9)
1998 97.1 (4.3) 94.4 (9.0) 91.0 (4.5) 103.2 (0.0)
1999 99.4 (2.3) 99.3 (5.3) 98.1 (7.8) 102.0 (– 1.1)
2000 100.0 (0.6) 100.0 (0.7) 100.0 (2.0) 100.0 (– 2.0)
20013 100.6 (0.7) 99.8 (–0.3) 102.9 (3.4) 96.6 (– 4.1)
1 Angka-angka dalam kurungan adalah peratus perubahan tahunan2 Wajaran berdasarkan kepada wajaran mutakhir Kajian Perbelanjaan Isi Rumah 1999/2000.3 Januari hingga Ogos.
Sumber: Jabatan Perangkaan.
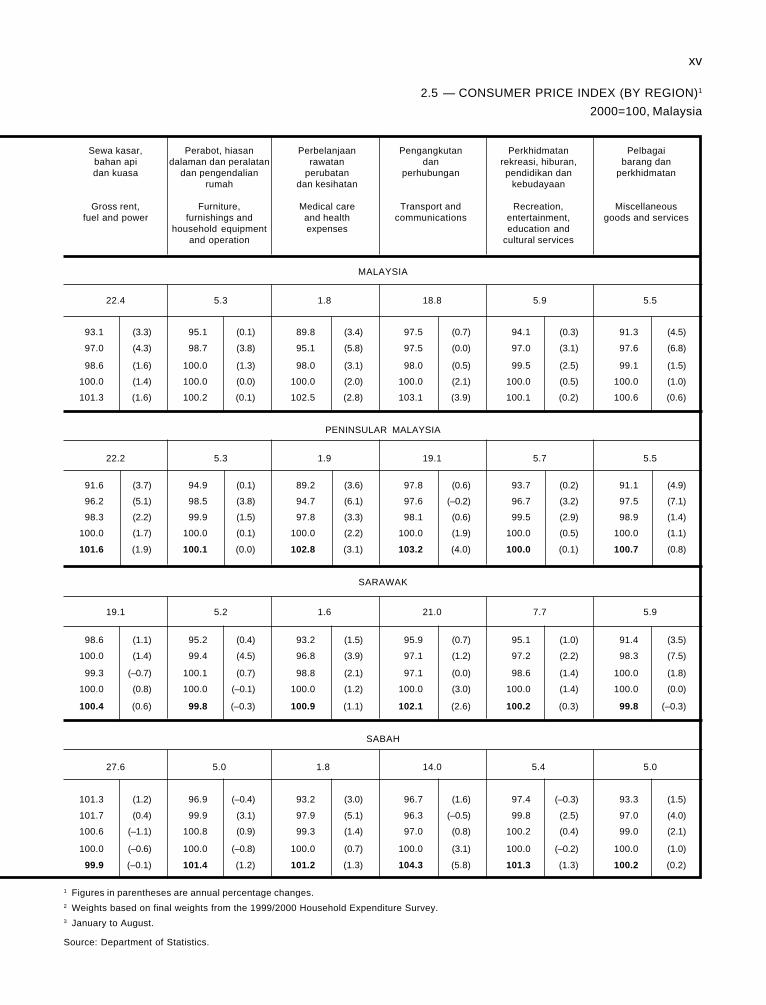
xv
2.5 — CONSUMER PRICE INDEX (BY REGION)1
2000=100, Malaysia
Sewa kasar, Perabot, hiasan Perbelanjaan Pengangkutan Perkhidmatan Pelbagaibahan api dalaman dan peralatan rawatan dan rekreasi, hiburan, barang dandan kuasa dan pengendalian perubatan perhubungan pendidikan dan perkhidmatan
rumah dan kesihatan kebudayaan
Gross rent, Furniture, Medical care Transport and Recreation, Miscellaneousfuel and power furnishings and and health communications entertainment, goods and services
household equipment expenses education andand operation cultural services
MALAYSIA
22.4 5.3 1.8 18.8 5.9 5.5
93.1 (3.3) 95.1 (0.1) 89.8 (3.4) 97.5 (0.7) 94.1 (0.3) 91.3 (4.5)
97.0 (4.3) 98.7 (3.8) 95.1 (5.8) 97.5 (0.0) 97.0 (3.1) 97.6 (6.8)
98.6 (1.6) 100.0 (1.3) 98.0 (3.1) 98.0 (0.5) 99.5 (2.5) 99.1 (1.5)
100.0 (1.4) 100.0 (0.0) 100.0 (2.0) 100.0 (2.1) 100.0 (0.5) 100.0 (1.0)
101.3 (1.6) 100.2 (0.1) 102.5 (2.8) 103.1 (3.9) 100.1 (0.2) 100.6 (0.6)
PENINSULAR MALAYSIA
22.2 5.3 1.9 19.1 5.7 5.5
91.6 (3.7) 94.9 (0.1) 89.2 (3.6) 97.8 (0.6) 93.7 (0.2) 91.1 (4.9)
96.2 (5.1) 98.5 (3.8) 94.7 (6.1) 97.6 (–0.2) 96.7 (3.2) 97.5 (7.1)
98.3 (2.2) 99.9 (1.5) 97.8 (3.3) 98.1 (0.6) 99.5 (2.9) 98.9 (1.4)
100.0 (1.7) 100.0 (0.1) 100.0 (2.2) 100.0 (1.9) 100.0 (0.5) 100.0 (1.1)
101.6 (1.9) 100.1 (0.0) 102.8 (3.1) 103.2 (4.0) 100.0 (0.1) 100.7 (0.8)
SARAWAK
19.1 5.2 1.6 21.0 7.7 5.9
98.6 (1.1) 95.2 (0.4) 93.2 (1.5) 95.9 (0.7) 95.1 (1.0) 91.4 (3.5)
100.0 (1.4) 99.4 (4.5) 96.8 (3.9) 97.1 (1.2) 97.2 (2.2) 98.3 (7.5)
99.3 (–0.7) 100.1 (0.7) 98.8 (2.1) 97.1 (0.0) 98.6 (1.4) 100.0 (1.8)
100.0 (0.8) 100.0 (–0.1) 100.0 (1.2) 100.0 (3.0) 100.0 (1.4) 100.0 (0.0)
100.4 (0.6) 99.8 (–0.3) 100.9 (1.1) 102.1 (2.6) 100.2 (0.3) 99.8 (–0.3)
SABAH
27.6 5.0 1.8 14.0 5.4 5.0
101.3 (1.2) 96.9 (–0.4) 93.2 (3.0) 96.7 (1.6) 97.4 (–0.3) 93.3 (1.5)
101.7 (0.4) 99.9 (3.1) 97.9 (5.1) 96.3 (–0.5) 99.8 (2.5) 97.0 (4.0)
100.6 (–1.1) 100.8 (0.9) 99.3 (1.4) 97.0 (0.8) 100.2 (0.4) 99.0 (2.1)
100.0 (–0.6) 100.0 (–0.8) 100.0 (0.7) 100.0 (3.1) 100.0 (–0.2) 100.0 (1.0)
99.9 (–0.1) 101.4 (1.2) 101.2 (1.3) 104.3 (5.8) 101.3 (1.3) 100.2 (0.2)
1 Figures in parentheses are annual percentage changes.2 Weights based on final weights from the 1999/2000 Household Expenditure Survey.3 January to August.
Source: Department of Statistics.
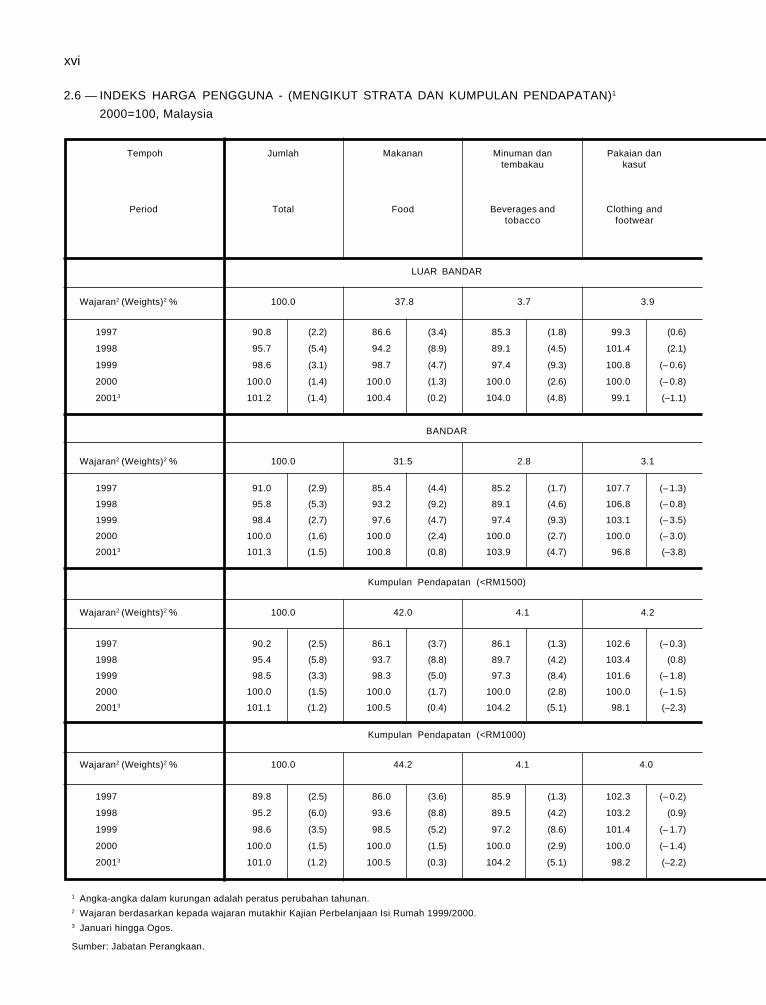
xvi
2.6 — INDEKS HARGA PENGGUNA - (MENGIKUT STRATA DAN KUMPULAN PENDAPATAN)1
2000=100, Malaysia
Tempoh Jumlah Makanan Minuman dan Pakaian dantembakau kasut
Period Total Food Beverages and Clothing andtobacco footwear
LUAR BANDAR
Wajaran2 (Weights)2 % 100.0 37.8 3.7 3.9
1997 90.8 (2.2) 86.6 (3.4) 85.3 (1.8) 99.3 (0.6)
1998 95.7 (5.4) 94.2 (8.9) 89.1 (4.5) 101.4 (2.1)
1999 98.6 (3.1) 98.7 (4.7) 97.4 (9.3) 100.8 (– 0.6)
2000 100.0 (1.4) 100.0 (1.3) 100.0 (2.6) 100.0 (– 0.8)
20013 101.2 (1.4) 100.4 (0.2) 104.0 (4.8) 99.1 (–1.1)
BANDAR
Wajaran2 (Weights)2 % 100.0 31.5 2.8 3.1
1997 91.0 (2.9) 85.4 (4.4) 85.2 (1.7) 107.7 (– 1.3)
1998 95.8 (5.3) 93.2 (9.2) 89.1 (4.6) 106.8 (– 0.8)
1999 98.4 (2.7) 97.6 (4.7) 97.4 (9.3) 103.1 (– 3.5)
2000 100.0 (1.6) 100.0 (2.4) 100.0 (2.7) 100.0 (– 3.0)
20013 101.3 (1.5) 100.8 (0.8) 103.9 (4.7) 96.8 (–3.8)
Kumpulan Pendapatan (<RM1500)
Wajaran2 (Weights)2 % 100.0 42.0 4.1 4.2
1997 90.2 (2.5) 86.1 (3.7) 86.1 (1.3) 102.6 (– 0.3)
1998 95.4 (5.8) 93.7 (8.8) 89.7 (4.2) 103.4 (0.8)
1999 98.5 (3.3) 98.3 (5.0) 97.3 (8.4) 101.6 (– 1.8)
2000 100.0 (1.5) 100.0 (1.7) 100.0 (2.8) 100.0 (– 1.5)
20013 101.1 (1.2) 100.5 (0.4) 104.2 (5.1) 98.1 (–2.3)
Kumpulan Pendapatan (<RM1000)
Wajaran2 (Weights)2 % 100.0 44.2 4.1 4.0
1997 89.8 (2.5) 86.0 (3.6) 85.9 (1.3) 102.3 (– 0.2)
1998 95.2 (6.0) 93.6 (8.8) 89.5 (4.2) 103.2 (0.9)
1999 98.6 (3.5) 98.5 (5.2) 97.2 (8.6) 101.4 (– 1.7)
2000 100.0 (1.5) 100.0 (1.5) 100.0 (2.9) 100.0 (– 1.4)
20013 101.0 (1.2) 100.5 (0.3) 104.2 (5.1) 98.2 (–2.2)
1 Angka-angka dalam kurungan adalah peratus perubahan tahunan.2 Wajaran berdasarkan kepada wajaran mutakhir Kajian Perbelanjaan Isi Rumah 1999/2000.3 Januari hingga Ogos.
Sumber: Jabatan Perangkaan.
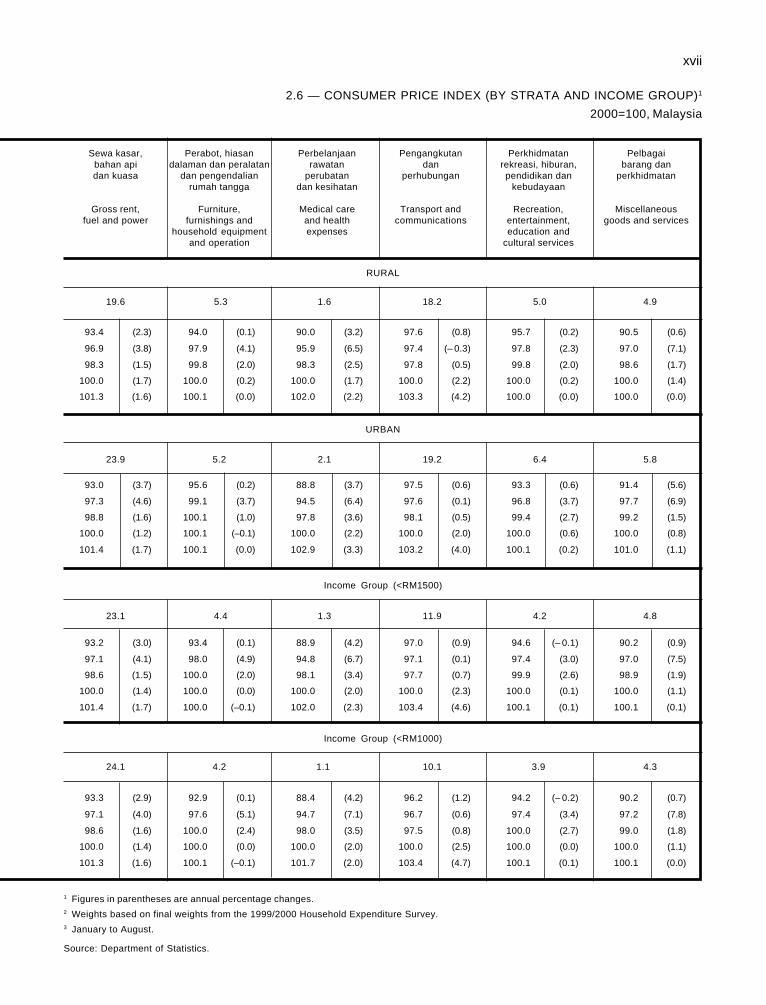
xvii
2.6 — CONSUMER PRICE INDEX (BY STRATA AND INCOME GROUP)1
2000=100, Malaysia
Sewa kasar, Perabot, hiasan Perbelanjaan Pengangkutan Perkhidmatan Pelbagaibahan api dalaman dan peralatan rawatan dan rekreasi, hiburan, barang dandan kuasa dan pengendalian perubatan perhubungan pendidikan dan perkhidmatan
rumah tangga dan kesihatan kebudayaan
Gross rent, Furniture, Medical care Transport and Recreation, Miscellaneousfuel and power furnishings and and health communications entertainment, goods and services
household equipment expenses education andand operation cultural services
RURAL
19.6 5.3 1.6 18.2 5.0 4.9
93.4 (2.3) 94.0 (0.1) 90.0 (3.2) 97.6 (0.8) 95.7 (0.2) 90.5 (0.6)
96.9 (3.8) 97.9 (4.1) 95.9 (6.5) 97.4 (– 0.3) 97.8 (2.3) 97.0 (7.1)
98.3 (1.5) 99.8 (2.0) 98.3 (2.5) 97.8 (0.5) 99.8 (2.0) 98.6 (1.7)
100.0 (1.7) 100.0 (0.2) 100.0 (1.7) 100.0 (2.2) 100.0 (0.2) 100.0 (1.4)
101.3 (1.6) 100.1 (0.0) 102.0 (2.2) 103.3 (4.2) 100.0 (0.0) 100.0 (0.0)
URBAN
23.9 5.2 2.1 19.2 6.4 5.8
93.0 (3.7) 95.6 (0.2) 88.8 (3.7) 97.5 (0.6) 93.3 (0.6) 91.4 (5.6)
97.3 (4.6) 99.1 (3.7) 94.5 (6.4) 97.6 (0.1) 96.8 (3.7) 97.7 (6.9)
98.8 (1.6) 100.1 (1.0) 97.8 (3.6) 98.1 (0.5) 99.4 (2.7) 99.2 (1.5)
100.0 (1.2) 100.1 (–0.1) 100.0 (2.2) 100.0 (2.0) 100.0 (0.6) 100.0 (0.8)
101.4 (1.7) 100.1 (0.0) 102.9 (3.3) 103.2 (4.0) 100.1 (0.2) 101.0 (1.1)
Income Group (<RM1500)
23.1 4.4 1.3 11.9 4.2 4.8
93.2 (3.0) 93.4 (0.1) 88.9 (4.2) 97.0 (0.9) 94.6 (– 0.1) 90.2 (0.9)
97.1 (4.1) 98.0 (4.9) 94.8 (6.7) 97.1 (0.1) 97.4 (3.0) 97.0 (7.5)
98.6 (1.5) 100.0 (2.0) 98.1 (3.4) 97.7 (0.7) 99.9 (2.6) 98.9 (1.9)
100.0 (1.4) 100.0 (0.0) 100.0 (2.0) 100.0 (2.3) 100.0 (0.1) 100.0 (1.1)
101.4 (1.7) 100.0 (–0.1) 102.0 (2.3) 103.4 (4.6) 100.1 (0.1) 100.1 (0.1)
Income Group (<RM1000)
24.1 4.2 1.1 10.1 3.9 4.3
93.3 (2.9) 92.9 (0.1) 88.4 (4.2) 96.2 (1.2) 94.2 (– 0.2) 90.2 (0.7)
97.1 (4.0) 97.6 (5.1) 94.7 (7.1) 96.7 (0.6) 97.4 (3.4) 97.2 (7.8)
98.6 (1.6) 100.0 (2.4) 98.0 (3.5) 97.5 (0.8) 100.0 (2.7) 99.0 (1.8)
100.0 (1.4) 100.0 (0.0) 100.0 (2.0) 100.0 (2.5) 100.0 (0.0) 100.0 (1.1)
101.3 (1.6) 100.1 (–0.1) 101.7 (2.0) 103.4 (4.7) 100.1 (0.1) 100.1 (0.0)
1 Figures in parentheses are annual percentage changes.2 Weights based on final weights from the 1999/2000 Household Expenditure Survey.3 January to August.
Source: Department of Statistics.
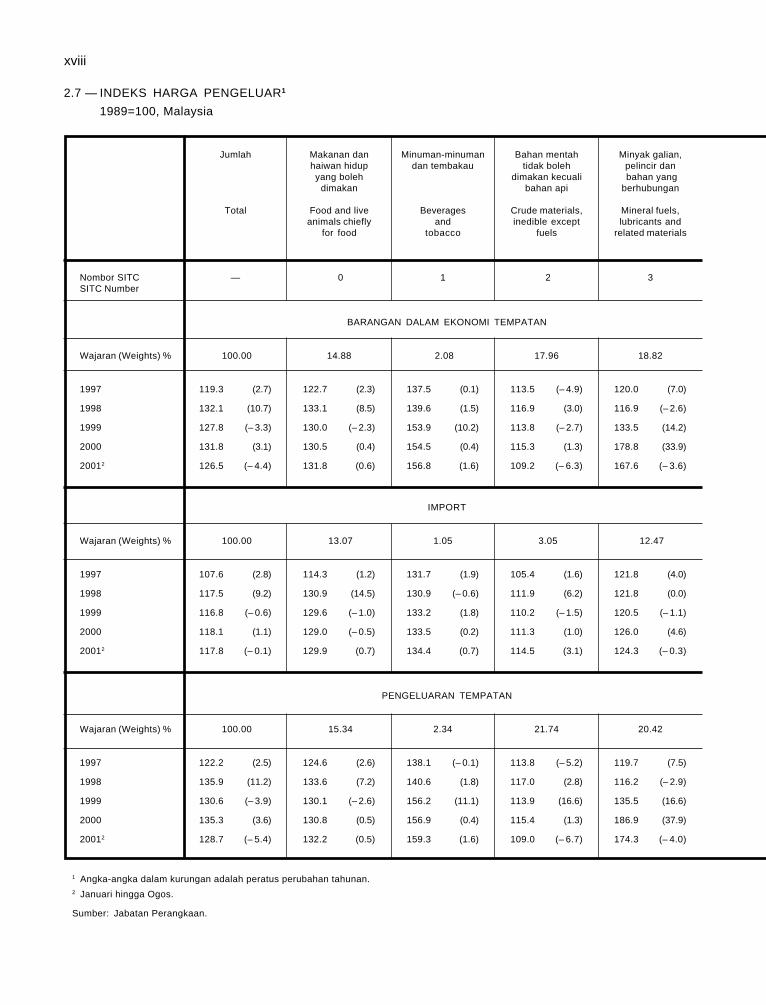
xviii
1 Angka-angka dalam kurungan adalah peratus perubahan tahunan.2 Januari hingga Ogos.
Sumber: Jabatan Perangkaan.
2.7 — INDEKS HARGA PENGELUAR1
1989=100, Malaysia
Jumlah Makanan dan Minuman-minuman Bahan mentah Minyak galian,haiwan hidup dan tembakau tidak boleh pelincir danyang boleh dimakan kecuali bahan yang
dimakan bahan api berhubungan
Total Food and live Beverages Crude materials, Mineral fuels,animals chiefly and inedible except lubricants and
for food tobacco fuels related materials
Nombor SITC — 0 1 2 3SITC Number
BARANGAN DALAM EKONOMI TEMPATAN
Wajaran (Weights) % 100.00 14.88 2.08 17.96 18.82
1997 119.3 (2.7) 122.7 (2.3) 137.5 (0.1) 113.5 (– 4.9) 120.0 (7.0)
1998 132.1 (10.7) 133.1 (8.5) 139.6 (1.5) 116.9 (3.0) 116.9 (– 2.6)
1999 127.8 (– 3.3) 130.0 (– 2.3) 153.9 (10.2) 113.8 (– 2.7) 133.5 (14.2)
2000 131.8 (3.1) 130.5 (0.4) 154.5 (0.4) 115.3 (1.3) 178.8 (33.9)
20012 126.5 (– 4.4) 131.8 (0.6) 156.8 (1.6) 109.2 (– 6.3) 167.6 (– 3.6)
IMPORT
Wajaran (Weights) % 100.00 13.07 1.05 3.05 12.47
1997 107.6 (2.8) 114.3 (1.2) 131.7 (1.9) 105.4 (1.6) 121.8 (4.0)
1998 117.5 (9.2) 130.9 (14.5) 130.9 (– 0.6) 111.9 (6.2) 121.8 (0.0)
1999 116.8 (– 0.6) 129.6 (– 1.0) 133.2 (1.8) 110.2 (– 1.5) 120.5 (– 1.1)
2000 118.1 (1.1) 129.0 (– 0.5) 133.5 (0.2) 111.3 (1.0) 126.0 (4.6)
20012 117.8 (– 0.1) 129.9 (0.7) 134.4 (0.7) 114.5 (3.1) 124.3 (– 0.3)
PENGELUARAN TEMPATAN
Wajaran (Weights) % 100.00 15.34 2.34 21.74 20.42
1997 122.2 (2.5) 124.6 (2.6) 138.1 (– 0.1) 113.8 (– 5.2) 119.7 (7.5)
1998 135.9 (11.2) 133.6 (7.2) 140.6 (1.8) 117.0 (2.8) 116.2 (– 2.9)
1999 130.6 (– 3.9) 130.1 (– 2.6) 156.2 (11.1) 113.9 (16.6) 135.5 (16.6)
2000 135.3 (3.6) 130.8 (0.5) 156.9 (0.4) 115.4 (1.3) 186.9 (37.9)
20012 128.7 (– 5.4) 132.2 (0.5) 159.3 (1.6) 109.0 (– 6.7) 174.3 (– 4.0)
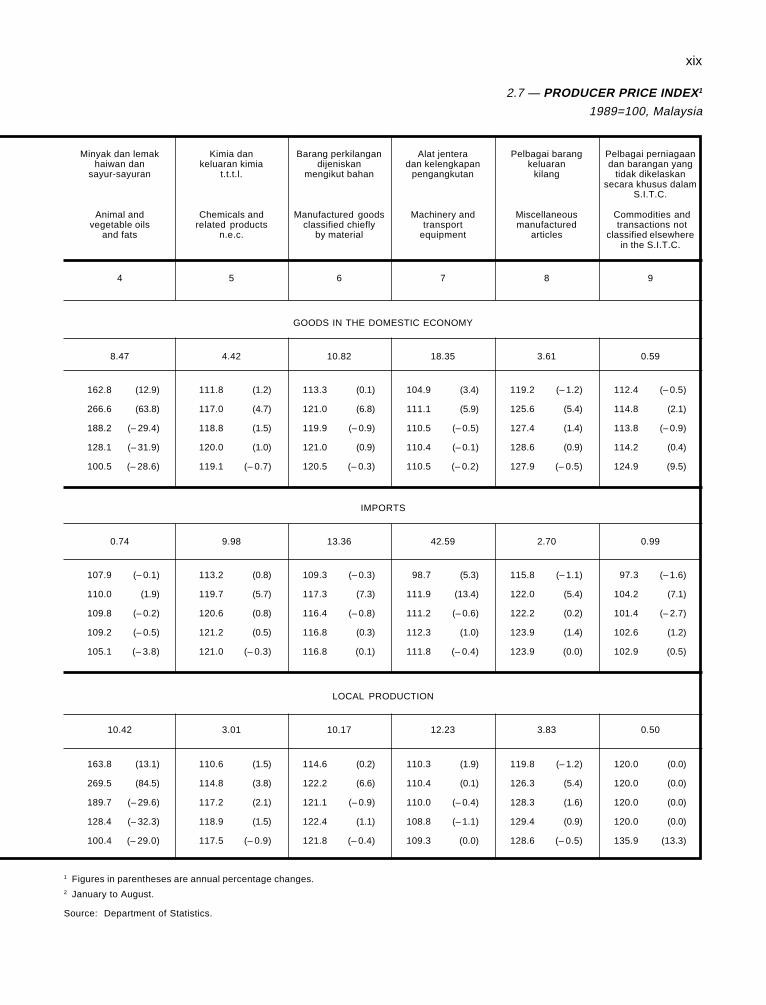
xix
2.7 — PRODUCER PRICE INDEX1
1989=100, Malaysia
Minyak dan lemak Kimia dan Barang perkilangan Alat jentera Pelbagai barang Pelbagai perniagaanhaiwan dan keluaran kimia dijeniskan dan kelengkapan keluaran dan barangan yang
sayur-sayuran t.t.t.l. mengikut bahan pengangkutan kilang tidak dikelaskansecara khusus dalam
S.I.T.C.
Animal and Chemicals and Manufactured goods Machinery and Miscellaneous Commodities andvegetable oils related products classified chiefly transport manufactured transactions not
and fats n.e.c. by material equipment articles classified elsewherein the S.I.T.C.
4 5 6 7 8 9
GOODS IN THE DOMESTIC ECONOMY
8.47 4.42 10.82 18.35 3.61 0.59
162.8 (12.9) 111.8 (1.2) 113.3 (0.1) 104.9 (3.4) 119.2 (– 1.2) 112.4 (– 0.5)
266.6 (63.8) 117.0 (4.7) 121.0 (6.8) 111.1 (5.9) 125.6 (5.4) 114.8 (2.1)
188.2 (– 29.4) 118.8 (1.5) 119.9 (– 0.9) 110.5 (– 0.5) 127.4 (1.4) 113.8 (– 0.9)
128.1 (– 31.9) 120.0 (1.0) 121.0 (0.9) 110.4 (– 0.1) 128.6 (0.9) 114.2 (0.4)
100.5 (– 28.6) 119.1 (– 0.7) 120.5 (– 0.3) 110.5 (– 0.2) 127.9 (– 0.5) 124.9 (9.5)
IMPORTS
0.74 9.98 13.36 42.59 2.70 0.99
107.9 (– 0.1) 113.2 (0.8) 109.3 (– 0.3) 98.7 (5.3) 115.8 (– 1.1) 97.3 (– 1.6)
110.0 (1.9) 119.7 (5.7) 117.3 (7.3) 111.9 (13.4) 122.0 (5.4) 104.2 (7.1)
109.8 (– 0.2) 120.6 (0.8) 116.4 (– 0.8) 111.2 (– 0.6) 122.2 (0.2) 101.4 (– 2.7)
109.2 (– 0.5) 121.2 (0.5) 116.8 (0.3) 112.3 (1.0) 123.9 (1.4) 102.6 (1.2)
105.1 (– 3.8) 121.0 (– 0.3) 116.8 (0.1) 111.8 (– 0.4) 123.9 (0.0) 102.9 (0.5)
LOCAL PRODUCTION
10.42 3.01 10.17 12.23 3.83 0.50
163.8 (13.1) 110.6 (1.5) 114.6 (0.2) 110.3 (1.9) 119.8 (– 1.2) 120.0 (0.0)
269.5 (84.5) 114.8 (3.8) 122.2 (6.6) 110.4 (0.1) 126.3 (5.4) 120.0 (0.0)
189.7 (– 29.6) 117.2 (2.1) 121.1 (– 0.9) 110.0 (– 0.4) 128.3 (1.6) 120.0 (0.0)
128.4 (– 32.3) 118.9 (1.5) 122.4 (1.1) 108.8 (– 1.1) 129.4 (0.9) 120.0 (0.0)
100.4 (– 29.0) 117.5 (– 0.9) 121.8 (– 0.4) 109.3 (0.0) 128.6 (– 0.5) 135.9 (13.3)
1 Figures in parentheses are annual percentage changes.2 January to August.
Source: Department of Statistics.
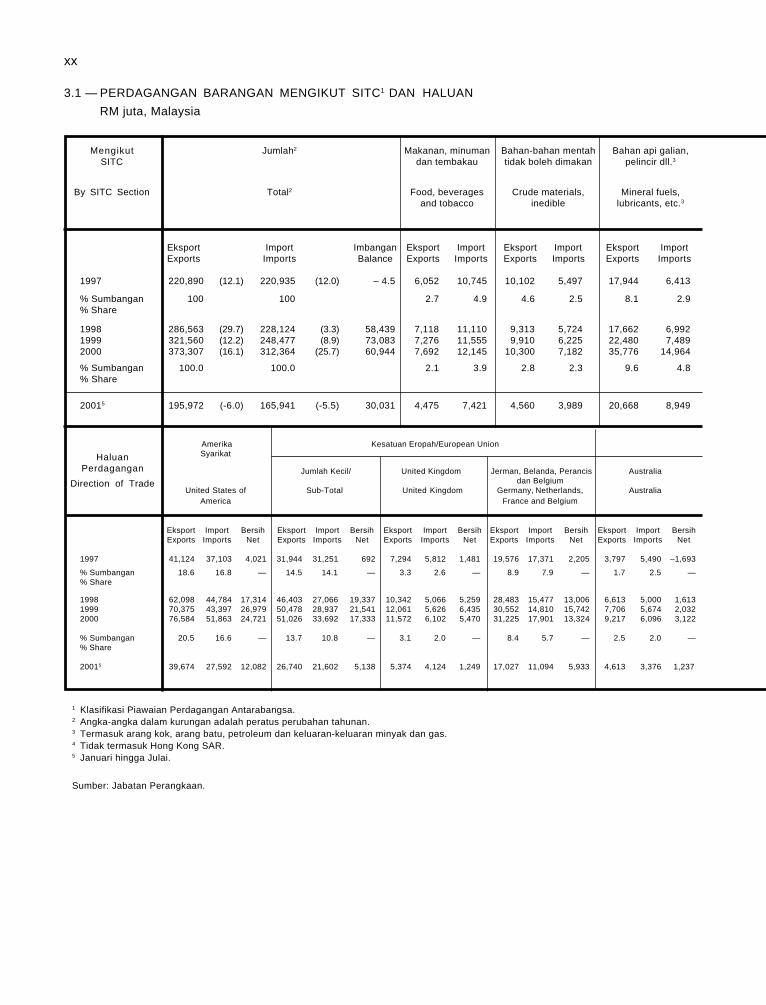
xx
3.1 — PERDAGANGAN BARANGAN MENGIKUT SITC1 DAN HALUAN
RM juta, Malaysia
Mengikut Jumlah2 Makanan, minuman Bahan-bahan mentah Bahan api galian,SITC dan tembakau tidak boleh dimakan pelincir dll.3
By SITC Section Total2 Food, beverages Crude materials, Mineral fuels,and tobacco inedible lubricants, etc.3
Eksport Import Imbangan Eksport Import Eksport Import Eksport ImportExports Imports Balance Exports Imports Exports Imports Exports Imports
1997 220,890 (12.1) 220,935 (12.0) – 4.5 6,052 10,745 10,102 5,497 17,944 6,413
% Sumbangan 100 100 2.7 4.9 4.6 2.5 8.1 2.9% Share
1998 286,563 (29.7) 228,124 (3.3) 58,439 7,118 11,110 9,313 5,724 17,662 6,9921999 321,560 (12.2) 248,477 (8.9) 73,083 7,276 11,555 9,910 6,225 22,480 7,4892000 373,307 (16.1) 312,364 (25.7) 60,944 7,692 12,145 10,300 7,182 35,776 14,964
% Sumbangan 100.0 100.0 2.1 3.9 2.8 2.3 9.6 4.8% Share
20015 195,972 (-6.0) 165,941 (-5.5) 30,031 4,475 7,421 4,560 3,989 20,668 8,949
Amerika Kesatuan Eropah/European UnionSyarikat
Jumlah Kecil/ United Kingdom Jerman, Belanda, Perancis Australiadan Belgium
United States of Sub-Total United Kingdom Germany, Netherlands, AustraliaAmerica France and Belgium
Eksport Import Bersih Eksport Import Bersih Eksport Import Bersih Eksport Import Bersih Eksport Import BersihExports Imports Net Exports Imports Net Exports Imports Net Exports Imports Net Exports Imports Net
1997 41,124 37,103 4,021 31,944 31,251 692 7,294 5,812 1,481 19,576 17,371 2,205 3,797 5,490 –1,693
% Sumbangan 18.6 16.8 — 14.5 14.1 — 3.3 2.6 — 8.9 7.9 — 1.7 2.5 —% Share
1998 62,098 44,784 17,314 46,403 27,066 19,337 10,342 5,066 5,259 28,483 15,477 13,006 6,613 5,000 1,6131999 70,375 43,397 26,979 50,478 28,937 21,541 12,061 5,626 6,435 30,552 14,810 15,742 7,706 5,674 2,0322000 76,584 51,863 24,721 51,026 33,692 17,333 11,572 6,102 5,470 31,225 17,901 13,324 9,217 6,096 3,122
% Sumbangan 20.5 16.6 — 13.7 10.8 — 3.1 2.0 — 8.4 5.7 — 2.5 2.0 —% Share
20015 39,674 27,592 12,082 26,740 21,602 5,138 5,374 4,124 1,249 17,027 11,094 5,933 4,613 3,376 1,237
1 Klasifikasi Piawaian Perdagangan Antarabangsa.2 Angka-angka dalam kurungan adalah peratus perubahan tahunan.3 Termasuk arang kok, arang batu, petroleum dan keluaran-keluaran minyak dan gas.4 Tidak termasuk Hong Kong SAR.5 Januari hingga Julai.
Sumber: Jabatan Perangkaan.
HaluanPerdagangan
Direction of Trade
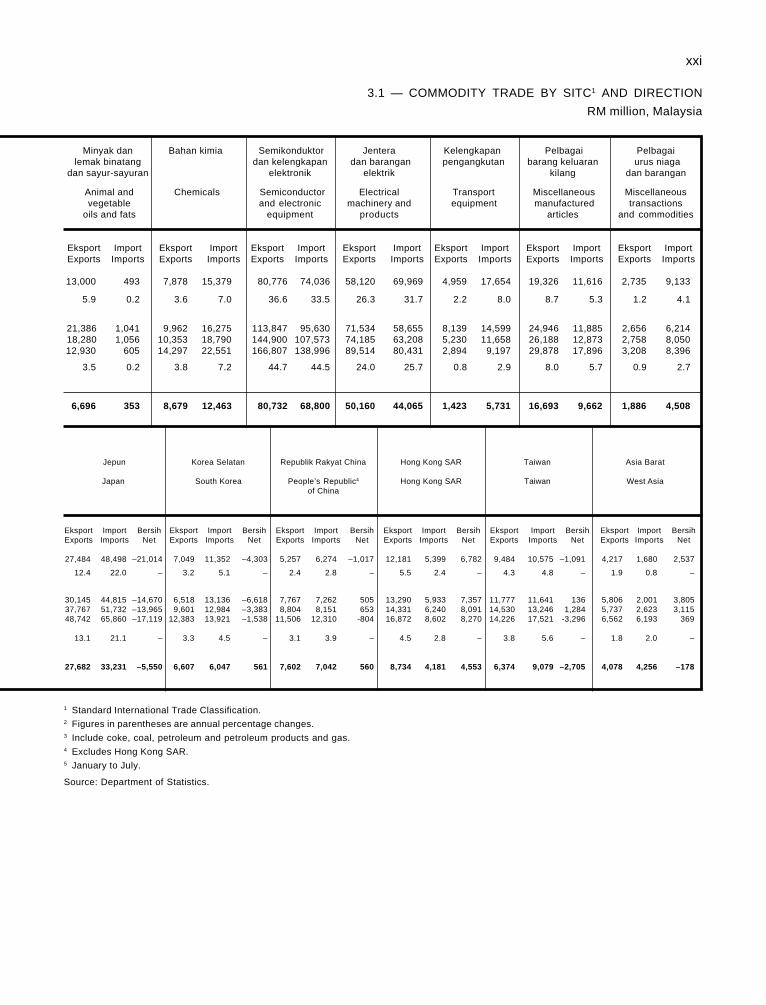
xxi
Jepun Korea Selatan Republik Rakyat China Hong Kong SAR Taiwan Asia Barat
Japan South Korea People’s Republic4 Hong Kong SAR Taiwan West Asiaof China
Eksport Import Bersih Eksport Import Bersih Eksport Import Bersih Eksport Import Bersih Eksport Import Bersih Eksport Import BersihExports Imports Net Exports Imports Net Exports Imports Net Exports Imports Net Exports Imports Net Exports Imports Net
27,484 48,498 –21,014 7,049 11,352 –4,303 5,257 6,274 –1,017 12,181 5,399 6,782 9,484 10,575 –1,091 4,217 1,680 2,537
12.4 22.0 – 3.2 5.1 – 2.4 2.8 – 5.5 2.4 – 4.3 4.8 – 1.9 0.8 –
30,145 44,815 –14,670 6,518 13,136 –6,618 7,767 7,262 505 13,290 5,933 7,357 11,777 11,641 136 5,806 2,001 3,80537,767 51,732 –13,965 9,601 12,984 –3,383 8,804 8,151 653 14,331 6,240 8,091 14,530 13,246 1,284 5,737 2,623 3,11548,742 65,860 –17,119 12,383 13,921 –1,538 11,506 12,310 -804 16,872 8,602 8,270 14,226 17,521 -3,296 6,562 6,193 369
13.1 21.1 – 3.3 4.5 – 3.1 3.9 – 4.5 2.8 – 3.8 5.6 – 1.8 2.0 –
27,682 33,231 –5,550 6,607 6,047 561 7,602 7,042 560 8,734 4,181 4,553 6,374 9,079 –2,705 4,078 4,256 –178
3.1 — COMMODITY TRADE BY SITC1 AND DIRECTION
RM million, Malaysia
Minyak dan Bahan kimia Semikonduktor Jentera Kelengkapan Pelbagai Pelbagailemak binatang dan kelengkapan dan barangan pengangkutan barang keluaran urus niaga
dan sayur-sayuran elektronik elektrik kilang dan barangan
Animal and Chemicals Semiconductor Electrical Transport Miscellaneous Miscellaneous vegetable and electronic machinery and equipment manufactured transactions
oils and fats equipment products articles and commodities
Eksport Import Eksport Import Eksport Import Eksport Import Eksport Import Eksport Import Eksport ImportExports Imports Exports Imports Exports Imports Exports Imports Exports Imports Exports Imports Exports Imports
13,000 493 7,878 15,379 80,776 74,036 58,120 69,969 4,959 17,654 19,326 11,616 2,735 9,133
5.9 0.2 3.6 7.0 36.6 33.5 26.3 31.7 2.2 8.0 8.7 5.3 1.2 4.1
21,386 1,041 9,962 16,275 113,847 95,630 71,534 58,655 8,139 14,599 24,946 11,885 2,656 6,214 18,280 1,056 10,353 18,790 144,900 107,573 74,185 63,208 5,230 11,658 26,188 12,873 2,758 8,05012,930 605 14,297 22,551 166,807 138,996 89,514 80,431 2,894 9,197 29,878 17,896 3,208 8,396
3.5 0.2 3.8 7.2 44.7 44.5 24.0 25.7 0.8 2.9 8.0 5.7 0.9 2.7
6,696 353 8,679 12,463 80,732 68,800 50,160 44,065 1,423 5,731 16,693 9,662 1,886 4,508
1 Standard International Trade Classification.2 Figures in parentheses are annual percentage changes.3 Include coke, coal, petroleum and petroleum products and gas.4 Excludes Hong Kong SAR.5 January to July.
Source: Department of Statistics.
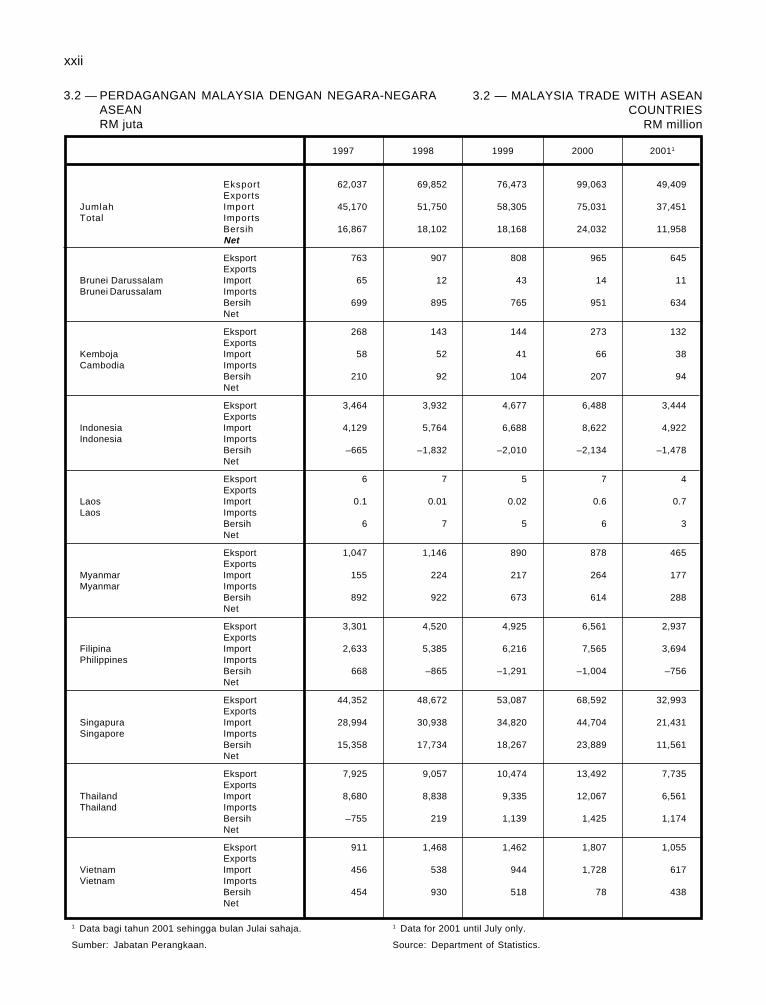
xxii
1997 1998 1999 2000 20011
Eksport 62,037 69,852 76,473 99,063 49,409Exports
Jumlah Import 45,170 51,750 58,305 75,031 37,451Total Imports
Bersih 16,867 18,102 18,168 24,032 11,958Net
Eksport 763 907 808 965 645Exports
Brunei Darussalam Import 65 12 43 14 11Brunei Darussalam Imports
Bersih 699 895 765 951 634Net
Eksport 268 143 144 273 132Exports
Kemboja Import 58 52 41 66 38Cambodia Imports
Bersih 210 92 104 207 94Net
Eksport 3,464 3,932 4,677 6,488 3,444Exports
Indonesia Import 4,129 5,764 6,688 8,622 4,922Indonesia Imports
Bersih –665 –1,832 –2,010 –2,134 –1,478Net
Eksport 6 7 5 7 4Exports
Laos Import 0.1 0.01 0.02 0.6 0.7Laos Imports
Bersih 6 7 5 6 3Net
Eksport 1,047 1,146 890 878 465Exports
Myanmar Import 155 224 217 264 177Myanmar Imports
Bersih 892 922 673 614 288Net
Eksport 3,301 4,520 4,925 6,561 2,937Exports
Filipina Import 2,633 5,385 6,216 7,565 3,694Philippines Imports
Bersih 668 –865 –1,291 –1,004 –756Net
Eksport 44,352 48,672 53,087 68,592 32,993Exports
Singapura Import 28,994 30,938 34,820 44,704 21,431Singapore Imports
Bersih 15,358 17,734 18,267 23,889 11,561Net
Eksport 7,925 9,057 10,474 13,492 7,735Exports
Thailand Import 8,680 8,838 9,335 12,067 6,561Thailand Imports
Bersih –755 219 1,139 1,425 1,174Net
Eksport 911 1,468 1,462 1,807 1,055Exports
Vietnam Import 456 538 944 1,728 617Vietnam Imports
Bersih 454 930 518 78 438Net
3.2 — MALAYSIA TRADE WITH ASEANCOUNTRIES
RM million
1 Data bagi tahun 2001 sehingga bulan Julai sahaja.
Sumber: Jabatan Perangkaan.
3.2 — PERDAGANGAN MALAYSIA DENGAN NEGARA-NEGARAASEANRM juta
1 Data for 2001 until July only.
Source: Department of Statistics.
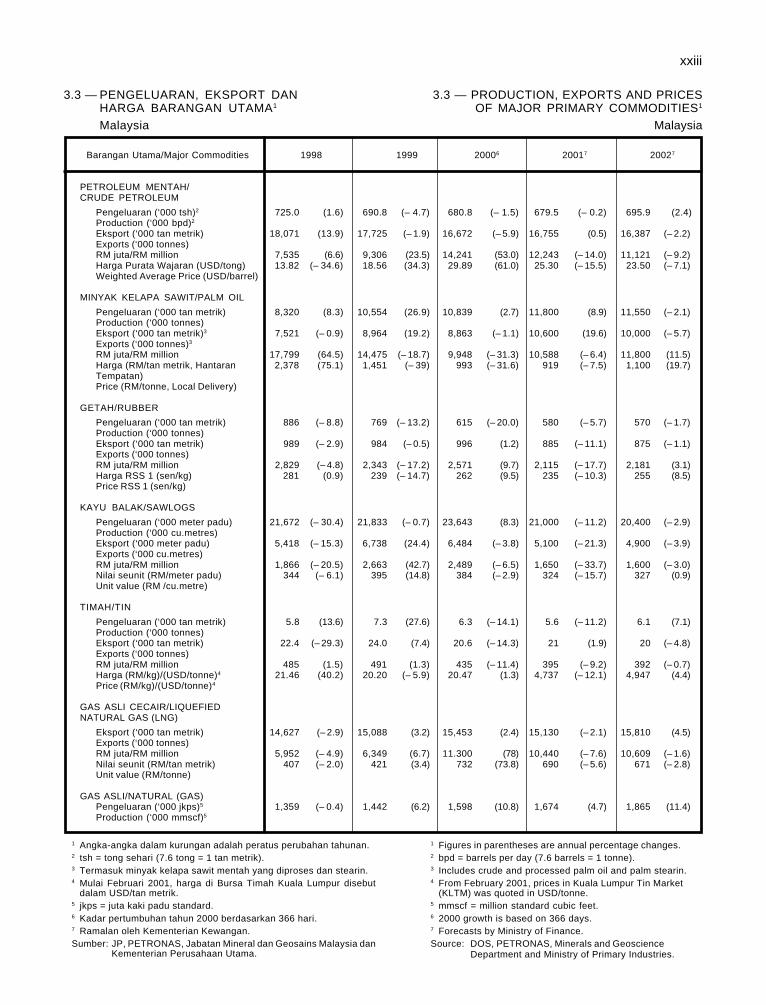
xxiii
3.3 — PENGELUARAN, EKSPORT DANHARGA BARANGAN UTAMA1
Malaysia
3.3 — PRODUCTION, EXPORTS AND PRICESOF MAJOR PRIMARY COMMODITIES1
Malaysia
Barangan Utama/Major Commodities 1998 1999 20006 20017 20027
PETROLEUM MENTAH/CRUDE PETROLEUM
Pengeluaran (‘000 tsh)2 725.0 (1.6) 690.8 (– 4.7) 680.8 (– 1.5) 679.5 (– 0.2) 695.9 (2.4)Production (‘000 bpd)2
Eksport (‘000 tan metrik) 18,071 (13.9) 17,725 (– 1.9) 16,672 (– 5.9) 16,755 (0.5) 16,387 (– 2.2)Exports (‘000 tonnes)RM juta/RM million 7,535 (6.6) 9,306 (23.5) 14,241 (53.0) 12,243 (– 14.0) 11,121 (– 9.2)Harga Purata Wajaran (USD/tong) 13.82 (– 34.6) 18.56 (34.3) 29.89 (61.0) 25.30 (– 15.5) 23.50 (– 7.1)Weighted Average Price (USD/barrel)
MINYAK KELAPA SAWIT/PALM OIL
Pengeluaran (‘000 tan metrik) 8,320 (8.3) 10,554 (26.9) 10,839 (2.7) 11,800 (8.9) 11,550 (– 2.1)Production (‘000 tonnes)Eksport (‘000 tan metrik)3 7,521 (– 0.9) 8,964 (19.2) 8,863 (– 1.1) 10,600 (19.6) 10,000 (– 5.7)Exports (‘000 tonnes)3
RM juta/RM million 17,799 (64.5) 14,475 (– 18.7) 9,948 (– 31.3) 10,588 (– 6.4) 11,800 (11.5)Harga (RM/tan metrik, Hantaran 2,378 (75.1) 1,451 (– 39) 993 (– 31.6) 919 (– 7.5) 1,100 (19.7)Tempatan)Price (RM/tonne, Local Delivery)
GETAH/RUBBER
Pengeluaran (‘000 tan metrik) 886 (– 8.8) 769 (– 13.2) 615 (– 20.0) 580 (– 5.7) 570 (– 1.7)Production (‘000 tonnes)Eksport (‘000 tan metrik) 989 (– 2.9) 984 (– 0.5) 996 (1.2) 885 (– 11.1) 875 (– 1.1)Exports (‘000 tonnes)RM juta/RM million 2,829 (– 4.8) 2,343 (– 17.2) 2,571 (9.7) 2,115 (– 17.7) 2,181 (3.1)Harga RSS 1 (sen/kg) 281 (0.9) 239 (– 14.7) 262 (9.5) 235 (– 10.3) 255 (8.5)Price RSS 1 (sen/kg)
KAYU BALAK/SAWLOGS
Pengeluaran (‘000 meter padu) 21,672 (– 30.4) 21,833 (– 0.7) 23,643 (8.3) 21,000 (– 11.2) 20,400 (– 2.9)Production (‘000 cu.metres)Eksport (‘000 meter padu) 5,418 (– 15.3) 6,738 (24.4) 6,484 (– 3.8) 5,100 (– 21.3) 4,900 (– 3.9)Exports (‘000 cu.metres)RM juta/RM million 1,866 (– 20.5) 2,663 (42.7) 2,489 (– 6.5) 1,650 (– 33.7) 1,600 (– 3.0)Nilai seunit (RM/meter padu) 344 (– 6.1) 395 (14.8) 384 (– 2.9) 324 (– 15.7) 327 (0.9)Unit value (RM /cu.metre)
TIMAH/TIN
Pengeluaran (‘000 tan metrik) 5.8 (13.6) 7.3 (27.6) 6.3 (– 14.1) 5.6 (– 11.2) 6.1 (7.1)Production (‘000 tonnes)Eksport (‘000 tan metrik) 22.4 (– 29.3) 24.0 (7.4) 20.6 (– 14.3) 21 (1.9) 20 (– 4.8)Exports (‘000 tonnes)RM juta/RM million 485 (1.5) 491 (1.3) 435 (– 11.4) 395 (– 9.2) 392 (– 0.7)Harga (RM/kg)/(USD/tonne)4 21.46 (40.2) 20.20 (– 5.9) 20.47 (1.3) 4,737 (– 12.1) 4,947 (4.4)Price (RM/kg)/(USD/tonne)4
GAS ASLI CECAIR/LIQUEFIEDNATURAL GAS (LNG)
Eksport (‘000 tan metrik) 14,627 (– 2.9) 15,088 (3.2) 15,453 (2.4) 15,130 (– 2.1) 15,810 (4.5)Exports (‘000 tonnes)RM juta/RM million 5,952 (– 4.9) 6,349 (6.7) 11.300 (78) 10,440 (– 7.6) 10,609 (– 1.6)Nilai seunit (RM/tan metrik) 407 (– 2.0) 421 (3.4) 732 (73.8) 690 (– 5.6) 671 (– 2.8)Unit value (RM/tonne)
GAS ASLI/NATURAL (GAS)Pengeluaran (‘000 jkps)5 1,359 (– 0.4) 1,442 (6.2) 1,598 (10.8) 1,674 (4.7) 1,865 (11.4)Production (‘000 mmscf)5
1 Angka-angka dalam kurungan adalah peratus perubahan tahunan.2 tsh = tong sehari (7.6 tong = 1 tan metrik).3 Termasuk minyak kelapa sawit mentah yang diproses dan stearin.4 Mulai Februari 2001, harga di Bursa Timah Kuala Lumpur disebut
dalam USD/tan metrik.5 jkps = juta kaki padu standard.6 Kadar pertumbuhan tahun 2000 berdasarkan 366 hari.7 Ramalan oleh Kementerian Kewangan.Sumber: JP, PETRONAS, Jabatan Mineral dan Geosains Malaysia dan
Kementerian Perusahaan Utama.
1 Figures in parentheses are annual percentage changes.2 bpd = barrels per day (7.6 barrels = 1 tonne).3 Includes crude and processed palm oil and palm stearin.4 From February 2001, prices in Kuala Lumpur Tin Market
(KLTM) was quoted in USD/tonne.5 mmscf = million standard cubic feet.6 2000 growth is based on 366 days.7 Forecasts by Ministry of Finance.Source: DOS, PETRONAS, Minerals and Geoscience
Department and Ministry of Primary Industries.
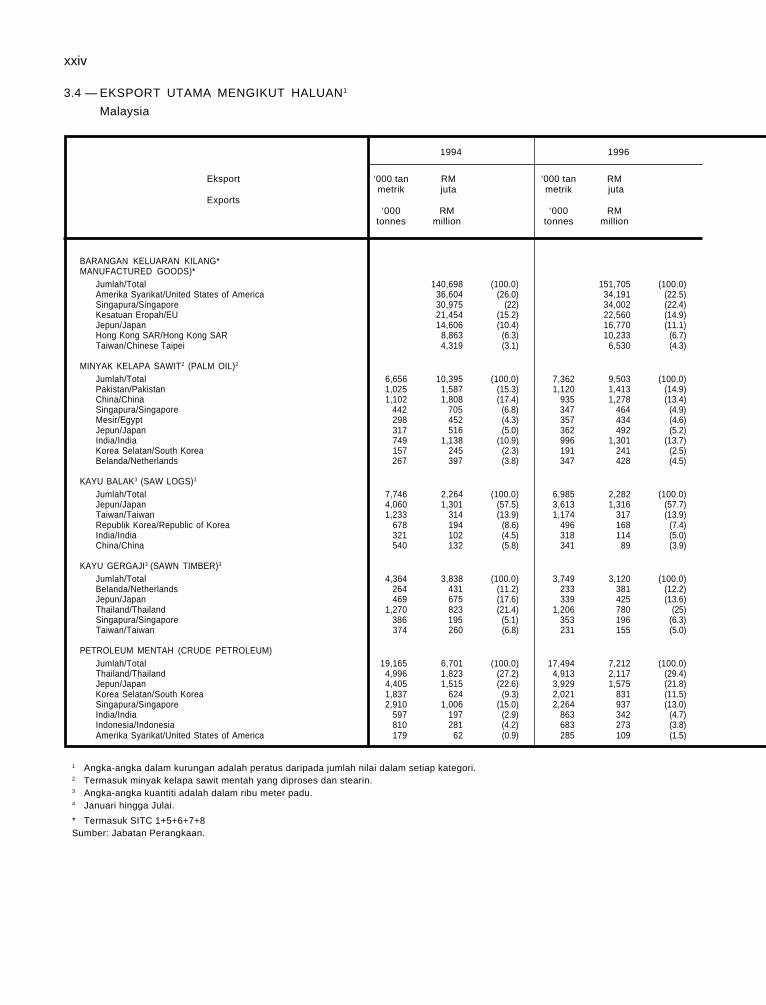
xxiv
3.4 — EKSPORT UTAMA MENGIKUT HALUAN1
Malaysia
1994 1996
Eksport ‘000 tan RM ‘000 tan RMmetrik juta metrik juta
Exports‘000 RM ‘000 RM
tonnes million tonnes million
BARANGAN KELUARAN KILANG*MANUFACTURED GOODS)*
Jumlah/Total 140,698 (100.0) 151,705 (100.0)Amerika Syarikat/United States of America 36,604 (26.0) 34,191 (22.5)Singapura/Singapore 30,975 (22) 34,002 (22.4)Kesatuan Eropah/EU 21,454 (15.2) 22,560 (14.9)Jepun/Japan 14,606 (10.4) 16,770 (11.1)Hong Kong SAR/Hong Kong SAR 8,863 (6.3) 10,233 (6.7)Taiwan/Chinese Taipei 4,319 (3.1) 6,530 (4.3)
MINYAK KELAPA SAWIT2 (PALM OIL)2
Jumlah/Total 6,656 10,395 (100.0) 7,362 9,503 (100.0)Pakistan/Pakistan 1,025 1,587 (15.3) 1,120 1,413 (14.9)China/China 1,102 1,808 (17.4) 935 1,278 (13.4)Singapura/Singapore 442 705 (6.8) 347 464 (4.9)Mesir/Egypt 298 452 (4.3) 357 434 (4.6)Jepun/Japan 317 516 (5.0) 362 492 (5.2)India/India 749 1,138 (10.9) 996 1,301 (13.7)Korea Selatan/South Korea 157 245 (2.3) 191 241 (2.5)Belanda/Netherlands 267 397 (3.8) 347 428 (4.5)
KAYU BALAK3 (SAW LOGS)3
Jumlah/Total 7,746 2,264 (100.0) 6,985 2,282 (100.0)Jepun/Japan 4,060 1,301 (57.5) 3,613 1,316 (57.7)Taiwan/Taiwan 1,233 314 (13.9) 1,174 317 (13.9)Republik Korea/Republic of Korea 678 194 (8.6) 496 168 (7.4)India/India 321 102 (4.5) 318 114 (5.0)China/China 540 132 (5.8) 341 89 (3.9)
KAYU GERGAJI3 (SAWN TIMBER)3
Jumlah/Total 4,364 3,838 (100.0) 3,749 3,120 (100.0)Belanda/Netherlands 264 431 (11.2) 233 381 (12.2)Jepun/Japan 469 675 (17.6) 339 425 (13.6)Thailand/Thailand 1,270 823 (21.4) 1,206 780 (25)Singapura/Singapore 386 195 (5.1) 353 196 (6.3)Taiwan/Taiwan 374 260 (6.8) 231 155 (5.0)
PETROLEUM MENTAH (CRUDE PETROLEUM)Jumlah/Total 19,165 6,701 (100.0) 17,494 7,212 (100.0)Thailand/Thailand 4,996 1,823 (27.2) 4,913 2,117 (29.4)Jepun/Japan 4,405 1,515 (22.6) 3,929 1,575 (21.8)Korea Selatan/South Korea 1,837 624 (9.3) 2,021 831 (11.5)Singapura/Singapore 2,910 1,006 (15.0) 2,264 937 (13.0)India/India 597 197 (2.9) 863 342 (4.7)Indonesia/Indonesia 810 281 (4.2) 683 273 (3.8)Amerika Syarikat/United States of America 179 62 (0.9) 285 109 (1.5)
1 Angka-angka dalam kurungan adalah peratus daripada jumlah nilai dalam setiap kategori.2 Termasuk minyak kelapa sawit mentah yang diproses dan stearin.3 Angka-angka kuantiti adalah dalam ribu meter padu.4 Januari hingga Julai.
* Termasuk SITC 1+5+6+7+8Sumber: Jabatan Perangkaan.
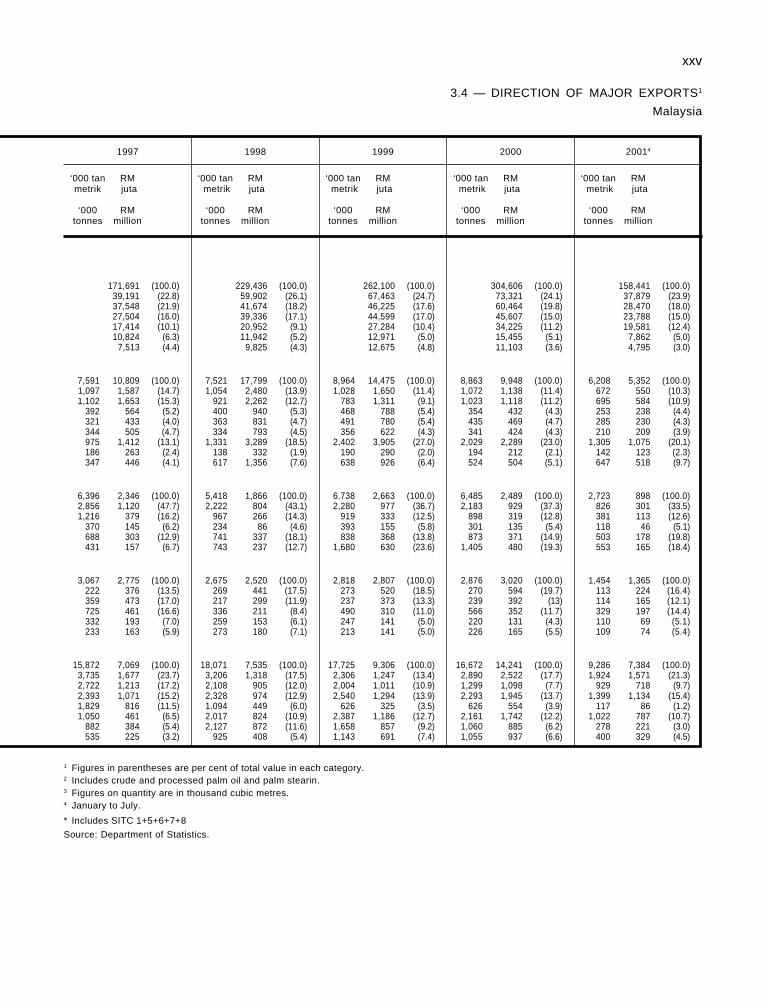
xxv
1 Figures in parentheses are per cent of total value in each category.2 Includes crude and processed palm oil and palm stearin.3 Figures on quantity are in thousand cubic metres.4 January to July.
* Includes SITC 1+5+6+7+8
Source: Department of Statistics.
3.4 — DIRECTION OF MAJOR EXPORTS1
Malaysia
1997 1998 1999 2000 20014
‘000 tan RM ‘000 tan RM ‘000 tan RM ‘000 tan RM ‘000 tan RMmetrik juta metrik juta metrik juta metrik juta metrik juta
‘000 RM ‘000 RM ‘000 RM ‘000 RM ‘000 RMtonnes million tonnes million tonnes million tonnes million tonnes million
171,691 (100.0) 229,436 (100.0) 262,100 (100.0) 304,606 (100.0) 158,441 (100.0)39,191 (22.8) 59,902 (26.1) 67,463 (24.7) 73,321 (24.1) 37,879 (23.9)37,548 (21.9) 41,674 (18.2) 46,225 (17.6) 60,464 (19.8) 28,470 (18.0)27,504 (16.0) 39,336 (17.1) 44,599 (17.0) 45,607 (15.0) 23,788 (15.0)17,414 (10.1) 20,952 (9.1) 27,284 (10.4) 34,225 (11.2) 19,581 (12.4)10,824 (6.3) 11,942 (5.2) 12,971 (5.0) 15,455 (5.1) 7,862 (5.0) 7,513 (4.4) 9,825 (4.3) 12,675 (4.8) 11,103 (3.6) 4,795 (3.0)
7,591 10,809 (100.0) 7,521 17,799 (100.0) 8,964 14,475 (100.0) 8,863 9,948 (100.0) 6,208 5,352 (100.0) 1,097 1,587 (14.7) 1,054 2,480 (13.9) 1,028 1,650 (11.4) 1,072 1,138 (11.4) 672 550 (10.3)1,102 1,653 (15.3) 921 2,262 (12.7) 783 1,311 (9.1) 1,023 1,118 (11.2) 695 584 (10.9)
392 564 (5.2) 400 940 (5.3) 468 788 (5.4) 354 432 (4.3) 253 238 (4.4)321 433 (4.0) 363 831 (4.7) 491 780 (5.4) 435 469 (4.7) 285 230 (4.3)344 505 (4.7) 334 793 (4.5) 356 622 (4.3) 341 424 (4.3) 210 209 (3.9)975 1,412 (13.1) 1,331 3,289 (18.5) 2,402 3,905 (27.0) 2,029 2,289 (23.0) 1,305 1,075 (20.1)186 263 (2.4) 138 332 (1.9) 190 290 (2.0) 194 212 (2.1) 142 123 (2.3)347 446 (4.1) 617 1,356 (7.6) 638 926 (6.4) 524 504 (5.1) 647 518 (9.7)
6,396 2,346 (100.0) 5,418 1,866 (100.0) 6.738 2,663 (100.0) 6,485 2,489 (100.0) 2,723 898 (100.0)2,856 1,120 (47.7) 2,222 804 (43.1) 2,280 977 (36.7) 2,183 929 (37.3) 826 301 (33.5)1,216 379 (16.2) 967 266 (14.3) 919 333 (12.5) 898 319 (12.8) 381 113 (12.6)
370 145 (6.2) 234 86 (4.6) 393 155 (5.8) 301 135 (5.4) 118 46 (5.1)688 303 (12.9) 741 337 (18.1) 838 368 (13.8) 873 371 (14.9) 503 178 (19.8)431 157 (6.7) 743 237 (12.7) 1,680 630 (23.6) 1,405 480 (19.3) 553 165 (18.4)
3,067 2,775 (100.0) 2,675 2,520 (100.0) 2,818 2,807 (100.0) 2,876 3,020 (100.0) 1,454 1,365 (100.0)222 376 (13.5) 269 441 (17.5) 273 520 (18.5) 270 594 (19.7) 113 224 (16.4)359 473 (17.0) 217 299 (11.9) 237 373 (13.3) 239 392 (13) 114 165 (12.1)725 461 (16.6) 336 211 (8.4) 490 310 (11.0) 566 352 (11.7) 329 197 (14.4)332 193 (7.0) 259 153 (6.1) 247 141 (5.0) 220 131 (4.3) 110 69 (5.1)233 163 (5.9) 273 180 (7.1) 213 141 (5.0) 226 165 (5.5) 109 74 (5.4)
15,872 7,069 (100.0) 18,071 7,535 (100.0) 17,725 9,306 (100.0) 16,672 14,241 (100.0) 9,286 7,384 (100.0)3,735 1,677 (23.7) 3,206 1,318 (17.5) 2,306 1,247 (13.4) 2,890 2,522 (17.7) 1,924 1,571 (21.3)2,722 1,213 (17.2) 2,108 905 (12.0) 2,004 1,011 (10.9) 1,299 1,098 (7.7) 929 718 (9.7)2,393 1,071 (15.2) 2,328 974 (12.9) 2,540 1,294 (13.9) 2,293 1,945 (13.7) 1,399 1,134 (15.4)1,829 816 (11.5) 1.094 449 (6.0) 626 325 (3.5) 626 554 (3.9) 117 86 (1.2)1,050 461 (6.5) 2,017 824 (10.9) 2,387 1,186 (12.7) 2,161 1,742 (12.2) 1,022 787 (10.7)
882 384 (5.4) 2,127 872 (11.6) 1,658 857 (9.2) 1,060 885 (6.2) 278 221 (3.0)535 225 (3.2) 925 408 (5.4) 1,143 691 (7.4) 1,055 937 (6.6) 400 329 (4.5)
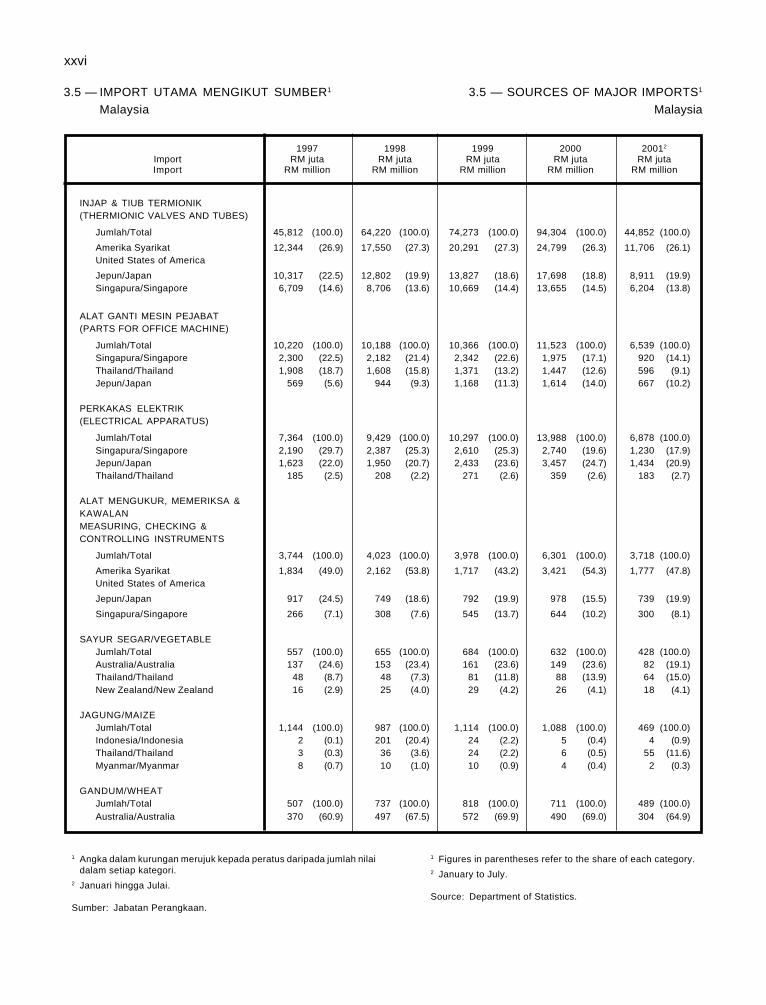
xxvi
3.5 — IMPORT UTAMA MENGIKUT SUMBER1
Malaysia
3.5 — SOURCES OF MAJOR IMPORTS1
Malaysia
1997 1998 1999 2000 20012
Import RM juta RM juta RM juta RM juta RM jutaImport RM million RM million RM million RM million RM million
INJAP & TIUB TERMIONIK(THERMIONIC VALVES AND TUBES)
Jumlah/Total 45,812 (100.0) 64,220 (100.0) 74,273 (100.0) 94,304 (100.0) 44,852 (100.0)
Amerika Syarikat 12,344 (26.9) 17,550 (27.3) 20,291 (27.3) 24,799 (26.3) 11,706 (26.1)United States of America
Jepun/Japan 10,317 (22.5) 12,802 (19.9) 13,827 (18.6) 17,698 (18.8) 8,911 (19.9)Singapura/Singapore 6,709 (14.6) 8,706 (13.6) 10,669 (14.4) 13,655 (14.5) 6,204 (13.8)
ALAT GANTI MESIN PEJABAT(PARTS FOR OFFICE MACHINE)
Jumlah/Total 10,220 (100.0) 10,188 (100.0) 10,366 (100.0) 11,523 (100.0) 6,539 (100.0)Singapura/Singapore 2,300 (22.5) 2,182 (21.4) 2,342 (22.6) 1,975 (17.1) 920 (14.1)Thailand/Thailand 1,908 (18.7) 1,608 (15.8) 1,371 (13.2) 1,447 (12.6) 596 (9.1)Jepun/Japan 569 (5.6) 944 (9.3) 1,168 (11.3) 1,614 (14.0) 667 (10.2)
PERKAKAS ELEKTRIK(ELECTRICAL APPARATUS)
Jumlah/Total 7,364 (100.0) 9,429 (100.0) 10,297 (100.0) 13,988 (100.0) 6,878 (100.0)Singapura/Singapore 2,190 (29.7) 2,387 (25.3) 2,610 (25.3) 2,740 (19.6) 1,230 (17.9)Jepun/Japan 1,623 (22.0) 1,950 (20.7) 2,433 (23.6) 3,457 (24.7) 1,434 (20.9)Thailand/Thailand 185 (2.5) 208 (2.2) 271 (2.6) 359 (2.6) 183 (2.7)
ALAT MENGUKUR, MEMERIKSA &KAWALANMEASURING, CHECKING &CONTROLLING INSTRUMENTS
Jumlah/Total 3,744 (100.0) 4,023 (100.0) 3,978 (100.0) 6,301 (100.0) 3,718 (100.0)
Amerika Syarikat 1,834 (49.0) 2,162 (53.8) 1,717 (43.2) 3,421 (54.3) 1,777 (47.8)United States of America
Jepun/Japan 917 (24.5) 749 (18.6) 792 (19.9) 978 (15.5) 739 (19.9)
Singapura/Singapore 266 (7.1) 308 (7.6) 545 (13.7) 644 (10.2) 300 (8.1)
SAYUR SEGAR/VEGETABLEJumlah/Total 557 (100.0) 655 (100.0) 684 (100.0) 632 (100.0) 428 (100.0)Australia/Australia 137 (24.6) 153 (23.4) 161 (23.6) 149 (23.6) 82 (19.1)Thailand/Thailand 48 (8.7) 48 (7.3) 81 (11.8) 88 (13.9) 64 (15.0)New Zealand/New Zealand 16 (2.9) 25 (4.0) 29 (4.2) 26 (4.1) 18 (4.1)
JAGUNG/MAIZEJumlah/Total 1,144 (100.0) 987 (100.0) 1,114 (100.0) 1,088 (100.0) 469 (100.0)Indonesia/Indonesia 2 (0.1) 201 (20.4) 24 (2.2) 5 (0.4) 4 (0.9)Thailand/Thailand 3 (0.3) 36 (3.6) 24 (2.2) 6 (0.5) 55 (11.6)Myanmar/Myanmar 8 (0.7) 10 (1.0) 10 (0.9) 4 (0.4) 2 (0.3)
GANDUM/WHEATJumlah/Total 507 (100.0) 737 (100.0) 818 (100.0) 711 (100.0) 489 (100.0)Australia/Australia 370 (60.9) 497 (67.5) 572 (69.9) 490 (69.0) 304 (64.9)
1 Angka dalam kurungan merujuk kepada peratus daripada jumlah nilaidalam setiap kategori.
2 Januari hingga Julai.
Sumber: Jabatan Perangkaan.
1 Figures in parentheses refer to the share of each category.2 January to July.
Source: Department of Statistics.
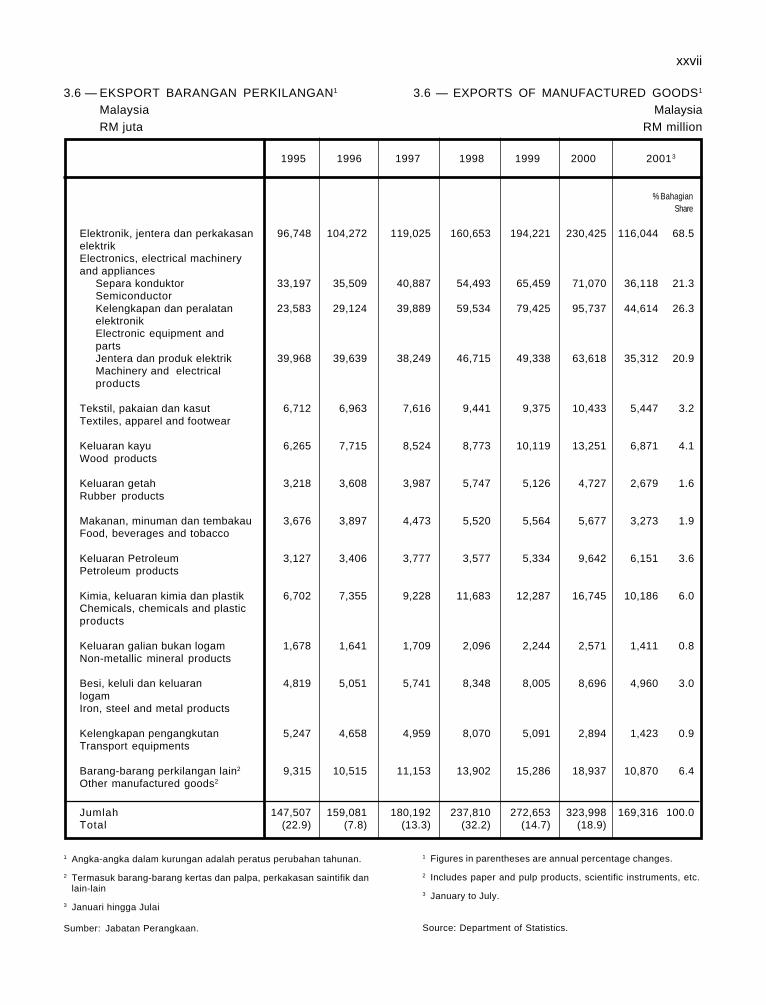
xxvii
1995 1996 1997 1998 1999 2000 20013
% BahagianShare
Elektronik, jentera dan perkakasan 96,748 104,272 119,025 160,653 194,221 230,425 116,044 68.5elektrikElectronics, electrical machineryand appliances
Separa konduktor 33,197 35,509 40,887 54,493 65,459 71,070 36,118 21.3SemiconductorKelengkapan dan peralatan 23,583 29,124 39,889 59,534 79,425 95,737 44,614 26.3elektronikElectronic equipment andpartsJentera dan produk elektrik 39,968 39,639 38,249 46,715 49,338 63,618 35,312 20.9Machinery and electricalproducts
Tekstil, pakaian dan kasut 6,712 6,963 7,616 9,441 9,375 10,433 5,447 3.2Textiles, apparel and footwear
Keluaran kayu 6,265 7,715 8,524 8,773 10,119 13,251 6,871 4.1Wood products
Keluaran getah 3,218 3,608 3,987 5,747 5,126 4,727 2,679 1.6Rubber products
Makanan, minuman dan tembakau 3,676 3,897 4,473 5,520 5,564 5,677 3,273 1.9Food, beverages and tobacco
Keluaran Petroleum 3,127 3,406 3,777 3,577 5,334 9,642 6,151 3.6Petroleum products
Kimia, keluaran kimia dan plastik 6,702 7,355 9,228 11,683 12,287 16,745 10,186 6.0Chemicals, chemicals and plasticproducts
Keluaran galian bukan logam 1,678 1,641 1,709 2,096 2,244 2,571 1,411 0.8Non-metallic mineral products
Besi, keluli dan keluaran 4,819 5,051 5,741 8,348 8,005 8,696 4,960 3.0logamIron, steel and metal products
Kelengkapan pengangkutan 5,247 4,658 4,959 8,070 5,091 2,894 1,423 0.9Transport equipments
Barang-barang perkilangan lain2 9,315 10,515 11,153 13,902 15,286 18,937 10,870 6.4Other manufactured goods2
Jumlah 147,507 159,081 180,192 237,810 272,653 323,998 169,316 100.0Total (22.9) (7.8) (13.3) (32.2) (14.7) (18.9)
3.6 — EXPORTS OF MANUFACTURED GOODS1
MalaysiaRM million
3.6 — EKSPORT BARANGAN PERKILANGAN1
MalaysiaRM juta
1 Figures in parentheses are annual percentage changes.
2 Includes paper and pulp products, scientific instruments, etc.
3 January to July.
Source: Department of Statistics.
1 Angka-angka dalam kurungan adalah peratus perubahan tahunan.
2 Termasuk barang-barang kertas dan palpa, perkakasan saintifik danlain-lain
3 Januari hingga Julai
Sumber: Jabatan Perangkaan.
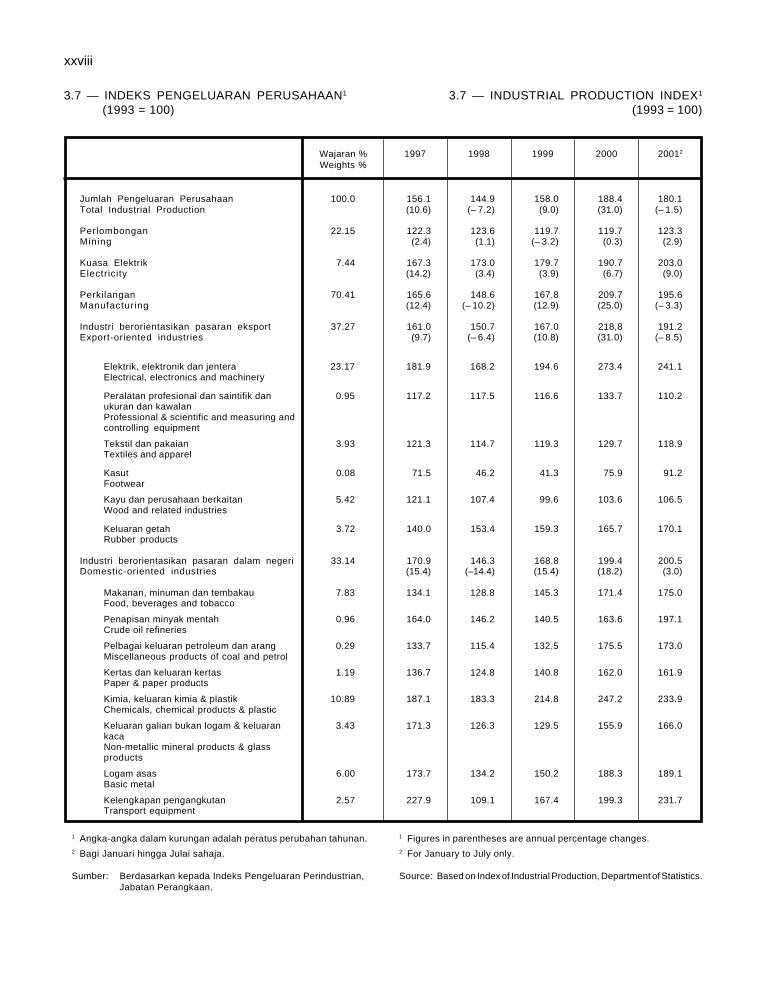
xxviii
3.7 — INDEKS PENGELUARAN PERUSAHAAN1 3.7 — INDUSTRIAL PRODUCTION INDEX1
(1993 = 100) (1993 = 100)
Wajaran % 1997 1998 1999 2000 20012
Weights %
Jumlah Pengeluaran Perusahaan 100.0 156.1 144.9 158.0 188.4 180.1Total Industrial Production (10.6) (– 7.2) (9.0) (31.0) (– 1.5)
Perlombongan 22.15 122.3 123.6 119.7 119.7 123.3Mining (2.4) (1.1) (– 3.2) (0.3) (2.9)
Kuasa Elektrik 7.44 167.3 173.0 179.7 190.7 203.0Electricity (14.2) (3.4) (3.9) (6.7) (9.0)
Perkilangan 70.41 165.6 148.6 167.8 209.7 195.6Manufacturing (12.4) (– 10.2) (12.9) (25.0) (– 3.3)
Industri berorientasikan pasaran eksport 37.27 161.0 150.7 167.0 218,8 191.2Export-oriented industries (9.7) (– 6.4) (10.8) (31.0) (– 8.5)
Elektrik, elektronik dan jentera 23.17 181.9 168.2 194.6 273.4 241.1Electrical, electronics and machinery
Peralatan profesional dan saintifik dan 0.95 117.2 117.5 116.6 133.7 110.2ukuran dan kawalanProfessional & scientific and measuring andcontrolling equipment
Tekstil dan pakaian 3.93 121.3 114.7 119.3 129.7 118.9Textiles and apparel
Kasut 0.08 71.5 46.2 41.3 75.9 91.2Footwear
Kayu dan perusahaan berkaitan 5.42 121.1 107.4 99.6 103.6 106.5Wood and related industries
Keluaran getah 3.72 140.0 153.4 159.3 165.7 170.1Rubber products
Industri berorientasikan pasaran dalam negeri 33.14 170.9 146.3 168.8 199.4 200.5Domestic-oriented industries (15.4) (–14.4) (15.4) (18.2) (3.0)
Makanan, minuman dan tembakau 7.83 134.1 128.8 145.3 171.4 175.0Food, beverages and tobacco
Penapisan minyak mentah 0.96 164.0 146.2 140.5 163.6 197.1Crude oil refineries
Pelbagai keluaran petroleum dan arang 0.29 133.7 115.4 132.5 175.5 173.0Miscellaneous products of coal and petrol
Kertas dan keluaran kertas 1.19 136.7 124.8 140.8 162.0 161.9Paper & paper products
Kimia, keluaran kimia & plastik 10.89 187.1 183.3 214.8 247.2 233.9Chemicals, chemical products & plastic
Keluaran galian bukan logam & keluaran 3.43 171.3 126.3 129.5 155.9 166.0kacaNon-metallic mineral products & glassproducts
Logam asas 6.00 173.7 134.2 150.2 188.3 189.1Basic metal
Kelengkapan pengangkutan 2.57 227.9 109.1 167.4 199.3 231.7Transport equipment
1 Angka-angka dalam kurungan adalah peratus perubahan tahunan.2 Bagi Januari hingga Julai sahaja.
Sumber: Berdasarkan kepada Indeks Pengeluaran Perindustrian,Jabatan Perangkaan.
1 Figures in parentheses are annual percentage changes.2 For January to July only.
Source: Based on Index of Industrial Production, Department of Statistics.
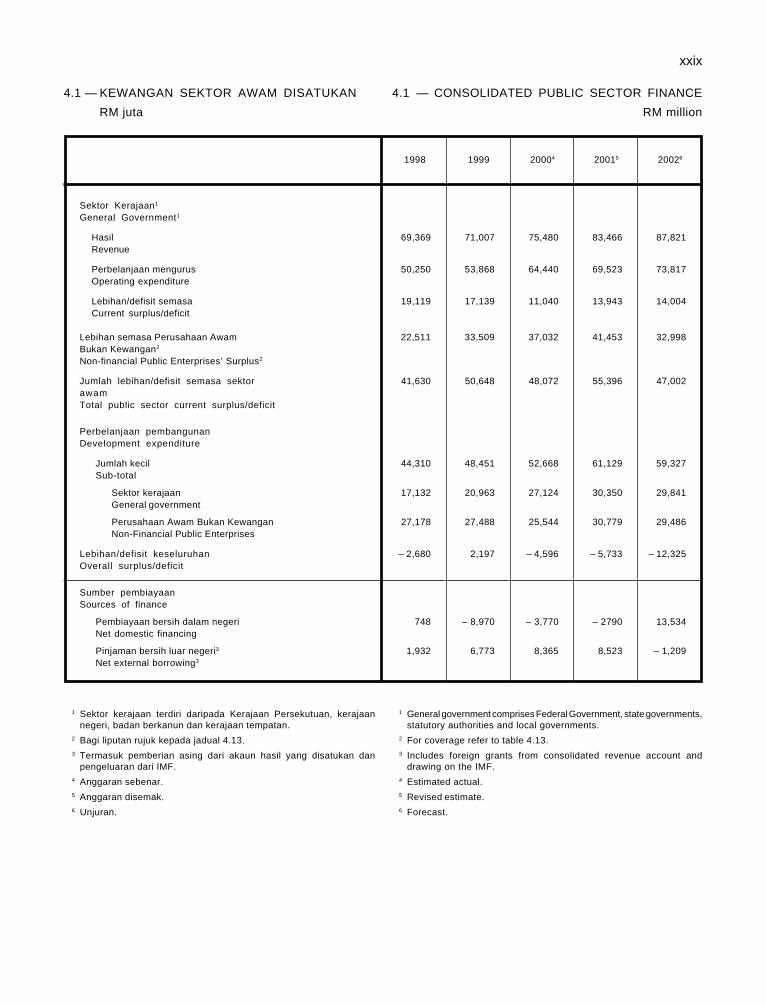
xxix
1 General government comprises Federal Government, state governments,statutory authorities and local governments.
2 For coverage refer to table 4.13.3 Includes foreign grants from consolidated revenue account and
drawing on the IMF.4 Estimated actual.5 Revised estimate.6 Forecast.
1 Sektor kerajaan terdiri daripada Kerajaan Persekutuan, kerajaannegeri, badan berkanun dan kerajaan tempatan.
2 Bagi liputan rujuk kepada jadual 4.13.3 Termasuk pemberian asing dari akaun hasil yang disatukan dan
pengeluaran dari IMF.4 Anggaran sebenar.5 Anggaran disemak.6 Unjuran.
4.1 — KEWANGAN SEKTOR AWAM DISATUKAN 4.1 — CONSOLIDATED PUBLIC SECTOR FINANCE
RM juta RM million
1998 1999 20004 20015 20026
Sektor Kerajaan1
General Government1
Hasil 69,369 71,007 75,480 83,466 87,821Revenue
Perbelanjaan mengurus 50,250 53,868 64,440 69,523 73,817Operating expenditure
Lebihan/defisit semasa 19,119 17,139 11,040 13,943 14,004Current surplus/deficit
Lebihan semasa Perusahaan Awam 22,511 33,509 37,032 41,453 32,998Bukan Kewangan2
Non-financial Public Enterprises’ Surplus2
Jumlah lebihan/defisit semasa sektor 41,630 50,648 48,072 55,396 47,002awamTotal public sector current surplus/deficit
Perbelanjaan pembangunanDevelopment expenditure
Jumlah kecil 44,310 48,451 52,668 61,129 59,327Sub-total
Sektor kerajaan 17,132 20,963 27,124 30,350 29,841General government
Perusahaan Awam Bukan Kewangan 27,178 27,488 25,544 30,779 29,486Non-Financial Public Enterprises
Lebihan/defisit keseluruhan – 2,680 2,197 – 4,596 – 5,733 – 12,325Overall surplus/deficit
Sumber pembiayaanSources of finance
Pembiayaan bersih dalam negeri 748 – 8,970 – 3,770 – 2790 13,534Net domestic financing
Pinjaman bersih luar negeri3 1,932 6,773 8,365 8,523 – 1,209Net external borrowing3
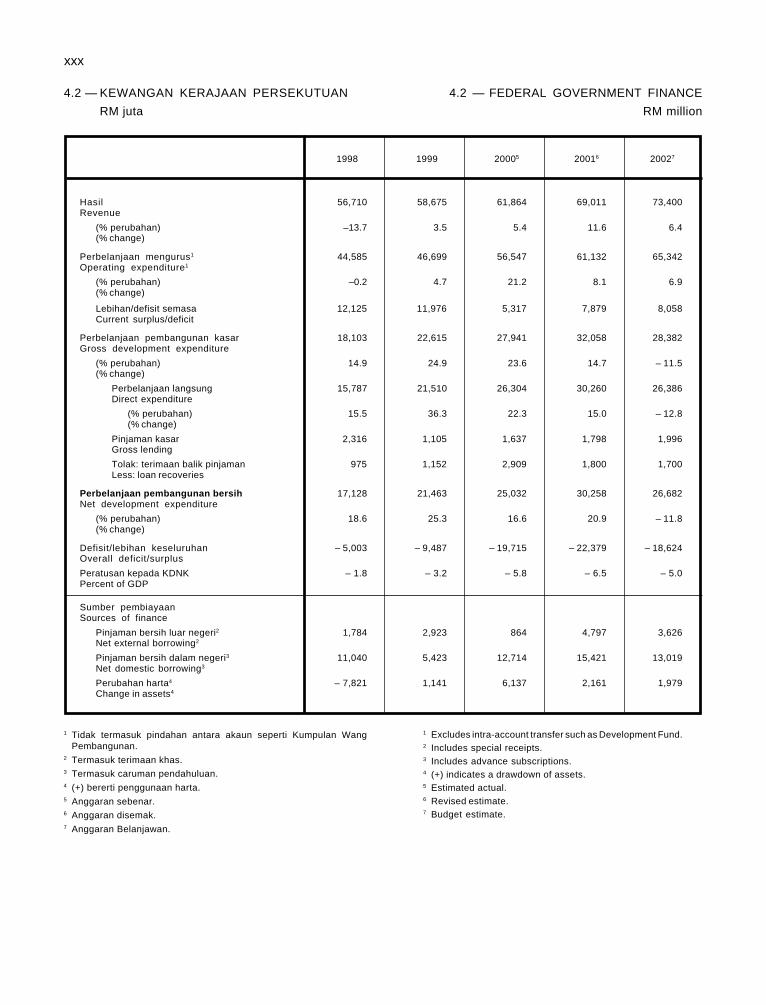
xxx
4.2 — KEWANGAN KERAJAAN PERSEKUTUAN 4.2 — FEDERAL GOVERNMENT FINANCE
RM juta RM million
1998 1999 20005 20016 20027
Hasil 56,710 58,675 61,864 69,011 73,400Revenue
(% perubahan) –13.7 3.5 5.4 11.6 6.4(% change)
Perbelanjaan mengurus1 44,585 46,699 56,547 61,132 65,342Operating expenditure1
(% perubahan) –0.2 4.7 21.2 8.1 6.9(% change)
Lebihan/defisit semasa 12,125 11,976 5,317 7,879 8,058Current surplus/deficit
Perbelanjaan pembangunan kasar 18,103 22,615 27,941 32,058 28,382Gross development expenditure
(% perubahan) 14.9 24.9 23.6 14.7 – 11.5(% change)
Perbelanjaan langsung 15,787 21,510 26,304 30,260 26,386Direct expenditure
(% perubahan) 15.5 36.3 22.3 15.0 – 12.8(% change)
Pinjaman kasar 2,316 1,105 1,637 1,798 1,996Gross lending
Tolak: terimaan balik pinjaman 975 1,152 2,909 1,800 1,700Less: loan recoveries
Perbelanjaan pembangunan bersih 17,128 21,463 25,032 30,258 26,682Net development expenditure
(% perubahan) 18.6 25.3 16.6 20.9 – 11.8(% change)
Defisit/lebihan keseluruhan – 5,003 – 9,487 – 19,715 – 22,379 – 18,624Overall deficit/surplus
Peratusan kepada KDNK – 1.8 – 3.2 – 5.8 – 6.5 – 5.0Percent of GDP
Sumber pembiayaanSources of finance
Pinjaman bersih luar negeri2 1,784 2,923 864 4,797 3,626Net external borrowing2
Pinjaman bersih dalam negeri3 11,040 5,423 12,714 15,421 13,019Net domestic borrowing3
Perubahan harta4 – 7,821 1,141 6,137 2,161 1,979Change in assets4
1 Excludes intra-account transfer such as Development Fund.2 Includes special receipts.3 Includes advance subscriptions.4 (+) indicates a drawdown of assets.5 Estimated actual.6 Revised estimate.7 Budget estimate.
1 Tidak termasuk pindahan antara akaun seperti Kumpulan WangPembangunan.
2 Termasuk terimaan khas.3 Termasuk caruman pendahuluan.4 (+) bererti penggunaan harta.5 Anggaran sebenar.6 Anggaran disemak.7 Anggaran Belanjawan.
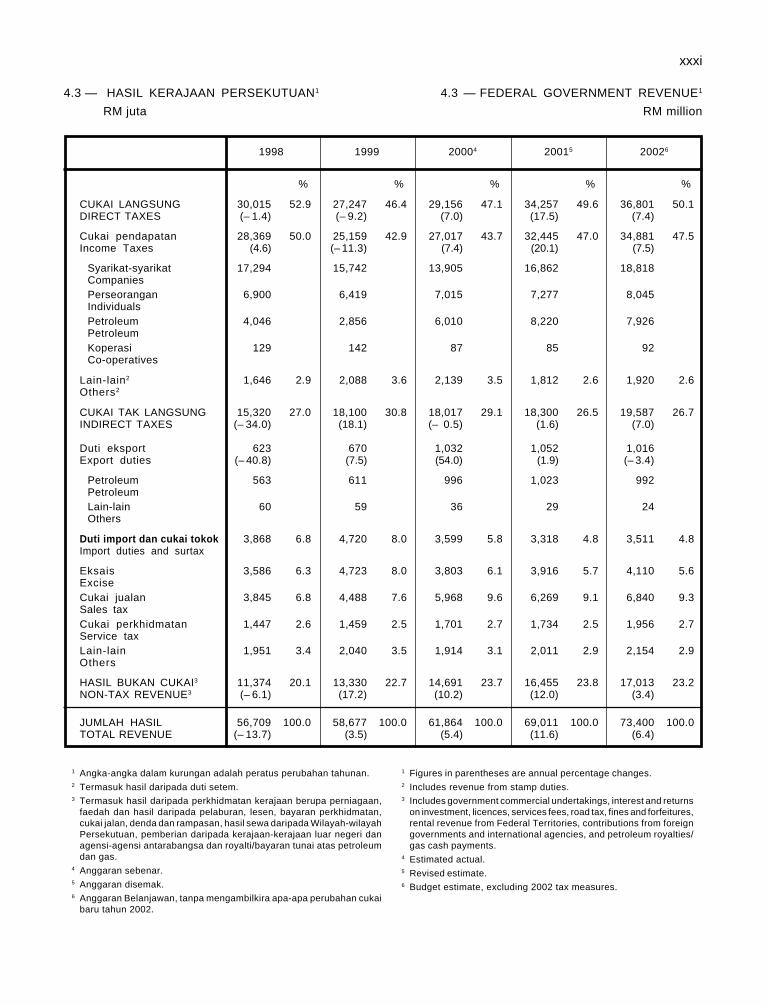
xxxi
4.3 — HASIL KERAJAAN PERSEKUTUAN1
RM juta
1998 1999 20004 20015 20026
% % % % %
CUKAI LANGSUNG 30,015 52.9 27,247 46.4 29,156 47.1 34,257 49.6 36,801 50.1DIRECT TAXES (– 1.4) (– 9.2) (7.0) (17.5) (7.4)
Cukai pendapatan 28,369 50.0 25,159 42.9 27,017 43.7 32,445 47.0 34,881 47.5Income Taxes (4.6) (– 11.3) (7.4) (20.1) (7.5)
Syarikat-syarikat 17,294 15,742 13,905 16,862 18,818CompaniesPerseorangan 6,900 6,419 7,015 7,277 8,045IndividualsPetroleum 4,046 2,856 6,010 8,220 7,926PetroleumKoperasi 129 142 87 85 92Co-operatives
Lain-lain2 1,646 2.9 2,088 3.6 2,139 3.5 1,812 2.6 1,920 2.6Others2
CUKAI TAK LANGSUNG 15,320 27.0 18,100 30.8 18,017 29.1 18,300 26.5 19,587 26.7INDIRECT TAXES (– 34.0) (18.1) (– 0.5) (1.6) (7.0)
Duti eksport 623 670 1,032 1,052 1,016Export duties (– 40.8) (7.5) (54.0) (1.9) (– 3.4)
Petroleum 563 611 996 1,023 992PetroleumLain-lain 60 59 36 29 24Others
Duti import dan cukai tokok 3,868 6.8 4,720 8.0 3,599 5.8 3,318 4.8 3,511 4.8Import duties and surtax
Eksais 3,586 6.3 4,723 8.0 3,803 6.1 3,916 5.7 4,110 5.6ExciseCukai jualan 3,845 6.8 4,488 7.6 5,968 9.6 6,269 9.1 6,840 9.3Sales taxCukai perkhidmatan 1,447 2.6 1,459 2.5 1,701 2.7 1,734 2.5 1,956 2.7Service taxLain-lain 1,951 3.4 2,040 3.5 1,914 3.1 2,011 2.9 2,154 2.9Others
HASIL BUKAN CUKAI3 11,374 20.1 13,330 22.7 14,691 23.7 16,455 23.8 17,013 23.2NON-TAX REVENUE3 (– 6.1) (17.2) (10.2) (12.0) (3.4)
JUMLAH HASIL 56,709 100.0 58,677 100.0 61,864 100.0 69,011 100.0 73,400 100.0TOTAL REVENUE (– 13.7) (3.5) (5.4) (11.6) (6.4)
4.3 — FEDERAL GOVERNMENT REVENUE1
RM million
1 Angka-angka dalam kurungan adalah peratus perubahan tahunan.2 Termasuk hasil daripada duti setem.3 Termasuk hasil daripada perkhidmatan kerajaan berupa perniagaan,
faedah dan hasil daripada pelaburan, lesen, bayaran perkhidmatan,cukai jalan, denda dan rampasan, hasil sewa daripada Wilayah-wilayahPersekutuan, pemberian daripada kerajaan-kerajaan luar negeri danagensi-agensi antarabangsa dan royalti/bayaran tunai atas petroleumdan gas.
4 Anggaran sebenar.5 Anggaran disemak.6 Anggaran Belanjawan, tanpa mengambilkira apa-apa perubahan cukai
baru tahun 2002.
1 Figures in parentheses are annual percentage changes.2 Includes revenue from stamp duties.3 Includes government commercial undertakings, interest and returns
on investment, licences, services fees, road tax, fines and forfeitures,rental revenue from Federal Territories, contributions from foreigngovernments and international agencies, and petroleum royalties/gas cash payments.
4 Estimated actual.5 Revised estimate.6 Budget estimate, excluding 2002 tax measures.
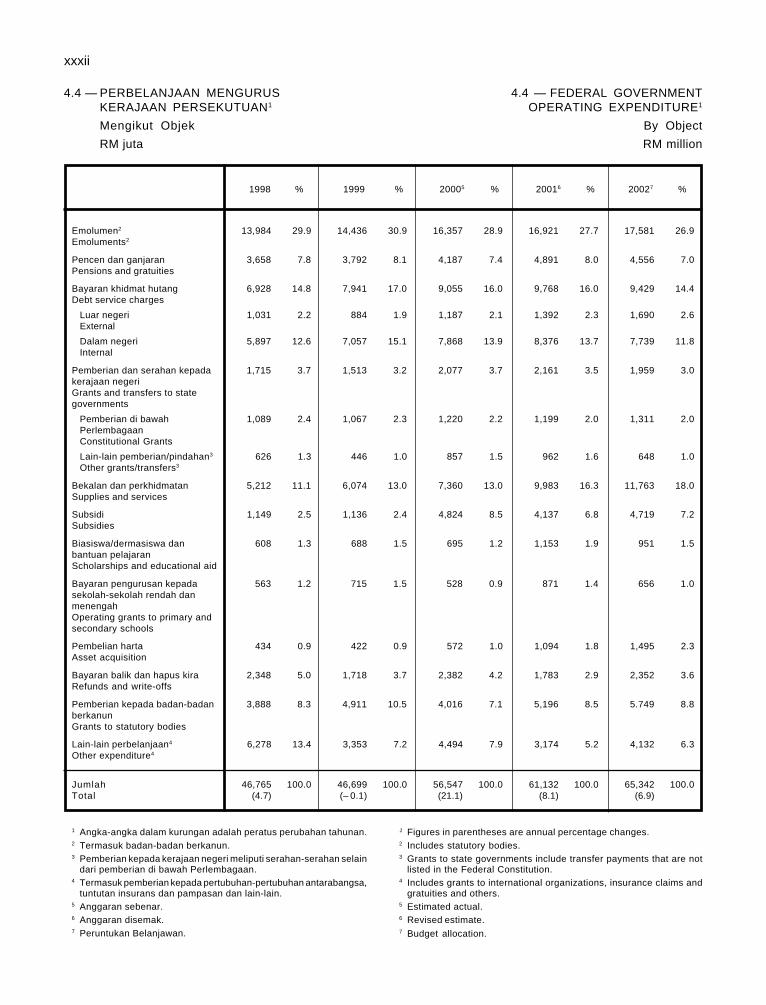
xxxii
1 Angka-angka dalam kurungan adalah peratus perubahan tahunan.2 Termasuk badan-badan berkanun.3 Pemberian kepada kerajaan negeri meliputi serahan-serahan selain
dari pemberian di bawah Perlembagaan.4 Termasuk pemberian kepada pertubuhan-pertubuhan antarabangsa,
tuntutan insurans dan pampasan dan lain-lain.5 Anggaran sebenar.6 Anggaran disemak.7 Peruntukan Belanjawan.
1 Figures in parentheses are annual percentage changes.2 Includes statutory bodies.3 Grants to state governments include transfer payments that are not
listed in the Federal Constitution.4 Includes grants to international organizations, insurance claims and
gratuities and others.5 Estimated actual.6 Revised estimate.7 Budget allocation.
4.4 — PERBELANJAAN MENGURUS 4.4 — FEDERAL GOVERNMENTKERAJAAN PERSEKUTUAN1 OPERATING EXPENDITURE1
Mengikut Objek By Object
RM juta RM million
1998 % 1999 % 20005 % 20016 % 20027 %
Emolumen2 13,984 29.9 14,436 30.9 16,357 28.9 16,921 27.7 17,581 26.9Emoluments2
Pencen dan ganjaran 3,658 7.8 3,792 8.1 4,187 7.4 4,891 8.0 4,556 7.0Pensions and gratuities
Bayaran khidmat hutang 6,928 14.8 7,941 17.0 9,055 16.0 9,768 16.0 9,429 14.4Debt service charges
Luar negeri 1,031 2.2 884 1.9 1,187 2.1 1,392 2.3 1,690 2.6External
Dalam negeri 5,897 12.6 7,057 15.1 7,868 13.9 8,376 13.7 7,739 11.8Internal
Pemberian dan serahan kepada 1,715 3.7 1,513 3.2 2,077 3.7 2,161 3.5 1,959 3.0kerajaan negeriGrants and transfers to stategovernments
Pemberian di bawah 1,089 2.4 1,067 2.3 1,220 2.2 1,199 2.0 1,311 2.0PerlembagaanConstitutional Grants
Lain-lain pemberian/pindahan3 626 1.3 446 1.0 857 1.5 962 1.6 648 1.0Other grants/transfers3
Bekalan dan perkhidmatan 5,212 11.1 6,074 13.0 7,360 13.0 9,983 16.3 11,763 18.0Supplies and services
Subsidi 1,149 2.5 1,136 2.4 4,824 8.5 4,137 6.8 4,719 7.2Subsidies
Biasiswa/dermasiswa dan 608 1.3 688 1.5 695 1.2 1,153 1.9 951 1.5bantuan pelajaranScholarships and educational aid
Bayaran pengurusan kepada 563 1.2 715 1.5 528 0.9 871 1.4 656 1.0sekolah-sekolah rendah danmenengahOperating grants to primary andsecondary schools
Pembelian harta 434 0.9 422 0.9 572 1.0 1,094 1.8 1,495 2.3Asset acquisition
Bayaran balik dan hapus kira 2,348 5.0 1,718 3.7 2,382 4.2 1,783 2.9 2,352 3.6Refunds and write-offs
Pemberian kepada badan-badan 3,888 8.3 4,911 10.5 4,016 7.1 5,196 8.5 5.749 8.8berkanunGrants to statutory bodies
Lain-lain perbelanjaan4 6,278 13.4 3,353 7.2 4,494 7.9 3,174 5.2 4,132 6.3Other expenditure4
Jumlah 46,765 100.0 46,699 100.0 56,547 100.0 61,132 100.0 65,342 100.0Total (4.7) (– 0.1) (21.1) (8.1) (6.9)
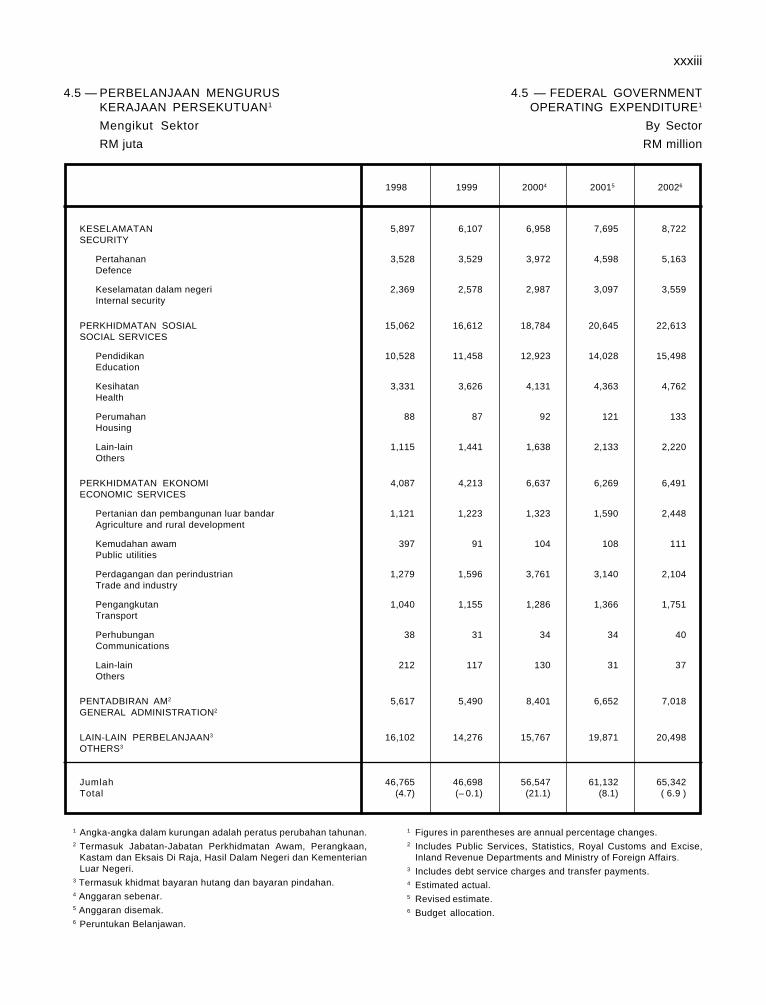
xxxiii
1 Angka-angka dalam kurungan adalah peratus perubahan tahunan.2 Termasuk Jabatan-Jabatan Perkhidmatan Awam, Perangkaan,
Kastam dan Eksais Di Raja, Hasil Dalam Negeri dan KementerianLuar Negeri.
3 Termasuk khidmat bayaran hutang dan bayaran pindahan.4 Anggaran sebenar.5 Anggaran disemak.6 Peruntukan Belanjawan.
1 Figures in parentheses are annual percentage changes.2 Includes Public Services, Statistics, Royal Customs and Excise,
Inland Revenue Departments and Ministry of Foreign Affairs.3 Includes debt service charges and transfer payments.4 Estimated actual.5 Revised estimate.6 Budget allocation.
4.5 — PERBELANJAAN MENGURUS 4.5 — FEDERAL GOVERNMENTKERAJAAN PERSEKUTUAN1 OPERATING EXPENDITURE1
Mengikut Sektor By Sector
RM juta RM million
1998 1999 20004 20015 20026
KESELAMATAN 5,897 6,107 6,958 7,695 8,722SECURITY
Pertahanan 3,528 3,529 3,972 4,598 5,163Defence
Keselamatan dalam negeri 2,369 2,578 2,987 3,097 3,559Internal security
PERKHIDMATAN SOSIAL 15,062 16,612 18,784 20,645 22,613SOCIAL SERVICES
Pendidikan 10,528 11,458 12,923 14,028 15,498Education
Kesihatan 3,331 3,626 4,131 4,363 4,762Health
Perumahan 88 87 92 121 133Housing
Lain-lain 1,115 1,441 1,638 2,133 2,220Others
PERKHIDMATAN EKONOMI 4,087 4,213 6,637 6,269 6,491ECONOMIC SERVICES
Pertanian dan pembangunan luar bandar 1,121 1,223 1,323 1,590 2,448Agriculture and rural development
Kemudahan awam 397 91 104 108 111Public utilities
Perdagangan dan perindustrian 1,279 1,596 3,761 3,140 2,104Trade and industry
Pengangkutan 1,040 1,155 1,286 1,366 1,751Transport
Perhubungan 38 31 34 34 40Communications
Lain-lain 212 117 130 31 37Others
PENTADBIRAN AM2 5,617 5,490 8,401 6,652 7,018GENERAL ADMINISTRATION2
LAIN-LAIN PERBELANJAAN3 16,102 14,276 15,767 19,871 20,498OTHERS3
Jumlah 46,765 46,698 56,547 61,132 65,342Total (4.7) (– 0.1) (21.1) (8.1) ( 6.9 )
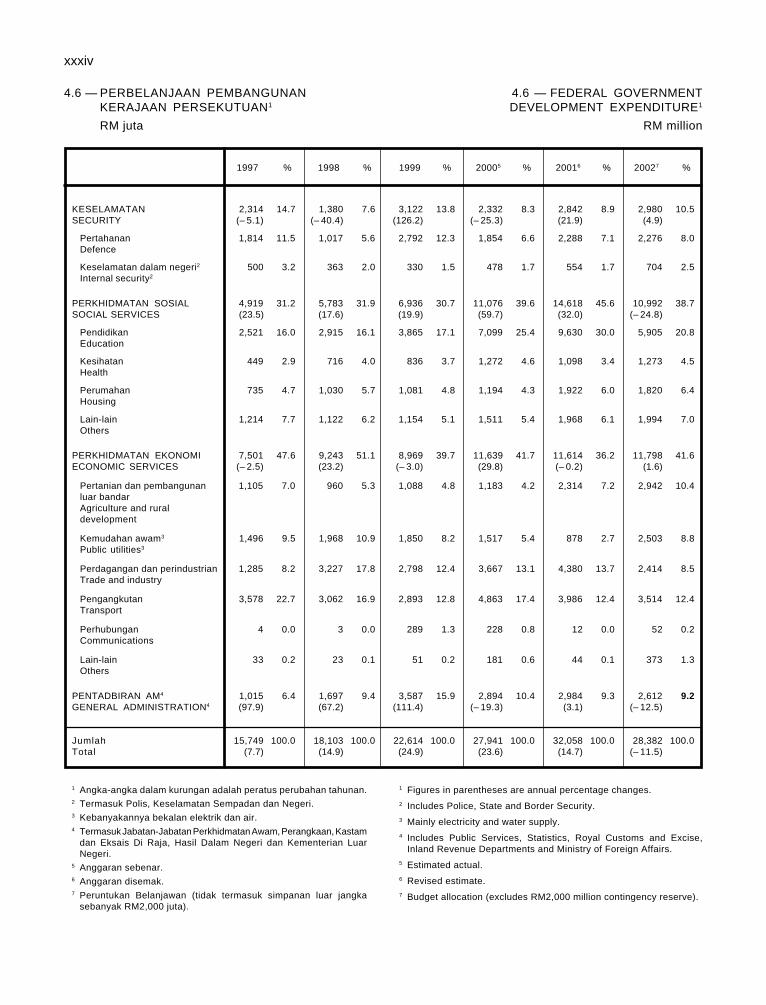
xxxiv
1 Angka-angka dalam kurungan adalah peratus perubahan tahunan.2 Termasuk Polis, Keselamatan Sempadan dan Negeri.3 Kebanyakannya bekalan elektrik dan air.4 Termasuk Jabatan-Jabatan Perkhidmatan Awam, Perangkaan, Kastam
dan Eksais Di Raja, Hasil Dalam Negeri dan Kementerian LuarNegeri.
5 Anggaran sebenar.6 Anggaran disemak.7 Peruntukan Belanjawan (tidak termasuk simpanan luar jangka
sebanyak RM2,000 juta).
1 Figures in parentheses are annual percentage changes.2 Includes Police, State and Border Security.3 Mainly electricity and water supply.4 Includes Public Services, Statistics, Royal Customs and Excise,
Inland Revenue Departments and Ministry of Foreign Affairs.5 Estimated actual.6 Revised estimate.7 Budget allocation (excludes RM2,000 million contingency reserve).
4.6 — PERBELANJAAN PEMBANGUNAN 4.6 — FEDERAL GOVERNMENTKERAJAAN PERSEKUTUAN1 DEVELOPMENT EXPENDITURE1
RM juta RM million
1997 % 1998 % 1999 % 20005 % 20016 % 20027 %
KESELAMATAN 2,314 14.7 1,380 7.6 3,122 13.8 2,332 8.3 2,842 8.9 2,980 10.5SECURITY (– 5.1) (– 40.4) (126.2) (– 25.3) (21.9) (4.9)
Pertahanan 1,814 11.5 1,017 5.6 2,792 12.3 1,854 6.6 2,288 7.1 2,276 8.0Defence
Keselamatan dalam negeri2 500 3.2 363 2.0 330 1.5 478 1.7 554 1.7 704 2.5Internal security2
PERKHIDMATAN SOSIAL 4,919 31.2 5,783 31.9 6,936 30.7 11,076 39.6 14,618 45.6 10,992 38.7SOCIAL SERVICES (23.5) (17.6) (19.9) (59.7) (32.0) (– 24.8)
Pendidikan 2,521 16.0 2,915 16.1 3,865 17.1 7,099 25.4 9,630 30.0 5,905 20.8Education
Kesihatan 449 2.9 716 4.0 836 3.7 1,272 4.6 1,098 3.4 1,273 4.5Health
Perumahan 735 4.7 1,030 5.7 1,081 4.8 1,194 4.3 1,922 6.0 1,820 6.4Housing
Lain-lain 1,214 7.7 1,122 6.2 1,154 5.1 1,511 5.4 1,968 6.1 1,994 7.0Others
PERKHIDMATAN EKONOMI 7,501 47.6 9,243 51.1 8,969 39.7 11,639 41.7 11,614 36.2 11,798 41.6ECONOMIC SERVICES (– 2.5) (23.2) (– 3.0) (29.8) (– 0.2) (1.6)
Pertanian dan pembangunan 1,105 7.0 960 5.3 1,088 4.8 1,183 4.2 2,314 7.2 2,942 10.4luar bandarAgriculture and ruraldevelopment
Kemudahan awam3 1,496 9.5 1,968 10.9 1,850 8.2 1,517 5.4 878 2.7 2,503 8.8Public utilities3
Perdagangan dan perindustrian 1,285 8.2 3,227 17.8 2,798 12.4 3,667 13.1 4,380 13.7 2,414 8.5Trade and industry
Pengangkutan 3,578 22.7 3,062 16.9 2,893 12.8 4,863 17.4 3,986 12.4 3,514 12.4Transport
Perhubungan 4 0.0 3 0.0 289 1.3 228 0.8 12 0.0 52 0.2Communications
Lain-lain 33 0.2 23 0.1 51 0.2 181 0.6 44 0.1 373 1.3Others
PENTADBIRAN AM4 1,015 6.4 1,697 9.4 3,587 15.9 2,894 10.4 2,984 9.3 2,612 9.2GENERAL ADMINISTRATION4 (97.9) (67.2) (111.4) (– 19.3) (3.1) (– 12.5)
Jumlah 15,749 100.0 18,103 100.0 22,614 100.0 27,941 100.0 32,058 100.0 28,382 100.0Total (7.7) (14.9) (24.9) (23.6) (14.7) (– 11.5)
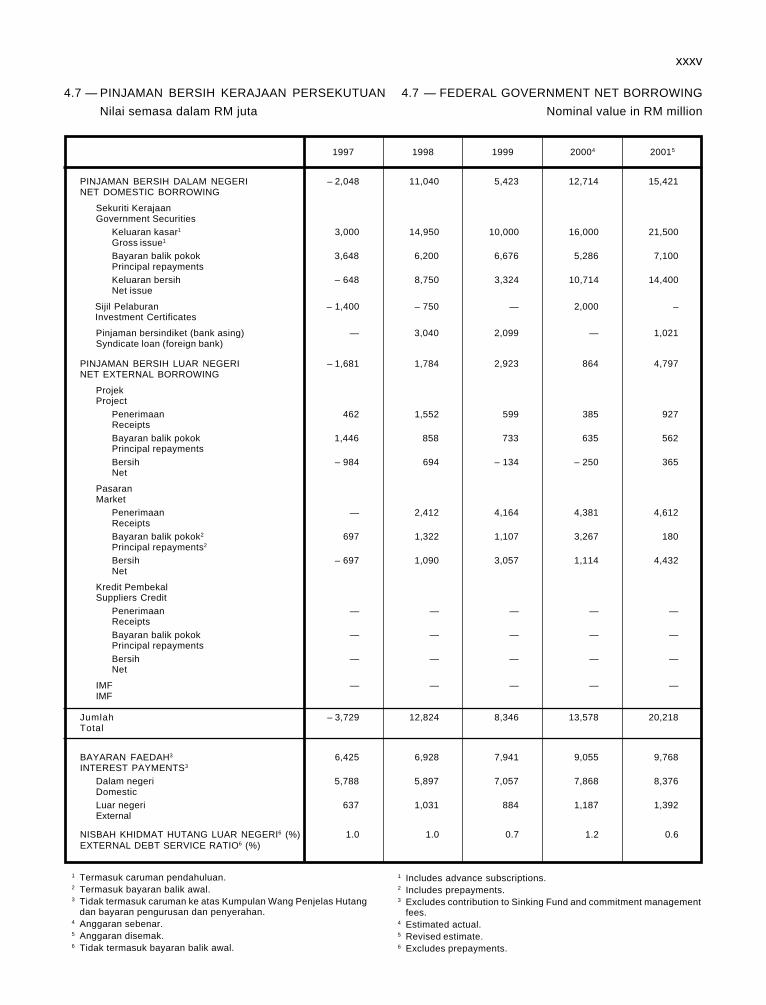
xxxv
4.7 — PINJAMAN BERSIH KERAJAAN PERSEKUTUAN 4.7 — FEDERAL GOVERNMENT NET BORROWING
Nilai semasa dalam RM juta Nominal value in RM million
1997 1998 1999 20004 20015
PINJAMAN BERSIH DALAM NEGERI – 2,048 11,040 5,423 12,714 15,421NET DOMESTIC BORROWING
Sekuriti KerajaanGovernment Securities
Keluaran kasar1 3,000 14,950 10,000 16,000 21,500Gross issue1
Bayaran balik pokok 3,648 6,200 6,676 5,286 7,100Principal repaymentsKeluaran bersih – 648 8,750 3,324 10,714 14,400Net issue
Sijil Pelaburan – 1,400 – 750 — 2,000 – Investment Certificates
Pinjaman bersindiket (bank asing) — 3,040 2,099 — 1,021Syndicate loan (foreign bank)
PINJAMAN BERSIH LUAR NEGERI – 1,681 1,784 2,923 864 4,797NET EXTERNAL BORROWING
ProjekProject
Penerimaan 462 1,552 599 385 927ReceiptsBayaran balik pokok 1,446 858 733 635 562Principal repaymentsBersih – 984 694 – 134 – 250 365Net
PasaranMarket
Penerimaan — 2,412 4,164 4,381 4,612ReceiptsBayaran balik pokok2 697 1,322 1,107 3,267 180Principal repayments2
Bersih – 697 1,090 3,057 1,114 4,432Net
Kredit PembekalSuppliers Credit
Penerimaan — — — — —ReceiptsBayaran balik pokok — — — — —Principal repaymentsBersih — — — — —Net
IMF — — — — —IMF
Jumlah – 3,729 12,824 8,346 13,578 20,218Total
BAYARAN FAEDAH3 6,425 6,928 7,941 9,055 9,768INTEREST PAYMENTS3
Dalam negeri 5,788 5,897 7,057 7,868 8,376DomesticLuar negeri 637 1,031 884 1,187 1,392External
NISBAH KHIDMAT HUTANG LUAR NEGERI6 (%) 1.0 1.0 0.7 1.2 0.6EXTERNAL DEBT SERVICE RATIO6 (%)
1 Termasuk caruman pendahuluan.2 Termasuk bayaran balik awal.3 Tidak termasuk caruman ke atas Kumpulan Wang Penjelas Hutang
dan bayaran pengurusan dan penyerahan.4 Anggaran sebenar.5 Anggaran disemak.6 Tidak termasuk bayaran balik awal.
1 Includes advance subscriptions.2 Includes prepayments.3 Excludes contribution to Sinking Fund and commitment management
fees.4 Estimated actual.5 Revised estimate.6 Excludes prepayments.
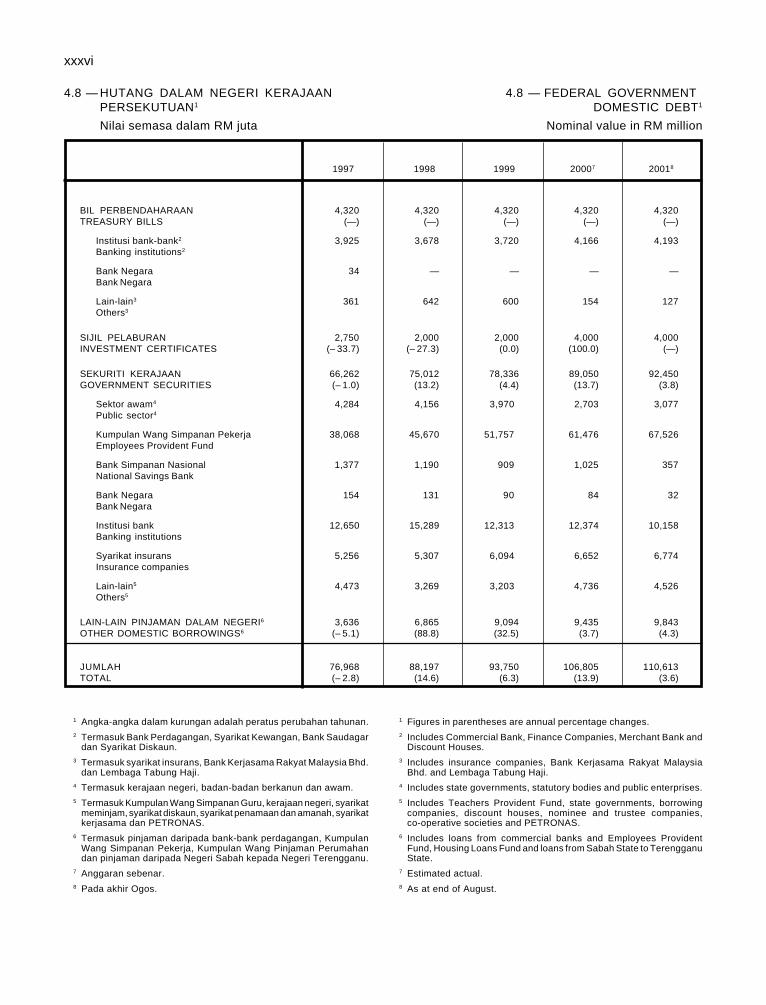
xxxvi
4.8 — HUTANG DALAM NEGERI KERAJAAN 4.8 — FEDERAL GOVERNMENTPERSEKUTUAN1 DOMESTIC DEBT1
Nilai semasa dalam RM juta Nominal value in RM million
1997 1998 1999 20007 20018
BIL PERBENDAHARAAN 4,320 4,320 4,320 4,320 4,320TREASURY BILLS (—) (—) (—) (—) (—)
Institusi bank-bank2 3,925 3,678 3,720 4,166 4,193Banking institutions2
Bank Negara 34 — — — —Bank Negara
Lain-lain3 361 642 600 154 127Others3
SIJIL PELABURAN 2,750 2,000 2,000 4,000 4,000INVESTMENT CERTIFICATES (– 33.7) (– 27.3) (0.0) (100.0) (—)
SEKURITI KERAJAAN 66,262 75,012 78,336 89,050 92,450GOVERNMENT SECURITIES (– 1.0) (13.2) (4.4) (13.7) (3.8)
Sektor awam4 4,284 4,156 3,970 2,703 3,077Public sector4
Kumpulan Wang Simpanan Pekerja 38,068 45,670 51,757 61,476 67,526Employees Provident Fund
Bank Simpanan Nasional 1,377 1,190 909 1,025 357National Savings Bank
Bank Negara 154 131 90 84 32Bank Negara
Institusi bank 12,650 15,289 12,313 12,374 10,158Banking institutions
Syarikat insurans 5,256 5,307 6,094 6,652 6,774Insurance companies
Lain-lain5 4,473 3,269 3,203 4,736 4,526Others5
LAIN-LAIN PINJAMAN DALAM NEGERI6 3,636 6,865 9,094 9,435 9,843OTHER DOMESTIC BORROWINGS6 (– 5.1) (88.8) (32.5) (3.7) (4.3)
JUMLAH 76,968 88,197 93,750 106,805 110,613TOTAL (– 2.8) (14.6) (6.3) (13.9) (3.6)
1 Angka-angka dalam kurungan adalah peratus perubahan tahunan.2 Termasuk Bank Perdagangan, Syarikat Kewangan, Bank Saudagar
dan Syarikat Diskaun.3 Termasuk syarikat insurans, Bank Kerjasama Rakyat Malaysia Bhd.
dan Lembaga Tabung Haji.4 Termasuk kerajaan negeri, badan-badan berkanun dan awam.5 Termasuk Kumpulan Wang Simpanan Guru, kerajaan negeri, syarikat
meminjam, syarikat diskaun, syarikat penamaan dan amanah, syarikatkerjasama dan PETRONAS.
6 Termasuk pinjaman daripada bank-bank perdagangan, KumpulanWang Simpanan Pekerja, Kumpulan Wang Pinjaman Perumahandan pinjaman daripada Negeri Sabah kepada Negeri Terengganu.
7 Anggaran sebenar.8 Pada akhir Ogos.
1 Figures in parentheses are annual percentage changes.2 Includes Commercial Bank, Finance Companies, Merchant Bank and
Discount Houses.3 Includes insurance companies, Bank Kerjasama Rakyat Malaysia
Bhd. and Lembaga Tabung Haji.4 Includes state governments, statutory bodies and public enterprises.5 Includes Teachers Provident Fund, state governments, borrowing
companies, discount houses, nominee and trustee companies,co-operative societies and PETRONAS.
6 Includes loans from commercial banks and Employees ProvidentFund, Housing Loans Fund and loans from Sabah State to TerengganuState.
7 Estimated actual.8 As at end of August.
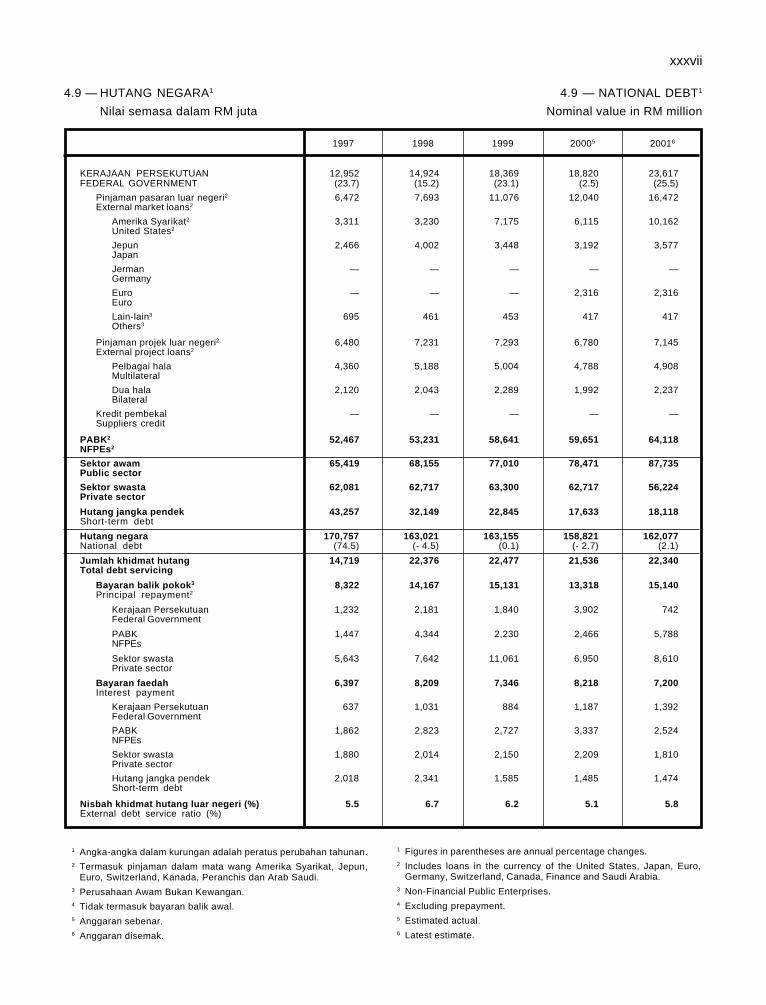
xxxvii
4.9 — HUTANG NEGARA1 4.9 — NATIONAL DEBT1
Nilai semasa dalam RM juta Nominal value in RM million
1997 1998 1999 20005 20016
KERAJAAN PERSEKUTUAN 12,952 14,924 18,369 18,820 23,617FEDERAL GOVERNMENT (23.7) (15.2) (23.1) (2.5) (25.5)
Pinjaman pasaran luar negeri2 6,472 7,693 11,076 12,040 16,472External market loans2
Amerika Syarikat2 3,311 3,230 7,175 6,115 10,162United States2
Jepun 2,466 4,002 3,448 3,192 3,577Japan
Jerman — — — — —Germany
Euro — — — 2,316 2,316Euro
Lain-lain3 695 461 453 417 417Others3
Pinjaman projek luar negeri2 6,480 7,231 7,293 6,780 7,145External project loans2
Pelbagai hala 4,360 5,188 5,004 4,788 4,908Multilateral
Dua hala 2,120 2,043 2,289 1,992 2,237Bilateral
Kredit pembekal — — — — —Suppliers credit
PABK2 52,467 53,231 58,641 59,651 64,118NFPEs2
Sektor awam 65,419 68,155 77,010 78,471 87,735Public sector
Sektor swasta 62,081 62,717 63,300 62,717 56,224Private sector
Hutang jangka pendek 43,257 32,149 22,845 17,633 18,118Short-term debt
Hutang negara 170,757 163,021 163,155 158,821 162,077National debt (74.5) (- 4.5) (0.1) (- 2.7) (2.1)
Jumlah khidmat hutang 14,719 22,376 22,477 21,536 22,340Total debt servicing
Bayaran balik pokok3 8,322 14,167 15,131 13,318 15,140Principal repayment2
Kerajaan Persekutuan 1,232 2,181 1,840 3,902 742Federal Government
PABK 1,447 4,344 2,230 2,466 5,788NFPEs
Sektor swasta 5,643 7,642 11,061 6,950 8,610Private sector
Bayaran faedah 6,397 8,209 7,346 8,218 7,200Interest payment
Kerajaan Persekutuan 637 1,031 884 1,187 1,392Federal Government
PABK 1,862 2,823 2,727 3,337 2,524NFPEs
Sektor swasta 1,880 2,014 2,150 2,209 1,810Private sector
Hutang jangka pendek 2,018 2,341 1,585 1,485 1,474Short-term debt
Nisbah khidmat hutang luar negeri (%) 5.5 6.7 6.2 5.1 5.8External debt service ratio (%)
1 Angka-angka dalam kurungan adalah peratus perubahan tahunan.2 Termasuk pinjaman dalam mata wang Amerika Syarikat, Jepun,
Euro, Switzerland, Kanada, Peranchis dan Arab Saudi.3 Perusahaan Awam Bukan Kewangan.4 Tidak termasuk bayaran balik awal.5 Anggaran sebenar.6 Anggaran disemak.
1 Figures in parentheses are annual percentage changes.2 Includes loans in the currency of the United States, Japan, Euro,
Germany, Switzerland, Canada, Finance and Saudi Arabia.3 Non-Financial Public Enterprises.4 Excluding prepayment.5 Estimated actual.6 Latest estimate.
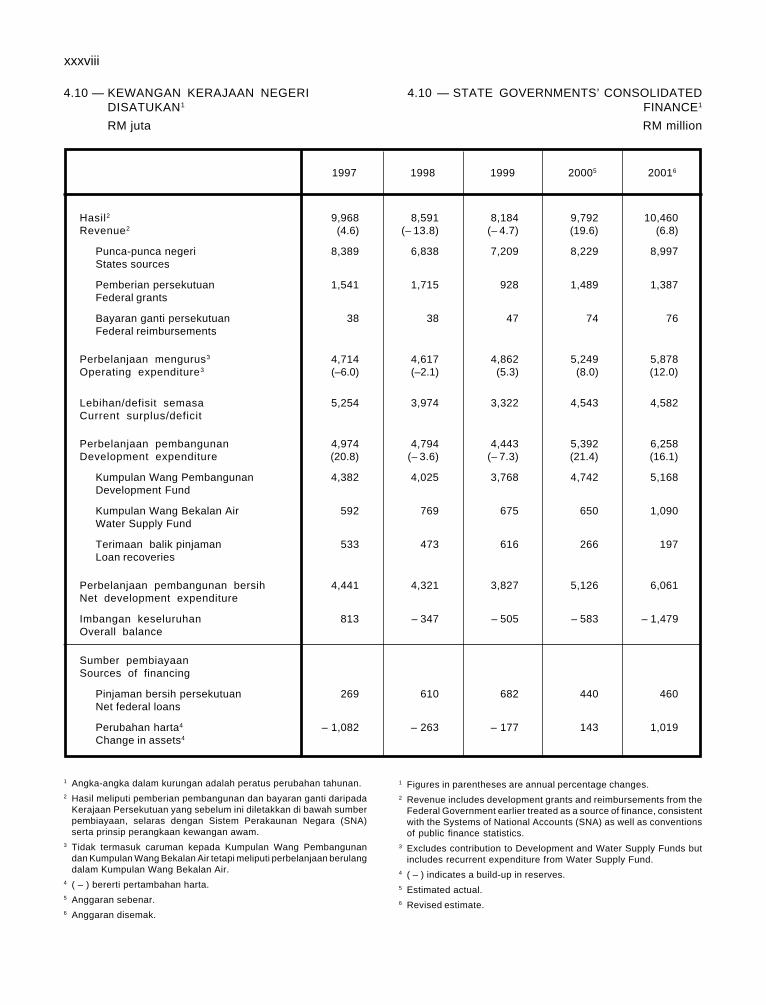
xxxviii
4.10 — KEWANGAN KERAJAAN NEGERI 4.10 — STATE GOVERNMENTS’ CONSOLIDATEDDISATUKAN1 FINANCE1
RM juta RM million
1997 1998 1999 20005 20016
Hasil2 9,968 8,591 8,184 9,792 10,460Revenue2 (4.6) (– 13.8) (– 4.7) (19.6) (6.8)
Punca-punca negeri 8,389 6,838 7,209 8,229 8,997States sources
Pemberian persekutuan 1,541 1,715 928 1,489 1,387Federal grants
Bayaran ganti persekutuan 38 38 47 74 76Federal reimbursements
Perbelanjaan mengurus3 4,714 4,617 4,862 5,249 5,878Operating expenditure3 (–6.0) (–2.1) (5.3) (8.0) (12.0)
Lebihan/defisit semasa 5,254 3,974 3,322 4,543 4,582Current surplus/deficit
Perbelanjaan pembangunan 4,974 4,794 4,443 5,392 6,258Development expenditure (20.8) (– 3.6) (– 7.3) (21.4) (16.1)
Kumpulan Wang Pembangunan 4,382 4,025 3,768 4,742 5,168Development Fund
Kumpulan Wang Bekalan Air 592 769 675 650 1,090Water Supply Fund
Terimaan balik pinjaman 533 473 616 266 197Loan recoveries
Perbelanjaan pembangunan bersih 4,441 4,321 3,827 5,126 6,061Net development expenditure
Imbangan keseluruhan 813 – 347 – 505 – 583 – 1,479Overall balance
Sumber pembiayaanSources of financing
Pinjaman bersih persekutuan 269 610 682 440 460Net federal loans
Perubahan harta4 – 1,082 – 263 – 177 143 1,019Change in assets4
1 Figures in parentheses are annual percentage changes.2 Revenue includes development grants and reimbursements from the
Federal Government earlier treated as a source of finance, consistentwith the Systems of National Accounts (SNA) as well as conventionsof public finance statistics.
3 Excludes contribution to Development and Water Supply Funds butincludes recurrent expenditure from Water Supply Fund.
4 ( – ) indicates a build-up in reserves.5 Estimated actual.6 Revised estimate.
1 Angka-angka dalam kurungan adalah peratus perubahan tahunan.2 Hasil meliputi pemberian pembangunan dan bayaran ganti daripada
Kerajaan Persekutuan yang sebelum ini diletakkan di bawah sumberpembiayaan, selaras dengan Sistem Perakaunan Negara (SNA)serta prinsip perangkaan kewangan awam.
3 Tidak termasuk caruman kepada Kumpulan Wang Pembangunandan Kumpulan Wang Bekalan Air tetapi meliputi perbelanjaan berulangdalam Kumpulan Wang Bekalan Air.
4 ( – ) bererti pertambahan harta.5 Anggaran sebenar.6 Anggaran disemak.
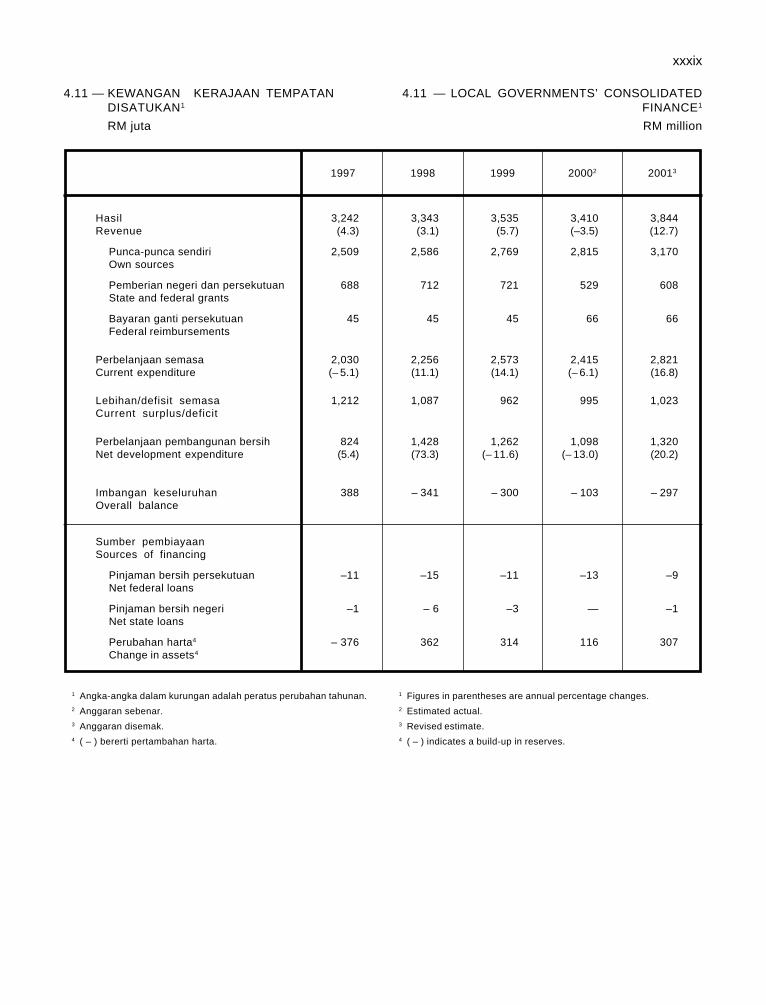
xxxix
1 Angka-angka dalam kurungan adalah peratus perubahan tahunan.2 Anggaran sebenar.3 Anggaran disemak.4 ( – ) bererti pertambahan harta.
1 Figures in parentheses are annual percentage changes.2 Estimated actual.3 Revised estimate.4 ( – ) indicates a build-up in reserves.
4.11 — KEWANGAN KERAJAAN TEMPATAN 4.11 — LOCAL GOVERNMENTS’ CONSOLIDATEDDISATUKAN1 FINANCE1
RM juta RM million
1997 1998 1999 20002 20013
Hasil 3,242 3,343 3,535 3,410 3,844Revenue (4.3) (3.1) (5.7) (–3.5) (12.7)
Punca-punca sendiri 2,509 2,586 2,769 2,815 3,170Own sources
Pemberian negeri dan persekutuan 688 712 721 529 608State and federal grants
Bayaran ganti persekutuan 45 45 45 66 66Federal reimbursements
Perbelanjaan semasa 2,030 2,256 2,573 2,415 2,821Current expenditure (– 5.1) (11.1) (14.1) (– 6.1) (16.8)
Lebihan/defisit semasa 1,212 1,087 962 995 1,023Current surplus/deficit
Perbelanjaan pembangunan bersih 824 1,428 1,262 1,098 1,320Net development expenditure (5.4) (73.3) (– 11.6) (– 13.0) (20.2)
Imbangan keseluruhan 388 – 341 – 300 – 103 – 297Overall balance
Sumber pembiayaanSources of financing
Pinjaman bersih persekutuan –11 –15 –11 –13 –9Net federal loans
Pinjaman bersih negeri –1 – 6 –3 — –1Net state loans
Perubahan harta4 – 376 362 314 116 307Change in assets4
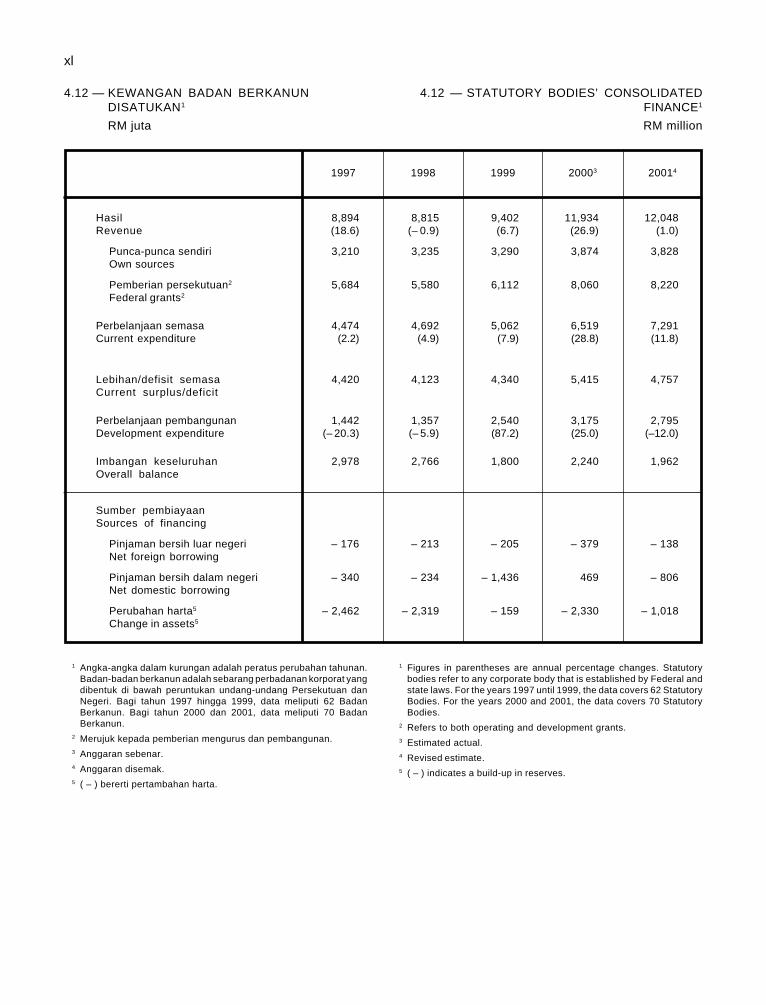
xl
4.12 — KEWANGAN BADAN BERKANUN 4.12 — STATUTORY BODIES’ CONSOLIDATEDDISATUKAN1 FINANCE1
RM juta RM million
1997 1998 1999 20003 20014
Hasil 8,894 8,815 9,402 11,934 12,048Revenue (18.6) (– 0.9) (6.7) (26.9) (1.0)
Punca-punca sendiri 3,210 3,235 3,290 3,874 3,828Own sources
Pemberian persekutuan2 5,684 5,580 6,112 8,060 8,220Federal grants2
Perbelanjaan semasa 4,474 4,692 5,062 6,519 7,291Current expenditure (2.2) (4.9) (7.9) (28.8) (11.8)
Lebihan/defisit semasa 4,420 4,123 4,340 5,415 4,757Current surplus/deficit
Perbelanjaan pembangunan 1,442 1,357 2,540 3,175 2,795Development expenditure (– 20.3) (– 5.9) (87.2) (25.0) (–12.0)
Imbangan keseluruhan 2,978 2,766 1,800 2,240 1,962Overall balance
Sumber pembiayaanSources of financing
Pinjaman bersih luar negeri – 176 – 213 – 205 – 379 – 138Net foreign borrowing
Pinjaman bersih dalam negeri – 340 – 234 – 1,436 469 – 806Net domestic borrowing
Perubahan harta5 – 2,462 – 2,319 – 159 – 2,330 – 1,018Change in assets5
1 Figures in parentheses are annual percentage changes. Statutorybodies refer to any corporate body that is established by Federal andstate laws. For the years 1997 until 1999, the data covers 62 StatutoryBodies. For the years 2000 and 2001, the data covers 70 StatutoryBodies.
2 Refers to both operating and development grants.3 Estimated actual.4 Revised estimate.5 ( – ) indicates a build-up in reserves.
1 Angka-angka dalam kurungan adalah peratus perubahan tahunan.Badan-badan berkanun adalah sebarang perbadanan korporat yangdibentuk di bawah peruntukan undang-undang Persekutuan danNegeri. Bagi tahun 1997 hingga 1999, data meliputi 62 BadanBerkanun. Bagi tahun 2000 dan 2001, data meliputi 70 BadanBerkanun.
2 Merujuk kepada pemberian mengurus dan pembangunan.3 Anggaran sebenar.4 Anggaran disemak.5 ( – ) bererti pertambahan harta.
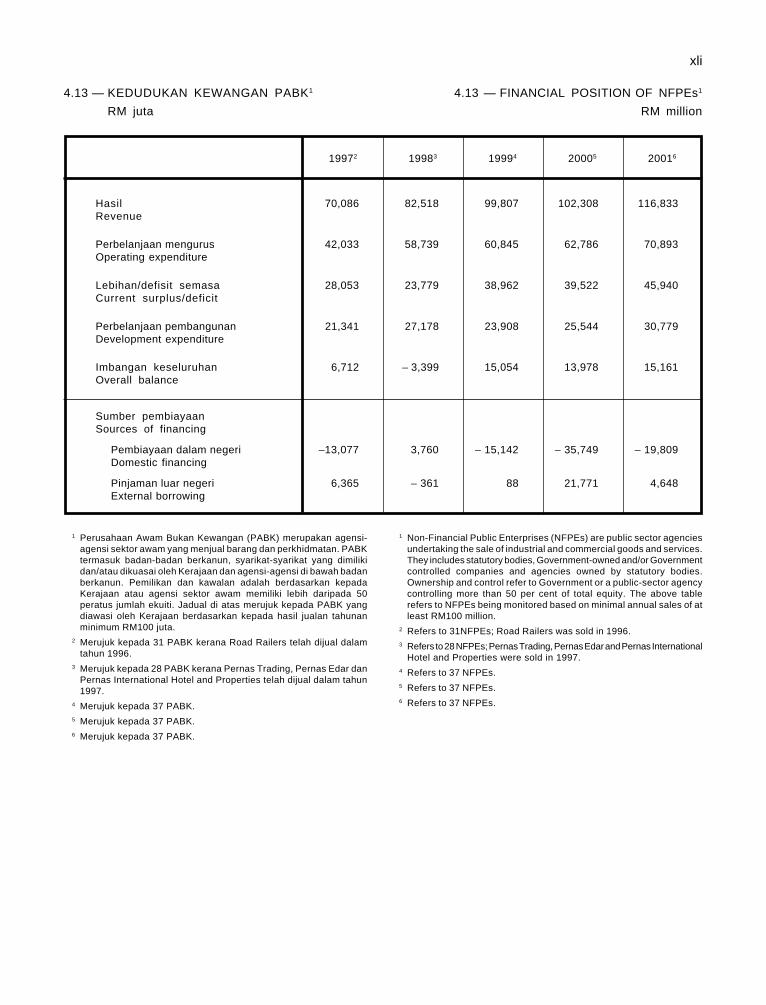
xli
1 Perusahaan Awam Bukan Kewangan (PABK) merupakan agensi-agensi sektor awam yang menjual barang dan perkhidmatan. PABKtermasuk badan-badan berkanun, syarikat-syarikat yang dimilikidan/atau dikuasai oleh Kerajaan dan agensi-agensi di bawah badanberkanun. Pemilikan dan kawalan adalah berdasarkan kepadaKerajaan atau agensi sektor awam memiliki lebih daripada 50peratus jumlah ekuiti. Jadual di atas merujuk kepada PABK yangdiawasi oleh Kerajaan berdasarkan kepada hasil jualan tahunanminimum RM100 juta.
2 Merujuk kepada 31 PABK kerana Road Railers telah dijual dalamtahun 1996.
3 Merujuk kepada 28 PABK kerana Pernas Trading, Pernas Edar danPernas International Hotel and Properties telah dijual dalam tahun1997.
4 Merujuk kepada 37 PABK.5 Merujuk kepada 37 PABK.6 Merujuk kepada 37 PABK.
1 Non-Financial Public Enterprises (NFPEs) are public sector agenciesundertaking the sale of industrial and commercial goods and services.They includes statutory bodies, Government-owned and/or Governmentcontrolled companies and agencies owned by statutory bodies.Ownership and control refer to Government or a public-sector agencycontrolling more than 50 per cent of total equity. The above tablerefers to NFPEs being monitored based on minimal annual sales of atleast RM100 million.
2 Refers to 31NFPEs; Road Railers was sold in 1996.3 Refers to 28 NFPEs; Pernas Trading, Pernas Edar and Pernas International
Hotel and Properties were sold in 1997.4 Refers to 37 NFPEs.5 Refers to 37 NFPEs.6 Refers to 37 NFPEs.
4.13 — KEDUDUKAN KEWANGAN PABK1 4.13 — FINANCIAL POSITION OF NFPEs1
RM juta RM million
19972 19983 19994 20005 20016
Hasil 70,086 82,518 99,807 102,308 116,833Revenue
Perbelanjaan mengurus 42,033 58,739 60,845 62,786 70,893Operating expenditure
Lebihan/defisit semasa 28,053 23,779 38,962 39,522 45,940Current surplus/deficit
Perbelanjaan pembangunan 21,341 27,178 23,908 25,544 30,779Development expenditure
Imbangan keseluruhan 6,712 – 3,399 15,054 13,978 15,161Overall balance
Sumber pembiayaanSources of financing
Pembiayaan dalam negeri –13,077 3,760 – 15,142 – 35,749 – 19,809Domestic financing
Pinjaman luar negeri 6,365 – 361 88 21,771 4,648External borrowing
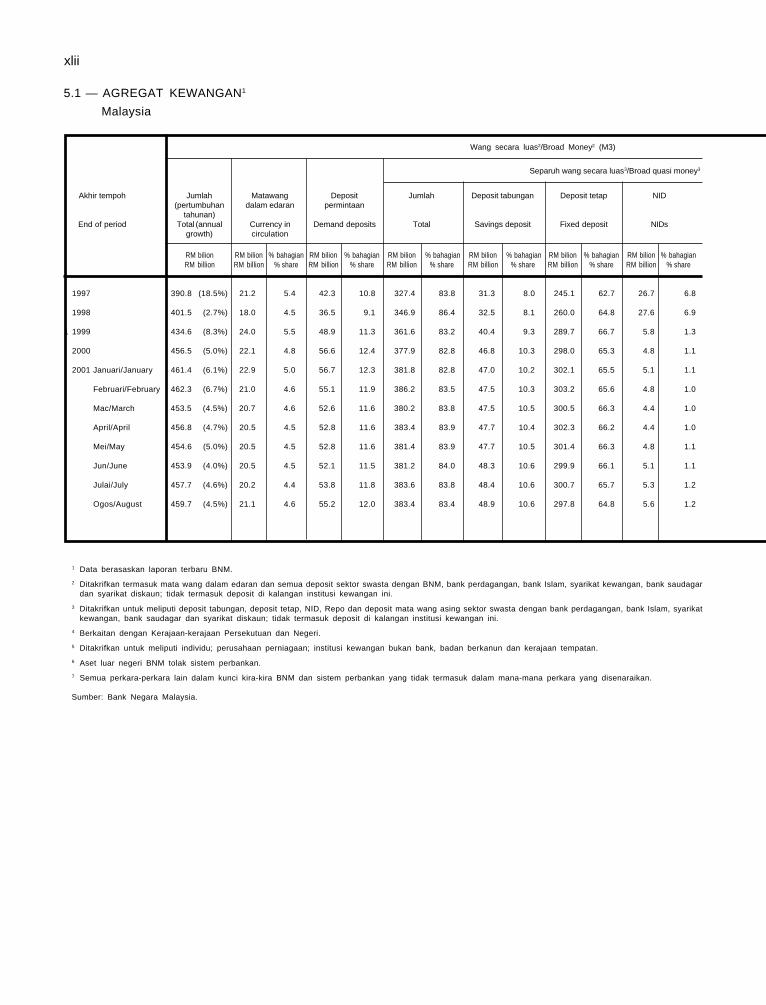
xlii
RM bilion RM bilion % bahagian RM bilion % bahagian RM bilion % bahagian RM bilion % bahagian RM bilion % bahagian RM bilion % bahagianRM billion RM billion % share RM billion % share RM billion % share RM billion % share RM billion % share RM billion % share
1997 390.8 (18.5%) 21.2 5.4 42.3 10.8 327.4 83.8 31.3 8.0 245.1 62.7 26.7 6.8
1998 401.5 (2.7%) 18.0 4.5 36.5 9.1 346.9 86.4 32.5 8.1 260.0 64.8 27.6 6.9
1 1999 434.6 (8.3%) 24.0 5.5 48.9 11.3 361.6 83.2 40.4 9.3 289.7 66.7 5.8 1.3
2000 456.5 (5.0%) 22.1 4.8 56.6 12.4 377.9 82.8 46.8 10.3 298.0 65.3 4.8 1.1
2001 Januari/January 461.4 (6.1%) 22.9 5.0 56.7 12.3 381.8 82.8 47.0 10.2 302.1 65.5 5.1 1.1
Februari/February 462.3 (6.7%) 21.0 4.6 55.1 11.9 386.2 83.5 47.5 10.3 303.2 65.6 4.8 1.0
Mac/March 453.5 (4.5%) 20.7 4.6 52.6 11.6 380.2 83.8 47.5 10.5 300.5 66.3 4.4 1.0
April/April 456.8 (4.7%) 20.5 4.5 52.8 11.6 383.4 83.9 47.7 10.4 302.3 66.2 4.4 1.0
Mei/May 454.6 (5.0%) 20.5 4.5 52.8 11.6 381.4 83.9 47.7 10.5 301.4 66.3 4.8 1.1
Jun/June 453.9 (4.0%) 20.5 4.5 52.1 11.5 381.2 84.0 48.3 10.6 299.9 66.1 5.1 1.1
Julai/July 457.7 (4.6%) 20.2 4.4 53.8 11.8 383.6 83.8 48.4 10.6 300.7 65.7 5.3 1.2
Ogos/August 459.7 (4.5%) 21.1 4.6 55.2 12.0 383.4 83.4 48.9 10.6 297.8 64.8 5.6 1.2
5.1 — AGREGAT KEWANGAN1
Malaysia
Akhir tempoh Jumlah Matawang Deposit Jumlah Deposit tabungan Deposit tetap NID(pertumbuhan dalam edaran permintaan
tahunan)End of period Total (annual Currency in Demand deposits Total Savings deposit Fixed deposit NIDs
growth) circulation
Wang secara luas2/Broad Money2 (M3)
Separuh wang secara luas3/Broad quasi money3
1 Data berasaskan laporan terbaru BNM.
2 Ditakrifkan termasuk mata wang dalam edaran dan semua deposit sektor swasta dengan BNM, bank perdagangan, bank Islam, syarikat kewangan, bank saudagardan syarikat diskaun; tidak termasuk deposit di kalangan institusi kewangan ini.
3 Ditakrifkan untuk meliputi deposit tabungan, deposit tetap, NID, Repo dan deposit mata wang asing sektor swasta dengan bank perdagangan, bank Islam, syarikatkewangan, bank saudagar dan syarikat diskaun; tidak termasuk deposit di kalangan institusi kewangan ini.
4 Berkaitan dengan Kerajaan-kerajaan Persekutuan dan Negeri.
5 Ditakrifkan untuk meliputi individu; perusahaan perniagaan; institusi kewangan bukan bank, badan berkanun dan kerajaan tempatan.
6 Aset luar negeri BNM tolak sistem perbankan.
7 Semua perkara-perkara lain dalam kunci kira-kira BNM dan sistem perbankan yang tidak termasuk dalam mana-mana perkara yang disenaraikan.
Sumber: Bank Negara Malaysia.
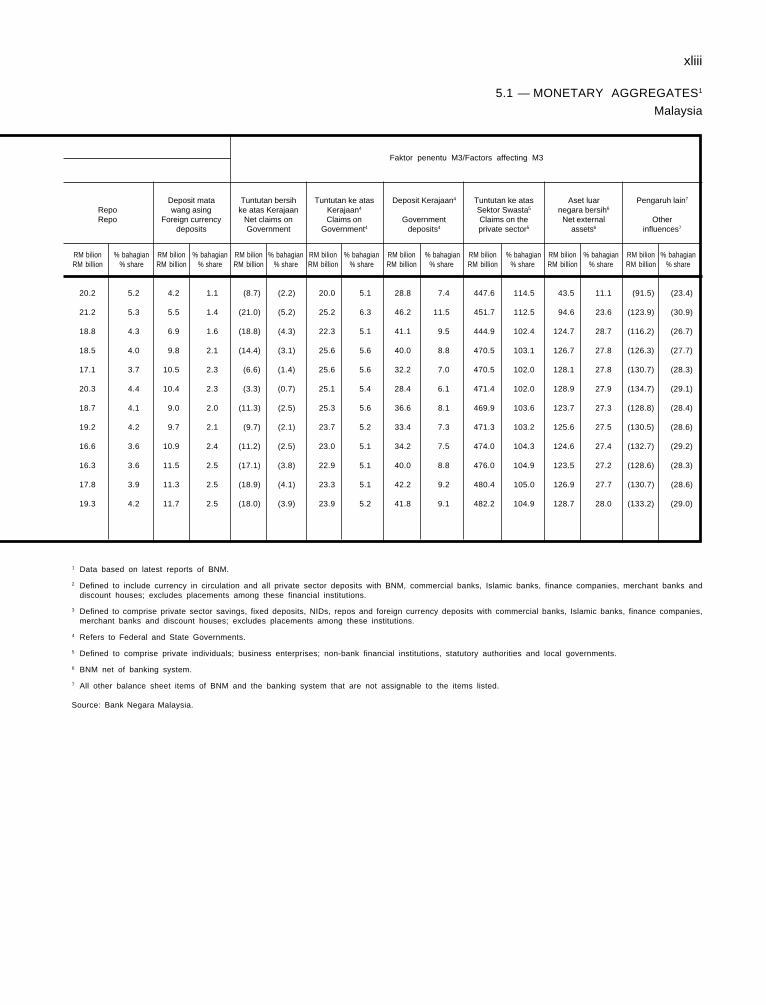
xliii
RM bilion % bahagian RM bilion % bahagian RM bilion % bahagian RM bilion % bahagian RM bilion % bahagian RM bilion % bahagian RM bilion % bahagian RM bilion % bahagianRM billion % share RM billion % share RM billion % share RM billion % share RM billion % share RM billion % share RM billion % share RM billion % share
20.2 5.2 4.2 1.1 (8.7) (2.2) 20.0 5.1 28.8 7.4 447.6 114.5 43.5 11.1 (91.5) (23.4)
21.2 5.3 5.5 1.4 (21.0) (5.2) 25.2 6.3 46.2 11.5 451.7 112.5 94.6 23.6 (123.9) (30.9)
18.8 4.3 6.9 1.6 (18.8) (4.3) 22.3 5.1 41.1 9.5 444.9 102.4 124.7 28.7 (116.2) (26.7)
18.5 4.0 9.8 2.1 (14.4) (3.1) 25.6 5.6 40.0 8.8 470.5 103.1 126.7 27.8 (126.3) (27.7)
17.1 3.7 10.5 2.3 (6.6) (1.4) 25.6 5.6 32.2 7.0 470.5 102.0 128.1 27.8 (130.7) (28.3)
20.3 4.4 10.4 2.3 (3.3) (0.7) 25.1 5.4 28.4 6.1 471.4 102.0 128.9 27.9 (134.7) (29.1)
18.7 4.1 9.0 2.0 (11.3) (2.5) 25.3 5.6 36.6 8.1 469.9 103.6 123.7 27.3 (128.8) (28.4)
19.2 4.2 9.7 2.1 (9.7) (2.1) 23.7 5.2 33.4 7.3 471.3 103.2 125.6 27.5 (130.5) (28.6)
16.6 3.6 10.9 2.4 (11.2) (2.5) 23.0 5.1 34.2 7.5 474.0 104.3 124.6 27.4 (132.7) (29.2)
16.3 3.6 11.5 2.5 (17.1) (3.8) 22.9 5.1 40.0 8.8 476.0 104.9 123.5 27.2 (128.6) (28.3)
17.8 3.9 11.3 2.5 (18.9) (4.1) 23.3 5.1 42.2 9.2 480.4 105.0 126.9 27.7 (130.7) (28.6)
19.3 4.2 11.7 2.5 (18.0) (3.9) 23.9 5.2 41.8 9.1 482.2 104.9 128.7 28.0 (133.2) (29.0)
5.1 — MONETARY AGGREGATES1
Malaysia
Deposit mata Tuntutan bersih Tuntutan ke atas Deposit Kerajaan4 Tuntutan ke atas Aset luar Pengaruh lain7
Repo wang asing ke atas Kerajaan Kerajaan4 Sektor Swasta5 negara bersih6
Repo Foreign currency Net claims on Claims on Government Claims on the Net external Otherdeposits Government Government4 deposits4 private sector5 assets6 influences7
Faktor penentu M3/Factors affecting M3
1 Data based on latest reports of BNM.
2 Defined to include currency in circulation and all private sector deposits with BNM, commercial banks, Islamic banks, finance companies, merchant banks anddiscount houses; excludes placements among these financial institutions.
3 Defined to comprise private sector savings, fixed deposits, NIDs, repos and foreign currency deposits with commercial banks, Islamic banks, finance companies,merchant banks and discount houses; excludes placements among these institutions.
4 Refers to Federal and State Governments.
5 Defined to comprise private individuals; business enterprises; non-bank financial institutions, statutory authorities and local governments.
6 BNM net of banking system.
7 All other balance sheet items of BNM and the banking system that are not assignable to the items listed.
Source: Bank Negara Malaysia.
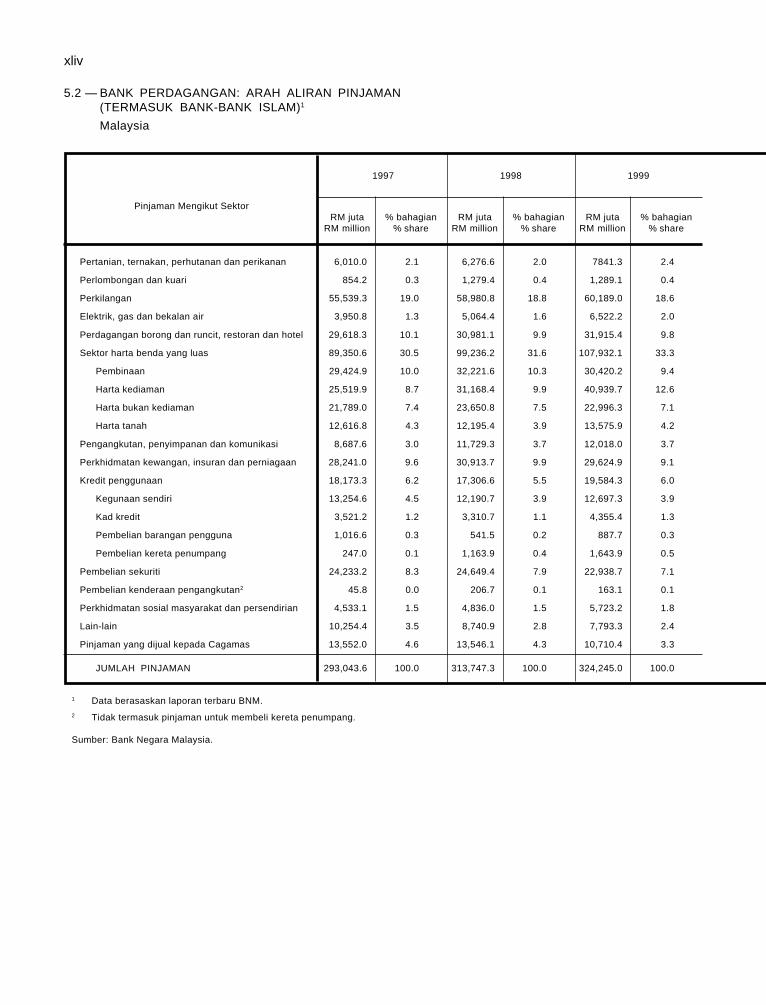
xliv
5.2 — BANK PERDAGANGAN: ARAH ALIRAN PINJAMAN(TERMASUK BANK-BANK ISLAM)1
Malaysia
1997 1998 1999
Pinjaman Mengikut SektorRM juta % bahagian RM juta % bahagian RM juta % bahagian
RM million % share RM million % share RM million % share
Pertanian, ternakan, perhutanan dan perikanan 6,010.0 2.1 6,276.6 2.0 7841.3 2.4
Perlombongan dan kuari 854.2 0.3 1,279.4 0.4 1,289.1 0.4
Perkilangan 55,539.3 19.0 58,980.8 18.8 60,189.0 18.6
Elektrik, gas dan bekalan air 3,950.8 1.3 5,064.4 1.6 6,522.2 2.0
Perdagangan borong dan runcit, restoran dan hotel 29,618.3 10.1 30,981.1 9.9 31,915.4 9.8
Sektor harta benda yang luas 89,350.6 30.5 99,236.2 31.6 107,932.1 33.3
Pembinaan 29,424.9 10.0 32,221.6 10.3 30,420.2 9.4
Harta kediaman 25,519.9 8.7 31,168.4 9.9 40,939.7 12.6
Harta bukan kediaman 21,789.0 7.4 23,650.8 7.5 22,996.3 7.1
Harta tanah 12,616.8 4.3 12,195.4 3.9 13,575.9 4.2
Pengangkutan, penyimpanan dan komunikasi 8,687.6 3.0 11,729.3 3.7 12,018.0 3.7
Perkhidmatan kewangan, insuran dan perniagaan 28,241.0 9.6 30,913.7 9.9 29,624.9 9.1
Kredit penggunaan 18,173.3 6.2 17,306.6 5.5 19,584.3 6.0
Kegunaan sendiri 13,254.6 4.5 12,190.7 3.9 12,697.3 3.9
Kad kredit 3,521.2 1.2 3,310.7 1.1 4,355.4 1.3
Pembelian barangan pengguna 1,016.6 0.3 541.5 0.2 887.7 0.3
Pembelian kereta penumpang 247.0 0.1 1,163.9 0.4 1,643.9 0.5
Pembelian sekuriti 24,233.2 8.3 24,649.4 7.9 22,938.7 7.1
Pembelian kenderaan pengangkutan2 45.8 0.0 206.7 0.1 163.1 0.1
Perkhidmatan sosial masyarakat dan persendirian 4,533.1 1.5 4,836.0 1.5 5,723.2 1.8
Lain-lain 10,254.4 3.5 8,740.9 2.8 7,793.3 2.4
Pinjaman yang dijual kepada Cagamas 13,552.0 4.6 13,546.1 4.3 10,710.4 3.3
JUMLAH PINJAMAN 293,043.6 100.0 313,747.3 100.0 324,245.0 100.0
1 Data berasaskan laporan terbaru BNM.2 Tidak termasuk pinjaman untuk membeli kereta penumpang.
Sumber: Bank Negara Malaysia.
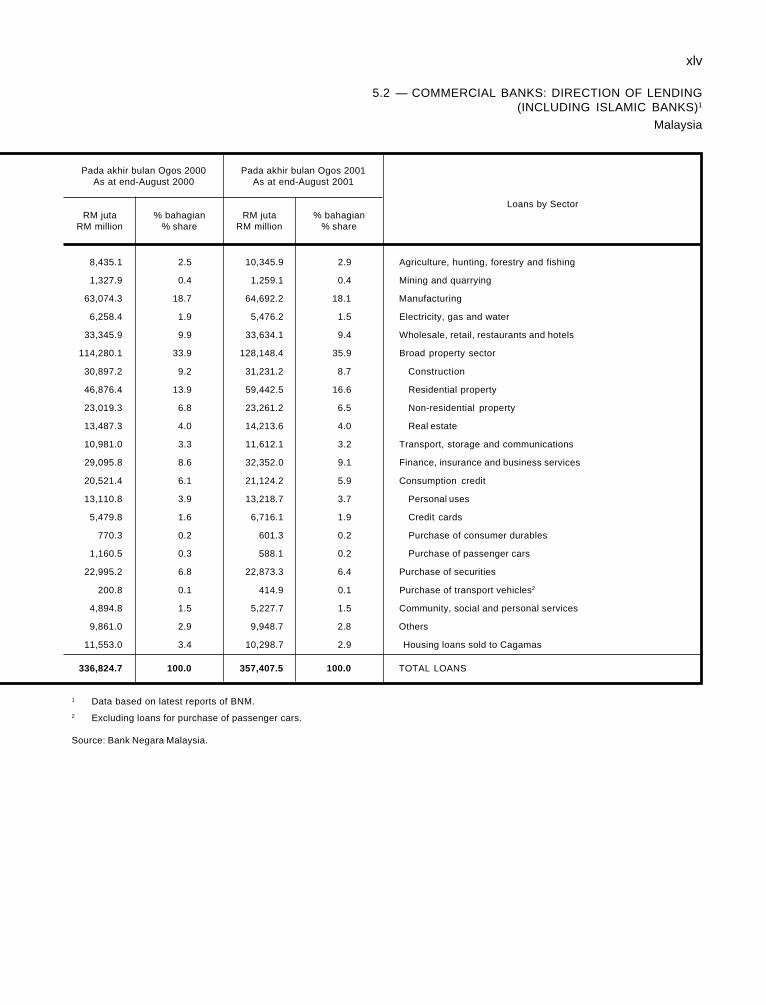
xlv
1 Data based on latest reports of BNM.2 Excluding loans for purchase of passenger cars.
Source: Bank Negara Malaysia.
5.2 — COMMERCIAL BANKS: DIRECTION OF LENDING(INCLUDING ISLAMIC BANKS)1
Malaysia
Pada akhir bulan Ogos 2000 Pada akhir bulan Ogos 2001As at end-August 2000 As at end-August 2001
Loans by SectorRM juta % bahagian RM juta % bahagian
RM million % share RM million % share
8,435.1 2.5 10,345.9 2.9 Agriculture, hunting, forestry and fishing
1,327.9 0.4 1,259.1 0.4 Mining and quarrying
63,074.3 18.7 64,692.2 18.1 Manufacturing
6,258.4 1.9 5,476.2 1.5 Electricity, gas and water
33,345.9 9.9 33,634.1 9.4 Wholesale, retail, restaurants and hotels
114,280.1 33.9 128,148.4 35.9 Broad property sector
30,897.2 9.2 31,231.2 8.7 Construction
46,876.4 13.9 59,442.5 16.6 Residential property
23,019.3 6.8 23,261.2 6.5 Non-residential property
13,487.3 4.0 14,213.6 4.0 Real estate
10,981.0 3.3 11,612.1 3.2 Transport, storage and communications
29,095.8 8.6 32,352.0 9.1 Finance, insurance and business services
20,521.4 6.1 21,124.2 5.9 Consumption credit
13,110.8 3.9 13,218.7 3.7 Personal uses
5,479.8 1.6 6,716.1 1.9 Credit cards
770.3 0.2 601.3 0.2 Purchase of consumer durables
1,160.5 0.3 588.1 0.2 Purchase of passenger cars
22,995.2 6.8 22,873.3 6.4 Purchase of securities
200.8 0.1 414.9 0.1 Purchase of transport vehicles2
4,894.8 1.5 5,227.7 1.5 Community, social and personal services
9,861.0 2.9 9,948.7 2.8 Others
11,553.0 3.4 10,298.7 2.9 Housing loans sold to Cagamas
336,824.7 100.0 357,407.5 100.0 TOTAL LOANS
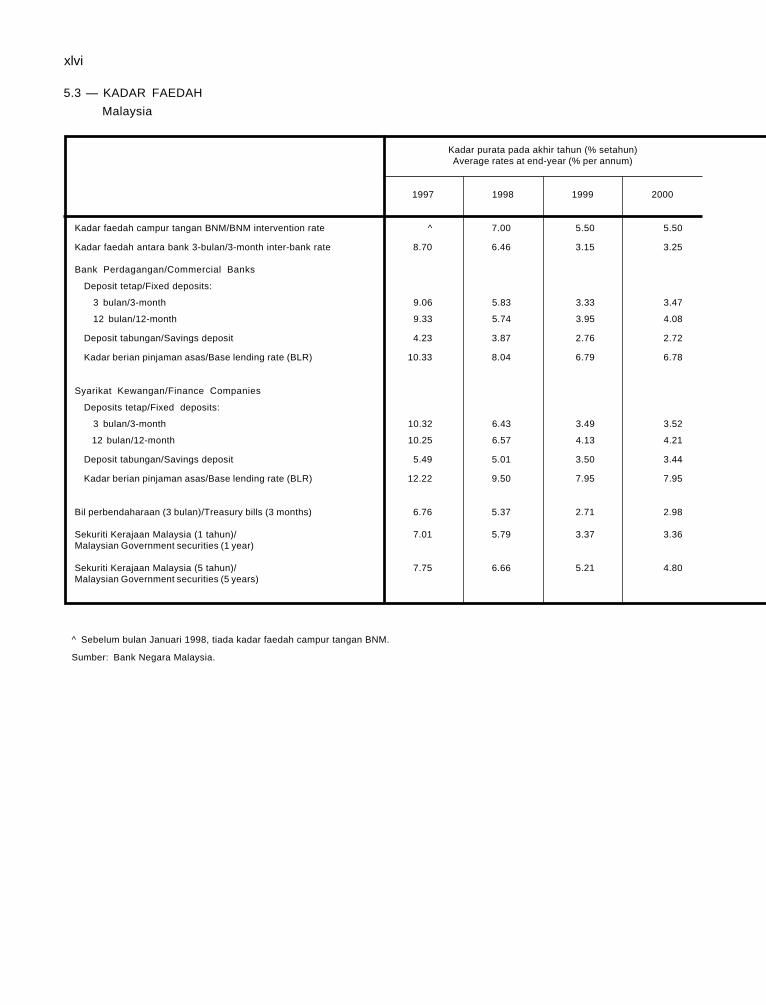
xlvi
Kadar purata pada akhir tahun (% setahun)Average rates at end-year (% per annum)
1997 1998 1999 2000
Kadar faedah campur tangan BNM/BNM intervention rate ^ 7.00 5.50 5.50
Kadar faedah antara bank 3-bulan/3-month inter-bank rate 8.70 6.46 3.15 3.25
Bank Perdagangan/Commercial Banks
Deposit tetap/Fixed deposits:
3 bulan/3-month 9.06 5.83 3.33 3.47
12 bulan/12-month 9.33 5.74 3.95 4.08
Deposit tabungan/Savings deposit 4.23 3.87 2.76 2.72
Kadar berian pinjaman asas/Base lending rate (BLR) 10.33 8.04 6.79 6.78
Syarikat Kewangan/Finance Companies
Deposits tetap/Fixed deposits:
3 bulan/3-month 10.32 6.43 3.49 3.52
12 bulan/12-month 10.25 6.57 4.13 4.21
Deposit tabungan/Savings deposit 5.49 5.01 3.50 3.44
Kadar berian pinjaman asas/Base lending rate (BLR) 12.22 9.50 7.95 7.95
Bil perbendaharaan (3 bulan)/Treasury bills (3 months) 6.76 5.37 2.71 2.98
Sekuriti Kerajaan Malaysia (1 tahun)/ 7.01 5.79 3.37 3.36Malaysian Government securities (1 year)
Sekuriti Kerajaan Malaysia (5 tahun)/ 7.75 6.66 5.21 4.80Malaysian Government securities (5 years)
5.3 — KADAR FAEDAH
Malaysia
^ Sebelum bulan Januari 1998, tiada kadar faedah campur tangan BNM.
Sumber: Bank Negara Malaysia.
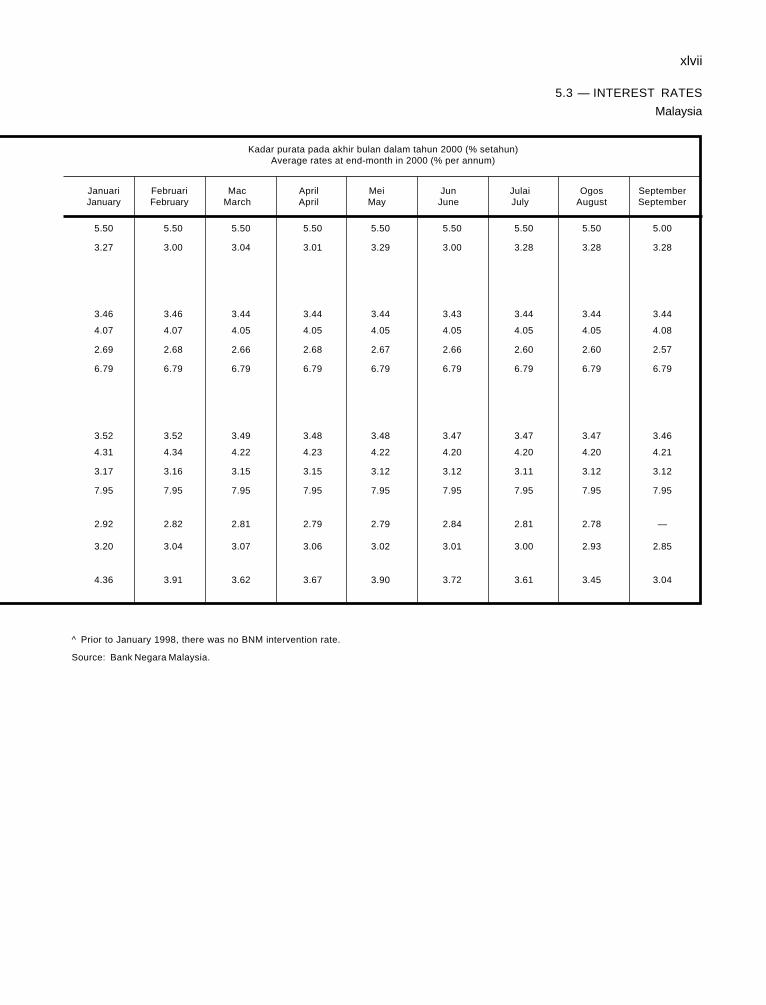
xlvii
5.3 — INTEREST RATES
Malaysia
Kadar purata pada akhir bulan dalam tahun 2000 (% setahun)Average rates at end-month in 2000 (% per annum)
Januari Februari Mac April Mei Jun Julai Ogos SeptemberJanuary February March April May June July August September
5.50 5.50 5.50 5.50 5.50 5.50 5.50 5.50 5.00
3.27 3.00 3.04 3.01 3.29 3.00 3.28 3.28 3.28
3.46 3.46 3.44 3.44 3.44 3.43 3.44 3.44 3.44
4.07 4.07 4.05 4.05 4.05 4.05 4.05 4.05 4.08
2.69 2.68 2.66 2.68 2.67 2.66 2.60 2.60 2.57
6.79 6.79 6.79 6.79 6.79 6.79 6.79 6.79 6.79
3.52 3.52 3.49 3.48 3.48 3.47 3.47 3.47 3.46
4.31 4.34 4.22 4.23 4.22 4.20 4.20 4.20 4.21
3.17 3.16 3.15 3.15 3.12 3.12 3.11 3.12 3.12
7.95 7.95 7.95 7.95 7.95 7.95 7.95 7.95 7.95
2.92 2.82 2.81 2.79 2.79 2.84 2.81 2.78 —
3.20 3.04 3.07 3.06 3.02 3.01 3.00 2.93 2.85
4.36 3.91 3.62 3.67 3.90 3.72 3.61 3.45 3.04
^ Prior to January 1998, there was no BNM intervention rate.
Source: Bank Negara Malaysia.
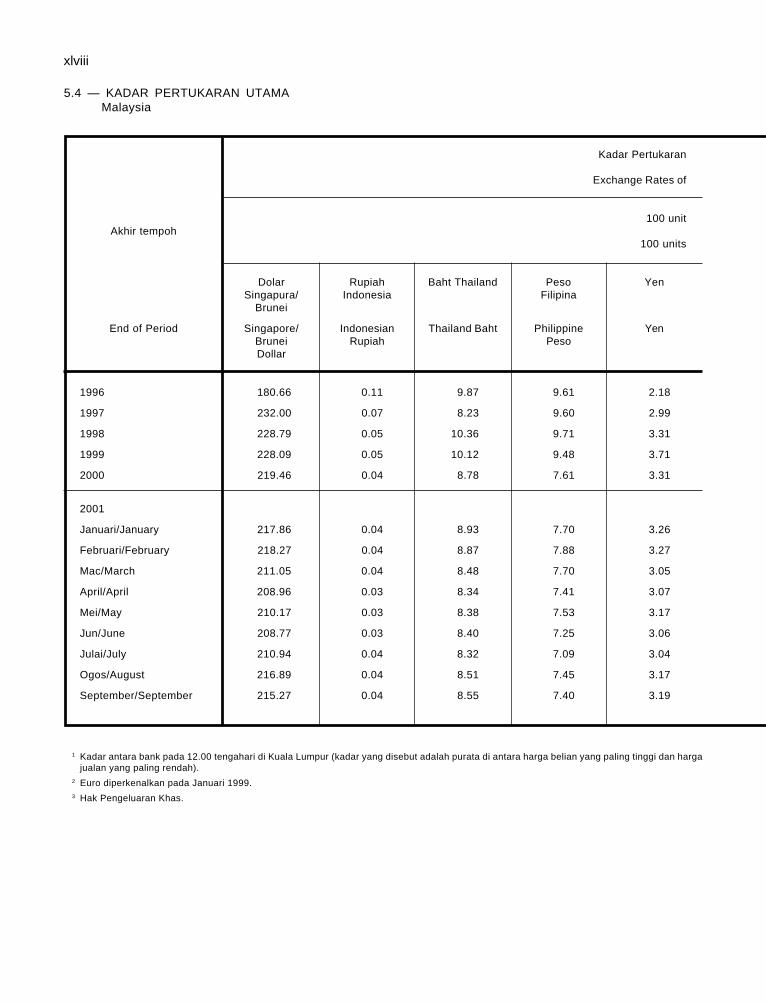
xlviii
5.4 — KADAR PERTUKARAN UTAMAMalaysia
Kadar Pertukaran
Exchange Rates of
100 unitAkhir tempoh
100 units
Dolar Rupiah Baht Thailand Peso YenSingapura/ Indonesia Filipina
Brunei
End of Period Singapore/ Indonesian Thailand Baht Philippine YenBrunei Rupiah PesoDollar
1996 180.66 0.11 9.87 9.61 2.18
1997 232.00 0.07 8.23 9.60 2.99
1998 228.79 0.05 10.36 9.71 3.31
1999 228.09 0.05 10.12 9.48 3.71
2000 219.46 0.04 8.78 7.61 3.31
2001
Januari/January 217.86 0.04 8.93 7.70 3.26
Februari/February 218.27 0.04 8.87 7.88 3.27
Mac/March 211.05 0.04 8.48 7.70 3.05
April/April 208.96 0.03 8.34 7.41 3.07
Mei/May 210.17 0.03 8.38 7.53 3.17
Jun/June 208.77 0.03 8.40 7.25 3.06
Julai/July 210.94 0.04 8.32 7.09 3.04
Ogos/August 216.89 0.04 8.51 7.45 3.17
September/September 215.27 0.04 8.55 7.40 3.19
1 Kadar antara bank pada 12.00 tengahari di Kuala Lumpur (kadar yang disebut adalah purata di antara harga belian yang paling tinggi dan hargajualan yang paling rendah).
2 Euro diperkenalkan pada Januari 1999.3 Hak Pengeluaran Khas.
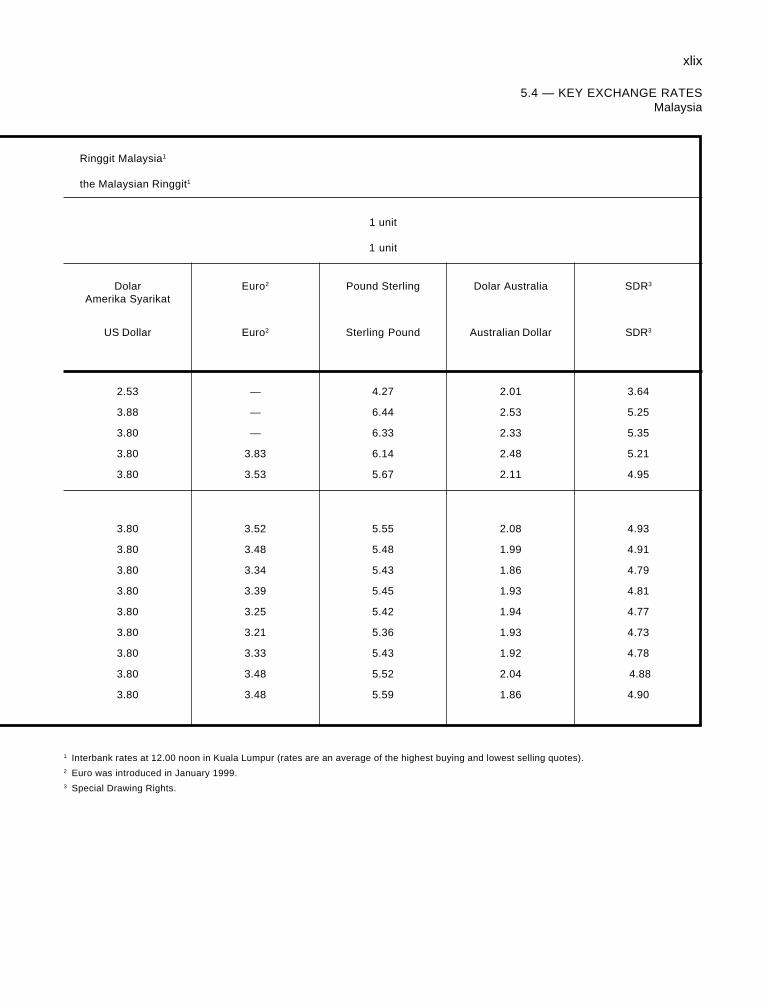
xlix
5.4 — KEY EXCHANGE RATESMalaysia
Ringgit Malaysia1
the Malaysian Ringgit1
1 unit
1 unit
Dolar Euro2 Pound Sterling Dolar Australia SDR3
Amerika Syarikat
US Dollar Euro2 Sterling Pound Australian Dollar SDR3
2.53 — 4.27 2.01 3.64
3.88 — 6.44 2.53 5.25
3.80 — 6.33 2.33 5.35
3.80 3.83 6.14 2.48 5.21
3.80 3.53 5.67 2.11 4.95
3.80 3.52 5.55 2.08 4.93
3.80 3.48 5.48 1.99 4.91
3.80 3.34 5.43 1.86 4.79
3.80 3.39 5.45 1.93 4.81
3.80 3.25 5.42 1.94 4.77
3.80 3.21 5.36 1.93 4.73
3.80 3.33 5.43 1.92 4.78
3.80 3.48 5.52 2.04 4.88
3.80 3.48 5.59 1.86 4.90
1 Interbank rates at 12.00 noon in Kuala Lumpur (rates are an average of the highest buying and lowest selling quotes).2 Euro was introduced in January 1999.3 Special Drawing Rights.
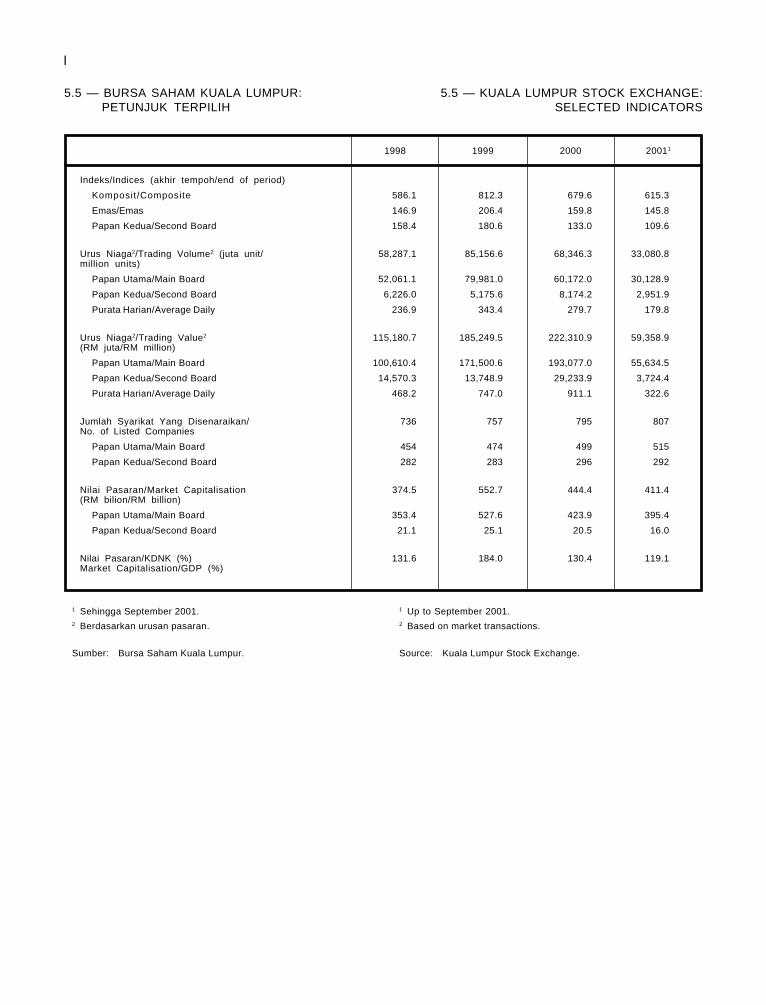
l
5.5 — KUALA LUMPUR STOCK EXCHANGE:SELECTED INDICATORS
5.5 — BURSA SAHAM KUALA LUMPUR:PETUNJUK TERPILIH
1998 1999 2000 20011
Indeks/Indices (akhir tempoh/end of period)
Komposit/Composite 586.1 812.3 679.6 615.3
Emas/Emas 146.9 206.4 159.8 145.8
Papan Kedua/Second Board 158.4 180.6 133.0 109.6
Urus Niaga2/Trading Volume2 (juta unit/ 58,287.1 85,156.6 68,346.3 33,080.8million units)
Papan Utama/Main Board 52,061.1 79,981.0 60,172.0 30,128.9
Papan Kedua/Second Board 6,226.0 5,175.6 8,174.2 2,951.9
Purata Harian/Average Daily 236.9 343.4 279.7 179.8
Urus Niaga2/Trading Value2 115,180.7 185,249.5 222,310.9 59,358.9(RM juta/RM million)
Papan Utama/Main Board 100,610.4 171,500.6 193,077.0 55,634.5
Papan Kedua/Second Board 14,570.3 13,748.9 29,233.9 3,724.4
Purata Harian/Average Daily 468.2 747.0 911.1 322.6
Jumlah Syarikat Yang Disenaraikan/ 736 757 795 807No. of Listed Companies
Papan Utama/Main Board 454 474 499 515
Papan Kedua/Second Board 282 283 296 292
Nilai Pasaran/Market Capitalisation 374.5 552.7 444.4 411.4(RM bilion/RM billion)
Papan Utama/Main Board 353.4 527.6 423.9 395.4
Papan Kedua/Second Board 21.1 25.1 20.5 16.0
Nilai Pasaran/KDNK (%) 131.6 184.0 130.4 119.1Market Capitalisation/GDP (%)
1 Sehingga September 2001. 1 Up to September 2001.2 Berdasarkan urusan pasaran. 2 Based on market transactions.
Sumber: Bursa Saham Kuala Lumpur. Source: Kuala Lumpur Stock Exchange.
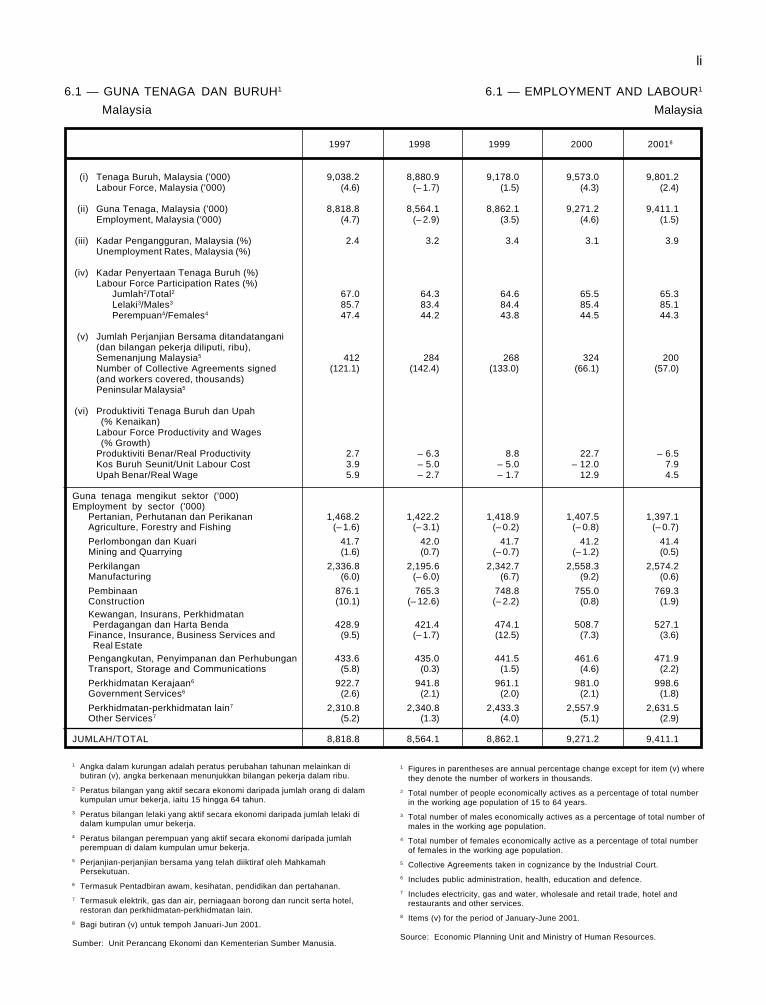
li
6.1 — GUNA TENAGA DAN BURUH1
Malaysia
1997 1998 1999 2000 20018
(i) Tenaga Buruh, Malaysia ('000) 9,038.2 8,880.9 9,178.0 9,573.0 9,801.2Labour Force, Malaysia ('000) (4.6) (– 1.7) (1.5) (4.3) (2.4)
(ii) Guna Tenaga, Malaysia ('000) 8,818.8 8,564.1 8,862.1 9,271.2 9,411.1Employment, Malaysia ('000) (4.7) (– 2.9) (3.5) (4.6) (1.5)
(iii) Kadar Pengangguran, Malaysia (%) 2.4 3.2 3.4 3.1 3.9Unemployment Rates, Malaysia (%)
(iv) Kadar Penyertaan Tenaga Buruh (%)Labour Force Participation Rates (%)
Jumlah2/Total2 67.0 64.3 64.6 65.5 65.3Lelaki3/Males3 85.7 83.4 84.4 85.4 85.1Perempuan4/Females4 47.4 44.2 43.8 44.5 44.3
(v) Jumlah Perjanjian Bersama ditandatangani(dan bilangan pekerja diliputi, ribu),Semenanjung Malaysia5 412 284 268 324 200Number of Collective Agreements signed (121.1) (142.4) (133.0) (66.1) (57.0)(and workers covered, thousands)Peninsular Malaysia5
(vi) Produktiviti Tenaga Buruh dan Upah(% Kenaikan)
Labour Force Productivity and Wages(% Growth)
Produktiviti Benar/Real Productivity 2.7 – 6.3 8.8 22.7 – 6.5Kos Buruh Seunit/Unit Labour Cost 3.9 – 5.0 – 5.0 – 12.0 7.9Upah Benar/Real Wage 5.9 – 2.7 – 1.7 12.9 4.5
Guna tenaga mengikut sektor ('000)Employment by sector ('000)
Pertanian, Perhutanan dan Perikanan 1,468.2 1,422.2 1,418.9 1,407.5 1,397.1Agriculture, Forestry and Fishing (– 1.6) (– 3.1) (– 0.2) (– 0.8) (– 0.7)
Perlombongan dan Kuari 41.7 42.0 41.7 41.2 41.4Mining and Quarrying (1.6) (0.7) (– 0.7) (– 1.2) (0.5)
Perkilangan 2,336.8 2,195.6 2,342.7 2,558.3 2,574.2Manufacturing (6.0) (– 6.0) (6.7) (9.2) (0.6)
Pembinaan 876.1 765.3 748.8 755.0 769.3Construction (10.1) (– 12.6) (– 2.2) (0.8) (1.9)Kewangan, Insurans, PerkhidmatanPerdagangan dan Harta Benda 428.9 421.4 474.1 508.7 527.1
Finance, Insurance, Business Services and (9.5) (– 1.7) (12.5) (7.3) (3.6)Real Estate
Pengangkutan, Penyimpanan dan Perhubungan 433.6 435.0 441.5 461.6 471.9Transport, Storage and Communications (5.8) (0.3) (1.5) (4.6) (2.2)
Perkhidmatan Kerajaan6 922.7 941.8 961.1 981.0 998.6Government Services6 (2.6) (2.1) (2.0) (2.1) (1.8)
Perkhidmatan-perkhidmatan lain7 2,310.8 2,340.8 2,433.3 2,557.9 2,631.5Other Services7 (5.2) (1.3) (4.0) (5.1) (2.9)
JUMLAH/TOTAL 8,818.8 8,564.1 8,862.1 9,271.2 9,411.1
1 Angka dalam kurungan adalah peratus perubahan tahunan melainkan dibutiran (v), angka berkenaan menunjukkan bilangan pekerja dalam ribu.
2 Peratus bilangan yang aktif secara ekonomi daripada jumlah orang di dalamkumpulan umur bekerja, iaitu 15 hingga 64 tahun.
3 Peratus bilangan lelaki yang aktif secara ekonomi daripada jumlah lelaki didalam kumpulan umur bekerja.
4 Peratus bilangan perempuan yang aktif secara ekonomi daripada jumlahperempuan di dalam kumpulan umur bekerja.
5 Perjanjian-perjanjian bersama yang telah diiktiraf oleh MahkamahPersekutuan.
6 Termasuk Pentadbiran awam, kesihatan, pendidikan dan pertahanan.
7 Termasuk elektrik, gas dan air, perniagaan borong dan runcit serta hotel,restoran dan perkhidmatan-perkhidmatan lain.
8 Bagi butiran (v) untuk tempoh Januari-Jun 2001.
Sumber: Unit Perancang Ekonomi dan Kementerian Sumber Manusia.
1 Figures in parentheses are annual percentage change except for item (v) wherethey denote the number of workers in thousands.
2 Total number of people economically actives as a percentage of total numberin the working age population of 15 to 64 years.
3 Total number of males economically actives as a percentage of total number ofmales in the working age population.
4 Total number of females economically active as a percentage of total numberof females in the working age population.
5 Collective Agreements taken in cognizance by the Industrial Court.
6 Includes public administration, health, education and defence.
7 Includes electricity, gas and water, wholesale and retail trade, hotel andrestaurants and other services.
8 Items (v) for the period of January-June 2001.
Source: Economic Planning Unit and Ministry of Human Resources.
6.1 — EMPLOYMENT AND LABOUR1
Malaysia
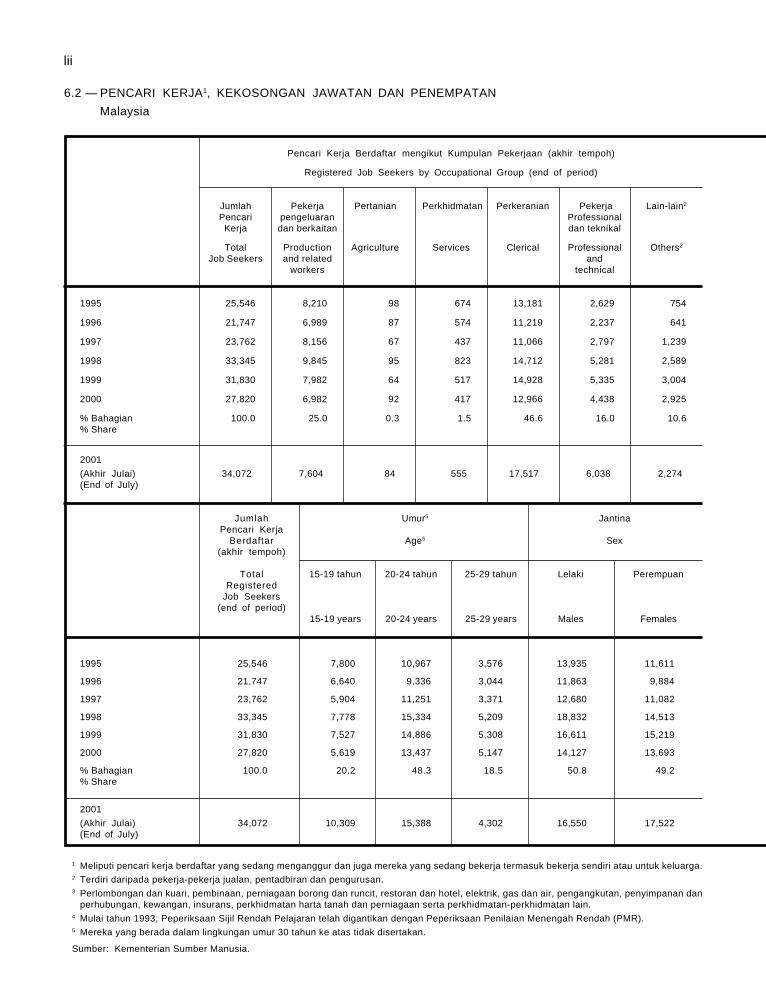
lii
6.2 — PENCARI KERJA1, KEKOSONGAN JAWATAN DAN PENEMPATAN
Malaysia
Pencari Kerja Berdaftar mengikut Kumpulan Pekerjaan (akhir tempoh)
Registered Job Seekers by Occupational Group (end of period)
Jumlah Pekerja Pertanian Perkhidmatan Perkeranian Pekerja Lain-lain2
Pencari pengeluaran ProfessionalKerja dan berkaitan dan teknikal
Total Production Agriculture Services Clerical Professional Others2
Job Seekers and related andworkers technical
1995 25,546 8,210 98 674 13,181 2,629 754
1996 21,747 6,989 87 574 11,219 2,237 641
1997 23,762 8,156 67 437 11,066 2,797 1,239
1998 33,345 9,845 95 823 14,712 5,281 2,589
1999 31,830 7,982 64 517 14,928 5,335 3,004
2000 27,820 6,982 92 417 12,966 4,438 2,925
% Bahagian 100.0 25.0 0.3 1.5 46.6 16.0 10.6% Share
2001
(Akhir Julai) 34,072 7,604 84 555 17,517 6,038 2,274(End of July)
Jumlah Umur5 JantinaPencari Kerja
Berdaftar Age5 Sex(akhir tempoh)
Total 15-19 tahun 20-24 tahun 25-29 tahun Lelaki PerempuanRegistered
Job Seekers(end of period)
15-19 years 20-24 years 25-29 years Males Females
1995 25,546 7,800 10,967 3,576 13,935 11,611
1996 21,747 6,640 9,336 3,044 11,863 9,884
1997 23,762 5,904 11,251 3,371 12,680 11,082
1998 33,345 7,778 15,334 5,209 18,832 14,513
1999 31,830 7,527 14,886 5,308 16,611 15,219
2000 27,820 5,619 13,437 5,147 14,127 13,693
% Bahagian 100.0 20.2 48.3 18.5 50.8 49.2% Share
2001
(Akhir Julai) 34,072 10,309 15,388 4,302 16,550 17,522(End of July)
1 Meliputi pencari kerja berdaftar yang sedang menganggur dan juga mereka yang sedang bekerja termasuk bekerja sendiri atau untuk keluarga.2 Terdiri daripada pekerja-pekerja jualan, pentadbiran dan pengurusan.3 Perlombongan dan kuari, pembinaan, perniagaan borong dan runcit, restoran dan hotel, elektrik, gas dan air, pengangkutan, penyimpanan dan
perhubungan, kewangan, insurans, perkhidmatan harta tanah dan perniagaan serta perkhidmatan-perkhidmatan lain.4 Mulai tahun 1993, Peperiksaan Sijil Rendah Pelajaran telah digantikan dengan Peperiksaan Penilaian Menengah Rendah (PMR).5 Mereka yang berada dalam lingkungan umur 30 tahun ke atas tidak disertakan.
Sumber: Kementerian Sumber Manusia.
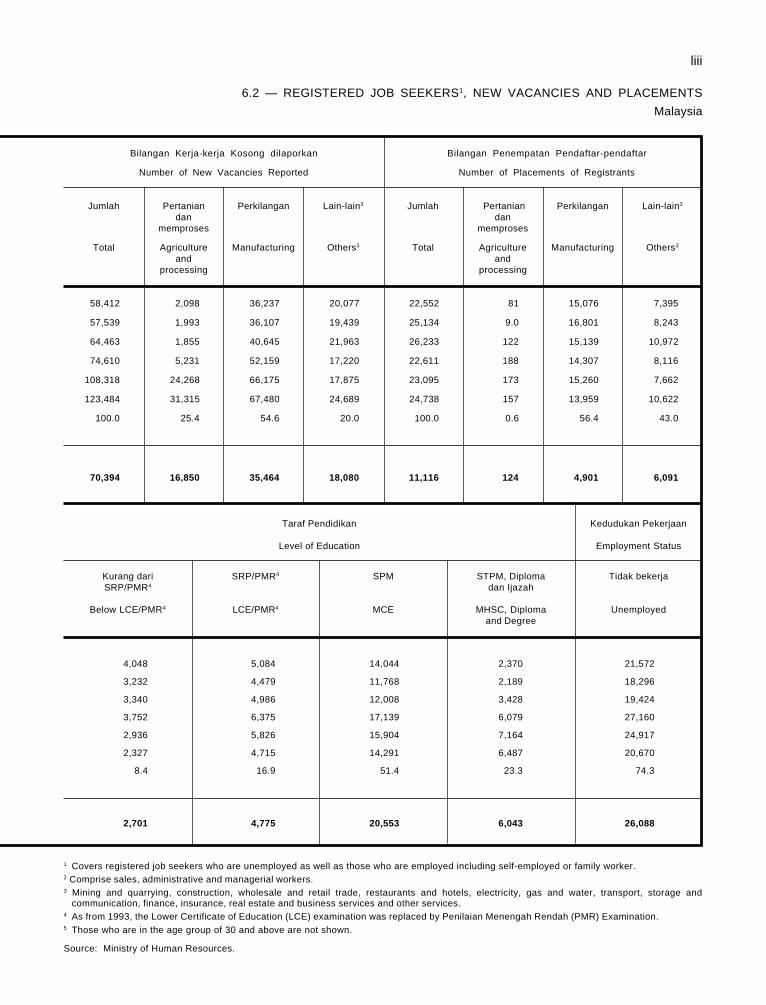
liii
6.2 — REGISTERED JOB SEEKERS1, NEW VACANCIES AND PLACEMENTS
Malaysia
Bilangan Kerja-kerja Kosong dilaporkan Bilangan Penempatan Pendaftar-pendaftar
Number of New Vacancies Reported Number of Placements of Registrants
Jumlah Pertanian Perkilangan Lain-lain3 Jumlah Pertanian Perkilangan Lain-lain3
dan danmemproses memproses
Total Agriculture Manufacturing Others3 Total Agriculture Manufacturing Others3
and andprocessing processing
58,412 2,098 36,237 20,077 22,552 81 15,076 7,395
57,539 1,993 36,107 19,439 25,134 9.0 16,801 8,243
64,463 1,855 40,645 21,963 26,233 122 15,139 10,972
74,610 5,231 52,159 17,220 22,611 188 14,307 8,116
108,318 24,268 66,175 17,875 23,095 173 15,260 7,662
123,484 31,315 67,480 24,689 24,738 157 13,959 10,622
100.0 25.4 54.6 20.0 100.0 0.6 56.4 43.0
70,394 16,850 35,464 18,080 11,116 124 4,901 6,091
Taraf Pendidikan Kedudukan Pekerjaan
Level of Education Employment Status
Kurang dari SRP/PMR4 SPM STPM, Diploma Tidak bekerjaSRP/PMR4 dan Ijazah
Below LCE/PMR4 LCE/PMR4 MCE MHSC, Diploma Unemployedand Degree
4,048 5,084 14,044 2,370 21,572
3,232 4,479 11,768 2,189 18,296
3,340 4,986 12,008 3,428 19,424
3,752 6,375 17,139 6,079 27,160
2,936 5,826 15,904 7,164 24,917
2,327 4,715 14,291 6,487 20,670
8.4 16.9 51.4 23.3 74.3
2,701 4,775 20,553 6,043 26,088
1 Covers registered job seekers who are unemployed as well as those who are employed including self-employed or family worker.2 Comprise sales, administrative and managerial workers.3 Mining and quarrying, construction, wholesale and retail trade, restaurants and hotels, electricity, gas and water, transport, storage and
communication, finance, insurance, real estate and business services and other services.4 As from 1993, the Lower Certificate of Education (LCE) examination was replaced by Penilaian Menengah Rendah (PMR) Examination.5 Those who are in the age group of 30 and above are not shown.
Source: Ministry of Human Resources.
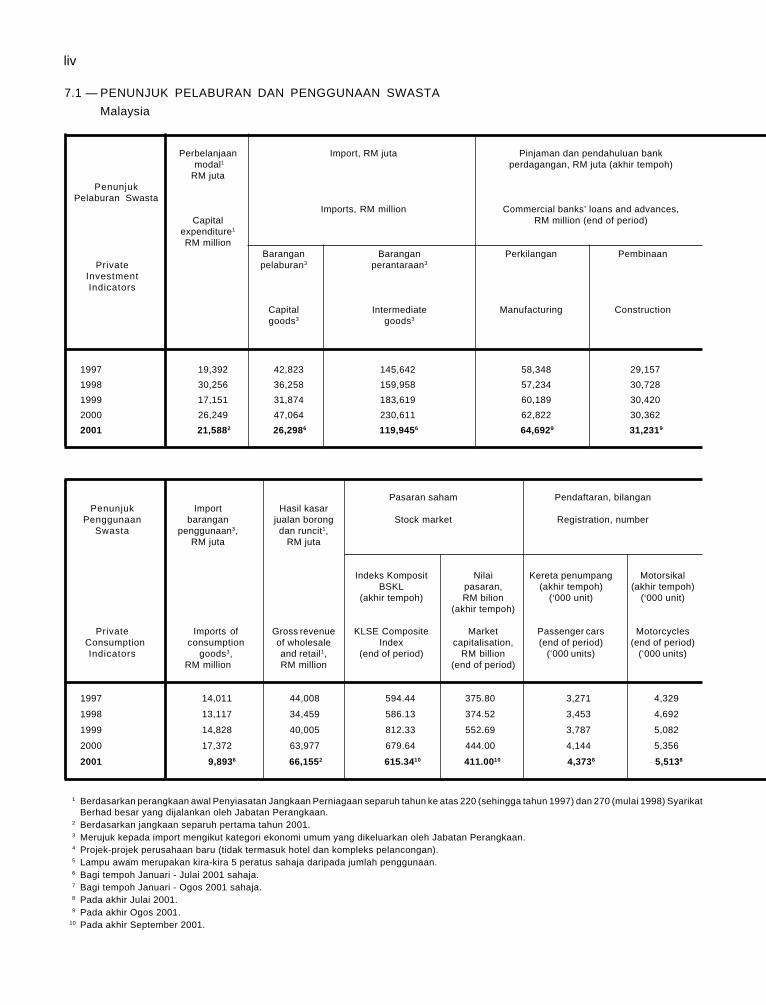
liv
7.1 — PENUNJUK PELABURAN DAN PENGGUNAAN SWASTA
Malaysia
Perbelanjaan Import, RM juta Pinjaman dan pendahuluan bank modal1 perdagangan, RM juta (akhir tempoh)RM juta
PenunjukPelaburan Swasta
Imports, RM million Commercial banks’ loans and advances,Capital RM million (end of period)
expenditure1
RM millionBarangan Barangan Perkilangan Pembinaan
Private pelaburan3 perantaraan3
InvestmentIndicators
Capital Intermediate Manufacturing Constructiongoods3 goods3
1997 19,392 42,823 145,642 58,348 29,157
1998 30,256 36,258 159,958 57,234 30,728
1999 17,151 31,874 183,619 60,189 30,420
2000 26,249 47,064 230,611 62,822 30,362
2001 21,5882 26,2986 119,9456 64,6929 31,2319
Pasaran saham Pendaftaran, bilanganPenunjuk Import Hasil kasar
Penggunaan barangan jualan borong Stock market Registration, numberSwasta penggunaan3, dan runcit1,
RM juta RM juta
Indeks Komposit Nilai Kereta penumpang MotorsikalBSKL pasaran, (akhir tempoh) (akhir tempoh)
(akhir tempoh) RM bilion (‘000 unit) (‘000 unit)(akhir tempoh)
Private Imports of Gross revenue KLSE Composite Market Passenger cars Motorcycles Consumption consumption of wholesale Index capitalisation, (end of period) (end of period)
Indicators goods3, and retail1, (end of period) RM billion (‘000 units) (‘000 units)RM million RM million (end of period)
1997 14,011 44,008 594.44 375.80 3,271 4,329
1998 13,117 34,459 586.13 374.52 3,453 4,692
1999 14,828 40,005 812.33 552.69 3,787 5,082
2000 17,372 63,977 679.64 444.00 4,144 5,356
2001 9,8936 66,1552 615.3410 411.0010 4,3738 5,5138
1 Berdasarkan perangkaan awal Penyiasatan Jangkaan Perniagaan separuh tahun ke atas 220 (sehingga tahun 1997) dan 270 (mulai 1998) SyarikatBerhad besar yang dijalankan oleh Jabatan Perangkaan.
2 Berdasarkan jangkaan separuh pertama tahun 2001.3 Merujuk kepada import mengikut kategori ekonomi umum yang dikeluarkan oleh Jabatan Perangkaan.4 Projek-projek perusahaan baru (tidak termasuk hotel dan kompleks pelancongan).5 Lampu awam merupakan kira-kira 5 peratus sahaja daripada jumlah penggunaan.6 Bagi tempoh Januari - Julai 2001 sahaja.7 Bagi tempoh Januari - Ogos 2001 sahaja.8 Pada akhir Julai 2001.9 Pada akhir Ogos 2001.
10 Pada akhir September 2001.
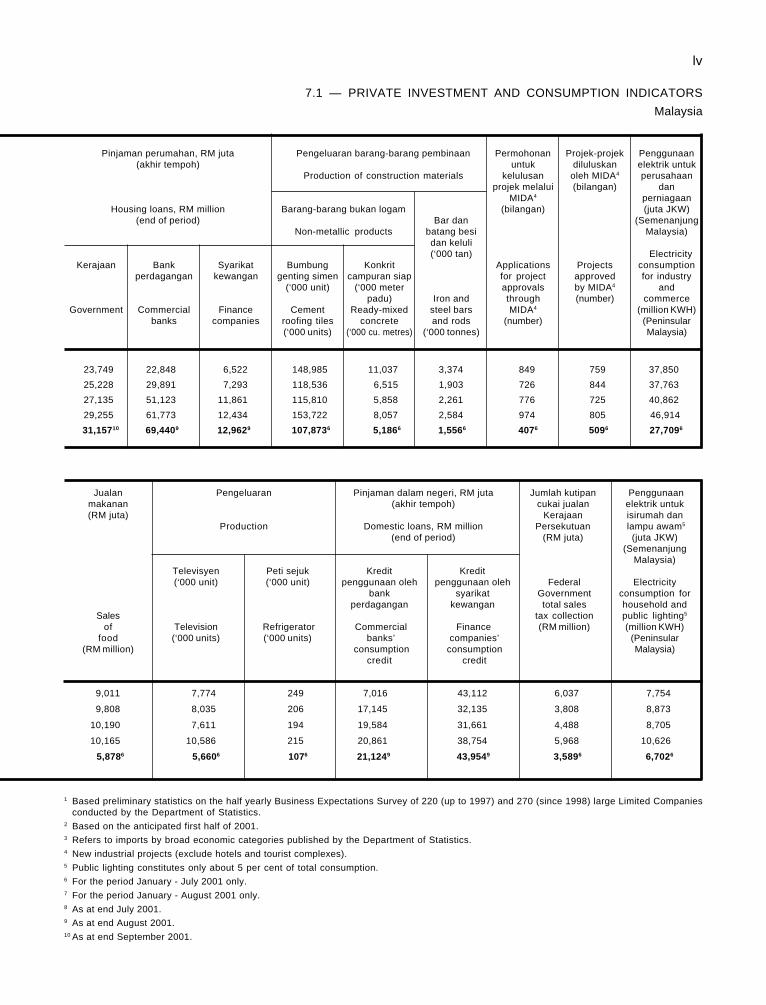
lv
7.1 — PRIVATE INVESTMENT AND CONSUMPTION INDICATORS
Malaysia
Pinjaman perumahan, RM juta Pengeluaran barang-barang pembinaan Permohonan Projek-projek Penggunaan(akhir tempoh) untuk diluluskan elektrik untuk
Production of construction materials kelulusan oleh MIDA4 perusahaanprojek melalui (bilangan) dan
MIDA4 perniagaanHousing loans, RM million Barang-barang bukan logam (bilangan) (juta JKW)
(end of period) Bar dan (SemenanjungNon-metallic products batang besi Malaysia)
dan keluli(‘000 tan) Electricity
Kerajaan Bank Syarikat Bumbung Konkrit Applications Projects consumptionperdagangan kewangan genting simen campuran siap for project approved for industry
(‘000 unit) (‘000 meter approvals by MIDA4 andpadu) Iron and through (number) commerce
Government Commercial Finance Cement Ready-mixed steel bars MIDA4 (million KWH)banks companies roofing tiles concrete and rods (number) (Peninsular
(‘000 units) (‘000 cu. metres) (‘000 tonnes) Malaysia)
23,749 22,848 6,522 148,985 11,037 3,374 849 759 37,850
25,228 29,891 7,293 118,536 6,515 1,903 726 844 37,763
27,135 51,123 11,861 115,810 5,858 2,261 776 725 40,862
29,255 61,773 12,434 153,722 8,057 2,584 974 805 46,914
31,15710 69,4409 12,9629 107,8736 5,1866 1,5566 4076 5096 27,7096
Jualan Pengeluaran Pinjaman dalam negeri, RM juta Jumlah kutipan Penggunaanmakanan (akhir tempoh) cukai jualan elektrik untuk(RM juta) Kerajaan isirumah dan
Production Domestic loans, RM million Persekutuan lampu awam5
(end of period) (RM juta) (juta JKW)(Semenanjung
Malaysia)Televisyen Peti sejuk Kredit Kredit(‘000 unit) (‘000 unit) penggunaan oleh penggunaan oleh Federal Electricity
bank syarikat Government consumption forperdagangan kewangan total sales household and
Sales tax collection public lighting5
of Television Refrigerator Commercial Finance (RM million) (million KWH)food (‘000 units) (‘000 units) banks’ companies’ (Peninsular
(RM million) consumption consumption Malaysia)credit credit
9,011 7,774 249 7,016 43,112 6,037 7,754
9,808 8,035 206 17,145 32,135 3,808 8,873
10,190 7,611 194 19,584 31,661 4,488 8,705
10,165 10,586 215 20,861 38,754 5,968 10,626
5,8786 5,6606 1076 21,1249 43,9549 3,5896 6,7026
1 Based preliminary statistics on the half yearly Business Expectations Survey of 220 (up to 1997) and 270 (since 1998) large Limited Companiesconducted by the Department of Statistics.
2 Based on the anticipated first half of 2001.3 Refers to imports by broad economic categories published by the Department of Statistics.4 New industrial projects (exclude hotels and tourist complexes).5 Public lighting constitutes only about 5 per cent of total consumption.6 For the period January - July 2001 only.7 For the period January - August 2001 only.8 As at end July 2001.9 As at end August 2001.10 As at end September 2001.
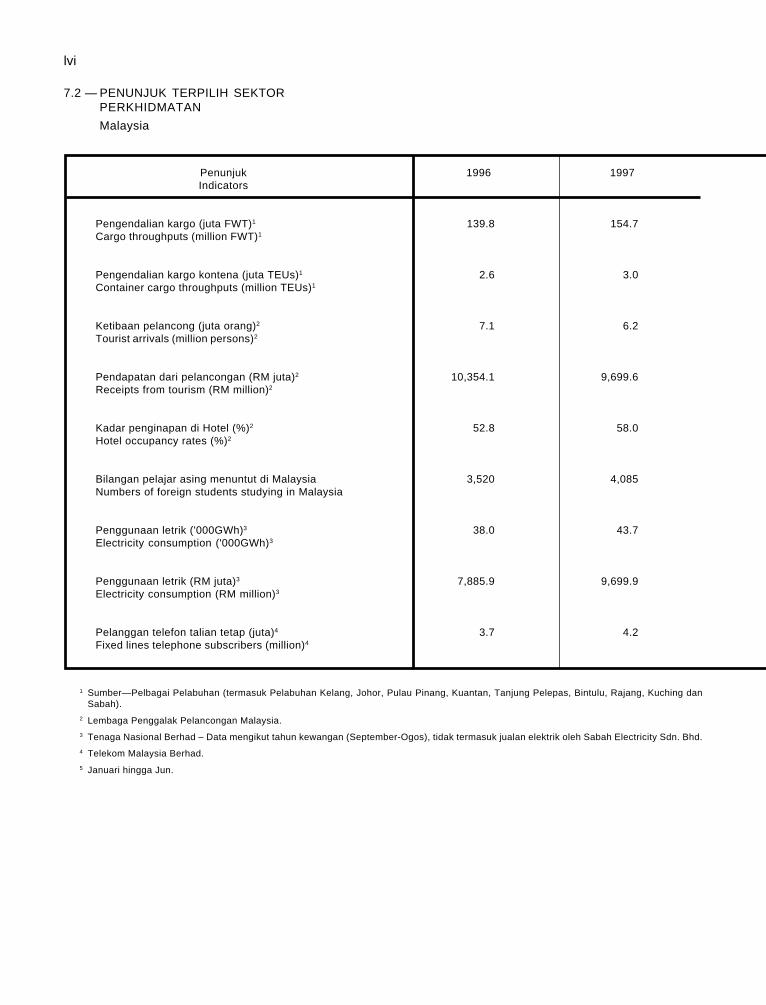
lvi
7.2 — PENUNJUK TERPILIH SEKTORPERKHIDMATAN
Malaysia
Penunjuk 1996 1997Indicators
Pengendalian kargo (juta FWT)1 139.8 154.7Cargo throughputs (million FWT)1
Pengendalian kargo kontena (juta TEUs)1 2.6 3.0Container cargo throughputs (million TEUs)1
Ketibaan pelancong (juta orang)2 7.1 6.2Tourist arrivals (million persons)2
Pendapatan dari pelancongan (RM juta)2 10,354.1 9,699.6Receipts from tourism (RM million)2
Kadar penginapan di Hotel (%)2 52.8 58.0Hotel occupancy rates (%)2
Bilangan pelajar asing menuntut di Malaysia 3,520 4,085Numbers of foreign students studying in Malaysia
Penggunaan letrik ('000GWh)3 38.0 43.7Electricity consumption ('000GWh)3
Penggunaan letrik (RM juta)3 7,885.9 9,699.9Electricity consumption (RM million)3
Pelanggan telefon talian tetap (juta)4 3.7 4.2Fixed lines telephone subscribers (million)4
1 Sumber—Pelbagai Pelabuhan (termasuk Pelabuhan Kelang, Johor, Pulau Pinang, Kuantan, Tanjung Pelepas, Bintulu, Rajang, Kuching danSabah).
2 Lembaga Penggalak Pelancongan Malaysia.3 Tenaga Nasional Berhad – Data mengikut tahun kewangan (September-Ogos), tidak termasuk jualan elektrik oleh Sabah Electricity Sdn. Bhd.4 Telekom Malaysia Berhad.5 Januari hingga Jun.
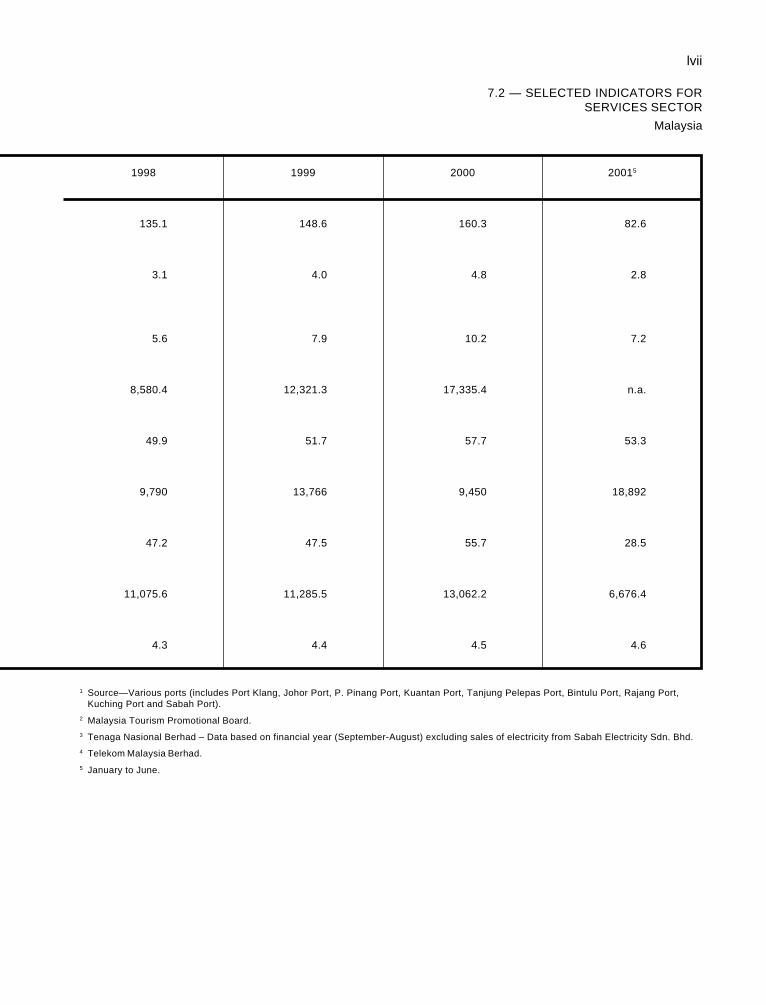
lvii
7.2 — SELECTED INDICATORS FORSERVICES SECTOR
Malaysia
1 Source—Various ports (includes Port Klang, Johor Port, P. Pinang Port, Kuantan Port, Tanjung Pelepas Port, Bintulu Port, Rajang Port,Kuching Port and Sabah Port).
2 Malaysia Tourism Promotional Board.3 Tenaga Nasional Berhad – Data based on financial year (September-August) excluding sales of electricity from Sabah Electricity Sdn. Bhd.4 Telekom Malaysia Berhad.5 January to June.
1998 1999 2000 20015
135.1 148.6 160.3 82.6
3.1 4.0 4.8 2.8
5.6 7.9 10.2 7.2
8,580.4 12,321.3 17,335.4 n.a.
49.9 51.7 57.7 53.3
9,790 13,766 9,450 18,892
47.2 47.5 55.7 28.5
11,075.6 11,285.5 13,062.2 6,676.4
4.3 4.4 4.5 4.6
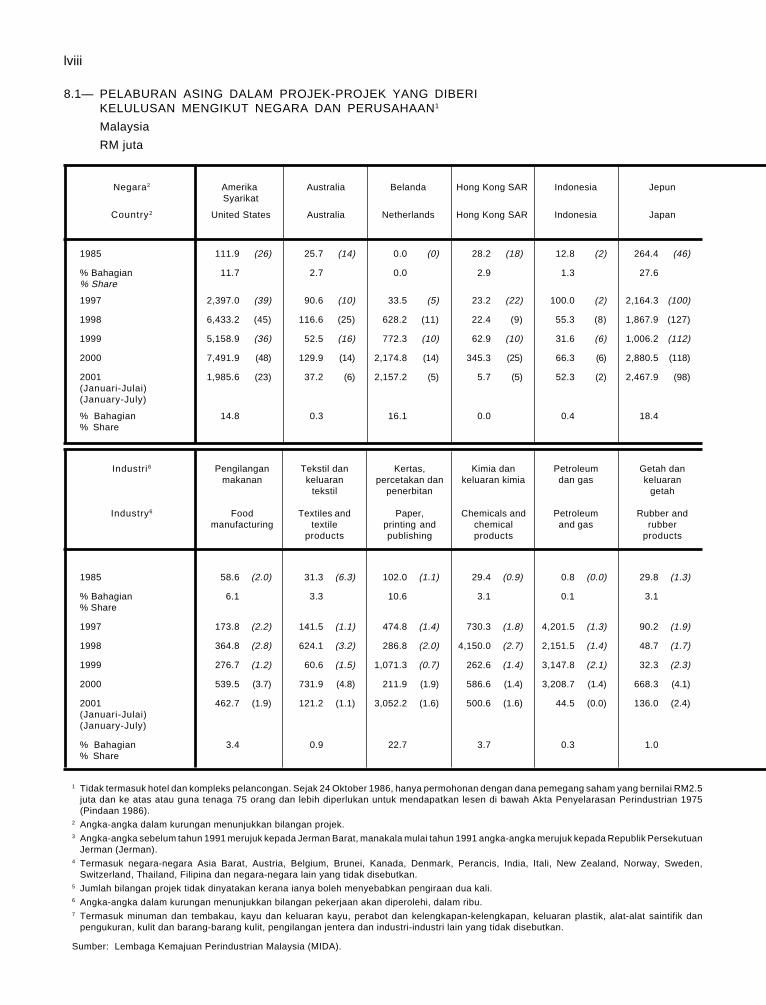
lviii
8.1— PELABURAN ASING DALAM PROJEK-PROJEK YANG DIBERIKELULUSAN MENGIKUT NEGARA DAN PERUSAHAAN1
Malaysia
RM juta
Negara2 Amerika Australia Belanda Hong Kong SAR Indonesia JepunSyarikat
Country2 United States Australia Netherlands Hong Kong SAR Indonesia Japan
1985 111.9 (26) 25.7 (14) 0.0 (0) 28.2 (18) 12.8 (2) 264.4 (46)
% Bahagian 11.7 2.7 0.0 2.9 1.3 27.6% Share
1997 2,397.0 (39) 90.6 (10) 33.5 (5) 23.2 (22) 100.0 (2) 2,164.3 (100)
1998 6,433.2 (45) 116.6 (25) 628.2 (11) 22.4 (9) 55.3 (8) 1,867.9 (127)
1999 5,158.9 (36) 52.5 (16) 772.3 (10) 62.9 (10) 31.6 (6) 1,006.2 (112)
2000 7,491.9 (48) 129.9 (14) 2,174.8 (14) 345.3 (25) 66.3 (6) 2,880.5 (118)
2001 1,985.6 (23) 37.2 (6) 2,157.2 (5) 5.7 (5) 52.3 (2) 2,467.9 (98)(Januari-Julai)(January-July)
% Bahagian 14.8 0.3 16.1 0.0 0.4 18.4% Share
Industri6 Pengilangan Tekstil dan Kertas, Kimia dan Petroleum Getah danmakanan keluaran percetakan dan keluaran kimia dan gas keluaran
tekstil penerbitan getah
Industry6 Food Textiles and Paper, Chemicals and Petroleum Rubber andmanufacturing textile printing and chemical and gas rubber
products publishing products products
1985 58.6 (2.0) 31.3 (6.3) 102.0 (1.1) 29.4 (0.9) 0.8 (0.0) 29.8 (1.3)
% Bahagian 6.1 3.3 10.6 3.1 0.1 3.1% Share
1997 173.8 (2.2) 141.5 (1.1) 474.8 (1.4) 730.3 (1.8) 4,201.5 (1.3) 90.2 (1.9)
1998 364.8 (2.8) 624.1 (3.2) 286.8 (2.0) 4,150.0 (2.7) 2,151.5 (1.4) 48.7 (1.7)
1999 276.7 (1.2) 60.6 (1.5) 1,071.3 (0.7) 262.6 (1.4) 3,147.8 (2.1) 32.3 (2.3)
2000 539.5 (3.7) 731.9 (4.8) 211.9 (1.9) 586.6 (1.4) 3,208.7 (1.4) 668.3 (4.1)
2001 462.7 (1.9) 121.2 (1.1) 3,052.2 (1.6) 500.6 (1.6) 44.5 (0.0) 136.0 (2.4)(Januari-Julai)(January-July)
% Bahagian 3.4 0.9 22.7 3.7 0.3 1.0% Share
1 Tidak termasuk hotel dan kompleks pelancongan. Sejak 24 Oktober 1986, hanya permohonan dengan dana pemegang saham yang bernilai RM2.5juta dan ke atas atau guna tenaga 75 orang dan lebih diperlukan untuk mendapatkan lesen di bawah Akta Penyelarasan Perindustrian 1975(Pindaan 1986).
2 Angka-angka dalam kurungan menunjukkan bilangan projek.3 Angka-angka sebelum tahun 1991 merujuk kepada Jerman Barat, manakala mulai tahun 1991 angka-angka merujuk kepada Republik Persekutuan
Jerman (Jerman).4 Termasuk negara-negara Asia Barat, Austria, Belgium, Brunei, Kanada, Denmark, Perancis, India, Itali, New Zealand, Norway, Sweden,
Switzerland, Thailand, Filipina dan negara-negara lain yang tidak disebutkan.5 Jumlah bilangan projek tidak dinyatakan kerana ianya boleh menyebabkan pengiraan dua kali.6 Angka-angka dalam kurungan menunjukkan bilangan pekerjaan akan diperolehi, dalam ribu.7 Termasuk minuman dan tembakau, kayu dan keluaran kayu, perabot dan kelengkapan-kelengkapan, keluaran plastik, alat-alat saintifik dan
pengukuran, kulit dan barang-barang kulit, pengilangan jentera dan industri-industri lain yang tidak disebutkan.
Sumber: Lembaga Kemajuan Perindustrian Malaysia (MIDA).
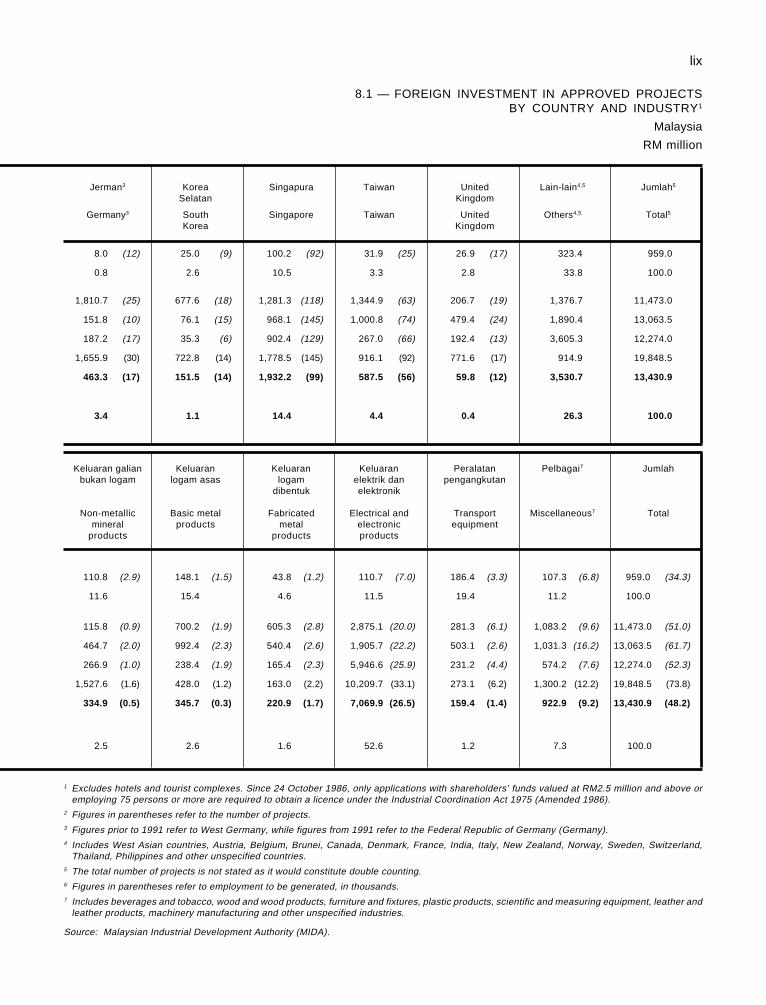
lix
1 Excludes hotels and tourist complexes. Since 24 October 1986, only applications with shareholders’ funds valued at RM2.5 million and above oremploying 75 persons or more are required to obtain a licence under the Industrial Coordination Act 1975 (Amended 1986).
2 Figures in parentheses refer to the number of projects.3 Figures prior to 1991 refer to West Germany, while figures from 1991 refer to the Federal Republic of Germany (Germany).4 Includes West Asian countries, Austria, Belgium, Brunei, Canada, Denmark, France, India, Italy, New Zealand, Norway, Sweden, Switzerland,
Thailand, Philippines and other unspecified countries.5 The total number of projects is not stated as it would constitute double counting.6 Figures in parentheses refer to employment to be generated, in thousands.7 Includes beverages and tobacco, wood and wood products, furniture and fixtures, plastic products, scientific and measuring equipment, leather and
leather products, machinery manufacturing and other unspecified industries.
Source: Malaysian Industrial Development Authority (MIDA).
8.1 — FOREIGN INVESTMENT IN APPROVED PROJECTSBY COUNTRY AND INDUSTRY1
Malaysia
RM million
Jerman3 Korea Singapura Taiwan United Lain-lain4,5 Jumlah5
Selatan Kingdom
Germany3 South Singapore Taiwan United Others4,5 Total5
Korea Kingdom
8.0 (12) 25.0 (9) 100.2 (92) 31.9 (25) 26.9 (17) 323.4 959.0
0.8 2.6 10.5 3.3 2.8 33.8 100.0
1,810.7 (25) 677.6 (18) 1,281.3 (118) 1,344.9 (63) 206.7 (19) 1,376.7 11,473.0
151.8 (10) 76.1 (15) 968.1 (145) 1,000.8 (74) 479.4 (24) 1,890.4 13,063.5
187.2 (17) 35.3 (6) 902.4 (129) 267.0 (66) 192.4 (13) 3,605.3 12,274.0
1,655.9 (30) 722.8 (14) 1,778.5 (145) 916.1 (92) 771.6 (17) 914.9 19,848.5
463.3 (17) 151.5 (14) 1,932.2 (99) 587.5 (56) 59.8 (12) 3,530.7 13,430.9
3.4 1.1 14.4 4.4 0.4 26.3 100.0
Keluaran galian Keluaran Keluaran Keluaran Peralatan Pelbagai7 Jumlahbukan logam logam asas logam elektrik dan pengangkutan
dibentuk elektronik
Non-metallic Basic metal Fabricated Electrical and Transport Miscellaneous7 Totalmineral products metal electronic equipment
products products products
110.8 (2.9) 148.1 (1.5) 43.8 (1.2) 110.7 (7.0) 186.4 (3.3) 107.3 (6.8) 959.0 (34.3)
11.6 15.4 4.6 11.5 19.4 11.2 100.0
115.8 (0.9) 700.2 (1.9) 605.3 (2.8) 2,875.1 (20.0) 281.3 (6.1) 1,083.2 (9.6) 11,473.0 (51.0)
464.7 (2.0) 992.4 (2.3) 540.4 (2.6) 1,905.7 (22.2) 503.1 (2.6) 1,031.3 (16.2) 13,063.5 (61.7)
266.9 (1.0) 238.4 (1.9) 165.4 (2.3) 5,946.6 (25.9) 231.2 (4.4) 574.2 (7.6) 12,274.0 (52.3)
1,527.6 (1.6) 428.0 (1.2) 163.0 (2.2) 10,209.7 (33.1) 273.1 (6.2) 1,300.2 (12.2) 19,848.5 (73.8)
334.9 (0.5) 345.7 (0.3) 220.9 (1.7) 7,069.9 (26.5) 159.4 (1.4) 922.9 (9.2) 13,430.9 (48.2)
2.5 2.6 1.6 52.6 1.2 7.3 100.0
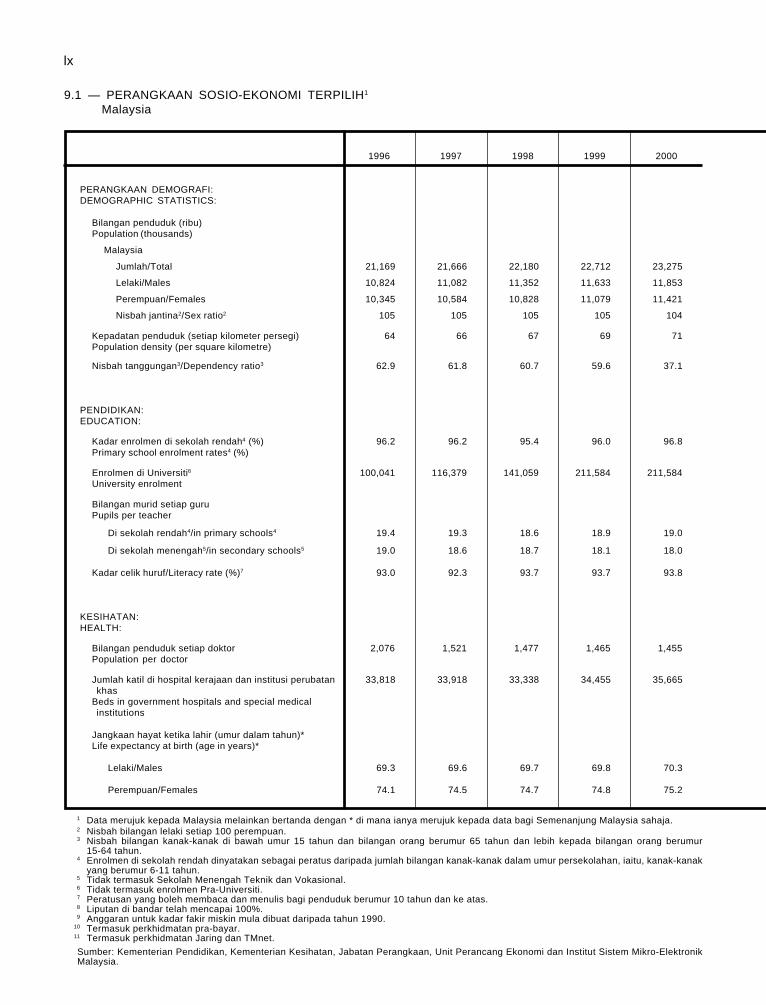
lx
9.1 — PERANGKAAN SOSIO-EKONOMI TERPILIH1
Malaysia
1996 1997 1998 1999 2000
PERANGKAAN DEMOGRAFI:DEMOGRAPHIC STATISTICS:
Bilangan penduduk (ribu)Population (thousands)
Malaysia
Jumlah/Total 21,169 21,666 22,180 22,712 23,275
Lelaki/Males 10,824 11,082 11,352 11,633 11,853
Perempuan/Females 10,345 10,584 10,828 11,079 11,421
Nisbah jantina2/Sex ratio2 105 105 105 105 104
Kepadatan penduduk (setiap kilometer persegi) 64 66 67 69 71Population density (per square kilometre)
Nisbah tanggungan3/Dependency ratio3 62.9 61.8 60.7 59.6 37.1
PENDIDIKAN:EDUCATION:
Kadar enrolmen di sekolah rendah4 (%) 96.2 96.2 95.4 96.0 96.8Primary school enrolment rates4 (%)
Enrolmen di Universiti6 100,041 116,379 141,059 211,584 211,584University enrolment
Bilangan murid setiap guruPupils per teacher
Di sekolah rendah4/in primary schools4 19.4 19.3 18.6 18.9 19.0
Di sekolah menengah5/in secondary schools5 19.0 18.6 18.7 18.1 18.0
Kadar celik huruf/Literacy rate (%)7 93.0 92.3 93.7 93.7 93.8
KESIHATAN:HEALTH:
Bilangan penduduk setiap doktor 2,076 1,521 1,477 1,465 1,455Population per doctor
Jumlah katil di hospital kerajaan dan institusi perubatan 33,818 33,918 33,338 34,455 35,665khas
Beds in government hospitals and special medicalinstitutions
Jangkaan hayat ketika lahir (umur dalam tahun)*Life expectancy at birth (age in years)*
Lelaki/Males 69.3 69.6 69.7 69.8 70.3
Perempuan/Females 74.1 74.5 74.7 74.8 75.2
1 Data merujuk kepada Malaysia melainkan bertanda dengan * di mana ianya merujuk kepada data bagi Semenanjung Malaysia sahaja.2 Nisbah bilangan lelaki setiap 100 perempuan.3 Nisbah bilangan kanak-kanak di bawah umur 15 tahun dan bilangan orang berumur 65 tahun dan lebih kepada bilangan orang berumur
15-64 tahun.4 Enrolmen di sekolah rendah dinyatakan sebagai peratus daripada jumlah bilangan kanak-kanak dalam umur persekolahan, iaitu, kanak-kanak
yang berumur 6-11 tahun.5 Tidak termasuk Sekolah Menengah Teknik dan Vokasional.6 Tidak termasuk enrolmen Pra-Universiti.7 Peratusan yang boleh membaca dan menulis bagi penduduk berumur 10 tahun dan ke atas.8 Liputan di bandar telah mencapai 100%.9 Anggaran untuk kadar fakir miskin mula dibuat daripada tahun 1990.
10 Termasuk perkhidmatan pra-bayar.11 Termasuk perkhidmatan Jaring dan TMnet.
Sumber: Kementerian Pendidikan, Kementerian Kesihatan, Jabatan Perangkaan, Unit Perancang Ekonomi dan Institut Sistem Mikro-ElektronikMalaysia.
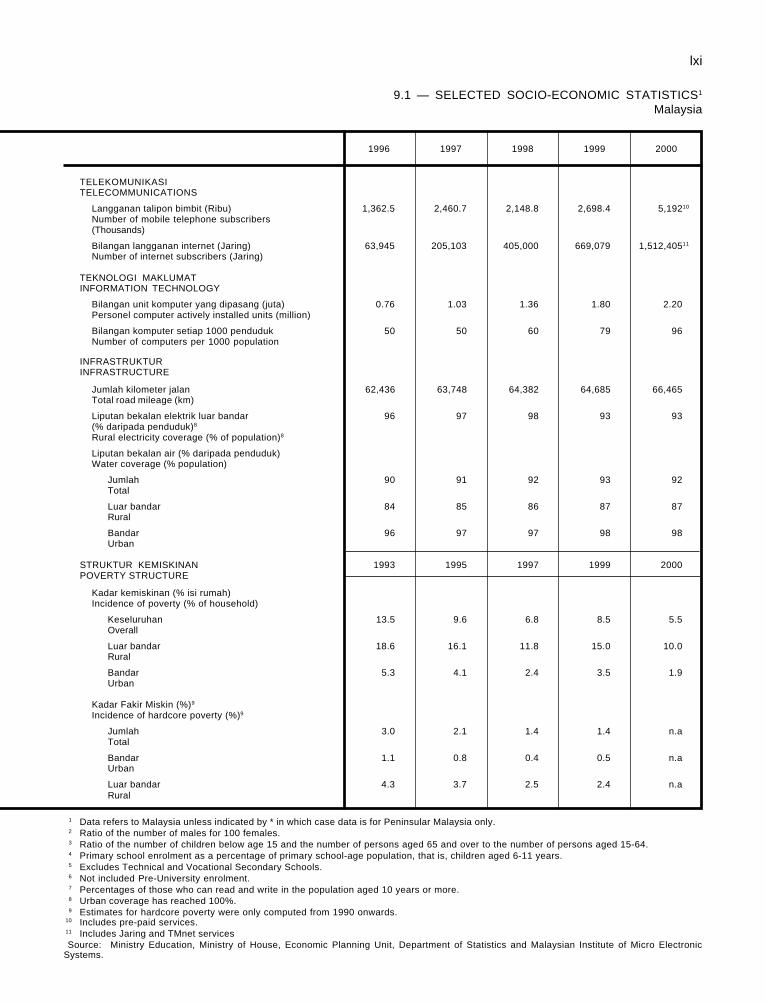
lxi
9.1 — SELECTED SOCIO-ECONOMIC STATISTICS1
Malaysia
1996 1997 1998 1999 2000
TELEKOMUNIKASITELECOMMUNICATIONS
Langganan talipon bimbit (Ribu) 1,362.5 2,460.7 2,148.8 2,698.4 5,19210
Number of mobile telephone subscribers(Thousands)
Bilangan langganan internet (Jaring) 63,945 205,103 405,000 669,079 1,512,40511
Number of internet subscribers (Jaring)
TEKNOLOGI MAKLUMATINFORMATION TECHNOLOGY
Bilangan unit komputer yang dipasang (juta) 0.76 1.03 1.36 1.80 2.20Personel computer actively installed units (million)
Bilangan komputer setiap 1000 penduduk 50 50 60 79 96Number of computers per 1000 population
INFRASTRUKTURINFRASTRUCTURE
Jumlah kilometer jalan 62,436 63,748 64,382 64,685 66,465Total road mileage (km)
Liputan bekalan elektrik luar bandar 96 97 98 93 93(% daripada penduduk)8
Rural electricity coverage (% of population)8
Liputan bekalan air (% daripada penduduk)Water coverage (% population)
Jumlah 90 91 92 93 92Total
Luar bandar 84 85 86 87 87Rural
Bandar 96 97 97 98 98Urban
STRUKTUR KEMISKINAN 1993 1995 1997 1999 2000POVERTY STRUCTURE
Kadar kemiskinan (% isi rumah)Incidence of poverty (% of household)
Keseluruhan 13.5 9.6 6.8 8.5 5.5Overall
Luar bandar 18.6 16.1 11.8 15.0 10.0Rural
Bandar 5.3 4.1 2.4 3.5 1.9Urban
Kadar Fakir Miskin (%)9
Incidence of hardcore poverty (%)9
Jumlah 3.0 2.1 1.4 1.4 n.aTotal
Bandar 1.1 0.8 0.4 0.5 n.aUrban
Luar bandar 4.3 3.7 2.5 2.4 n.aRural
1 Data refers to Malaysia unless indicated by * in which case data is for Peninsular Malaysia only.2 Ratio of the number of males for 100 females.3 Ratio of the number of children below age 15 and the number of persons aged 65 and over to the number of persons aged 15-64.4 Primary school enrolment as a percentage of primary school-age population, that is, children aged 6-11 years.5 Excludes Technical and Vocational Secondary Schools.6 Not included Pre-University enrolment.7 Percentages of those who can read and write in the population aged 10 years or more.8 Urban coverage has reached 100%.9 Estimates for hardcore poverty were only computed from 1990 onwards.
10 Includes pre-paid services.11 Includes Jaring and TMnet servicesSource: Ministry Education, Ministry of House, Economic Planning Unit, Department of Statistics and Malaysian Institute of Micro Electronic
Systems.

Investors’ Guide

170
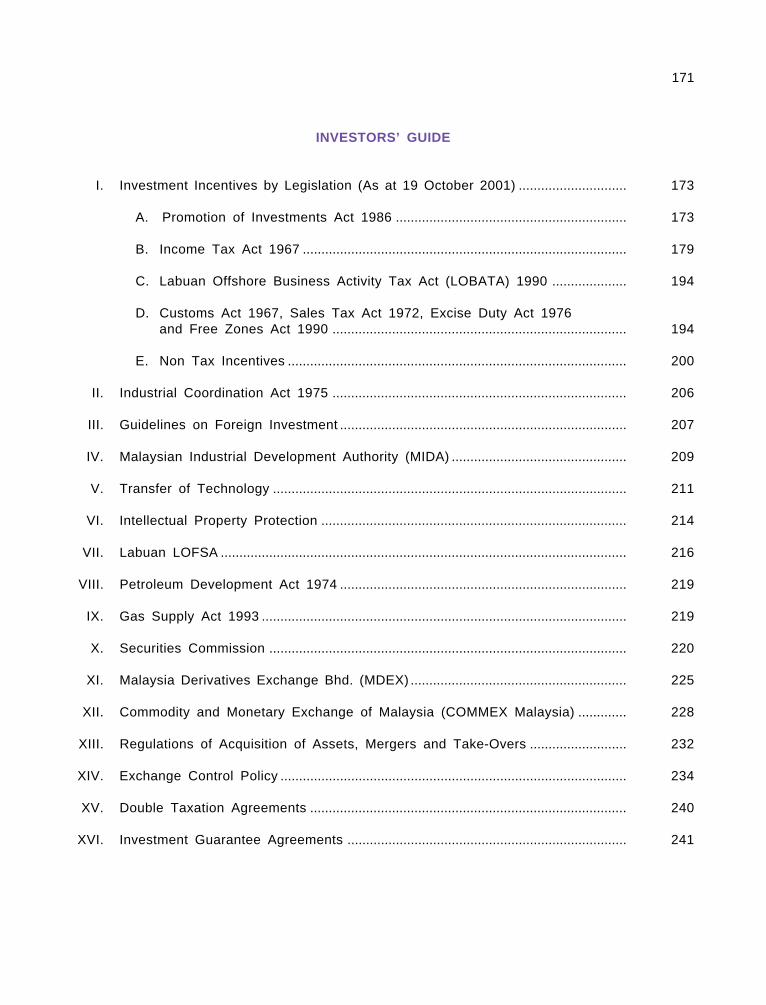
171
INVESTORS’ GUIDE
I. Investment Incentives by Legislation (As at 19 October 2001) ............................. 173
A. Promotion of Investments Act 1986 .............................................................. 173
B. Income Tax Act 1967 ....................................................................................... 179
C. Labuan Offshore Business Activity Tax Act (LOBATA) 1990 .................... 194
D. Customs Act 1967, Sales Tax Act 1972, Excise Duty Act 1976and Free Zones Act 1990 ............................................................................... 194
E. Non Tax Incentives ........................................................................................... 200
II. Industrial Coordination Act 1975 ............................................................................... 206
III. Guidelines on Foreign Investment ............................................................................. 207
IV. Malaysian Industrial Development Authority (MIDA) ............................................... 209
V. Transfer of Technology ............................................................................................... 211
VI. Intellectual Property Protection .................................................................................. 214
VII. Labuan LOFSA ............................................................................................................. 216
VIII. Petroleum Development Act 1974 ............................................................................. 219
IX. Gas Supply Act 1993 .................................................................................................. 219
X. Securities Commission ................................................................................................ 220
XI. Malaysia Derivatives Exchange Bhd. (MDEX) .......................................................... 225
XII. Commodity and Monetary Exchange of Malaysia (COMMEX Malaysia) ............. 228
XIII. Regulations of Acquisition of Assets, Mergers and Take-Overs .......................... 232
XIV. Exchange Control Policy ............................................................................................. 234
XV. Double Taxation Agreements ..................................................................................... 240
XVI. Investment Guarantee Agreements ........................................................................... 241

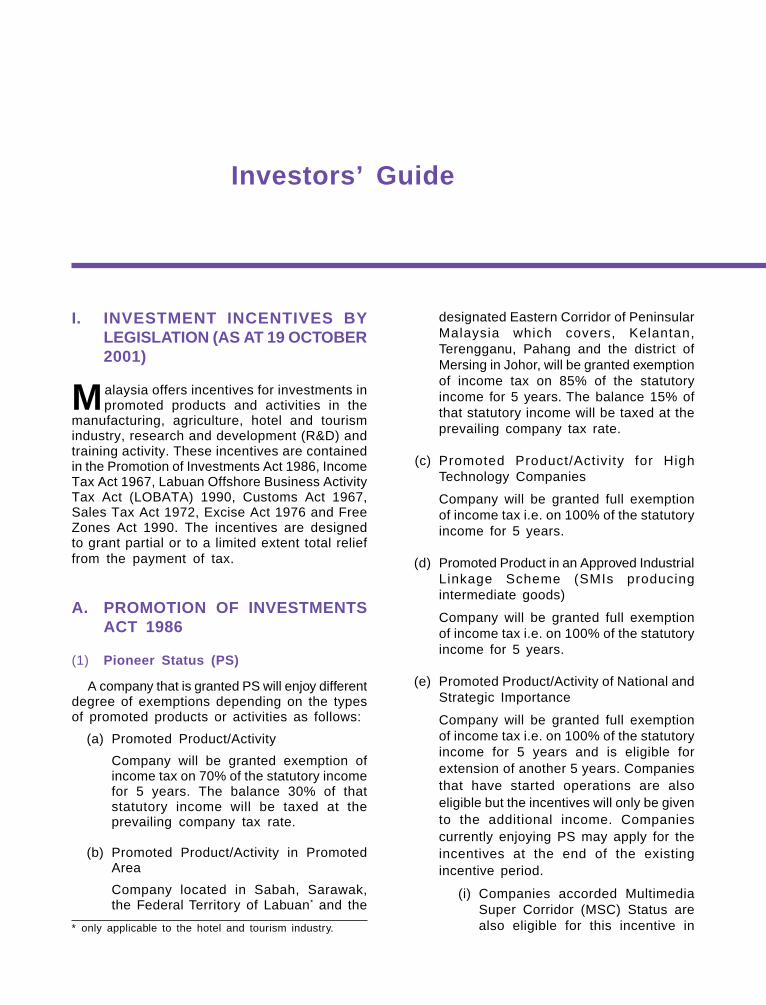
Investors’ Guide
I. INVESTMENT INCENTIVES BYLEGISLATION (AS AT 19 OCTOBER2001)
Malaysia offers incentives for investments inpromoted products and activities in the
manufacturing, agriculture, hotel and tourismindustry, research and development (R&D) andtraining activity. These incentives are containedin the Promotion of Investments Act 1986, IncomeTax Act 1967, Labuan Offshore Business ActivityTax Act (LOBATA) 1990, Customs Act 1967,Sales Tax Act 1972, Excise Act 1976 and FreeZones Act 1990. The incentives are designedto grant partial or to a limited extent total relieffrom the payment of tax.
A. PROMOTION OF INVESTMENTSACT 1986
(1) Pioneer Status (PS)
A company that is granted PS will enjoy differentdegree of exemptions depending on the typesof promoted products or activities as follows:
(a) Promoted Product/Activity
Company will be granted exemption ofincome tax on 70% of the statutory incomefor 5 years. The balance 30% of thatstatutory income will be taxed at theprevailing company tax rate.
(b) Promoted Product/Activity in PromotedArea
Company located in Sabah, Sarawak,the Federal Territory of Labuan* and the
designated Eastern Corridor of PeninsularMalaysia which covers, Kelantan,Terengganu, Pahang and the district ofMersing in Johor, will be granted exemptionof income tax on 85% of the statutoryincome for 5 years. The balance 15% ofthat statutory income will be taxed at theprevailing company tax rate.
(c) Promoted Product/Activity for HighTechnology Companies
Company will be granted full exemptionof income tax i.e. on 100% of the statutoryincome for 5 years.
(d) Promoted Product in an Approved IndustrialLinkage Scheme (SMIs producingintermediate goods)
Company will be granted full exemptionof income tax i.e. on 100% of the statutoryincome for 5 years.
(e) Promoted Product/Activity of National andStrategic Importance
Company will be granted full exemptionof income tax i.e. on 100% of the statutoryincome for 5 years and is eligible forextension of another 5 years. Companiesthat have started operations are alsoeligible but the incentives will only be givento the additional income. Companiescurrently enjoying PS may apply for theincentives at the end of the existingincentive period.
(i) Companies accorded MultimediaSuper Corridor (MSC) Status arealso eligible for this incentive in* only applicable to the hotel and tourism industry.
174
addition to other incentives underthe Bill of Guarantees. The taxincentive accorded to the MSCcompanies is also extended tomultimedia facult ies locatedoutside the MSC. A multimediafaculty under the proposedincentive is referred to as a centreof learning which provides coursesin media, computer, informationtechnology, telecommunications,communications and contentsrelating to data, voice, graphics andimages.
(ii) Companies in approved industriallinkage scheme capable of achievingworld class standards in terms ofprice, quality and capacity are alsoeligible.
(f) Contract Research and Development(R&D) company
A company that provides R&D services inMalaysia to a company other than its relatedcompany, will be granted full exemptionof income tax i.e. on 100% of the statutoryincome for 5 years.
Terms and conditions for companies enjoyingPS:
(i) Company granted PS shall within 6 monthsor such approved extended period requestfor a pioneer certificate, specifying amongothers the date of production from whichthe partial exemption/full exemption willbe granted.
(ii) Capital allowances have to be utilisedduring the pioneer period and will not beallowed to be carried forward to the postpioneer period.
(iii) Losses unabsorbed during the pioneerperiod will not be allowed to be carriedforward to the post pioneer period exceptfor PS for Contract Research andDevelopment Company.
(iv) Dividends paid out of tax-exempt incometo shareholders will also be exempted fromtax.
(2) Investment Tax Allowance (ITA)
The Investment Tax Allowance is an alternativeto the Pioneer Status and is designed to caterfor projects which have large capital investmentsand long gestation periods.
As in the case of PS, a company granted ITAwill enjoy different degree of exemptions asfollows:
(a) Promoted Product/Activity
Company will be granted an allowance of60% in respect of qualifying capitalexpenditure (such as factory, plant,machinery or other equipment used forapproved project) incurred within 5 yearsfrom the date that the f irst capitalexpenditure incurred. The allowance canbe utilised to set off up to 70% of thestatutory income in the assessment year.The balance of that statutory income willbe taxed at the prevailing company taxrate. Any unutilised allowance can becarried forward to subsequent years untilthe whole amount has been used up.
(b) Promoted Product/Activity In PromotedArea
Company located in Sabah, Sarawak, theFederal Territory of Labuan* and designatedEastern Corridor of Peninsular Malaysiawhich covers Kelantan, Terengganu,Pahang and the district of Mersing in Johorwill be granted an allowance of 80% inrespect of qualifying capital expenditureincurred within 5 years from the date thefirst capital expenditure incurred. Theallowance can be utilised to set off up to85% of the statutory income in theassessment year. The balance of thatstatutory income will be taxed at theprevailing company tax rate. Any unutilisedallowance can be carried forward tosubsequent years until the whole amounthas been used up.
* only applicable to the hotel and tourism industry.
175
(c) Promoted Product/Activity For HighTechnology Companies
Company will be granted an allowance of60% in respect of qualifying capitalexpenditure incurred within 5 years fromthe date the first capital expenditureincurred. The allowance can be utilised toset off against 100% of statutory incomein the year of assessment. Any unutilisedallowance can be carried forward tosubsequent years until the whole amounthas been used up.
(d) Promoted Product In An Approved IndustrialLinkage Programme
Company will be granted an allowance of100% in respect of qualifying capitalexpenditure incurred within 5 years fromthe date the first capital expenditureincurred. The allowance can be utilised toset off against 100% of statutory incomein the year of assessment. Any unutilisedallowance can be carried forward tosubsequent years until the whole amounthas been used up.
(e) Promoted Product/Activity Of National AndStrategic Importance
Company will be granted an allowance of100% in respect of qualifying capitalexpenditure incurred within 5 years fromthe date the first capital expenditureincurred. The allowance can be utilised toset off against 100% of statutory incomein the year of assessment. Any unutilisedallowance can be carried forward tosubsequent years until the whole amounthas been used up. Companies that havestarted operation are also eligible but theincentives will only be given on theadditional investment. Companies currentlyenjoying ITA may apply for the incentivesat the end of the existing incentive period.
(i) Companies accorded MultimediaSuper Corridor (MSC) Status arealso eligible for this incentive in
addition to other incentives underthe Bill of Guarantees. The taxincentive accorded to the MSCcompanies is also extended tomultimedia faculties located outsidethe MSC. A multimedia facultyunder the proposed incentiverefers to as a centre of learningwhich provides courses in media,computer, information technology,t e l e c o m m u n i c a t i o n s ,communications and contentsrelating to data, voice, graphicsand images.
(ii) Companies in approved industriallinkage scheme capable of achievingworld class standards in terms ofprice, quality and capacity are alsoeligible.
(f) Research and Development (R&D)Activities
Different incentives are given to companiesspecialising in R&D activities, i.e. incentivesfor “R&D company” and incentives for“Contract R&D Company”, as follows:
(i) R&D Company (a company thatprovides R&D services in Malaysiato its related company or to anyother company)
Company wil l be granted anallowance of 100% in respect ofqualifying capital expenditureincurred within 10 years from thedate the first capital expenditureincurred. The allowance can beutilised to set off up to 70% of thestatutory income in the assessmentyear. The balance of that statutoryincome will be taxed at the prevailingcompany tax rate. Any unutilisedallowance can be carried forwardto the subsequent years until it isfully utilised.
176
(ii) Contract R&D Company (a companythat provides R&D services inMalaysia to a company other thanits related company)
Company wil l be granted anallowance of 100% in respect ofqualifying capital expenditureincurred within 10 years from thedate the first capital expenditureincurred. The allowance can beutilised to set off up to 70% of thestatutory income in the assessmentyear. The balance of that statutoryincome will be taxed at the prevailingcompany tax rate. Any unutilisedallowance can be carried forwardto the subsequent years until it isfully utilised.
(iii) In-house R&D (research anddevelopment carried on in Malaysiawithin a company for the purposeof its own business)
Company wil l be granted anallowance of 50% in respect ofqualifying capital expenditureincurred within 10 years from thedate the first capital expenditureincurred. The allowance can beutilised to set off up to 70% of thestatutory income in the assessmentyear. The balance of that statutoryincome will be taxed at the prevailingcompany tax rate. Any unutilisedallowance can be carried forwardto subsequent years until the wholeamount has been used up.
(g) Technical or Vocational training company
Company will be granted an allowance of100% in respect of qualifying capitalexpenditure incurred within 10 years fromthe date the first capital expenditureincurred. The allowance can be utilised toset off up to 70% of the statutory incomein the assessment year. The balance ofthat statutory income will be taxed at theprevailing company tax rate. Any unutilised
allowance can be carried forward tosubsequent years until the whole amounthas been used up.
Companies with existing technical orvocational training institutes that incur newinvestment to upgrade their trainingequipment or expand their trainingcapacities are also eligible for this incentive.
(3) Industrial Adjustment Allowance (IAA)
IAA is available to companies in selectedmanufacturing sector namely in wood based,textile, machinery and engineering, stamping,mould, tools and dies and machinery sub-sector.The companies should already be in existencebefore 31.12.1990 and have been participatingin certain industrial adjustment activities suchas reorganisation, reconstruction or amalgamationwithin the sector.
Companies will be granted an allowance of60% to 100% based on the industrial adjustmentactivities undertaken. The allowance will be givenin respect of qualifying capital expenditure incurredwithin 5 years. The allowance can be utilised toset off against 100% of adjusted income in theyear of assessment.
Terms and conditions for companies enjoyingITA & IAA:
(i) Any unutilised allowance can be carriedforward to the subsequent years until it isfully utilised.
(ii) Dividends paid out of tax-exempt incometo shareholders will also be exempted.
(4) Infrastructure Allowance (IA)
IA is available to any company resident inMalaysia engaged in manufacturing, agricultural,hotel, tourism or other industrial/commercialactivity in Sabah, Sarawak and the designatedEastern Corridor of Peninsular Malaysia.
Company will be granted an allowance of 100%in respect of capital expenditure on infrastructure(such as reconstruction, extension, or
177
improvement of any permanent structure includinga bridge, jetty, port or road). The allowance canbe utilised to set off up to 85% of statutoryincome in the year of assessment. The balanceof that statutory income will be taxed at theprevailing company tax rate. Any unutilisedallowance can be carried forward to thesubsequent years until it is fully utilised.
(5) Double Deduction on Expenses forPromotion of Exports
This incentive is available to any companyresident in Malaysia seeking opportunities forexports of manufactured and agricultural products.
The expenses eligible for double deduction are:
(a) overseas advertising,
(b) supply of free samples abroad,
(c) export market research,
(d) preparation of tenders for the supply ofgoods overseas,
(e) supply of technical information abroad,
(f) exhibits and/or participation required intrade or industrial exhibitions held locallyor abroad approved by the Ministry ofInternational Trade and Industry (MITI),
(g) fares in respect of travel overseas byemployees of companies for business,
(h) accommodation and sustenance expensesincurred by Malaysian businessman goingoverseas for business, subject to RM200per day,
(i) cost of maintaining sales office overseasfor the promotion of exports, and
(j) professional service fees for designing thepackage of products for export subject tothe conditions that the product is of exportquality and the company uses localprofessional services.
For pioneer companies, the expenses areaccumulated and allowed against their post-pioneer income.
(6) Incentive For Forest Plantation Project
Companies which undertake forestplantation projects are eligible for the followingincentives:
(i) full income tax exemption i.e 100% ofstatutory income for 5 years and eligiblefor extension of another 5 years; or
(ii) Investment Tax Allowance of 100% ofcapital expenditure incurred within aperiod of 5 years to be set off against100% of the statutory income in theassessment year. Any unuti l isedallowance can be carried forward tosubsequent years until the whole amounthas been used up.
(7) Incentive For Storage, Treatment AndDisposal Of Toxic And Hazardous Waste.
Companies which are directly involved in thestorage, treatment and disposal of toxic andhazardous waste in an integrated manner aregranted:
(i) income tax exemption on 70% of statutoryincome for 5 years; or
(ii) Investment Tax Allowance of 60% ofcapital expenditure incurred within aperiod of 5 years to be set off against70% of the statutory income in theassessment year. Any unuti l isedallowance can be carried forward tosubsequent years until the whole amounthas been used up.
(iii) Activities located in the promoted areasare eligible for income tax exemption orInvestment Tax Allowance in accordancewith that given for promoted areas.
(8) Incentive For Waste Recycling Activities
Companies undertaking waste recyclingactivities of high value added using hightechnology are granted:
(i) income tax exemption on 70% of statutoryincome for 5 years; or
178
(ii) Investment Tax Allowance of 60% ofcapital expenditure incurred within aperiod of 5 years to be set off against70% of the statutory income in theassessment year. Any unuti l isedallowance can be carried forward tosubsequent years until the whole amounthas been used up.
(iii) Activities located in the promoted areasare eligible for income tax exemption orInvestment Tax Allowance in accordancewith that given for promoted areas.
(9) Incentive for The Conservation of Energy
(A) Companies providing energyconservation services are granted:
(i) income tax exemption on 70%of statutory income for 5 years;or
(ii) Investment Tax Allowance of 60%of capital expenditure incurredwithin a period of 5 years to beset off against 70% of thestatutory income in theassessment year. Any unutilisedallowance can be carried forwardto subsequent years until thewhole amount has been used up.
(iii) Activities located in the promotedareas are eligible for income taxexemption or Investment TaxAllowance in accordance with thatgiven for promoted areas.
This incentive is applicable forapplications received from 28 October2000 until 31 December 2002, oncondit ion that the company mustimplement the project within one yearfrom the date the incentive isapproved.
(B) Companies which incur capitalexpenditure for purpose of energyconservation measures in their owncompany are granted AcceleratedDepreciation Allowance, to be written
off within a period of 3 years. Thisincentive is effective from the year ofassessment 2001.
(10) Incentive For Utilising Biomass As A NewSource Of Energy
Companies intending to generate ‘energy’ from‘biomass sources’ are granted:
(i) income tax exemption of 70% of statutoryincome for 5 years; or
(ii) Investment Tax Allowance of 60% to beset off against 70% of statutory incomefor 5 years. Any unutilised allowance canbe carried forward to subsequent yearsuntil the whole amount has been used up.
(iii) Activities located in the promoted areasare eligible for income tax exemption orInvestment Tax Allowance in accordancewith that given for promoted areas.
This incentive is applicable for applicationsreceived from 28 October 2000 until 31December 2002, on condition that the companymust implement the project within one year fromthe date the incentive is approved.
For purposes of this incentive, ‘biomasssources’ refer to the following:
(i) Palm Oil Mill/Estates Waste
(ii) Rice Mill Waste
(iii) Sugar Cane Mill Waste
(iv) Timber /Sawmill Waste
(v) Paper Recycling Mill Waste
(vi) Municipal Waste
(vii) Biogas (from Landfill, Palm Oil Mill Effluent(POME), Animal Waste, others)
‘Energy’ forms in this incentive refer to thefollowing:
(i) Electricity
(ii) Steam
(iii) Chilled Water
(iv) Heat
179
(11) Incentive for Companies Providing ColdChain Facilities and Services for FoodProducts
To encourage companies to provide cold roomand refrigerated facilities and related servicessuch as collection and treatment of locallyproduced perishable food products , companieswill be granted the following incentives:
(i) income tax exemption of 70% on statutoryincome for 5 years; or
(ii) Investment Tax Allowance of 60% on thecapital expenditure incurred within 5years, to be utilised against 70% ofstatutory income. Any unutilised allowancecan be carried forward to subsequentyears until the whole amount has beenused up.
(iii) Activities located in the promoted areasare eligible for income tax exemption orInvestment Tax Allowance in accordancewith that given for promoted areas.
B. INCOME TAX ACT 1967
(1) Income Tax Exemption
(a) Approved Service Projects (ASP)(Section 127)
The income of companies undertaking ASPis exempted at statutory level. The quantumof tax exemption on statutory income variesbetween 70% and 100% for a period of5 and 10 years from the date of generationof income. The quantum of exemptionavailable are as follows:
(i) companies undertaking ASP will begranted partial exemption of incometax on 70% of the statutory incomefor 5 years. The balance 30% ofthat statutory income will be taxedat the prevailing company tax rate;
(ii) companies under taking ASP inSabah, Sarawak and the designated‘eastern corridor’ of PeninsularMalaysia will be granted partial
exemption of income tax on 85% ofthe statutory income for 5 years.The balance 15% of that statutoryincome will be taxed at the prevailingcompany tax rate;
(iii) companies undertaking ASP ofnational and strategic importancewill be granted full exemption ofstatutory income from payment ofincome tax for 10 years.
Note:
• Dividends paid out of tax-exemptincome to shareholders will also beexempted from tax.
• Capital al lowances and lossesunabsorbed have to be utilised duringthe exemption period and will not beallowed to be carried forward to thepost exemption period.
(b) Trading Companies
Companies approved as “InternationalTrading Company” are given income taxexemption amounting to 70% of thestatutory income arising from increasedexport sales. For the purpose of thisincentive, export sales do not includetrading commissions and profits derive fromtrading at the commodity exchange. Thisexemption is for five (5) years. To qualifyas an ‘International Trading Company’, acompany must satisfy the following criteria:
(i) be incorporated in Malaysia,
(ii) achieve an annual sales turnoverof more than RM25 million,
(iii) equity holding of at least 70% byMalaysian,
(iv) market manufactured goods,especially those from small andmedium scale industry, and
(v) be registered with MATRADE.
180
In addition, the company must satisfy thefollowing conditions to enjoy for the taxincentive:
(i) not more than 20% of annual salesis derived from trading ofcommodities,
(ii) not more than 20% of annual salesis derived from the sales of the goodsof related companies, and
(iii) use local services such as banking,f inance, insurance, ports andairports.
(c) Operational Headquarters Company (OHQ)
An approved OHQ company is a locallyincorporated company which carries on abusiness in Malaysia of providing qualifyingservices to its offices or related companiesoutside Malaysia and which is approvedby the Minister of Finance.
The qualifying services are in respect of:
(i) general management andadministration;
(ii) business planning and co-ordination;
(iii) procurement of raw materials,components and finished products;
(iv) technical support and maintenance;
(v) marketing control and salespromotion planning;
(vi) training and personnel management;
(vii) treasury and fund managementservices;
(viii) corporate financial advisory services;
(ix) research and development (R&D)work;
Companies granted an approved OHQstatus will enjoy a 10% concessionary taxon business income, income from loan/fund management services and royaltyincome received from research anddevelopment work.
Income arising from sources outsideMalaysia and received in Malaysia by aresident company is not subject to tax.
The tenure of the OHQ incentives is fora period of five (5) years which may beextended for another five (5) years.
(d) Venture Capital Industry
The following incentives are available:
(i) Venture Capital CompaniesInvesting In Venture Companies:
Venture Capital Companies(VCC)investing in venture companies aregiven full tax exemption on allsources of income for 10 years ofassessment or the years ofassessment equivalent to the lifespan of the fund(if any) establishedfor the purpose of investing in theventure company whichever is thelesser. Where a VCC incurs a lossfrom the disposal of shares in aventure company in the basis periodfor any year of assessment withinthe exempt period, such loss shallbe carried forward to the post-exempt period.
Condit ions to qualify for theexemption:
• Be a company incorporatedunder the Companies Act1965, a partnership, a schemeor an arrangement investingin a venture company in theform of seed-capital, start-upor early-stage financing.
• Have at least 70% of its fundsinvested in venture companieswhich are not i ts relatedcompanies at the time of firstinvestment.
• The venture companies mustbe a resident in Malaysia forthe basis year for the year ofassessment and involved in
181
products/activities promoted bythe Government include thoserecognised by the following:
o Promotion InvestmentsAct 1986 such as PioneerStatus or Investment TaxAllowance incentivegranted by MIDA/MITI,high-tech incentivesgranted by MIDA, MSCstatus granted by MDC,and SMIDEC;
o T e c h n o l o g y - b a s e dactivities approved byMESDAQ;
o Industrial Research &Development GrantScheme granted byMinistry of Science,Technology and theEnvironment; or
o MSC Research &Development GrantScheme granted byMDC.
VCC must obtain annual certificationfrom the Security Commission thatthe conditions imposed for theincentives have been complied. Theletter of certi f ication must beattached with the income tax returnform for submission to the InlandRevenue Board. This incentive iseffective from the year ofassessment 2000 in respect of thebasis period ending in the year 2000.
(ii) Companies or Individuals InvestingIn Venture Companies:
A company or an individual havinga business source, having investedin a venture company at start-up,seed capital and early stagefinancing are entitled to a deductionfrom the adjusted income equivalentto the value of the investment madein the venture company. If thecompany or individual does not have
sufficient adjusted income to offsetthe investment, the deductions willbe allowed to be carried forward.
Condit ions to qualify for thededuction:
• Be a resident in Malaysia andmaking investments in aventure company for financingor funding at seed-capital,start-up or early-stage.
• The investment in the venturecompany is in a form of holdingof shares which at the time ofacquisition are not listed forquotation in the official list ofa stock exchange.
• The venture companies mustnot be its related companiesat the time of first investment.
• The venture companies mustbe resident in Malaysia for thebasis year of the year ofassessment and involved inproducts/activities promoted bythe Government include thoserecognised by the following:
o Promotion Investment Act1986 such as PioneerStatus or Investment TaxAllowance incentivegranted by MIDA/MITI,high-tech incentivesgranted by MIDA, MSCstatus granted by MDC,and SMIDEC;
o T e c h n o l o g y - b a s e dactivities approved byMESDAQ;
o Industrial Research &Development GrantScheme granted byMinistry of Science,Technology and theEnvironment; or
o MSC Research &Development GrantScheme granted by MDC.
182
A company or an individual mustobtain annual certification from theSecurities Commission that theconditions imposed for the incentiveshave been complied. The letter ofcertification must be attached withthe income tax return form forsubmission to the Inland RevenueBoard. This incentive is effectivefrom the year of assessment 2001.For a company the incentive 1(d)(i)and (ii) are mutually exclusive.
For purposes of obtaining tax incentives, thedefinitions for stages of financing are as follows:
“early-stage financing” means financing or fundingprovided to a venture company as:
(a) capital expenditure and/or working capitalto initiate commercialisation of a technologyor product;
(b) additional capital expenditure and/orworking capital to increase productioncapacity, marketing or productdevelopment; or
(c) an interim funding for venture companiesexpecting to be listed on the official list ofa stock exchange.
For products or activities that are not on theMalaysian Exchange Of Securities Dealing &Automated Quotation (MESDAQ)’s l ist oftechnology-based activities, subclauses (b) or(c) would only be applicable if the financing orfunding has been provided for from seed-capitalor start-up stage.
“seed-capital financing” means financing orfunding provided to a venture company, for thepurposes of research, assessment anddevelopment of an init ial concept and/orprototype.
“start-up financing” means financing or fundingprovided to a venture company for productdevelopment and initial marketing.
(e) Tour Operators
(i) Incentive for bringing in ForeignTourists
Exemption from tax on incomeearned from the business ofoperating tours provided that thetour operators are licensed with theMinistry of Culture, Arts & Tourismand the tour operators bring in atleast 500 foreign tourists per yearthrough group tours. This incentiveis extended until year of assessment2001 (current year basis).
(ii) Incentive for Domestic Tourism
Exemption from tax on incomeearned from the business ofoperating tours provided that thetour operators are licensed with theMinistry of Culture, Arts and Tourismand the tour operators conductdomestic tour packages with at least1,200 local tourists per year. Forthis purpose, a domestic tourpackage means any tour packagewithin Malaysia participated by localtourists (individuals who areMalaysian citizens or residing inMalaysia) inclusive of transportationby air, land or sea and providing atleast one night accommodation. Thisincentive is extended until year ofassessment 2001 (current yearbasis)
(f) Organisers of International Conference
Local companies which organiseinternational conferences in Malaysia willbe eligible for income tax exemption onincome earned from bringing at least 500foreign participants per year into thecountry.
(g) Promotion of Export
(i) exemption of statutory incomeequivalent to 10% of the value of
183
increased exports is given tomanufacturers provided that thegoods exported attain at least 30%value added;
(ii) exemption of statutory incomeequivalent to 15% of the value ofincreased exports is given tomanufacturers provided that thegoods exported attain at least 50%value added;
(iii) exemption of statutory incomeequivalent to 10% of the value ofincreased exports is given tocompanies which export fruits andcut flowers;
(iv) exemption of statutory incomeequivalent to 10% of the value ofincreased exports is given tocompanies in selected servicessector as follows:
(a) legal;
(b) accounting;
(c) engineering consultancy;
(d) architecture;
(e) marketing;
(f) business consultancy;
(g) office services;
(h) construction management;
(i) building management;
(j) plantation management;
(k) health;
(l) education;
(m) publishing; and
(n) information and communi-cation technology
(h) Promotion of Car and Motorcycle RacingEvents
Drivers and organisers of car andmotorcycles racing of international standardheld in Malaysia are eligible for:
(i) full tax exemption on income earnedby the drivers;
(ii) 50% tax exemption on incomeearned by the organisers.
(i) Promotion of Boat/Yacht MaintenanceActivities in Langkawi
Companies undertaking repair andmaintenance activities of luxury boats andyacht in Langkawi are eligible for full incometax exemption for 5 years.
(j) Incentive for Investor and Producerengaged in Food Production
First alternative :
(i) a company which invest in asubsidiary company engaged infood production will be granted taxdeduction equivalent to the amountof investment made in thatsubsidiary; AND
(ii) the subsidiary company undertakingfood production will be given incometax exemption of 100% on itsstatutory income for 10 yearscommencing from the first yearthe company enjoys profit inwhich:
(a) losses incurred before theexemption period is allowedto be brought forward afterthe exemption period of 10years .
(b) losses incurred during theexemption period is alsoallowed to be brought forwardafter the exemption period of10 years; and
(c) dividends paid from theexempt income be exemptedin the hand of theshareholders
OR
Second alternative :
(i) the company which invests in thesubsidiary company engaged in foodproduction will be given group relief
184
for the losses incurred by subsidiarycompany before it records any profit;AND
(ii) the subsidiary company undertakingfood production be given incometax exemption of 100% on itsstatutory income for 10 yearscommencing from the first year thecompany enjoys profit in which:
(a) losses incurred during theexemption period is alsoallowed to be brought forwardafter the exemption period of10 years; and
(b) dividends paid from theexempt income be exemptedin the hand of theshareholders
The incentives are granted with thefollowing conditions:
(i) the investing company should own100% of the subsidiary companythat undertakes food production;
(ii) the eligible food products are asapproved by the Minister of Finance.Initially the approved food productsare kenaf, vegetables, fruits, herbs,spices, aquaculture and rearing ofcattle, goat and sheep; and
(iii) the food production project shouldcommence within a period of oneyear from the date the incentive isapproved.
Application for these incentives should besubmitted to the Ministry of Agriculturebefore 31 December 2003 for the approvalof the Minister Of Finance .
(2) Investment Allowance (IA) (Schedule 7B)
IA is an alternative to income tax exemptionunder section 127 for companies undertakingASP. Under the IA, the quantum of allowancevaries as follows:
(i) companies under taking ASP will begranted IA of 60% in respect of qualifying
capital expenditure incurred within 5 yearsfrom the date the capital expenditure isfirst incurred. The allowance can beutilised to set off against 70% of thestatutory income;
(ii) companies undertaking ASP in Sabah,Sarawak and the designated easterncorridor of Peninsular Malaysia will begranted IA of 80% in respect of qualifyingcapital expenditure incurred within 5 yearsfrom the date the capital expenditure isfirst incurred. The allowance can beutilised to set off against 85% of thestatutory income;
(iii) companies undertaking ASP of nationaland strategic importance will be grantedIA of 100% in respect of qualifying capitalexpenditure incurred within 5 years fromthe date the capital expenditure is firstincurred. The allowance can be utilisedto set off against 100% of statutoryincome.
Note:
• Dividends paid out of tax-exempt incometo shareholders will also be exempted.
• Any unutilised allowance can be carriedto the subsequent years until it is fullyutilised.
(3) Reinvestment Allowance (RA)
RA is given to manufacturing and agriculturalcompanies producing essential food (rice, maize,vegetable, tubers, livestock farming, productionof aquatic products and any other activitiesapproved by the Minister of Finance) undertakingexpansion, modernisation and diversificationactivities.
The level of RA granted are as follows:
(a) Projects in promoted areas such as Sabah,Sarawak and designated Eastern Corridorof Peninsular Malaysia which coversKelantan, Terengganu, Pahang and thedistrict of Mersing in Johor.
— RA of 60% in respect of qualifyingcapital expenditure incurred. The
185
allowance can be utilised to set offagainst 100% of statutory incomein the year of assessment.
(b) Projects in non-promoted areas (WesternCorridor of Peninsular Malaysia);
(i) The RA of 60% in respect ofqualifying capital expenditure. Theallowance can be utilised to set offup to 70% of statutory income inthe assessment year. The balanceof the statutory income will be taxedat the prevailing company tax rate.
(ii) Companies that carry outreinvestment which can improvetheir productivity level significantlywill be granted RA of 60% whichis allowed to be utilised to set offagainst 100% of statutory income.
Definit ion of “signif icant increase inproductivity”
The process eff iciency ratio(PER) hasincreased by at least the same rate as the GDPgrowth rate for that industry.
Formula : Process Efficiency Ratio (PER)
PER = Total Output – BIMSTotal Input – BIMS
Whereby, BIMS (Bought in materials andservices) is defined as value of materialsconsumed in the production process (includingpayment for the transport, tax paid includingthose on materials) + value of equipment usedsuch as packaging materials, daily used materials(including off ice stationery, materials forimprovement and maintenance) + publicationcost + lubricants + cost of goods sold in samecondition such as utilities (water, electricity andfuels) + payments to contractors + payment toindustrial work done by others + payment fornon-industrial services.
Eligibility criteria:
(i) The company must be in operation for atleast 12 months.
(ii) The RA will be given for a period of 5years beginning from the year the firstreinvestment is made;
(iii) Assets acquired from RA cannot bedisposed within 2 years of reinvestment.
(4) Double Deduction Incentive
i. Research & Development (R&D)
The types of R&D that are eligible for thedouble deduction are :
(a) Approved Research- Section 34A ofIncome Tax Act 1967
Double Deduction on non-capitalexpenditure incurred on research anddevelopment approved by the Ministerof Finance(delegated to the InlandRevenue Board).
(b) Payment for Services- Section 34B (1)(b) & (c) Double deduction on paymentfor use of services of:
(i) approved research institutions;*
(ii) approved research anddevelopment (R&D) company;**
(iii) a contract research anddevelopment (R&D) company.**
Note:
*Approved research institution includesthe following:
(i) al l government researchinstitutions, including institutionscorporatised under Section 24 ofthe Companies Act 1965;
(ii) government funded universitieswhich undertake research thatconform to the definition of R &Das indicated above.
186
** R&D company or contract R&Dcompany refer to companieswhich are established inconformity with Section 2 of thePromotion of Investments Act1986.
(c) Cash Contributions Section34B (1) (a)
Double deduction on cashcontributions made to approvedresearch institutions. The list ofapproved research institutions asat 19 October 2001 are:
(i) Malaysian Agr iculturalResearch and DevelopmentInstitute (MARDI)
(ii) Rubber Research Instituteof Malaysia (RRI)
(iii) Forest Research InstituteMalaysia (FRIM)
(iv) Malaysian Institute of MicroElectronic System (MIMOS)
(v) Palm Oil Research Instituteof Malaysia (PORIM)
(vi) Standard and IndustrialResearch Institute ofMalaysia (SIRIM)
(vii) Mineral Research Institute
(viii) Malaysian Centre forRemote Sensing (MACRES)
(ix) Veter inary ResearchInstitute
(x) Fisheries Research Institute
(xi) Institute for MedicalResearch (IMR)
(xii) Malaysian Institute forNuclear TechnologyResearch (MINT)
(xiii) Unit PengurusanPenyelidikan, Universit iKebangsaan Malaysia(UKM)
(xiv) Pusat Inovasi danPerundingan, Universit iSains Malaysia (USM)
(xv) Pusat Penyelidikan danPerundingan, Universit iUtara Malaysia (UUM)
(xvi) Unit Penyelidikan, UniversitiPutra Malaysia (UPM)
(xvii) Pusat Penyelidikan,Universit i IslamAntarabangsa Malaysia(UIAM)
(xviii) Unit Perundingan, UniversitiMalaya (UM)
(xix) Unit Penyelidikan danPembangunan, UniversitiTeknologi Malaysia (UTM)
(xx) Unit Penyelidikan, UniversitiMalaysia Sabah (UMS)
(xxi) Unit Pemindahan Teknologi& Perundingan, UniversitiMalaysia Sarawak (Unimas)
(xxii) Pusat Sains dan TeknologiPertahanan, KementerianPertahanan
(xxiii) Biro Penyelidikan danPerundingan, Universit iTeknologi MARA (UiTM)
For purposes of this incentive , R&Dis defined as follows:
“Research and development (R&D)means any systematic or intensivestudy undertaken in the field ofscience or technology with the objectof using the results of the study forthe production or improvement ofmaterials, devices, products,produce or processes but does notinclude:
(i) quality control of products orroutine testing of materials,devices, products or produce;
(ii) research in the socialsciences or the humanities;
187
(iii) routine data collection;
(iv) eff iciency surveys ormanagement studies;
(v) market research or salespromotion; and
(vi) with effect from year ofassessment 1998, a companycarried out designing orprototyping as anindependent activity will alsoqualify for R&D incentives”
ii. Training
Effective from 1 July 1993 double deductionfor expenses on training will be considered onlyfor companies which do not contribute to theHuman Resource Development Fund (HRDF)and the trainees must be full-time employeeswho are Malaysian citizens.
(a) Approved Training Institutions
Companies, including those in theservices sector not covered by the HumanResources Development Fund (HRDF)are eligible for double deductions ontraining expenses if such training wereto be undertaken in approved traininginstitution or government traininginstitutions. Companies undertakingtraining in approved training institutionscould claim double deduction on expensesbilled by the respective approved traininginstitutions. (No other expenses areallowed for double deduction). Theapproved training institutions as at 19October 2001 are as follows:
(i) National Productivity Corporation(NPC)
(ii) Standard and Industrial ResearchInstitute of Malaysia (SIRIM)
(iii) Universiti Teknologi Mara (UiTM)
(iv) Malaysian Agricultural Researchand Development Institute(MARDI)
(v) Forest Research Institute ofMalaysia (FRIM)
(vi) The Centre For Instructor andAdvanced Skill Training (CIAST)
(vii) Penang Skil ls DevelopmentCentre (PSDC)
(viii) Institut Kemahiran Mara (IKM)
(ix) Industrial Training Institute (ITI)
(x) German-Malaysia Institute (GMI)
(xi) Malaysia Timber Industry Board(MTIB)
(xii) Federation of MalaysianManufacturer - Entrepreneur andSkills Development Centre (FMM-ESDC) (certain programmes only)
(xiii) Perak Entrepreneur and SkillsDevelopment Centre (PESDC)
(xiv) Tuas Polytech (British MalaysianInstitute)
(xv) ASEAN Timber TechnologyCentre (ATTC)
(xvi) Sarawak Timber IndustryDevelopment Corporation(STIDC)
(xvii) Kedah Industrial Skil ls &Management DevelopmentCentre (KISMEC)
(xviii) Malaysia France Institute (MFI)
(xix) Selangor Human ResourceDevelopment Centre (SHRDC)
(xx) Pusat Pembangunan TenagaIndustri Johor (PUSPATRI)
(xxi) Malaysian Institute of NeuclearTechnology (MINT)
(xxii) Pahang Skil ls DevelopmentCentre
(b) Approved Training Programmes
(i) Manufacturing companies inproduction
Manufacturing companies under-taking training programmes locallyor overseas approved by MIDA forthe purpose of upgrading/developing
188
craft, supervisory skills, technicalskil ls, productivity and qualityimprovements.
(ii) Manufacturing companies not yetin production
Qualified manufacturing companiesundertaking training programmesthat are approved by MIDA for thepurpose acquiring/developing craft,supervisory or technical skills, thatcan contribute to future production.
(iii) Training for handicapped person
A company which incurred trainingexpenses in the training of anyhandicapped person who is not anemployee of the company. Thetraining should be done either in-house or at any approved traininginstitution in Malaysia. Suchhandicapped person must beclassified as handicapped by theMinistry of National Unity and SocialDevelopment and the trainingundertaken must serve to enhancehis/her employment prospect.
(iv) Tourism Industry
Companies in the hotel or touroperating business which undertaketraining for the purpose of upgradingthe level of skills and professionalismin the tourism industry and approvedby the Minister of Culture, Arts andTourism.
(iv) Non-manufacturing Companies
Non-manufacturing companies thatsend their employees to attendtraining programmes approvedby the Ministry of Finance inthe following institutions as at19 October 2001 are:
(a) Institute Bank-Bank Malaysia(IBBM)
(b) Malaysian Insurance Institute(MII)
(c) Persekutuan Penghantar FretMalaysia
(d) Association of ConsultingEngineers Malaysia (ACEM)
(e) Persatuan Elektrik &Elektronik
(f) AFCM Training Services Sdn.Bhd
(g) Institut Pengurusan (Malaysia(MIM)
(h) Institut Jurutera Malaysia(IEM)
iii. Freight Charges
(a) Double deduction on freight charges formanufacturers in Sabah & Sarawak whoexport rattan and wood-based products.
(b) Double deduction on freight charges forall manufacturers who ship their goodsfrom Sabah & Sarawak to PeninsularMalaysia provided they use the ports inPeninsular Malaysia. This incentive iseffective from the year of assessment2000 (current year basis).
iv. Insurance Premiums
(a) Double deduction on premiums paid forexport credit insurance.
(b) Double deduction on insurance premiumspaid for the import of goods providedthe risk are insured with an insurancecompany incorporated in Malaysia.
(c) Double deduction on insurance premiumspaid for export of goods provided therisk are insured with an insurancecompany incorporated in Malaysia.
v. Overseas Promotion
(a) Tourism Industry
Double deduction for tourism industry isgranted on expenditure incurred by hotels
189
and tour operators for overseaspromotions as follows:
(i) expenditure on publicity andadvertisement in any mass mediaoutside Malaysia;
(ii) expenditure on the publication ofbrochures, magazines and guidebooks, including delivery costswhich are not charged to theoverseas customers;
(iii) expenditure on market researchto explore for new marketsoverseas, subject to the priorapproval of the Ministry of Culture,Arts and Tourism;
(iv) expenditure which includes faresto any country outside Malaysiafor purposes of negotiating orsecuring a contract for advertisingor participating in trade fairs,conferences or forum approved bythe Ministry of Culture, Arts andTour ism. Such expenses aresubject to a maximum for RM200per day for lodging and RM100per day for food for the durationof the stay overseas;
(v) expenditure for organising tradefairs, conferences or forumapproved by the Ministry of Culture,Arts and Tourism; and
(vi) maintenance of sales off iceoverseas.
(b) Approved International Trade Fairs
Double deduction is al lowed forexpenditure incurred by a company forparticipating in an approved internationaltrade fair held in Malaysia.
(c) Export of services
Double deduction incentive on expensesincurred pertaining to promotion of exportof services, which is currently availableto the tourism sub sector, is extended tothe entire services sector.
The expenses eligible for doublededuction are as follows:
(i) export market research;
(ii) preparation of tenders for thesupply of services overseas;
(iii) supply of technical informationabroad;
(iv) fares in respect of overseasbusiness travel by employees;
(v) accommodation and sustenanceexpenses incurred by Malaysianbusinessmen going overseas forbusiness, subject to RM200 perday for lodging and RM100 perday for food;
(vi) cost of maintaining office overseasfor purpose of promotion ofservices; and
(vii) professional fees incurred inpackaging design for exports.
Double deduction on promotion of exportof services for companies eligible for taxincentives under Section 127 or Schedule7B of the Income Tax Act 1967, is allowedto be accumulated and offset against theirpost-exemption income.
vi. Promotion of Local Brand Name
Double deduction is granted for ‘qualifyingadvertising expenditure’ incurred withinMalaysia in respect of Malaysian brand namegoods.
For purposes of this incentive the ‘qualifyingadvertising expenditure’ refers to thefollowing:
(a) advertisements on the Internet wherethe host website is located inMalaysia;
(b) advertisements in magazines andnewspaper where the magazines andnewpapers are printed in Malaysia;
(c) advertisements on local licensedtelevision stations;
190
(d) advertisements approved by therelevant local authority onadvertisement hoardings located inMalaysia;
(e) advertisements in trade publicationswhere the trade publications areprinted in Malaysia;
(f) advertisements in any form in thecourse of sponsoring an approvedinternational sporting event inMalaysia; and
(g) advertisements in any form in thecourse of sponsoring an approvedinternational trade conference or anapproved international trade exhibitionheld in Malaysia.
To be eligible for this incentive, the localbrands must satisfy the following criteria:
(a) brand name is owned by a companywhich is locally incorporated with atleast 70% Malaysian owned;
(b) the brand name is registered inMalaysia;
(c) the brand name product must achieveexport quality standards; and
(d) expenditure incurred in advertisingmust be incurred in Malaysia.
(5) Single Deduction
(a) Approved Investment Overseas.
Single deduction on pre-operatingexpenses such as cost of market researchfor approved investment overseas.
(b) Training Expenses.
Single deduction on pre-operating trainingexpenses incurred by any company.
(c) Technical or Vocational Training Institute.
Single deduction for contribution in cashto a technical or vocational traininginstitute established and maintained bythe Government or statutory body.
(d) Organisation for the Promotion andConservation of the Environment.
Single deduction for donations to anapproved organisation establishedexclusively for the protection andconservation of the environment.
(e) Single deduction for gift under Section44(6A).
Single deduction for an amount equal tovalue as determined by the Departmentof Museums & Antiquities, the NationalArchives or National Art Gallery of anygift or artefact or manuscript made tothe State/National Art Gallery,Government or State Government.
(f) Single deduction for an amount equal toexpenditure incurred:
(i) on the provision of services, publicamenities and contribution to acharity or community projectpertaining to education, health,housing and infrastructure andinformation & communicationtechnology approved by theMinister of Finance.
(ii) on the provision and maintenanceof a child care centre for the benefitof persons employed by him inhis business;
(iii) in establishing and managing amusical or cultural group approvedby the Minister;
(iv) on sponsoring local and foreigncultural performances approved bythe Ministry of Culture, Art andTourism.
(v) as operational expenditureincluding payments to consultantsrelated to the usage of IT toimprove management andproduction processes,
(vi) in obtaining quality systems andstandards and halal certification.
191
(6) Industrial Building Allowance
Industrial Building Allowance (IBA) is grantedto companies incurring capital expenditure onconstruction or purchase of a building which isused for specific operational purposes as perSchedule 3 of the Income Tax Act 1967.
The IBA consists of a normal IBA which wouldenable the capital expenditure to be fully utilizedwithin 45 years by allowing an initial allowanceof 10% and an annual allowance of 2%. Whereasa special IBA to enable the capital expenditureto be utilized within a shorter period is given byallowing allowances at higher rates.
For normal IBA, it is granted to a buildingused for the purposes of a business and thebuilding is used as:
(a) a factory;
(b) a dock, wharf, jetty or other similar building;
(c) a warehouse and the business consistsor mainly consists of the hire of storagespace to the public;
(d) water or electricity supply projects ortelecommunication project for the public;
(e) a licenced private hospital, maternity homeand nursing home;
(f) a hotel building which has been constructedor purchased during the Pioneer Statusor Investment Tax Allowance incentiveperiod;
(g) a public road or ancillary structures whichexpenditure is recoverable through tollcollection;
(h) a building to carry out an Approved ServiceSector Projects;
(i) a building constructed by a person pursuantto an agreement entered into betweenthat person and the government on a build-lease - transfer basis subject to theapproval of the Minister;
(j) in connection with the working of a farmand the business consists or mainlyconsists of the working of the farm, withor without other farms;
(k) in connection with the working of a mineand the business consists or mainlyconsists of the working of a mine, withor without other mines; and
(l) for the purpose of research approved bythe Minister, research and employeestraining undertaken by a company whichis participating in industrial adjustmentproject approved under the Promotion ofInvestment Act 1986 and researchundertaken by a research and developmentcompany or a contract research anddevelopment company as defined underSection 2 of the Promotion of InvestmentAct 1986.
A special IBA is given in the form of 10%allowance of the expenditure incurred for theconstruction or purchase of buildings. This wouldenable the expenditure to be fully utilised within10 years on the followings:
(a) buildings which are used for the purposesof storage of goods for exports or for thestorage of imported goods which are tobe processed and distributed or re-export;
(b) buildings for the purposes of industrial,technical or vocational training approvedby the Minister;
(c) buildings for a school or an educationalinstitution approved by the Minister ofEducation;
(d) buildings for the purposes of l ivingaccommodation for employees inmanufacturing, Approved Services Projectand hotel or tourism business;
(e) buildings for the purposes of the provisionof child care facilities for employees.
A more special IBA is given in the form of20% allowance to enable the expenditure to befully utilized within 5 years to a building usedfor the purposes of a business of that personwhich consists wholly or partly of the workingof the farm, or the construction on that farm ofa building which is provided by that person forthe welfare of persons, or as living accommodationfor a person employed in or in connection withthe working of that farm.
192
(7) Accelerated Capital Allowance
(a) Computer and information technologyassets.
Initial allowance of 20% and annualallowance of 40%.
(b) Environmental protection equipment.
Initial allowance of 40% and annualallowance of 20%.
(c) Deduction for acquiring property rights
Capital expenditure on acquiring proprietaryrights such as patent, industrial designand trademarks is allowed as deductionof 10% on the cost of the acquisition ofthe proprietary rights for 10 years.
(8) Deduction for Capital Expenditure onApproved Agricultural Projects
Capital expenditure on approved agriculturalprojects under schedule 4A of the Income TaxAct, 1967 allows a person carrying on an approvedagricultural project to elect so that the qualifyingcapital expenditure incurred by him in respect ofthat project is deducted from his aggregateincome, including income from other sources.Where there is insufficient aggregate income forthe qualifying farm, expenditure to be deductedfrom the unabsorbed expenditure will be carriedforward to subsequent years of assessment heso elects, he will not be entitled to any capitalallowance or agricultural allowance on that samecapital expenditure.
This incentive is not available to companieswhich have been granted incentive under thePromotion of Investment Act, 1986 and therepealed Investment Incentive Act, 1968 andwhose tax relief period have not started or havenot expired.
The qualifying capital expenditure eligible fordeduction for purposes of this incentive are asfollows:
(a) the clearing and preparation of land;
(b) the planting (but not replanting) of a croprelating to an approved agriculturalproject;
(c) the construction on a farm of a road orbridge;
(d) the construction on a farm of a buildingused for the purposes of an approvedagricultural project which is carried outon that farm or the construction on thatfarm of building provided for the welfareand accommodation or persons employedin that project and which, if that projectceased to be carried out, is likely to belittle or no value to any person except inconnection with the working of anotherfarm;
(e) the construction of a pond or the installationof an irrigation or drainage system whichis used for the purposed of an approvedagricultural project.
Only expenditure incurred within a specifictime frame and in respect of a farm cultivationand utilising a specified minimum hectarage foreach approved project as stipulated by the Ministerof Finance will qualify. The approved projectsare as follows:
Project Period MinimumHectarage
1. Aquaculture (Prawns) 2 years 40 hectares
2. Cultivation of Crops:
Papaya 1 year 40 hectares
bananas 1 year 40 hectares
passion fruit 1 year 40 hectares
star fruit 2 years 8 hectares
guava (jambu) 2 years 8 hectares
mangosteen 7 years 8 hectares
3. Floriculture* 2 years 8 hectares
* (Plants, bulbs, tubers and roots with orwithout flowerbuds, of the kind specified inchapter 6 of the Custom Duties Order 1988,which are suitable for planting or ornamentaluse, excluding mushroom spawn, buddedor seedling rubber stumps and rubberbudwood.
193
(9) Special Tax Treatment for Gift
(a) Training Activity
Special tax treatment for donation of usedmachinery or equipment, to a technicalor vocational training institute establishedand maintained by the Government orstatutory body or technical or vocationaltraining institute approved by the Ministerof Finance.
(b) Research Activity
Special tax treatment for donation of usedmachinery or equipment to approvedresearch institutes.
(c) For both (a) & (b)
The disposal value of such machineryor equipment is deemed as zero. Anyunutilised capital allowance (residualexpenditure) in respect of the machineryor equipment will be given full deductionin the year of assessment in which themachinery or equipment are donated.
Prior to this, the disposal value of suchgifts is taken to be the market value andif the value is higher than the utilisedcapital allowance, the donor is subjectto tax on the balancing charge.
(10) Tax Exemption to Promote Labuan asInternational Offshore Financial Centre(IOFC)
(i) Dividends received from an offshorecompany, which are paid, creditedor distributed out of income derivedfrom an offshore business activity isexempted from income tax. If theshareholder of the offshore companyis a domestic company in Malaysia,the income from such dividendsenjoys second-tier exemption.
(ii) Royalties received from an offshorecompany by a non-resident or anotheroffshore company is exempted fromincome tax.
(iii) Interest received from an offshorecompany by a non-resident or anotheroffshore company is exempted fromincome tax.
(iv) Technical and management feesreceived from an offshore companyby a non-resident or another offshorecompany is exempted from incometax.
(v) Distributions received from anoffshore trust by the beneficiaries areexempted from tax.
(vi) Documents for offshore businessactivities, transfer of shares in anoffshore company and Memorandum& Articles of Association of an offshorecompany is exempted from stampduty.
(vii) 65% tax exemption on statutoryincome of Labuan trust company andservice providers providing qualifyingprofessional services of accounting,f inancial, legal and secretarialservices to offshore company untilthe year of assessment 2004.
(viii) 50% tax exemption on gross incomeof non-citizen employee working ina managerial capacity in an offshorecompany until the year of assessment2004
(ix) 50% tax exemption on gross incomeof a non-citizen trust officer workingin a trust company until the year ofassessment 2004.
(x) 50% tax exemption on Labuan andhousing allowances of citizen workingin an offshore company andgovernment services in Labuan.
(xi) Withholding tax exemption on rentalpayment to non-residents from theuse of moveable property by anoffshore leasing company.
(xii) Duty free goods for individuals whoseperiod of stay in Labuan is 24 hours(formerly 72 hours).
194
C. Labuan Offshore Business ActivityTax Act 1990 (LOBATA)
I. Offshore companies in Labuanundertaking offshore trading activitiescan choose either to:
(i) pay tax at a rate of 3% from thenet profit; or
(ii) pay RM20,000.
II. Income of offshore companies from non-trading activities is not subject to anytax.
III. Where an offshore company carryingon both offshore trading and non-tradingactivity, it is deemed to be carrying onoffshore trading activity.
D. Customs Act 1967, Sales Tax Act1972, Excise Act 1976 and FreeZones Act 1990
(1) Manufacturing Sector
(a) Import duty exemption on rawmaterials/components used in:
(i) Production for export market
Raw materials/componentsused directly and notmanufactured locally, ormanufactured locally but notof acceptable quality andprice.
(ii) Production for domesticmarket
Raw materials/componentsused directly and not availablelocally, with effect from IJanuary 1999.
(b) Import duty/excise duty and SalesTax exemption for machinery andequipment
(i) not available locally and useddirectly in the manufacturingprocess;
(ii) locally purchased machinery/equipment used directly in themanufacturing process.
Duty exemption on spares andconsumables was withdrawn in1996 to encourage domesticproduction. However to reduce costof production in the midst ofeconomic turmoil, duty exemptionwas granted selectively based onspecific criteria until 31 December2003. The criteria are as follows:
(i) Company must export at least80% of their production;
(ii) spares and consumables thathave limited demand and notfeasible for domesticproduction;
(iii) Import duty on such itemsexceed 5%.
(c) Duty Drawback
Manufacturers who have paid dutyon the import of raw materials &components used for theproduction of goods for exportwithin a year are eligible to claimdrawback on the duty paid.Drawback can be claimed from theCustoms Department but subjectto the conditions under Section99 of the Customs Act, 1967.
(d) Sales Tax Exemption
Manufacturers of taxable goodswith annual sales turnoverexceeding RM100,000 are requiredto be licensed under Sales TaxAct 1972 and be eligible forexemption from sales tax on inputs(in line with single stage taxconcept) . However manufacturerswith annual sales turnover lessthan RM100,000, have the optioneither to obtain exemption fromsales tax on inputs (by beinglicensed) or pay sales tax on inputsbut enjoy exemption on output.
195
There are few categories of goodsexempted at both the input andoutput stage, i.e all goods(includingpacking materials) used in themanufacture of the following;
(i) controlled articles(goods);
(ii) pharmaceutical products;
(iii) milk products;
(iv) batik fabrics;
(v) perfumes and eau d’ toilette,beauty or make-uppreparations, photographiccameras, wrist-watches,pens;
(vi) computers and computersperipherals, parts andaccessories;
(vii) carton boxes, corrugatedpaper or paperboard, foldingcarton boxes and cases ofnon-corrugated paper andpaperboard;
(viii) products in the printingindustry;
(ix) agricultural or horticulturalsprayers;
(x) plywood;
(xi) re-treaded tyres;
(xii) uninterruptible powersystems;
(xiii) machinery; and
(xiv) manufactured goods forexport.
(2) Agricultural Sector
(a) Full import duty exemption on rawmaterials/components used in:
(i) Production for export market.Imported direct raw materials/components not availablelocally or available locally butnot of acceptable quality andprice.
(ii) Production for domesticmarket.Direct raw materials/components not availablelocally.
(b) Full import/excise duty and salestax exemption on machinery/equipment
Full exemption from:
(i) imported machinery/equipment not availablelocally.
(ii) locally purchased machinery/equipment.
(3) Service Sector
(a) Import duty and sales taxexemption on raw materials/components for imported rawmaterials/components used directlyin the implementation of ASP andare not available locally.
(b) Excise duty and sales taxexemption on machinery/equipment for locally purchasedmachinery/equipment used in theimplementation of ASP.
(4) Tourism Sector
Duty exemption on materials/equipment for accommodation andnon-accommodation tourism projects
Full exemption from:
(a) import duty and sales tax onidentified imported materials/equipment.
(b) sales tax and excise duty onidentified locally purchasedequipment.
(5) Film & Music Sector
Duty exemption on equipment forrecording studios, production housesand cineplexes.
196
Full exemption from:
(a) import duty and sales tax onidentified imported equipments.
(b) sales tax and excise duty onselected locally purchasedequipment.
(6) Research Activity
Duty exemption on machinery/equipment, materials, raw materialsand samples used for approvedresearch projects, in house research,contract research and developmentcompany .
Full exemption from:
(a) import duty and sales tax onimported items.
(b) sales tax and excise duty onlocally purchased items.
(7) Training Activity
Duty exemption on machinery/equipment, materials, raw materialsand samples used in approved trainingprogramme or by an approved traininginstitution and technical or vocationaltraining company.
Full exemption from:
(a) import duty and sales tax onimported items.
(b) sales tax and excise duties onlocally purchased items.
(8) Environment Protection
(a) Manufacturing companies thatpurchase machinery/equipment forpollution control.
Full exemption from:
(i) import duty and sales tax onimported machinery/equipment not availablelocally.
(ii) sales tax and excise duty onlocally purchased machinery/equipment.
(b) Companies undertaking storage,treatment and disposal of toxic andhazardous wastes.
Full exemption from:
(i) import duty and sales tax onimported machinery/equipment that are notavailable locally.
(ii) sales tax and excise duty onlocally purchased machinery/equipment.
The level and criteria ofexemption on raw material/component are the same asthe exemption on rawmaterial/component for themanufacturing sector.
(c) Catalytic Converters
Exemption from import duty andsales tax on catalytic convertorsused in motor vehicle assemblers.
(d) Companies providing energyconservation services &Companies which incur capitalexpenditure arising from energyconservation measures undertakenin their own company.
Full exemption from:
(i) import duty and sales tax onimported machinery/equipment that are notavailable locally.
(ii) sales tax and excise duty onlocally purchased machinery/equipment.
197
(e) Companies utilising biomass as anew source of energy.
Full exemption from:
(i) import duty and sales tax onimported machinery/equipment that are notavailable locally.
(ii) sales tax and excise duty onlocally purchased machinery/equipment.
(9) All goods except petroleum andpetroleum products are exemptedfrom sales tax, as Labuan is a freeport.
(10) Incentives for InternationalProcurement Centres (IPCs)
IPC are exempted from import dutieson raw materials, components andfinished products into the FreeZone or Licensed ManufacturingWarehouses under section 11, FreeZones Act 1990 and section 14,Customs Act 1967.
Non-tax incentives includes:
(a) expatriate posts will be approvedbased on requirement of IPC;
(b) open one or more foreigncurrency accounts with anylicensed commercial bank toretain their export proceedswithout any limit imposed;
(c) enter into foreign exchangeforward contracts with anylicensed commercial bank to sellforward export proceeds basedon projected sales; and
(d) exempted from the requirementsof the Ministry of Domestic Tradeand Consumer Affairs Guidelineson foreign equity ownership onwholesale and retail trade.
The term IPC refers to a locallyincorporated company, local or foreignowned, which carries on a businessin Malaysia to undertake procurement
and sales of raw materials, componentsand finished products from local orthird countries to its group of relatedand unrelated companies in Malaysiaor abroad.
In order to qualify for the whole packageof incentives offered, the IPC must bean ‘approved IPC status company’.To qualify as an ‘approved IPC statuscompany ’ it must satisfy the followingconditions:
(a) locally incorporated under theCompany’s Act 1965 with aminimum paid-up capital ofRM0.5 million;
(b) a minimum total operatingexpenditure of RM1.5 million peryear;
(c) a minimum annual businessturnover (sales) of RM100million; and
(d) goods to be handled directlythrough Malaysian ports andairports.
SUMMARY OF DIRECT & INDIRECTTAX INCENTIVES BY SECTORS
(1) Manufacturing Sector
(a) Pioneer Status or Investment TaxAllowance
(b) Industrial Adjustment Allowance
(c) Infrastructure Allowance
(d) Reinvestment Allowance
(e) Industrial Building Allowance
(f) Double deduction on expenses for exportpromotion
(g) Double deduction for participating inapproved international trade fair inMalaysia
(h) Double deduction for promotion ofMalaysian brand names
(i) Double deduction incentive for researchand development
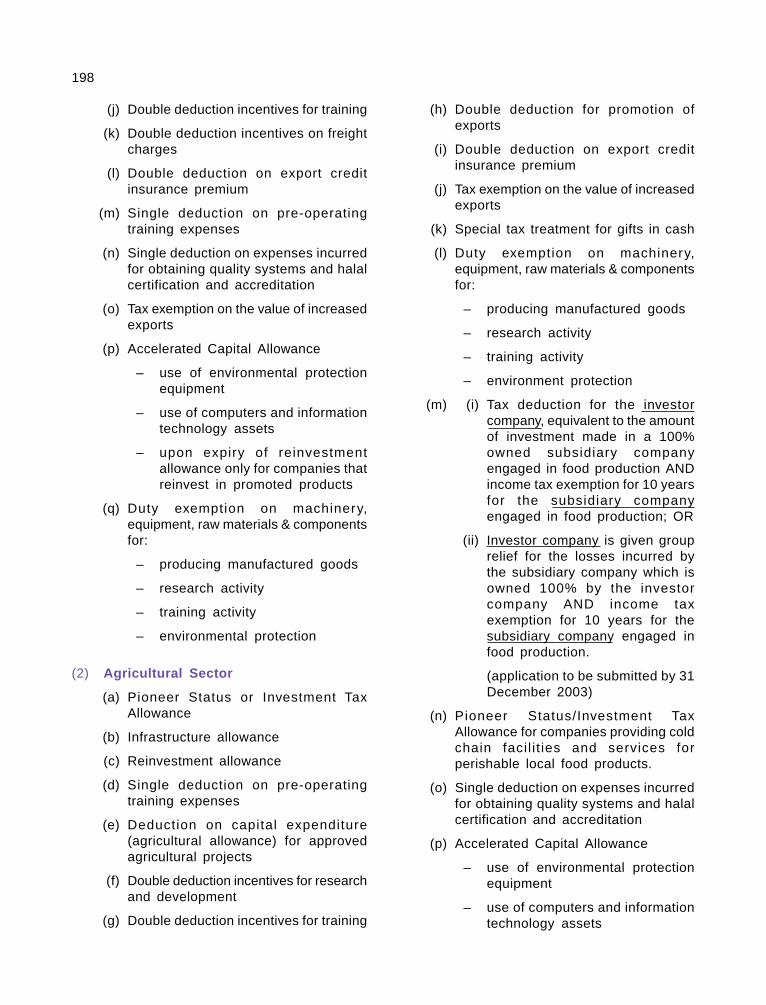
198
(j) Double deduction incentives for training
(k) Double deduction incentives on freightcharges
(l) Double deduction on export creditinsurance premium
(m) Single deduction on pre-operatingtraining expenses
(n) Single deduction on expenses incurredfor obtaining quality systems and halalcertification and accreditation
(o) Tax exemption on the value of increasedexports
(p) Accelerated Capital Allowance
– use of environmental protectionequipment
– use of computers and informationtechnology assets
– upon expiry of reinvestmentallowance only for companies thatreinvest in promoted products
(q) Duty exemption on machinery,equipment, raw materials & componentsfor:
– producing manufactured goods
– research activity
– training activity
– environmental protection
(2) Agricultural Sector
(a) Pioneer Status or Investment TaxAllowance
(b) Infrastructure allowance
(c) Reinvestment allowance
(d) Single deduction on pre-operatingtraining expenses
(e) Deduction on capital expenditure(agricultural allowance) for approvedagricultural projects
(f) Double deduction incentives for researchand development
(g) Double deduction incentives for training
(h) Double deduction for promotion ofexports
(i) Double deduction on export creditinsurance premium
(j) Tax exemption on the value of increasedexports
(k) Special tax treatment for gifts in cash
(l) Duty exemption on machinery,equipment, raw materials & componentsfor:
– producing manufactured goods
– research activity
– training activity
– environment protection
(m) (i) Tax deduction for the investorcompany, equivalent to the amountof investment made in a 100%owned subsidiary companyengaged in food production ANDincome tax exemption for 10 yearsfor the subsidiary companyengaged in food production; OR
(ii) Investor company is given grouprelief for the losses incurred bythe subsidiary company which isowned 100% by the investorcompany AND income taxexemption for 10 years for thesubsidiary company engaged infood production.
(application to be submitted by 31December 2003)
(n) Pioneer Status/Investment TaxAllowance for companies providing coldchain facil i t ies and services forperishable local food products.
(o) Single deduction on expenses incurredfor obtaining quality systems and halalcertification and accreditation
(p) Accelerated Capital Allowance
– use of environmental protectionequipment
– use of computers and informationtechnology assets
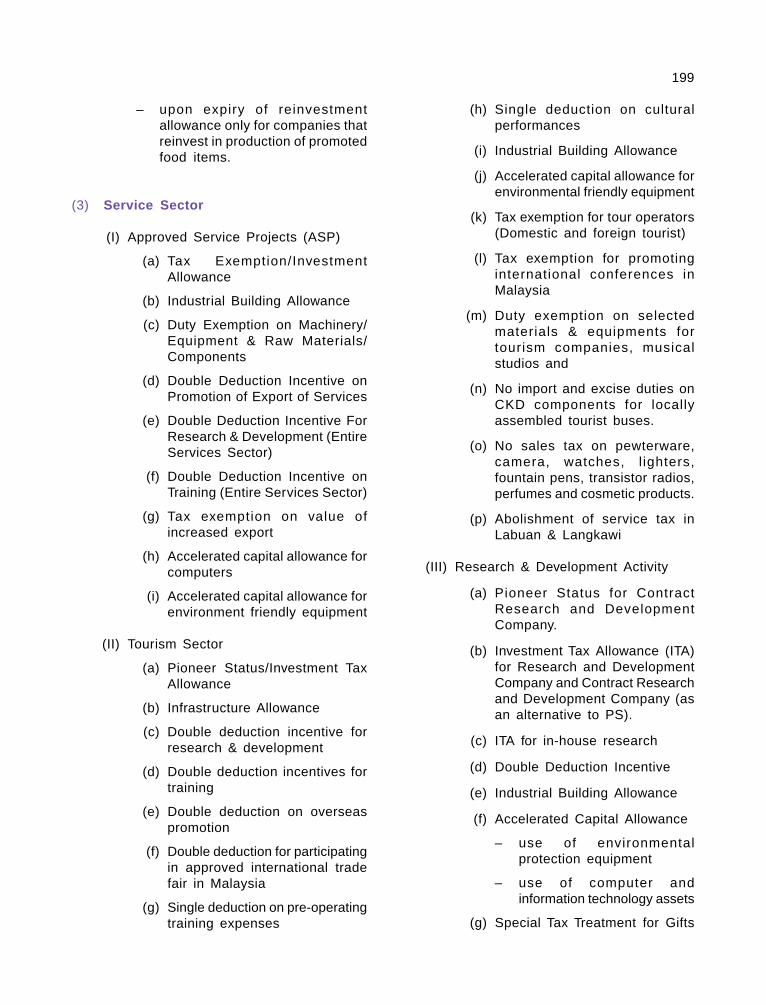
199
– upon expiry of reinvestmentallowance only for companies thatreinvest in production of promotedfood items.
(3) Service Sector
(I) Approved Service Projects (ASP)
(a) Tax Exemption/InvestmentAllowance
(b) Industrial Building Allowance
(c) Duty Exemption on Machinery/Equipment & Raw Materials/Components
(d) Double Deduction Incentive onPromotion of Export of Services
(e) Double Deduction Incentive ForResearch & Development (EntireServices Sector)
(f) Double Deduction Incentive onTraining (Entire Services Sector)
(g) Tax exemption on value ofincreased export
(h) Accelerated capital allowance forcomputers
(i) Accelerated capital allowance forenvironment friendly equipment
(II) Tourism Sector
(a) Pioneer Status/Investment TaxAllowance
(b) Infrastructure Allowance
(c) Double deduction incentive forresearch & development
(d) Double deduction incentives fortraining
(e) Double deduction on overseaspromotion
(f) Double deduction for participatingin approved international tradefair in Malaysia
(g) Single deduction on pre-operatingtraining expenses
(h) Single deduction on culturalperformances
(i) Industrial Building Allowance
(j) Accelerated capital allowance forenvironmental friendly equipment
(k) Tax exemption for tour operators(Domestic and foreign tourist)
(l) Tax exemption for promotinginternational conferences inMalaysia
(m) Duty exemption on selectedmaterials & equipments fortourism companies, musicalstudios and
(n) No import and excise duties onCKD components for locallyassembled tourist buses.
(o) No sales tax on pewterware,camera, watches, l ighters,fountain pens, transistor radios,perfumes and cosmetic products.
(p) Abolishment of service tax inLabuan & Langkawi
(III) Research & Development Activity
(a) Pioneer Status for ContractResearch and DevelopmentCompany.
(b) Investment Tax Allowance (ITA)for Research and DevelopmentCompany and Contract Researchand Development Company (asan alternative to PS).
(c) ITA for in-house research
(d) Double Deduction Incentive
(e) Industrial Building Allowance
(f) Accelerated Capital Allowance
– use of environmentalprotection equipment
– use of computer andinformation technology assets
(g) Special Tax Treatment for Gifts
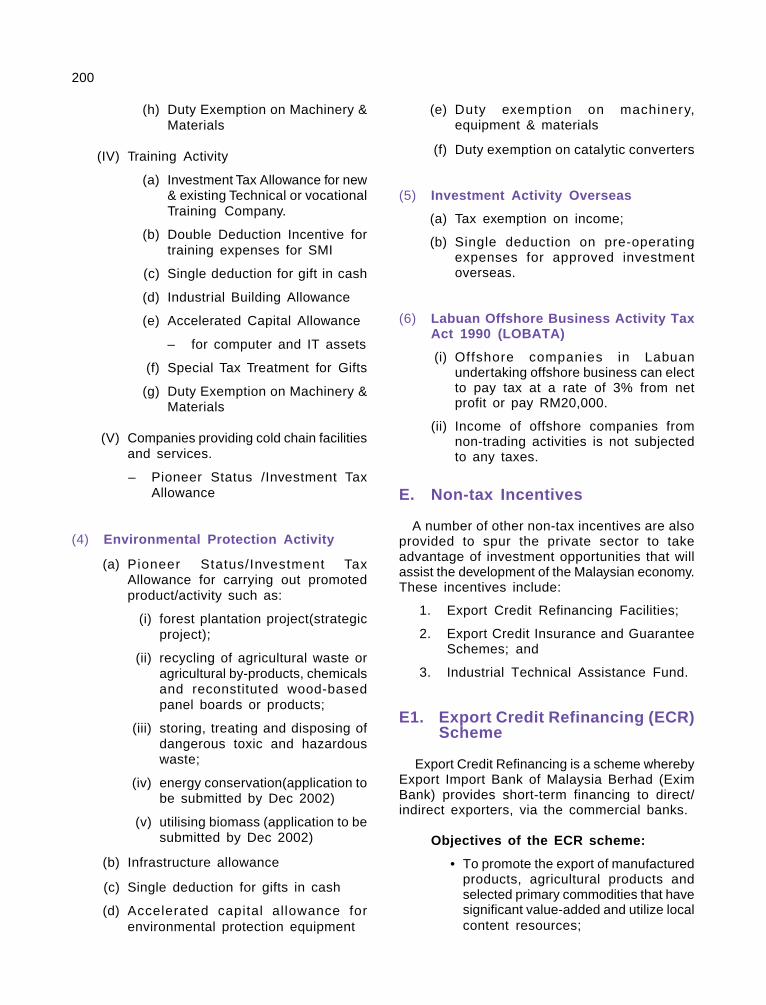
200
(h) Duty Exemption on Machinery &Materials
(IV) Training Activity
(a) Investment Tax Allowance for new& existing Technical or vocationalTraining Company.
(b) Double Deduction Incentive fortraining expenses for SMI
(c) Single deduction for gift in cash
(d) Industrial Building Allowance
(e) Accelerated Capital Allowance
– for computer and IT assets
(f) Special Tax Treatment for Gifts
(g) Duty Exemption on Machinery &Materials
(V) Companies providing cold chain facilitiesand services.
– Pioneer Status /Investment TaxAllowance
(4) Environmental Protection Activity
(a) Pioneer Status/Investment TaxAllowance for carrying out promotedproduct/activity such as:
(i) forest plantation project(strategicproject);
(ii) recycling of agricultural waste oragricultural by-products, chemicalsand reconstituted wood-basedpanel boards or products;
(iii) storing, treating and disposing ofdangerous toxic and hazardouswaste;
(iv) energy conservation(application tobe submitted by Dec 2002)
(v) utilising biomass (application to besubmitted by Dec 2002)
(b) Infrastructure allowance
(c) Single deduction for gifts in cash
(d) Accelerated capital allowance forenvironmental protection equipment
(e) Duty exemption on machinery,equipment & materials
(f) Duty exemption on catalytic converters
(5) Investment Activity Overseas
(a) Tax exemption on income;
(b) Single deduction on pre-operatingexpenses for approved investmentoverseas.
(6) Labuan Offshore Business Activity TaxAct 1990 (LOBATA)
(i) Offshore companies in Labuanundertaking offshore business can electto pay tax at a rate of 3% from netprofit or pay RM20,000.
(ii) Income of offshore companies fromnon-trading activities is not subjectedto any taxes.
E. Non-tax Incentives
A number of other non-tax incentives are alsoprovided to spur the private sector to takeadvantage of investment opportunities that willassist the development of the Malaysian economy.These incentives include:
1. Export Credit Refinancing Facilities;
2. Export Credit Insurance and GuaranteeSchemes; and
3. Industrial Technical Assistance Fund.
E1. Export Credit Refinancing (ECR)Scheme
Export Credit Refinancing is a scheme wherebyExport Import Bank of Malaysia Berhad (EximBank) provides short-term financing to direct/indirect exporters, via the commercial banks.
Objectives of the ECR scheme:
• To promote the export of manufacturedproducts, agricultural products andselected primary commodities that havesignificant value-added and utilize localcontent resources;
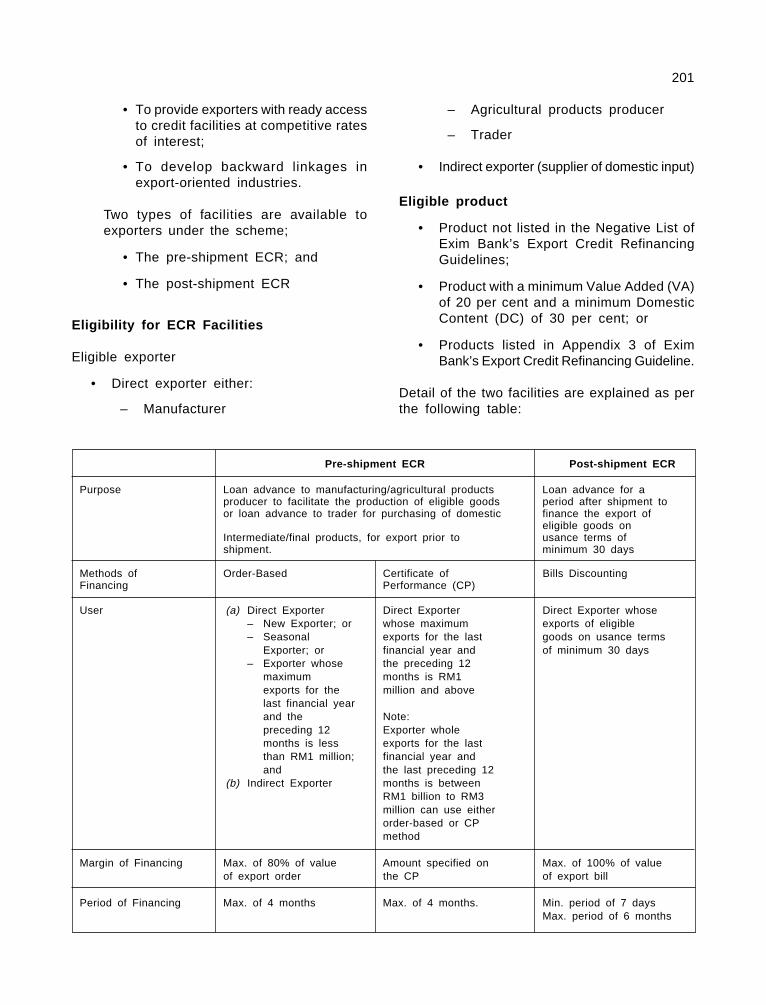
201
• To provide exporters with ready accessto credit facilities at competitive ratesof interest;
• To develop backward linkages inexport-oriented industries.
Two types of facilities are available toexporters under the scheme;
• The pre-shipment ECR; and
• The post-shipment ECR
Eligibility for ECR Facilities
Eligible exporter
• Direct exporter either:
– Manufacturer
Pre-shipment ECR Post-shipment ECR
Purpose Loan advance to manufacturing/agricultural products Loan advance for aproducer to facilitate the production of eligible goods period after shipment toor loan advance to trader for purchasing of domestic finance the export of
eligible goods onIntermediate/final products, for export prior to usance terms ofshipment. minimum 30 days
Methods of Order-Based Certificate of Bills DiscountingFinancing Performance (CP)
User (a) Direct Exporter Direct Exporter Direct Exporter whose– New Exporter; or whose maximum exports of eligible– Seasonal exports for the last goods on usance terms
Exporter; or financial year and of minimum 30 days– Exporter whose the preceding 12
maximum months is RM1exports for the million and abovelast financial yearand the Note:preceding 12 Exporter wholemonths is less exports for the lastthan RM1 million; financial year andand the last preceding 12
(b) Indirect Exporter months is betweenRM1 billion to RM3million can use eitherorder-based or CPmethod
Margin of Financing Max. of 80% of value Amount specified on Max. of 100% of valueof export order the CP of export bill
Period of Financing Max. of 4 months Max. of 4 months. Min. period of 7 daysMax. period of 6 months
– Agricultural products producer
– Trader
• Indirect exporter (supplier of domestic input)
Eligible product
• Product not listed in the Negative List ofExim Bank’s Export Credit RefinancingGuidelines;
• Product with a minimum Value Added (VA)of 20 per cent and a minimum DomesticContent (DC) of 30 per cent; or
• Products listed in Appendix 3 of EximBank’s Export Credit Refinancing Guideline.
Detail of the two facilities are explained as perthe following table:
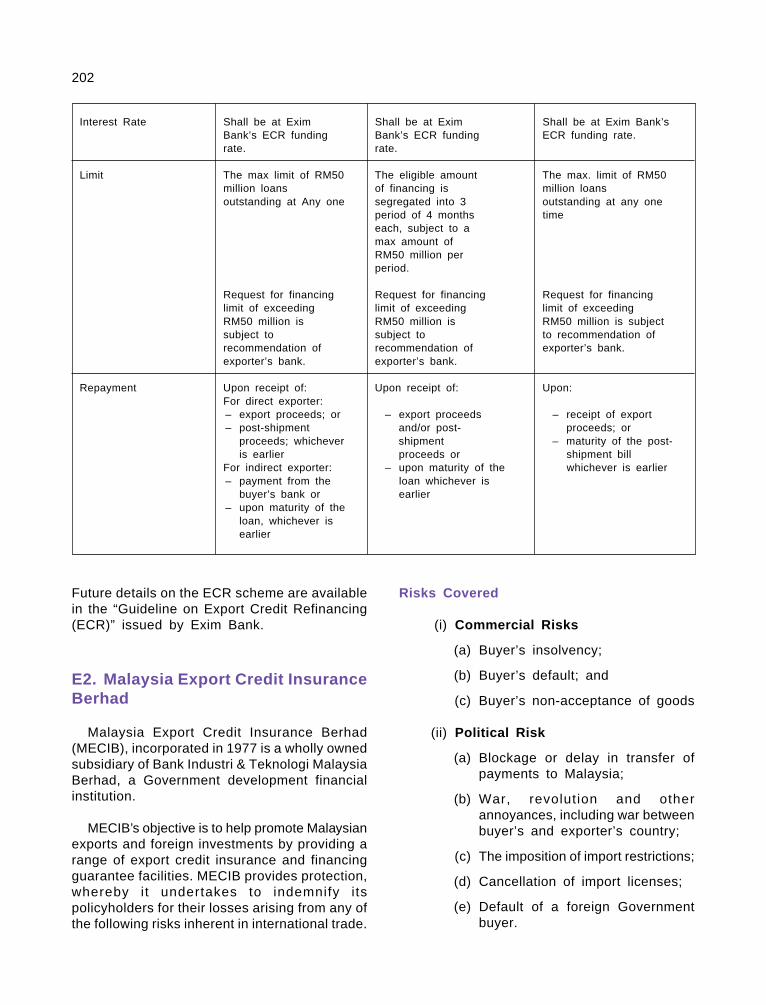
202
Interest Rate Shall be at Exim Shall be at Exim Shall be at Exim Bank’sBank’s ECR funding Bank’s ECR funding ECR funding rate.rate. rate.
Limit The max limit of RM50 The eligible amount The max. limit of RM50million loans of financing is million loansoutstanding at Any one segregated into 3 outstanding at any one
period of 4 months timeeach, subject to amax amount ofRM50 million perperiod.
Request for financing Request for financing Request for financinglimit of exceeding limit of exceeding limit of exceedingRM50 million is RM50 million is RM50 million is subjectsubject to subject to to recommendation ofrecommendation of recommendation of exporter’s bank.exporter’s bank. exporter’s bank.
Repayment Upon receipt of: Upon receipt of: Upon:For direct exporter:– export proceeds; or – export proceeds – receipt of export– post-shipment and/or post- proceeds; or
proceeds; whichever shipment – maturity of the post-is earlier proceeds or shipment bill
For indirect exporter: – upon maturity of the whichever is earlier– payment from the loan whichever is
buyer’s bank or earlier– upon maturity of the
loan, whichever isearlier
Future details on the ECR scheme are availablein the “Guideline on Export Credit Refinancing(ECR)” issued by Exim Bank.
E2. Malaysia Export Credit InsuranceBerhad
Malaysia Export Credit Insurance Berhad(MECIB), incorporated in 1977 is a wholly ownedsubsidiary of Bank Industri & Teknologi MalaysiaBerhad, a Government development financialinstitution.
MECIB’s objective is to help promote Malaysianexports and foreign investments by providing arange of export credit insurance and financingguarantee facilities. MECIB provides protection,whereby it undertakes to indemnify itspolicyholders for their losses arising from any ofthe following risks inherent in international trade.
Risks Covered
(i) Commercial Risks
(a) Buyer’s insolvency;
(b) Buyer’s default; and
(c) Buyer’s non-acceptance of goods
(ii) Political Risk
(a) Blockage or delay in transfer ofpayments to Malaysia;
(b) War, revolution and otherannoyances, including war betweenbuyer’s and exporter’s country;
(c) The imposition of import restrictions;
(d) Cancellation of import licenses;
(e) Default of a foreign Governmentbuyer.
203
Facilities Offered
(a) Short Term Facilities
(i) Comprehensive Policy (Shipments)
This policy covers non-payment resultingfrom commercial and political risks inrespect of goods and commoditiesexported on credit terms of not morethan 180 days. The cover commencesfrom the date of shipment. Percentageof cover is up to 95% of the amountof loss.
(ii) Comprehensive Policy (Contracts)
This policy covers the risks of non-payment for goods specifically producedunder a contract of sale for overseasbuyers especially where loss can besustained in the event of the contractbeing frustrated in the pre-shipmentperiod. Hence, cover commences fromthe date of the contract. Percentage ofcover is up to 95% of the amount ofloss.
(iii) Comprehensive Policy (Service)
This policy covers export of servicesother than tangible goods to overseasclients or principals such as technicalor professional assistance; repairs; refitsconversion carried out on ships; andpayment under royalty agreement etc;on credit terms of not more than 180days. Cover is effective from date ofinvoice. Percentage of cover is up to95% of the amount of loss.
(iv) Bank Letter of Credit Policy (BankLC Policy)
Bank LC Policy is offered to commercialbanks providing post-shipment financingto the exporters selling on LC terms ofpayment. With the policy, the LCnegotiating bank’s concerns about thecredit standing of the LC issuing bankand/or the political and economicconditions prevailing in the buyers’country are mitigated.
The policy insures the LC negotiatingbank for non-reimbursement by the LCissuing bank up to 95% of the facevalue of the LC.
This policy aims to promote Malaysianexport to non-traditional and difficultmarkets by enabling the commercialbanks to finance the exports to theseregions.
(b) Medium and Long-Term Facilities
(i) Specific Policy
This policy covers export of capital orsemi-capital goods and/or services withlengthy manufacturing and/or paymentperiods and high contract values. It istailored to the needs and features ofeach project or manufacturer inMalaysia. The credit terms must be fora minimum of two years and the policyis issued on a one-off project basis.Percentage of cover is up to 95% ofthe amount of loss.
(ii) Supplier Credit Guarantee
This guarantee applies to loans givenby the financial institutions to financea Malaysian supplier/exporter/contractorof Malaysian goods and services orMalaysian turnkey contractorundertaking an overseas project.
Without the loan, the Malaysian exporteror turnkey contractor may not be ableto implement the project.
To mitigate its balance sheet exposureto political risks in the buying country,the Malaysian exporter or turnkeycontractor can insure these risks withMECIB under the Specific Policy.
The percentage of cover for the SupplierCredit Guarantee is determined on case-by-case basis up to a maximum of 100%.The loan, in turn, could provide financingfor up to 85% of the Malaysian contractvalue related to the overseas project
204
or export transaction. If the contractcontains goods other than Malaysiangoods and services, a Malaysian contentand value added requirement of 30%is necessary.
(iii) Buyer Credit Guarantee
This guarantee is provided to financialinstitutions lending to a foreignsovereign, public or private buyer forfinancing the purchase of Malaysiangoods and services typically capitalgoods or turnkey projects wherebydisbursement is made directly to theexporter in accordance with the supplycontract.
Without the loan, the foreign buyer maynot be able to purchase the Malaysiangoods and services.
Percentage of cover is on case-by-casebasis, but generally, for a loan to asovereign buyer, a 100% comprehensivecoverage is extended. The loan, in turn,could provide financing for up to 85%of the Malaysian contract value relatedto the overseas project or exporttransaction. If the contract containsgoods other than Malaysian goodsand services, a Malaysian content andvalue added requirement of 30% isnecessary.
(iv) Project Finance Guarantee
This guarantee applies to loans givenby financial institutions to companiesundertaking overseas privatisationprojects e.g. Build-Operate-Transfer orBuild-Own-Operate-Transfer on limitedrecourse financing basis where thesource of repayment is from the cashflowof the project itself.
Guarantee provided can be in the formof political risks cover only or bothpolitical and commercial risks coverage.The extent of commercial risk coverageis determined on case-by-case basis
subject to maximum of 100%. Theproject is normally required to befinanced through injection mix of debtand equity, and, typically a 70:30 mixis ideal for an infrastructure project.
(v) Overseas Investment Insurance
This insurance protects Malaysianinvestors of their investment typicallyrelated to an overseas project either inthe form of equity commercial bank loanor shareholder’s loan against lossesarising from political risks such asrestrictions or blockage in repatriationof profits, dividend, loan repayment etc.,expropriatory acts by the hostgovernment whether directly or indirectlyand damages to tangible assets dueto war and civil disturbances. On acase-by-case basis, where concessionhas been awarded to an investor,extended coverage of repudiation ofcontract by host government may beconsidered.
Standard coverage of 90% of anyinvestment losses arising from theaforementioned polit ical r isks isavailable.
(vi) Bond Facility
MECIB can either issue bonds or provideguarantee to commercial banks toencourage the issuance of bonds onbehalf of the Malaysian companies tomeet the requirement of the overseasbuyers of Malaysian goods andservices.
The types of bonds typically coveredare tender bond, advance paymentbond and performance bond. Coverageis 100%.
An unfair calling of bond is also availableproviding protection to Malaysiancompanies against unfair calling ofthe bond by the overseas buyer/principal. Standard coverage of 95% isavailable.
205
For further information, please contact MECIBat the nearest office:
Kuala Lumpur
Malaysia Export Credit Insurance Berhad(32522-U)Level 17, Bangunan Bank Industri, BandarWawasanNo 1016, Jalan Sultan Ismail,P.O. Box 1104850734 Kuala LumpurTel : 03 - 26910677Fax : 03 - 26910353E-mail : [email protected] : www.mecib.com
Penang
Malaysia Export Credit Insurance Berhad(32522-U)2nd Floor, 53 Jalan Selat, Taman SelatP.O. Box 157,12000 Butterworth,PenangTel : 604 – 3321862Fax : 604 – 3322172E-mail : [email protected]
Johor
Malaysia Export Credit Insurance Berhad(32522-U)2nd Floor, No 95, Jalan DamaiTaman Setia, Off Jalan Stulang Darat80300 Johor Bahru,Johor Darul TakzimTel : 607 – 2231191Fax : 607 – 2240370E-mail : [email protected]
E3. Industrial Technical AssistanceFund (ITAF)
The Industrial Technical Assistance Fund(ITAF) was initially set up by the Governmentwith an allocation of RM50 million for the purposeof providing grants to small and medium-scaleindustries (SMIs). On depletion of the originalallocation, an additional RM70 million has been
injected into the fund to be utilised for the followingschemes:
(i) Business Planning and DevelopmentScheme (ITAF1);
(ii) Process Improvement and ProductDevelopment Scheme (ITAF 2);
(iii) Productivity and Quality CertificationScheme (ITAF 3); and
(iv) Market Development Scheme (ITAF 4).
SMIs that operate in the manufacturing sectoror services directly-related to manufacturingactivities and fulfil the following conditions areeligible to apply for assistance:
(i) Incorporated under the Companies Act1965;
(ii) Annual sales turnover not exceeding RM25million with full-time employees notexceeding 150;
(iii) At least 70% of their equity are held byMalaysians of which not more than 25%held by large companies;
(iv) Companies which are not yet in commercialproduction but possess production facilitiesor have access to facilities approved bythe Government such as the IncubatorScheme or the Technology Park Scheme;
(v) Priority will be given to SMIs manufacturingproducts(s) or providing manufacturing-related services promoted under thePromotion of Investments Act (PIA) 1986;and
(vi) Companies appointed under the IndustrialLinkage Programme (ILP).
Assistance is given in the form of a matchinggrant whereby 50% of the project cost is borneby the Government and the remaining 50% isborne by the applicant company subject to amaximum grant as stipulated for each scheme.
206
Further information on ITAF can be obtainedfrom:
ITAF Secretariat,Perbadanan Pembangunan Industri Kecil danSederhana Malaysia (SMIDEC)701 D, Level 7, Tower D,Uptown 5,Jalan SS 21/39,Damansara Uptown,47400 Petaling Jaya,Selangor Darul Ehsan.
Telephone No : 03 – 7660 8585Fax No : 03 – 7660 1919
II. THE INDUSTRIAL CO ORDINATIONACT, 1975
The objective of the Industrial Co-ordinationAct 1975 (ICA) is to ensure orderly developmentand growth in the manufacturing sector. TheICA requires person(s) engaging in anymanufacturing activity to obtain a licence fromthe Licensing Officer in respect of suchmanufacturing activity. Only manufacturingcompanies with shareholders’ funds of RM2.5million and above or engaging 75 or more full-time employees need to apply for a licence underthe ICA.
All applications for manufacturing licencesshould be made in the prescribed form to theDirector-General of the Malaysian IndustrialDevelopment Authority (MIDA) in Kuala Lumpur,Malaysia. MIDA is the Government’s principalagency for the promotion and coordination ofindustrial development in Malaysia.
The relevant definitions in the ICA are asfollows:
(a) The “Licensing Officer” is the Secretary-General of the Ministry of InternationalTrade and Industry (MITI).
(b) “Manufacturing activity” means the making,altering, blending, ornamenting, finishingor otherwise treating or adapting any articleor substance with a view to its use, sale,transport, delivery or disposal and includes
the assembly of parts and ship repairingbut shall not include any activity normallyassociated with retail or wholesale trade.
(c) “Shareholders’ funds” means the aggregateamount of a company’s paid-up capital(in respect of preference shares andordinary shares and not including anyamount in respect of bonus shares to theextent they were issued out of capitalreserve created by revaluation of fixedassets), reserves (other than any capitalreserve which was created by revaluationof f ixed assets and provisions fordepreciation, renewals or replacementsand diminution in value of assets), balanceof share premium account (not includingany amount credited there in at the instanceof issuing bonus shares at premium outof capital reserve by revaluation of fixedassets) and balance of profit and lossappropriation account.
(d) “Full-time paid employees” means allpersons normally working in theestablishment for at least six hours a dayand at least 20 days a month for 12 monthsduring the year and who receive a salary.Persons such as traveling sales,engineering, maintenance and repairpersonnel, or who are paid by and areunder the control of the establishment arealso included. Full-time paid employeesalso include directors of incorporatedenterprises except those paid solely forthe attendance at Board of Directorsmeetings. Family workers who receiveregular salaries or allowances and whocontribute to the Employees Provident Fund(EPF) or other superannuation funds arealso included in the definition.
1. Guidelines for Approval of IndustrialProjects
Malaysia’s rapid industrial growth over thepast decade has created a high demand forlabour in the manufacturing sector. The last fewyears has seen a tightening in the labour marketsituation.
In view of this, the Government has set downguidelines for the consideration of industrial project
207
based on the Capital Investment Per Employee(C/E) Ratio. With effect from 26 August 1995,projects with a C/E Ratio of less than RM55,000will be defined as labour-intensive and will notbe considered for a manufacturing licence or fortax incentives by MITI.
However, projects which fulfil one of thefollowing criteria will be exempted from the aboveguideline:
(a) If value-added is more than 30%.
(b) If the Managerial, Technical andSupervisory (MTS) Index is more than 15%.
(c) If the project undertakes activities orproducts listed as promoted activities andproducts of high technology.
(d) If the project is located in the EasternCorridor* of Peninsular Malaysia, Sabahand Sarawak.
2. Expansion of Production Capacity andDiversification of Products
An existing licensed company which proposesto undertake an expansion of production capacityfor its approved products or diversification tomanufacture additional products is required tosubmit an application for the expansion ordiversification in the prescribed form to MIDA.
III. GUIDELINES ON FOREIGNINVESTMENT
1. Equity Policy In The Manufacturing Sector
The Malaysian Government welcomes foreigninvestment in the manufacturing sector. In keepingwith the objective of increasing Malaysianparticipation in manufacturing activities, it is thepolicy of the Government to encourage projectsto be undertaken on a joint-venture basis betweenMalaysians and foreign entrepreneurs.
1.1 Equity Policy Applicable to NewInvestments, Expansion or Diversification
Foreign equity participation in manufacturingprojects has been governed by the level ofexports. Effective from 31 July 1998, theMalaysian Government has liberalised theequity policy for the manufacturing sectorin respect of new investments, expansionor diversification as follows:
(a) Foreign investors can now hold 100%equity irrespective of the level ofexports.
(b) This relaxation is applicable for allapplications received from 31 July1998 until 31 December 2003 to setup manufacturing projects with theexception of specific activities andproducts where Malaysians small andmedium scale companies have thecapabilities and expertise. Theseactivities and products are paperpackaging; plastic packaging (bottles,films, sheets and bags); plasticinjection moulded components; metalstamping, metal fabrication; wireharness; printing and steel servicecentres. For these activities andproducts, the prevailing specific equityguidelines are applicable.
(c) This policy will apply to all applicationsreceived from 31 July 1998 to 31December 2003, as well asapplications already received, but forwhich decisions are pending.
(d) All projects approved under this policywill not be required to restructuretheir equity after the period.
(e) The Government will review this policyafter 31 December 2003.
1.2 Equity Policy Applicable to ExistingCompanies
(a) Companies which have been licensedbefore 31 July 1998 have to complywith the equity condition as statedin the licence. However, for existing
* The Eastern Corridor of Peninsular Malaysia coversKelantan, Terengganu, Pahang and the district of Mersingin Johor.
208
companies undertaking expansion ordiversification, the equity policy asin para 1.1 above applies to theexpansion and diversif icationprojects.
The equity policy as in para 1.1 above alsoapplies to the following companies:
(b) Companies previously exempted fromthe Manufacturing Licence but whoseshareholders’ funds have nowreached RM2.5 mill ion or haveengaged 75 or more ful l-t imeemployees; and
(c) Existing l icensed companiesexempted from the equity conditionwhich are required to inform MITIwhen their shareholders’ funds reachRM2.5 million.
1.3 Relaxation of Export Conditions forExisting Manufacturers
To encourage greater levels of industriallinkages and local sources, the Governmenthas relaxed the export conditions imposedon manufacturing companies effective from1 January 1998 to 31 December 2003. Withthis relaxation, all existing companies withexport conditions can apply to MIDA for anapproval to sell in the domestic market asfollows:
— up to 100% of their output for thoseproducts with nil duty or not producedlocally.
— Up to 80% of their output, if thedomestic supply is inadequate; orthe imports from ASEAN for productswith CEPT duties of 5% and belowhave increased.
The above temporary relaxation of exportcondition will not affect the current equitystructure and incentives of existingcompanies.
2. Protection Of Foreign Investment
2.1 Equity Ownership
A company that has been approved witha certain equity participation will not berequired to restructure its equity at anytime, provided that the company continuesto comply with the original conditions ofapproval and retains the original featuresof the project.
2.2 Investment Guarantee Agreements
Malaysia’s readiness to conclude InvestmentGuarantee Agreements (IGAS) is atestimony of the Government’s desire toincrease the confidence of foreign investorsin Malaysia.
An IGA will provide the foreign investorwith the following:
(a) Protection against nationalisation andexpropriation.
(b) Prompt and adequate compensationin the event of nationalisation orexpropriation.
(c) Free transfer of profits, capital andother fees.
(d) Settlement of investment disputesunder the Convention on theSettlement of Investment Disputesof which Malaysia has been a membersince 1966.
Malaysia has concluded InvestmentGuarantee Agreements with the followingcountries (in order of precedence): UnitedStates of America, Germany, Canada,Netherlands, France, Switzerland, Sweden,Belgo-Luxembourg, United Kingdom, SriLanka, Romania, Norway, Austria, Finland,Organisation of Islamic Countries (OIC),Kuwait, Association of South-East AsianNations (ASEAN), Italy, South Korea, China,United Arab Emirates, Denmark, Vietnam,Papua New Guinea, Chile, Laos, Taiwan,Hungary, Poland, Indonesia, Albania,
209
Zimbabwe, Turkmenistan, Namibia,Cambodia, Argentina, Jordan, Bangladesh,Croatia, Bosnia Herzegovina, Spain,Pakistan, Kyrgyz Republic, Mongolia, India,Uruguay, Peru, Kazakhstan, Malawi, CzechRepublic, Guinea, Ghana, Egypt, Botswana,Cuba, Uzbekistan, Macedonia, North Korea,Yemen, Turkey, Lebanon, Burkina Faso,Republic of Sudan, Republic of Djibouti,Republic of Ethiopia, Senegal and State ofBahrain, Algeria and Saudi Arabia.
2.3 Convention on the Settlement ofInvestment Disputes
In line with the national policy of promotingand protecting foreign investment, theMalaysian Government in 1966 ratified theprovisions of the Convention on theSettlement of Investment Disputesestablished under the auspices of theInternational Bank for Reconstruction andDevelopment (IBRD).
Facilities for international conciliation orarbitration are established by the Conventionthrough the International Centre forSettlement of Investment Disputes whichis located at the principal office of the IBRDin Washington.
2.4 Regional Centre for Arbitration
The Kuala Lumpur Regional Centre forArbitration was established in 1978 underthe auspices of the Asian-African LegalConsultative Committee (AALCC) - an inter-governmental organisation in cooperationwith and with the assistance of theGovernment of Malaysia.
The Centre serves the Asian and Pacificregion. It is a non-profit organisation andhas been established with the objective ofproviding a system for the settlement ofdisputes for the benefit of parties engagedin trade and commerce and investmentswith and within the region.
IV. MALAYSIAN INDUSTRIALDEVELOPMENT AUTHORITY(MIDA)
The Malaysian Industrial Development Authority(MIDA) is the first point of contact for investorswho intend to set up projects in the manufacturingand related support services sector in Malaysia.MIDA has established a global network ofoverseas offices covering North America, Europeand the Asia-Pacific and a local network of branchoffices in the various states to assist investorsin the initial stages to the implementation andoperation of their projects.
Since 1 October 1988, the Malaysian IndustrialDevelopment Authority (MIDA) has beendesignated as the Coordinating Centre onInvestment. Investors need only to approachMIDA to obtain most of the approvals requiredat the Federal level. This measure is aimed atfurther streamlining the administrative proceduresin respect of investment at the Federal level.
The major functions of MIDA are:
(a) Promote foreign and local investments inthe manufacturing and related servicessector;
(b) Undertake planning for industrialdevelopment in Malaysia;
(c) Recommend to the Minister of InternationalTrade & Industry policies and strategieson industrial promotion and development;
(d) Evaluate various types of applicationsrelating to the set up and implementationof industrial and related projects;
(e) Assist companies in the implementationand operation of their projects and otherassistance through direct consultation andcooperation with the relevant authoritiesat both the federal and state levels;
(f) Facilitate the exchange of information andcoordination among institutions engagedin or connected with industrial development.
Applications evaluated cover the following:
(a) Manufacturing licences;
210
(b) Tax incentives for manufacturing activities,agriculture projects, hotel and tourismprojects, R&D, technical or vocationaltraining institutions and softwaredevelopment;
(c) Expatriate posts;
(d) Import duty exemption on raw materialsan components;
(e) Import duty and sales tax exemption onmachinery and equipment;
(f) Tariff protection;
(g) Approvals of technology transferagreements; and
(h) Asean Industrial Cooperation (AICO)Scheme
To further enhance MIDA’s role in assistinginvestors, senior representatives from variouskey Ministries, departments and relevantcorporations are emplaced within the MIDAHeadquarters in Kuala Lumpur to assist andadvise investors and coordinate applications forapprovals and other matters under the purviewof these bodies. The 3 representatives are from:
(a) Ministry of Finance;
(b) Ministry of Human Resources;
(c) Immigration Department;
(d) Royal Customs and Excise Department;
(e) Department of Occupational Safety andHealth;
(f) Department of Environment;
(g) Tenaga Nasional Berhad; and
(h) Telekom Malaysia Berhad.
On the 3rd May 1999, an Industry SupportDivision was set up in MIDA with the followingfunctions:
(a) Assist companies in the implementationand operation of new projects;
(b) Extend support to existing companies intheir expansion, diversif ication andreinvestment projects;
(c) Undertake periodic reviews of issues andformulate appropriate measures for thesmooth implementation and operation ofindustrial projects;
Investment Centre at State Level
At the state level, investment centres havealso been formed to provide efficient servicesto investors. Presently, nine states have set upsuch centres. These are Johor, Kelantan, Melaka,Negeri Sembilan, Pahang, Perak, Sabah,Selangor and Terengganu. The State Governmentof Sarawak has also agreed in principle to setup a similar centre. The three other states ofKedah, Perlis and Pulau Pinang are still operatingunder this existing systems where applicationsare submitted directly to the respective agenciesfor approval. If complications or delays shouldarise in the granting of certain approvals, theState Economic Development Corporations(SEDCs) of Kedah and Perlis and the PenangDevelopment Corporation (PDC) will then convenea meeting among the agencies concerned toexpedite the granting of such approvals.
The investment centres at the state level areeither at the SEDCs as in Johor, Kelantan, Melaka,Pahang and Perak or at the State EconomicPlanning Units (SEPUs) as in the case of NegeriSembilan, Selangor and Terengganu. In Sabah,the centre is at the Department of IndustrialResearch and Development (DIRD). In Sarawak,the State Government has agreed that the centrebe based at the Ministry of Industrial Development(MID).
To assist these centres to function effectively,Special Committees have been established. Therole of these Committees is to coordinate anddecide all matters concerning the issue of licences,permits and approvals and problems faced byinvestors at the state level. All applications andcomplaints received are channelled by the centres(which also serve as the secretariats to the SpecialCommittees) to the relevant agencies forconsideration. The centres at state level doundertake different functions but they are generallyvery similar and their functions relate more toexpediting the necessary approvals for theimplementation of their projects.
211
The essential Terms of Reference of the centresat the state level are as follows:
(a) to establish an investment informationcentre for collecting, updating and providingrelevant information or data to investors;
(b) to receive, process and convey decisionson applications for licences, permits andapprovals required by investors at the statelevel for the implementation and operationof their projects;
(c) to monitor the progress of projects withthe view to assisting investors in theimplementation of their projects; and
(d) to advise the State Governments from timeto time on all matters pertaining to thedevelopment of the industrial sector inthe state.
With the establishment of the investmentcentres at the state level, the administrativeprocedures involved in the granting of approvals,permits and l icences required for theimplementation and operation of the projects atthe respective state level have been streamlined.It would not only make it easier for the investorsas they would have to deal only with the centresin respect of most, if not all, of the problemsthey would encounter at the state level, but thetime taken to secure the necessary approvalswould also be reduced. This would save theinvestors valuable time, effort and resources intheir dealings with the State Governments andwould consequently enhance the overallinvestment climate not only of the states butalso of the nation as a whole.
Pertaining to the relationship between Federaland State Governments, the joint IndustrialCoordination Committee involving Federal andState has been established in every state withthe following function:
(i) Plan industrial development at the statelevel to ensure that it is in accordancewith national planning. State industrialdevelopment plans are used as inputs tonational industrial to national industrialdevelopment plans to ensure effectiveness.
(ii) Identify investment promotion strategiesto ensure efficient distribution of industries.For this the committee will emphasize:
(a) identifying new industrial zonesevaluating infrastructure elementssuch as roads, water supply,electricity, transportation,communications, storage anddisposal of industrial wastes;
(b) evaluating the feasibility of settingup specif ic industrial zones,specifically for SMI’s
(c) identifying and solving problemsfaced by companies operating inindustrial zones; and
(d) identifying industries which need tobe emphasized in the differentstates.
(iii) Plan and monitor linkages in industrialsub-sectors in order to ensure the presenceof critical supporting industries at the statelevel. Industrial development is to be moreintegrated. Synergy in industrialdevelopment to be achieved by the differentstates.
(iv) Promote Skills Development Centres atthe state level to ensure a sufficient supplyof skilled workers for industry.
(v) Identity weaknesses in procedureshindering project implementation andrecommend remedial action.
(vi) Plan export promotions so that industrialproducers explore international markets.
(vii) Provide feedback and references to helpthe private sector solve their problems.
V. TRANSFER OF TECHNOLOGY
All manufacturing projects licensed under theindustrial Coordination Act 1975 must obtain theprior written approval of the Ministry ofInternational Trade and Industry (MITI) beforeentering into any technology transfer agreementinvolving foreign partners.
212
This is done to ensure that the agreement willnot impose unfair and unjustifiable restrictionsor handicaps on the local party, the agreementwill not be prejudicial to national interest, andthe payment of fees (if applicable) will becommensurate with the level of technology tobe transferred.
Types of Agreements
Technology transfer agreements cover licencerights over specific processes, formulae ormanufacturing technology (may be patented orunpatented), other knowledge and expertisenecessary for the setting up of a plant, andprovision of various technical assistance andsupporting services.
Under these arrangements, a specif icagreement entered into could be in the form of:
(i) Joint-Venture Agreement. An agreementto set up a joint-venture company betweentwo or more parties involving locals andforeigners.
(ii) Technical Assistance and Know-HowAgreement. An agreement between twoor more parties where one party will providethe technical assistance and know-howfor the manufacture of certain productsfor a certain amount of fee or royalty.
(iii) Licence Agreement. An agreementbetween two or more parties where thelicensor grants a licence/right to thelicensee to use its patents, trademarksand other industrial/intellectual propertiesfor the manufacture of certain productsfor a certain amount of fee or royalty.
(iv) Patent and Trademark Agreement. Anagreement between two or more partieswhere one party gives the right to theother to use its patents and trademarksfor the manufacture of certain productsfor a certain amount of fee.
(v) Turnkey Contract. A contract between twoor more parties where the contract isawarded to one of the parties to performall stages from the initial to the final stage,inclusive of consultancy, managerial,
technical and other services, until thecontractual project is ready for immediatecommercial production or final use.
(vi) Management Agreement. An agreementbetween two or more parties where oneparty will provide management servicesto the other for a management fee.
Guidelines on Transfer of Technology
Agreements on transfer of technology mustdefine in detail the following:
(i) technological content and principal featuresof technology or process;
(ii) anticipated production;
(iii) quality and specification of products; and
(iv) particulars of technical assistance, servicesand manner in which they are to beprovided.
The transfer of technology must be effectedthrough the following:
1. Access to Improvements
The technology to be supplied shouldincorporate:
(i) the latest development know-how of thesupplier; and
(ii) access to innovations or breakthrough intechnology, including new patents appliedfor or registered.
2. Remuneration for Technology
Payment for technology can be in the form ofa ‘fixed lump sum fee’ or a ‘running royalty’ ora combination of lump sum fee and runningroyalty for a specified period. Lump sum paymentsare usually allowed in cases where the know-how can be fully and completely transferred andabsorbed within a specified period. The methodof payment that is preferable is the running royaltybased on net sales. Initial lump sum paymentsin addition to royalties are not encouraged byMITI. Where such payments are requested, it
213
should be only for the recovery of actual expensesincurred by the Licensor for preliminary servicesprovided to the Licensee.
3. Method of Payment
(a) Royalty is imputed in relation to the levelof technology and principal elements oftransfer. Depending upon the merits ofeach case, a rate of 1% to 5% of netsales can be considered. Net sales aredefined as gross sales less sales discountsor returns, transport costs (includingfreight), insurance, duties, taxes and othercharges including where applicable, costsof raw materials, parts and componentsimported from the foreign l icensorconcerned or its subsidiaries or affiliatedcompanies.
(b) The Government has liberalised the presentpolicy for regulating technology transferagreements by allowing automatic approvalof the following:
(i) Technology transfer agreementssigned between 100% foreign-owned companies in Malaysia andany foreign party or foreign holdingcompany.
(ii) All technical assistance, licence andknow-how agreements signedbetween Malaysian-owned/Malaysian joint-venture companiesand any foreign party where theroyalty payment is as follows:
(a) running royalty not exceeding3% of net sales; or
(b) lump sum payment notexceeding RM500,000; or
(c) lump sum payment andrunning royalty in total notexceeding 3% of net sales.
(iii) Trade mark and patent agreementssigned between Malaysian-owned/Malaysian joint-venture companiesand any foreign party involvingroyalty payments not exceeding 1%of net sales for each category.
Practice of itemisation of service under separateagreements is discouraged.
(c) Capitalisation of know-how fees or royaltyis not encouraged.
4. Duration and Renewal
(a) Duration of the agreement should beadequate for full absorption of technology.The life of any patent relating to thetechnology is also taken into consideration.
(b) An initial period of five years is normallyapproved and any renewal is subject tothe prior approval of MITI.
5. Training
A provision for adequate training of the localcompany’s personnel in the technology supplier’splant facilities as well as in-house training in thelocal company’s plant should be incorporatedand clearly specified. In the case of the former,the number of personnel to be trained, the areasof training and its duration, together witharrangements and the facilities to be madeavailable for the training should also be defined.The costs of training should be borne by thetechnology supplier but all expenses related tosalaries, wages, living and travelling allowancesshould be borne by the local company.
6. Patents and Trade Marks
Patents and trade marks may come as oneof the components of the whole technologytransfer package. In the case of patents, it isof utmost importance that those patents involvedin any process know-how be explicitly definedin the agreements and the local company isgranted user rights over all such patents. Wherethe life of the patents extends beyond the durationof the agreement concerned, an arrangementshould be made for the continued use of thepatents after the expiry of the agreement.
7. Confidentiality/Secrecy
Confidentiality of information should be confinedto the duration of the agreement only.
214
8. Guarantee/Warranty
The agreement should define a guaranteewith respect to the production capacity, productquality and specifications and other features ofthe manufacturing process.
9. Infringement of Third Party’s Right
The technology supplier should undertake toindemnify the local company against any claimsin the event that legal proceedings are taken bya third party against the local company forinfringement upon any industrial property rightsarising out of the use by the local company ofany of the technical assistance furnished by thetechnology supplier.
10. Termination Clause
Either party should have the right to terminatethe agreement.
11. Taxes
A withholding tax of 10% is levied on paymentsmade to foreign suppliers of technology and thistax has to be borne by the foreign recipient.Exemption under the Double Taxation Agreement,where applicable, has to be made to the Ministryof Finance separately.
12. Sales Territory
The local company should be free to sell itsproduce (manufactured with the l icensedtechnology) in the whole of Malaysia and allother countries except where the foreigntechnology supplier is manufacturing directly orwhere he has given exclusive rights to othersor where he is legally not empowered to allowsales based on his technology.
13. Governing Laws and Arbitration
The governing laws for any technology transferarrangement should be Malaysian laws and
arbitration proceedings must be conducted inMalaysia in accordance with either the MalaysianArbitration Act, 1952 (Revised 1972) or the UnitedNations Commission on International Trade Law(UNCITRAL) Rules and conducted at the Asian-African Legal Consultative Committee (AALCC)Regional Centre for Arbitration, Kuala Lumpur.
The requirement does not apply to agreementssigned between 100% foreign-owned companiesin Malaysia and any foreign party or foreignholding company.
VI. INTELLECTUAL PROPERTYPROTECTION
Intellectual property system in Malaysiaprovides protection for patents, trademarks,industrial designs, copyright, layout designs ofintergrated circuit and geographicalindications . Malaysia provides adequateprotection in the field of intellectual property forboth local and foreign investors. Malaysia is amember of the World Intellectual Proper tyOrganization and signatories to two conventionsadministered by the world body, namely, ParisConvention (for the protection of industrialproperty-patents, trademarks and industrialdesigns) and the Berne Convention (for theprotection of Copyright). Malaysia is also asignatory to the TRIPs Agreement (Agreementon Trade Related Aspects of Intellectual PropertyRights), an agreement under the auspices ofthe World Trade Organization.
1. Patents Act 1983
Patents protection is governed by the PatentsAct 1983. An Application for a patent can befiled in Malaysia and upon registration, protectionis provided for its exploitation in the country. Aninvention is patentable if it is new involves aninventive step and is industrially applicable.Besides patent, a utility innovation certificate isalso granted for an innovation or a ‘minor’ inventionwhich does not require to satisfy the test ofinventiveness as of patent.
215
To comply with TRIPS Agreement, the periodfor patent protection was amended to 20 yearsfrom the date of filing of an application andsubject to yearly renewal from the date ofgrant. A Utility Innovation is protected for 10years from the date of filing of an application,and may be extended for another 5 yearsplus 5 years, subject to use. The proprietorof the patent has the right to exploit the patentedinvention, to assign or to license the use of apatent.
2. Trade Marks Act 1976
Trademarks protection is governed by the TradeMarks Act 1976 which provides effective andadequate protection for registered trademarksin Malaysia. The Act is applicable to goodsas well as services. To comply with TRIPSAgreement, the Act was amended in 2000 togive protection for well-known marks and tomake provision for border measures.
The period of protection, is 10 years whichis renewable for a period of every 10 yearsthereafter.
The proprietor of the trademark has the rightto assign as well as to licence the use of atrademark.
The protection of a trademark is not limitedin time, provided its registration is periodicallyrenewed.
3. Copyright Act 1987
Copyright protection in Malaysia is governedby the Copyright Act 1987 which came into forceon 1 December 1987. The Act provides for theprotection of literary works, artistic works, musicalworks, films, sound recordings, broadcasts andpublished editions. Computer software andcompilation of data is protected as literary works.Copyright generally subsists during the life ofthe author and 50 years after his death. Durationof protection of f i lms, sound recordings,broadcasts and published editions is 50 years.
The Act also provides for civil as well as criminalsanctions. A unique feature of the Act is the
inclusion of provisions for enforcement whichprovides the power to enter premises suspectedof having infringing copies and contrivances andthe appointment of a special team of offices toenforce the Act. The Act accords similar protectionto local and foreign works.
To comply with TRIPS Agreement the Act wasamended in 2000 to provide protection forperformers.
4. Industrial Designs Act 1996
The Industrial Designs Act 1996 which wasenforced on 1 September 1999, replaced theUnited Kingdom Design (Protection) Act 1949of West Malaysia, the United Kingdom Designs(Protection) Ordinance Chapter 152 of Sabahand the Designs (United Kingdom) Ordinance,Chapter 59 of Sarawak, for the registration ofindustrial designs in Malaysia.
The industrial designs is granted for 5 yearsupon registration from the date of filing, and isrenewable for further two consecutive terms offive years each. The owner of a registered designhas the right to institute legal proceedings againstany person who has infringed or is infringingany of the rights conferred by the industrialdesign’s registration.
5. Layout-Designs of Integrated Circuits Act2000
The Layout-Designs of Integrated Circuits Act2000 came into force on 15 August 2000. TheAct provides protection for layout-designs ofintegrated circuits (without any registration) forten years from the date of its commercialexploitation in Malaysia or elsewhere.
6. Geographical Indications Act 2000
The Geographical Indications Act 2000 cameinto force on 15 August 2001. The Act providesprotection, upon registration, to goods followingthe name of the place where the goods areproduced. Protections are applicable to goodslike wine, agricultural products, handicrafts and
216
others. Geographical indications which arecontrary to public order or morality shall not beprotected under the Act.
VII. LABUAN LOFSA
To further enhance the role of Malaysia asa financial centre, the Federal Territory of Labuanwas launched as an International OffshoreFinancial Centre (IOFC) on 1 October 1990.Labuan as an IOFC will complement the onshorefinancial system in Kuala Lumpur. The businessand activities promoted in Labuan IOFC are:
(i) Offshore banking including investmentbanking;
(ii) Offshore insurance and offshoreinsurance-related businesses;
(iii) Trusts business;
(iv) Investment holdings;
(v) Mutual funds, units trust and fundmanagement;
(vi) Leasing;
(vii) Venture capital;
(viii) Company management;
(ix) Money broking;
(x) Money market, Corporate Treasury; and
(xi) Islamic financing.
The Administration of Labuan IOFC
The businesses and activities of Labuan IOFCare administered by the Labuan Offshore FinancialServices Authority (LOFSA) – a Single RegulatoryAgency which was established on 15 February1996. The purpose of LOFSA is to act as a one-stop agency to streamline and rationalise theGovernment administrative machinery insupervising the activities and operations of the
offshore financial services industry in Labuan,and be responsible for setting national objectives,policies and priorities for the orderly developmentand administration of the Labuan IOFC. However,matters relating to taxation continue to beadministrated by the Inland Revenue Board.
Legislation
The legislation governing the conduct ofoffshore businesses and investment activities inLabuan IOFC is as follows:
(a) Offshore Companies Act, 1990;
(b) Labuan Trust Companies Act ,1990;
(c) Offshore Banking Act, 1990;
(d) Offshore Insurance Act, 1990;
(e) Labuan Offshore Business Activity TaxAct, 1990;
(f) Labuan Offshore Financial ServicesAuthority Act, 1996;
(g) Labuan Offshore Trust Act, 1996;
(h) Labuan Offshore Limited Partnership Act,1997; and
(i) Labuan Offshore Securities Industry Act,1998.
Investment/Mutual Fund Business
The investment/mutual fund business is a newactivity which has been promoted in Labuanand is regulated under the Labuan OffshoreSecurities Industry Act, 1998 (LOSIA). The LOSIAprovides the necessary legal framework for thecreation and management of offshore investmentfunds, including Islamic funds as well as theprovision of fund administration services. TheAct also allows for the setting-up of the LabuanInternational Financial Exchange (LFX) whichcan be used for the listing of mutual funds andother permitted offshore instruments. As
217
investment opportunities in the South East Asianregion are plentiful, Labuan offers an attractivedomicile to foreign funds seeking to undertakeinvestments in the region.
The main features of the LOSIA are describedbelow:
(i) Two types of funds can be establishedunder LOSIA, namely, a private and apublic fund. A private fund is defined asa fund which has either not more than100 subscribers whose each first timeinvestment is not less than RM100,000 orany number of subscribers whose eachfirst time investment is not less thanRM500,000. On the other hand, a publicfund is a fund in which its shares areoffered for subscription to the generalpublic.
(ii) While both type of funds need to beregistered with LOFSA in accordance withthe procedures provided under the Act,private funds are accorded more flexibility.Minimal requirements are imposed forestablishing private funds in Labuan. Forexample, private funds need not apply toLOFSA for approval of their prospectus,fund manager and fund administrator.
(iii) LOSIA only allows a person who is licensedor registered with LOFSA to manage oradminister a fund duly registered underthe Act. However, in certain circumstances,LOFSA may allow a fund manager outsideLabuan and licensed in a recognizedcountry to manage or administer any fundestablished in Labuan.
(iv) The offshore banks and Labuan trustcompanies are allowed to be the custodianof any fund launched in Labuan. LOSIAalso provides that only a Labuan trustcompany may be appointed as the trusteeof the fund. However, LOSIA allows anauthorized trustee under the laws of anyrecognised country or jurisdiction to carryout similar functions in Labuan.
(v) A public fund is statutorily required to keepproper accounting records and prepareannual f inancial statements. Thesedocuments must be kept in Labuan andmay be inspected by LOFSA, potentialinvestors or the public.
(vi) No public fund shall be offered to thepublic unless a prospectus pertaining tothe fund has been published and filedwith the Authority. This would ensure thatpotential investors have adequateinformation about the fund.
(vii) The Act provides that if a person hassubscribed to a fund and the fund did notcomply with the provisions of LOSIA, theperson may rescind the subscriptioncontract or claim damages from the fundoperator. It is an offence under LOSIA toissue any misleading prospectus.
(viii) Any public fund which conducts anybusiness outside Labuan is required tofile with LOFSA a certificate to be issuedby a competent Authority who is responsiblefor the regulation and supervision of theconduct of its business in that recognisedcountry or supervision. The certificate shallstate the fund is carrying on or engagedin a lawful business.
(ix) LOSIA provides for the establishment ofLFX. The purpose of the establishment ofLIFE is to provide listing facilities to afund launched in Labuan or abroad.
Tax System
An offshore company must be incorporatedor registered under the Offshore Companies Act1990 to carry on offshore business activities inor from Labuan and to enjoy the preferential taxtreatment under the Labuan Offshore BusinessActivity Tax Act, 1990 (LOBATA). The LOBATAprovides for the imposition, assessment andcollection of tax on offshore business activitiescarried on by an offshore company in or fromLabuan, effective from the year of assessment1991. An offshore company includes an offshoretrust created in Labuan.
218
(a) Offshore Companies
An offshore company carrying on an offshoretrading activity (which includes banking, insurance,trading, petroleum operations, managementactivities, chartering and leasing of ships) forthe basis period for a year of assessment willbe taxed at a rate of 3% of its net profits orat a fixed rate of RM20,000 upon election bythe company for that year of assessment payableto the Inland Revenue Board. An offshorecompany carrying on an offshore non-tradingactivity (which refers to an activity relating tothe holding of investments in securities, stocks,shares, loans, deposits and immovable propertiesby an offshore company on its own behalf) forthe basis period for a year of assessment is notsubject to tax for that year of assessment.However, where an offshore company is carryingon both offshore trading and non-trading activity,it is deemed to be carrying on offshore tradingactivity.
(b) Companies other than OffshoreCompanies/Residents and Non-ResidentIndividuals
Companies operating in Labuan, incorporatedor registered under the Companies Act 1965,are not recognised as offshore companies anddo not enjoy the preferential tax treatment underthe LOBATA. Such companies continue to betaxed under the Income Tax Act, 1967. Taxincentives under the LOBATA are also notapplicable to companies carrying on industrialand/or manufacturing activities but instead theymay apply for incentives under the Promotionof Investments Act 1986. Non-resident andresident individuals in Labuan will continue tobe taxed under the Income Tax Act, 1967.
(c) Preferential Tax Treatment AccordedUnder Income Tax, 1967 and Stamp Act,1949
The preferential tax treatments are:
(i) Treatment on Dividends
Dividends received by an offshorecompany from a Malaysian resident
company are not subject to income taxand no refund or set-off is given in respectof tax deducted from such dividends.Dividends paid by an offshore companyout of income derived from an offshorebusiness activity or out of exempt incomeis not subject to income tax in the handsof the recipient. Such dividends will bepaid gross without any tax deduction atsource.
(ii) Treatment on Distribution By OffshoreTrust
Distribution made by an offshore trustis not subject to income tax in the handsof the beneficiary.
(iii) Treatment on Royalty
Royalty paid by an offshore company toa non-resident person or another offshorecompany is not subject to income taxand hence is not subject to withholdingtax.
(iv) Treatment on Interest
Interest paid by an offshore company toa non-resident person or another offshorecompany is not subject to income tax.However, where the interest accrues toa banking, finance company or insurancebusiness carried on by a non-residentperson in Malaysia, that interest will besubject to income tax as part of businessincome. Interest paid by an offshorecompany to a resident person, other thana person carrying on a banking, financecompany or insurance business inMalaysia, is not subject to income tax.
(v) Treatment on Technical OrManagement Fees
Technical or management fees paid byan offshore company to a non-residentor another offshore company is not subjectto income tax.
219
(vi) Exemption from Stamp Duty
All instruments made in connection withan offshore business activity by anoffshore company are not subject to stampduty under the Stamp Act 1949.
(vii) Abatement of Tax for ProfessionalServices
Income derived from qualifyingprofessional services rendered to anoffshore company in Labuan is exemptedfrom tax up to an amount equivalent to65% of the statutory income from thatsource. This incentive is applicable untilyear of assessment 2004.
(viii) Abatement of Tax for Employment
Income derived by a non-citizen individualfrom an employment exercisable in amanagerial capacity of an offshorecompany in Labuan and a non-citizentrust officer in a Labuan Trust Companyis exempted from tax up to an amountequivalent to 50% of the gross incomefrom that employment until year ofassessment 2004 and 2005, respectively.
VIII. PETROLEUM DEVELOPMENTACT, 1974
The Petroleum Development Act, 1974 cameinto force on 1 October 1974. The purpose ofthe Act is to regulate the petroleum andpetrochemical industries. The power to regulateall activities in the upstream petroleum sectoris vested in the Petroleum Nasional Berhad orPETRONAS. The Petroleum Regulations 1974,which were amended on 14 January 1991, vestedpowers to the Ministry of Domestic Trade andConsumer Affairs and the Ministry of InternationalTrade and Industry (MITI) to regulate all activitiesin the downstream sector of the petroleumindustry.
The Ministry of Domestic Trade and ConsumerAffairs has been given the powers to issue licencesfor the marketing and the distribution of petroleum
and petrochemical products. MITI is vested withthe powers to issue licences for the processingand refining of petroleum as well as themanufacture of petrochemical products.
In addition, the Petroleum (Income Tax) Act1967 was amended in 1976 to bring the structurein line with the production sharing contracts signedbetween PETRONAS and the various oilcompanies. Effective from the year of assessment1998, income tax on the petroleum industry wasreduced from 40% to 38% while the export dutyfor crude oil and condensate was reduced from20% to 10% with effect from 1 January 1998.
IX. GAS SUPPLY ACT 1993
The Gas Supply Act, 1993 was gazetted on4 February 1993 to safeguard the interests ofconsumers supplied with gas through pipelinesand from storage tanks or cylinders specificallyused for reticulation of gas. Gas was reticulatedto commercial and industrial outlets as well asresidential consumers.
The Gas Supply Act 1993 came into effectsimultaneously with the gazetting of the GasSupply Regulations 1997 on 17 July 1997. TheRegulations include procedures for the issuanceof a license to supply, installation of gas pipelines,inspection, tests and maintenance of gasinstallations as well as the certification andregistration of competent persons to undertakethe relevant work in such a manner as to ensurepublic safety. Both the Act and its Regulationsare enforced by the Director General of theElectricity and Gas Supply Department.
With the gazetting of the Gas Supply Act 1993,the relevant sections in the PetroleumDevelopment Act 1974 pertaining to the gasreticulation process have also been amendedto prevent duplications between the two Acts.This is to ensure that all gas reticulation andrelated transmission and supply activities willbe conducted in accordance with the Gas SupplyRegulations 1997.
220
X. SECURITIES COMMISSION
The Securit ies Commission (SC) wasestablished and started operations on 1 March1993 with the coming into force of the SecuritiesCommission Act 1993. With the coming into forceof the Securities Commission Act 1993, thefunctions of the Capital Issues Committee (CIC)established under the Securities Industry Act1983 and those of the Panel on Take-overs andMergers under the Companies Act 1965 weretransferred to the SC.
The SC comprises the following nine membersappointed by the Minister of Finance:
(a) SC a Chairman, who shall be an ExecutiveChairman;
(b) Four members representing theGovernment, including the Deputy ChiefExecutive; and
(c) Four other persons from the private sector.
A member of the SC shall hold office for aterm not exceeding three years and is eligiblefor reappointment.
Functions of the Securities Commission
The functions of the SC as stipulated in theSecurit ies Commission Act 1993, are asfollows:
(a) to advise the Minister of Finance on allmatters relating to the securities andfutures’ industries;
(b) to regulate all matters relating to securitiesand futures contracts;
(c) to ensure that the provisions of thesecurities laws are complied with;
(d) to regulate the take-overs and mergersof companies;
(e) to regulate all matters relating to unittrust schemes;
(f) to be responsible for supervising andmonitoring the activities of any exchange,clearing house and central depository;
(g) to take all reasonable measures tomaintain the confidence of investors inthe securities and futures’ markets byensuring adequate protection for suchinvestors;
(h) to promote and encourage proper conductamong members of the exchanges,clearing houses, central depository andall licensed persons;
(i) to suppress illegal, dishonourable andimproper practices in dealings in securitiesand trading in futures contracts and theprovision of investment advice or otherservices relating to securities or futurescontracts;
(j) to consider and make recommendationsfor the reform of the law relating tosecurities and futures contracts;
(k) to encourage and promote thedevelopment of securities and futures’markets in Malaysia including researchand training in connection thereto;
(l) to encourage and promote self-regulationby professional associations or marketbodies in the securities and futuresindustries;
(m) to license and supervise all licensedpersons as may be provided for underany securities law; and
(n) to promote and maintain the integrity ofall licensed persons in the securities andfutures’ industries.
In addition, the SC is also the sole regulatorof the private debt securities market and theregistering authority for prospectuses in respectof all securities other than shares and debenturesissued by unlisted recreational clubs.
Governing Acts and Guidelines
The SC is responsible for the administrationand enforcement of the following Acts:
(a) Securities Commission Act 1993;
(b) Securities Industry Act. 1983;
(c) Futures Industry Act 1993; and
221
(d) Securities Industry (Central Depositories)Act 1991.
The following are some of the Guidelines,Codes and Regulations issued and administeredthe SC:
(a) Policies and Guidelines on Issue/Offerof Securities;
(b) Guidelines for Public Offerings ofSecurities of Infrastructure ProjectCompanies;
(c) Guidelines for Public Offerings ofSecurities of Closed-End Funds;
(d) Guidelines for the Public Offering ofSecurities of Foreign-Based Companieswith the Listing and Quotation on theKuala Lumpur Stock Exchange;
(e) Prospectus Guidelines;
(f) Guidelines on the Offering of Private DebtSecurities;
(g) Guidelines on Contents of Prospectusfor Debentures;
(h) Securities Commission (Shelf RegistrationScheme for Debentures) Regulations2000;
(i) Guidelines on the Minimum ContentsRequirements for Trust Deeds;
(j) Malaysian Code on Take-overs andMergers;
(k) Guidelines on Asset Valuations forSubmission to the Securities Commission;
(l) Guidelines on Unit Trust Funds;
(m) Guidelines on Property Trust Funds;
(n) Guidelines on the Establishment ofForeign Fund Management Companies;
(o) Guidelines for Application for FundManager’s and Fund Manager’sRepresentative’s Licence under theSecurities Industry Act 1983;
(p) Guidelines For Application For FuturesFund Managers and Futures FundManager’s Representative’s LicenceUnder The Futures Industry Act;
(q) Guidelines for the issue of Call Warrants;
(r) Guidelines on Securities Borrowing andLending in Malaysia;
(s) Guidelines for Application of Licenceunder the Futures Industry Act 1993;
(t) Statutory Declaration by a PersonPursuant to an Application for a Licenceunder the Futures Industry Act 1993/Securities Industry 1983.
Applications For Corporate Proposals
A public company is required to seek theapproval of the SC, as required by the SecuritiesCommission Act 1993, before undertaking anyof the following proposals:
(a) Make available, offer for subscription orpurchase, or issue an invitation tosubscribe for or purchase securities inMalaysia.
(b) Make available, offer for subscription orpurchase, or issue an invitation tosubscribe for or purchase, outsideMalaysia, securities of a public companyor to list such securities on a securitiesexchange outside Malaysia;
(c) Make a bonus issue of securities of apublic company other than by way ofcapitalisation of unappropriated profits.
(d) By way of issue of securities effect:
(i) a compromise or arrangementwhether or not for the purposes ofor in connection with a scheme,compromise or arrangement forthe amalgamation of any two ormore corporations or forreconstruction of any corporation;or
(ii) an employee share or employeeshare option scheme; or
(iii) an acquisition of securities orassets.
(e) Apply for the listing of a corporation orfor the quotation of securities on a stockmarket of a stock exchange.
222
(f) Distribute assets of a public company toits members other than distribution incash or distribution of assets to membersof the public company on its winding up.
(g) Acquire or dispose of assets (whetheror not by way of issue of securities) whichresults in a significant change in thebusiness direction or policy of a listedpublic company.
In considering the proposals stipulated above,the SC may have regard to any of the followingmatters:
(a) whether or not there will be adequatedisclosure of such information thatinvestors and their professional adviserswould reasonably require and reasonablyexpert to find in the prospectus for thepurpose of making an informedassessment of:
(i) the assets and liabilities, financialposition, profits and losses andprospects of the issuer, and in thecase of a unit trust scheme orprescribed investment scheme, ofthe scheme;
(ii) the rights attaching to the securities;and
(iii) the merits of investing in thesecurities and the extent of the riskinvolved in doing so.
(b) whether the enquiries (if any) of thecorporation concerned, its officers,underwriters and advisers provideadequate verification of the accuracy andcompleteness of information disclosed;
(c) whether the persons in respect of whoma proposal has been made, needprotection through the process of approvaland disclosure pursuant to Part IV of theSecurities Commission Act 1993.
(d) the type of business in which thecorporation is engaged and the risksassociated with it;
(e) the record of the corporation and thecharacter, skills and experience of itsmanagement;
(f) the purpose for which the company israising funds;
(g) the suitability of permitting the proposalor permitting trading in securities on thestock market of a stock exchange or anystock market outside Malaysia;
(h) interests of the public; or
(i) whether the operation of the marketforces, including those with respect toprice, provide an adequate mechanismfor dealing with risks and merits of theproposal.
Regulatory Framework for Fundraising
Major changes to the regulatory frameworkfor fundraising were introduced with effect from1 July 2000 when the Securities Commission(Amendment Act 2000 (SCA) came into force.The rationale for the amendments is to createa fully rationalized and efficient regulatory regimefor capital raising in Malaysia. Under the SCA,the SC is the approving and registering authorityfor prospectuses in respect of all securities otherthan shares and debentures issues by unlistedrecreational clubs whilst the Registrar ofCompanies (ROC) retains all responsibilitiesrelating to the lodgment of prospectuses.
The existing provisions in the Companies Act1965 that deal with prospectuses will apply toany offer of shares or debentures by unlistedrecreational clubs and in respect of “interests”which are regulated under Division 5 of Part IVof the Companies Act 1965. The ROC wouldalso continued to regulate all public offers ofshares and debentures by unlisted recreationalclubs under Division 4 of Part IV of the CompaniesAct 1965 administered by the Registrar ofCompanies.
The SC is the single regulatory body for allcorporate bond issuance except for bonds whichare issued by unlisted recreational clubs. TheSC is responsible for the regulation of trustees,trust deeds, borrowers’ and guarantors’ obligationsin relation to debenture issues which areconsidered to be integral to the regulation ofcorporate bond market.
223
A company undertaking fundraising activitiesmay be required to prepare and registered withthe SC a document known as a prospectus. TheSCA specifies when a prospectus must beregistered and what its contents must include.
Division 3 Part IV of the SCA set out theprovisions regulating the requirement forprospectuses in relation to any issue of, offerfor subscription or purchases of or invitation tosubscribe for or purchase securities. Other formsof fundraising include debt securities e.g.debentures, mortgage debentures and unsecurednotes. These forms of fundraising are alsogoverned by the prospectus requirements setout in the SCA and other specific requirementsin relation to debentures set out in Division 4 ofPart IV of the SCA, such as the requirement fora trustee and trust deed, the duties of a trustee,duties of a borrower and the duties of a guarantor.
Initial Public Offering of Securities with Listingand Quotation on a Stock Exchange
The general policies and principles adoptedby the SC on public companies intending toundertake initial public offerings of securitieswith listing and quotation on the Kuala LumpurStock change are stipulated in the “Policies andGuidelines on Issue/Offer of Securities” (IssuesGuidelines), which became effective on 1 January1996 and replaced the previous “Guidelines forthe New Issue of Securities and the Valuationof Public Limited Companies” issued by the thenCIC.
The amendments made to the IssuesGuidelines in April 1999 involved the revisionof the requirements for listing on both the SecondBoard and Main Board of the KLSE and therequirements for reverse take-overs/back-doorlistings. The revised requirements were aimedat strengthening listing standards to provide addedcomfort to the investing public in their investmentopportunities as well as to promote the growthand orderly development of the Malaysian capitalmarket.
More amendments were made to the IssuesGuidelines in December 1999 to further facilitatethe progressive move towards disclosure-based
regulation (DBR). The revisions, which markedthe commencement of Phase 2 of DBR, generallyfocussed on liberalisation of the requirementson pricing of securities; valuation of assets, andutilisation of proceeds. Under Phase 2 of theDBR programme, the SC would minimise itsassessment in these areas as long as the broadrequirements/guidelines are complied with.
In evaluating an applicant’s suitability for listing,the SC will take into consideration a number offactors including adherence to quantitative andqualitative requirements as well as otherrequirements set out in the Issues Guidelines.Some of the more pertinent requirements thatwould have to be met are as follows:
1. Issued and Paid-up Capital
(a) Listing on Main Board
A public company seeking listing of andquotation for its securities on the MainBoard should have an issued and paid-up capital of not less than RM 60 million,comprising ordinary shares with a parvalue of not less than 10 cent per share.
(b) Listing On Second Board
A public company seeking listing of andquotation for its securities on the SecondBoard should have a minimum issuedand paid-up capital of RM40 million,comprising ordinary shares with a pervalue of not lass than 10 cent per share.
2. Historical Profit Performance
(a) Listing on Main Board
The company should have anuninterrupted profit record of either threeto five full financial years, with anaggregate after-tax profit of not less thanRM30 million over the said three to fiveyears, and at least RM8 million after-taxprofit for the latest financial year.
224
(b) Listing on Second Board
The company should have anuninterrupted profit record of either threeto five full financial years, with anaggregate after-tax profit of not less thanRM12 million over the said three to fiveyears, and at least RM4 million after-taxprofit for the latest financial year.
3. Pricing
The company should have an uninterruptedprofit record of either three to five full financialyears, with an aggregate after-tax profit ofnot less than RM12 million over the saidthree to five years, and at least RM4 millionafter-tax profit for the latest financial year.
Flexibilities in Listing Criteria for BumiputeraCompanies
Flexibilities in compliance with the listingrequirements for applications on proformaaccounts are given by The SC for Bumiputera-controlled companies that have pooled togetherfor listing on the Kuala Lumpur Stock Exchange(KLSE).
Paragraph 10.10(1)(e) of the Issues Guidelinespertaining to the use of proforma accounts forthe purpose of listing state the following:
“Where a group of companies is seeking listingon the stock exchange, at least one (1)company (which is the qualifying company)within the group, should be able to fulfil theprofit track record requirements. If no onecompany qualifies, listing based on the strengthof the group’s proforma accounts may beconsidered provided that all the companieswithin the group:
(a) are involved in the same orcomplementary business activities;
(b) have common directors; and
(c) have common shareholders withcontrolling shareholding, on a collectivebasis’
over the profit track record period.
For the purpose of determining controllingshareholding, only legal or registered ownershipwill be accepted, and control is taken as morethan 50% of the voting rights.”
With these flexibilities, a group of Bumiputera-controlled companies applying for listing basedon the strength of the group’s proforma accountswould only have to comply with the first criterionof being involved in the same or complementarybusiness activities and not the other two criteriaof having common directors and commoncontrolling shareholders.
However, in order to qualify for the flexibility,the Bumiputera group of companies must fulfilthe following conditions:
(a) The group must have a genuine pooledarrangement;
(b) The company which is the single largestcontributor, on an average basis for thepast three full financial years, to profitswithin the proforma group should havebeen incorporated and have been inbusiness operating the same orcomplementary business for at least 5full financial years prior to makingsubmission to the SC;
(c) Each company to be pooled togethermust have been a Bumiputera-controlledcompany under the control of the sameBumiputera shareholders with controllingshareholding for at least 3 full financialyears prior to making submission to theSC (or throughout the duration of thecompany if the company has beenincorporated for a period of less than 3financial years); and
(d) The company used as the listing vehiclemust, upon and subsequent to listing,be a Bumiputera-controlled company.
The purpose of the flexibilities is to provideBumiputera companies with the opportunities toaccess the capital market.
225
Regulations Relating to Take-overs andMergers
Persons involved in any take-over and mergerexercise are required to observe the provisionsrelating to take-overs and mergers contained insections 33 to 33E of the Securities CommissionAct, 1993 (SCA) and the Malaysian Code onTake-overs and Mergers 1998 (Code). Inadministering the Code, the SC will take intoaccount the desirability of ensuring that theacquisition of voting shares or control ofcompanies takes place in an efficient, competitiveand informed market.
Pursuant to section 33B(2) f the SCA, anacquirer who has obtained control in a companyis required to make a take-over offer, other thanin respect of voting shares of the company whichat the date of the offer are already held by theacquirer of which the acquirer is entitled toexercise. In this regard, control, in relation toan acquisition of shares, is defined under section33 of the SCA as the acquisition or holding of,or entitlement to exercise or control the exerciseof, voting shares of more than 33% in a company.
Pursuant to section 33B(3) of the SCA, anacquirer who has obtained more than 33% ofthe voting shares in a company but less than50% of voting shares in that company shall notacquire any additional voting shares in thatcompany, except in accordance with the provisionsof the Code. In this regard, section 6(1) (b) ofthe Code provides that an acquirer who holdsmore than 33% but less than 50% of the votingshares of a company and such person acquiresin any period of six months more than 2% ofthe voting shares of the company, such personshall be subjected to the provisions in the Coderelating to mandatory offers.
A person who fails to comply with the mandatoryoffer requirement shall be guilty of an offenceand shall, upon conviction, be punished with afine not exceeding one mill ion ringgit orimprisonment for a term not exceeding 10 yearsor both pursuant to section 33B(4) of the SCA.
Addit ionally, where any documents orinformation is required to be submitted to theSC, in relation to or in connection with a take-
over offer or merger and a person submits orcauses to be submitted any document orinformation that is false or misleading, the personshall be guilty of an offence and shall uponconviction, be punished to a fine not exceedingthree million ringgit or to imprisonment notexceeding 10 years or both pursuant to section33E(3) of the SCA.
Certain restrictions are imposed on both theacquirer as well as persons who sell their sharesto an acquirer. Pursuant to section 7 of theCode, acquirers who are subject to the mandatoryoffer requirement are restricted from appointingany director to the board of the offeree companyor exercising the voting rights attached to thevoting shares which have been acquired beforethe acquirer sends out an offer document to theofferee shareholders. Section 10 of the Codeprovides that persons who intend to sell his orits voting shares to an acquirer are not allowedto resign as director or cause a director whois accustomed to act in accordance to his or itsdirections or instructions to resign from the boardof the offeree until the first closing date of thetake–over offer or the date when the take-overbecomes or is declared unconditional as toacceptances, whichever is later.
Practice Notes attached to the Code provideguidance on the interpretation of certain provisionsof the Code. Amongst others, it provides forinstances where the mandatory offer obligationwould be deemed to be incurred as well ascircumstances under which a person may applyfor exemption from mandatory offer provisions.
XI. MALAYSIA DERIVATIVESEXCHANGE BHD (“MDEX”)
The futures industry in Malaysia commencedwith the establishment of the Kuala LumpurCommodity Exchange (KLCE), a commodityfutures exchange, which was the first futuresexchange in Southeast Asia in July 1980.
On 15 December 1995, the birth of KLOFFEheralded a significant event in the developmentof the nation’s capital market with the launch ofKLOFFE’s stock index futures contract. With its
226
introduction, Malaysia became the third Asianeconomy after Hong Kong and Japan to offerdomestic equity derivatives products. KLOFFEas a financial futures and options exchange offersan efficient price discovery mechanism and arisk transfer capabil i ty that has becomeindispensable to both corporate and individualinvestors.
In its early days, KLOFFE has already becomea member of the International Options MarketAssociation (IOMA), the International Financeand Commodities Institute (IFCI) and a signatoryto the Windsor Agreement. This is an indicationof its commitment to be a part of the internationalderivatives industry. In recognition of its striveto achieve premier exchange status, KLOFFEwas awarded “The 1996 Derivatives Exchangeof the Year” by World Equity, a renownedinternational equity investors magazine withinthe first year of operations.
It was also in May 1996, the MalaysianMonetary Exchange (MME) was set up to providefixed income derivatives, namely three-monthKLIBOR futures. In December 1998, the KLCEmerged with the MME and changed its name tothe Commodity and Monetary Exchange ofMalaysia (COMMEX Malaysia) to reflect thediversity of its products. In January 1999, a Salesand Purchase agreement was finalised betweenthe Kuala Lumpur Stock Exchange (KLSE) andshareholders of KLOFFE Capital Sdn Bhd.KLOFFE thus became a subsidiary of the KLSEGroup of Companies.
Subsequently, both KLOFFE and COMMEXMalaysia signed a Memorandum of Understandingto merge both exchanges in December 2000. Alldetails were finalised in May 2001 and the newexchange renamed to Malaysia DerivativesExchange Berhad (MDEX) was launched on 11June 2001. This is in-line with the recommendationin the Securities Commission’s Capital MarketMasterplan which aimed at establishing a singleexchange that is able to offer a multitude ofproducts for investors.
It is MDEX’s mission to be the catalyst in thedevelopment of the derivatives industry inMalaysia. MDEX will continually strive to providesafe and effective risk management tools to both
the commodity and financial communities. As afutures and options exchange, MDEX hasestablished a reputation for being a market withthe necessary capacity and capabilities forservicing the needs of the international tradingcommunity.
Regulatory Framework
The basis for the regulatory framework forthe futures industry is provided for by the FuturesIndustry Act 1993 (FIA). Under the FIA, approvalof the Minister of Finance is required before afutures exchange can be established and startto operate. To ensure that the public interestobjective is served by the establishment of thefutures exchange, the Minister is also empoweredunder the FIA to appoint the Executive Chairmanand two other members of the Board of theexchange.
The FIA also provides for the supervision ofthe futures industry to be undertaken by theSecurities Commission (SC), including licensingof market intermediaries such as:
(a) Futures broker and its representatives
(b) Futures fund manager and itsrepresentatives
(c) Future trading adviser and itsrepresentatives
Membership of MDEX
The merged exchange has various classes ofmembership, namely:
(a) Trading Members
Trading Membership is available tocompanies incorporated under theCompanies Act 1965. These companiesare set-up specifically to carry out afutures broking business and must belicensed as a futures broker under theFIA. The membership depending on theclass of membership, enables a companyto trade in equity related, non-equityrelated and commodity products. The
227
companies are permitted to trade for itselfand also on behalf of i ts cl ients.Application for admission as a TradingMember is by way of subscription of oneclass “A”, “B” or “C” Preference Shareissued by the MDEX which has attachedto it all the rights and obligations of aTrading Member.
(b) Local Members
Local Membership is offered to individualswho wish to trade for their own account.These individuals are not permitted totrade on behalf of clients. Local Membersare not required to be licensed underthe FIA as they are not considered to beintermediaries in the industry. However,they are required to be registered withMDEX. Local Members have access tothe trading facility of MDEX for thepurpose of executing their own trades ofwhich matched trades must be clearedthrough any of the Clearing Members.
(c) Trading Permit Holders
Trading permits may be issued toindividuals or corporations which enablethem to trade on MDEX for a limitedperiod of t ime. These permits arerenewable upon expiration, subject tothe approval of the exchange. TradingPermit Holders may not transfer theirrights to another individual or corporation.
(d) Associate Members
Associate Members are corporations thathave been granted the option to be aClearing Member. These companies donot own any Preference Shares. AssociateMembers are required to nominate aTrading Member who will execute tradeson their behalf.
(e) Members Representatives
A Trading Member requires individualsto act on its behalf. These individualsare required to be licensed as futuresbroker representatives (FBR) by the SC
under the FIA. They typically carry outthe following functions on behalf of theTrading Members—
(i) Execution of trades;
(ii) Collection of margins fromcustomers;
(iii) Provide basic accounting records;and
(iv) Advise customers in their tradingprogrammes.
Products
The following 4 products are currently traded onthe exchange—
(a) Crude Palm Oil (CPO) Futures
(b) Kuala Lumpur Stock Exchange CompositeIndex (KLSE CI) Futures
(c) Kuala Lumpur Stock Exchange CompositeIndex (KLSE CI) Options
(d) 3-Month Kuala Lumpur Interbank OfferedRate (KLIBOR) interest rate Futures
The Crude Palm Oil Futures contract waslaunched in October 1980 and remains the mostsuccessful commodity futures contract to-date.On the financial side, the first contract to belaunched was the KLSE CI Futures contract inDecember 1995. This was followed by the 3-Month KLIBOR Futures contract in May 1996,and subsequently the KLSE CI Options contractin December 2000.
Trading Mechanism
KLSE CI Futures and Options employ theelectronic system for trading known as theKLOFFE Automated Trading System (“KATS”).KATS is based on the Eurex Deutscheland tradingsystem and has been substantially enhanced tomeet Malaysian market requirements.
The CPO Futures and KLIBOR Futures stillemploy the open-outcry system for trading.However, this will change soon when all contractswill be traded using the KATS electronic trading
228
system. The open-outcry system requires all floortraders to call out their bids and offers in a loudand audible manner within the respective tradingpits on the trading floor. It is through the constantprocess of bidding and offering that a particularprice is reached where both buyer and selleragree to transact. This process constitutes the‘price discovery’ mechanism of futures market.
To further facilitate communication amongtraders in the pits, hand signals are used tocomplement the calling out of bids and offers.This is especially helpful during hectic tradingperiods where the ‘noise’ level can be ratherhigh within the trading pits.
All bids to buy and offers to sell, as well astraded prices, are captured on MDEX Malaysia’sprice reporting system known as e-XPRESS,and the information is disseminatedinstantaneously to all market participantsworldwide via newswires such as Reuters,Bloomberg, Bridge News, etc. Plans are underwayto enhance transparency further by providingreal-time information over the information super-highways of the Internet.
Malaysian Derivatives Clearing House
The Malaysian Derivatives Clearing HouseBhd (MDCH) is the clearing house for exchangetraded derivative contracts in Malaysia. Its primaryfunction is to ensure that the financial obligationsunder the futures contracts entered into on theexchange are performed in a timely manner. Itcarries out this function by becoming thecounterparty to these contracts, assuming thecredit risk of its Clearing Members and managingthat centralised risk.
MDCH was formed in December 1995 to clearstock index futures, and in May 1996 it beganclearing interest rate futures. In November 1997it merged with the clearing house for commoditiesfutures, Malaysian Futures Clearing CorporationBhd (MFCC). MDCH now clears:
(a) Stock index futures and options;
(b) Interest rate futures; and
(c) Palm oil futures.
In protecting the financial integrity of themarketplace, MDCH adopts a financial andoperational safeguard system that is comparableto the best international practices. This systemis designed to provide the highest level of safetywith very early detection of unsound practiceson the part of any member. Protection againstmarket defaults is imperative and remains theultimate goal of the clearing system.
Financial performance of all contracts tradedon MDEX is guaranteed, initially by the ClearingMembers, and thereafter by the MDCH, oncethe contract has been matched and acceptedfor clearing. All participants of the MDEX musthave their trades cleared through a ClearingMember of the MDCH to ensure themselves ofa financially strong party behind their contractsas soon as they are transacted.
Once a contract has been accepted for clearing,the MDCH substitutes itself as the buyer to theseller and vice versa. MDCH will then hold eachClearing Member accountable for every positionit carries regardless of whether the position iscarried for the account of another member, forthe account of a non-member client, or for theClearing Member’s own account. In short, theMDCH looks solely to the Clearing Membercarrying and guaranteeing the account to secureall payments and performance obligations.
XII. COMMODITY AND MONETARYEXCHANGE OF MALAYSIA(COMMEX MALAYSIA)
Commodity and Monetary Exchange ofMalaysia (COMMEX Malaysia) is a membershipowned futures exchange which was incorporatedon 14 July 1980 as The Kuala Lumpur CommodityExchange. In 1992 The Kuala Lumpur CommodityExchange formed a wholly-owned subsidiaryMalaysia Monetary Exchange in order to offertrading in financial futures. The businessoperations of Malaysia Monetary Exchange wasmerged with that of COMMEX Malaysia on 7December 1998.
COMMEX Malaysia operates under thejurisdiction and supervision of the Securities
229
Commission and is governed by the FuturesIndustry Act 1993 (FIA), thus offering investorsthe security of trading on a regulated Exchangewith proven procedures and standards whichconform to international standards.
COMMEX Malaysia provides and regulatesthe facilities and place for trading of bothcommodity and financial futures contractspursuant to the business rules of the exchange.All futures contracts traded on the exchange areguaranteed by the clearing house, MalaysianDerivatives Clearing House Bhd.
Management of COMMEX Malaysia
The powers of management of the exchangeare vested in the Management Board of theExchange. As stipulated in section 5 of the FIA,the Management Board comprises of:
(i) An Executive Chairman and two otherdirectors appointed by the Minister ofFinance; and
(ii) Six directors elected by the members.
Membership
The membership structure of Commodity andMonetary Exchange of Malaysia has two distinctfutures markets namely the commodity andfinancial futures markets. Members of theExchange Company are corporations (brokersand non-brokers), categorised as GeneralMembers, Commodity Members and FinancialMembers. Members of the Exchange are individualLocal Members, Local Lessees, Trading PermitHolders and corporate Trade Affiliates.
A broker member of COMMEX Malaysia is acorporate member holding a futures broker licenseissued by the Securities Commission (SC) underthe Futures Industry Act (FIA) 1993, to carry onfutures brokering business. Consequently, underthe FIA, every director and relevant employeeof a futures broker member are required to belicensed by the SC as futures broker’srepresentatives (FBR).
Seats
The trading rights of members of the Exchangeare attached to Seats, (minimum 1 seat) whichare either owned or leased. As for the Membersof the Exchange Company, they must at leastown 2 seats, a prequisite to their trading rights.Seats are categorised as Commodity Seats,Financial Seats and Individual Seats.
Seats may be purchased from the Exchangeor from Members wishing to sell in the secondarymarket, subject to the approval and in accordancewith the Business Rules of the Exchange.
Market Safeguards
COMMEX Malaysia has many safeguards ofhigh standards to protect the integrity of themarkets. They are as follows:
(i) The Clearing House
In protecting the financial integrity of themarketplace, COMMEX Malaysia togetherwith its clearing house, the MalaysianDerivatives Clearing House Berhad(MDCH), adopts a f inancial andoperational safeguard system that iscomparable to the best internationalpractices. This system is designed toprovide the highest level of safety withvery early detection of unsound practiceson the part of any member. Protectionagainst market defaults is imperative andremains the ultimate goal of the clearingsystem.
Financial performance of all contractstraded on the floor of COMMEX Malaysiais guaranteed, initially by the ClearingMembers, and thereafter by the MDCH,once the contract has been matched andaccepted for clearing. All participants ofthe Exchange must have their tradescleared through a Clearing Member ofthe MDCH to ensure themselves of afinancially strong party behind theircontracts as soon as they aretransacted.
230
Once a contract has been accepted forclearing, the MDCH substitutes itself asthe buyer to the seller and vice versa.MDCH will then hold each ClearingMember accountable for every positionit carries regardless of whether theposition is carried for the account ofanother member, for the account of anon-member client, or for the ClearingMember’s own account. In short, theMDCH looks solely to the ClearingMember carrying and guaranteeing theaccount to secure all payments andperformance obligations.
(ii) The Audit, Compliance & Surveillance(ACS) Division
The ACS division has an overallresponsibility of upholding the integrityof COMMEX Malaysia’s futures markets.The Division carries out a wide rangeof duties through its highly dedicatedand competent audit staff which includedaily and regular monitoring of the marketand members, regular visits to members’offices for field audits and monitoring ofthe activities on the trading floor of theExchange.
The duties of the ACS Division can beclassified into the following major areas:
(a) Audit and Compliance
The Division is responsible fordetecting violation of the Rules andthe Act. It conducts routine andsurprise audits on Broker Membersas well as reviewing the adequacyof their internal controls.
(b) Financial Surveillance
The Division is also responsiblefor detection of any failure byMembers to meet the minimumfinancial requirements of theExchange. It conducts regularmonitoring of Members’ financialpositions and clients’ funds insegregation. Early warning levels
are established to facilitate moreintensive monitoring wherenecessary, on the Broker Members’financial positions.
(c) Market Surveillance
The Division is responsible fordetection of any adverse situationsthat may threaten the orderlytrading or liquidation of contractson any COMMEX Malaysia’sfutures markets avoiding possiblemarket disruptions. It conductsdaily monitoring of the futuresprices and prices of the underlyingcommodity in the cash and forwardmarkets, and the prices ofsubstitutes of the underlyingcommodity of the futures contracts,as well as the open positions oflarge traders.
(d) Floor Surveillance
The Division is also responsiblefor detecting any fraudulent tradingpractice, abuse, and any otherviolation of COMMEX Malaysia’sBusiness Rules or the objectscontained in COMMEX Malaysia’sFloor Procedures Manual. Theirduties include ensuring all traderson the Floor maintain a highstandard of conduct andprofessionalism, conduct regularaudits on Members pertaining toFloor Rules violation, investigatecomplaints officially received fromMembers, Locals, the ClearingHouse, and other sources, andcarry out special audits at therequest of the ComplianceCommittee of the Exchange.
A CCTV (closed-circuit television)Surveillance System is in place toenhance the Division’sperformance. The system includescameras located at strategicpositions within the trading floor,microphones, television monitors,
231
videocassette recorders, and ascanner with pan, tilt and zoomcapabilities.
Other than carrying out i tsresponsibil i t ies of detectingviolations that may affect theintegrity of the market, the divisionalso adopts a proactive approachto assist Members in complyingwith the Rules. Members arestrongly encouraged to consult thedivision on regulatory issues. Earlywarnings to Members in somesituations where Members facesome risks of violating the Rulesare also provided. In addition, theDivision regularly init iatesamendments to the Rules insteering towards a more efficientmarketplace.
In addition to the above, theDivision also acts as the Secretariatto the Dispute Committee of theExchange in settling disputesbetween Members and clients. Theframework for enforcing the Rulesis firmly established and well-tested, with the ComplianceCommittee of the Exchange havingsome limited disciplinary powerslike imposing compound fines forsome specific minor violations, andordering Broker Members to tradefor liquidation only for failure tomeet minimum financialrequirements. All major and seriousviolations detected are referred tothe Business Conduct Committeefor a full disciplinary hearing.
(iii) Registration of Brokers
A Member of the Exchange, who handlesclients’ futures accounts must beregistered as a Futures Broker with theSecurities Commission (SC) under theFutures Industry Act (FIA), 1993. TheSC is an independent national regulatoryagency responsible for the regulation andsupervision of both commodity futuresand financial futures trading in Malaysia.
A Futures Broker must also ensure thatall its employees, who handle clients,are registered as Futures Broker’sRepresentatives (FBRs) and areregistered with the SC.
(iv) Reportable Position and SpeculativePosition Limits
Members are required to report to theExchange when its proprietary account,or any of its client’s, has a position equalto or in excess of the reportable levelset by the Exchange for each contract.
Reportable position for Crude Palm Oilfutures contract is set at 100 or moreopen contracts, either long or short, inany one delivery month. As for the Three-month KLIBOR futures contract, an openposition of 100 or more Contracts in anyone (1) delivery month which is ownedor controlled by a Member or Client, aloneor in conjunction with any other personor corporation, at the close of theAfternoon Session on any Business Dayshall constitute Reportable Position.
Speculative position limits are also setfor all contracts. For CPO futures, thelimit is 500, net long or short, in anydelivery month or in all months combined.This limit is set at 2,000 contracts, nettgross open positions for all deliverymonths of the contract for KLIBOR futures.
Exemptions from position limits can beobtained for bona fide hedging trades.These limits are enforced strictly toprevent price manipulation or corneringof the market, hence protecting theintegrity of the Exchange.
(v) Segregation of Clients’ Funds
Members are required to maintain aseparate bank account for all clients’funds. Clients’ funds cannot be withdrawnfrom the segregated account except forthe purposes of payment of deposits andmargins, payment of debts due to theMember from the clients, and monies
232
drawn on clients’ authority. Members arealso not permitted to use moniesbelonging to one client for margining orfinancing the trades and positions ofanother client or the Member itself.
COMMEX Malaysia’s Products
COMMEX Malaysia, Malaysia’s premier and firstmulti-product futures exchange, currently offerstwo futures contracts.
The Crude Palm Oil (CPO) Futures contract,launched in 1980, caters to the price riskmanagement needs of the oils and fats’ industry.Over the last few years, the market has gainedtremendously in stature. Prices discovered onthe trading floor are now recognised as the pricingbenchmark for palm oil and its products worldwide.
The Three-Months Kuala Lumpur InterbankOffered Rate (3-month KLIBOR) futures contractwas launched in 1996. This contract caters tothe hedging and trading needs of financialinstitutions and large corporations with Ringgit-based assets. Major users of the contract currentlyinclude the commercial banks, large corporationsand many others with risk exposure to interestrate movements.
XIII. REGULATION OF ACQUISITIONOF ASSETS, MERGERS ANDTAKE-OVERS
The Foreign Investment Committee (FIC)Guidelines of 1974 were formulated to establisha set rules regarding the acquisition of assetsor any interest, mergers or take-overs ofcompanies and business. The Guidelines maybe viewed as a means of restructuring the pattern,ownership and control of the corporate sectorsin line with the objectives of the New EconomicPolicy (NEP) of 1970-90. Through theseGuidelines, the Government endeavours to reducethe present imbalances in the distribution of thecorporate wealth and to encourage those formsof private investment that would contribute tothe development of the country in consonancewith the objectives of the NEP. Since efforts
made in restructuring the equity ownership inthe corporate sector will continue under theNational Development Policy for the period after1990, the 1974 FIC Guidelines will continue toapply regarding the acquisition of assets or anyinterest, mergers and take-overs of companiesand businesses in furtherance of the restructuringobjectives.
Rules and Regulations Regarding Acquisition,Mergers and Take-Over
The Guidelines for the acquisition of assets,mergers or take-overs by foreign or Malaysianinterests are governed among others by thefollowing rules:
(a) Against the existing pattern of ownership,the proposed acquisition of assets or anyinterest, mergers or take-overs shouldresult directly or indirectly in a morebalanced Malaysian participation inownership and control.
(b) The proposed acquisition of assets or anyinterest, mergers or take-over should leaddirectly or indirectly to net economicbenefits in relation to such matters as theextent of Malaysian participation,particularly Bumiputera participation,ownership and management, incomedistribution, growth, employment, exports,quality, range of products and services,economic diversification, processing andupgrading of local raw material, training,efficiency, and research and development.
(c) The proposed acquisition of assets or anyinterest, mergers or take-overs ofcompanies and businesses should not haveadverse consequences in term of nationalpolicies in such matters as defence,environmental protection or regionaldevelopment.
(d) The onus of proving that the proposedacquisition of assets or any interest,mergers or take-overs of companies andbusinesses is not against the objectivesof the NEP is on the acquiring partiesconcerned.
233
The above guidelines will apply to the following:
(a) any proposed acquisition by foreigninterests of any substantial fixed assetsin Malaysia;
(b) any proposed acquisition of assets or anyinterest, mergers and take-overs ofcompanies and businesses in Malaysiaby any means, which will result in ownershipor control passing to foreign interest;
(c) any proposed acquisition of 15% or moreof the voting power by any one foreigninterest or associated group or by foreigninterests in the aggregate of 30% or moreof the voting power of a Malaysia companyor business;
(d) control of Malaysian companies orbusinesses through any form of joint-venture agreement, managementagreement and technical assistanceagreement or other agreement;
(e) any merger and take-over of any companyor business in Malaysia whether byMalaysians or foreign interests; and
(f) any other proposed acquisition of assetsor interests exceeding in value of RM5million whether by Malaysians or foreigninterests.
The guidelines, however, do not apply to specificprojects approved by the Government comprisingthe following:
(a) acquisition by Ministries and GovernmentDepartments;
(b) acquisit ion by Minister of FinanceIncorporated, Menteri Besar Incorporatedand State Secretary Incorporated; and
(c) privatisation projects approved by theFederal or State Government.
Foreign Investment Committee
For the purpose of implementing the guidelines,the FIC was established and is responsible for
major issues on foreign investment. The functionsof the FIC are:
(a) to formulate policy guidelines on foreigninvestments in all sectors of the economyto ensure the fulfillment of the objectivesof the NEP;
(b) to monitor the progress and help resolveproblems pertaining to foreign privateinvestments and to recommend suitableinvestment policies;
(c) to supervise and advise ministries andGovernment agencies in all mattersconcerning foreign investments;
(d) to coordinate and regulate the acquisitionof any assets or interests, mergers andtake-overs of companies and businessesin Malaysia; and
(e) to monitor, assist and evaluate the form,extent and conduct of foreign investmentsin the country and to maintaincomprehensive information to foreigninvestments.
The FIC comprises the following members:
(a) Director-General of the Economic PlanningUnit (as Chairman);
(b) Secretary-General of the Ministry ofFinance;
(c) Governor of the Central Bank ;
(d) Secretary-General of the Ministry ofInternational Trade and Industry;
(e) Chairman of the Securities Commission;
(f) Chairman of the Malaysian IndustrialDevelopment Authority;
(g) Director-General of the implementation andCoordination Unit;
(h) Secretary-General of the ministry ofDomestic Trade and Consumer Affairs;
(i) Secretary-General of the Ministry ofEntrepreneur Development; and
(j) Registrar of Companies.
234
Further details on the Guidelines and proceduresfor submission of proposals to the FIC areobtainable from:
The SecretaryForeign Investment Committee (FIC)Economic Planning UnitPrime Minister’s DepartmentBlock B5 & B6P.M’s Department Complex62502 Putrajaya.
XIV. EXCHANGE CONTROL POLICY
With the return of stability in the financial markets,Malaysia’s selective exchange control measuresintroduced since 1 September 1998 have beenprogressively relaxed. The major changesintroduced in 2000/2001 were the following -
(a) 10 July 2001
Extension of Ringgit Credit Facilities toNon-residents for purchase of ImmovableProperty in Malaysia
Resident financial institutions are allowedto extend up to a maximum of 3 propertyloans in aggregate to non-residents tofinance the purchase or construction ofany property in Malaysia (excluding thepurchase of land only), subject to thebanks’ internal credit assessmentguideline.
(b) 2 May 2001
Abolition of Levy
The 10% levy imposed on profits fromportfolio investments that are repatriatedwithin one year of realisation has beenabolished. With this measure, there iscomplete freedom of inflows and outflowsof portfolio investments.
(c) 20 December 2000
Ringgit Credit Facilities to Non-residents
Licensed commercial banks and BankIslam Malaysia Berhad in Malaysia are
freely allowed to extend overdraft facilityin aggregate of not exceeding RM200million on intra-day and not exceedingRM10 million on overnight basis to non-resident stockbroking companies andglobal custodian banks to facilitate thesettlement of trades done on the KualaLumpur Stock Exchange (KLSE).
In addition, they can also enter into short-term currency swap arrangement to coverpayment for purchase of shares on theKuala Lumpur Stock Exchange subjectto certain conditions.
(d) 1 December 2000
Domestic Credit Facilities Extendedto Non-Resident Controlled Companies
Non-Resident Controlled Companies arepermitted to source up to 50% of thetotal amount of their domestic creditfacilities from foreign-owned bankinginstitutions in Malaysia.
The exchange control policies of Malaysiaare applied uniformly to transactions withall countries, except Israel, Serbia andMontenegro for which special restrictionsapply. The exchange control policies, ingeneral, are aimed at monitoring thesettlement of payments and receipts aswell as encouraging the use of thecountry’s f inancial resources forproductive purposes in Malaysia. Formonitoring and compiling balance ofpayments statistics, residents are requiredto complete statistical forms, Form P andForm R, for each payment and receiptof more than RM10,00 vis-à-vis non-residents.
The following are the main exchange controlrules:
I. Current Account Transactions
(a) Payments for Import of Goods andServices
Payments to non-residents are freelyallowed for import of goods and services
235
irrespective of amount as long as theyare made in foreign currency.
(b) Export Proceeds
All export proceeds are required to berepatriated back to Malaysia inaccordance to the payment scheduleas specified in the sales contract, whichin any case should not exceed sixmonths from the date of export.
Export proceeds must be received inforeign currency and must be sold forringgit or retained in approved foreigncurrency accounts with residentcommercial banks, up to an aggregateovernight limit of between USD1 millionand USD10 million.
Resident exporters are required tosubmit a quarterly report listing allexports exceeding RM100,000 f.ob. pershipment, where payment would bereceived in full or in part, within 21days after the end of the quarter beingreported.
(c) Import and Export of Currency byTravellers
Resident and non-resident travellers arenot required to declare in the TravellersDeclaration Form (TDF) as long as theycarry currency notes and/or traveller’scheques within the permissible limits.For non-residents, the declaration hasbeen incorporated into the EmbarkationCard issued by the ImmigrationDepartment.
Declaration in the TDF is no longerrequired under the fol lowingcircumstances:-
• Resident carrying any amount offoreign currency notes, includingtraveller’s cheques into Malaysia.
• Resident and non-residenttravellers carrying ringgit notes upto RM1,000.
• Resident travellers bringing outforeign currency notes, includingtraveller’s cheques, up to theequivalent of RM10,000.
• Non-resident travellers can bringin any amount of foreign currencynotes, including traveller’scheques. They are not requiredto declare in the TDF as long asthe amount brought in is less thanthe equivalent of USD2,500.
However, for residents, prior writtenapproval from the Controller of ForeignExchange (the Controller) should beobtained if the amount exceeds thepermissible limits. In the case of non-resident travellers, they will only needto seek approval if the amount to becarried abroad exceeds the amountbrought into Malaysia, provided theamount to be taken out is more thanthe equivalent of USD2,500.
II. Capital Account Transactions
(a) Foreign Direct Investment
Foreign direct investors are freelyallowed to repatriate their investments,including capital, profits, dividends andinterest.
(b) Investment Abroad by Residents
Residents, other than commercial banksand approved merchant banks, arerequired to seek prior approval fromthe Controller to remit funds in excessof RM10,000 for overseas investmentpurposes.
Commercial banks and approvedmerchant banks are freely permitted toinvest abroad as long as they complywith the Banking and FinancialInstitutions Act, 1989 and their approvednet open position limit. Remittance forinvestments abroad must be made inforeign currency.
236
(c) Foreign Currency Credit Facilitiesfrom Non-Residents
Residents are freely permitted to obtaincredit facilities in foreign currency upto the equivalent of RM5 million in theaggregate from licensed banks, licensedmerchant banks and non-residents. Anyamount exceeding the permitted limitwould require the prior approval of theController. Where the aggregate amountexceeds the equivalent of RM1 million,the resident must provide the Controllerinformation on the credit facilities.
There is no restriction for repayment ofcredit facilities obtained as long as suchcredit facilities have been obtained inaccordance with the relevant exchangecontrol policies.
(d) Ringgit Credit Facilities from Non-Residents
Residents are not allowed to obtain creditfacilities in ringgit from non-residentswithout the prior approval of theController.
(e) Extension of Credit Facilities to Non-Residents
Foreign Currency Credit Facilities
Commercial banks are freely allowedto extend credit facilities in foreigncurrency to non-residents for anypurpose. However, credit facilitiesextended for the acquisit ion ordevelopment of immovable property inMalaysia would be subject to similarrequirements as in ringgit credit facilitiesoutlined below.
Ringgit Credit Facilities
Resident financial institutions areallowed to extend credit facilities inringgit to non-residents to finance thepurchase or construction of any propertyin Malaysia (excluding for purchase ofland only), subject to their own internal
credit assessment guideline. Residentcompanies are allowed to extend creditfacilities to their non-resident employeessubject to the terms and conditions ofservice to finance the purchase orconstruction of property (excludingpurchase of land only) in Malaysia. Anon-resident may only obtain, at anyone point in time, a maximum of threeproperty loans in ringgit (Including loansobtained from companies under theterms and conditions of service). Allpurchases are subject to the guidelineissued by the Foreign InvestmentCommittee (FIC).
Banking institutions are allowed toextend credit facilities in ringgit up tothe aggregate of RM200,000 to a non-resident for purposes other than tofinance the acquisition or developmentof immovable property in Malaysia andpurchase of one vehicle for own use.Prior written approval of the Controlleris required for the extension of creditfacilities exceeding the limit.
Licensed Banks and Bank IslamMalaysia Berhad are allowed to extendoverdraft facility in aggregate of notexceeding RM200 million on intra-dayand not exceeding RM10 million onovernight basis to non-residentstockbroking companies and non-resident global custodian banks. Theconditions are that the facility would bestrictly for financing funding gaps dueto unforeseen or inadvertent/technicaladministration errors or time zone delaysin relation to settlement of trades onthe Kuala Lumpur Stock Exchange(KLSE).
Resident stock-broking companies areallowed to extend margin financing tonon-resident clients for the purchaseof shares listed on the KLSE, providedthey comply with all the relevant rulesimposed by KLSE.
237
Ringgit Swap/Forward
Authorised dealers are allowed to enterinto short-term currency swaparrangement with non-residentstockbrokers and non-resident globalcustodian banks to cover payment fortheir share purchases on the KLSE.Authorised dealers are also allowed toenter into an outright ringgit forwardsale contract with non-residents for thesame purpose. The permission is subjectto the condition that such contracts arebased on firm commitment and not onanticipated purchases, and with maturityperiod of up to three working days withno rollover option.
(f) Portfolio Investments
Non-residents are freely allowed torepatriate their principal sum and profitsout of the country at any time. The exitlevy system was abolished on 2 May2001.
III. Ringgit Credit Facilities to Non-ResidentControlled Companies
A resident is freely allowed to extend creditfacilities in ringgit to a Non-ResidentControlled Company (NRCC) operating inMalaysia up to an aggregate limit of RM10million per corporate group and any amountof short-term trade financing where thetenure does not exceed 12 months. TheNRCC is required to obtain prior approvalfrom the Controller for domestic borrowingexceeding RM10 million in aggregate andto comply with the 3:1 gearing ratiorequirement between its domestic debt andeligible capital funds.
Of the total amount of credit facilitiesextended to any NRCC by resident bankinginstitutions in Malaysia, foreign-ownedbanking institutions may only extend creditfacilities up to a maximum of 50%, with thebalance from Malaysian-owned bankinginstitutions.
IV. Issuance of Ringgit Private DebtSecurities
On 24 April 2000, general permission wasgranted to NRCCs to raise domestic creditfacility through the issuance of ringgit PrivateDebt Securities regardless of amount, asstated in the Exchange Control Guidelineon Private Debt Securities. However, theNRCC must comply with the 50:50 ruleand the 3:1 ratio. NRCCs would be exemptedfrom the 50:50 rule if the Private DebtSecurities are issued by way of a competitivebidding system. The proceeds from thePrivate Debt Securities must be utilised forproductive purposes. The amount issuedwould be included as part of the NRCCs’total domestic credit facilities.
V. Foreign Currency Accounts of Residents
Resident exporters are permitted to openforeign currency accounts with residentcommercial banks to retain export proceedsin foreign currency of between USD1 millionand USD10 million, depending on theirexport receipts:
Aggregate Average MonthlyOvernight Limit Export Receipts
USD10 million Exceeding RM20 million
USD5 million Exceeding RM10 millionand up to RM20 million
USD3 million Between RM5 million andRM10 million
USD1 million Less than RM5 million
Resident companies with domestic creditfacilities are permitted to open foreigncurrency accounts to retain foreign currencyreceivables, other than export proceeds,up to an aggregate overnight limit of:
• USD0.5 million with commercial banksin Malaysia; and
• USD0.5 million with Licensed OffshoreBanks in Labuan.
238
Resident companies with no domestic creditfacilities are permitted to open foreigncurrency accounts with commercial banksin Malaysia to retain foreign currencyreceivables other than export proceeds withno overnight limit specified by Bank NegaraMalaysia.
Resident individuals are also allowed toopen foreign currency accounts solely tofacil i tate education and employmentoverseas up to an aggregate overnight limitof USD100,000 with commercial banks inMalaysia, USD100,000 with Labuan offshorebanks and USD50,000 with overseas banks.
VI. Foreign Currency Accounts of Non-Residents
Commercial banks and approved merchantbanks are freely allowed to open foreigncurrency accounts for non-residents.
There are no restrictions on the inflow andoutflow of funds through the foreign currencyaccounts of non-residents.
VII. External Accounts of Non-Residents
Banking institutions are freely allowed toopen accounts in ringgit known as ExternalAccounts for non-residents.
Non-residents are allowed to use their ringgitfunds in the External Account for thefollowing purposes—
• To purchase foreign currency;
• To purchase ringgit assets;
• To pay for goods and services inMalaysia for own use;
• To pay for administrative and statutoryexpenses incurred in Malaysia;
• To pay for settlement under a non-financial guarantee (where the non-financial guarantee is called uponagainst the account holder)
• To extend ringgit credit facilities tostaff in Malaysia in accordance to termsand conditions of employment;
• To repay ringgit credit facilities thatwere extended in accordance to ECMNotice, ECM 6 or the terms andconditions of employment;
• To withdraw ringgit cash of any amount;and
• To pay resident beneficiary for anypurpose except for the followingpurposes—
– payment for the import of goodsand services;
– extension of ringgit credit facilitiesto residents not in accordanceto the terms and conditions ofservice;
– settlement under f inancialguarantees; and
– Payments on behalf of a thirdparty.
The sources of funds in these ringgitaccounts may be from—
• Sale of foreign currencies;
• Sale of own ringgit assets;
• All income derived from Malaysiaincluding salaries, wages,commissions, fees, rental, interest,profits or dividends.
• Proceeds from credit facilities permittedunder ECM Notice, ECM 6 or inaccordance to the terms and conditionsof service;
• Proceeds from repayment of ringgitcredit facilities that were in accordanceto ECM Notice, ECM 6 or in accordanceto the terms and conditions of service;
• Credit ing of r inggit cash of notexceeding RM10,000 per day; and
• Transfers from an External Accountbelonging to the same account holder.
239
Ringgit funds in the External Accounts arefreely convertible and these funds can alsobe used for permissible purposes mentionedabove.
There is no restriction on the operations ofthe External Accounts of non-residentsworking in Malaysia (including their spouse,children and/or parents who are currentlyresiding in Malaysia), non-residents studyingin Malaysia (including their spouse, childrenand/or parents who are currently residingin Malaysia), Central Banks, Embassies,Consulates, High Commissions,Supranational or International organisationsrecognised by the Malaysian Government.
VIII. Special Status Granted to SelectedCompanies
(a) Offshore Entities in the LabuanInternational Offshore FinancialCentre
Entit ies established in LabuanInternational Offshore FinancialCentre (IOFC) are declared as non-residents for exchange controlpurposes after they are incorporated/registered under the OffshoreCompanies Act 1990, and/or licensedOffshore Banking Act 1990 orOffshore Insurance Act 1990 as thecase may be. Offshore entities inLabuan are freely allowed to deal inforeign currency with non-residents.
Licensed Offshore Banks in Labuanare permitted to receive paymentsin ringgit from residents arising fromfees, commissions, dividends, orinterest from deposit of funds.
Effective from 30 September 2000,Licensed Offshore Banks in Labuanare permitted to invest in assets/instruments in Malaysia for their ownaccount provided investments aretransacted directly with residentbanking institutions or residentbrokers. The investments must notbe financed by ringgit borrowings.
All offshore entities are freely allowedto maintain ringgit accounts withresident banks to facil itate thedefrayment of statutory andadministrative expenses in Malaysia.
Offshore Insurance Entities in Labuanare permitted to maintain ringgitaccounts with resident banks inMalaysia. They can use their ringgitaccounts for purposes of defrayingtheir statutory and administrativeexpenses in Malaysia, includingreceipt of insurance premiums andfor payment of claims arising frominsurance and reinsurance ofdomestic insurance business.
(b) Multimedia Super Corridor Companies
Companies operating in MultimediaSuper Corridor (MSCs) which areincorporated as separate legalentities, are given exemption fromexchange control regulations uponthe companies being awarded theMSC status by the MultimediaDevelopment Corporation. Theexemption granted to the MSCcompany is solely for transactionsundertaken on its own account.However, prior approval should beobtained to deal with SpecifiedPersons and in Restricted Currenciesof Israel and the Federal Republic ofYugoslavia (Serbia and Montenegro).In addition, the MSC company is alsorequired to submit the necessarystatistical forms/reports/statements.
(c) Approved Operational Headquarters
Approved Operational Headquarters(OHQs) are allowed to open foreigncurrency accounts with commercialbanks in Malaysia to retain exportproceeds in foreign currency up toan aggregate overnight balanceequivalent to USD10 mil l ion,regardless of the amount of exportreceipts.
240
OHQs are also allowed to openforeign currency accounts withcommercial banks in Malaysia,Licensed Offshore Banks in Labuanor overseas banks for crediting foreigncurrency receivables, other thanexport proceeds, with no limit on theovernight balances.
OHQs are allowed to obtain domesticcredit facilities in ringgit not exceedingRM10 million, provided the ringgitfunds are used in Malaysia.
OHQs are allowed to obtain anyamount of foreign currency creditfacilities from commercial banks andmerchant banks in Malaysia, and fromany non-residents, provided OHQdoes not on-lend to, or raise the fundson behalf of, any resident. Such creditfacilities can be extended to theirrelated companies overseas orinvested abroad if their aggregatedomestic credit facilities in ringgit doesnot exceed RM10 million.
(d) Approved InternationalProcurement Centres
Approved International ProcurementCentres (IPCs) are allowed to retainany amount of export proceeds inforeign currency accounts maintainedwith resident commercial banks forthe approved IPC activities only. IPCsare also allowed to enter into forwardexchange contracts with residentcommercial banks to hedge exchangerisk based on projected volume oftrade.
XV. DOUBLE TAXATIONAGREEMENTS
Double taxation agreements provide for theavoidance of incidences of double taxation oninternational income, such as business profits,dividends, interests and royalties, derived in onecountry and remitted to another country. This
removes the “tax barrier” to international tradeand investment. The agreements also providefor the exchange of information on relevant incomeand this is useful to prevent evasion of taxeson income.
Under double taxation agreements, businessprofits are taxed only in the country in whichthe enterprise is situated. Where the enterprisecarries on business through a permanentestablishment situated in the other contractingcountry, tax is levied in the other country onprofits attributable to or derived by the permanentestablishment in the country where it is situated.
Under most double taxation agreements, profitsfrom shipping and air transport operations ininternational traffic are taxed only in the countrywhere the management and control of theenterprise are exercised.
In most double taxation agreements whichMalaysia have entered into, the contractingcountries have agreed to provide credit on incometax which have been exempted by Malaysia ona reciprocal basis. In case of dividends paid bycompanies exempted from tax under thePromotion of Investments Act 1986, the recipientsare also exempted from Malaysian income taxon such dividends. If the recipients are alsotaxed on that dividend income in the contractingcountries, then the contracting countries will givecredits as if Malaysian tax has been paid.
To date, 55 countries have double taxationagreements with Malaysia, namely:
Country Date of SigningAgreement
1. Sweden 21.11.1970
2. Denmark 04.12.1970
3. Norway 23.12.1970
4. United Kingdom 30.03.1973
United Kingdom (New Agreement) 10.12.1996
5. Belgium 24.10.1973
Belgium (Protocol) 21.11.1995
6. Switzerland 30.12.1974
241
7. France 24.04.1975
France (Protocol) 31.01.1991
8. Federal Republic of Germany) 08.04.1977
9. Poland 16.09.1977
10. Romania 26.11.1982
11. Italy 28.01.1984
12. Finland 28.03.1984
13. Russia 31.07.1987
14. Netherlands 07.03.1988
Netherlands (Protocol) 04.12.1996
15. Hungary 24.05.1989
16. Austria 20.09.1989
17. Albania 24.01.1994
18. Malta 03.10.1995
19. Czech Republic 08.03.1996
20. Ireland 28.11.1998
21. Singapore 26.12.1968
Singapore (Supplementary) 06.07.1973
22. Japan 30.01.1970
Japan (New Agreement) 19.02.1999
23. Sri Lanka 16.09.1972
Sri Lanka (New Agreement) 16.09.1997
24. India 25.10.1976
India (New Agreement) 14.05.2001
25. Thailand 29.03.1982
Thailand (Protocol) 10.02.1995
26. South Korea 20.04.1982
27. Philippines 27.04.1982
28. Pakistan 29.05.1982
29. Bangladesh 19.04.1983
30. China 23.11.1985
31. Indonesia 12.09.1991
32. Iran 11.11.1992
33. Sudan 07.10.1993
34. Turkey 27.09.1994
35. Jordan 01.10.1994
36. Mongolia 27.07.1995
37. Vietnam 07.09.1995
38. United Arab Emirates 28.11.1995
39. Kuwait 06.04.1997
40. Egypt 14.04.1997
41. Uzbekistan 06.10.1997
42. Republic of Kyrgyz 19.11.2000
43. Myanmar 09.03.1998
44. Bahrain 14.06.1999
45. New Zealand 19.03.1976
New Zealand (Protocol) 14.07.1994
46. Australia 20.08.1980
47. Papua New Guinea 20.05.1993
48. Fiji 19.12.1995
49. Canada 16.05.1976
50. Mauritius 23.08.1992
51. Zimbabwe 28.04.1994
52. Namibia 28.07.1997
LIMITED DTA AGREEMENT (In respect of income ofTransport Enterprises only)
53. Saudi Arabia 18.07.1993(air transport only)
54. U.S.A (shipping and 17.04.1989air transport)
55. Republic of Argentina 03.10.1997(shipping and air transport)
XVI. INVESTMENT GUARANTEEAGREEMENTS
The purpose of the Investment GuaranteeAgreements (IGAs) is to ensure against non-commercial risks such as expropriation andnationalisation and to allow for remittances andrepatriation of capital. For a developing countrysuch as Malaysia, it is hoped that the IGAs willhelp to quicken the pace of industrialisation byencouraging the inflows of foreign capital. It isgenerally considered that the IGAs, which preventarbitrary action by a recipient country, will generateconfidence in foreign investors.
Country Date of SigningAgreement
Country Date of SigningAgreement
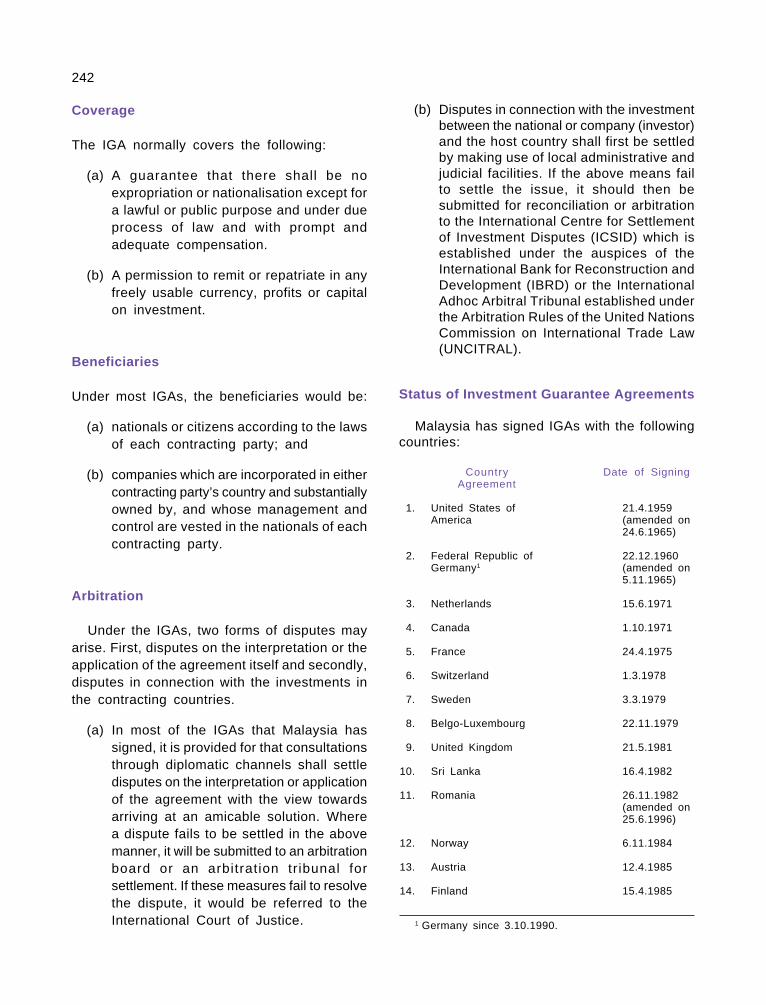
242
Coverage
The IGA normally covers the following:
(a) A guarantee that there shall be noexpropriation or nationalisation except fora lawful or public purpose and under dueprocess of law and with prompt andadequate compensation.
(b) A permission to remit or repatriate in anyfreely usable currency, profits or capitalon investment.
Beneficiaries
Under most IGAs, the beneficiaries would be:
(a) nationals or citizens according to the lawsof each contracting party; and
(b) companies which are incorporated in eithercontracting party’s country and substantiallyowned by, and whose management andcontrol are vested in the nationals of eachcontracting party.
Arbitration
Under the IGAs, two forms of disputes mayarise. First, disputes on the interpretation or theapplication of the agreement itself and secondly,disputes in connection with the investments inthe contracting countries.
(a) In most of the IGAs that Malaysia hassigned, it is provided for that consultationsthrough diplomatic channels shall settledisputes on the interpretation or applicationof the agreement with the view towardsarriving at an amicable solution. Wherea dispute fails to be settled in the abovemanner, it will be submitted to an arbitrationboard or an arbitration tr ibunal forsettlement. If these measures fail to resolvethe dispute, it would be referred to theInternational Court of Justice.
(b) Disputes in connection with the investmentbetween the national or company (investor)and the host country shall first be settledby making use of local administrative andjudicial facilities. If the above means failto settle the issue, it should then besubmitted for reconciliation or arbitrationto the International Centre for Settlementof Investment Disputes (ICSID) which isestablished under the auspices of theInternational Bank for Reconstruction andDevelopment (IBRD) or the InternationalAdhoc Arbitral Tribunal established underthe Arbitration Rules of the United NationsCommission on International Trade Law(UNCITRAL).
Status of Investment Guarantee Agreements
Malaysia has signed IGAs with the followingcountries:
Country Date of SigningAgreement
1. United States of 21.4.1959America (amended on
24.6.1965)
2. Federal Republic of 22.12.1960Germany1 (amended on
5.11.1965)
3. Netherlands 15.6.1971
4. Canada 1.10.1971
5. France 24.4.1975
6. Switzerland 1.3.1978
7. Sweden 3.3.1979
8. Belgo-Luxembourg 22.11.1979
9. United Kingdom 21.5.1981
10. Sri Lanka 16.4.1982
11. Romania 26.11.1982(amended on25.6.1996)
12. Norway 6.11.1984
13. Austria 12.4.1985
14. Finland 15.4.1985
1 Germany since 3.10.1990.
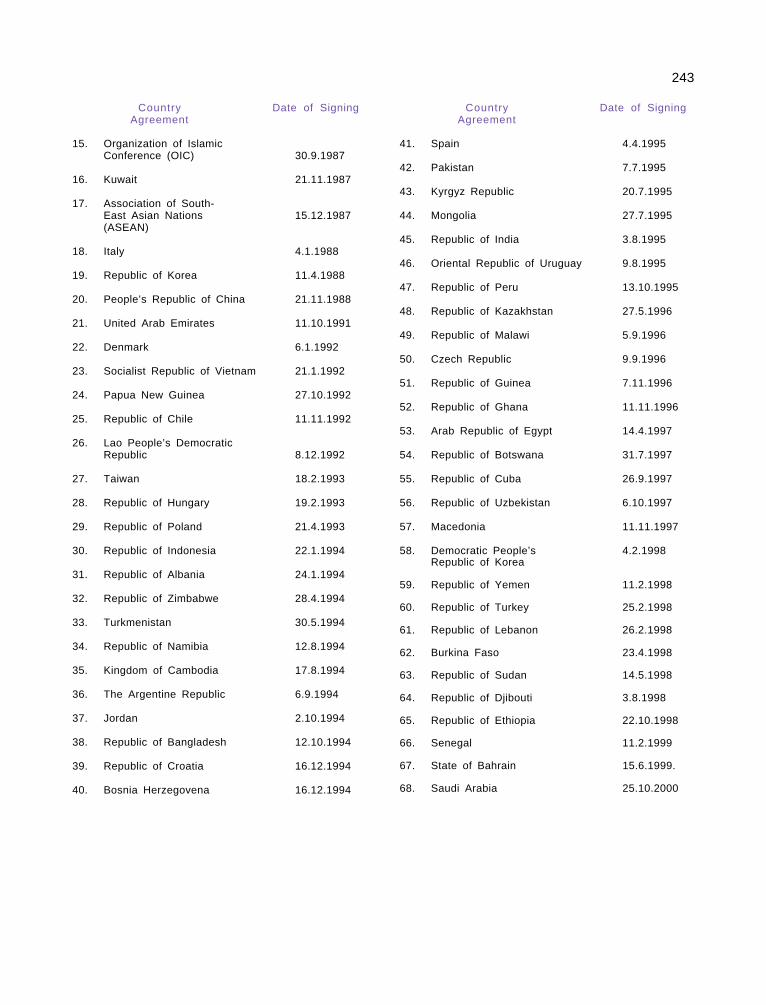
243
15. Organization of IslamicConference (OIC) 30.9.1987
16. Kuwait 21.11.1987
17. Association of South-East Asian Nations 15.12.1987(ASEAN)
18. Italy 4.1.1988
19. Republic of Korea 11.4.1988
20. People’s Republic of China 21.11.1988
21. United Arab Emirates 11.10.1991
22. Denmark 6.1.1992
23. Socialist Republic of Vietnam 21.1.1992
24. Papua New Guinea 27.10.1992
25. Republic of Chile 11.11.1992
26. Lao People’s DemocraticRepublic 8.12.1992
27. Taiwan 18.2.1993
28. Republic of Hungary 19.2.1993
29. Republic of Poland 21.4.1993
30. Republic of Indonesia 22.1.1994
31. Republic of Albania 24.1.1994
32. Republic of Zimbabwe 28.4.1994
33. Turkmenistan 30.5.1994
34. Republic of Namibia 12.8.1994
35. Kingdom of Cambodia 17.8.1994
36. The Argentine Republic 6.9.1994
37. Jordan 2.10.1994
38. Republic of Bangladesh 12.10.1994
39. Republic of Croatia 16.12.1994
40. Bosnia Herzegovena 16.12.1994
41. Spain 4.4.1995
42. Pakistan 7.7.1995
43. Kyrgyz Republic 20.7.1995
44. Mongolia 27.7.1995
45. Republic of India 3.8.1995
46. Oriental Republic of Uruguay 9.8.1995
47. Republic of Peru 13.10.1995
48. Republic of Kazakhstan 27.5.1996
49. Republic of Malawi 5.9.1996
50. Czech Republic 9.9.1996
51. Republic of Guinea 7.11.1996
52. Republic of Ghana 11.11.1996
53. Arab Republic of Egypt 14.4.1997
54. Republic of Botswana 31.7.1997
55. Republic of Cuba 26.9.1997
56. Republic of Uzbekistan 6.10.1997
57. Macedonia 11.11.1997
58. Democratic People’s 4.2.1998Republic of Korea
59. Republic of Yemen 11.2.1998
60. Republic of Turkey 25.2.1998
61. Republic of Lebanon 26.2.1998
62. Burkina Faso 23.4.1998
63. Republic of Sudan 14.5.1998
64. Republic of Djibouti 3.8.1998
65. Republic of Ethiopia 22.10.1998
66. Senegal 11.2.1999
67. State of Bahrain 15.6.1999.
68. Saudi Arabia 25.10.2000
Country Date of SigningAgreement
Country Date of SigningAgreement