Macomber International (Dean Macomber)
19
REVIEW OF FACILITIES AND MARKETING PROGRAMS AS PROPOSED BY APPLICANTS FOR THE KANSAS SOUTHEAST ZONE CASINO LICENSE Presented by: Dean M. Macomber Macomber International, Inc. June 10, 2015, v.2.0.
-
Upload
krgc -
Category
Government & Nonprofit
-
view
108 -
download
0
Transcript of Macomber International (Dean Macomber)

REVIEW OF FACILITIES AND
MARKETING PROGRAMS
AS PROPOSED BY APPLICANTS FOR THE KANSAS SOUTHEAST ZONE CASINO LICENSE
Presented by:
Dean M. Macomber
Macomber International,
Inc.
June 10, 2015, v.2.0.

CONFIDENTIALITY, LIMITED USE, AND
OTHER TERMS AND CONDITIONS
This presentation (“Presentation”) is for the exclusive use of the Kansas Lottery
Commission and other official Kansas agencies associated with the granting of the
Southeast Zone (defined) casino license. Any other use for other purposes or by other
individuals, enterprises, or other entities is strictly prohibited without the prior written
permission of Macomber International, Inc. (“MI”), the Report’s author.
This report is an abbreviated summary of the longer MI report entitled “Evaluation of
Project Concept, Programing, Design, and Marketing as Proposed by Applicants for
the Kansas Southeast Zone Casino License,” dated 6/8/15 v.3.0. (“Report”).
Any information, evaluation, and/or conclusions shown in this Presentation should not
be used, applied, or relied upon without reading and referring to the full Report.
This Presentation is subject to the same limited use, terms and conditions found in the
Report. MI accepts no liability for the information contained in the Report or this
Presentation.

SUMMARY OF THE SUMMARY In a market with greater than normal risk, all three proposed casino
projects have virtually the same potential to achieve and sustain success
with their Phase 1 proposal even though they come to this net position
with a different set of pluses and minuses.
The primary risk management strategy appears to have been to propose
a project that has the minimum critical mass to win the bid but also to
achieve Phase 1 success. The optimum potential of the market will not
be realized until Phase 2 and beyond.
The largest project positioned to be a regional casino provides the greatest
potential revenues and upside but is accompanied by less room for error. The
two smaller locals’ oriented casinos offer the opposite.
Thus, the first order decision is not so much about which of the
three casinos to award the license but rather which of the two
risk-reward profiles are preferred. Afterward, if the preference
is for a regional casino there is only one. If the preference is for
a locals’ casino there are two projects but they are about
equal. The choice between them should be heavily weighted
based upon the perceived abilities of the owner and and team
to monitor conditions and react appropriately more so than the
efficacy of the Phase 1 concept, design, and marketing plan.
Caveat: The differential of the gaming tax rate between KS
and OK is a pall that hangs over this opportunity because it
provides a mechanism for the OK casino owners to wage a
Marketing War.

The development environment
COMPETITION AND RISK
The marketplace (“Marketplace”) for the Kanas Southeast Zone (“SE Zone”) may be
defined as a 90 mile radius segmented by an inner market (30 mile ring), middle market
(60 mile ring) and outer market (90 mile ring).
The facilities and marketing programs submitted by the three applicants are remarkably
similar in terms of the macro-dynamics of the Kanas Southeast Zone that are:
1. A mature and medium to high competitive
environment.
2. Relative to the SE Zone, a lightly populated,
rural inner ring, a similar middle ring with the
exception of Springfield, MO, and an outer
ring with large, dense, urban populations of
the Greater Tulsa Kansas City Metro Areas.
3. A spread in the gaming tax rate between Kansas vs. Oklahoma casinos that ranges
from +10% to +27%. This spread may potentially be used by Oklahoma casinos
reactively and/or proactively to defend against adverse impact from a SE Casino.
4. Other development risks.
The result is a greater than normal development risk.
0.0%
10.0%
20.0%
30.0%
40.0%
50.0%
60.0%
70.0%
0 100 200 300 400 500 600
% W
ho V
isit A
tlant
ic Cit
y
Miles from Atlantic City
Visitation Curve

The development environment … pragmatically leads to a
LIMITED DEVELOPMENT STRATEGY
Either …
1. A locals’-oriented casino
designed to primarily attract
inner ring players and whatever
additional demand from the
middle and outer rings as
justified (“Locals’ Casino”).
Or …
2. A destination locals’ / regional
casino-resort that will appeal to
less price / value sensitive local
players but more so to middle
and outer ring regional players
(“Locals’ / Regional Casino”).
1. Locals’ Casino
a. Smaller … to right-size to potential.
b. Less expensive … middle market needs.
c. Crawford County … further away from
northeast OK competition.
1. Local’s / Regional Casino
a. Larger to …
Satisfy demand for greater variety
To accommodate greater volume needed to make it “work.”
To compete (others are big to huge).
b. More expensive …
To satisfy demand for higher quality.
To pay for higher capacity
c. Located in Cherokee County … to get
closer to I-44, primary access road.

Applicant Expectations
DEMAND PHYSICAL DEMAND – number of visitors
FINANCIAL DEMAND – gross gaming revenue (“GGR”)
CAMPTOWN KANSAS CROSSING CASTLE ROCK
Locals' Locals' Locals'/Regional
1.0. PHYSICAL DEMAND
1.1. PLAYER VISITOR-DAYS
Kansas 209,000 257,000 297,000
Ex-Kanas 740,000 273,000 892,000
Total Player Visitor-Days 949,000 530,000 1,189,000
Per Average Day 2,600 1,452 3,258
1.2. NON-GAMING VISITOR-DAYS 64,000 21,000 63,000
1.3. TOTAL VISITOR DAYS 1,013,000 551,000 1,252,000
Per Average Day 2,775 1,510 3,430
3.0. FINANCIAL DEMAND
3.1. GROSS GAMING REVENUE ("GGR") 10,632,000$ 22,873,000$ 22,252,000$
Kansas
Ex-Kanas 37,000,000 24,359,000 66,755,000
MI Adjustment to match pro forma 2,670,000
Total Gross Gaming Revenue 47,632,000$ 47,232,000$ 91,677,000$
GGR/Gaming Visitor-Day $50 $89 $77
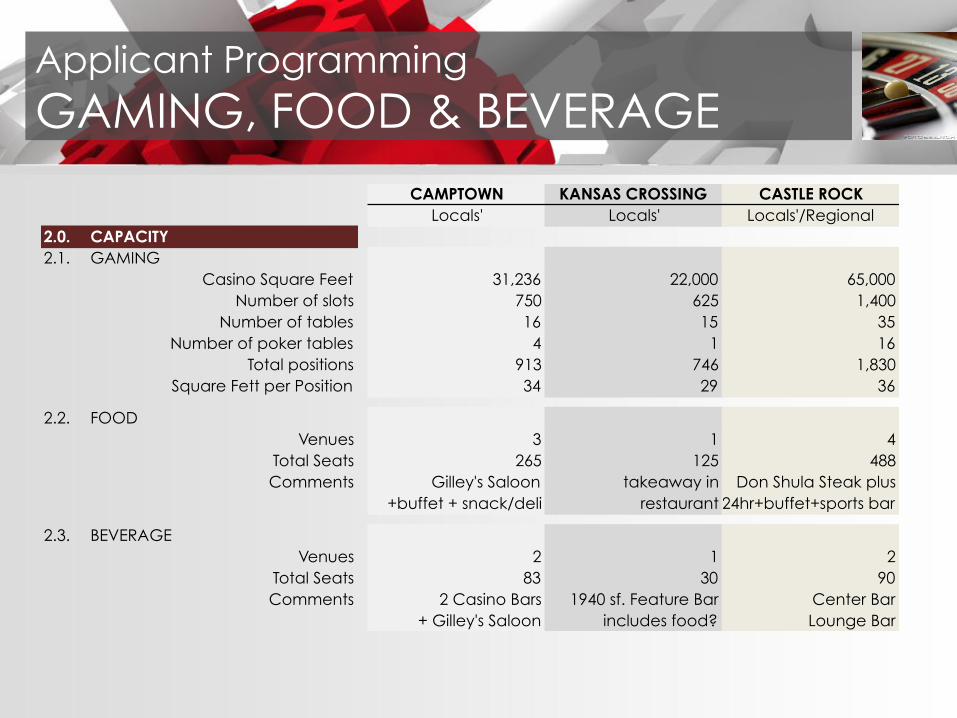
Applicant Programming
GAMING, FOOD & BEVERAGE
CAMPTOWN KANSAS CROSSING CASTLE ROCK
Locals' Locals' Locals'/Regional
2.0. CAPACITY
2.1. GAMING
Casino Square Feet 31,236 22,000 65,000
Number of slots 750 625 1,400
Number of tables 16 15 35
Number of poker tables 4 1 16
Total positions 913 746 1,830
Square Fett per Position 34 29 36
2.2. FOOD
Venues 3 1 4
Total Seats 265 125 488
Comments Gilley's Saloon takeaway in Don Shula Steak plus
+buffet + snack/deli restaurant 24hr+buffet+sports bar
2.3. BEVERAGE
Venues 2 1 2
Total Seats 83 30 90
Comments 2 Casino Bars 1940 sf. Feature Bar Center Bar
+ Gilley's Saloon includes food? Lounge Bar
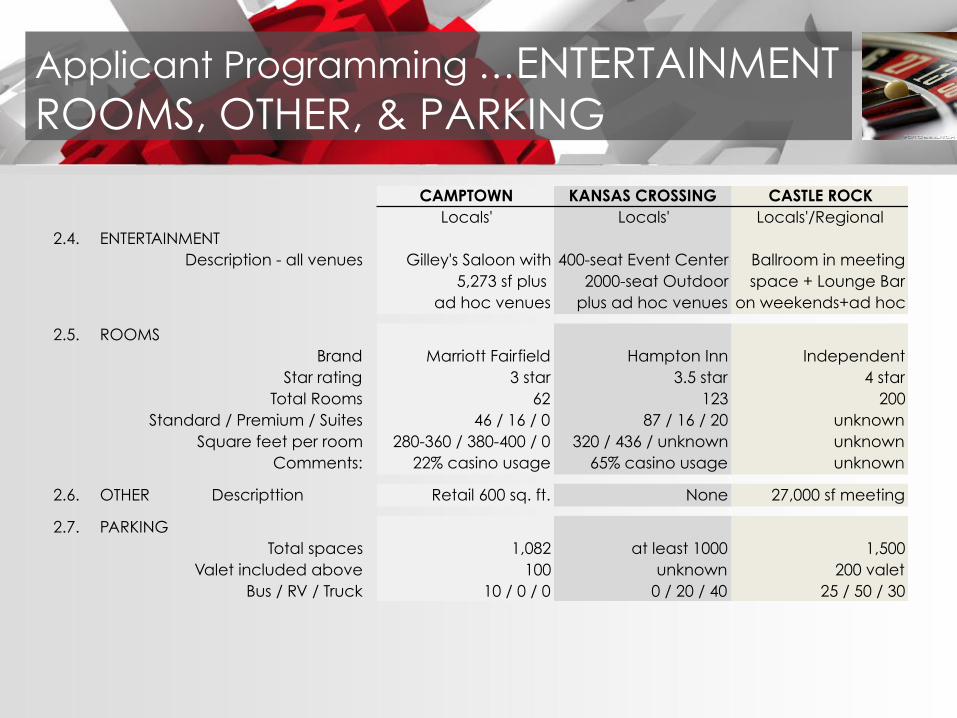
Applicant Programming …ENTERTAINMENT
ROOMS, OTHER, & PARKING
CAMPTOWN KANSAS CROSSING CASTLE ROCK
Locals' Locals' Locals'/Regional
2.4. ENTERTAINMENT
Description - all venues Gilley's Saloon with 400-seat Event Center Ballroom in meeting
5,273 sf plus 2000-seat Outdoor space + Lounge Bar
ad hoc venues plus ad hoc venues on weekends+ad hoc
2.5. ROOMS
Brand Marriott Fairfield Hampton Inn Independent
Star rating 3 star 3.5 star 4 star
Total Rooms 62 123 200
Standard / Premium / Suites 46 / 16 / 0 87 / 16 / 20 unknown
Square feet per room 280-360 / 380-400 / 0 320 / 436 / unknown unknown
Comments: 22% casino usage 65% casino usage unknown
2.6. OTHER Descripttion Retail 600 sq. ft. None 27,000 sf meeting
2.7. PARKING
Total spaces 1,082 at least 1000 1,500
Valet included above 100 unknown 200 valet
Bus / RV / Truck 10 / 0 / 0 0 / 20 / 40 25 / 50 / 30

Applicant Proposal
DESIGN -- EXTERIOR
CAMPTOWN
Locals’ casino
KANSAS CROSSING
Locals’ casino
CASTLE ROCK
Locals’ / regional casino
CAMPTOWN Kansas / Mid-west Western.
3-star hotel maybe sets 3-star standard for property.
If so, good alignment with middle-Middle Market.
KANSAS CROSSING A little more Kansas / Mid-west modern (?).
3.5 star hotel maybe sets 3.5 standard for property.
If so, slightly better chance to market to upper-Middle.
CASTLE ROCK Contemporary, modern outside. Juxtapose to rural area nearby.
4 star hotel maybe sets 4-star standard for property.
If so, good because broader appeal one down, one up.
X
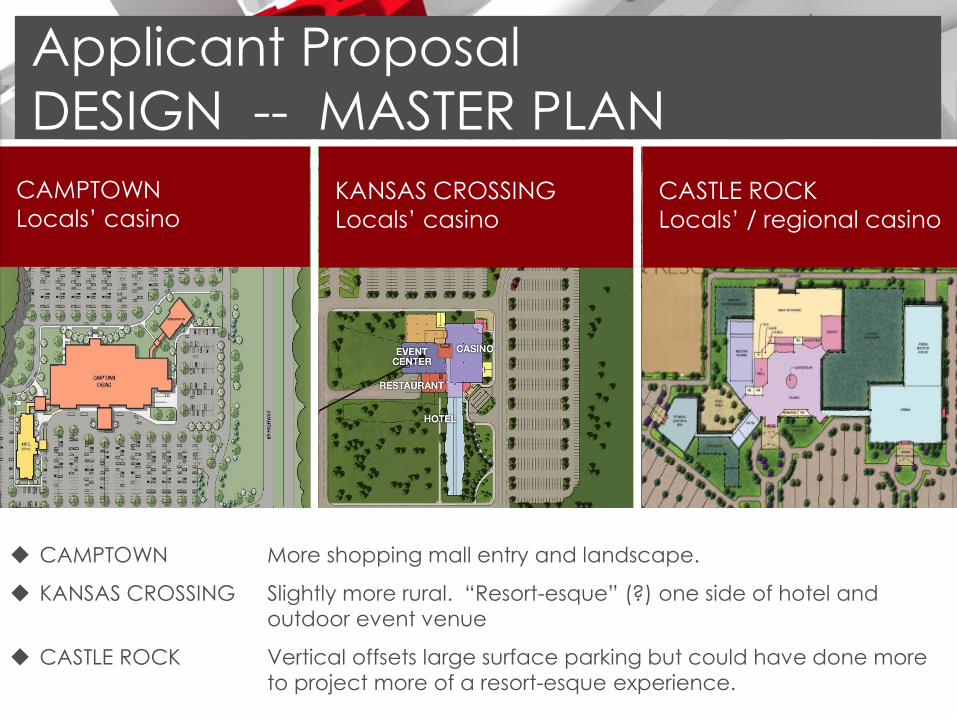
Applicant Proposal
DESIGN -- MASTER PLAN
CAMPTOWN
Locals’ casino
KANSAS CROSSING
Locals’ casino
CASTLE ROCK
Locals’ / regional casino
CAMPTOWN More shopping mall entry and landscape.
KANSAS CROSSING Slightly more rural. “Resort-esque” (?) one side of hotel and
outdoor event venue
CASTLE ROCK Vertical offsets large surface parking but could have done more
to project more of a resort-esque experience.
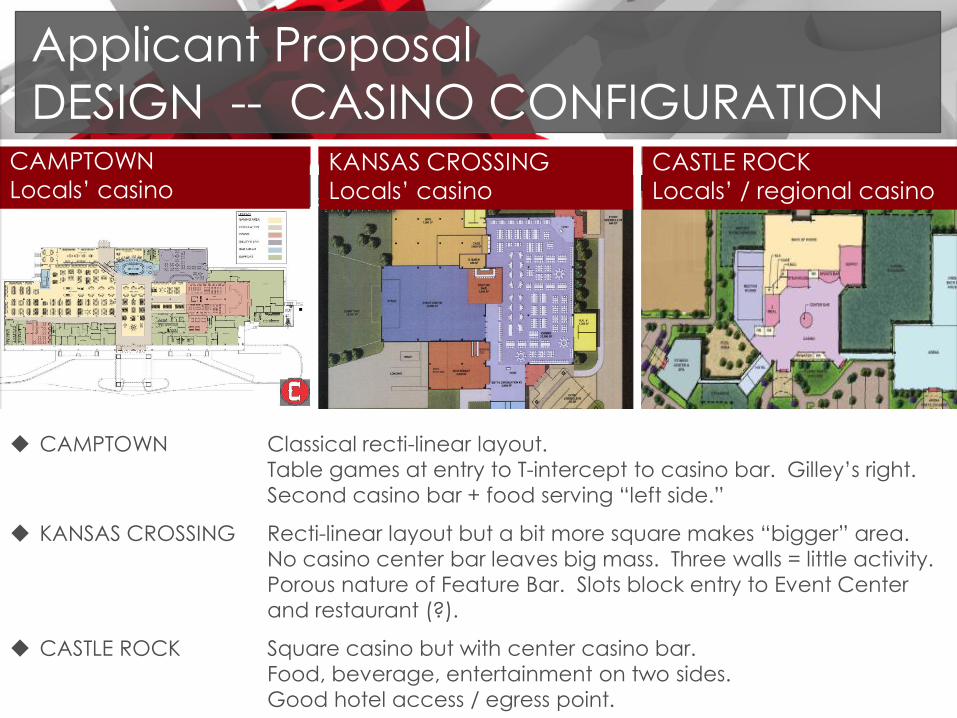
Applicant Proposal
DESIGN -- CASINO CONFIGURATION
CAMPTOWN
Locals’ casino KANSAS CROSSING
Locals’ casino
CASTLE ROCK
Locals’ / regional casino
CAMPTOWN Classical recti-linear layout.
Table games at entry to T-intercept to casino bar. Gilley’s right.
Second casino bar + food serving “left side.”
KANSAS CROSSING Recti-linear layout but a bit more square makes “bigger” area.
No casino center bar leaves big mass. Three walls = little activity.
Porous nature of Feature Bar. Slots block entry to Event Center
and restaurant (?).
CASTLE ROCK Square casino but with center casino bar.
Food, beverage, entertainment on two sides.
Good hotel access / egress point.

Applicant Proposal
DESIGN -- CASINO
CAMPTOWN
Locals’ casino CASTLE ROCK
Locals’ / regional casino
KANSAS CROSSING
Locals’ casino
CAMPTOWN Less Western inside (but Gilley’s will amplify … see next).
But, organic, rug, fabrics soften. Makes more informal.
KANSAS CROSSING A bit of step up but still around organic themes.
Broad appeal. 3.5 stars?
CASTLE ROCK Crystal. Chandeliers. More contemporary. Formal.
4-stars? Off-putting or attractive to mid-Middle market?
.

Applicant Proposal
DESIGN -- NON-GAMING
CASTLE ROCK
Locals’ / regional casino
KANSAS CROSSING
Locals’ casino
CAMPTOWN
Locals’ casino
CAMPTOWN Gilley’s. Gilley’s. Gilley’s.
Very western but meant to be a fun, party atmosphere.
Unclear how much western theme will permeate rest of property.
KANSAS CROSSING Western ceiling. Contemporary floor. 3.5 stars?
Shows porosity of entry to Feature Bar. Will it work.
CASTLE ROCK Hotel lobby “shouts” four-star. Chic. Modern. “Special.”
Looks a step more formal than Downstream.
But, too much for northeast Oklahoma or aspirational?
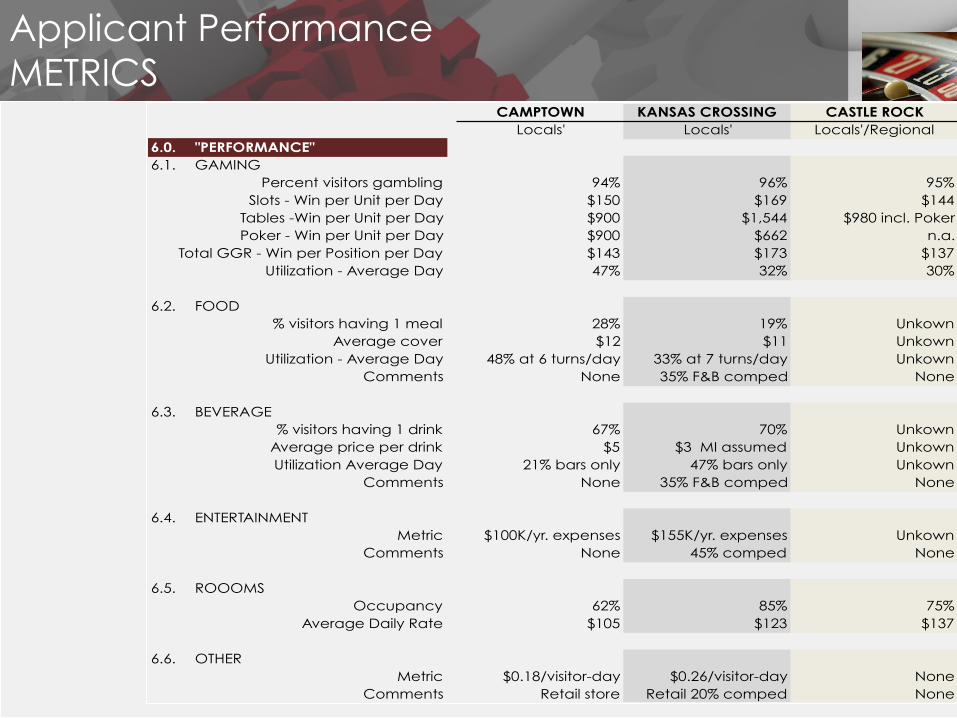
Applicant Performance
METRICS CAMPTOWN KANSAS CROSSING CASTLE ROCK
Locals' Locals' Locals'/Regional
6.0. "PERFORMANCE"
6.1. GAMING
Percent visitors gambling 94% 96% 95%
Slots - Win per Unit per Day $150 $169 $144
Tables -Win per Unit per Day $900 $1,544 $980 incl. Poker
Poker - Win per Unit per Day $900 $662 n.a.
Total GGR - Win per Position per Day $143 $173 $137
Utilization - Average Day 47% 32% 30%
6.2. FOOD
% visitors having 1 meal 28% 19% Unkown
Average cover $12 $11 Unkown
Utilization - Average Day 48% at 6 turns/day 33% at 7 turns/day Unkown
Comments None 35% F&B comped None
6.3. BEVERAGE
% visitors having 1 drink 67% 70% Unkown
Average price per drink $5 $3 MI assumed Unkown
Utilization Average Day 21% bars only 47% bars only Unkown
Comments None 35% F&B comped None
6.4. ENTERTAINMENT
Metric $100K/yr. expenses $155K/yr. expenses Unkown
Comments None 45% comped None
6.5. ROOOMS
Occupancy 62% 85% 75%
Average Daily Rate $105 $123 $137
6.6. OTHER
Metric $0.18/visitor-day $0.26/visitor-day None
Comments Retail store Retail 20% comped None

Applicant Marketing Effort
MARKETING EFFORT
“PART A” – COMPS, CASH BACK, POINT REDEMPTION, ADVERTISING AND +++
“PART B” – NON-GAMING AS LOSS LEADERS, MARKETING TOOLS
CAMPTOWN KANSAS CROSSING CASTLE ROCK
Locals' Locals' Locals'/Regional
5.0. MARKETING
5.1. PROMOTIONAL ALLOWANCES 4,600,000$ 4,529,000$ 2,670,000$
Percent of GGR 10% 10% 3%
Comments Estimated by MI
5.2. G&A MARKETING 5,100,000$ 3,472,000$ 4,957,000$
Percent of GGR 11% 7% 5%
5.3. TOTAL PRO FORMA MARKETING 9,700,000$ 8,001,000$ 7,627,000$
Percent of GGR 20% 17% 8%
Departmental Profit CAMPTOWN KANSAS CROSS. CASTLE ROCK
FOOD
+58%
-81% Unknown
BEVERAGE -2% Unknown
ENTERTAINMENT -$100K expense +3% Unknown
HOTEL +35% Unknown – 3rd party Unknown
EBITDA MARGIN 26% 20% 26%

Applicant Performance
REVENUE, MARKETING, AND PROFIT (EBITDA)
CAMPTOWN KANSAS CROSSING CASTLE ROCK
Locals' Locals' Locals'/Regional
3.0. FINANCIAL DEMAND
3.1. GROSS GAMING REVENUE ("GGR") 10,632,000$ 22,873,000$ 22,252,000$
Kansas
Ex-Kanas 37,000,000 24,359,000 66,755,000
MI Adjustment to match pro forma 2,670,000
Total Gross Gaming Revenue 47,632,000$ 47,232,000$ 91,677,000$
GGR/Gaming Visitor-Day $50 $89 $77
3.2. NON-GAMING REVENUE 8,585,000$ 2,840,000$ 21,046,000$
Non-Gaming Revenue/Visitor-Day $8 $5 $17
% NG Rev. of Total Revenue 15% 6% 19%
3.3. TOTAL GROSS REVENUE 56,217,000$ 50,072,000$ 112,724,000$
Total Revenue/Visitor-Day $55 $91 $90
3.4. PROMOTIONAL ALLOWANCES -4,600,000 -4,529,000 -2,670,000
% of GGR -9.7% -9.6% -2.9% est'ed by MI
3.5. NET REVENUE 51,617,000$ 45,543,000$ 110,054,000$
4.0. MARKETING
4.1. PROMOTIONAL ALLOWANCES 4,600,000$ 4,529,000$ 2,670,000$
Percent of GGR 10% 10% 3%
Comments Estimated by MI
4.2. G&A MARKETING 5,100,000$ 3,472,000$ 4,957,000$
Percent of GGR 11% 7% 5%
4.3. TOTAL PRO FORMA MARKETING 9,700,000$ 8,001,000$ 7,627,000$
Percent of GGR 20% 17% 8%
5.0. PROFIT
5.1. EBITDA $14,846,000 $9,895,000 $29,137,000
Margin - % Total Revenue 26% 20% 26%
Comments After Rent + Manage-
ment Fee. Otherwise
MI expects upper-20%.

Applicant Performance
SQUARE FEET, INVESTMENT, FUNDING, ROI CAMPTOWN KANSAS CROSSING CASTLE ROCK
Locals' Locals' Locals'/Regional
7.0. SQUARE FEET
7.1. CASINO, FOOD, BEVERAGE, OTHER 47,000 57,000 298,000
7.2. HOTEL 42,000 80,000 125,000
7.3. TOTAL SQUARE FEET 89,000 137,000 423,000
If equalized to 150 rooms 149,000 155,000 392,000
8.0. INVESTMENT
8.1. HARD COST 69,607,000$ 52,721,000$ 120,210,000$
Hard Cost per Square Foot $778 $385 $284
If land and no. rooms equalized $531 $525 $281
8.2. SOFT COST 8,299,000 12,018,000 13,788,000
8.3. LICENSE FEE AND RELATED 6,125,000 5,500,000 5,500,000
8.4. TOTAL INVESTMENT 84,032,309$ 70,239,910$ 139,498,565$
If land and no. rooms equalized $94,000,000 $99,000,000 $130,000,000
Total Investment per Square Foot $940 $514 $330
If land and no. rooms equalized $627 $638 $331
EBITDA Return on Investment 18% 14% 21%
MI adjusted for rent and Project high teen ROI
management fee
9.0. FUNDING
9.1. EQUITY Unknown 25,909,000$ 44,498,000$
9.2. DEBT Unknown 44,330,000 95,000,000
9.3. TOTAL 84,032,309$ 70,239,000$ 139,498,000$
Debt to Total Investment unknown 63% 68%

SUMMARY OF THE SUMMARY In a market with greater than normal risk, all three proposed casino
projects have virtually the same potential to achieve and sustain success
with their Phase 1 proposal even though they come to this net position
with a different set of pluses and minuses.
The primary risk management strategy appears to have been to propose
a project that has the minimum critical mass to win the bid but also to
achieve that success. The optimum potential of the market will not be
realized until Phase 2 and beyond.
The largest project positioned to be a regional casino provides the greatest
potential revenues and upside but is accompanied by less room for error. The
two smaller locals’ oriented casinos offer the opposite.
Thus, the first order decision is not so much about which of the
three casinos to award the license but rather which of the two
risk-reward profiles are preferred. Afterward, if the preference
is for a regional casino there is only one. If the preference is for
a locals’ casino there are two projects but they are about
equal. The choice between them should be heavily weighted
based upon the perceived abilities of the owner and
management team more so than the efficacy of the concept,
design, and marketing plan.
Caveat: The differential of the gaming tax rate between KS
and OK is a pall that hangs over this opportunity because it
provides a mechanism for the OK casino owners to wage a
Marketing War.

Thank you.
Dean M. Macomber Dean M. Macomber, President
Macomber International, Inc.
Mobile: +1.702.682.2229
Office: +1.702.456.6066
Skype: macomberinternational
Email: [email protected]