Macitentan does not interfere with hepatic bile salt...
55
JPET #214106 1 TITLE PAGE Macitentan does not interfere with hepatic bile salt transport Alexander Treiber, Päivi Aeänismaa, Ruben de Kanter, Stephane Delahaye, Marianne Treher, Patrick Hess, Patricia Sidharta Departments of Preclinical Drug Metabolism and Pharmacokinetics (A.T., P.A., R.K. S.D.), Toxicology (M.T.), Pharmacology (P.H.) and Clinical Pharmacology (P.S.), Actelion Pharmaceuticals Ltd, Allschwil, Switzerland JPET Fast Forward. Published on April 25, 2014 as DOI:10.1124/jpet.114.214106 Copyright 2014 by the American Society for Pharmacology and Experimental Therapeutics. This article has not been copyedited and formatted. The final version may differ from this version. JPET Fast Forward. Published on April 25, 2014 as DOI: 10.1124/jpet.114.214106 at ASPET Journals on April 12, 2020 jpet.aspetjournals.org Downloaded from
Transcript of Macitentan does not interfere with hepatic bile salt...
JPET #214106
1
TITLE PAGE
Macitentan does not interfere with hepatic bile salt transport Alexander Treiber, Päivi Aeänismaa, Ruben de Kanter, Stephane Delahaye, Marianne Treher,
Patrick Hess, Patricia Sidharta
Departments of Preclinical Drug Metabolism and Pharmacokinetics (A.T., P.A., R.K. S.D.),
Toxicology (M.T.), Pharmacology (P.H.) and Clinical Pharmacology (P.S.), Actelion
Pharmaceuticals Ltd, Allschwil, Switzerland
JPET Fast Forward. Published on April 25, 2014 as DOI:10.1124/jpet.114.214106
Copyright 2014 by the American Society for Pharmacology and Experimental Therapeutics.
This article has not been copyedited and formatted. The final version may differ from this version.JPET Fast Forward. Published on April 25, 2014 as DOI: 10.1124/jpet.114.214106
at ASPE
T Journals on A
pril 12, 2020jpet.aspetjournals.org
Dow
nloaded from
JPET #214106
2
RUNNING TITLE PAGE
Running title: macitentan and hepatic bile salt transport
Corresponding author: Alexander Treiber Actelion Pharmaceuticals Ltd
Gewerbestrasse 16 4123 Allschwil Switzerland +41 61 565 65 92 (phone) +41 61 565 89 03 (fax) [email protected] Text pages: 50
Number of tables: 8
Number of figures: 5
Number of references: 51
Abstract: 187 words
Introduction: 595 words
Discussion: 1959 words
Section assignment: Toxicology
ABBREVIATIONS
ALT: alanine aminotransferase, ATP: adenosine triphosphate, AUC: area under the plasma
concentration vs. time curve, bid: bis in die (twice a day), BLQ: below limit of quantification,
BSEP: bile salt export pump, CHO: Chinese hamster ovary, CLint : intrinsic clearance, CLpo:
oral clearance, Cmax: (observed) peak plasma concentration, DMEM: Dulbecco's Modified
Eagle's Medium, DMSO: dimethyl sulfoxide, EDTA: ethylenediaminetetraacetic acid, ET-1:
endothelin-1, FCS: fetal calf serum, HBSS: Hank's balanced salt solution, HEPES: N-(2-
hydroxyethyl)-1-piperazineethanesulfonic acid, HIV: human immunodeficiency virus, IC50:
concentration of an inhibitor that reduces the measured response by 50%, ID: internal
diameter, Ki: inhibition constant, NAD: nicotinamide adenine dinucleotide, NADH:
nicotinamide adenine dinucleotide, reduced form, NTCP: sodium taurocholate co-
transporting polypeptide, OATP: organic anion-transporting polypeptide, PBPK: physiology-
based pharmacokinetic (modeling), PK: pharmacokinetic(s), SD: standard deviation, Sf9:
Spodoptera frugiperda cell line, Tmax: time to reach maximum observed plasma
concentration, Tris: tris(hydroxymethyl)aminomethane.
This article has not been copyedited and formatted. The final version may differ from this version.JPET Fast Forward. Published on April 25, 2014 as DOI: 10.1124/jpet.114.214106
at ASPE
T Journals on A
pril 12, 2020jpet.aspetjournals.org
Dow
nloaded from
JPET #214106
3
ABSTRACT
Treatment of pulmonary arterial hypertension with the endothelin receptor antagonist
bosentan has been associated with transient increases in liver transaminases. Mechanistically,
bosentan inhibits the bile salt pump BSEP leading to an intrahepatic accumulation of
cytotoxic bile salts eventually resulting in hepatocellular damage. BSEP inhibition by
bosentan is amplified by its accumulation in liver as bosentan is a substrate of OATP
transport proteins. The novel endothelin receptor antagonist macitentan shows a superior liver
safety profile. Introduction of the less acidic sulfamide moiety and increased lipophilicity
yield a hepatic disposition profile different from other endothelin receptor antagonists.
Passive diffusion rather than OATP-mediated uptake is the driving force for macitentan
uptake into the liver. Interaction with the NTCP and BSEP transport proteins involved in
hepatic bile salt homeostasis is therefore limited due to the low intrahepatic drug
concentrations. Evidence for this conclusion is provided by in vitro experiments in drug
transporter-expressing cells lines, acute and long-term studies in rat and dogs, absence of
plasma bile salt changes in healthy human volunteers after multiple dosing, and finally the
liver safety profile of macitentan in the completed phase III morbidity/mortality SERAPHIN
trial.
This article has not been copyedited and formatted. The final version may differ from this version.JPET Fast Forward. Published on April 25, 2014 as DOI: 10.1124/jpet.114.214106
at ASPE
T Journals on A
pril 12, 2020jpet.aspetjournals.org
Dow
nloaded from
JPET #214106
4
INTRODUCTION
About a decade ago, endothelin receptor antagonists were introduced as a therapeutic concept
for the treatment of pulmonary arterial hypertension, a debilitating and finally fatal disease
for which no oral treatment option was available before. The dual endothelin receptor
antagonist bosentan (Tracleer®) was approved in 2001 as the first member of this new class,
followed by sitaxentan (Thelin®) in 2006 and ambrisentan (Letairis®/Volibris®) in 2007.
Macitentan (Opsumit®, N-[5-(4-bromophenyl)-6-[2-[(5-bromo-2-pyrimidinyl)oxy]ethoxy]-4-
pyrimidinyl-N'-propylsulfamide) has been developed as a new generation endothelin receptor
antagonist with sustained receptor binding and improved receptor potency, pharmacokinetic
and liver safety profile (Iglarz et al., 2008; Raja, 2010). Most of these improvements result
from a modified tissue distribution as macitentan can freely diffuse into tissues rather than
being dependent on active transport.
Bosentan was approved at doses of 62.5 mg and 125 mg bid, but was initially studied at
higher doses for the treatment of hypertension (Krum et al., 1998) and chronic heart failure
(Sütsch et al., 1998). Chronic heart failure patients treated with bosentan 500 mg bid had an
18% incidence of elevated ALT levels vs. 4% on placebo. In a subset of patients
concomitantly treated with the antidiabetic glyburide, 29% had elevated ALT vs. 4% and 0%
on either placebo alone or placebo and glyburide. Changes in liver transaminases were
accompanied by dose-dependent increases in plasma bile salts and alkaline phosphatase.
Inhibition of the bile salt export pump BSEP by bosentan and its metabolites has been
identified as the likely mechanism underlying the observed changes in plasma transaminases
(Fattinger et al., 2001). BSEP is an ATP-dependent transport protein located at the
hepatocanalicular membrane and mediates the rate-limiting step in bile salt secretion from
This article has not been copyedited and formatted. The final version may differ from this version.JPET Fast Forward. Published on April 25, 2014 as DOI: 10.1124/jpet.114.214106
at ASPE
T Journals on A
pril 12, 2020jpet.aspetjournals.org
Dow
nloaded from
JPET #214106
5
blood into bile (Gerloff et al., 1998; Stieger et al., 2000). Bosentan and its metabolites
inhibited taurocholate transport in vitro in canalicular rat liver membrane vesicles and in Sf9
cell vesicles overexpressing rat bsep. In rats, plasma bile salts increased in a dose-dependent
manner after intravenous dosing of bosentan (Stieger et al., 2000; Kis et al., 2009). These
initial findings in rats were later confirmed with human BSEP (Mano et al., 2007) and led to
the hypothesis that bosentan treatment initially triggers a disruption of bile salt homeostasis
through dose-dependent blockade of BSEP-mediated bile salt excretion into bile, eventually
resulting in their accumulation in liver cells. As bile salts are cytotoxic at high concentrations,
the observed liver transaminase elevations in man are believed to result from the secondary
bile salt toxicity in hepatocytes.
The hepatic disposition of bosentan is mediated by OATP transport (Treiber et al., 2007)
followed by extensive metabolism through CYP3A4 and CYP2C9 and finally excretion of
the metabolites into bile (Weber et al., 1999). As a consequence, bosentan pharmacokinetics
are sensitive to concomitant CYP3A4 and/or OATP inhibitors. While the potent CYP3A4
inhibitor ketoconazole increased bosentan in plasma by only about 2-fold (van Giersbergen et
al., 2002), more pronounced elevations were observed with the OATP inhibitor rifampicin
(van Giersbergen et al., 2007), the HIV protease inhibitor ritonavir/lopinavir (Kaletra®)
(Dingemanse et al., 2010) and cyclosporin A (Binet et al., 2000), the latter two being
combined CYP3A4/OATP inhibitors.
Conceptually, there are several options to design drugs with an improved side effect profile.
On one hand, improving receptor affinity and pharmacokinetic properties might yield drugs
that are effective at lower doses. The alternative approach is to avoid interactions with targets
critically involved in toxicity. Both approaches were combined in the discovery of
This article has not been copyedited and formatted. The final version may differ from this version.JPET Fast Forward. Published on April 25, 2014 as DOI: 10.1124/jpet.114.214106
at ASPE
T Journals on A
pril 12, 2020jpet.aspetjournals.org
Dow
nloaded from
JPET #214106
6
macitentan. The present report summarizes the experimental evidence demonstrating that
macitentan does not interact with hepatic transport proteins critically involved in bile salt
trafficking and drug accumulation in the liver.
This article has not been copyedited and formatted. The final version may differ from this version.JPET Fast Forward. Published on April 25, 2014 as DOI: 10.1124/jpet.114.214106
at ASPE
T Journals on A
pril 12, 2020jpet.aspetjournals.org
Dow
nloaded from
JPET #214106
7
MATERIALS AND METHODS
Chemicals and Reagents
Macitentan (N-[5-(4-bromophenyl)-6-[2-[(5-bromo-2-pyrimidinyl)oxy]-ethoxy]-4-pyrimidin-
yl]-N′-propylsulfamide) was obtained from Lonza AG (Visp, Switzerland) with a purity of
99.8%. 14C-Radiolabled macitentan with a specific activity of 55 mCi/mmol was purchased
from GE Healthcare (Little Chalfont, United Kingdom). Metabolite ACT-132577 was either
obtained from the chemistry department of Actelion Pharmaceuticals Ltd or from
SynphaBase (Pratteln, Switzerland), with purity in excess of 97%. 14C-ACT-132577 with a
specific activity of 56 mCi/mmol was obtained from Quotient Bioresearch (Rushden,
Northamptonshire, United Kingdom). Both radiolabeled compounds were supplied as
acetonitrile solutions with radiochemical purities in excess of 97%. Bosentan was obtained
from the chemistry department of Actelion Pharmaceuticals Ltd. Sodium taurocholate was
from Sigma (Buchs, Switzerland) whereas 3H-taurocholic acid with specific activity of
4.6-5.0 Ci/mmol was purchased from Perkin Elmer (Boston, Massachusetts, USA) as a
solution in methanol:ethanol (1:3) at a concentration of 1 mCi/ml. Estrone-3-sulfate and
atorvastatin calcium trihydrate were from Sigma-Aldrich (Buchs, Switzerland). 3H-estrone-3-
sulfate and 3H-atorvastatin calcium with specific activities of 50 Ci/mmol and 10 Ci/mmol,
respectively, were purchased from American Radiolabeled Chemicals (St. Louis, Missouri,
USA) as solutions in ethanol or ethanol:water (1:1). Cyclosporin A was purchased from
Fluka and rifampicin from Sigma-Aldrich. Liquid scintillation cocktails Filter-Count and
IRGA Safe Plus were purchased from Perkin Elmer (Zürich, Switzerland). Baculovirus-
infected Sf9 cell membrane vesicles overexpressing human BSEP were obtained from
SOLVO Biotechnology (Budapest, Hungary). All media and supplements for CHO and CHO
Flp InTM cells were obtained from Invitrogen AG (Basel, Switzerland).
This article has not been copyedited and formatted. The final version may differ from this version.JPET Fast Forward. Published on April 25, 2014 as DOI: 10.1124/jpet.114.214106
at ASPE
T Journals on A
pril 12, 2020jpet.aspetjournals.org
Dow
nloaded from
JPET #214106
8
Transport experiments
Preparation of stock solutions
For BSEP and NTCP inhibition experiments, macitentan and ACT-132577 stock solutions
were initially prepared in DMSO in concentration ranges of 1 μM-100 mM (BSEP) and
1 μM-100 mM (NTCP), and then diluted with the buffer used in the transport experiments
(see below). For cellular transport experiments, macitentan and ACT-132577 DMSO stock
solutions were prepared in a range from 0.1 µM to 100 mM and again diluted with transport
buffer. Stock solutions of cyclosporin A and rifampicin were prepared in DMSO in a
concentration range from 1-50 mM. DMSO was also used to prepare the 10 mM and 100 mM
stock solutions of atorvastatin, taurocholic acid and estrone-3-sulfate.
Cell culture
CHO Flp InTM cells overexpressing human NTCP were cultured at passage numbers 5 to 19
on tissue culture dishes of 55 cm2 growth area (Sarstedt, USA) at 37 °C in a humidified
atmosphere containing 5% carbon dioxide. Cells were maintained in Ham's F-12 medium
supplemented with 10% fetal calf serum, penicillin/streptomycin (100 IU/ml), L-glutamine
(1 mM) and hygromycin B (500 μg/ml). For transport experiments, cells from a maximally
90% confluent 58 cm2 tissue culture dish were detached with trypsin-EDTA, uniformly
resuspended in Ham's F-12 medium and seeded on tissue culture dishes (Corning, USA). The
cells were used for transport experiments 72 h to 96 h later, when they were 80-90%
confluent. 24 h before starting the transport experiments, cells were additionally induced by
adding 5 mM sodium butyrate (Sigma-Aldrich, Buchs, Switzerland) to the medium.
CHO cells overexpressing human OATP1B1, OATP1B3 and OATP2B1 and wild-type
CHO cells were cultured at passage numbers 9 to 60 on tissue culture dishes (Corning, USA)
at 37 °C in a humidified atmosphere containing 5% carbon dioxide. All cell lines were
This article has not been copyedited and formatted. The final version may differ from this version.JPET Fast Forward. Published on April 25, 2014 as DOI: 10.1124/jpet.114.214106
at ASPE
T Journals on A
pril 12, 2020jpet.aspetjournals.org
Dow
nloaded from
JPET #214106
9
maintained in DMEM containing 1 g/L glucose and supplemented with 10% fetal calf serum,
penicillin/streptomycin (100 IU/ml) and L-proline (0.05 mg/ml). The culture medium for the
OATP-expressing CHO cells additionally contained geneticin (500 μg/ml). For transport
experiments, cells from a confluent 55 cm2 tissue culture dish were detached with trypsin-
EDTA, uniformly resuspended in DMEM, and seeded on tissue culture dishes of 8 cm2
growth area. Cells were used for transport experiments 72 h to 96 h later, when they were 90-
100% confluent. 24 h before starting the transport experiment, cells were additionally
induced by adding 5 mM sodium butyrate to the medium.
Cryopreserved human hepatocytes (Bioreclamation IVT, Brussels, Belgium, lot SSR) were
seeded on collagen-coated 24-well plates (Nunc, Thermo Scientific, Wohlen, Switzerland) at
a density of 0.2 x 10⁶ viable cells per well. Cells were allowed to attach for about 4 hours in
William's medium E (Life Technologies Europe B.V., Zug, Switzerland) supplemented with
10% FCS, 10 mg/mL insulin and 10 mg/mL penicillin/streptomycin prior to use in uptake
experiments.
Transport experiments with overexpressing CHO cells
Transport experiments with CHO Flp InTM cells expressing NTCP were run using three 8 cm2
tissue culture dishes for each concentration investigated. After washing the cells three times
with 2 ml of pre-warmed (37 °C) sodium or choline buffer, the uptake experiment was
initiated by adding 1 ml of buffer containing either 14C-labeled macitentan at various
concentrations or 5 μM 3H-labeled taurocholic acid (appropriately diluted with non-labeled
material). The sodium-containing buffer was composed of 20 mM HEPES (pH 7.4), 116.4
mM NaCl, 1 mM NaH2PO4, 5.3 mM KCl, 0.8 mM MgSO4 and 5.5 mM D-glucose. The
choline-containing buffer had the overall same composition but sodium chloride and
NaH2PO4 were replaced with 116.4 mM choline chloride and 1 mM KH2PO4, respectively.
After incubation at 37 °C for 40 s, cellular uptake was stopped by addition of two times 2 ml
This article has not been copyedited and formatted. The final version may differ from this version.JPET Fast Forward. Published on April 25, 2014 as DOI: 10.1124/jpet.114.214106
at ASPE
T Journals on A
pril 12, 2020jpet.aspetjournals.org
Dow
nloaded from
JPET #214106
10
of ice-cold choline buffer containing 0.5% bovine serum albumin (Sigma-Aldrich, Buchs,
Switzerland). Bovine serum albumin was included in the washing buffer to minimize
unspecific binding. Cells were washed four times with approximately 2 ml of ice-cold choline
buffer and then solubilized by addition of 1 ml of 1% (w/v) Triton X-100. After incubation
for at least 20 min, 0.5 ml of the cell lysate was mixed with 3.5 ml of scintillation cocktail
IRGA Safe Plus and total radioactivity determined using a Tri-Carb 2300 TR liquid
scintillation analyzer (Packard Bioscience, Zürich, Switzerland). 25-μl aliquots of the cell
lysates were used to determine the protein content of each sample (see below). Inhibition
experiments were performed by simultaneous addition of 5 μM 3H-taurocholic acid and pre-
defined concentrations of macitentan or ACT-132577. Incubations and sample work-up were
done as outlined above. NTCP-mediated transport rates were calculated as the difference
between sodium and choline buffer.
Transport experiments with OATP-expressing and wild-type CHO cells were run using
three 8 cm2 tissue culture dishes for each concentration. After washing the cells three times
with 2 ml of pre-warmed (37 °C) transport buffer, the uptake experiment was initiated by
adding 1 ml of buffer containing macitentan or ACT-132577 at concentrations of 0.01-100
μM and 0.01-300 μM, respectively. Cellular uptake was determined at 37°C and stopped
after 40 s by addition of two times 2 ml of ice-cold transport buffer containing 0.5% bovine
serum albumin. The latter was included in the washing buffer to minimize non-specific
binding of radioactive compounds. Cells were then rapidly washed four times with each 2 ml
of ice-cold transport buffer and solubilized by addition of 1 ml of 1% (w/v) Triton X-100.
After incubation for at least 20 min, 0.5 ml of the cell lysate was mixed with 5 ml of
scintillation cocktail IRGA Safe Plus and total radioactivity determined using a Tri-Carb
2300 TR liquid scintillation analyzer. 25-μl aliquots of the cell lysates were used to determine
This article has not been copyedited and formatted. The final version may differ from this version.JPET Fast Forward. Published on April 25, 2014 as DOI: 10.1124/jpet.114.214106
at ASPE
T Journals on A
pril 12, 2020jpet.aspetjournals.org
Dow
nloaded from
JPET #214106
11
total protein content. Prior to each transport experiment, the time dependence of cellular
uptake was individually determined in order to optimize experimental conditions.
The effect of the OATP inhibitors cyclosporin A and rifampicin on the uptake of 1 μM
macitentan was investigated for all three OATP transporters. The inhibition experiment was
started by addition of 1 ml pre-warmed transport buffer containing radiolabeled macitentan
and the inhibitor in a concentration range from 0.05-100 μM. After incubation at 37 °C for
20 s, cellular uptake was terminated by addition of two times 2 ml of ice-cold transport buffer
containing 0.5% bovine serum albumin. The sample work-up in these inhibition experiments
was done as outlined above. The final content of organic solvent in the transport experiments
never exceeded 1%. 3H-Estrone-3-sulfate was used as a positive control.
Transport experiments with membrane vesicles
For transport experiments, membrane vesicles expressing human BSEP (50 μg total protein)
were incubated in the presence and absence of 5 mM ATP. Incubations were carried out at
37 °C for 1 min or 3 min in transport buffer containing 10 mM HEPES (pH 7.4), 50 mM
sucrose, 100 mM KNO3, 10 mM Mg(NO3)2, and 5 μM 3H-taurocholic acid. Taurocholate
uptake was stopped by addition of ice-cold washing buffer containing 10 mM Tris-HCl (pH
7.4), 50 mM sucrose and 100 mM KCl, followed by collection of membrane vesicles on a
cellulose nitrate membrane filter (pore size 0.45 µm) using a rapid filtration system
(Millipore, Zug, Switzerland). Prior to the experiments, filters were saturated with 1 mM
non-labeled taurocholic acid to minimize non-specific binding of radiolabeled compound.
Retained membranes were then washed twice with ice-cold buffer, and transferred into
scintillation vials. After addition of 3.5 ml scintillation cocktail, total radioactivity was
determined on a Tri-Carb 2300 TR liquid scintillation analyzer. Inhibition experiments were
performed by incubating membrane vesicles simultaneously with 5 μM 3H-taurocholic acid
This article has not been copyedited and formatted. The final version may differ from this version.JPET Fast Forward. Published on April 25, 2014 as DOI: 10.1124/jpet.114.214106
at ASPE
T Journals on A
pril 12, 2020jpet.aspetjournals.org
Dow
nloaded from
JPET #214106
12
and various concentrations of macitentan or ACT-132577. BSEP-mediated transport rates
were calculated as the difference of results obtained in the presence and absence of ATP.
Macitentan partitioning in human hepatocytes
Cellular uptake of macitentan was determined in triplicate with plated, cryopreserved human
hepatocytes. After removing the William's medium E, cells were washed twice with 0.5 mL
pre-warmed Hank's balanced salt solution (HBSS). Medium and washing solutions were
pooled and the number of unattached cells counted using a Vi-CELL counter (Beckman
Coulter, Nyon, Switzerland) to estimate the number of plated hepatocytes in the well. The
hepatic uptake experiment was started by addition of 200 µL pre-warmed (37 °C) incubation
solution containing macitentan in HBSS with 1% DMSO at a final concentration of ca. 100
nM. After 10 min incubation at 37 °C on an orbital shaker at 300 rpm, uptake was terminated
by removal of the supernatant followed by washing of the cells with twice 0.5 mL ice-cold
phosphate-buffered saline (pH 7.4). Supernatants were fortified with one volume equivalent
of acetonitrile containing tetra-deuterated macitentan as analytical standard. Hepatocytes
were lysed by addition of 200 µL of a 2:3 mixture of HBSS and acetonitrile containing
tetradeuterated macitentan, and incubation at room temperature for 15 min. Calibration
samples were prepared and worked up in parallel in a concentration range from 2 - 1000 nM
by diluting the macitentan stock solution in DMSO with a 1:1 (v/v) mixture of either
acetonitrile and HBSS, or hepatocyte lysate. All samples were placed in 96-well plates
pending analysis by LC-MS/MS.
Macitentan binding in human hepatocytes
Macitentan binding to human hepatocyte homogenate was determined using rapid
equilibrium dialysis and a membrane with a molecular weight cut-off of 8 kDa (Thermo
Fisher Scientific, Reinach, Switzerland). Prior to equilibrium dialysis, human hepatocytes (1
x 106 cells/mL) were metabolically inactivated by initial incubation at 37 °C and 800 rpm on
This article has not been copyedited and formatted. The final version may differ from this version.JPET Fast Forward. Published on April 25, 2014 as DOI: 10.1124/jpet.114.214106
at ASPE
T Journals on A
pril 12, 2020jpet.aspetjournals.org
Dow
nloaded from
JPET #214106
13
a thermomixer for 48 h, followed by three freeze-thaw cycles at room temperature and
-20 oC, and finally sonication for 10 s (Vibracell 75043, Bioblock Scientific, Illkirch, France).
Macitentan at a final concentration of 0.5 μM was added to the hepatocyte homogenate as a
0.5 mM stock solution in DMSO. 200 µL-aliquots of this mixture were transferred into the
donor compartment of the rapid equilibrium device and dialyzed against 350 µL HBSS at 37
°C for 4 h on an orbital shaker in an atmosphere containing 5% CO2. At the end of dialysis,
50 μL aliquots of the donor compartment were diluted with HBSS, while 50 µL of the
receiver compartment were diluted with 50 µL of blank hepatocyte homogenate in order to
generate samples with the same analytical matrix. Three independent experiments were
performed with three replicates each. Sample work-up for LC-MS/MS analysis consisted of
protein precipitation with three volume equivalents of methanol containing tetradeuterated
macitentan as analytical standard. After centrifugation at 3220 g and 4 °C for 20 min, 5 µL-
aliquots were transferred in a 96-well plate pending analysis. Calibration samples were
prepared and worked up in parallel in a concentration range from 0.5 -1000 nM by diluting
the macitentan stock solution in DMSO with a 1:1 (v/v) mixture of hepatocyte homogenate
and HBSS.
Quantification of macitentan by LC-MS/MS
The analytical equipment consisted of a Shimadzu HPLC System (Shimadzu, Reinach,
Switzerland) connected to an API5000 (AB SCIEX, Concord, Ontario, Canada). Data
acquisition was done using the Analyst software package (version 1.5.1). The
chromatographic analysis was achieved on a Phenomenex Luna C8 column (5 µm, 2.0 x
20 mm ID) at room temperature with a flow rate of 0.6 mL/min. Mobile phases consisted of
0.1 % aqueous formic acid and acetonitrile. The mass transitions used for macitentan and its
This article has not been copyedited and formatted. The final version may differ from this version.JPET Fast Forward. Published on April 25, 2014 as DOI: 10.1124/jpet.114.214106
at ASPE
T Journals on A
pril 12, 2020jpet.aspetjournals.org
Dow
nloaded from
JPET #214106
14
tetradeuterated internal standard were 589 to 201 and 593 to 205, respectively, both with a
scan time of 50 ms.
Determination of total protein content
Total protein content was determined using the Pierce bicinchoninic acid assay (Pierce
Science, Lausanne, Switzerland) with quantification at a wavelength of 590 nm on a
SpectraCount spectrophotometer (Packard Bioscience) according to the supplier’s protocol.
Bovine serum albumin was used as a standard. Raw data were analyzed using the
PlateReader software I-Smart (version 3.0 for Windows, Packard Bioscience).
Data evaluation
Data from the inhibition experiments were evaluated by plotting the inhibitor concentration
(logarithmic scale) against the BSEP- or NTCP-mediated transport of taurocholic acid. IC50
values were then determined from the plot by non-linear regression using equation 1 with a
constraint Bottom > 0 (Giacomini et al., 2010):
equation 1 � ����
��� �����
�� �������
in which y is the transport expressed as % inhibition relative to control, x is the inhibitor
concentration (μM), s is the slope at the point of inversion, and Top and Bottom are the
maximum and minimum transport rates. For all graphical data evaluations, the GraphPad
Prism software package (version 5.0, GraphPad Software Inc., La Jolla, USA) was used. The
fitted parameters are presented as best-fit parameter and standard error.
Cellular uptakes were normalized to total protein content and are either expressed as
(pmol/mg protein) or are further normalized for incubation time and expressed as
(pmol/mg·min). OATP-mediated net uptake rates are calculated as the difference of OATP-
This article has not been copyedited and formatted. The final version may differ from this version.JPET Fast Forward. Published on April 25, 2014 as DOI: 10.1124/jpet.114.214106
at ASPE
T Journals on A
pril 12, 2020jpet.aspetjournals.org
Dow
nloaded from
JPET #214106
15
expressing and wild-type CHO cells for each individual concentration and are presented as
mean and standard deviation (SD). Uptake ratios were calculated from the OATP-expressing
and wild-type cells.
The partitioning ratio of macitentan between human hepatocytes and in the incubation
medium (Kp) was calculated using equation 2:
equation 2 solutionincubation
hepatocytehepatocytep c
VAK
/=
where Ahepatocyte is the amount of macitentan in hepatocyte lysate, Vhepatocyte is the hepatocyte
volume and cincubation solution is the macitentan concentration in the incubation medium at the
end of the experiment. The hepatocyte volume was estimated from cell diameters measured
before plating (23 µm). This value is in good agreement with previously published data, i.e.,
16.2 µm for human hepatocytes (Mateus et al., 2013), and 24 µm for rat hepatocytes (Treijtel
et al., 2005).
The unbound fraction in the hepatocyte homogenate (fu,homogenate) was calculated using
equation 3:
equation 3 ogenate
bufferogenateu c
cf
homhom, =
where chomogenate and cbuffer are the macitentan concentrations in the donor and receiver
compartments at the end of dialysis. The unbound fraction in human hepatocytes (fu, hepatocyte)
was derived from equation 4:
equation 4 1)1/1(
1
hom,, +−
=ogenateu
hepatocyteu fDf
This article has not been copyedited and formatted. The final version may differ from this version.JPET Fast Forward. Published on April 25, 2014 as DOI: 10.1124/jpet.114.214106
at ASPE
T Journals on A
pril 12, 2020jpet.aspetjournals.org
Dow
nloaded from
JPET #214106
16
where D is the homogenate dilution factor. The volume of human hepatocytes was again
determined from cell diameters (20 µm) prior to homogenization. The ratio of unbound
macitentan concentrations between cells and medium (Kp,uu) as a measure for drug
accumulation was calculated using equation 5:
equation 5 psolutionincubationu
hepatocyteuuup K
f
fK ×=
,
,,
where fu, incubation solution is the unbound macitentan concentration of the incubation medium. Fu,
incubation solution is assumed to be 1 as the medium does not contain proteins.
Bile salt measurements in animals and man
Quantification of bile salts in plasma and serum
Bile salt concentrations in plasma and serum were determined using an enzymatic assay
based on the reduction of NAD to NADH, which is subsequently used to reduce
nitrotetrazolium blue to formazan, followed by colorimetric quantification of the latter at a
wavelength of 530 nm. For samples from the intravenous rat model, bile salts in plasma were
quantified using a kit from Sigma Diagnostics (St. Louis, USA) and a set of calibration
samples ranging from 0-100 μM that was run on the same 96-well plate as the unknown
samples. The commercial kit is designed to quantify bile salts in serum but can equally be
used for plasma (validation data not shown). Bile salts in sera from the externally performed
rat and dog toxicity studies and the multiple-ascending dose study with macitentan in human
healthy subjects (Sidharta et al., 2013) were analyzed in the respective preclinical and clinical
research labs.
This article has not been copyedited and formatted. The final version may differ from this version.JPET Fast Forward. Published on April 25, 2014 as DOI: 10.1124/jpet.114.214106
at ASPE
T Journals on A
pril 12, 2020jpet.aspetjournals.org
Dow
nloaded from
JPET #214106
17
Animals
For the acute cholestasis model, male Wistar rats, 8-12 weeks of age, were delivered from
RCC Ltd, Biotechnology and Animal Breeding Division, Füllinsdorf, Switzerland, and used
after an acclimatization period of at least 7 days. Body weights were between 221-345 g at
the day of the experiment. All animals were housed under climate-controlled conditions with
a 12-hour light/dark cycle in accordance with the guidelines of the Basel Cantonal Veterinary
Office (license no. 169). All animals were maintained under identical conditions and had free
access to drinking water and food (batch 3418, Provimi Kliba, Kaiseraugst, Switzerland).
The multiple-dose toxicity studies in Wistar or Sprague Dawley rats and Beagle dogs were
conducted in certified contract research organizations in compliance with principles of Good
Laboratory Practice. All animal experiments adhered to the "Principles of Laboratory Animal
Care" (NIH publication #85-32, revised in 1985).
Bosentan, macitentan and ACT-132577 in the acute rat model
Macitentan, its metabolite ACT-132577, and bosentan were formulated as microsuspensions
in 7.5% gelatin and intravenously administered via the tail vein at a dose of 25 mg/kg (n=6)
and a dosing volume of 1 ml/kg. All formulations were prepared freshly on the day of
experiment and stirred well prior to administration. About 0.5 ml of blood was collected into
EDTA-containing vials from the sublingual vein before dosing and at 10, 45, and 120 min
after dosing. The effect of the gelatin vehicle was investigated in a control experiment.
Plasma was prepared by centrifugation at ca. 4000 rpm and stored frozen at -20 oC pending
analysis.
Bile salt measurements in the rat and dog toxicity studies
In the multiple-dose oral toxicity studies, male and female animals were treated once daily
with macitentan either by gavage (rats) or with capsules (dogs). A control group receiving the
methylcellulose vehicle or empty capsules was an integral part of all study designs. Doses
This article has not been copyedited and formatted. The final version may differ from this version.JPET Fast Forward. Published on April 25, 2014 as DOI: 10.1124/jpet.114.214106
at ASPE
T Journals on A
pril 12, 2020jpet.aspetjournals.org
Dow
nloaded from
JPET #214106
18
were selected based on previous dose-range finding studies and preceding studies of shorter
duration. Treatment duration was 4, 13 and 26 weeks in the rat, and 4, 13, and 39 weeks in
the dog. Bile salts in plasma were determined at the end of the toxicity study as part of the
regular clinical chemistry program.
Bile salt measurements in the multiple ascending dose study in man
The multiple ascending dose study with macitentan in healthy human subjects was designed
as a double-blind, placebo-controlled, randomized study to investigate the tolerability, safety,
pharmacokinetics and pharmacodynamics of macitentan (Sidharta et al., 2013). The study
followed the principles of the Declaration of Helsinki and Good Clinical Practice. The
protocol and informed consent form was approved by an independent Ethics Committee
(Ethics Committee of the Landesärztekammer Baden-Württemberg, Stuttgart, Germany). A
total of 32 male subjects received doses of 1, 3, 10 and 30 mg macitentan or placebo for 10
days once daily in fasted state. Each dose was administered sequentially to a group of eight
subjects (six on macitentan, two on placebo). Safety evaluation comprised the collection of
adverse event data including assessments of seriousness, severity, relationship to study drug
and outcome. The safety assessment comprised laboratory variables, vital signs, 12-lead
ECG, physical condition, and body weight. Pharmacokinetic parameters of macitentan and its
metabolite ACT-132577 were assessed for all doses. Bile salts in serum were determined
pre-dose on day 1 and day 10 of treatment.
Physiologically-based pharmacokinetic (PBPK) modeling
The Simcyp Population-Based ADME Simulator (version 12, Simcyp Limited, Sheffield,
UK), a PBPK computer model combined with genetic, physiological, and demographic
variables using Monte Carlo methods and equations derived from population databases
obtained from literature sources, was used.
This article has not been copyedited and formatted. The final version may differ from this version.JPET Fast Forward. Published on April 25, 2014 as DOI: 10.1124/jpet.114.214106
at ASPE
T Journals on A
pril 12, 2020jpet.aspetjournals.org
Dow
nloaded from
JPET #214106
19
The physicochemical properties and blood binding of macitentan, i.e., molecular weight
588 g/mol, logD 2.9, pKa 6.2, plasma protein binding 99.6% and blood/plasma ratio 0.55
were entered into Simcyp. The corresponding values for ACT-132577 were molecular weight
546 g/mol, logD 1.5, pKa 6.1, plasma protein binding 99.5% and blood/plasma ratio 0.55.
Published data were used as source for the pharmacokinetic, metabolism and excretion data
used for the development of the PBPK model (Bruderer et al., 2012b; Atsmon et al., 2013).
Only 4% of the oral dose was excreted in feces as unchanged macitentan after oral dosing of
14C-labeled macitentan to healthy volunteers, suggesting almost complete absorption of the
dose from the gut. Unchanged macitentan was not detected in urine. Oral absorption was
modeled using a simple first-order model, with the fraction of the dose absorbed from the gut
(fa) set to 1 without variation. The rate constant of absorption (ka), absorption lag time and
Qgut, a hybrid term including both villous blood flow and permeability through the enterocyte
membrane (Yang et al., 2007; Pang and Chow, 2012), were optimized to fit the observed
plasma concentration profile of macitentan. Optimized values were: ka 0.3 h-1, lag time 1 h,
and Qgut 9.5 L/h. The volume of distribution was calculated based on a full PBPK model
using the tissue partitioning equations of Rodgers et al. (Rodgers et al., 2005; Rodgers and
Rowland, 2006; Rodgers and Rowland, 2007). The predicted volume of distribution at steady
state using tissue volumes for a healthy volunteer population was 0.36 L/kg for macitentan
and 0.22 L/kg for ACT-132577. Distribution was assumed to be perfusion-limited for all
organs. The liver to plasma partitioning coefficients for macitentan and ACT-132577 were
predicted as 0.18 and 0.09, based on physiological liver volume, intra- and extracellular water
content, neutral and acidic (phospo)lipid content, binding to albumin and (predicted) binding
to lipoproteins.
For the purpose of modeling, it was assumed that macitentan excretion into feces was the
result of biliary excretion rather than incomplete absorption. Consequently, 4% of the
This article has not been copyedited and formatted. The final version may differ from this version.JPET Fast Forward. Published on April 25, 2014 as DOI: 10.1124/jpet.114.214106
at ASPE
T Journals on A
pril 12, 2020jpet.aspetjournals.org
Dow
nloaded from
JPET #214106
20
clearance was set to occur via unchanged excretion into the bile and the remaining 96% was
set to be cleared by hepatic metabolism. Renal clearance was set to zero as no unchanged
macitentan was detected in urine. Macitentan blood clearance in man is unknown. However,
oral clearance can be calculated using equation 6:
equation 6 �� ��� ����
Mean plasma AUC of macitentan was 5759 ng·h/ml at a dose of 10 mg (Atsmon et al., 2013).
The oral clearance, CLpo, was calculated as 1.8 l/h. The metabolic oral clearance (96% of the
total oral clearance) of macitentan was scaled to ‘μl/min/mg protein’ and ‘µl/min/million
hepatocytes’ with the assumption, based on in vitro and clinical interaction data, that 62% of
macitentan is metabolized to ACT-132577 (Actelion, data on file) using the scaling factors in
Simcyp. The intrinsic clearance CLint was derived from CLpo using the well-stirred liver
model and equation 7:
equation 7 ���� ���
,�� ������
���
This resulted in a liver microsomal clearance CLint of 0.48 μl/min/pmol CYP3A4 for the
formation of ACT-132577. The intrinsic clearance of 1.5 μl/min/million hepatocytes was
used to calculate biliary clearance in the PBPK model. The remainder of the metabolic
clearance of macitentan was not assigned to a specific enzyme.
ACT-132577 has not been dosed intravenously to humans; therefore the human clearance is
unknown. However, the clearance of a metabolite can be calculated using equation 8
(Rowland and Tozer, 1989):
equation 8
������������−������������
��������������������������
= ����
������������������������
����������−������������
This article has not been copyedited and formatted. The final version may differ from this version.JPET Fast Forward. Published on April 25, 2014 as DOI: 10.1124/jpet.114.214106
at ASPE
T Journals on A
pril 12, 2020jpet.aspetjournals.org
Dow
nloaded from
JPET #214106
21
Application of equation 8 using the observed AUC values for macitentan and ACT-132577
(corrected for the difference in molecular weight) after a single 10 mg macitentan dose
(Atsmon et al., 2013) and the 62% fraction of macitentan metabolized to ACT-132577
resulted in a metabolite clearance of 0.32 L/kg.
A coefficient of variation of 30% was assumed for the input parameters single compartment
absorption rate constant, lag time, Qgut, and intrinsic clearance. For all other parameters,
variation during the simulations was based on (physiological) variation of the population
database within Simcyp. The population selected for the trial design was a healthy volunteer
population, male subjects, age 18-45 years, in fed state. Ten virtual trials of ten subjects each
were run (total size: 100) for a single dose of 10 mg and for steady state simulations with a 30
mg macitentan loading dose followed by 11 daily doses of 10 mg.
This article has not been copyedited and formatted. The final version may differ from this version.JPET Fast Forward. Published on April 25, 2014 as DOI: 10.1124/jpet.114.214106
at ASPE
T Journals on A
pril 12, 2020jpet.aspetjournals.org
Dow
nloaded from
JPET #214106
22
RESULTS
Inhibition of taurocholate uptake by macitentan and metabolite ACT-132577 was
investigated using membrane vesicles expressing human BSEP at concentrations up to
100 μM and 300 μM, respectively (Fig. 1). IC50 values of macitentan and ACT-132577
derived from an analysis of pooled data were 18 ± 5 μM (n=6) and 60 ± 14 μM (n=4),
respectively. Taurocholate was also the substrate in the inhibition experiments with human
NTCP overexpressed in CHO cells (Fig. 2). Macitentan inhibited taurocholate uptake with a
mean IC50 value of 18 ± 2 μM (n = 3), whereas ACT-132577 showed a mean IC50 of 14 ± 2
μM (n = 2).
We have previously reported on the cellular uptake of macitentan in OATP1B1 and
OATP1B3-overexpressing cells in the context of the clinical drug-drug interaction studies
with cyclosporin A and rifampicin (Bruderer et al., 2012a). Table 1 summarizes these results
of the uptake experiments with macitentan and ACT-132577 together with new data on
OATP2B1. Estrone-3-sulfate was used as a positive control. Uptake ratios between OATP-
overexpressing and wild-type cells were calculated. Based on these data, neither macitentan
nor ACT-132577 are considered substrates for OATP1B1 or OATP2B1. Cellular uptake rates
of both compounds into CHO wild-type cells exceeded that of the OATP substrate estrone-3-
sulfate by at least 150-fold (at 5 μM), indicating that their cellular uptake is mostly driven by
high passive diffusion. Figure 3 displays the net uptake rates for macitentan in OATP1B3-
overexpressing CHO cells. Net uptake rates consistently differed from those in wild-type
CHO cells and the linear increase up to the highest concentration of 100 μM suggests that
macitentan is likely a substrate of OATP1B3. No saturation in macitentan uptake was
observed in this concentration range indicating that the affinity of macitentan for OATP1B3
transport is rather low. Passive permeation was again the major contributor to overall cellular
This article has not been copyedited and formatted. The final version may differ from this version.JPET Fast Forward. Published on April 25, 2014 as DOI: 10.1124/jpet.114.214106
at ASPE
T Journals on A
pril 12, 2020jpet.aspetjournals.org
Dow
nloaded from
JPET #214106
23
uptake as uptake ratios never exceeded 1.2. The role of OATP in the overall cellular uptake is
therefore considered of little clinical relevance. Based on the results in Table 1, metabolite
ACT-132577 is not a substrate for OATP1B3.
To verify the above conclusion, macitentan uptake into OATP-overexpressing cells was
additionally determined in the presence of the known OATP inhibitors cyclosporin A (Shitara
et al., 2003) and rifampicin (Vavricka et al., 2002; Hirano et al., 2006). The results are
summarized in Table 2. No consistent effect of cyclosporin A was observed over the
concentration range up to 100 μM, i.e., at concentrations largely exceeding its Ki value of 0.2
μM (Shitara et al., 2003). Cyclosporin A inhibition was not evident in OATP1B3 cells, nor
was there any consistent effect of rifampicin in either cell line. Control experiments with both
inhibitors using 3H-atorvastatin as an OATP substrate yielded concentration-dependent
decreases in net uptake rates for both compounds (data not shown). Overall, these OATP
inhibition experiments support the conclusion that macitentan cellular uptake is mostly
dependent on passive diffusion with only a small component of OATP1B3-mediated uptake.
Macitentan uptake into CHO Flp InTM cells overexpressing the sodium-dependent
taurocholate co-transporting polypeptide NTCP was investigated in the same concentration
range as used for OATP transporters. Uptake ratios were determined from experiments in the
presence and absence of sodium using taurocholic acid at 5 μM as a positive control. The
results are summarized in Table 3. Uptake ratios were around unity over the entire
concentration range indicating that macitentan is not a NTCP substrate.
The potential for intracellular accumulation of macitentan has been determined in human
hepatocytes using a previously published method with small modifications (Mateus et al.,
This article has not been copyedited and formatted. The final version may differ from this version.JPET Fast Forward. Published on April 25, 2014 as DOI: 10.1124/jpet.114.214106
at ASPE
T Journals on A
pril 12, 2020jpet.aspetjournals.org
Dow
nloaded from
JPET #214106
24
2013). Two parallel experiments were performed, in which first the partitioning ratio (Kp) of
macitentan between hepatocytes and culture medium was determined. Mean Kp was 724 ± 96
indicating a significant partitioning of macitentan into human hepatocytes. Macitentan
binding in hepatocytes (fu,hepatocytes) was derived from binding in hepatocyte homogenates
(fu,homogenate) as determined by rapid equilibrium dialysis. The corresponding values for
fu,homogenate and fu,hepatocytes were 0.189 ± 0.009 and 0.00099 ± 0.00004, respectively. This data
suggests that macitentan is highly bound in human hepatocytes and that the free fraction
therein is only around 0.1%. The ratio of unbound macitentan concentrations in hepatocytes
and medium (Kp,uu) as a measure for hepatocellular accumulation was calculated as 0.7 ± 0.1.
Macitentan does therefore not accumulate in human liver cells as the unbound concentrations
in liver cells and incubation medium are similar. The significant partitioning of macitentan
into liver cells is likely the consequence of its elevated lipophilicity and compensated by the
high binding to cellular components.
The acute effects of macitentan and ACT-132577 on bile salt homeostasis were tested upon
intravenous dosing to the rat. This model was developed by Fattinger et al. (Fattinger et al.,
2001) to mechanistically rationalize the increased plasma bile salts in clinical trials with
bosentan. Macitentan and ACT-132577 were individually tested in this model at an
intravenous dose of 25 mg/kg, with plasma samples taken before and at 10, 45, and 120 min
after dosing. As individual plasma bile salt concentrations varied significantly between
animals prior to drug administration, results are also expressed as individual differences from
pre-dose values. Bosentan was included as positive control. Results for all three endothelin
receptor antagonists are summarized in Table 4. Bosentan increased plasma bile salts by 18 ±
13 μM at 10 min post-dose which then returned to pre-dose values within 45 min after
dosing. Neither macitentan nor ACT-132577 elicited such an increase in plasma bile salts.
This article has not been copyedited and formatted. The final version may differ from this version.JPET Fast Forward. Published on April 25, 2014 as DOI: 10.1124/jpet.114.214106
at ASPE
T Journals on A
pril 12, 2020jpet.aspetjournals.org
Dow
nloaded from
JPET #214106
25
After 10 min, mean increases were 3.7 ± 4.4 μM for macitentan and 2.5 ± 6.7 μM for ACT-
132577, and thus not different from vehicle (0.4 ± 3.4 μM).
Bile salts in serum were systematically determined in the oral toxicology program of
macitentan in the rat and dog as part of the clinical chemistry program. Table 5 summarizes
the data collected for all dose groups at the end of the respective study period. In the 4-week
rat study, there was no increase in mean bile salts in the male animals up to the highest dose
of 1500 mg/kg, and in female rats up to 450 mg/kg. Similar to the observations in the
intravenous rat model, significant inter-individual variability was evident in these rat studies,
most likely resulting from differences in food consumption as animals had free access to food
over the entire study. No difference between dose groups was noted in the bile salt
concentrations in the 26-week toxicity study, in which rats received macitentan doses up to
250 mg/kg. In the 4-week dog study, macitentan doses up to 250 mg/kg were given. Inter-
animal variability was significantly lower compared to the rat. There was no difference in
mean serum bile salts between dose groups in male or female animals. A similar picture was
obtained for doses up to 100 mg/kg in the 13-week study, during which bile salt data were
collected after 4 weeks of treatment and at study end. No change in bile salts was observed
across dose groups for the entire study duration. Doses in the 39-week dog study were 5, 30,
and 100 mg/kg at the start of the study. After 20 weeks, the high dose had to be reduced to 75
mg/kg. Serum bile salt data were collected at the end of the study and confirmed the
observations from the studies of shorter duration.
Changes in serum bile salts were also monitored in the multiple-ascending dose study with
macitentan in which healthy volunteers received macitentan doses of 1, 3, 10 and 30 mg for a
period of 10 days (Sidharta et al., 2013). Each dose group consisted of six individuals on
This article has not been copyedited and formatted. The final version may differ from this version.JPET Fast Forward. Published on April 25, 2014 as DOI: 10.1124/jpet.114.214106
at ASPE
T Journals on A
pril 12, 2020jpet.aspetjournals.org
Dow
nloaded from
JPET #214106
26
active treatment and two on placebo. The placebo data were pooled from the four active dose
groups. Bile salts were collected on the first day prior to macitentan dosing and on day 10 at
the end of study. Results are shown in Table 6. Bile salt concentrations in serum were in a
narrow range from 7.7-19 μM and there was no discernible trend toward increased serum
levels at any dose. Inspection of the individual data revealed a maximum difference of 5 μM
between measurements on day 1 and day 10, which was observed in a subject receiving
placebo. These data confirm the above animal data and show that macitentan treatment in
man is not associated with changes in serum bile salts.
A physiology-based pharmacokinetic (PBPK) model of macitentan was developed in order to
allow comparison of the in vitro transport data to concentrations of macitentan and
ACT-132577 in the portal vein, systemic circulation, and liver. Table 7 summarizes the
observed and predicted human pharmacokinetic parameters of macitentan and ACT-132577
after single and repeat dosing as derived from the PBPK model. The derived plasma
concentration vs. time profiles for both compounds after a single oral dose are depicted in
Fig. 4 (panels A and B). Projected plasma exposure (AUC) and peak plasma concentration
(Cmax) data were close to the mean observed data. The model predicts a mean Tmax of 7 h, i.e.,
slightly earlier than the observed mean of 9 h but still well within the range of individual
values. Similarly, the Tmax for ACT-132577 was predicted at 26 h vs. observed 48 h. Overall,
the PBPK model adequately describes the observed plasma concentration profiles of
macitentan and ACT-132577. It was therefore considered suitable to predict portal vein and
liver concentrations as well.
Panel C in Fig. 4 shows the time course of mean macitentan and ACT-132577 concentrations
in the portal vein, plasma, and liver. Peak concentrations of macitentan in the portal vein and
This article has not been copyedited and formatted. The final version may differ from this version.JPET Fast Forward. Published on April 25, 2014 as DOI: 10.1124/jpet.114.214106
at ASPE
T Journals on A
pril 12, 2020jpet.aspetjournals.org
Dow
nloaded from
JPET #214106
27
liver after a single 10 mg dose to healthy male subjects were estimated as 354 nM (208
ng/ml) and 62 nM (36 ng/ml), respectively. The corresponding values for ACT-132577 were
420 nM (223 ng/ml) and 39 nM (21 ng/ml). As ACT-132577 is generated by hepatic
metabolism, plasma and portal vein concentrations are identical. The concentration vs. time
profiles for both compounds at steady-state are illustrated in panel D. Predicted total peak
concentrations for macitentan at steady-state were 400 nM (235 ng/ml) in plasma, 419 nM
(247 ng/ml) in portal vein and 72 nM (43 ng/ml) in liver. The corresponding values for
ACT-132577 were 1722 nM (915 ng/ml) for plasma/portal vein and 159 nM (85 ng/ml) for
the liver.
A parameter sensitivity analysis of the PBPK model was performed to investigate the effect
of various degrees of active hepatic uptake on the pharmacokinetic parameters of macitentan,
with the liver as a permeability-limited instead of a perfusion-limited organ. Passive uptake
clearance CLint, passive into human hepatocytes was estimated from the macitentan logD of 2.9
as 5.3 μL/min/106 cells (Menochet et al., 2012). Four different values for active uptake
clearance CLint, active, i.e. 0, 10, 25, and 50 μL/min/106 cells, were then arbitrarily assigned to
OATP1B1 as a prototypical hepatic uptake transporter. Ten virtual trials of ten subjects each
were again run (total size: 100) for a single dose of 10 mg without any other changes to the
PBPK model. A comparison between predicted and observed pharmacokinetic parameters is
shown in Table 8. In the permeability-limited PBPK liver model, the best fit between
modeled and observed macitentan AUC0-24h is achieved with a CLint, active of 25 μL/min/106
cells, for which a ratio of unbound liver and plasma concentrations of 1.05 is predicted. The
outcome is then closest to the perfusion-limited PBPK model, in which the ratio of unbound
concentrations is per definition set to unity.
This article has not been copyedited and formatted. The final version may differ from this version.JPET Fast Forward. Published on April 25, 2014 as DOI: 10.1124/jpet.114.214106
at ASPE
T Journals on A
pril 12, 2020jpet.aspetjournals.org
Dow
nloaded from
JPET #214106
28
DISCUSSION
‘Dosis sola facit venenum’ is the scientific legacy of the Swiss physician, alchemist,
astrologer, and philosopher Paracelsus (1493-1541). About 500 years later, its longer version
‘all things are poison, and there is nothing without poisonous qualities…it is only the dose
which make a thing poison’ is still a major paradigm in modern pharmacology in its attempt
to find drugs with adequate risk-benefit profiles. Nowadays, the interplay of target affinity
and local drug concentrations has replaced the historical dose term as a measure for drug
quantity. Whether a drug reaches its target in sufficient concentrations is mostly dependent on
its physicochemical properties, as drug distribution to the majority of organs and tissues is
driven by passive diffusion. While total drug concentrations can vary significantly between
tissues as a consequence of differing binding properties, free drug concentrations strive to
equilibrate. This general concept needs to be expanded for organs expressing transport
proteins that are capable of maintaining non-equilibrium conditions and consequently,
depending on their transport direction, result in lower or higher free drug concentrations on
one side of a membrane. Liver, kidney, brain, and placenta are typical examples of such
organs, and the discovery and characterization of transporters like the ATP-dependent efflux
pump P-gp or the organic anion-transporting polypeptide family OATP has fundamentally
changed our understanding of drug disposition.
Endothelin receptor antagonists have been established as a therapeutic concept for the
treatment of pulmonary arterial hypertension. From a chemical perspective, they require a
negative charge (Wu, 2000; Boss et al., 2002) for their interaction with Arg326 of the
endothelin receptors (Breu et al., 1995). In the case of sitaxentan and ambrisentan, this
negative charge is provided by a carboxylic acid whereas bosentan contains an aromatic
sulfonamide. As a consequence, the majority of drug molecules are negatively charged at
This article has not been copyedited and formatted. The final version may differ from this version.JPET Fast Forward. Published on April 25, 2014 as DOI: 10.1124/jpet.114.214106
at ASPE
T Journals on A
pril 12, 2020jpet.aspetjournals.org
Dow
nloaded from
JPET #214106
29
physiological pH which – together with high binding to plasma proteins - limits distribution
into tissues. On the other hand, the negative charge makes them candidate substrates for
anion transporters, and interactions with OATP transport proteins have indeed been described
(Katz et al., 2006; Treiber et al., 2007; Spence et al., 2010). Hepatic side effects – mostly
manifest as transient reversible elevations of liver transaminases in plasma – have also been
reported for some marketed endothelin receptor antagonists (Humbert et al., 2007; Galie et
al., 2011). Active drug uptake by OATP transporters has the potential to increase hepatic
drug concentrations and thus to contribute to liver injury. The combination of BSEP
inhibition and OATP-mediated accumulation in liver cells is the likely mechanism for the
cholestatic effect of bosentan (Fattinger et al., 2001; Treiber et al., 2007). In line with this
hypothesis is the observation in pulmonary arterial hypertension patients concomitantly
receiving the HIV protease inhibitor lopinavir/ritonavir, a potent inhibitor of both CYP3A4
metabolism and OATP transport (Hull et al., 2009; Annaert et al., 2010): bosentan trough
plasma concentrations were increased by 48-fold in this patient population but were not
associated with a higher frequency of liver injury (Dingemanse et al., 2010), most likely
because hepatic drug burden was reduced as a consequence of blocked OATP uptake.
The above points illustrate the necessity to discover novel endothelin receptor antagonists
with an improved safety profile. The medicinal chemistry program leading to the discovery of
macitentan and its pharmacological profile in animal models have been published previously
(Iglarz et al., 2008; Bolli et al., 2012). Key structural changes in macitentan versus bosentan
constitute the replacement of the sulfonamide by a sulfamide moiety and the increase in
overall compound lipophilicity. The sulfamide function in macitentan is less acidic than the
sulfonamide in bosentan as evidenced by the difference in pKa values of 6.2 and 5.1 (Iglarz et
al., 2008), respectively, thus increasing the proportion of molecules present in non-ionized
This article has not been copyedited and formatted. The final version may differ from this version.JPET Fast Forward. Published on April 25, 2014 as DOI: 10.1124/jpet.114.214106
at ASPE
T Journals on A
pril 12, 2020jpet.aspetjournals.org
Dow
nloaded from
JPET #214106
30
state at physiological pH. The octanol/water partition coefficient logD7.4, a measure of
lipophilicity, is 2.9 for macitentan and 1.3 for bosentan. Both factors facilitate membrane
permeability and penetration into tissues. These changes were achieved without
compromising target affinity. Macitentan antagonizes the specific binding of ET-1 to
recombinant ETA and ETB receptors with IC50 values of 0.5 nM and 391 nM, respectively
(Iglarz et al., 2008). In ex vivo models using rat aorta and trachea preparations, macitentan
behaved as a more dual endothelin receptor with pA2 values of 7.6 and 5.9 for ETA and ETB
receptors, respectively (Iglarz et al., 2008). Metabolic stability was optimized in vitro and
favorably translated in animals (Bolli et al., 2012) and man (Sidharta et al., 2011; Sidharta et
al., 2013). As a consequence, macitentan was used at daily doses of 3 mg and 10 mg in the
completed phase III SERAPHIN trial in patients with pulmonary arterial hypertension
(Pulido et al., 2013). Macitentan has an active metabolite, ACT-132577, that is formed in a
cytochrome P450-catalyzed reaction, circulates in human plasma and likely contributes to the
overall efficacy.
Beyond improved receptor binding affinities and pharmacokinetic properties over bosentan,
the structural changes in macitentan have altered the hepatic disposition and interaction
profile with hepatic transporters. As illustrated in Figs. 1 and 2, macitentan and ACT-132577
are inhibitors of the two major transport proteins responsible for hepatic bile salt trafficking,
i.e., NTCP and BSEP. NTCP (SLC10A1) is the major transporter responsible for moving bile
salts from blood into liver cells (Doring et al., 2012) whereas BSEP mediates the rate-limiting
step in bile salt secretion from blood into bile (Gerloff et al., 1998; Stieger et al., 2000) (Fig.
5). NTCP was equally inhibited by macitentan and ACT-132577 with IC50 values in the range
of 14–18 μM, whereas BSEP was inhibited with IC50 ranging from 18–60 μM. These in vitro
data are thus not different from those of bosentan with reported IC50 values on BSEP and
This article has not been copyedited and formatted. The final version may differ from this version.JPET Fast Forward. Published on April 25, 2014 as DOI: 10.1124/jpet.114.214106
at ASPE
T Journals on A
pril 12, 2020jpet.aspetjournals.org
Dow
nloaded from
JPET #214106
31
NTCP of 25–77 μM (Mano et al., 2007; Dawson et al., 2012; Warner et al., 2012) and 24-30
μM (Leslie et al., 2007), respectively. However, the mechanism of hepatic uptake differs
between bosentan and macitentan. Bosentan uptake into liver cells is largely dependent on
OATP transport in animals and man (Treiber et al., 2004; Treiber et al., 2007). In contrast, its
increased lipophilicity allows macitentan to enter cells by passive diffusion as shown in the
uptake experiments with OATP-expressing and wild-type cells (Table 1). The same
conclusion was drawn in a recent study on macitentan interactions with other hepatic
transport proteins (Weiss et al., 2013). Macitentan is a weak substrate for OATP1B3 (Fig. 3),
but not for OATP1B1, OATP2B1 or NTCP. Active transport contributes less than 20% to
overall cellular uptake. Consequently, macitentan uptake is not vulnerable to OATP
inhibition by cyclosporin A or rifampicin (Table 3). These conclusions were confirmed in a
clinical drug-drug interaction study with cyclosporin A, an established potent inhibitor of
OATP- (Shitara et al., 2003) and NTCP-mediated transport (Mita et al., 2006). Concomitant
cyclosporin A increased macitentan exposure in man by only 1.1-fold (Bruderer et al.,
2012a), compared to a 30-fold increase observed with the proven OATP substrate bosentan
(Treiber et al., 2007) in the presence of cyclosporin A (Binet et al., 2000).
Bosentan elicited a dose-dependent increase in plasma bile salts in the rat after single
intravenous administration (Fattinger et al., 2001). Macitentan and ACT-132577 were both
tested in this model alongside with bosentan, all at a dose of 25 mg/kg. Results with bosentan
reproduced literature data, while no effect was observed with macitentan or ACT-132577
(Table 4). These data provide evidence in a more physiological setting that neither compound
interferes with bile salt homeostasis under conditions that led to an acute cholestatic effect
with bosentan. Supportive data upon chronic dosing was provided by the bile salt data from
the rat and dog toxicity studies. After 26 or 39 weeks of treatment with macitentan at doses
This article has not been copyedited and formatted. The final version may differ from this version.JPET Fast Forward. Published on April 25, 2014 as DOI: 10.1124/jpet.114.214106
at ASPE
T Journals on A
pril 12, 2020jpet.aspetjournals.org
Dow
nloaded from

JPET #214106
32
up to 250 mg/kg (rat) and 100/75 mg/kg (dog), there was no pattern of elevated plasma bile
salts in any toxicity study nor were there any histological findings pointing to a cholestatic
potential of macitentan (Actelion, data on file). In contrast, bosentan-treated animals showed
elevated bile salt and alanine aminotransferase levels, which were considered to be
consequences of a functional cholestasis (Actelion, data on file).
A PBPK model was developed for macitentan and ACT-132577 with the aim to estimate
blood and liver concentrations. Total mean macitentan concentrations projected from PBPK
modeling at steady-state in plasma, portal vein and liver are 400 nM, 419 nM and 72 nM. The
corresponding values for ACT-132577 were 1722 nM for plasma/portal vein and 159 nM for
the liver. Correction for plasma protein binding leads to predicted unbound peak macitentan
concentrations of 1.60 nM in plasma, 1.68 nM in the portal vein, and 0.29 nM in the liver.
Free concentrations for ACT-132577 in plasma/portal vein and liver were 8.61 nM and 0.80
nM, respectively. These concentrations are significantly below those observed in the bile salt
transport experiments with NTCP- and BSEP-expressing cells. The key assumption of free
partitioning of macitentan between blood and liver and equal unbound drug concentrations in
both compartments is supported by the experimentally determined Kp,uu of 0.7 in human
hepatocytes, and the sensitivity analysis of the PBPK model probing for the impact of various
degrees of active hepatic uptake on macitentan pharmacokinetics. In this permeability-limited
PBPK model, the best fit between observed and predicted macitentan pharmacokinetics in
achieved when the ratio of unbound plasma and liver concentrations approaches unity
(Table 8).
Serum bile salts were measured in the multiple ascending dose study with macitentan in
which daily doses up to 30 mg were given to healthy volunteers for 10 days (Sidharta et al.,
This article has not been copyedited and formatted. The final version may differ from this version.JPET Fast Forward. Published on April 25, 2014 as DOI: 10.1124/jpet.114.214106
at ASPE
T Journals on A
pril 12, 2020jpet.aspetjournals.org
Dow
nloaded from
JPET #214106
33
2013). As shown in Table 6, there was no difference in bile salts between dose groups and
compared to placebo. All individual values were in a narrow range from 7.7–19 μM. Liver
transaminases but not bile salts were measured in the long-term phase III SERAPHIN trial
with macitentan (Pulido et al., 2013). The incidence of liver enzyme elevations more than
three times the upper limit of normal was not different between placebo and the 3 mg and 10
mg dose groups. The incidences of alanine or aspartate aminotransferase elevations more
than three times above the upper limit of normal were 4% and 3% in the 3 mg and 10 mg
dose group, respectively, compared to 4% on placebo (Pulido et al., 2013). Similarly, the
incidence of plasma bilirubin elevations was equally distributed over all dose groups and
placebo.
In conclusion, there is cumulative evidence demonstrating the superior liver safety profile of
the next generation endothelin receptor antagonist macitentan. Unlike bosentan, macitentan is
devoid of a pattern of functional cholestasis in long-term clinical trials. On a molecular basis,
this difference is the result of discrete changes in chemical structure. While macitentan
maintains equal inhibitory potency to bosentan on NTCP and BSEP transport in vitro,
replacement of the sulfonamide by a less acidic sulfamide moiety and an increased
lipophilicity result in a complete change in the hepatic disposition profile. Bosentan uptake
into the liver is an active process, mediated by OATP transport proteins, likely leading to
accumulation in liver cells. In contrast, macitentan partitions into the liver mostly by passive
diffusion. Local drug concentrations are thus limited by the extensive binding of macitentan
to plasma proteins to levels that are unlikely to exert an inhibitory potential on hepatic bile
salts. These conclusions from biochemical and drug disposition data were confirmed in an
acute rat model and long-term toxicity studies in the rat and dog. In clinical trials, no change
in plasma bile salts was observed in healthy volunteers upon multiple-dose treatment up to
30 mg per day, nor was the incidence of liver transaminase elevations different in macitentan-
This article has not been copyedited and formatted. The final version may differ from this version.JPET Fast Forward. Published on April 25, 2014 as DOI: 10.1124/jpet.114.214106
at ASPE
T Journals on A
pril 12, 2020jpet.aspetjournals.org
Dow
nloaded from
JPET #214106
34
vs. placebo-treated patients in the long-term morbidity/mortality SERAPHIN trial.
Macitentan at a daily dose of 10 mg is therefore not expected to interfere with hepatic bile
salt transport in clinical practice.
ACKNOWLEDGMENTS
The authors would like to thank Aude Weigel, Eric Soubieux, Julia Friedrich and Stephanie
Bernhard for their dedication and experimental contributions. We are also grateful to Susan
Flores and Charlotte Gonzales for their help in preparing the manuscript.
AUTHORSHIP CONTRIBUTIONS
Participated in research design: Treiber, Aeänismaa, Delahaye, Treher, Hess, Sidharta
Conducted experiments: Treiber, Aeänismaa, Delahaye, Treher, Hess, Sidharta
Performed data analysis: Treiber, Aeänismaa, Treher, de Kanter, Delahaye, Hess, Sidharta
Wrote or contributed to the writing of the manuscript: Treiber, Aeänismaa, Treher, de Kanter,
Hess, Sidharta
This article has not been copyedited and formatted. The final version may differ from this version.JPET Fast Forward. Published on April 25, 2014 as DOI: 10.1124/jpet.114.214106
at ASPE
T Journals on A
pril 12, 2020jpet.aspetjournals.org
Dow
nloaded from
JPET #214106
35
REFERENCES
Annaert P, Ye ZW, Stieger B and Augustijns P (2010) Interaction of HIV protease inhibitors
with OATP1B1, 1B3, and 2B1. Xenobiotica 40:163-176.
Atsmon J, Dingemanse J, Shaikevich D, Volokhov I and Sidharta PN (2013) Investigation of
the effects of ketoconazole on the pharmacokinetics of macitentan, a novel dual
endothelin receptor antagonist, in healthy subjects. Clin Pharmacokinet 52:685-692.
Binet I, Wallnofer A, Weber C, Jones R and Thiel G (2000) Renal hemodynamics and
pharmacokinetics of bosentan with and without cyclosporine A. Kidney Int 57:224-231.
Bolli MH, Boss C, Binkert C, Buchmann S, Bur D, Hess P, Iglarz M, Meyer S, Rein J, Rey
M, Treiber A, Clozel M, Fischli W and Weller T (2012) The discovery of N-[5-(4-
bromophenyl)-6-[2-[(5-bromo-2-pyrimidinyl)oxy]ethoxy]-4-pyrimidinyl]-N'-p
ropylsulfamide (Macitentan), an orally active, potent dual endothelin receptor antagonist.
J Med Chem 55:7849-7861.
Boss C, Bolli M and Weller T (2002) Endothelin receptor antagonists: structures, synthesis,
selectivity and therapeutic applications. Curr Med Chem 9:349-383.
Breu V, Hashido K, Broger C, Miyamoto C, Furuichi Y, Hayes A, Kalina B, Loffler BM,
Ramuz H and Clozel M (1995) Separable binding sites for the natural agonist endothelin-
1 and the non-peptide antagonist bosentan on human endothelin-A receptors. Eur J
Biochem 231:266-270.
Bruderer S, Aanismaa P, Homery MC, Hausler S, Landskroner K, Sidharta PN, Treiber A
and Dingemanse J (2012a) Effect of cyclosporine and rifampin on the pharmacokinetics
of macitentan, a tissue-targeting dual endothelin receptor antagonist. AAPS J 14:68-78.
Bruderer S, Hopfgartner G, Seiberling M, Wank J, Sidharta PN, Treiber A and Dingemanse J
(2012b) Absorption, distribution, metabolism, and excretion of macitentan, a dual
endothelin receptor antagonist, in humans. Xenobiotica 42:901-910.
This article has not been copyedited and formatted. The final version may differ from this version.JPET Fast Forward. Published on April 25, 2014 as DOI: 10.1124/jpet.114.214106
at ASPE
T Journals on A
pril 12, 2020jpet.aspetjournals.org
Dow
nloaded from
JPET #214106
36
Dawson S, Stahl S, Paul N, Barber J and Kenna JG (2012) In vitro inhibition of the bile salt
export pump correlates with risk of cholestatic drug-induced liver injury in humans.
Drug Metab Dispos 40:130-138.
Dingemanse J, van Giersbergen PL, Patat A and Nilsson PN (2010) Mutual pharmacokinetic
interactions between bosentan and lopinavir/ritonavir in healthy participants. Antivir
Ther 15:157-163.
Doring B, Lutteke T, Geyer J and Petzinger E (2012) The SLC10 carrier family: transport
functions and molecular structure. Curr Top Membr 70:105-168.
Fattinger K, Funk C, Pantze M, Weber C, Reichen J, Stieger B and Meier PJ (2001) The
endothelin antagonist bosentan inhibits the canalicular bile salt export pump: a potential
mechanism for hepatic adverse reactions. Clin Pharmacol Ther 69:223-231.
Galie N, Hoeper MM, Simon J, Gibbs R and Simonneau G (2011) Liver toxicity of sitaxentan
in pulmonary arterial hypertension. Eur Heart J 32:386-387.
Gerloff T, Stieger B, Hagenbuch B, Madon J, Landmann L, Roth J, Hofmann AF and Meier
PJ (1998) The sister of P-glycoprotein represents the canalicular bile salt export pump of
mammalian liver. J Biol Chem 273:10046-10050.
Giacomini KM, Huang SM, Tweedie DJ, Benet LZ, Brouwer KL, Chu X, Dahlin A, Evers R,
Fischer V, Hillgren KM, Hoffmaster KA, Ishikawa T, Keppler D, Kim RB, Lee CA,
Niemi M, Polli JW, Sugiyama Y, Swaan PW, Ware JA, Wright SH, Yee SW, Zamek-
Gliszczynski MJ and Zhang L (2010) Membrane transporters in drug development. Nat
Rev Drug Discov 9:215-236.
Hirano M, Maeda K, Shitara Y and Sugiyama Y (2006) Drug-drug interaction between
pitavastatin and various drugs via OATP1B1. Drug Metab Dispos 34:1229-1236.
This article has not been copyedited and formatted. The final version may differ from this version.JPET Fast Forward. Published on April 25, 2014 as DOI: 10.1124/jpet.114.214106
at ASPE
T Journals on A
pril 12, 2020jpet.aspetjournals.org
Dow
nloaded from
JPET #214106
37
Hull MW, Harris M, Lima V, Guillemi S, Harrigan PR and Montaner JS (2009)
Lopinavir/ritonavir pharmacokinetics in a substitution of high-dose soft-gelatin capsule
to tablet formulation. J Clin Pharmacol 49:155-161.
Humbert M, Segal ES, Kiely DG, Carlsen J, Schwierin B and Hoeper MM (2007) Results of
European post-marketing surveillance of bosentan in pulmonary hypertension. Eur
Respir J 30:338-344.
Iglarz M, Binkert C, Morrison K, Fischli W, Gatfield J, Treiber A, Weller T, Bolli MH, Boss
C, Buchmann S, Capeleto B, Hess P, Qiu C and Clozel M (2008) Pharmacology of
macitentan, an orally active tissue-targeting dual endothelin receptor antagonist. J
Pharmacol Exp Ther 327:736-745.
Katz DA, Carr R, Grimm DR, Xiong H, Holley-Shanks R, Mueller T, Leake B, Wang Q, Han
L, Wang PG, Edeki T, Sahelijo L, Doan T, Allen A, Spear BB and Kim RB (2006)
Organic anion transporting polypeptide 1B1 activity classified by SLCO1B1 genotype
influences atrasentan pharmacokinetics. Clin Pharmacol Ther 79:186-196.
Kis E, Ioja E, Nagy T, Szente L, Heredi-Szabo K and Krajcsi P (2009) Effect of membrane
cholesterol on BSEP/Bsep activity: species specificity studies for substrates and
inhibitors. Drug Metab Dispos 37:1878-1886.
Krum H, Viskoper RJ, Lacourciere Y, Budde M and Charlon V (1998) The effect of an
endothelin-receptor antagonist, bosentan, on blood pressure in patients with essential
hypertension. Bosentan Hypertension Investigators. N Engl J Med 338:784-790.
Leslie EM, Watkins PB, Kim RB and Brouwer KL (2007) Differential inhibition of rat and
human Na+-dependent taurocholate cotransporting polypeptide (NTCP/SLC10A1)by
bosentan: a mechanism for species differences in hepatotoxicity. J Pharmacol Exp Ther
321:1170-1178.
This article has not been copyedited and formatted. The final version may differ from this version.JPET Fast Forward. Published on April 25, 2014 as DOI: 10.1124/jpet.114.214106
at ASPE
T Journals on A
pril 12, 2020jpet.aspetjournals.org
Dow
nloaded from
JPET #214106
38
Mano Y, Usui T and Kamimura H (2007) Effects of bosentan, an endothelin receptor
antagonist, on bile salt export pump and multidrug resistance-associated protein 2.
Biopharm Drug Dispos 28:13-18.
Mateus A, Matsson P and Artursson P (2013) Rapid measurement of intracellular unbound
drug concentrations. Mol Pharm 10:2467-2478.
Menochet K. Kenworthy KE, Houston JB, Galetin A SW (2012) Simuntaneous assessment of
uptake and metabolism in rat hepatocytes: a comprehensive mechanistic model. J Exp
Pharm 34:2-15.
Mita S, Suzuki H, Akita H, Hayashi H, Onuki R, Hofmann AF and Sugiyama Y (2006)
Inhibition of bile acid transport across Na+/taurocholate cotransporting polypeptide
(SLC10A1) and bile salt export pump (ABCB 11)-coexpressing LLC-PK1 cells by
cholestasis-inducing drugs. Drug Metab Dispos 34:1575-1581.
Pang KS and Chow EC (2012) Commentary: theoretical predictions of flow effects on
intestinal and systemic availability in physiologically based pharmacokinetic intestine
models: the traditional model, segregated flow model, and QGut model. Drug Metab
Dispos 40:1869-1877.
Pulido T, Adzerikho I, Channick RN, Delcroix M, Galie N, Ghofrani HA, Jansa P, Jing ZC,
Le Brun FO, Mehta S, Mittelholzer CM, Perchenet L, Sastry BK, Sitbon O, Souza R,
Torbicki A, Zeng X, Rubin LJ and Simonneau G (2013) Macitentan and morbidity and
mortality in pulmonary arterial hypertension. N Engl J Med 369:809-818.
Raja SG (2010) Macitentan, a tissue-targeting endothelin receptor antagonist for the potential
oral treatment of pulmonary arterial hypertension and idiopathic pulmonary fibrosis.
Curr Opin Investig Drugs 11:1066-1073.
This article has not been copyedited and formatted. The final version may differ from this version.JPET Fast Forward. Published on April 25, 2014 as DOI: 10.1124/jpet.114.214106
at ASPE
T Journals on A
pril 12, 2020jpet.aspetjournals.org
Dow
nloaded from
JPET #214106
39
Rodgers T, Leahy D and Rowland M (2005) Tissue distribution of basic drugs: accounting
for enantiomeric, compound and regional differences amongst beta-blocking drugs in rat.
J Pharm Sci 94:1237-1248.
Rodgers T and Rowland M (2006) Physiologically based pharmacokinetic modelling 2:
predicting the tissue distribution of acids, very weak bases, neutrals and zwitterions. J
Pharm Sci 95:1238-1257.
Rodgers T and Rowland M (2007) Mechanistic approaches to volume of distribution
predictions: understanding the processes. Pharm Res 24:918-933.
Rowland M and Tozer N (1989) Clinical pharmacokinetics: concepts and applications. Lea
and Febiger, London.
Shitara Y, Itoh T, Sato H, Li AP and Sugiyama Y (2003) Inhibition of transporter-mediated
hepatic uptake as a mechanism for drug-drug interaction between cerivastatin and
cyclosporin A. J Pharmacol Exp Ther 304:610-616.
Sidharta PN, van Giersbergen PL and Dingemanse J (2013) Safety, tolerability,
pharmacokinetics, and pharmacodynamics of macitentan, an endothelin receptor
antagonist, in an ascending multiple-dose study in healthy subjects. J Clin Pharmacol
53:1131-1138.
Sidharta PN, van Giersbergen PL, Halabi A and Dingemanse J (2011) Macitentan: entry-into-
humans study with a new endothelin receptor antagonist. Eur J Clin Pharmacol 67:977-
984.
Spence R, Mandagere A, Richards DB, Magee MH, Dufton C and Boinpally R (2010)
Potential for pharmacokinetic interactions between ambrisentan and cyclosporine. Clin
Pharmacol Ther 88:513-520.
This article has not been copyedited and formatted. The final version may differ from this version.JPET Fast Forward. Published on April 25, 2014 as DOI: 10.1124/jpet.114.214106
at ASPE
T Journals on A
pril 12, 2020jpet.aspetjournals.org
Dow
nloaded from
JPET #214106
40
Stieger B, Fattinger K, Madon J, Kullak-Ublick GA and Meier PJ (2000) Drug- and estrogen-
induced cholestasis through inhibition of the hepatocellular bile salt export pump (Bsep)
of rat liver. Gastroenterology 118:422-430.
Sütsch G, Kiowski W, Yan XW, Hunziker P, Christen S, Strobel W, Kim JH, Rickenbacher P
and Bertel O (1998) Short-term oral endothelin-receptor antagonist therapy in
conventionally treated patients with symptomatic severe chronic heart failure.
Circulation 98:2262-2268.
Treiber A, Schneiter R, Delahaye S and Clozel M (2004) Inhibition of organic anion
transporting polypeptide-mediated hepatic uptake is the major determinant in the
pharmacokinetic interaction between bosentan and cyclosporin A in the rat. J Pharmacol
Exp Ther 308:1121-1129.
Treiber A, Schneiter R, Hausler S and Stieger B (2007) Bosentan is a substrate of human
OATP1B1 and OATP1B3: inhibition of hepatic uptake as the common mechanism of its
interactions with cyclosporin A, rifampicin, and sildenafil. Drug Metab Dispos 35:1400-
1407.
Treijtel N, van Helvoort H, Barendregt A, Blaauboer BJ and van Eijkeren JC (2005) The use
of sandwich-cultured rat hepatocytes to determine the intrinsic clearance of compounds
with different extraction ratios: 7-ethoxycoumarin and warfarin. Drug Metab Dispos
33:1325-1332.
van Giersbergen PL, Halabi A and Dingemanse J (2002) Single- and multiple-dose
pharmacokinetics of bosentan and its interaction with ketoconazole. Br J Clin Pharmacol
53:589-595.
van Giersbergen PL, Treiber A, Schneiter R, Dietrich H and Dingemanse J (2007) Inhibitory
and inductive effects of rifampin on the pharmacokinetics of bosentan in healthy
subjects. Clin Pharmacol Ther 81:414-419.
This article has not been copyedited and formatted. The final version may differ from this version.JPET Fast Forward. Published on April 25, 2014 as DOI: 10.1124/jpet.114.214106
at ASPE
T Journals on A
pril 12, 2020jpet.aspetjournals.org
Dow
nloaded from

JPET #214106
41
Vavricka SR, Van Montfoort J, Ha HR, Meier PJ and Fattinger K (2002) Interactions of
rifamycin SV and rifampicin with organic anion uptake systems of human liver.
Hepatology 36:164-172.
Warner DJ, Chen H, Cantin LD, Kenna JG, Stahl S, Walker CL and Noeske T (2012)
Mitigating the inhibition of human bile salt export pump by drugs: opportunities
provided by physicochemical property modulation, in silico modeling, and structural
modification. Drug Metab Dispos 40:2332-2341.
Weber C, Gasser R and Hopfgartner G (1999) Absorption, excretion, and metabolism of the
endothelin receptor antagonist bosentan in healthy male subjects. Drug Metab Dispos
27:810-815.
Weiss J, Theile D, Ruppell MA, Speck T, Spalwisz A and Haefeli WE (2013) Interaction
profile of macitentan, a new non-selective endothelin-1 receptor antagonist, in vitro. Eur
J Pharmacol.
Wu C (2000) Recent discovery and development of endothelin receptor antagonists. Expt
Opin Ther Pat 10:1653-1668.
Yang J, Jamei M, Yeo KR, Tucker GT and Rostami-Hodjegan A (2007) Prediction of
intestinal first-pass drug metabolism. Curr Drug Metab 8:676-684.
FOOTNOTES
Contact for reprint requests: Alexander Treiber, Actelion Pharmaceuticals Ltd,
Gewerbestrasse 16, 4123 Allschwil, Switzerland, e-mail: [email protected]
This article has not been copyedited and formatted. The final version may differ from this version.JPET Fast Forward. Published on April 25, 2014 as DOI: 10.1124/jpet.114.214106
at ASPE
T Journals on A
pril 12, 2020jpet.aspetjournals.org
Dow
nloaded from
JPET #214106
42
LEGENDS TO FIGURES
Fig. 1 Inhibition of vesicular taurocholate uptake into membrane vesicles expressing human
BSEP by (A) macitentan and (B) ACT 132577. Data are mean ± SD of 3 replicates.
Data of one representative experiment are shown.
Fig. 2 Inhibition of taurocholate uptake into CHO cells expressing human NTCP by (A)
macitentan and (B) ACT-132577. Data are mean ± SD of 3 replicates. Data of one
representative experiment are shown.
Fig. 3 Net cellular uptake of macitentan in OATP1B3-expressing CHO cells. Data are mean
± SD of 3 replicates.
Fig. 4 Liver, portal vein and systemic plasma concentration-time profiles of macitentan and
ACT-132577 after (A, B, C) single and (D) repeat 10 mg oral dosing. Observed data
(panels A and B) from (Atsmon et al., 2013).
Fig. 5 Hepatic transport proteins involved in bile salt transport. NTCP as well as OATP1B1,
OATP1B3 and OATP2B1 are located at the basolateral membrane of hepatocytes and
facilitate the uptake of bile salts in liver cells. BSEP is located at the canalicular
membrane and promotes the exports of bile salts into bile canaliculi.
This article has not been copyedited and formatted. The final version may differ from this version.JPET Fast Forward. Published on April 25, 2014 as DOI: 10.1124/jpet.114.214106
at ASPE
T Journals on A
pril 12, 2020jpet.aspetjournals.org
Dow
nloaded from
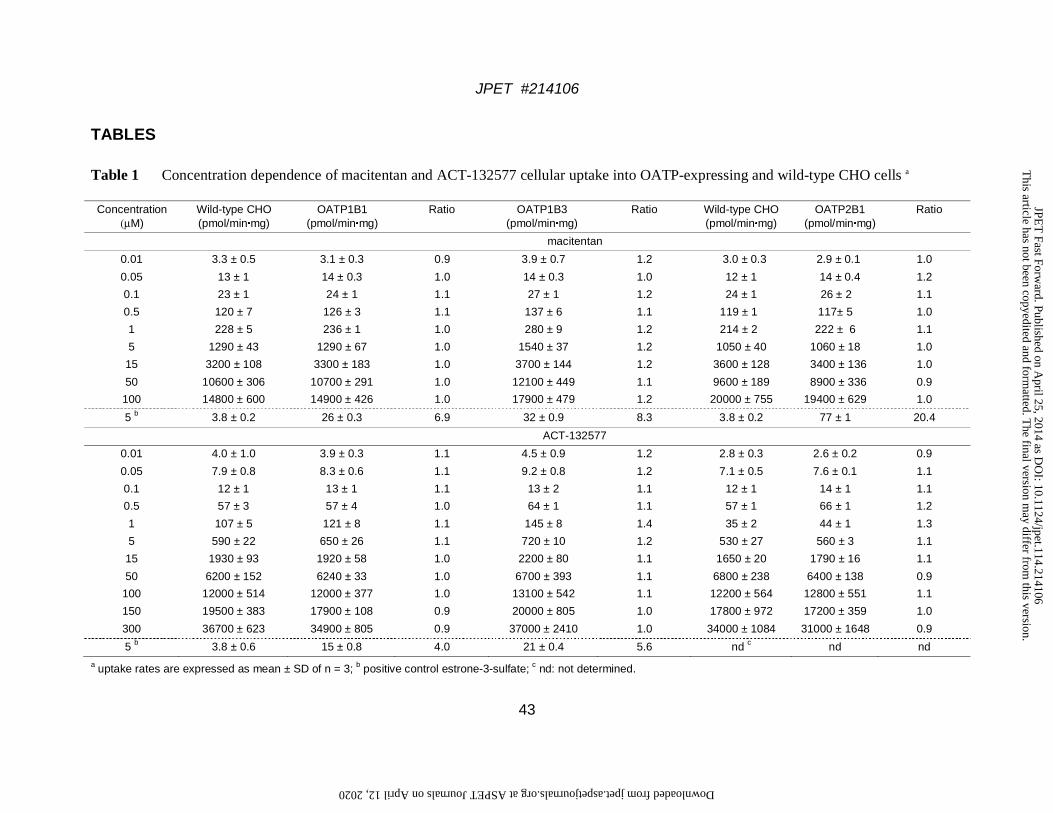
JPET #214106
43
TABLES
Table 1 Concentration dependence of macitentan and ACT-132577 cellular uptake into OATP-expressing and wild-type CHO cells a
Concentration (μM)
Wild-type CHO (pmol/min·mg)
OATP1B1 (pmol/min·mg)
Ratio OATP1B3 (pmol/min·mg)
Ratio Wild-type CHO (pmol/min·mg)
OATP2B1 (pmol/min·mg)
Ratio
macitentan
0.01 3.3 ± 0.5 3.1 ± 0.3 0.9 3.9 ± 0.7 1.2 3.0 ± 0.3 2.9 ± 0.1 1.0
0.05 13 ± 1 14 ± 0.3 1.0 14 ± 0.3 1.0 12 ± 1 14 ± 0.4 1.2
0.1 23 ± 1 24 ± 1 1.1 27 ± 1 1.2 24 ± 1 26 ± 2 1.1
0.5 120 ± 7 126 ± 3 1.1 137 ± 6 1.1 119 ± 1 117± 5 1.0
1 228 ± 5 236 ± 1 1.0 280 ± 9 1.2 214 ± 2 222 ± 6 1.1
5 1290 ± 43 1290 ± 67 1.0 1540 ± 37 1.2 1050 ± 40 1060 ± 18 1.0
15 3200 ± 108 3300 ± 183 1.0 3700 ± 144 1.2 3600 ± 128 3400 ± 136 1.0
50 10600 ± 306 10700 ± 291 1.0 12100 ± 449 1.1 9600 ± 189 8900 ± 336 0.9
100 14800 ± 600 14900 ± 426 1.0 17900 ± 479 1.2 20000 ± 755 19400 ± 629 1.0
5 b 3.8 ± 0.2 26 ± 0.3 6.9 32 ± 0.9 8.3 3.8 ± 0.2 77 ± 1 20.4
ACT-132577
0.01 4.0 ± 1.0 3.9 ± 0.3 1.1 4.5 ± 0.9 1.2 2.8 ± 0.3 2.6 ± 0.2 0.9
0.05 7.9 ± 0.8 8.3 ± 0.6 1.1 9.2 ± 0.8 1.2 7.1 ± 0.5 7.6 ± 0.1 1.1
0.1 12 ± 1 13 ± 1 1.1 13 ± 2 1.1 12 ± 1 14 ± 1 1.1
0.5 57 ± 3 57 ± 4 1.0 64 ± 1 1.1 57 ± 1 66 ± 1 1.2
1 107 ± 5 121 ± 8 1.1 145 ± 8 1.4 35 ± 2 44 ± 1 1.3
5 590 ± 22 650 ± 26 1.1 720 ± 10 1.2 530 ± 27 560 ± 3 1.1
15 1930 ± 93 1920 ± 58 1.0 2200 ± 80 1.1 1650 ± 20 1790 ± 16 1.1
50 6200 ± 152 6240 ± 33 1.0 6700 ± 393 1.1 6800 ± 238 6400 ± 138 0.9
100 12000 ± 514 12000 ± 377 1.0 13100 ± 542 1.1 12200 ± 564 12800 ± 551 1.1
150 19500 ± 383 17900 ± 108 0.9 20000 ± 805 1.0 17800 ± 972 17200 ± 359 1.0
300 36700 ± 623 34900 ± 805 0.9 37000 ± 2410 1.0 34000 ± 1084 31000 ± 1648 0.9
5 b 3.8 ± 0.6 15 ± 0.8 4.0 21 ± 0.4 5.6 nd c nd nd
a uptake rates are expressed as mean ± SD of n = 3; b positive control estrone-3-sulfate; c nd: not determined.
This article has not been copyedited and form
atted. The final version m
ay differ from this version.
JPET
Fast Forward. Published on A
pril 25, 2014 as DO
I: 10.1124/jpet.114.214106 at ASPET Journals on April 12, 2020 jpet.aspetjournals.org Downloaded from
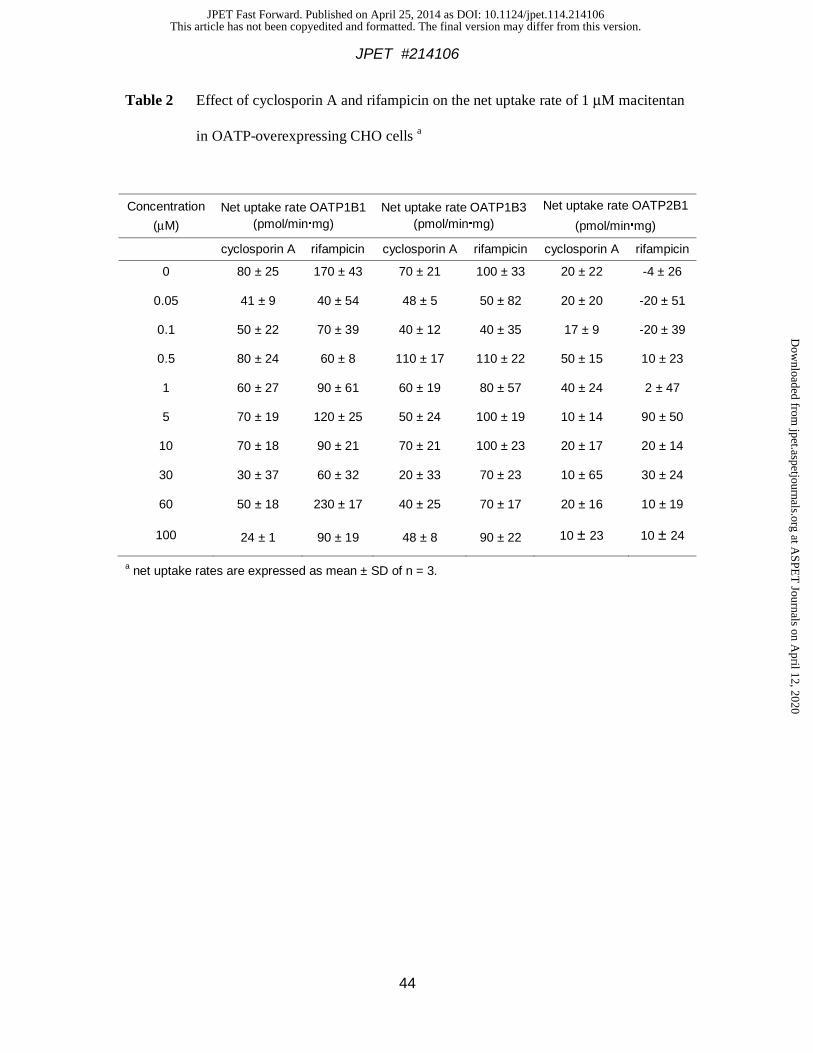
JPET #214106
44
Table 2 Effect of cyclosporin A and rifampicin on the net uptake rate of 1 μM macitentan
in OATP-overexpressing CHO cells a
Concentration
(μM) Net uptake rate OATP1B1
(pmol/min·mg) Net uptake rate OATP1B3
(pmol/min·mg)
Net uptake rate OATP2B1
(pmol/min·mg)
cyclosporin A rifampicin cyclosporin A rifampicin cyclosporin A rifampicin
0 80 ± 25 170 ± 43 70 ± 21 100 ± 33 20 ± 22 -4 ± 26
0.05 41 ± 9 40 ± 54 48 ± 5 50 ± 82 20 ± 20 -20 ± 51
0.1 50 ± 22 70 ± 39 40 ± 12 40 ± 35 17 ± 9 -20 ± 39
0.5 80 ± 24 60 ± 8 110 ± 17 110 ± 22 50 ± 15 10 ± 23
1 60 ± 27 90 ± 61 60 ± 19 80 ± 57 40 ± 24 2 ± 47
5 70 ± 19 120 ± 25 50 ± 24 100 ± 19 10 ± 14 90 ± 50
10 70 ± 18 90 ± 21 70 ± 21 100 ± 23 20 ± 17 20 ± 14
30 30 ± 37 60 ± 32 20 ± 33 70 ± 23 10 ± 65 30 ± 24
60 50 ± 18 230 ± 17 40 ± 25 70 ± 17 20 ± 16 10 ± 19
100 24 ± 1 90 ± 19 48 ± 8 90 ± 22 10 ± 23 10 ± 24
a net uptake rates are expressed as mean ± SD of n = 3.
This article has not been copyedited and formatted. The final version may differ from this version.JPET Fast Forward. Published on April 25, 2014 as DOI: 10.1124/jpet.114.214106
at ASPE
T Journals on A
pril 12, 2020jpet.aspetjournals.org
Dow
nloaded from

JPET #214106
45
Table 3 Concentration dependence of macitentan cellular uptake into NTCP-expressing
CHO Flp InTM cells a
Concentration
(μM)
NTCP without Na+
(pmol/min·mg)
NTCP with Na+
(pmol/min·mg)
Ratio
0.01 3.7 ± 0.3 3.4 ± 0.2 0.9
0.05 17 ± 1 18 ± 1 1.0
0.1 35 ± 1 33 ± 2 0.9
0.5 162 ± 4 168 ± 2 1.0
1 310 ± 12 324 ± 1 1.0
5 1520 ± 98 1500 ± 59 1.0
15 4270 ± 43 4500 ± 240 1.1
50 13800 ± 124 14000 ± 207 1.0
100 22500 ± 905 23500 ± 314 1.0
5 b 14 ± 4 310 ± 10 21
a uptake rates are expressed as mean ± SD of n = 3. b positive control taurocholic acid.
This article has not been copyedited and formatted. The final version may differ from this version.JPET Fast Forward. Published on April 25, 2014 as DOI: 10.1124/jpet.114.214106
at ASPE
T Journals on A
pril 12, 2020jpet.aspetjournals.org
Dow
nloaded from
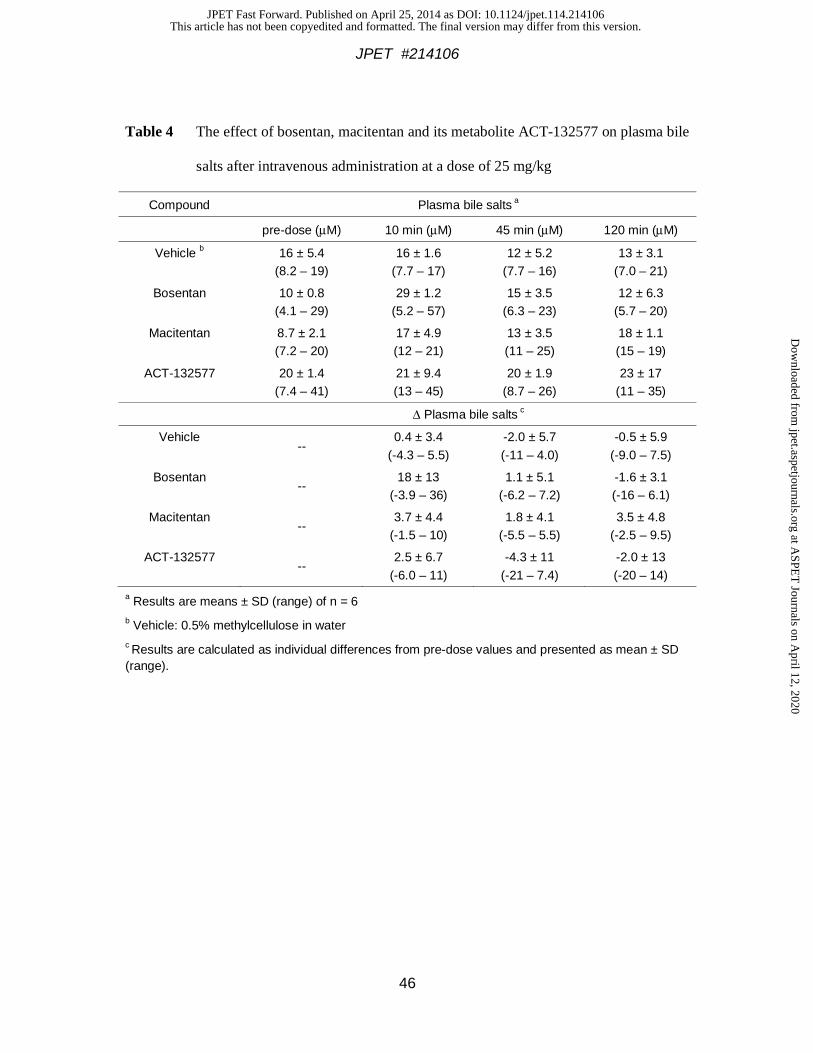
JPET #214106
46
Table 4 The effect of bosentan, macitentan and its metabolite ACT-132577 on plasma bile
salts after intravenous administration at a dose of 25 mg/kg
Compound Plasma bile salts a
pre-dose (μM) 10 min (μM) 45 min (μM) 120 min (μM)
Vehicle b 16 ± 5.4 (8.2 – 19)
16 ± 1.6 (7.7 – 17)
12 ± 5.2 (7.7 – 16)
13 ± 3.1 (7.0 – 21)
Bosentan 10 ± 0.8 (4.1 – 29)
29 ± 1.2 (5.2 – 57)
15 ± 3.5 (6.3 – 23)
12 ± 6.3 (5.7 – 20)
Macitentan 8.7 ± 2.1 (7.2 – 20)
17 ± 4.9 (12 – 21)
13 ± 3.5 (11 – 25)
18 ± 1.1 (15 – 19)
ACT-132577 20 ± 1.4 (7.4 – 41)
21 ± 9.4 (13 – 45)
20 ± 1.9 (8.7 – 26)
23 ± 17 (11 – 35)
Δ Plasma bile salts c
Vehicle --
0.4 ± 3.4 (-4.3 – 5.5)
-2.0 ± 5.7 (-11 – 4.0)
-0.5 ± 5.9 (-9.0 – 7.5)
Bosentan --
18 ± 13 (-3.9 – 36)
1.1 ± 5.1 (-6.2 – 7.2)
-1.6 ± 3.1 (-16 – 6.1)
Macitentan --
3.7 ± 4.4 (-1.5 – 10)
1.8 ± 4.1 (-5.5 – 5.5)
3.5 ± 4.8 (-2.5 – 9.5)
ACT-132577 --
2.5 ± 6.7 (-6.0 – 11)
-4.3 ± 11 (-21 – 7.4)
-2.0 ± 13 (-20 – 14)
a Results are means ± SD (range) of n = 6 b Vehicle: 0.5% methylcellulose in water c Results are calculated as individual differences from pre-dose values and presented as mean ± SD (range).
This article has not been copyedited and formatted. The final version may differ from this version.JPET Fast Forward. Published on April 25, 2014 as DOI: 10.1124/jpet.114.214106
at ASPE
T Journals on A
pril 12, 2020jpet.aspetjournals.org
Dow
nloaded from
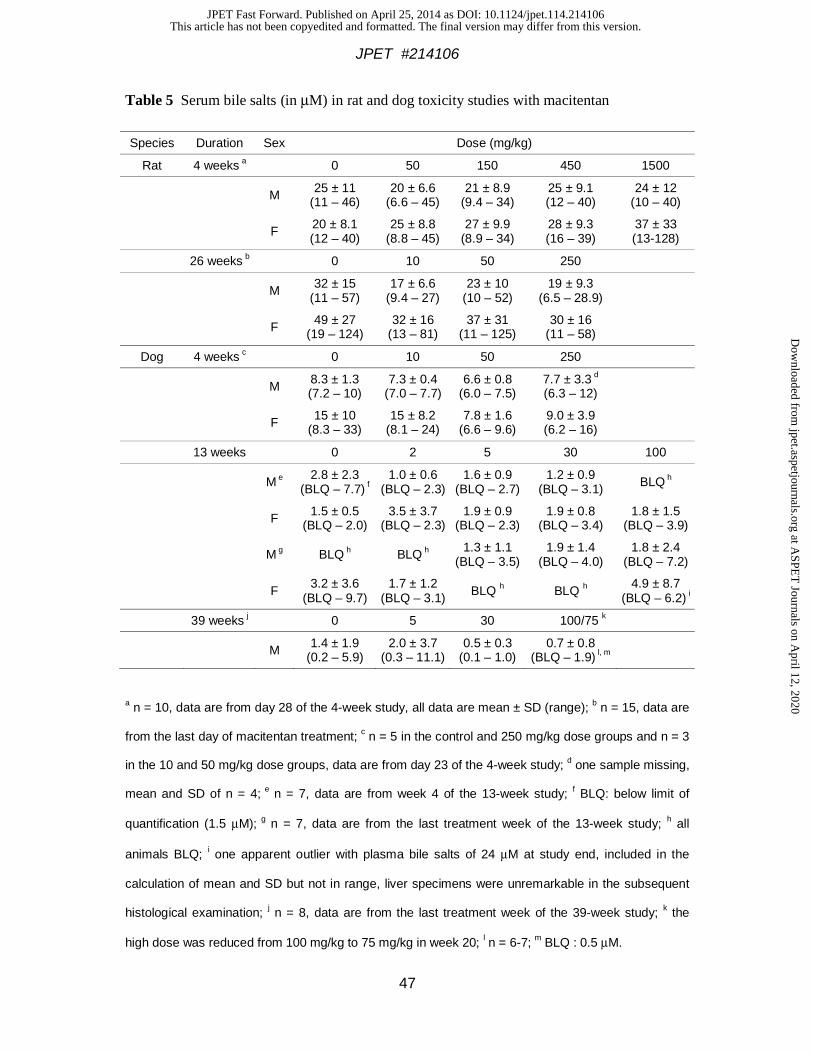
JPET #214106
47
Table 5 Serum bile salts (in μM) in rat and dog toxicity studies with macitentan
Species Duration Sex Dose (mg/kg)
Rat 4 weeks a 0 50 150 450 1500
M 25 ± 11 (11 – 46)
20 ± 6.6 (6.6 – 45)
21 ± 8.9 (9.4 – 34)
25 ± 9.1 (12 – 40)
24 ± 12 (10 – 40)
F 20 ± 8.1 (12 – 40)
25 ± 8.8 (8.8 – 45)
27 ± 9.9 (8.9 – 34)
28 ± 9.3 (16 – 39)
37 ± 33 (13-128)
26 weeks b 0 10 50 250
M 32 ± 15 (11 – 57)
17 ± 6.6 (9.4 – 27)
23 ± 10 (10 – 52)
19 ± 9.3 (6.5 – 28.9)
F 49 ± 27 (19 – 124)
32 ± 16 (13 – 81)
37 ± 31 (11 – 125)
30 ± 16 (11 – 58)
Dog 4 weeks c 0 10 50 250
M 8.3 ± 1.3 (7.2 – 10)
7.3 ± 0.4 (7.0 – 7.7)
6.6 ± 0.8 (6.0 – 7.5)
7.7 ± 3.3 d
(6.3 – 12)
F 15 ± 10 (8.3 – 33)
15 ± 8.2 (8.1 – 24)
7.8 ± 1.6 (6.6 – 9.6)
9.0 ± 3.9 (6.2 – 16)
13 weeks 0 2 5 30 100
M e 2.8 ± 2.3 (BLQ – 7.7) f
1.0 ± 0.6 (BLQ – 2.3)
1.6 ± 0.9 (BLQ – 2.7)
1.2 ± 0.9 (BLQ – 3.1) BLQ h
F 1.5 ± 0.5 (BLQ – 2.0)
3.5 ± 3.7 (BLQ – 2.3)
1.9 ± 0.9 (BLQ – 2.3)
1.9 ± 0.8 (BLQ – 3.4)
1.8 ± 1.5 (BLQ – 3.9)
M g BLQ h BLQ h 1.3 ± 1.1 (BLQ – 3.5)
1.9 ± 1.4 (BLQ – 4.0)
1.8 ± 2.4 (BLQ – 7.2)
F 3.2 ± 3.6
(BLQ – 9.7) 1.7 ± 1.2
(BLQ – 3.1) BLQ h BLQ h 4.9 ± 8.7
(BLQ – 6.2) i
39 weeks j 0 5 30 100/75 k
M 1.4 ± 1.9 (0.2 – 5.9)
2.0 ± 3.7 (0.3 – 11.1)
0.5 ± 0.3 (0.1 – 1.0)
0.7 ± 0.8 (BLQ – 1.9) l, m
a n = 10, data are from day 28 of the 4-week study, all data are mean ± SD (range); b n = 15, data are
from the last day of macitentan treatment; c n = 5 in the control and 250 mg/kg dose groups and n = 3
in the 10 and 50 mg/kg dose groups, data are from day 23 of the 4-week study; d one sample missing,
mean and SD of n = 4; e n = 7, data are from week 4 of the 13-week study; f BLQ: below limit of
quantification (1.5 μM); g n = 7, data are from the last treatment week of the 13-week study; h all
animals BLQ; i one apparent outlier with plasma bile salts of 24 μM at study end, included in the
calculation of mean and SD but not in range, liver specimens were unremarkable in the subsequent
histological examination; j n = 8, data are from the last treatment week of the 39-week study; k the
high dose was reduced from 100 mg/kg to 75 mg/kg in week 20; l n = 6-7; m BLQ : 0.5 μM.
This article has not been copyedited and formatted. The final version may differ from this version.JPET Fast Forward. Published on April 25, 2014 as DOI: 10.1124/jpet.114.214106
at ASPE
T Journals on A
pril 12, 2020jpet.aspetjournals.org
Dow
nloaded from
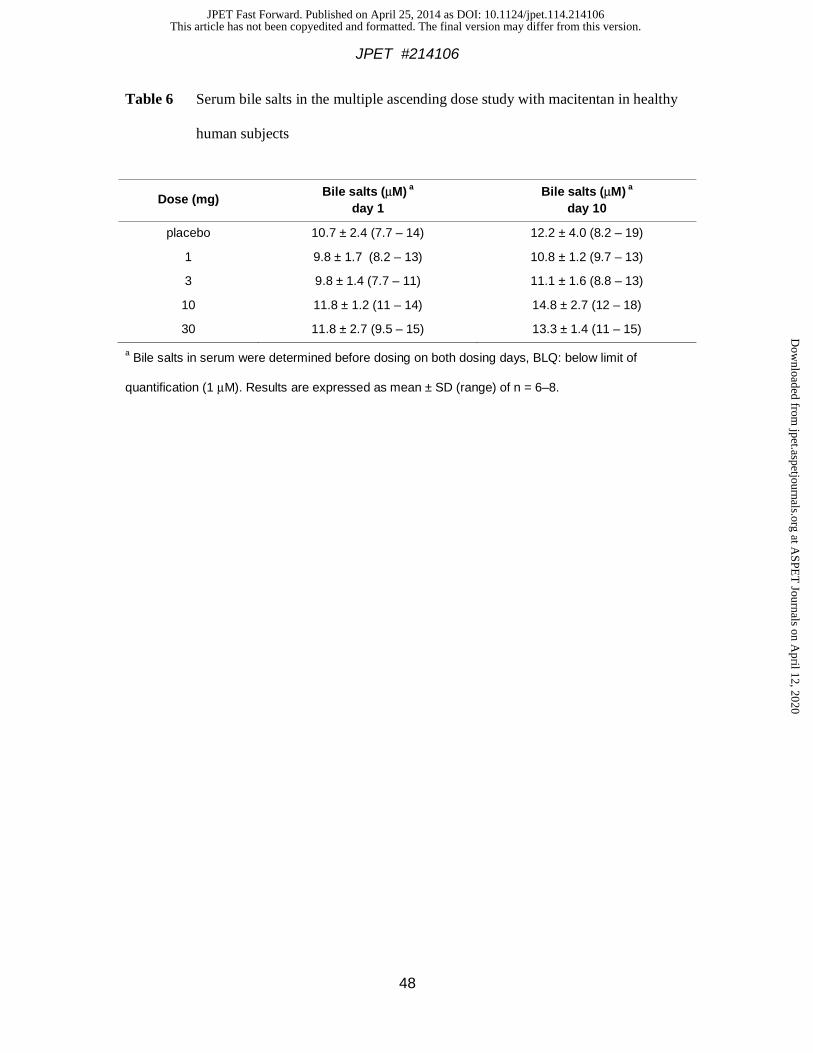
JPET #214106
48
Table 6 Serum bile salts in the multiple ascending dose study with macitentan in healthy
human subjects
Dose (mg) Bile salts (μM) a
day 1 Bile salts (μM) a
day 10
placebo 10.7 ± 2.4 (7.7 – 14) 12.2 ± 4.0 (8.2 – 19)
1 9.8 ± 1.7 (8.2 – 13) 10.8 ± 1.2 (9.7 – 13)
3 9.8 ± 1.4 (7.7 – 11) 11.1 ± 1.6 (8.8 – 13)
10 11.8 ± 1.2 (11 – 14) 14.8 ± 2.7 (12 – 18)
30 11.8 ± 2.7 (9.5 – 15) 13.3 ± 1.4 (11 – 15)
a Bile salts in serum were determined before dosing on both dosing days, BLQ: below limit of
quantification (1 μM). Results are expressed as mean ± SD (range) of n = 6–8.
This article has not been copyedited and formatted. The final version may differ from this version.JPET Fast Forward. Published on April 25, 2014 as DOI: 10.1124/jpet.114.214106
at ASPE
T Journals on A
pril 12, 2020jpet.aspetjournals.org
Dow
nloaded from
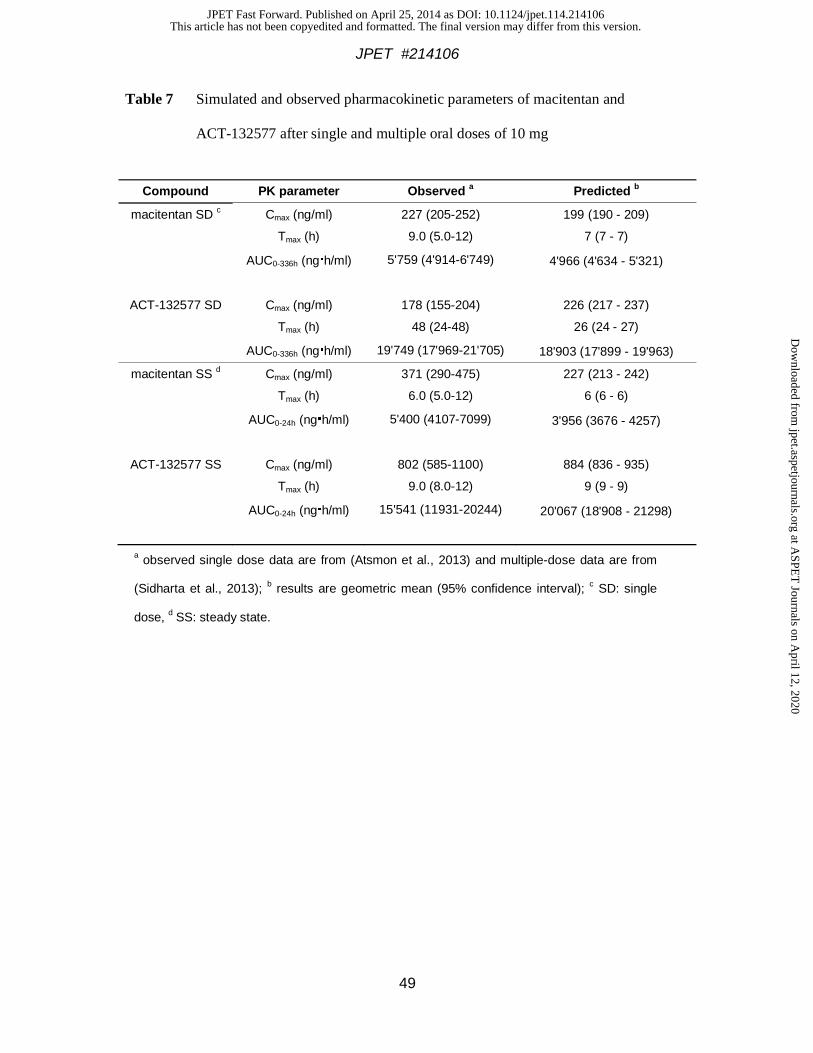
JPET #214106
49
Table 7 Simulated and observed pharmacokinetic parameters of macitentan and
ACT-132577 after single and multiple oral doses of 10 mg
Compound PK parameter Observed a Predicted b
macitentan SD c Cmax (ng/ml) 227 (205-252) 199 (190 - 209)
Tmax (h) 9.0 (5.0-12) 7 (7 - 7)
AUC0-336h (ng·h/ml) 5'759 (4'914-6'749) 4'966 (4'634 - 5'321)
ACT-132577 SD Cmax (ng/ml) 178 (155-204) 226 (217 - 237)
Tmax (h) 48 (24-48) 26 (24 - 27)
AUC0-336h (ng·h/ml) 19'749 (17'969-21'705) 18'903 (17'899 - 19'963)
macitentan SS d Cmax (ng/ml) 371 (290-475) 227 (213 - 242)
Tmax (h) 6.0 (5.0-12) 6 (6 - 6)
AUC0-24h (ng·h/ml) 5'400 (4107-7099) 3'956 (3676 - 4257)
ACT-132577 SS Cmax (ng/ml) 802 (585-1100) 884 (836 - 935)
Tmax (h) 9.0 (8.0-12) 9 (9 - 9)
AUC0-24h (ng·h/ml) 15'541 (11931-20244) 20'067 (18'908 - 21298)
a observed single dose data are from (Atsmon et al., 2013) and multiple-dose data are from
(Sidharta et al., 2013); b results are geometric mean (95% confidence interval); c SD: single
dose, d SS: steady state.
This article has not been copyedited and formatted. The final version may differ from this version.JPET Fast Forward. Published on April 25, 2014 as DOI: 10.1124/jpet.114.214106
at ASPE
T Journals on A
pril 12, 2020jpet.aspetjournals.org
Dow
nloaded from
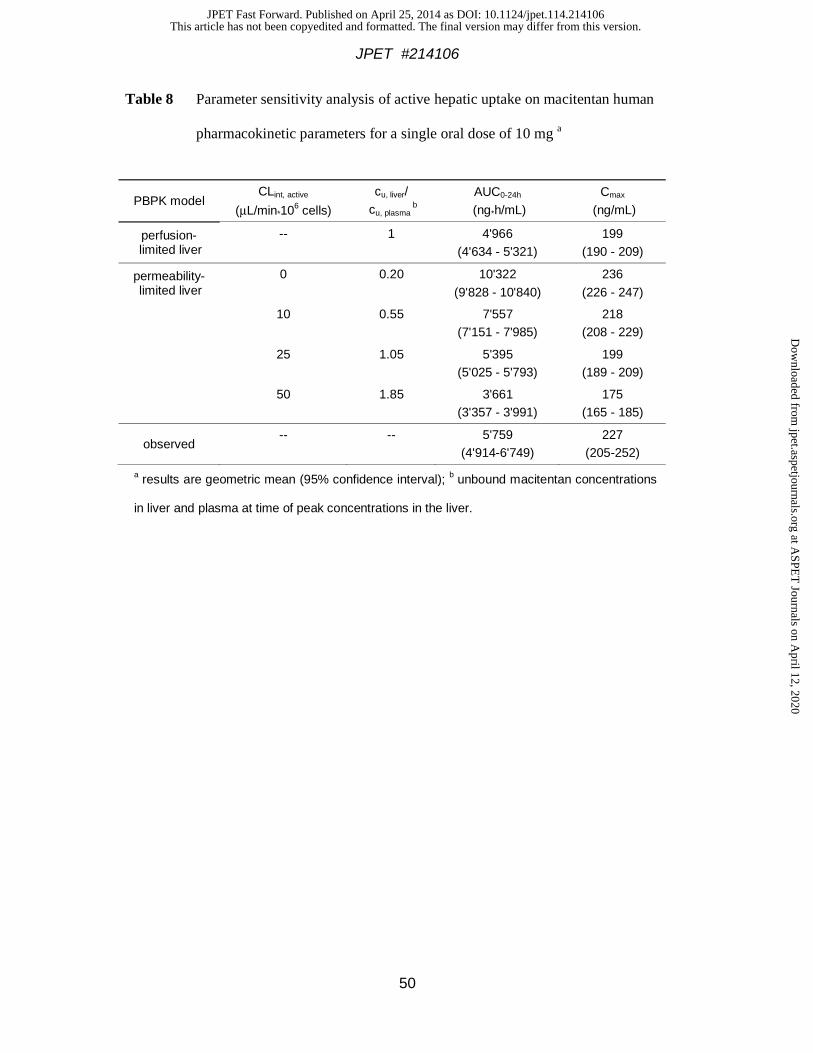
JPET #214106
50
Table 8 Parameter sensitivity analysis of active hepatic uptake on macitentan human
pharmacokinetic parameters for a single oral dose of 10 mg a
PBPK model CLint, active
(μL/min*106 cells)
cu, liver/ cu, plasma
b AUC0-24h
(ng*h/mL) Cmax
(ng/mL)
perfusion-limited liver
-- 1 4'966 (4'634 - 5'321)
199 (190 - 209)
permeability-limited liver
0 0.20 10'322 (9'828 - 10'840)
236 (226 - 247)
10 0.55 7'557
(7'151 - 7'985) 218
(208 - 229)
25 1.05 5'395
(5'025 - 5'793) 199
(189 - 209)
50 1.85 3'661
(3'357 - 3'991) 175
(165 - 185)
observed -- -- 5'759
(4'914-6'749) 227
(205-252)
a results are geometric mean (95% confidence interval); b unbound macitentan concentrations
in liver and plasma at time of peak concentrations in the liver.
This article has not been copyedited and formatted. The final version may differ from this version.JPET Fast Forward. Published on April 25, 2014 as DOI: 10.1124/jpet.114.214106
at ASPE
T Journals on A
pril 12, 2020jpet.aspetjournals.org
Dow
nloaded from
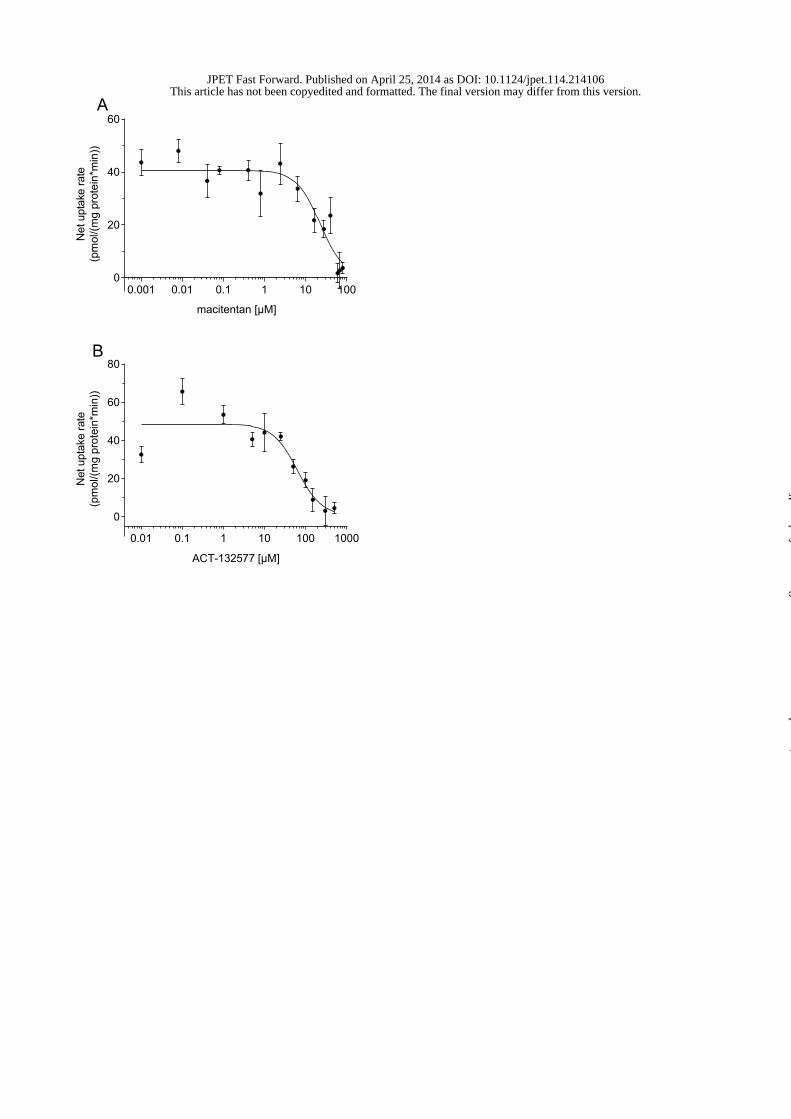
0.001 0.01 0.1 1 10 1000
20
40
60
macitentan8[µM]
Net
upta
kera
te(p
mol
/(m
gpr
otei
n*m
in))
A
0.01 0.1 1 10 100 1000
0
20
40
60
80
ACT-1325778[µM]
Net
upta
kera
te(p
mol
/(m
gpr
otei
n*m
in))
B
This article has not been copyedited and formatted. The final version may differ from this version.JPET Fast Forward. Published on April 25, 2014 as DOI: 10.1124/jpet.114.214106
at ASPE
T Journals on A
pril 12, 2020jpet.aspetjournals.org
Dow
nloaded from
gonzalc
Typewritten Text
gonzalc
Typewritten Text
gonzalc
Typewritten Text
gonzalc
Typewritten Text
gonzalc
Typewritten Text
gonzalc
Typewritten Text
gonzalc
Typewritten Text
gonzalc
Typewritten Text
gonzalc
Typewritten Text
Figure 1
gonzalc
Typewritten Text
gonzalc
Typewritten Text
gonzalc
Typewritten Text
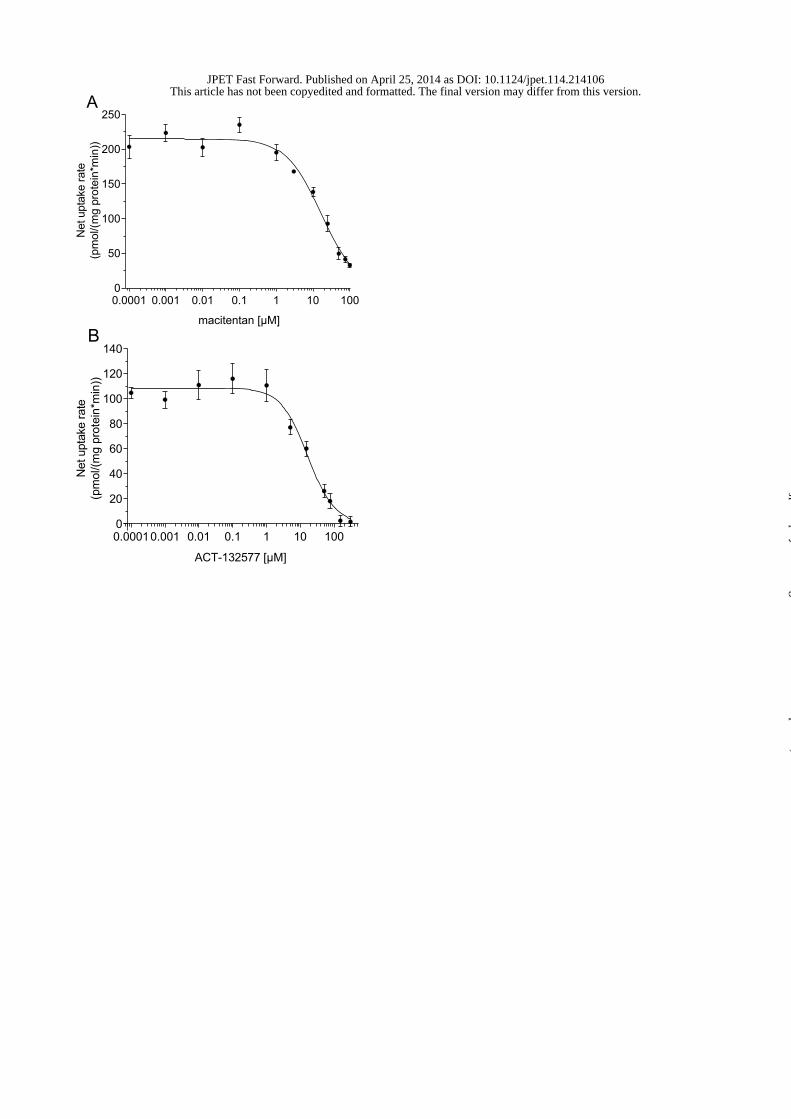
0.0001 0.001 0.01 0.1 1 10 1000
50
100
150
200
250
macitentan6[µM]
Net
upta
kera
te(p
mol
/(m
gpr
otei
n*m
in))
A
0.00010.001 0.01 0.1 1 10 1000
20
40
60
80
100
120
140
ACT-1325776[µM]
Net
upta
kera
te(p
mol
/(m
gpr
otei
n*m
in))
B
This article has not been copyedited and formatted. The final version may differ from this version.JPET Fast Forward. Published on April 25, 2014 as DOI: 10.1124/jpet.114.214106
at ASPE
T Journals on A
pril 12, 2020jpet.aspetjournals.org
Dow
nloaded from
gonzalc
Typewritten Text
Figure 2
gonzalc
Typewritten Text
gonzalc
Typewritten Text
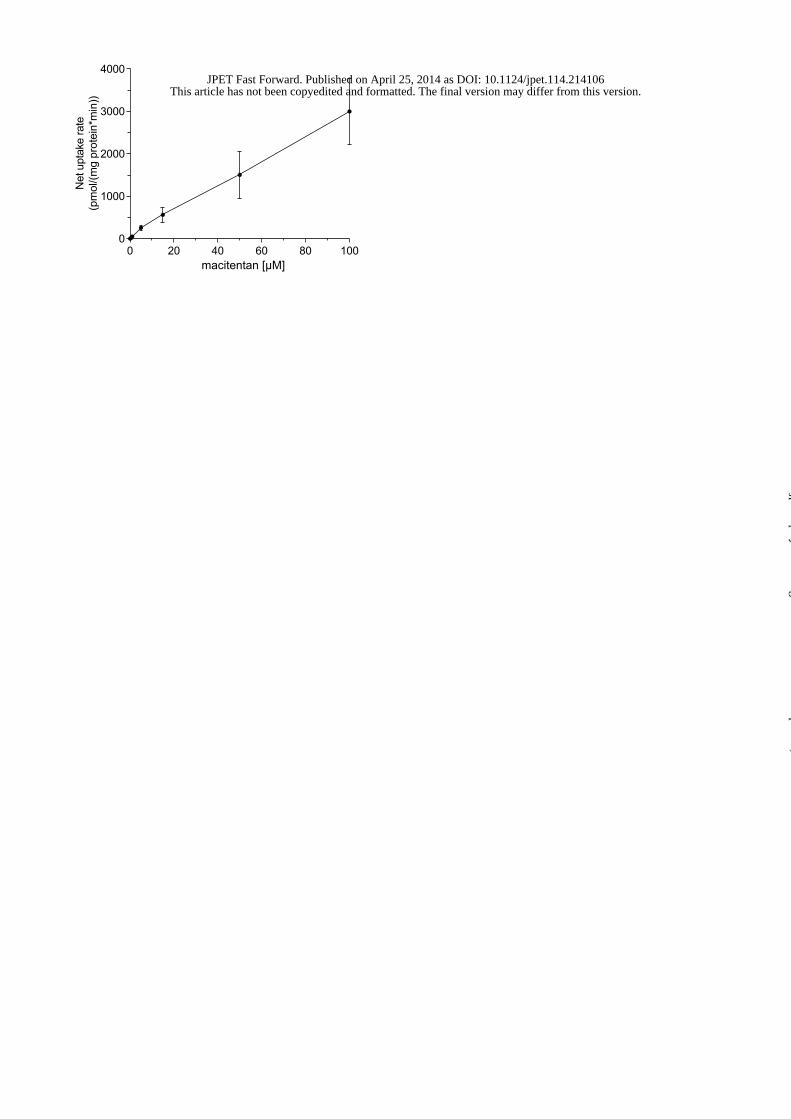
0 20 40 60 80 1000
1000
2000
3000
4000
macitentan [µM]
Net
upta
kera
te(p
mol
/(m
gpr
otei
n*m
in))
This article has not been copyedited and formatted. The final version may differ from this version.JPET Fast Forward. Published on April 25, 2014 as DOI: 10.1124/jpet.114.214106
at ASPE
T Journals on A
pril 12, 2020jpet.aspetjournals.org
Dow
nloaded from
gonzalc
Typewritten Text
Figure 3
gonzalc
Typewritten Text
gonzalc
Typewritten Text
gonzalc
Typewritten Text
gonzalc
Typewritten Text

0
50
100
150
200
250
300
350
0 24 48 72 96 120 144 168 192 216
Syst
em
ic1C
on
cen
trat
ion
1(n
g/m
L)
Time1(h)
A:1mean1predicted1(line)1and1observed1(dots)1plasmaconcentration-time1profile1of1macitentan
0
50
100
150
200
250
300
0 24 48 72 96 120 144 168 192 216
Syst
em
ic1C
on
cen
trat
ion
1(n
g/m
L)
Time1(h)
B:1mean1predicted1(line)1and1observed1(dots)1plasmaconcentration-time1profile1of1ACT-132577
liver macitentan
liver ACT-132577
0
50
100
150
200
250
0 24 48 72 96 120 144 168 192 216
Co
nce
ntr
atio
n1(
ng/
mL)
Time1(h)
C:1predicted1single-dose1macitentan1and1ACT-132577
0
100
200
300
400
500
600
700
800
900
1000
0 6 12 18 24
Co
nce
ntr
atio
n1(
ng/
mL)
Time1(h)
D:1predicted1multiple-dose1macitentan1and1ACT-132577
plasma macitentan
plasma ACT-132577
portal vein macitentan
portal vein ACT-132577
This article has not been copyedited and formatted. The final version may differ from this version.JPET Fast Forward. Published on April 25, 2014 as DOI: 10.1124/jpet.114.214106
at ASPE
T Journals on A
pril 12, 2020jpet.aspetjournals.org
Dow
nloaded from
gonzalc
Typewritten Text
gonzalc
Typewritten Text
gonzalc
Typewritten Text
Figure 4
gonzalc
Typewritten Text
gonzalc
Typewritten Text
gonzalc
Typewritten Text
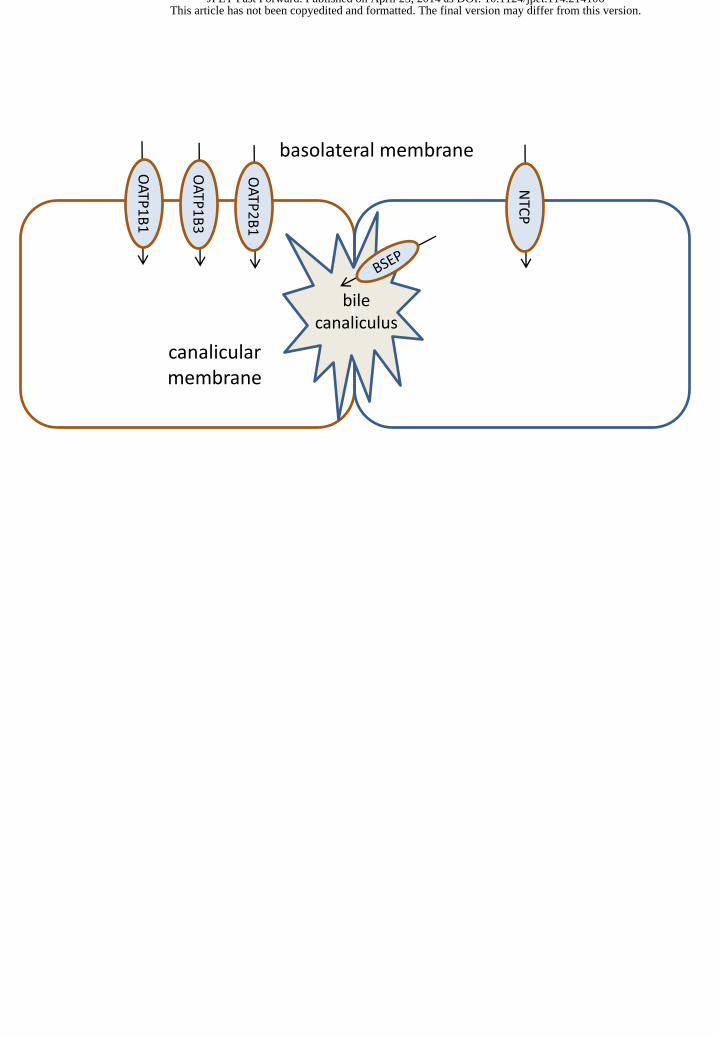
Have a nice day and see you on Monday.
Have a nice day and see you on Monday.
l
basolateral membrane
bile canaliculus
canalicular membrane
This article has not been copyedited and formatted. The final version may differ from this version.JPET Fast Forward. Published on April 25, 2014 as DOI: 10.1124/jpet.114.214106
at ASPE
T Journals on A
pril 12, 2020jpet.aspetjournals.org
Dow
nloaded from
gonzalc
Typewritten Text
Figure 5
gonzalc
Typewritten Text
gonzalc
Typewritten Text