MACC regional multi-model ensemble simulations of … · MACC regional multi-model ensemble...
16
Atmos. Chem. Phys., 15, 8115–8130, 2015 www.atmos-chem-phys.net/15/8115/2015/ doi:10.5194/acp-15-8115-2015 © Author(s) 2015. CC Attribution 3.0 License. MACC regional multi-model ensemble simulations of birch pollen dispersion in Europe M. Sofiev 1 , U. Berger 2 , M. Prank 1 , J. Vira 1 , J. Arteta 5 , J. Belmonte 3 , K.-C. Bergmann 4 , F. Chéroux 5 , H. Elbern 6 , E. Friese 6 , C. Galan 7 , R. Gehrig 8 , D. Khvorostyanov 9 , R. Kranenburg 10 , U. Kumar 11 , V. Marécal 5 , F. Meleux 12 , L. Menut 9 , A.-M. Pessi 13 , L. Robertson 14 , O. Ritenberga 15 , V. Rodinkova 16 , A. Saarto 13 , A. Segers 10 , E. Severova 17 , I. Sauliene 18 , P. Siljamo 1 , B. M. Steensen 19 , E. Teinemaa 20 , M. Thibaudon 21 , and V.-H. Peuch 22 1 Finnish Meteorological Institute, Erik Palmenin Aukio 1, Helsinki, Finland 2 Medical University of Vienna, Vienna, Austria 3 Institut de Ciència i Tecnologia Ambientals, Universitat Autònoma de Barcelona, Barcelona, Spain 4 Foundation German Pollen Information Service, Berlin, Germany 5 Groupe d’Étude de l’Atmosphère Méréorologique/Centre National de Recherches Météorologiques, CNRS-Météo-France, Toulouse, France 6 Rhenish Institute for Environmental Research at the University of Cologne, Cologne, Germany 7 University of Cordoba, Cordoba, Spain 8 Federal Office of Meteorology and Climatology Meteo Swiss, Zurich, Switzerland 9 Laboratoire de Météorologie Dynamique, CNRS, Ecole Polytechnique, Ecole Normale Supérieure, Université P.M. Curie, Ecole Nationale des Ponts et Chaussées, Palaiseau, France 10 TNO, Utrecht, the Netherlands 11 Royal Netherlands Meteorological Institute, De Bilt, the Netherlands 12 INERIS, Institut National de l’Environnement Industriel et des Risques, Verneuil en Halatte, France 13 University of Turku, Turku, Finland 14 SMHI, Swedish Meteorological and Hydrological Institute, Norrköping, Sweden 15 University of Latvia, Riga, Latvia 16 VNMU, Vinnitsa National Medical University, Vinnitsa, Ukraine 17 Moscow State University, Moscow, Russia 18 Siauliai University, Siauliai, Lithuania 19 MET Norway, Oslo, Norway 20 Estonian Environmental Research Centre, Tallinn, Estonia 21 RNSA, Brussieu, France 22 European Centre of Medium-Range Weather Forecast, Reading, UK Correspondence to: M. Sofiev (mikhail.sofiev@fmi.fi) Received: 30 December 2014 – Published in Atmos. Chem. Phys. Discuss.: 18 March 2015 Revised: 29 June 2015 – Accepted: 2 July 2015 – Published: 23 July 2015 Abstract. This paper presents the first ensemble modelling experiment in relation to birch pollen in Europe. The seven- model European ensemble of MACC-ENS, tested in trial simulations over the flowering season of 2010, was run through the flowering season of 2013. The simulations have been compared with observations in 11 countries, all mem- bers of the European Aeroallergen Network, for both individ- ual models and the ensemble mean and median. It is shown that the models successfully reproduced the timing of the very late season of 2013, generally within a couple of days from the observed start of the season. The end of the sea- son was generally predicted later than observed, by 5 days or more, which is a known feature of the source term used in the study. Absolute pollen concentrations during the sea- Published by Copernicus Publications on behalf of the European Geosciences Union.
Transcript of MACC regional multi-model ensemble simulations of … · MACC regional multi-model ensemble...
Atmos. Chem. Phys., 15, 8115–8130, 2015
www.atmos-chem-phys.net/15/8115/2015/
doi:10.5194/acp-15-8115-2015
© Author(s) 2015. CC Attribution 3.0 License.
MACC regional multi-model ensemble simulations of birch pollen
dispersion in Europe
M. Sofiev1, U. Berger2, M. Prank1, J. Vira1, J. Arteta5, J. Belmonte3, K.-C. Bergmann4, F. Chéroux5, H. Elbern6,
E. Friese6, C. Galan7, R. Gehrig8, D. Khvorostyanov9, R. Kranenburg10, U. Kumar11, V. Marécal5, F. Meleux12,
L. Menut9, A.-M. Pessi13, L. Robertson14, O. Ritenberga15, V. Rodinkova16, A. Saarto13, A. Segers10, E. Severova17,
I. Sauliene18, P. Siljamo1, B. M. Steensen19, E. Teinemaa20, M. Thibaudon21, and V.-H. Peuch22
1Finnish Meteorological Institute, Erik Palmenin Aukio 1, Helsinki, Finland2Medical University of Vienna, Vienna, Austria3Institut de Ciència i Tecnologia Ambientals, Universitat Autònoma de Barcelona, Barcelona, Spain4Foundation German Pollen Information Service, Berlin, Germany5Groupe d’Étude de l’Atmosphère Méréorologique/Centre National de Recherches Météorologiques,
CNRS-Météo-France, Toulouse, France6Rhenish Institute for Environmental Research at the University of Cologne, Cologne, Germany7University of Cordoba, Cordoba, Spain8Federal Office of Meteorology and Climatology Meteo Swiss, Zurich, Switzerland9Laboratoire de Météorologie Dynamique, CNRS, Ecole Polytechnique, Ecole Normale Supérieure, Université P.M. Curie,
Ecole Nationale des Ponts et Chaussées, Palaiseau, France10TNO, Utrecht, the Netherlands11Royal Netherlands Meteorological Institute, De Bilt, the Netherlands12INERIS, Institut National de l’Environnement Industriel et des Risques, Verneuil en Halatte, France13University of Turku, Turku, Finland14SMHI, Swedish Meteorological and Hydrological Institute, Norrköping, Sweden15University of Latvia, Riga, Latvia16VNMU, Vinnitsa National Medical University, Vinnitsa, Ukraine17Moscow State University, Moscow, Russia18Siauliai University, Siauliai, Lithuania19MET Norway, Oslo, Norway20Estonian Environmental Research Centre, Tallinn, Estonia21RNSA, Brussieu, France22European Centre of Medium-Range Weather Forecast, Reading, UK
Correspondence to: M. Sofiev ([email protected])
Received: 30 December 2014 – Published in Atmos. Chem. Phys. Discuss.: 18 March 2015
Revised: 29 June 2015 – Accepted: 2 July 2015 – Published: 23 July 2015
Abstract. This paper presents the first ensemble modelling
experiment in relation to birch pollen in Europe. The seven-
model European ensemble of MACC-ENS, tested in trial
simulations over the flowering season of 2010, was run
through the flowering season of 2013. The simulations have
been compared with observations in 11 countries, all mem-
bers of the European Aeroallergen Network, for both individ-
ual models and the ensemble mean and median. It is shown
that the models successfully reproduced the timing of the
very late season of 2013, generally within a couple of days
from the observed start of the season. The end of the sea-
son was generally predicted later than observed, by 5 days
or more, which is a known feature of the source term used
in the study. Absolute pollen concentrations during the sea-
Published by Copernicus Publications on behalf of the European Geosciences Union.
8116 M. Sofiev et al.: MACC regional multi-model ensemble simulations of birch pollen dispersion
son were somewhat underestimated in the southern part of
the birch habitat. In the northern part of Europe, a record-
low pollen season was strongly overestimated by all mod-
els. The median of the multi-model ensemble demonstrated
robust performance, successfully eliminating the impact of
outliers, which was particularly useful since for most models
this was the first experience of pollen forecasting.
1 Introduction
During the last 30 years, the prevalence of airborne allergy
and asthma in Europe has increased 4-fold, reaching 15–
40 % of the population. According to the European Fed-
eration of Allergy and Airway Diseases Patients Associa-
tions, 80 million (24.4 %) adults living in Europe are allergic.
The allergy prevalence in children is 30–40 % and increasing
(Laatikainen et al., 2011; Rönmark et al., 2009). Allergy to
various types of pollen in the air, exacerbated by co-exposure
to chemical pollutants and fine aerosols, is the number one
chronic disease in Europe, overshadowing allergy to house
dust mite and affecting over 20 % of the population (Bous-
quet et al., 2007).
Among the allergenic plants, grass and birch pollen af-
fect about 40 and 25 % of all hay fever sufferers in Eu-
rope respectively (Heinzerling et al., 2009). Birch is a strong
allergy-provoking tree with a population-wide sensitisation
of approximately 15 % (WHO, 2003). The distribution of
silver birch (Betula pendula Roth.) and downy birch (B.
pubescens L.) extends from mountains in the temperate cli-
mate of southern Europe to Fennoscandia and Siberia (Atkin-
son, 1992; OECD, 2003).
It has long been known that the bulk of pollen is de-
posited near the source plant (Raynor et al., 1970; Tampieri
et al., 1977; Wright, 1953, 1952). However, birches, as well
as other species (Alnus, Carpinus, Corylus, Ostrya, Fagus,
Quercus, Castanea) belonging to the order Fagales, are wind-
pollinated trees generating vast amounts of pollen to en-
sure a sufficient level of fertilisation of female flowers over
receptor regions. Their pollen grains are sufficiently small
and light to facilitate the atmospheric transport of up to 1 %
of the released material over thousands of kilometres when
weather conditions are suitable (Sofiev et al., 2006a). This
phenomenon was noticed in the middle of the twentieth cen-
tury (Erdtman, 1937, 1935, 1931; Gregory, 1961). Later, it
was recognised that the long-range transported pollen can
have a substantial health impact (Viander and Koivikko,
1978) and facilitate a large-scale redistribution of genetic
material (Lindgren et al., 1995). Long-range transport of
pollen is practically unpredictable with local observations or
statistical models. However, up until the last 2 decades no
practical instruments had been developed for its quantitative
evaluation and forecasting.
Starting from the 1990s, episodes of pollen dispersion on
regional and continental scales have been addressed in nu-
merous studies (Belmonte et al., 2000; Corden et al., 2002;
Damialis and Gioulekas, 2005; Hjelmroos, 1992; Latalova
et al., 2002; Mahura et al., 2007; Ranta and Satri, 2007;
Ranta et al., 2011; Rantio-Lehtimaki, 1994; Siljamo et al.,
2008c; Skjøth et al., 2008; Sofiev et al., 2012b, 2006a; Yli-
Panula et al., 2009; see also reviews by Smith et al., 2014, and
Sofiev and Bergmann, 2013). It was shown that, although the
features of each specific long-range transport episode vary
widely, there may be a systematic pattern in the springtime
pollen redistribution in Europe with prevailing transport di-
rections, main source and receptor regions, etc. There have
been several attempts to reveal such a pattern via a multi-
annual analysis (Damialis and Gioulekas, 2005; Siljamo et
al., 2008a, c, 2006; Skjøth et al., 2009, 2007; Smith et al.,
2008; Sofiev et al., 2006a; Stach et al., 2007; Yli-Panula et
al., 2009) but the picture is still largely incomplete.
The main tool for analysing the pollen distribution on re-
gional and continental scales is numerical modelling that
combines phenological models covering pollen maturation
and presentation (the pollen source term) with the atmo-
spheric dispersion model. Currently, there exist four com-
paratively independent formulations of the source terms for
birch pollen. The European-scale source term used in the cur-
rent study was developed for the SILAM model (http://silam.
fmi.fi) by an international consortium within the scope of the
POLLEN project of the Academy of Finland (Siljamo et al.,
2012; Sofiev et al., 2012a). Various versions of the model
have been used for forecasts of pollen distribution in Europe
starting from 2005 (Sofiev et al., 2006a) and reanalysis of the
flowering seasons back to 1997 (Siljamo et al., 2008c; Veri-
ankaite et al., 2010). The COSMO-ART birch module was
developed at the University of Karlsruhe (Helbig et al., 2004;
Vogel et al., 2008) and MeteoSwiss (Pauling et al., 2012;
Zink et al., 2013) and is currently used for pollen forecasting
for central and south-western Europe. Development is also
going on in Denmark with the regional ENVIRO-HIRLAM
system (Mahura et al., 2009) applied for forecasting over
northern Europe. Finally, combining the COSMO-ART and
SILAM source terms, Efstathiou et al. (2011) developed a
regional-scale model for the USA and applied it to birch and
ragweed.
MACC (Monitoring of Atmospheric Composition and Cli-
mate, http://www.gmes-atmosphere.eu) pollen simulations
are based on the SILAM source term. Its formulations and
input data have been shared among the seven regional mod-
elling teams of MACC and, in co-operation with the Eu-
ropean Aeroallergen Network (EAN), set into operational
multi-model ensemble forecasting of birch pollen in Europe.
The goal of the current paper is to present and evaluate
the results of the first ensemble modelling of birch pollen in
Europe during the season of 2013.
The next section will present the models and setup of the
simulations as well as the observation data used for evalua-
tion of the model predictions. The results section will present
the outcome of the simulations and the quality scores of the
Atmos. Chem. Phys., 15, 8115–8130, 2015 www.atmos-chem-phys.net/15/8115/2015/
M. Sofiev et al.: MACC regional multi-model ensemble simulations of birch pollen dispersion 8117
individual models and the ensemble. The discussion section
will be dedicated to analysis of the results, considerations of
the efficiency of the multi-model ensemble for pollen, and
identification of the most pressing development needs.
2 Materials and methods
This section presents the regional models used in the study,
outlines the birch pollen source term implemented in all of
them, and introduces the pollen observations used for evalu-
ation of the model predictions.
2.1 Dispersion models
The dispersion models used in the study comprise the
MACC-II European ensemble, which is described in detail
in Marécal et al. (2015). In the following, only the model
features relevant for the pollen atmospheric transport calcu-
lations are described.
The ensemble consisted of seven models.
– CHIMERE (http://www.lmd.polytechnique.fr/chimere/)
is an Eulerian regional-scale chemistry-transport model
for gaseous and aerosol species (Menut et al., 2013).
Pollen is implemented as a special aerosol with a pre-
scribed species-specific size (currently birch or rag-
weed) between 20 and 22 µm and density of 800 and
1050 kg m−3 respectively. The resulting gravitational
settling velocity is 1.2–1.3 cm s−1. The transport pro-
cesses affecting pollens, such as advection, turbulent
mixing, and wet deposition, are implemented in the
same way as for other aerosols. Dry deposition is de-
scribed via gravitational settling only, which dominates
for pollens (Sofiev et al., 2006a), whereas resuspension
is parameterized following Helbig et al. (2004).
– EMEP model of EMEP/MSC-W (European Monitor-
ing and Evaluation Programme/Meteorological Synthe-
sizing Centre – West) is a chemical transport model
developed at the Norwegian Meteorological Institute
and described in Simpson et al. (2012). It is flexible
with respect to the choice of projection and grid reso-
lution. Dry deposition is handled in the lowest model
layer. A resistance analogy formulation is used to de-
scribe dry deposition of gases, whereas for aerosols
the mass-conservation equation is adopted from Venka-
tram (1978) with the dry deposition velocities depen-
dent on the land use type. Wet scavenging is depen-
dent on precipitation intensity and is treated differently
within and below clouds. The below-cloud scavenging
rates for particles are calculated based on Scott (1979).
The rates are size dependent, growing for larger parti-
cles.
– EURAD-IM (http://www.eurad.uni-koeln.de) is an Eu-
lerian mesoscale chemistry transport model involving
advection, diffusion, chemical transformation, wet and
dry deposition, and sedimentation of tropospheric trace
gases and aerosols (Hass et al., 1995; Memmesheimer
et al., 2004). It includes 3D-VAR and 4D-VAR chem-
ical data assimilation (Elbern et al., 2007) and is able
to run in nesting mode. The positive definite advection
scheme of Bott (1989) is used to solve the advective
transport and the aerosol sedimentation. An eddy dif-
fusion approach is applied to parameterize the vertical
sub-grid-scale turbulent transport (Holtslag and Nieuw-
stadt, 1986). Dry deposition of aerosol species is treated
as size dependent using the resistance model of Petroff
and Zhang (2010). Wet deposition of pollen is parame-
terized according to Baklanov and Sorensen (2001).
– LOTOS-EUROS (http://www.lotos-euros.nl/) is an Eu-
lerian chemical transport model (Schaap et al., 2008).
The advection scheme follows Walcek and Alek-
sic (1998). The dry deposition scheme of Zhang et
al. (2001) is used to describe the surface uptake of
aerosols. Below-cloud scavenging is described using
simple scavenging coefficients for particles (Simpson et
al., 2003).
– MATCH (http://www.smhi.se/en/research/research-
departments/air-quality/match-transport-and-
chemistry-model-1.6831) is an Eulerian multi-scale
chemical transport model with mass-conservative
transport and diffusion based on a Bott-type advection
scheme (Langner et al., 1998; Robertson and Langner,
1999). For birch pollen, dry deposition is mainly
treated by sedimentation and a simplified wet scav-
enging scheme is applied. The temperature sum from
March onwards, driving the birch pollen emission, is
determined outside the model and fed into the emission
module.
– MOCAGE (http://www.cnrm.meteo.fr/gmgec-old/site_
engl/mocage/mocage_en.html) is a multi-scale disper-
sion model with grid-nesting capability (Josse et al.,
2004; Martet et al., 2009). The semi-Lagrangian advec-
tion scheme of Williamson and Rasch (1989) is used
for the grid-scale transport. The convective transport is
based on the parameterization proposed by Bechtold et
al. (2001) whereas the turbulent diffusion follows the
parameterization of Louis (1979). Dry deposition in-
cluding the sedimentation scheme follows Seinfeld and
Pandis (1998). The wet deposition by the convective and
stratiform precipitations is based on Giorgi and Chamei-
des (1986).
– SILAM (http://silam.fmi.fi) is a meso-to-global-scale
dispersion model (Sofiev et al., 2008; see also the
review by Kukkonen et al., 2012). The Eulerian
advection–diffusion core used in this study is based on
the algorithms of Galperin (2000) and Sofiev (2002).
www.atmos-chem-phys.net/15/8115/2015/ Atmos. Chem. Phys., 15, 8115–8130, 2015
8118 M. Sofiev et al.: MACC regional multi-model ensemble simulations of birch pollen dispersion
The dry deposition scheme (Kouznetsov and Sofiev,
2012) is applicable for a wide range of particle sizes
including coarse aerosols, which are primarily removed
by sedimentation. The wet deposition parameterization
distinguishes between sub- and in-cloud scavenging by
both rain and snow (Sofiev et al., 2006b). For coarse
particles, impaction scavenging is dominant below the
cloud. The model is capable of 3D- and 4D-VAR data
assimilation (Vira and Sofiev, 2012), also applicable to
birch.
– ENSEMBLE models were generated by the arithmetic
average and median calculated from seven model fields
for each hour.
2.2 Birch pollen source term
All models of this study are equipped with the same birch
pollen source term (Sofiev et al., 2012) verified for the sea-
son of 2006 by Siljamo et al. (2012). The formulations and
input data are open at http://silam.fmi.fi/MACC. The main
input data set is the birch habitat map compiled by Sofiev et
al. (2006a) with a spatial resolution of 0.5◦× 0.5◦ longitude–
latitude. The birch productivity is assumed to be the same in
all years and equal to 109 pollen m−2 season−1.
The flowering description follows the concept of ther-
mal time phenological models and, in particular, the double-
threshold air temperature sum approach of Linkosalo et
al. (2010) modified by Sofiev et al. (2012), which determines
the flowering propagation during the whole spring season.
Within that approach, the heat accumulation starts on a day in
spring (1 March in the current setup) and continues through-
out the season. Flowering starts when the accumulated heat
reaches the starting threshold and continues until the heat
reaches the ending threshold. The rate of heat accumulation
is the main controlling parameter for pollen emission: the
model establishes direct proportionality between the flower-
ing stage and fraction of the heat sum accumulated to-date.
Apart from temperature, the pollen release rate is mod-
ulated by ambient humidity, precipitation, and wind speed.
Following Sofiev et al. (2012), higher relative humidity
(RH) and rain reduce the release, completely stopping it for
RH > 80 % and/or rain > 0.1 mm h−1. Strong wind promotes
it by up to 50 %. Atmospheric turbulence is taken into ac-
count via the turbulent velocity scale and thus becomes im-
portant only in cases close to free convection. In stable or
neutral stratification and calm conditions the release is sup-
pressed by 50 %.
Local-scale variability of the flowering results in the need
to include probabilistic description of the flowering propaga-
tion (Siljamo et al., 2008b). In the simplest form, the proba-
bility of an individual tree entering the flowering stage can be
considered via the uncertainty of the temperature sum thresh-
old determining the start of flowering for the grid cell.
The end of the season is described via the open-pocket
principle: the flowering continues until the initially available
amount of pollen is completely released.
2.3 Pollen observations
The observations for the model evaluation in 2013 have been
provided by the following 11 members of the EAN: Aus-
tria, Estonia, Germany, Finland, France, Latvia, Lithuania,
Russia, Spain, Switzerland, and Ukraine. Additionally, the
data for the initial model testing for the season of 2010 were
provided by Austria, Finland, Germany, Latvia, Lithuania,
Russia, Spain, Switzerland, and Ukraine. In total, informa-
tion from 165 sites in 2010 and 186 sites in 2013 was made
available to the modelling teams. Among these, 21 stations
in mountain valleys of the Alps and Pyrenees were flagged
as not representative on the regional scale and excluded from
the analysis (see the Discussion section). The analysis below
concentrates on the season of 2013 as the data for 2010 were
mainly used for setting up and verifying the pollen source
term implementations. However, a comparison of these years
is used to illustrate the variability of pollen seasons and the
ability of the models to reproduce it.
Pollen monitoring was performed with Burkard 7-day and
Lanzoni 2000 pollen traps based on the Hirst design (Hirst,
1954). The pollen grains were collected at an airflow rate of
10 L min−1. The observations covered the period from March
until September, with some variations between the countries.
Daily observations were used. Following the EAN recom-
mendations (Galán et al., 2014; Jäger et al., 1995), most sam-
plers were located at heights of between 10 and 30 m on the
roofs of suitable buildings. The places were frequently in the
cities’ downtown areas; i.e. they largely represent the urban-
background conditions (although not always). With regard to
microscopic analysis, the EAN recommendation is to count
at least 10 % of the sample using horizontal or vertical strips
(Galán et al., 2014). The actual procedures vary between the
countries but generally comply. The counting in 2013 was
performed along 12 vertical strips (in most countries), or two
to four horizontal traverses (Switzerland, Spain), using a bi-
hourly stratified random sampling (Finland) (Mandrioli and
Comtois, 1998). In all cases, the data were expressed as mean
daily concentrations (pollen m−3).
2.4 Setup of the simulations
Simulations followed the standards of MACC regional en-
semble (Marécal et al., 2015). The domain spanned from
25◦ W to 45◦ E and from 30 to 70◦ N. Each of the seven mod-
els was run with its own horizontal and vertical resolutions,
which varied from 0.1 to 0.25◦ of the horizontal grid cell
size, and had from 3 up to 52 vertical layers within the tropo-
sphere (Table 1). This range of resolutions is not designed to
reproduce local aspects of pollen distribution, instead cover-
ing the whole continent and describing the large-scale trans-
Atmos. Chem. Phys., 15, 8115–8130, 2015 www.atmos-chem-phys.net/15/8115/2015/

M. Sofiev et al.: MACC regional multi-model ensemble simulations of birch pollen dispersion 8119
Figure 1. Seasonal pollen index (SPI, sum of daily concentrations) 2013 (pollen day m−3).
port events. The limited number of vertical dispersion lay-
ers is a compromise allowing for high horizontal resolution.
Thick layers are not a major limitation as long as the full ver-
tical resolution of the input meteorological data is used for
the evaluation of dispersion parameters (Sofiev, 2002).
In the forecasting regime during the spring of 2013, the
time range of the simulations was 96 h from 00:00 UTC on
day 0 (D0) with hourly output on eight vertical levels (sur-
face, 50, 250, 500, 1000, 2000, 3000, and 5000 m above the
surface). After the end of the season, it was reanalysed by
most of the models to correct technical problems experienced
in the forecasting regime. For the reanalysis simulations (dis-
cussed in this paper), the models were run through the whole
period without separation into individual forecast cycles. For
those models that were not rerun, the first 24 h of each fore-
cast were used. In all cases, only near-surface concentrations
were analysed.
All models considered pollen as an inert water-insoluble
particle 22 µm in diameter and with density of 800 kg m−3
(Bassett et al., 1978; Bucher and Kofler, 2015; Sofiev et al.,
2006a)
3 Results for the flowering season of 2013
3.1 Observed peculiarities of the season
The season of 2013 had three major specifics, which distin-
guished it from “typical” pollen seasons and, in particular,
from the training year of 2010:
– A cold spring resulted in late flowering. In central Eu-
rope, the flowering started up to 2–3 weeks later than
usual. For instance, 2013 in Switzerland was among
the latest years since 1993 (the latest at five stations):
9 days later than in 2010. In Moscow, the cold start
of the spring was compensated by its faster progres-
sion, so that the early-flowering alder was shifted by
about 2 weeks but the birch season was delayed by only
a few days. In Lithuania, however, the observed high-
concentration time period started 10 days earlier than
in 2010, almost simultaneously with France, which was
probably caused by early long-range transport events.
– The duration of the season was up to 1 week shorter
than usual. Thus, in Switzerland it lasted for ∼ 30 days
(22–35 for different stations) as compared the long-term
average of 37 days. In Finland, the difference between
the season length in 2010 and in 2013 reached a factor
of 2.4.
www.atmos-chem-phys.net/15/8115/2015/ Atmos. Chem. Phys., 15, 8115–8130, 2015
8120 M. Sofiev et al.: MACC regional multi-model ensemble simulations of birch pollen dispersion
Table 1. Setup of the simulations for the participating models.
Model Horizontal dispersion
grid
Vertical Dispersion Meteo input Meteo grid Meteo vertical
CHIMERE 0.15◦× 0.15◦ 8 levels up to 500 hPa ECMWF IFS 00 operational
forecast, internal preprocessor
0.125◦× 0.125◦ IFS vertical: 91 levels
EMEP 0.25◦× 0.25◦ 20 levels up to 12 km ECMWF IFS 00 operational
forecast, internal preprocessor
0.25◦× 0.125◦ IFS levels 39–91 up to 100 hPa
EURAD 15 km on Lambert con-
formal projection
23 layers up to 100 hPa WRF based on ECMWF IFS 15 km on Lambert
conformal projection
23 layers up to 100 hPa
LOTOS-EUROS 0.5◦× 0.25◦ 3 dynamic layers up
to 3.5 km, surface layer
25m
ECMWF IFS 00 operational
forecast, internal preprocessor
0.5◦× 0.25◦ IFS levels up to 3.5 km (approx.
levels 69–91)
MATCH 0.2◦× 0.2◦ 52 layers up to 7 km ECMWF IFS 00 from MARS,
internal preprocessor
0.2◦× 0.2◦ IFS vertical: 91 levels
MOCAGE 0.2◦× 0.2◦ 47 layers up to 5 hPa (7
in ABL)
ECMWF IFS 00 operational
forecast, internal preprocessor
0.125◦× 0.125◦ IFS vertical 91 levels
SILAM 0.15◦× 0.15◦ 8 layers up to 6.7 km ECMWF IFS 00 operational
forecast, internal preprocessor
0.125◦× 0.125◦ IFS levels 40–91 up to
∼ 110 hPa
– An anomalously low pollen season was recorded in
northern Europe and Russia. The seasonal pollen index
(SPI: the sum of daily pollen concentrations over the
whole season) was 10–1000 times lower than in 2012
and about 10 times weaker than in 2010 (that year was
comparatively usual). The SPI in central Europe was
moderate, which resulted in an inverse load pattern: the
SPI in the north was several tens of times lower than
that in the central regions.
These peculiarities presented substantial challenges to the
models. The phenological model of the source term has a
mechanism that accounts for the season shift, but it still went
beyond the verified range. The season strength, however, is
currently not a predicted quantity, which made it impossible
to capture the anomalously low season in the north.
3.2 Model results
All models predicted a quite standard load pattern for the
SPI (Fig. 1). Its maximum is located over central Russia and
Fennoscandia and the SPI gradually decreases towards the
south-west. In central Europe, there is a substantial inhomo-
geneity of the SPI, which reflects the patchy birch habitat in
the region.
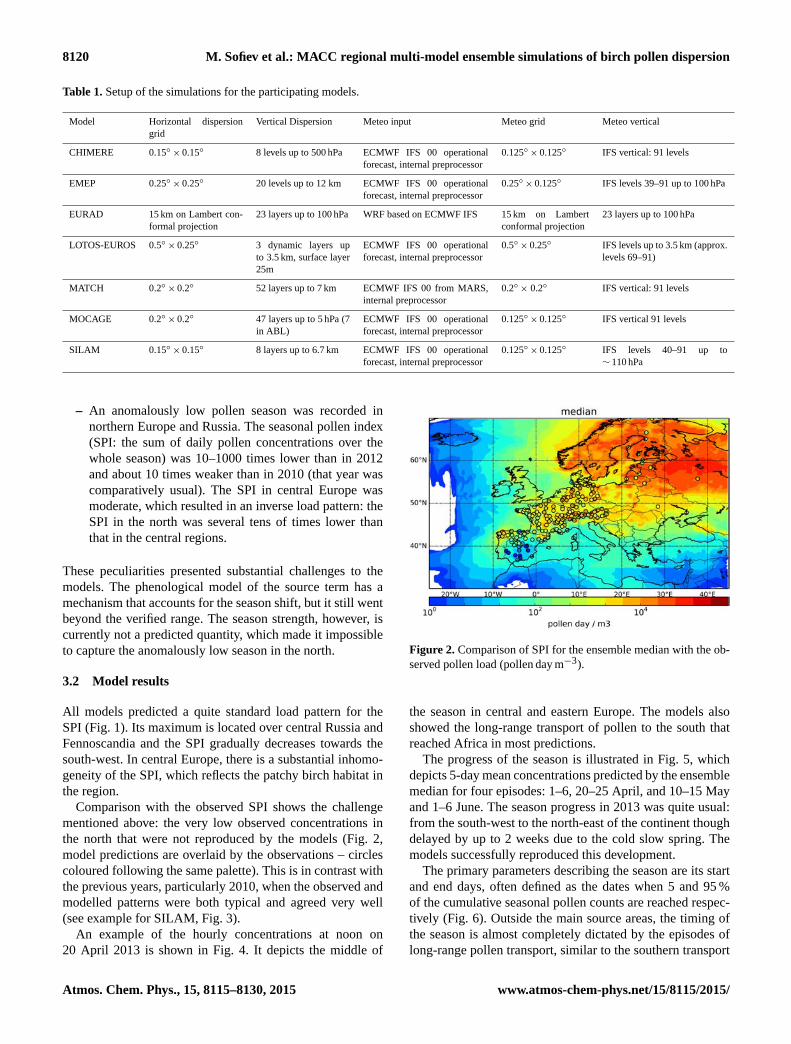
Comparison with the observed SPI shows the challenge
mentioned above: the very low observed concentrations in
the north that were not reproduced by the models (Fig. 2,
model predictions are overlaid by the observations – circles
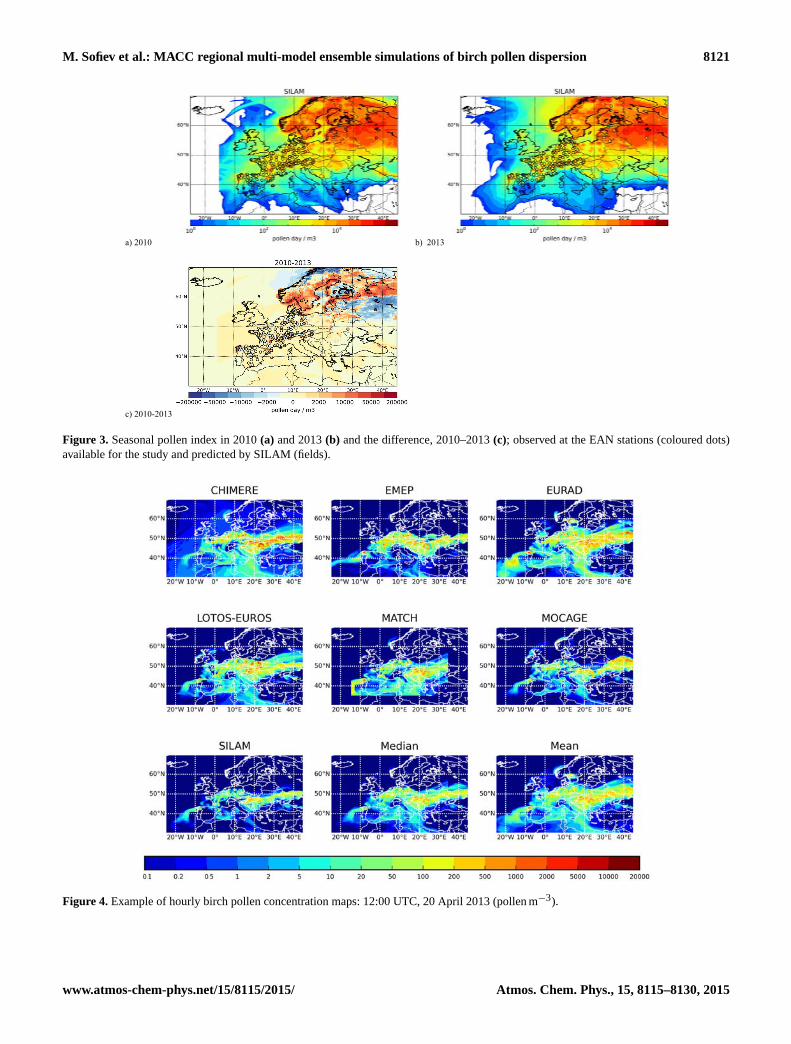
coloured following the same palette). This is in contrast with
the previous years, particularly 2010, when the observed and
modelled patterns were both typical and agreed very well
(see example for SILAM, Fig. 3).
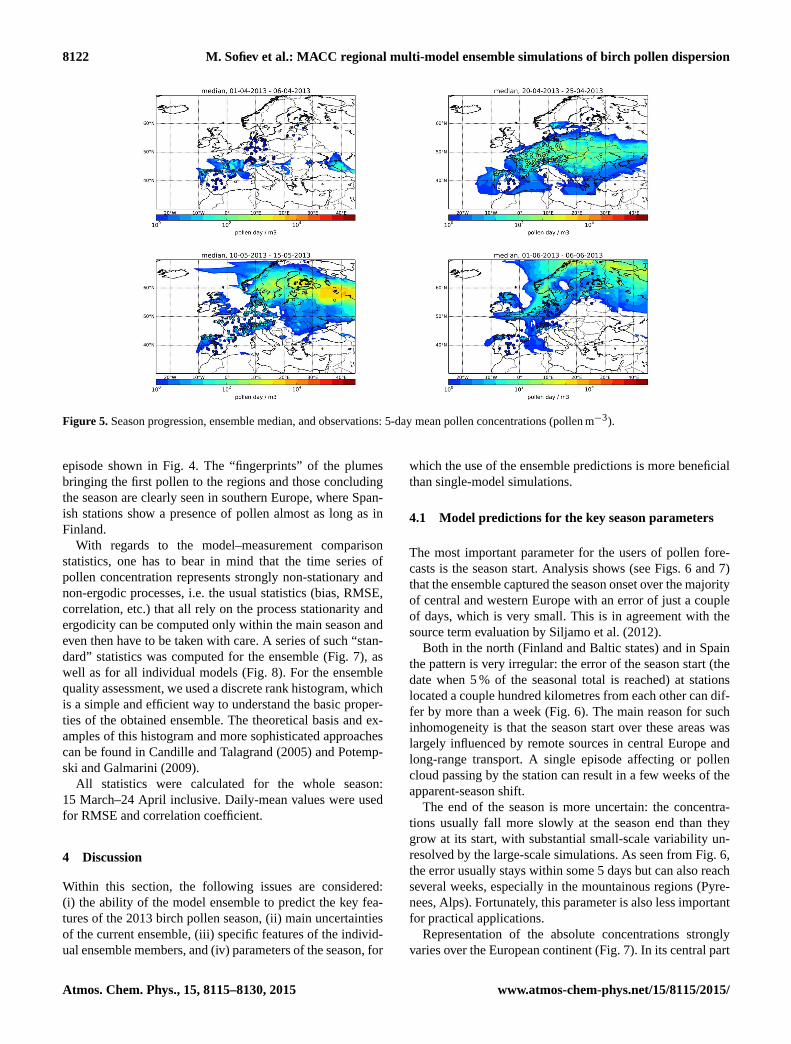
An example of the hourly concentrations at noon on
20 April 2013 is shown in Fig. 4. It depicts the middle of
Figure 2. Comparison of SPI for the ensemble median with the ob-
served pollen load (pollen day m−3).
the season in central and eastern Europe. The models also
showed the long-range transport of pollen to the south that
reached Africa in most predictions.
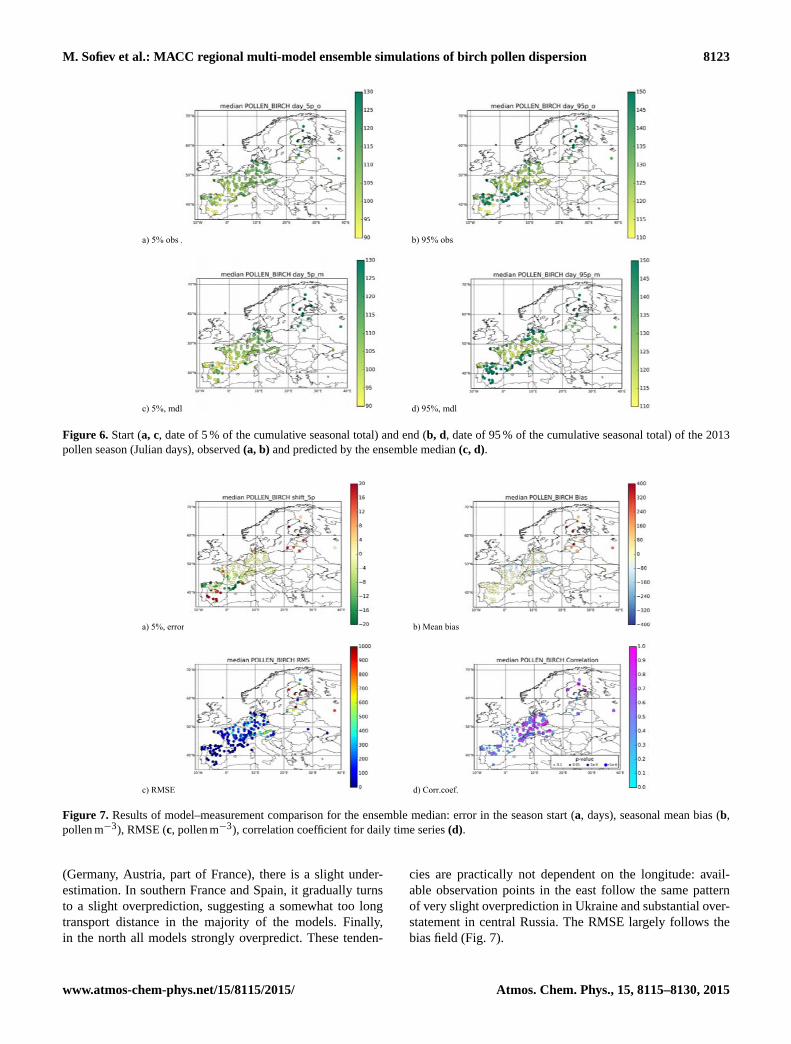
The progress of the season is illustrated in Fig. 5, which
depicts 5-day mean concentrations predicted by the ensemble
median for four episodes: 1–6, 20–25 April, and 10–15 May
and 1–6 June. The season progress in 2013 was quite usual:
from the south-west to the north-east of the continent though
delayed by up to 2 weeks due to the cold slow spring. The
models successfully reproduced this development.
The primary parameters describing the season are its start
and end days, often defined as the dates when 5 and 95 %
of the cumulative seasonal pollen counts are reached respec-
tively (Fig. 6). Outside the main source areas, the timing of
the season is almost completely dictated by the episodes of
long-range pollen transport, similar to the southern transport
Atmos. Chem. Phys., 15, 8115–8130, 2015 www.atmos-chem-phys.net/15/8115/2015/
M. Sofiev et al.: MACC regional multi-model ensemble simulations of birch pollen dispersion 8121
a) 2010 b) 2013
c) 2010-2013
Figure 3. Seasonal pollen index in 2010 (a) and 2013 (b) and the difference, 2010–2013 (c); observed at the EAN stations (coloured dots)
available for the study and predicted by SILAM (fields).
Figure 4. Example of hourly birch pollen concentration maps: 12:00 UTC, 20 April 2013 (pollen m−3).
www.atmos-chem-phys.net/15/8115/2015/ Atmos. Chem. Phys., 15, 8115–8130, 2015
8122 M. Sofiev et al.: MACC regional multi-model ensemble simulations of birch pollen dispersion
Figure 5. Season progression, ensemble median, and observations: 5-day mean pollen concentrations (pollen m−3).
episode shown in Fig. 4. The “fingerprints” of the plumes
bringing the first pollen to the regions and those concluding
the season are clearly seen in southern Europe, where Span-
ish stations show a presence of pollen almost as long as in
Finland.
With regards to the model–measurement comparison
statistics, one has to bear in mind that the time series of
pollen concentration represents strongly non-stationary and
non-ergodic processes, i.e. the usual statistics (bias, RMSE,
correlation, etc.) that all rely on the process stationarity and
ergodicity can be computed only within the main season and
even then have to be taken with care. A series of such “stan-
dard” statistics was computed for the ensemble (Fig. 7), as
well as for all individual models (Fig. 8). For the ensemble
quality assessment, we used a discrete rank histogram, which
is a simple and efficient way to understand the basic proper-
ties of the obtained ensemble. The theoretical basis and ex-
amples of this histogram and more sophisticated approaches
can be found in Candille and Talagrand (2005) and Potemp-
ski and Galmarini (2009).
All statistics were calculated for the whole season:
15 March–24 April inclusive. Daily-mean values were used
for RMSE and correlation coefficient.
4 Discussion
Within this section, the following issues are considered:
(i) the ability of the model ensemble to predict the key fea-
tures of the 2013 birch pollen season, (ii) main uncertainties
of the current ensemble, (iii) specific features of the individ-
ual ensemble members, and (iv) parameters of the season, for
which the use of the ensemble predictions is more beneficial
than single-model simulations.
4.1 Model predictions for the key season parameters
The most important parameter for the users of pollen fore-
casts is the season start. Analysis shows (see Figs. 6 and 7)
that the ensemble captured the season onset over the majority
of central and western Europe with an error of just a couple
of days, which is very small. This is in agreement with the
source term evaluation by Siljamo et al. (2012).
Both in the north (Finland and Baltic states) and in Spain
the pattern is very irregular: the error of the season start (the
date when 5 % of the seasonal total is reached) at stations
located a couple hundred kilometres from each other can dif-
fer by more than a week (Fig. 6). The main reason for such
inhomogeneity is that the season start over these areas was
largely influenced by remote sources in central Europe and
long-range transport. A single episode affecting or pollen
cloud passing by the station can result in a few weeks of the
apparent-season shift.
The end of the season is more uncertain: the concentra-
tions usually fall more slowly at the season end than they
grow at its start, with substantial small-scale variability un-
resolved by the large-scale simulations. As seen from Fig. 6,
the error usually stays within some 5 days but can also reach
several weeks, especially in the mountainous regions (Pyre-
nees, Alps). Fortunately, this parameter is also less important
for practical applications.
Representation of the absolute concentrations strongly
varies over the European continent (Fig. 7). In its central part
Atmos. Chem. Phys., 15, 8115–8130, 2015 www.atmos-chem-phys.net/15/8115/2015/
M. Sofiev et al.: MACC regional multi-model ensemble simulations of birch pollen dispersion 8123
a) 5% obs , b) 95% obs
c) 5%, mdl d) 95%, mdl
Figure 6. Start (a, c, date of 5 % of the cumulative seasonal total) and end (b, d, date of 95 % of the cumulative seasonal total) of the 2013
pollen season (Julian days), observed (a, b) and predicted by the ensemble median (c, d).
a) 5%, error b) Mean bias
c) RMSE d) Corr.coef.
Figure 7. Results of model–measurement comparison for the ensemble median: error in the season start (a, days), seasonal mean bias (b,
pollen m−3), RMSE (c, pollen m−3), correlation coefficient for daily time series (d).
(Germany, Austria, part of France), there is a slight under-
estimation. In southern France and Spain, it gradually turns
to a slight overprediction, suggesting a somewhat too long
transport distance in the majority of the models. Finally,
in the north all models strongly overpredict. These tenden-
cies are practically not dependent on the longitude: avail-
able observation points in the east follow the same pattern
of very slight overprediction in Ukraine and substantial over-
statement in central Russia. The RMSE largely follows the
bias field (Fig. 7).
www.atmos-chem-phys.net/15/8115/2015/ Atmos. Chem. Phys., 15, 8115–8130, 2015
8124 M. Sofiev et al.: MACC regional multi-model ensemble simulations of birch pollen dispersion
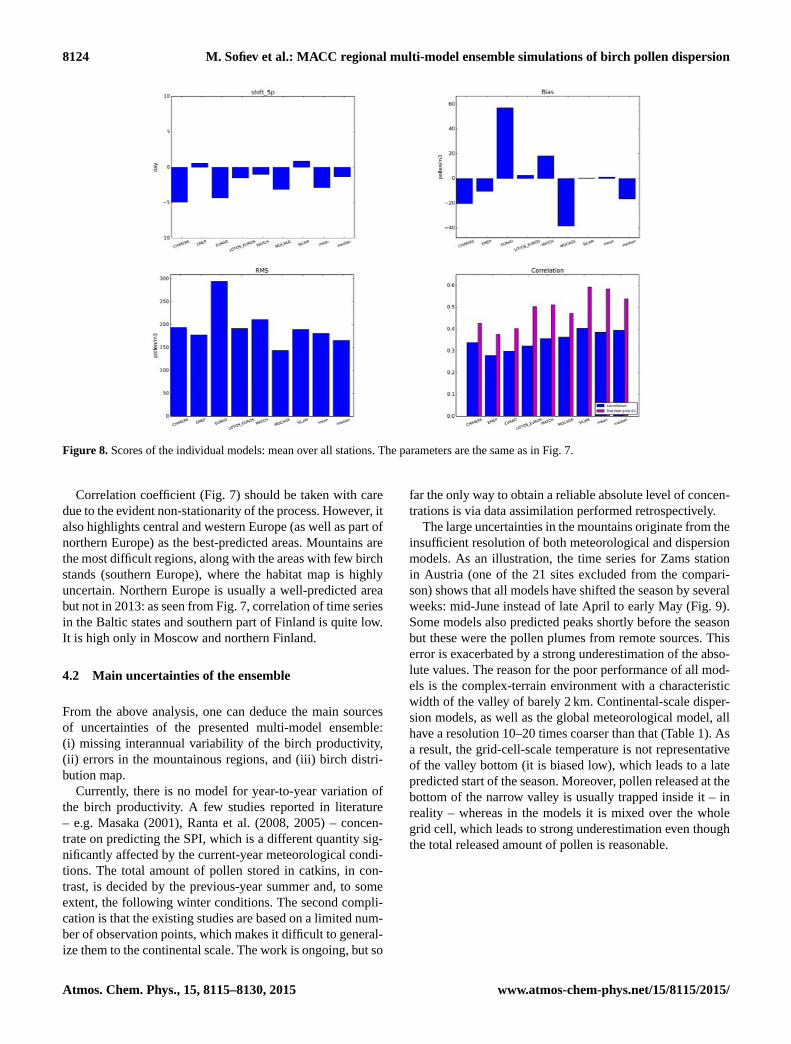
Figure 8. Scores of the individual models: mean over all stations. The parameters are the same as in Fig. 7.
Correlation coefficient (Fig. 7) should be taken with care
due to the evident non-stationarity of the process. However, it
also highlights central and western Europe (as well as part of
northern Europe) as the best-predicted areas. Mountains are
the most difficult regions, along with the areas with few birch
stands (southern Europe), where the habitat map is highly
uncertain. Northern Europe is usually a well-predicted area
but not in 2013: as seen from Fig. 7, correlation of time series
in the Baltic states and southern part of Finland is quite low.
It is high only in Moscow and northern Finland.
4.2 Main uncertainties of the ensemble
From the above analysis, one can deduce the main sources
of uncertainties of the presented multi-model ensemble:
(i) missing interannual variability of the birch productivity,
(ii) errors in the mountainous regions, and (iii) birch distri-
bution map.
Currently, there is no model for year-to-year variation of
the birch productivity. A few studies reported in literature
– e.g. Masaka (2001), Ranta et al. (2008, 2005) – concen-
trate on predicting the SPI, which is a different quantity sig-
nificantly affected by the current-year meteorological condi-
tions. The total amount of pollen stored in catkins, in con-
trast, is decided by the previous-year summer and, to some
extent, the following winter conditions. The second compli-
cation is that the existing studies are based on a limited num-
ber of observation points, which makes it difficult to general-
ize them to the continental scale. The work is ongoing, but so
far the only way to obtain a reliable absolute level of concen-
trations is via data assimilation performed retrospectively.
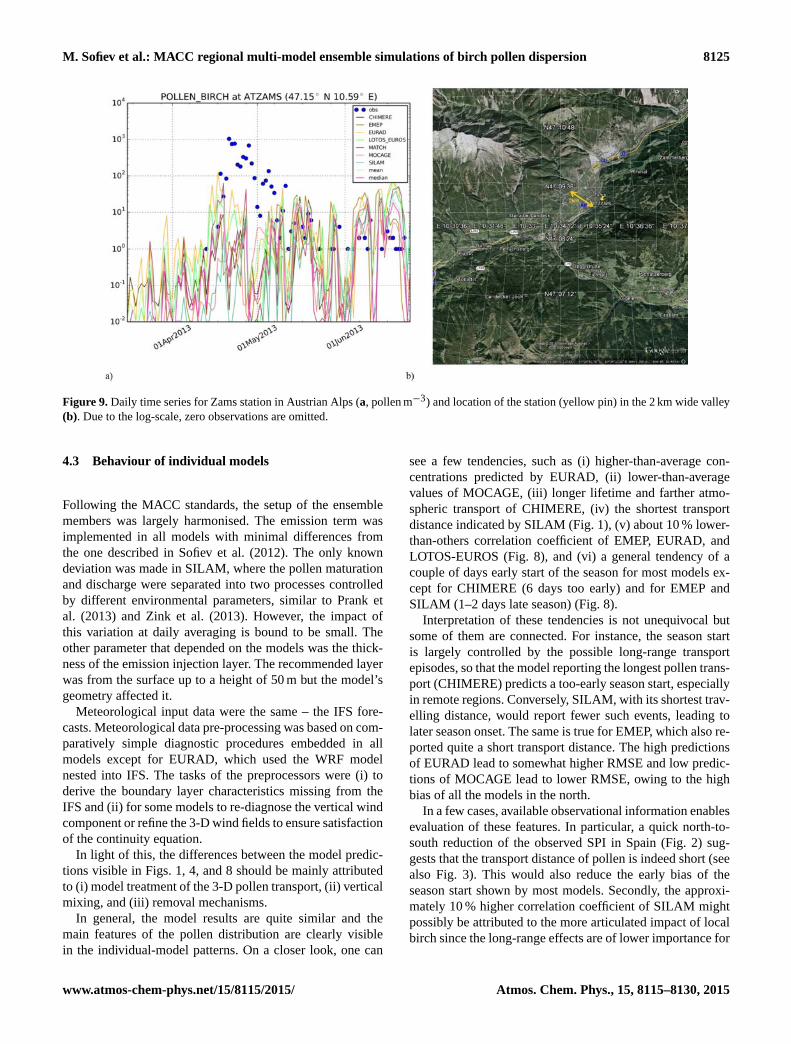
The large uncertainties in the mountains originate from the
insufficient resolution of both meteorological and dispersion
models. As an illustration, the time series for Zams station
in Austria (one of the 21 sites excluded from the compari-
son) shows that all models have shifted the season by several
weeks: mid-June instead of late April to early May (Fig. 9).
Some models also predicted peaks shortly before the season
but these were the pollen plumes from remote sources. This
error is exacerbated by a strong underestimation of the abso-
lute values. The reason for the poor performance of all mod-
els is the complex-terrain environment with a characteristic
width of the valley of barely 2 km. Continental-scale disper-
sion models, as well as the global meteorological model, all
have a resolution 10–20 times coarser than that (Table 1). As
a result, the grid-cell-scale temperature is not representative
of the valley bottom (it is biased low), which leads to a late
predicted start of the season. Moreover, pollen released at the
bottom of the narrow valley is usually trapped inside it – in
reality – whereas in the models it is mixed over the whole
grid cell, which leads to strong underestimation even though
the total released amount of pollen is reasonable.
Atmos. Chem. Phys., 15, 8115–8130, 2015 www.atmos-chem-phys.net/15/8115/2015/
M. Sofiev et al.: MACC regional multi-model ensemble simulations of birch pollen dispersion 8125
Figure 9. Daily time series for Zams station in Austrian Alps (a, pollen m−3) and location of the station (yellow pin) in the 2 km wide valley
(b). Due to the log-scale, zero observations are omitted.
4.3 Behaviour of individual models
Following the MACC standards, the setup of the ensemble
members was largely harmonised. The emission term was
implemented in all models with minimal differences from
the one described in Sofiev et al. (2012). The only known
deviation was made in SILAM, where the pollen maturation
and discharge were separated into two processes controlled
by different environmental parameters, similar to Prank et
al. (2013) and Zink et al. (2013). However, the impact of
this variation at daily averaging is bound to be small. The
other parameter that depended on the models was the thick-
ness of the emission injection layer. The recommended layer
was from the surface up to a height of 50 m but the model’s
geometry affected it.
Meteorological input data were the same – the IFS fore-
casts. Meteorological data pre-processing was based on com-
paratively simple diagnostic procedures embedded in all
models except for EURAD, which used the WRF model
nested into IFS. The tasks of the preprocessors were (i) to
derive the boundary layer characteristics missing from the
IFS and (ii) for some models to re-diagnose the vertical wind
component or refine the 3-D wind fields to ensure satisfaction
of the continuity equation.
In light of this, the differences between the model predic-
tions visible in Figs. 1, 4, and 8 should be mainly attributed
to (i) model treatment of the 3-D pollen transport, (ii) vertical
mixing, and (iii) removal mechanisms.
In general, the model results are quite similar and the
main features of the pollen distribution are clearly visible
in the individual-model patterns. On a closer look, one can
see a few tendencies, such as (i) higher-than-average con-
centrations predicted by EURAD, (ii) lower-than-average
values of MOCAGE, (iii) longer lifetime and farther atmo-
spheric transport of CHIMERE, (iv) the shortest transport
distance indicated by SILAM (Fig. 1), (v) about 10 % lower-
than-others correlation coefficient of EMEP, EURAD, and
LOTOS-EUROS (Fig. 8), and (vi) a general tendency of a
couple of days early start of the season for most models ex-
cept for CHIMERE (6 days too early) and for EMEP and
SILAM (1–2 days late season) (Fig. 8).
Interpretation of these tendencies is not unequivocal but
some of them are connected. For instance, the season start
is largely controlled by the possible long-range transport
episodes, so that the model reporting the longest pollen trans-
port (CHIMERE) predicts a too-early season start, especially
in remote regions. Conversely, SILAM, with its shortest trav-
elling distance, would report fewer such events, leading to
later season onset. The same is true for EMEP, which also re-
ported quite a short transport distance. The high predictions
of EURAD lead to somewhat higher RMSE and low predic-
tions of MOCAGE lead to lower RMSE, owing to the high
bias of all the models in the north.
In a few cases, available observational information enables
evaluation of these features. In particular, a quick north-to-
south reduction of the observed SPI in Spain (Fig. 2) sug-
gests that the transport distance of pollen is indeed short (see
also Fig. 3). This would also reduce the early bias of the
season start shown by most models. Secondly, the approxi-
mately 10 % higher correlation coefficient of SILAM might
possibly be attributed to the more articulated impact of local
birch since the long-range effects are of lower importance for
www.atmos-chem-phys.net/15/8115/2015/ Atmos. Chem. Phys., 15, 8115–8130, 2015
8126 M. Sofiev et al.: MACC regional multi-model ensemble simulations of birch pollen dispersion
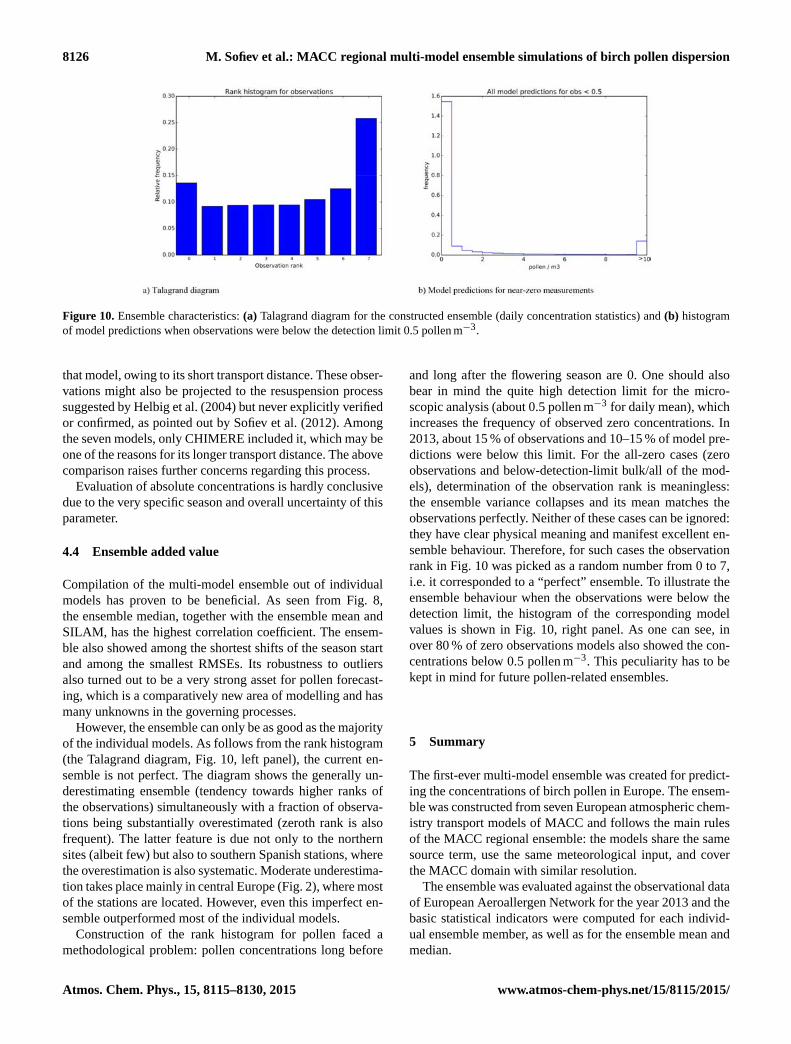
Figure 10. Ensemble characteristics: (a) Talagrand diagram for the constructed ensemble (daily concentration statistics) and (b) histogram
of model predictions when observations were below the detection limit 0.5 pollen m−3.
that model, owing to its short transport distance. These obser-
vations might also be projected to the resuspension process
suggested by Helbig et al. (2004) but never explicitly verified
or confirmed, as pointed out by Sofiev et al. (2012). Among
the seven models, only CHIMERE included it, which may be
one of the reasons for its longer transport distance. The above
comparison raises further concerns regarding this process.
Evaluation of absolute concentrations is hardly conclusive
due to the very specific season and overall uncertainty of this
parameter.
4.4 Ensemble added value
Compilation of the multi-model ensemble out of individual
models has proven to be beneficial. As seen from Fig. 8,
the ensemble median, together with the ensemble mean and
SILAM, has the highest correlation coefficient. The ensem-
ble also showed among the shortest shifts of the season start
and among the smallest RMSEs. Its robustness to outliers
also turned out to be a very strong asset for pollen forecast-
ing, which is a comparatively new area of modelling and has
many unknowns in the governing processes.
However, the ensemble can only be as good as the majority
of the individual models. As follows from the rank histogram
(the Talagrand diagram, Fig. 10, left panel), the current en-
semble is not perfect. The diagram shows the generally un-
derestimating ensemble (tendency towards higher ranks of
the observations) simultaneously with a fraction of observa-
tions being substantially overestimated (zeroth rank is also
frequent). The latter feature is due not only to the northern
sites (albeit few) but also to southern Spanish stations, where
the overestimation is also systematic. Moderate underestima-
tion takes place mainly in central Europe (Fig. 2), where most
of the stations are located. However, even this imperfect en-
semble outperformed most of the individual models.
Construction of the rank histogram for pollen faced a
methodological problem: pollen concentrations long before
and long after the flowering season are 0. One should also
bear in mind the quite high detection limit for the micro-
scopic analysis (about 0.5 pollen m−3 for daily mean), which
increases the frequency of observed zero concentrations. In
2013, about 15 % of observations and 10–15 % of model pre-
dictions were below this limit. For the all-zero cases (zero
observations and below-detection-limit bulk/all of the mod-
els), determination of the observation rank is meaningless:
the ensemble variance collapses and its mean matches the
observations perfectly. Neither of these cases can be ignored:
they have clear physical meaning and manifest excellent en-
semble behaviour. Therefore, for such cases the observation
rank in Fig. 10 was picked as a random number from 0 to 7,
i.e. it corresponded to a “perfect” ensemble. To illustrate the
ensemble behaviour when the observations were below the
detection limit, the histogram of the corresponding model
values is shown in Fig. 10, right panel. As one can see, in
over 80 % of zero observations models also showed the con-
centrations below 0.5 pollen m−3. This peculiarity has to be
kept in mind for future pollen-related ensembles.
5 Summary
The first-ever multi-model ensemble was created for predict-
ing the concentrations of birch pollen in Europe. The ensem-
ble was constructed from seven European atmospheric chem-
istry transport models of MACC and follows the main rules
of the MACC regional ensemble: the models share the same
source term, use the same meteorological input, and cover
the MACC domain with similar resolution.
The ensemble was evaluated against the observational data
of European Aeroallergen Network for the year 2013 and the
basic statistical indicators were computed for each individ-
ual ensemble member, as well as for the ensemble mean and
median.
Atmos. Chem. Phys., 15, 8115–8130, 2015 www.atmos-chem-phys.net/15/8115/2015/
M. Sofiev et al.: MACC regional multi-model ensemble simulations of birch pollen dispersion 8127
The ensemble demonstrated good skills in predicting sev-
eral main characteristics of the pollen season of 2013: the
season start and propagation, the pollen distribution pattern
in central, eastern, and southern Europe, and characteristic
concentrations over these regions. The season timing was
captured despite the anomalously late flowering due to the
cold spring of 2013.
Representation of the pollen concentrations in northern
Europe, the Baltic states, and central Russia was affected by
the anomalously low flowering intensity in 2013. As a result,
all models had strongly overestimated pollen levels there.
This was in contrast to the usual pollen distribution pattern
in Europe, such as the one of the quite typical year of 2010,
which was reproduced much better.
The experiment showed the high added value of the en-
semble. For most of the participating models this was the first
experience of pollen simulations, which affected the reliabil-
ity of their results. The ensemble median proved to be robust
to the outliers, finally showing among the highest correlation
coefficients and one of the smallest errors in the season tim-
ing and RMSEs.
The main areas of improvement referred to the interannual
variation of the birch productivity as well as to the represen-
tation of the flowering timing in the complex-terrain condi-
tions.
Acknowledgements. The work was performed within the scope of
the FP-7 MACC-II project. The birch source term is developed
within the scope of the Academy of Finland POLLEN and APTA
projects. Observational data were provided by national pollen
monitoring of Austria, Estonia, Germany, Finland, France, Latvia,
Lithuania, Russia, Spain, Switzerland, and Ukraine, members of
the European Aeroallergen Network.
Edited by: S. Galmarini
References
Atkinson, M. D.: Betula pendula Roth (B. verrucosa Ehrh.) and B.
pubescens Ehrh. J. Ecol., 80, 837–870, 1992.
Baklanov, A. and Sorensen, J. H.: Parameterisation of radionuclide
deposition in atmospheric long-range transport modelling, Phys.
Chem. Earth, Pt. B, 26, 787–799, 2001.
Bassett, I. J., Crompton, C. W., and Parmelee, J. A.: An Atlas of Air-
borne Pollen Fungus Spores of Canada. Research Branch Canada
Department of Agriculture, Ottawa, 1978.
Bechtold, P., Bazile, E., Guichard, F., Mascart, P., and Richard, E.:
A mass-flux convection scheme for regional and global models,
Q. J. Roy. Meteorol. Soc., 127, 869–886, 2001.
Belmonte, J., Vendrell, M., Roure, J., Vidal, J., Botey, J., and
Cadahía, A.: Levels of Ambrosia pollen in the atmospheric spec-
tra of Catalan aerobiological stations, Aerobiologia (Bologna),
16, 93–99, 2000.
Bott, A.: A positive definite advection scheme obtained by nonlin-
ear renormalization of the advective fluxes, Mon. Weather Rev.,
117, 1006–1016, 1989.
Bousquet, P.-J., Chinn, S., Janson, C., Kogevinas, M., Burney, P.,
and Jarvis, D.: Geographical variation in the prevalence of pos-
itive skin tests to environmental aeroallergens in the European
Community Respiratory Health Survey I. Allergy, 62, 301–309,
doi:10.1111/j.1398-9995.2006.01293.x, 2007.
Bucher, E. and Kofler, V.: Pollen Atlas, Biol. Lab. State
Agency Environ, Bozen, available at: https://www.polleninfo.
org/FI/fi/allergy-infos/aerobiologics/pollen-atlas.html, last ac-
cess: 6 July 2015.
Candille, G. and Talagrand, O.: Evaluation of probabilistic predic-
tion systems for a scalar variable, Q. J. Roy. Meteorol. Soc., 131,
2131–2150, doi:10.1256/qj.04.71, 2005.
Corden, J. M., Stach, A., and Milligton, W.: A comparison of Betula
pollen season at two European sites; Derby, United Kingdom and
Poznan, Poland (1995–1999), Aerobiologia (Bologna), 18, 53–
54, 2002.
Damialis, A. and Gioulekas, D.: Transport of airborne pollen
into the city of Thessaloniki?: the effects of wind direc-
tion, speed and persistence, Int. J. Biometeorol., 49, 139–145,
doi:10.1007/s00484-004-0229-z, 2005.
Efstathiou, C., Isukapalli, S., and Georgopoulos, P.: A mechanistic
modeling system for estimating large-scale emissions and trans-
port of pollen and co-allergens, Atmos. Environ., 45, 2260–2276,
doi:10.1016/j.atmosenv.2010.12.008, 2011.
Elbern, H., Strunk, A., Schmidt, H., and Talagrand, O.: Emission
rate and chemical state estimation by 4-dimensional variational
inversion, Atmos. Chem. Phys., 7, 3749–3769, doi:10.5194/acp-
7-3749-2007, 2007.
Erdtman, G.: Pollen-statistics: A new research method in paleoecol-
ogy, Science, 73, 399–401, 1931.
Erdtman, G.: Pollen statistics: A botanical and geological research
method, in: Pollen Grains, edited by: Wodehouse, R. P., 110–125,
1935.
Erdtman, G.: Pollen grains recovered from the atmosphere over the
Atlantic, Medd. Göteborgs Bot. Trädgård, 12, 186–196, 1937.
Galán, C., Smith, M., Thibaudon, M., Frenguelli, G., Oteros, J.,
Gehrig, R., Berger, U., Clot, B., Brandao, R., and Group, E. Q.
W.: Pollen monitoring: minimum requirements and reproducibil-
ity of analysis, Aerobiologia (Bologna), 30, 385–395, 2014.
Galperin, M. V: The Approaches to Correct Computation of Air-
borne Pollution Advection, in: Problems of Ecological Monitor-
ing and Ecosystem Modelling. XVII, Gidrometeoizdat, St. Pe-
tersburg, 54–68, 2000 (in Russian).
Giorgi, F. and Chameides, W. L.: Rainout lifetimes of highly soluble
aerosols and gases as inferred from simulations with a general
circulation model, J. Geophys. Res., 91, 14367–14376, 1986.
Gregory, P. H.: The microbiology of the atmosphere, Interscience,
New York, 1961.
Hass, H., Jakobs, H. J., and Memmesheimer, M.: Analysis of a re-
gional model (EURAD) near surface gas concentration predic-
tions using observations from networks, Meteorol. Atmos. Phys.,
57, 173–200, 1995.
Heinzerling, L. M., Burbach, G. J., Edenharter, G., Bachert, C.,
Bindslev-Jensen, C., Bonini, S., Bousquet, J., Bousquet-Rouanet,
L., Bousquet, P. J., Bresciani, M., Bruno, A., Burney, P., Canon-
ica, G. W., Darsow, U., Demoly, P., Durham, S., Fokkens, W. J.,
www.atmos-chem-phys.net/15/8115/2015/ Atmos. Chem. Phys., 15, 8115–8130, 2015

8128 M. Sofiev et al.: MACC regional multi-model ensemble simulations of birch pollen dispersion
Giavi, S., Gjomarkaj, M., Gramiccioni, C., Haahtela, T., Kowal-
ski, M. L., Magyar, P., Muraközi, G., Orosz, M., Papadopoulos,
N. G., Röhnelt, C., Stingl, G., Todo-Bom, A., Von Mutius, E.,
Wiesner, A., Wöhrl, S., and Zuberbier, T.: GA2LEN skin test
study I: GA2LEN harmonization of skin prick testing: novel sen-
sitization patterns for inhalant allergens in Europe, Allergy, 64,
1498–1506, 2009.
Helbig, N., Vogel, B., Vogel, H., and Fiedler, F.: Numerical mod-
elling of pollen dispersion on the regional scale, Aerobiologia
(Bologna), 3, 3–19, 2004.
Hirst, J. M.: An automatic volumetric spore trap, Ann. Appl. Biol.,
39, 257–265, 1954.
Hjelmroos, M.: Long-distance transport of Betula pollen grains and
allergic symptoms, Aerobiologia (Bologna), 8, 231–236, 1992.
Holtslag, A. A. and Nieuwstadt, F. T. M.: Scaling the atmospheric
boundary layer. Bound. Layer Meteorol. 36, 201–209, 1986.
Jäger, S., Mandroli, P., Spieksma, F., Emberlin, J., Hjelmroos,
M., Rantio-Lehtimaki, A., and Al, E.: News, Aerobiologia
(Bologna), 11, 69–70, 1995.
Josse, B., Simon, P., and Peuch, V.: Radon global simulations with
the multiscale chemistry and transport model MOCAGE, Tellus
B, 56, 339–356, 2004.
Kouznetsov, R. and Sofiev, M.: A methodology for evaluation of
vertical dispersion and dry deposition of atmospheric aerosols, J.
Geophys. Res., 117, D01202, doi:10.1029/2011JD016366, 2012.
Kukkonen, J., Olsson, T., Schultz, D. M., Baklanov, A., Klein, T.,
Miranda, A. I., Monteiro, A., Hirtl, M., Tarvainen, V., Boy, M.,
Peuch, V.-H., Poupkou, A., Kioutsioukis, I., Finardi, S., Sofiev,
M., Sokhi, R., Lehtinen, K. E. J., Karatzas, K., San José, R.,
Astitha, M., Kallos, G., Schaap, M., Reimer, E., Jakobs, H.,
and Eben, K.: A review of operational, regional-scale, chemical
weather forecasting models in Europe, Atmos. Chem. Phys., 12,
1–87, doi:10.5194/acp-12-1-2012, 2012.
Laatikainen, T., von Hertzen, L., Koskinen, J.-P., Makela, M. J.,
Jousilahti, P., Kosunen, T. U., Vlasoff, T., Ahlstrom, M., Var-
tiainen, E., and Haahtela, T.: Allergy gap between Finnish and
Russian Karelia on increase, Allergy, 66, 886–892, 2011.
Langner, J., Bergström, R., and Pleijel, K.: European scale mod-
eling of sulphur, oxidized nitrogen and photochemical oxidants,
Model dependent development av evaluation for the 1994 grow-
ing season, Norkoping, 1998.
Latalova, M., Mietus, M., and Uruska, A.: Seasonal variations in
the atmospheric Betula pollen count in Gdañsk (southern Baltic
coast) in relation to meteorological parameters, Aerobiologia
(Bologna), 18, 33–43, 2002.
Lindgren, D., Paule, L., Shen, X.-H., Yazdani, R., Segerstrom,
U., Wallin, J.-E., and Lejdebro, M. L.: Can viable pollen carry
Scotch pine genes over long distances?, Grana, 34, 64–69, 1995.
Linkosalo, T., Ranta, H., Oksanen, A., Siljamo, P., Luomajoki, A.,
Kukkonen, J., and Sofiev, M.: A double-threshold temperature
sum model for predicting the flowering duration and relative in-
tensity of Betula pendula and B. pubescens, Agr. Forest Me-
teorol., 150, 1579–1584, doi:10.1016/j.agrformet.2010.08.007,
2010.
Louis, J.-F.: A parametric model of vertical eddy fluxes in the atmo-
sphere, Bound. Lay.-Meteorol., 17, 187–202, 1979.
Mahura, A., Korsholm, U., Baklanov, A., and Rasmussen, A.:
Elevated birch pollen episodes in Denmark?: contributions
from remote sources, Aerobiologia (Bologna), 23, 171–179,
doi:10.1007/s10453-007-9061-3, 2007.
Mahura, A., Baklanov, A., and Korsholm, U.: Parameterization of
the birch pollen diurnal cycle, Aerobiologia (Bologna), 25, 203–
208, doi:10.1007/s10453-009-9125-7, 2009.
Mandrioli, P. and Comtois, P. V. L. (Eds.): Methods in Aerobiology,
Pitagora Editrice, Bologna, 1998.
Marécal, V., Peuch, V.-H., Andersson, C., Andersson, S., Arteta, J.,
Beekmann, M., Benedictow, A., Bergström, R., Bessagnet, B.,
Cansado, A., Chéroux, F., Colette, A., Coman, A., Curier, R. L.,
Denier van der Gon, H. A. C., Drouin, A., Elbern, H., Emili,
E., Engelen, R. J., Eskes, H. J., Foret, G., Friese, E., Gauss, M.,
Giannaros, C., Guth, J., Joly, M., Jaumouillé, E., Josse, B., Kady-
grov, N., Kaiser, J. W., Krajsek, K., Kuenen, J., Kumar, U., Li-
ora, N., Lopez, E., Malherbe, L., Martinez, I., Melas, D., Meleux,
F., Menut, L., Moinat, P., Morales, T., Parmentier, J., Piacentini,
A., Plu, M., Poupkou, A., Queguiner, S., Robertson, L., Rouïl,
L., Schaap, M., Segers, A., Sofiev, M., Thomas, M., Timmer-
mans, R., Valdebenito, Á., van Velthoven, P., van Versendaal, R.,
Vira, J., and Ung, A.: A regional air quality forecasting system
over Europe: the MACC-II daily ensemble production, Geosci.
Model Dev. Discuss., 8, 2739–2806, doi:10.5194/gmdd-8-2739-
2015, 2015.
Martet, M., Peuch, V.-H., Laurent, B. B. M., and Bergametti, G.:
Evaluation of long-range transport and deposition of desert dust
with the CTM Mocage, Tellus B, 61, 449–463, 2009.
Masaka, K.: Modelling the Masting Behaviour of Betula platy-
phylla var. japonica using the Resource Budget Model, Ann.
Bot., 88, 1049–1055, doi:10.1006/anbo.2001.1547, 2001.
Memmesheimer, M., Friese, E., Ebel, A., Jakobs, H. J., Feldmann,
H., Kessler, C., and Piekorz, G.: Long-term simulations of partic-
ulate matter in Europe on different scales using sequential nest-
ing of a regional model, Int. J. Environ. Pollut., 22, 108–132,
2004.
Menut, L., Bessagnet, B., Khvorostyanov, D., Beekmann, M.,
Blond, N., Colette, A., Coll, I., Curci, G., Foret, G., Hodzic,
A., Mailler, S., Meleux, F., Monge, J.-L., Pison, I., Siour, G.,
Turquety, S., Valari, M., Vautard, R., and Vivanco, M. G.:
CHIMERE 2013: a model for regional atmospheric composition
modelling, Geosci. Model Dev., 6, 981–1028, doi:10.5194/gmd-
6-981-2013, 2013.
OECD: Consensus document on the biology of European
white birch (Betula pendula Roth), Series on harmonisa-
tion of regulatory oversight in biotechnology, OECD Report
ENV/JM/MONO(2003)12, Paris, available at: http://www.oecd.
org/science/biotrack/46815768.pdf (last access: 19 July 2015),
2003.
Pauling, A., Rotach, M. W., Gehrig, R., and Clot, B.: A method to
derive vegetation distribution maps for pollen dispersion mod-
els using birch as an example, Int. J. Biometeorol., 56, 949–958,
doi:10.1007/s00484-011-0505-7, 2012.
Petroff, A. and Zhang, L.: Development and validation of a
size-resolved particle dry deposition scheme for application
in aerosol transport models, Geosci. Model Dev., 3, 753–769,
doi:10.5194/gmd-3-753-2010, 2010.
Potempski, S. and Galmarini, S.: Est modus in rebus: analytical
properties of multi-model ensembles, Atmos. Chem. Phys., 9,
9471–9489, doi:10.5194/acp-9-9471-2009, 2009.
Atmos. Chem. Phys., 15, 8115–8130, 2015 www.atmos-chem-phys.net/15/8115/2015/
M. Sofiev et al.: MACC regional multi-model ensemble simulations of birch pollen dispersion 8129
Prank, M., Chapman, D. S., Bullock, J. M., Belmonte, J.,
Berger, U., Dahl, A., Jäger, S., Kovtunenko, I., Magyar, D.,
Niemelä, S., Rantio-Lehtimäki, A., Rodinkova, V., Sauliene,
I., Severova, E., Sikoparija, B., and Sofiev, M.: An opera-
tional model for forecasting ragweed pollen release and dis-
persion in Europe, Agr. Forest Meteorol., 182–183, 43–53,
doi:10.1016/j.agrformet.2013.08.003, 2013.
Ranta, H. and Satri, P.: Synchronized inter-annual fluctuation of
flowering intensity affects the exposure to allergenic tree pollen
in North Europe, Grana, 46, 274–284, 2007.
Ranta, H., Oksanen, A., Hokkanen, T., Bondesman, K., and Heino,
S.: Masting by Betula-species?; applying the resource budget
model to north European data sets, Int. J. Biometeorol., 49, 146–
151, doi:10.1007/s00484-004-0228-0, 2005.
Ranta, H., Hokkanen, T., Linkosalo, T., Laukkanen, L., Bondesman,
K., and Oksanen, A.: Male flowering of birch?: Spatial synchro-
nization, year-to-year variation and relation of catkin numbers
and airborne pollen counts, For. Ecol. Manage., 255, 643–650,
doi:10.1016/j.foreco.2007.09.040, 2008.
Ranta, H., Siljamo, P., Oksanen, A., Sofiev, M., Linkosalo, T.,
Bergmann, K.-C., Bucher, E., Ekebom, A., Emberlin, J., Gehrig,
R., Hallsdottir, M., Jato, V., Jäger, S., Myszkowska, D., Paldy,
A., Ramfjord, H., Severova, E., and Thibaudon, M.: Aerial and
annual variation of birch pollen loads and a modelling system for
simulating and forecasting pollen emissions and transport at an
European scale, Aerobiol. Monogr., 1, 115–131, 2011.
Rantio-Lehtimaki, A.: Short, medium and long range transported
airborne particles in viability and antigenicity analyses, Aerobi-
ologia (Bologna), 10, 175–181, 1994.
Raynor, G. S., Ogden, E. C., and Hayes, J. V.: Dispersion and de-
position of ragweed pollen from experimental sources, J. Appl.
Meteorol. Climatol., 9, 885–895, 1970.
Robertson, L. and Langner, J.: An Eulerian Limited-Area Atmo-
spheric Transport Model, J. Appl. Meteorol., 38, 190–210, 1999.
Rönmark, E., Bjerg, A., Perzanowski, M., Platts-Mills, T., and
Lundbäck, B.: Major increase in allergic sensitization in school
children from 1996 to 2006 in Northern Sweden, J. Allergy Clin.
Immunol., 124, 1–19, doi:10.1016/j.jaci.2009.05.011, 2009.
Schaap, M., Timmermans, R. M. A., Roemer, M., Boersen, G. A.
C., Builtjes, P. J. H., Sauter, F. J., Velders, G. J. M., and Beck,
J. P.: The LOTOS-EUROS model: Description, validation and
latest developments, Int. J. Environ. Pollut., 32, 270–290, 2008.
Scott, B. C.: Parameterization of sulphate removal by precipitation,
J. Appl. Meteorol., 17, 11275–11389, 1979.
Seinfeld, J. H. and Pandis, S. N.: Atmospheric Chemistry and
Physics, 1st Edn., Wiley, New York, 1998.
Siljamo, P., Sofiev, M., Severova, E., Ranta, H., and Polevova, S.:
On influence of long-range transport of pollen grains onto pol-
linating seasons, in: Developments in Environmental Science,
edited by: Borrego, C. and Renner, E., 6. Air Polution Mod-
elling and Its Applications XVIII, 708–716, doi:10.1016/S1474-
8177(70)06074-3, 2006.
Siljamo, P., Sofiev, M., Linkosalo, T., Ranta, H., and Kukkonen,
J.: Development and application of biogenic emission term as
a basis of long-range transport of allergenic pollen, in: NATO
Science for Piece and Security Serties C: Environmental Secu-
rity, edited by: Borrego, C. and Miranda, A. I., Air Pollution
Modelling and Its Application, XIX, Springer, Springer-Verlag
Berlin, 154–162, 2008a.
Siljamo, P., Sofiev, M., Ranta, H., Linkosalo, T., Kubin, E., Ahas,
R., Genikhovich, E., Jatczak, K., Jato, V., Nekovar, J., Minin,
A., Severova, E., and Shalabova, V.: Representativeness of point-
wise phenological Betula data collected in different parts of Eu-
rope, Glob. Ecol. Biogeogr., 17, 489–502, doi:10.1111/j.1466-
8238.2008.00383.x, 2008b.
Siljamo, P., Sofiev, M., Severova, E., Ranta, H., Kukkonen,
J., Polevova, S., Kubin, E., and Minin, A.: Sources, impact
and exchange of early-spring birch pollen in the Moscow
region and Finland, Aerobiologia (Bologna), 24, 211–230,
doi:10.1007/s10453-008-9100-8, 2008c.
Siljamo, P., Sofiev, M., Filatova, E., Grewling, L., Jäger, S.,
Khoreva, E., Linkosalo, T., Ortega Jimenez, S., Ranta, H.,
Rantio-Lehtimäki, A., Svetlov, A., Veriankaite, L., Yakovleva,
E., and Kukkonen, J.: A numerical model of birch pollen
emission and dispersion in the atmosphere. Model evaluation
and sensitivity analysis, Int. J. Biometeorol., 57, 125–136,
doi:10.1007/s00484-012-0539-5, 2012.
Simpson, D., Fagerli, H., Jonson, J. E., Tsyro, S., Wind, P.,
and Tuovinen, J.-P.: Transboundary Acidification, Eutrophica-
tion and Ground Level Ozone in Europe, Part 1: Unified EMEP
Model Description, EMEP Report 1/2003, Oslo, 2003.
Simpson, D., Benedictow, A., Berge, H., Bergström, R., Emberson,
L. D., Fagerli, H., Flechard, C. R., Hayman, G. D., Gauss, M.,
Jonson, J. E., Jenkin, M. E., Nyíri, A., Richter, C., Semeena, V.
S., Tsyro, S., Tuovinen, J.-P., Valdebenito, Á., and Wind, P.: The
EMEP MSC-W chemical transport model – technical descrip-
tion, Atmos. Chem. Phys., 12, 7825–7865, doi:10.5194/acp-12-
7825-2012, 2012.
Skjøth, C. A., Sommer, J., Stach, A., Smith, M., and Brandt, J.: The
long-range transport of birch (Betula) pollen from Poland and
Germany causes significant pre-season concentrations in Den-
mark, Clin. Exp. Allergy, 37, 1204–1212, doi:10.1111/j.1365-
2222.2007.02771.x, 2007.
Skjøth, C. A., Sommer, J., Brandt, J., Hvidberg, M., Geels, C.,
Hansen, K. M., Hertel, O., Frohn, L. M., and Christensen, J. H.:
Copenhagen – a significant source of birch (Betula) pollen?, Int.
J. Biometeorol., 52, 453–462, doi:10.1007/s00484-007-0139-y,
2008.
Skjøth, C. A., Smith, M., Brandt, J., and Emberlin, J.: Are the birch
trees in Southern England a source of Betula pollen for North
London?, Int. J. Biometeorol., 53, 75–86, doi:10.1007/s00484-
008-0192-1, 2009.
Smith, M., Skjøth, C. A., Myszkowska, D., Uruska, A., Puc,
M., Stach, A., Balwierz, Z., Chlopek, K., Piotrowska, K.,
Kasprzyk, I., and Brandt, J.: Long-range transport of Am-
brosia pollen to Poland, Environ. Res., 148, 1402–1411,
doi:10.1016/j.agrformet.2008.04.005, 2008.
Smith, M., Jäger, S., Berger, U., Sikoparija, B., Hallsdottir, M.,
Sauliene, I., Bergmann, K.-C., Pashley, C.H., de Weger, L.,
Majkowska-Wojciechowska, B., Rybnícek, O., Thibaudon, M.,
Gehrig, R., Bonini, M., Yankova, R., Damialis, A., Vokou, D.,
Gutiérrez Bustillo, A. M., Hoffmann-Sommergruber, K., and van
Ree, R.: Geographic and temporal variations in pollen expo-
sure across Europe, Allergy, 69, 913–923, doi:10.1111/all.12419,
2014.
Sofiev, M.: Extended resistance analogy for construction of the ver-
tical diffusion scheme for dispersion models, J. Geophys. Res.,
107, ACH 10–1–ACH 10–8, doi:10.1029/2001JD001233, 2002.
www.atmos-chem-phys.net/15/8115/2015/ Atmos. Chem. Phys., 15, 8115–8130, 2015
8130 M. Sofiev et al.: MACC regional multi-model ensemble simulations of birch pollen dispersion
Sofiev, M. and Bergmann, K.-C. (Eds.): Allergenic pollen. A review
of production, release, distribution and health impact, Springer-
Verlag Berlin, Heidelberg, 2013.
Sofiev, M., Siljamo, P., Ranta, H., and Rantio-Lehtimaki, A.: To-
wards numerical forecasting of long-range air transport of birch
pollen: theoretical considerations and a feasibility study, Int.
J. Biometeorol., 50, 392–402, doi:10.1007/s00484-006-0027-x,
2006a.
Sofiev, M., Siljamo, P., Valkama, I., Ilvonen, M., and Kukko-
nen, J.: A dispersion modelling system SILAM and its eval-
uation against ETEX data, Atmos. Environ., 40, 674–685,
doi:10.1016/j.atmosenv.2005.09.069, 2006b.
Sofiev, M., Galperin, M. V., and Genikhovich, E.: Construction and
evaluation of Eulerian dynamic core for the air quality and emer-
gency modeling system SILAM, in: NATO Science for Piece and
Security Serties C: Environmental Security, edited by: Borrego,
C. and Miranda, A. I., Air Pollution Modelling and Its Applica-
tion, XIX, Springer-Verlag Berlin, 699–701, 2008.
Sofiev, M., Siljamo, P., Ranta, H., and Linkosalo, T.: A numerical
model of birch pollen emission and dispersion in the atmosphere,
Description of the emission module, Int. J. Biometeorol., 57, 45–
58, doi:10.1007/s00484-012-0532-z, 2012a.
Sofiev, M., Siljamo, P., Ranta, H., Linkosalo, T., Jaeger, S., Jaeger,
C., Rassmussen, A., Severova, E., Oksanen, A., Karppinen, A.,
and Kukkonen, J.: From Russia to Iceland: an evaluation of
a large-scale pollen and chemical air pollution episode during
April and May, 2006, in: Aerobiological Monographs, Towards
a Comprehensive Vision, edited by: Clot, B., Comtois, P., and
Escamilla-Garcia, B., 95–113, 2012b.
Stach, A., Smith, M., Skjøth, C. A., and Brandt, J.: Examining Am-
brosia pollen episodes at Poznan (Poland) using back-trajectory
analysis, Int. J. Biometeorol., 51, 275–286, doi:10.1007/s00484-
006-0068-1, 2007.
Tampieri, F., Mandrioli, P., and Puppi, G. L.: Medium range trans-
port of airborne pollen, Agric. Meteorol., 18, 9–20, 1977.
Venkatram, A.: Estimating the convective velocity scale for diffu-
sion applications, Bound. Lay.-Meteorol., 15, 447–452, 1978.
Veriankaite, L., Siljamo, P., Sofiev, M., Sauliene, I., and Kukko-
nen, J.: Modelling analysis of source regions of long-range trans-
ported birch pollen that influences allergenic seasons in Lithua-
nia, Aerobiologia (Bologna), 26, 47–62, doi:10.1007/s10453-
009-9142-6, 2010.
Viander, M. and Koivikko, A.: The seasonal symptoms of hyposen-
sitized and untreated hay fever patients in relation to birch pollen
counts: correlation with nasal sensitivity, prick tests and RAST,
Clin. Allergy, 8, 387–396, 1978.
Vira, J. and Sofiev, M.: On variational data assimilation for estimat-
ing the model initial conditions and emission fluxes for short-
term forecasting of SOx concentrations, Atmos. Environ., 46,
318–328, doi:10.1016/j.atmosenv.2011.09.066, 2012.
Vogel, H., Pauling, A., and Vogel, B.: Numerical simulation of
birch pollen dispersion with an operational weather forecast sys-
tem, Int. J. Biometeorol., 52, 805–814, doi:10.1007/s00484-008-
0174-3, 2008.
Walcek, C. J. and Aleksic, N. M.: A simple but accurate mass con-
servative, peak-preserving, mixing ratio bounded advection algo-
rithm with FORTRAN code, Atmos. Environ., 32, 3863–3880,
doi:10.1016/S1352-2310(98)00099-5, 1998.
WHO: Phenology and human health: allergic disorders, Copen-
hagen, 2003.
Williamson, D. L. and Rasch, P.: Two-Dimensional Semi-
Lagrangian Transport with Shape-Preserving Interpolation, Am.
Meteorol. Soc., 117, 102–129, 1989.
Wright, J. W.: Pollen dispersion of some forest trees., Northeastern
Forest Experiment Station, Forest Service, U.S. Dept. of Agri-
culture, Station paper 46, February 1952, 42 pp., 1952.
Wright, J. W.: Pollen dispersion studies: Some practical applica-
tions, J. Forestry, 114–118, 1953.
Yli-Panula, E., Fekedulegn, D. B., Green, B. J., and Ranta, H.:
Analysis of Airborne Betula Pollen in Finland?; a 31-Year Per-
spective, Int. J. Environ. Res. Public Health, 6, 1706–1723,
doi:10.3390/ijerph6061706, 2009.
Zhang, L., Gong, S., Padro, J., and Barrie, L.: A size-segregated par-
ticle dry deposition scheme for an atmospheric aerosol module,
Atmos. Environ., 35, 549–560, 2001.
Zink, K., Pauling, A., Rotach, M. W., Vogel, H., Kaufmann, P., and
Clot, B.: EMPOL 1.0: a new parameterization of pollen emission
in numerical weather prediction models, Geosci. Model Dev., 6,
1961–1975, doi:10.5194/gmd-6-1961-2013, 2013.
Atmos. Chem. Phys., 15, 8115–8130, 2015 www.atmos-chem-phys.net/15/8115/2015/