Long-Term Population Cycles in Human Societies · Long-Term Population Cycles in Human Societies...
17
THE YEAR IN ECOLOGY AND CONSERVATION BIOLOGY, 2009 Long-Term Population Cycles in Human Societies Peter Turchin Department of Ecology and Evolutionary Biology, University of Connecticut, Storrs, Connecticut, USA Human population dynamics are usually conceptualized as either boundless growth or growth to an equilibrium. The implicit assumption underlying these paradigms is that any feedback processes regulating population density, if they exist, operate on a fast-time-scale, and therefore we do not expect to observe population oscillations in human population numbers. This review asks, are population processes in historical and prehistorical human populations characterized by second-order feedback loops, that is, regulation involving lags? If yes, then the implications for forecasting future population change are obvious—what may appear as inexplicable, exogenously driven reverses in population trends may actually be a result of feedbacks operating with substantial time lags. This survey of a variety of historical and archeological data indicates that slow oscillations in population numbers, with periods of roughly two to three centuries, are observed in a number of world regions and historical periods. Next, a potential explanation for this pattern, the demographic-structural theory, is discussed. Finally, the implications of these results for global population forecasts is discussed. Key words: human; population; cycles; history; dynamics; global Introduction Long-term human population dynamics are often portrayed as an almost inexorable expo- nential growth. During the 1960s, it even ap- peared that global population was growing at a faster-than-exponential rate, leading to pre- dictions of “Doomsday” that was to occur on Friday, November 13, 2026 (Von Foerster et al. 1960, Berryman and Valenti 1994). During the 1990s, when a noticeable decline in global pop- ulation growth rate took place (due largely to precipitous drops in birth rates of populous developing countries, primarily China and In- dia), it became clear that erstwhile predictions of doom (Ehrlich 1968) were unsustainable. In fact, with most European countries experi- encing population declines (which is especially noticeable in Eastern European countries, but Address for correspondence: Peter Turchin, Department of Ecology and Evolutionary Biology, University of Connecticut, Storrs, CT 06269. [email protected] would be as pronounced in Western Europe, except for a masking effect of immigration), the discussion in the popular press shifted to the op- posite tack. Now predictions are equally dire, but instead of fearing population explosion, we are supposed to worry about how to support increasing numbers of retirees on a shrinking base of the working population. Some of the current numerical predictions are as extreme as previous doomsday warnings. For example, the popular press in Russia routinely publishes predictions that the population of that country will be halved by 2050. Although many media reports have a sensa- tionalist, and even hysterical quality, the main question as to what will happen to popula- tions of different countries, as well as the to- tal population of the Earth, is very impor- tant. The numbers and structure of human populations have an enormous impact on the well-being of individuals, societies, and the biosphere. Yet, I would argue, the majority of forecasts are based on models of human The Year in Ecology and Conservation Biology, 2009: Ann. N.Y. Acad. Sci. 1162: 1–17 (2009). doi: 10.1111/j.1749-6632.2009.04447.x c 2009 New York Academy of Sciences. 1
Transcript of Long-Term Population Cycles in Human Societies · Long-Term Population Cycles in Human Societies...

THE YEAR IN ECOLOGY AND CONSERVATION BIOLOGY, 2009
Long-Term Population Cyclesin Human Societies
Peter Turchin
Department of Ecology and Evolutionary Biology, University of Connecticut,Storrs, Connecticut, USA
Human population dynamics are usually conceptualized as either boundless growthor growth to an equilibrium. The implicit assumption underlying these paradigms isthat any feedback processes regulating population density, if they exist, operate ona fast-time-scale, and therefore we do not expect to observe population oscillations inhuman population numbers. This review asks, are population processes in historical andprehistorical human populations characterized by second-order feedback loops, that is,regulation involving lags? If yes, then the implications for forecasting future populationchange are obvious—what may appear as inexplicable, exogenously driven reversesin population trends may actually be a result of feedbacks operating with substantialtime lags. This survey of a variety of historical and archeological data indicates thatslow oscillations in population numbers, with periods of roughly two to three centuries,are observed in a number of world regions and historical periods. Next, a potentialexplanation for this pattern, the demographic-structural theory, is discussed. Finally,the implications of these results for global population forecasts is discussed.
Key words: human; population; cycles; history; dynamics; global
Introduction
Long-term human population dynamics areoften portrayed as an almost inexorable expo-nential growth. During the 1960s, it even ap-peared that global population was growing ata faster-than-exponential rate, leading to pre-dictions of “Doomsday” that was to occur onFriday, November 13, 2026 (Von Foerster et al.
1960, Berryman and Valenti 1994). During the1990s, when a noticeable decline in global pop-ulation growth rate took place (due largely toprecipitous drops in birth rates of populousdeveloping countries, primarily China and In-dia), it became clear that erstwhile predictionsof doom (Ehrlich 1968) were unsustainable.In fact, with most European countries experi-encing population declines (which is especiallynoticeable in Eastern European countries, but
Address for correspondence: Peter Turchin, Department of Ecologyand Evolutionary Biology, University of Connecticut, Storrs, CT [email protected]
would be as pronounced in Western Europe,except for a masking effect of immigration), thediscussion in the popular press shifted to the op-posite tack. Now predictions are equally dire,but instead of fearing population explosion, weare supposed to worry about how to supportincreasing numbers of retirees on a shrinkingbase of the working population. Some of thecurrent numerical predictions are as extremeas previous doomsday warnings. For example,the popular press in Russia routinely publishespredictions that the population of that countrywill be halved by 2050.
Although many media reports have a sensa-tionalist, and even hysterical quality, the mainquestion as to what will happen to popula-tions of different countries, as well as the to-tal population of the Earth, is very impor-tant. The numbers and structure of humanpopulations have an enormous impact on thewell-being of individuals, societies, and thebiosphere. Yet, I would argue, the majorityof forecasts are based on models of human
The Year in Ecology and Conservation Biology, 2009: Ann. N.Y. Acad. Sci. 1162: 1–17 (2009).doi: 10.1111/j.1749-6632.2009.04447.x c© 2009 New York Academy of Sciences.
1

2 Annals of the New York Academy of Sciences
population dynamics that are fundamentallyflawed. The simplest forecasting devices aredeterministic extrapolations of current trends.These approaches may employ the exponentialmodel, or even faster-than-exponential growth,as in the Doomsday model. A somewhat moresophisticated approach is to allow for changein demographic rates (birth, death, migration),but still to assume that these processes aredriven by exogenous influences (which can bemodeled either stochastically, or by assuminga deterministic trend). Note that these stan-dard approaches to forecasting human popula-tion are essentially zero-order models, becausethey do not take into account potential feed-backs from population density to demographicrates. Zero-order dynamics are nonequilibrial;depending on parameters, the population num-bers either increase to infinity or decline tozero (Turchin 2003a, p. 37). Including den-sity dependence in population-growth models(the canonical model in population ecology isthe logistic) leads to first-order dynamical pro-cesses, characterized by a convergence to anequilibrium (often called the carrying capacity).Demographers of the human population be-gan seriously entertaining density-dependentmodels much later than population ecolo-gists working with nonhuman animals (Lee1987).
First-order feedbacks act on a fast-time-scale.For example, in a territorial mammal, as soonas population has increased to the point whereall available territories are occupied, any sur-plus animals become nonterritorial “floaters”with poor survival rates and zero reproductiveprospects. Thus, as soon as population num-bers reach the carrying capacity determinedby the total number of territories, populationgrowth rate is reduced to zero without anytime lag. Some regulatory processes, however,act on a slow-time-scale (these are second-order feedbacks). The paradigmatic exampleof a second-order dynamical process in animalecology is the interaction between predatorsand prey. When a population of prey reaches ahigh enough density for a predator population
to begin increasing, there is no immediate ef-fect on the prey’s population growth rate. Thishappens because it takes time for the predatornumbers to increase to the level where they be-gin affecting prey numbers. Furthermore, oncethere are many predators, and the prey popu-lation has started collapsing, the predators con-tinue to drive prey numbers down. Even thoughthere are few prey, and most predators arestarving, it takes time for predators to die out.As a result, second-order population feedbacksact with a substantial lag and tend to induceoscillations.
As I have argued in Complex Population Dy-
namics (Turchin 2003a), such second-order pro-cesses as interactions between predators andprey, hosts and parasitoids or parasites, andplants and herbivores (generally known astrophic interactions) are very important driversof population fluctuations. The great majorityof population cycles in nature are driven bytrophic mechanisms (Turchin 2003a, p. 384).In contrast, human demographers, as far as Iknow, do not consider second-order processeswhen modeling and forecasting human popula-tion dynamics. There has been some discussionof demographic cycles, for example, oscillationsin the population age structure with the periodroughly equal to one human generation (ca.25 years). Another kind of cycle is character-ized by an alternation of high fecundity–lowfecundity generations, with an overall period ofroughly 50 years (Easterlin 1980; Wachter andLee 1989). In population ecology, such oscil-lations are often called generation cycles andfirst-order cycles, respectively (Turchin 2003a,25). As we shall see in the following sections,second-order cycles should be characterized bymuch longer periods.
This review asks, are population processes inhistorical and prehistorical human populationscharacterized by second-order feedback loops?If yes, then the implications for forecastingfuture population change are obvious—whatmay appear as inexplicable, exogenously drivenreverses in population trends may actually bea result of feedbacks operating with substantial
Turchin: Long-Term Population Cycles in Human Societies 3
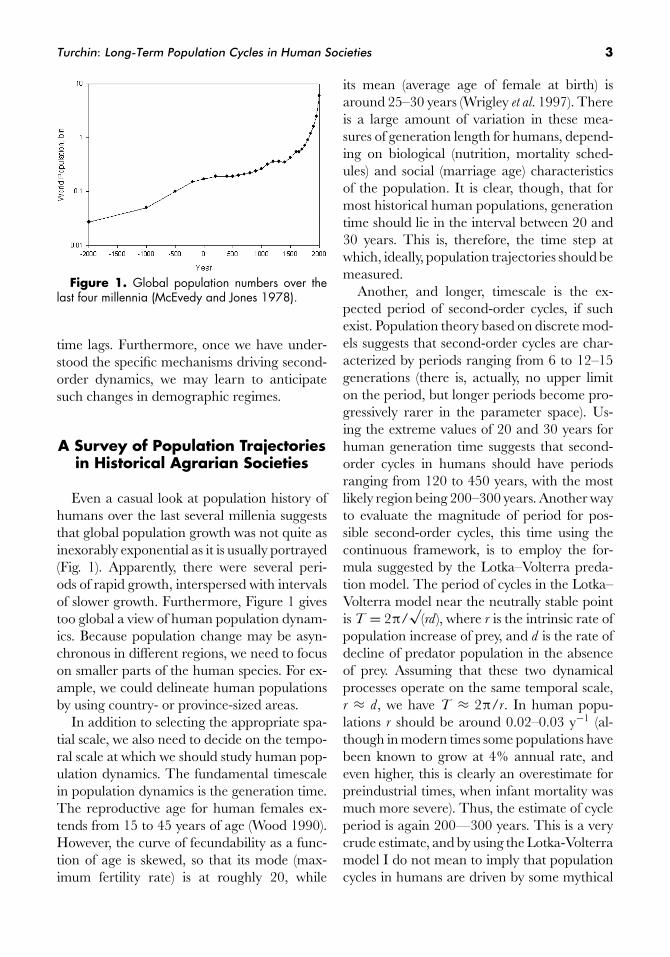
Figure 1. Global population numbers over thelast four millennia (McEvedy and Jones 1978).
time lags. Furthermore, once we have under-stood the specific mechanisms driving second-order dynamics, we may learn to anticipatesuch changes in demographic regimes.
A Survey of Population Trajectoriesin Historical Agrarian Societies
Even a casual look at population history ofhumans over the last several millenia suggeststhat global population growth was not quite asinexorably exponential as it is usually portrayed(Fig. 1). Apparently, there were several peri-ods of rapid growth, interspersed with intervalsof slower growth. Furthermore, Figure 1 givestoo global a view of human population dynam-ics. Because population change may be asyn-chronous in different regions, we need to focuson smaller parts of the human species. For ex-ample, we could delineate human populationsby using country- or province-sized areas.
In addition to selecting the appropriate spa-tial scale, we also need to decide on the tempo-ral scale at which we should study human pop-ulation dynamics. The fundamental timescalein population dynamics is the generation time.The reproductive age for human females ex-tends from 15 to 45 years of age (Wood 1990).However, the curve of fecundability as a func-tion of age is skewed, so that its mode (max-imum fertility rate) is at roughly 20, while
its mean (average age of female at birth) isaround 25–30 years (Wrigley et al. 1997). Thereis a large amount of variation in these mea-sures of generation length for humans, depend-ing on biological (nutrition, mortality sched-ules) and social (marriage age) characteristicsof the population. It is clear, though, that formost historical human populations, generationtime should lie in the interval between 20 and30 years. This is, therefore, the time step atwhich, ideally, population trajectories should bemeasured.
Another, and longer, timescale is the ex-pected period of second-order cycles, if suchexist. Population theory based on discrete mod-els suggests that second-order cycles are char-acterized by periods ranging from 6 to 12–15generations (there is, actually, no upper limiton the period, but longer periods become pro-gressively rarer in the parameter space). Us-ing the extreme values of 20 and 30 years forhuman generation time suggests that second-order cycles in humans should have periodsranging from 120 to 450 years, with the mostlikely region being 200–300 years. Another wayto evaluate the magnitude of period for pos-sible second-order cycles, this time using thecontinuous framework, is to employ the for-mula suggested by the Lotka–Volterra preda-tion model. The period of cycles in the Lotka–Volterra model near the neutrally stable pointis T = 2π/
√(rd ), where r is the intrinsic rate of
population increase of prey, and d is the rate ofdecline of predator population in the absenceof prey. Assuming that these two dynamicalprocesses operate on the same temporal scale,r ≈ d, we have T ≈ 2π/r. In human popu-lations r should be around 0.02–0.03 y−1 (al-though in modern times some populations havebeen known to grow at 4% annual rate, andeven higher, this is clearly an overestimate forpreindustrial times, when infant mortality wasmuch more severe). Thus, the estimate of cycleperiod is again 200—300 years. This is a verycrude estimate, and by using the Lotka-Volterramodel I do not mean to imply that populationcycles in humans are driven by some mythical

4 Annals of the New York Academy of Sciences
predators. Rather, I am using Lotka–Volterraequations as a generic model of second-orderoscillations (it is the simplest possible system ofordinary differential equations that generatescycles). To sum, we expect that second-order cy-cles in human populations, if they exist, shouldbe characterized by periods of two to three cen-turies. Thus, in order to detect such cycles weneed multicentury time series. I now turn todata.
Western Europe
The first place to look for data is the popu-lation atlas of McEvedy and Jones (1978). Thetemporal resolution used in the atlas (a timestep of 100 years after 1000 CE and 50 yearsafter 1500 CE) is not sufficiently fine to sta-tistically analyze the data, but for some areaswhere long-term population history is reason-ably well known, like Western Europe, the over-all pattern is quite striking (Fig. 2). The figureplots population trajections in just two coun-tries, but others exhibit a qualitatively similarpattern. First, there is an overall increase in av-erage population density. Second, around thismillennial trend there are two secular cycles,with peaks ca. 1300 and 1600.
The millennial trend reflects the gradual so-cial evolution (which greatly accelerates afterthe end of the agrarian period, but in this re-view I focus on preindustrial societies). Else-where (see Figure 3.10 in Turchin and Nefedov2008) I made some quantitative estimates of thisaccumulation of knowledge and technology inthe context of one case study: England between1150 and 1800. The secular oscillations appearto have the right period for second-order cycles,but we need more information before drawingany definitive conclusions.
China
Is this pattern of secular oscillations arounda milennial trend specific to Europe, or does ithold more generally for agrarian societies? Toanswer this question, we travel to the opposite
Figure 2. Population dynamics in Czechoslo-vakia and Spain, 1100–1800 (McEvedy and Jones1978).
end of Eurasia. Ever since the first imperialunification by the Qin dynasty in 221 BCE, thecentral authorities conducted detailed censusesfor tax purposes. As a result, we have a recordof Chinese population dynamics extending overtwo thousand years, although it has significantgaps during the periods of internal disunity andcivil war.
Interpretation of the transmitted numbers isplagued by several difficulties. During the laterstages of dynastic cycles, corrupt or lazy officialsoften falsified or even fabricated outright popu-lation data (Ho 1959). Conversion coefficientsbetween the number of taxable households andthe actual population are often unknown, and itis possible that these coefficients changed fromdynasty to dynasty. The area controlled by thestate also continually changed. Finally, it is of-ten difficult to determine whether the number
Turchin: Long-Term Population Cycles in Human Societies 5
of taxable households declined during the timesof trouble as a result of demographic change(death, emigration), or as a result of the state’sfailure to control and enumerate the subjectpopulation. Thus, there is a certain degree ofcontroversy among the experts as to preciselywhat the numbers mean (Ho 1959; Durand1960; Song et al. 1985). The disagreements,however, primarily concern absolute popula-tion levels, while there is a substantial degreeof agreement on the relative changes in popu-lation density (which are, of course, of primaryinterests to our purposes). Chinese population,essentially, expanded during periods of politicalstability and declined (sometimes precipitously)during periods of unrest. As a result, populationmovements closely mirror the “dynastic cycle”in China (Ho 1959; Reinhard et al. 1968; Chuand Lee 1994).
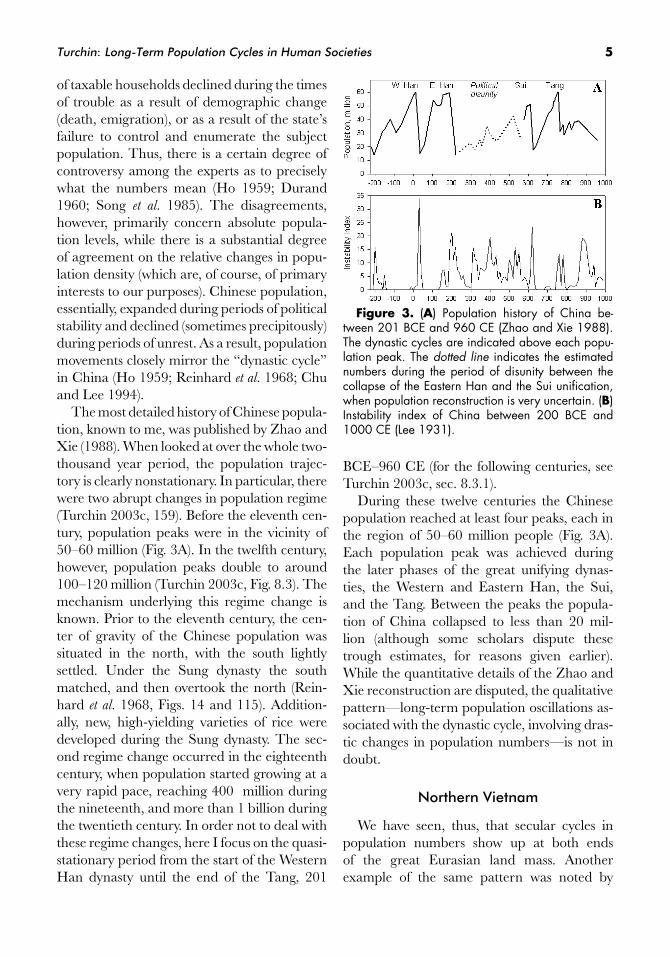
The most detailed history of Chinese popula-tion, known to me, was published by Zhao andXie (1988). When looked at over the whole two-thousand year period, the population trajec-tory is clearly nonstationary. In particular, therewere two abrupt changes in population regime(Turchin 2003c, 159). Before the eleventh cen-tury, population peaks were in the vicinity of50–60 million (Fig. 3A). In the twelfth century,however, population peaks double to around100–120 million (Turchin 2003c, Fig. 8.3). Themechanism underlying this regime change isknown. Prior to the eleventh century, the cen-ter of gravity of the Chinese population wassituated in the north, with the south lightlysettled. Under the Sung dynasty the southmatched, and then overtook the north (Rein-hard et al. 1968, Figs. 14 and 115). Addition-ally, new, high-yielding varieties of rice weredeveloped during the Sung dynasty. The sec-ond regime change occurred in the eighteenthcentury, when population started growing at avery rapid pace, reaching 400 million duringthe nineteenth, and more than 1 billion duringthe twentieth century. In order not to deal withthese regime changes, here I focus on the quasi-stationary period from the start of the WesternHan dynasty until the end of the Tang, 201
Figure 3. (A) Population history of China be-tween 201 BCE and 960 CE (Zhao and Xie 1988).The dynastic cycles are indicated above each popu-lation peak. The dotted line indicates the estimatednumbers during the period of disunity between thecollapse of the Eastern Han and the Sui unification,when population reconstruction is very uncertain. (B)Instability index of China between 200 BCE and1000 CE (Lee 1931).
BCE–960 CE (for the following centuries, seeTurchin 2003c, sec. 8.3.1).
During these twelve centuries the Chinesepopulation reached at least four peaks, each inthe region of 50–60 million people (Fig. 3A).Each population peak was achieved duringthe later phases of the great unifying dynas-ties, the Western and Eastern Han, the Sui,and the Tang. Between the peaks the popula-tion of China collapsed to less than 20 mil-lion (although some scholars dispute thesetrough estimates, for reasons given earlier).While the quantitative details of the Zhao andXie reconstruction are disputed, the qualitativepattern—long-term population oscillations as-sociated with the dynastic cycle, involving dras-tic changes in population numbers—is not indoubt.
Northern Vietnam
We have seen, thus, that secular cycles inpopulation numbers show up at both endsof the great Eurasian land mass. Anotherexample of the same pattern was noted by
6 Annals of the New York Academy of Sciences
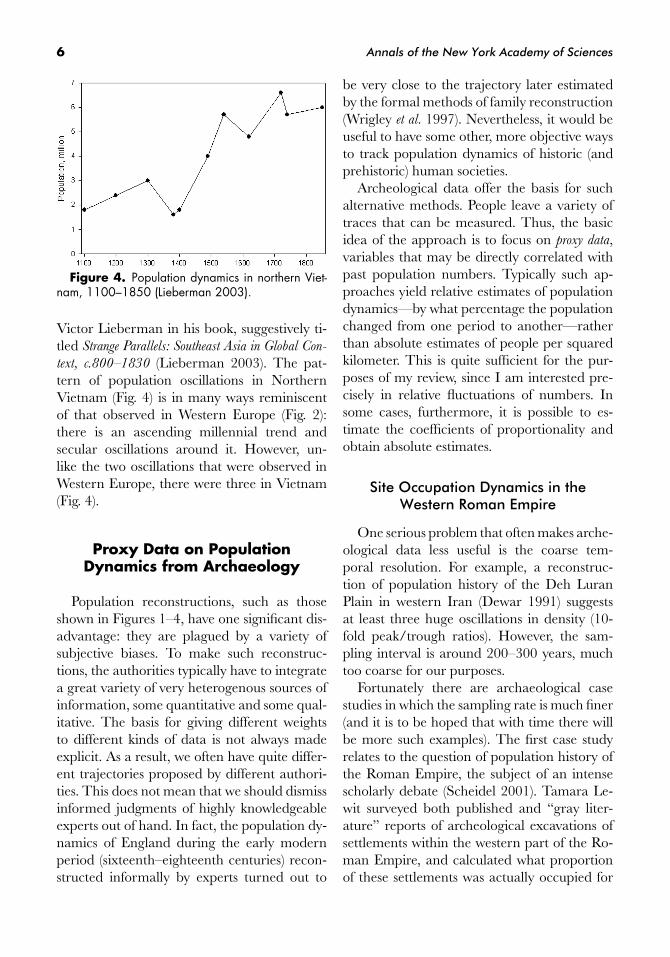
Figure 4. Population dynamics in northern Viet-nam, 1100–1850 (Lieberman 2003).
Victor Lieberman in his book, suggestively ti-tled Strange Parallels: Southeast Asia in Global Con-
text, c.800–1830 (Lieberman 2003). The pat-tern of population oscillations in NorthernVietnam (Fig. 4) is in many ways reminiscentof that observed in Western Europe (Fig. 2):there is an ascending millennial trend andsecular oscillations around it. However, un-like the two oscillations that were observed inWestern Europe, there were three in Vietnam(Fig. 4).
Proxy Data on PopulationDynamics from Archaeology
Population reconstructions, such as thoseshown in Figures 1–4, have one significant dis-advantage: they are plagued by a variety ofsubjective biases. To make such reconstruc-tions, the authorities typically have to integratea great variety of very heterogenous sources ofinformation, some quantitative and some qual-itative. The basis for giving different weightsto different kinds of data is not always madeexplicit. As a result, we often have quite differ-ent trajectories proposed by different authori-ties. This does not mean that we should dismissinformed judgments of highly knowledgeableexperts out of hand. In fact, the population dy-namics of England during the early modernperiod (sixteenth–eighteenth centuries) recon-structed informally by experts turned out to
be very close to the trajectory later estimatedby the formal methods of family reconstruction(Wrigley et al. 1997). Nevertheless, it would beuseful to have some other, more objective waysto track population dynamics of historic (andprehistoric) human societies.
Archeological data offer the basis for suchalternative methods. People leave a variety oftraces that can be measured. Thus, the basicidea of the approach is to focus on proxy data,variables that may be directly correlated withpast population numbers. Typically such ap-proaches yield relative estimates of populationdynamics—by what percentage the populationchanged from one period to another—ratherthan absolute estimates of people per squaredkilometer. This is quite sufficient for the pur-poses of my review, since I am interested pre-cisely in relative fluctuations of numbers. Insome cases, furthermore, it is possible to es-timate the coefficients of proportionality andobtain absolute estimates.
Site Occupation Dynamics in theWestern Roman Empire
One serious problem that often makes arche-ological data less useful is the coarse tem-poral resolution. For example, a reconstruc-tion of population history of the Deh LuranPlain in western Iran (Dewar 1991) suggestsat least three huge oscillations in density (10-fold peak/trough ratios). However, the sam-pling interval is around 200–300 years, muchtoo coarse for our purposes.
Fortunately there are archaeological casestudies in which the sampling rate is much finer(and it is to be hoped that with time there willbe more such examples). The first case studyrelates to the question of population history ofthe Roman Empire, the subject of an intensescholarly debate (Scheidel 2001). Tamara Le-wit surveyed both published and “gray liter-ature” reports of archeological excavations ofsettlements within the western part of the Ro-man Empire, and calculated what proportionof these settlements was actually occupied for
Turchin: Long-Term Population Cycles in Human Societies 7
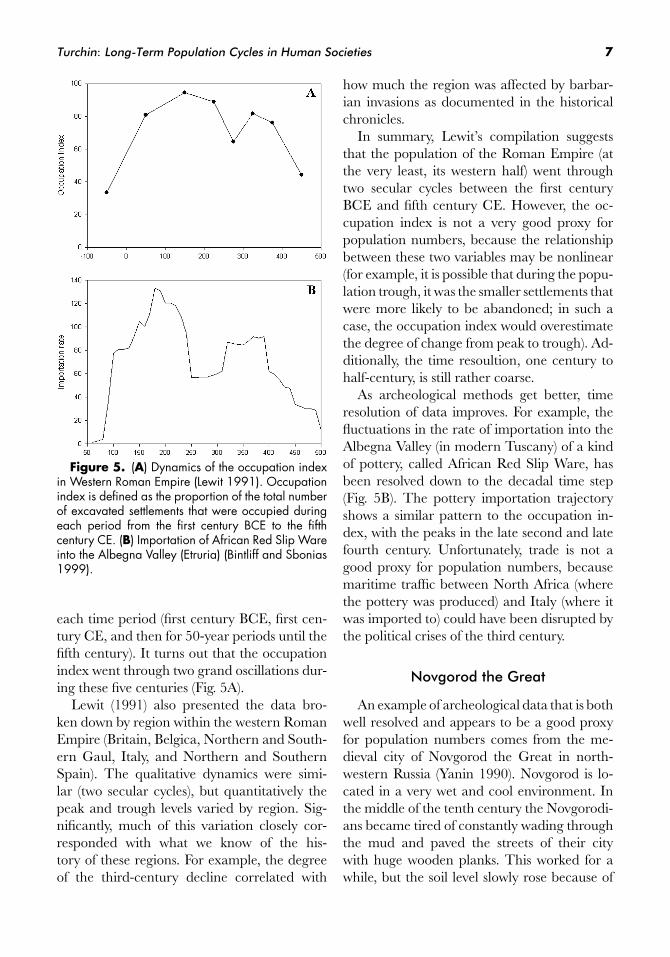
Figure 5. (A) Dynamics of the occupation indexin Western Roman Empire (Lewit 1991). Occupationindex is defined as the proportion of the total numberof excavated settlements that were occupied duringeach period from the first century BCE to the fifthcentury CE. (B) Importation of African Red Slip Wareinto the Albegna Valley (Etruria) (Bintliff and Sbonias1999).
each time period (first century BCE, first cen-tury CE, and then for 50-year periods until thefifth century). It turns out that the occupationindex went through two grand oscillations dur-ing these five centuries (Fig. 5A).
Lewit (1991) also presented the data bro-ken down by region within the western RomanEmpire (Britain, Belgica, Northern and South-ern Gaul, Italy, and Northern and SouthernSpain). The qualitative dynamics were simi-lar (two secular cycles), but quantitatively thepeak and trough levels varied by region. Sig-nificantly, much of this variation closely cor-responded with what we know of the his-tory of these regions. For example, the degreeof the third-century decline correlated with
how much the region was affected by barbar-ian invasions as documented in the historicalchronicles.
In summary, Lewit’s compilation suggeststhat the population of the Roman Empire (atthe very least, its western half) went throughtwo secular cycles between the first centuryBCE and fifth century CE. However, the oc-cupation index is not a very good proxy forpopulation numbers, because the relationshipbetween these two variables may be nonlinear(for example, it is possible that during the popu-lation trough, it was the smaller settlements thatwere more likely to be abandoned; in such acase, the occupation index would overestimatethe degree of change from peak to trough). Ad-ditionally, the time resoultion, one century tohalf-century, is still rather coarse.
As archeological methods get better, timeresolution of data improves. For example, thefluctuations in the rate of importation into theAlbegna Valley (in modern Tuscany) of a kindof pottery, called African Red Slip Ware, hasbeen resolved down to the decadal time step(Fig. 5B). The pottery importation trajectoryshows a similar pattern to the occupation in-dex, with the peaks in the late second and latefourth century. Unfortunately, trade is not agood proxy for population numbers, becausemaritime traffic between North Africa (wherethe pottery was produced) and Italy (where itwas imported to) could have been disrupted bythe political crises of the third century.
Novgorod the Great
An example of archeological data that is bothwell resolved and appears to be a good proxyfor population numbers comes from the me-dieval city of Novgorod the Great in north-western Russia (Yanin 1990). Novgorod is lo-cated in a very wet and cool environment. Inthe middle of the tenth century the Novgorodi-ans became tired of constantly wading throughthe mud and paved the streets of their citywith huge wooden planks. This worked for awhile, but the soil level slowly rose because of
8 Annals of the New York Academy of Sciences
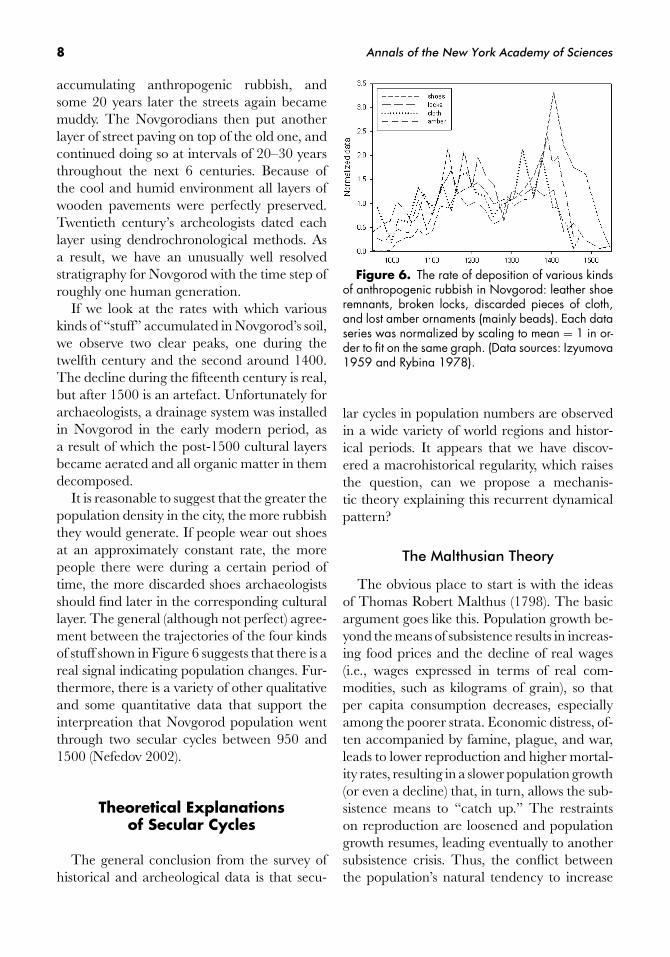
accumulating anthropogenic rubbish, andsome 20 years later the streets again becamemuddy. The Novgorodians then put anotherlayer of street paving on top of the old one, andcontinued doing so at intervals of 20–30 yearsthroughout the next 6 centuries. Because ofthe cool and humid environment all layers ofwooden pavements were perfectly preserved.Twentieth century’s archeologists dated eachlayer using dendrochronological methods. Asa result, we have an unusually well resolvedstratigraphy for Novgorod with the time step ofroughly one human generation.
If we look at the rates with which variouskinds of “stuff” accumulated in Novgorod’s soil,we observe two clear peaks, one during thetwelfth century and the second around 1400.The decline during the fifteenth century is real,but after 1500 is an artefact. Unfortunately forarchaeologists, a drainage system was installedin Novgorod in the early modern period, asa result of which the post-1500 cultural layersbecame aerated and all organic matter in themdecomposed.
It is reasonable to suggest that the greater thepopulation density in the city, the more rubbishthey would generate. If people wear out shoesat an approximately constant rate, the morepeople there were during a certain period oftime, the more discarded shoes archaeologistsshould find later in the corresponding culturallayer. The general (although not perfect) agree-ment between the trajectories of the four kindsof stuff shown in Figure 6 suggests that there is areal signal indicating population changes. Fur-thermore, there is a variety of other qualitativeand some quantitative data that support theinterpreation that Novgorod population wentthrough two secular cycles between 950 and1500 (Nefedov 2002).
Theoretical Explanationsof Secular Cycles
The general conclusion from the survey ofhistorical and archeological data is that secu-
Figure 6. The rate of deposition of various kindsof anthropogenic rubbish in Novgorod: leather shoeremnants, broken locks, discarded pieces of cloth,and lost amber ornaments (mainly beads). Each dataseries was normalized by scaling to mean = 1 in or-der to fit on the same graph. (Data sources: Izyumova1959 and Rybina 1978).
lar cycles in population numbers are observedin a wide variety of world regions and histor-ical periods. It appears that we have discov-ered a macrohistorical regularity, which raisesthe question, can we propose a mechanis-tic theory explaining this recurrent dynamicalpattern?
The Malthusian Theory
The obvious place to start is with the ideasof Thomas Robert Malthus (1798). The basicargument goes like this. Population growth be-yond the means of subsistence results in increas-ing food prices and the decline of real wages(i.e., wages expressed in terms of real com-modities, such as kilograms of grain), so thatper capita consumption decreases, especiallyamong the poorer strata. Economic distress, of-ten accompanied by famine, plague, and war,leads to lower reproduction and higher mortal-ity rates, resulting in a slower population growth(or even a decline) that, in turn, allows the sub-sistence means to “catch up.” The restraintson reproduction are loosened and populationgrowth resumes, leading eventually to anothersubsistence crisis. Thus, the conflict betweenthe population’s natural tendency to increase
Turchin: Long-Term Population Cycles in Human Societies 9
and the limitations imposed by the availabil-ity of food result in the tendency of popu-lation numbers to oscillate. Malthus’s theorywas extended and further developed by DavidRicardo in his theories of diminishing returnsand rent (Ricardo 1817). In the twentieth cen-tury the argument was taken up by such neo-Malthusians as Wilhelm Abel, Michael Postan,and Emmanuel Le Roy Ladurie (Postan 1966;Le Roy Ladurie 1974; Abel 1980).
There are problems with this argument,some empirical (which will be dealt with in alater section) and some theoretical. The the-oretical problem becomes apparent when werephrase the Malthusian argument using theterms of modern population dynamics. Let usassume that the rate of technological progressoccurs on a slower timescale compared to thescale of secular cycles (this appears to be areasonable assumption for preindustrial soci-eties). Thus, the carrying capacity K will beset by the amount of land available for agricul-ture and the current agrarian technology (yieldsper unit of area). As population approachesthe carrying capacity, all available land willbe cultivated. Further increase of populationnumbers immediately (without a time lag) re-sults in lower average consumption rates. Sincethere is no time lag, there should be no over-shoot of the carrying capacity, and the pop-ulation numbers should equilibrate at K . Inother words, we are dealing here with a first-order dynamical process, the simplest modelfor which would be the logistic equation, andthe end result of our assumptions is not cy-cles, but a stable equilibrium. A discrete first-order process can generate cycles of alternatinghigh-density/low-density generations, but sucha model is inappropriate for human populationwith overlapping generations. Furthermore, aswe have seen in the data survey, secular cyclesare characterized by ascending and descend-ing phases several generations long. These areclearly second-order processes, and thus the ex-planatory model should be a system of equa-tions with population numbers N interactingwith some other dynamical factor X (or X ,
Y , . . . if there are more than one). The Malthu-sian theory does not provide a clear answer justwhat this factor X might be.
The Demographic–Structural Theory
Although Malthus mentioned war as one ofthe consequences of population growth, he didnot develop this line of reasoning in any detail.The neo-Malthusian theory of the twentiethcentury was concerned almost exclusively withthe demographic and economic variables. Asignificant extension of the Malthusian modelwas achieved by the historical sociologist JackGoldstone (1991), who focused on indirect ef-fects of population growth on society’s struc-tures. More specifically, Goldstone argued thatexcessive population growth has several effectson social institutions. First, it leads to persistentprice inflation, falling real wages, rural misery,urban migration, and increased frequency offood riots and wage protests (this is essentiallythe Malthusian component). Second, and evenmore important, rapid expansion of popula-tion results in an increased number of aspirantsfor elite positions. Increased intraelite compe-tition leads to the formation of rival patronagenetworks vying for state rewards. As a result,elites become riven by increasing rivalry andfactionalism. Third, population growth leadsto expansion of the army and the bureaucracyand rising real costs. States have no choice butto seek to expand taxation, despite resistancefrom the elites and the general populace. Yetattempts to increase revenues cannot offset thespiraling state expenses. Thus, even if the statesucceeds in raising taxes, it is still headed forfiscal crisis. As all these trends intensify, the endresult is state bankruptcy and consequent lossof the military control; elite movements of re-gional and national rebellion; and a combina-tion of elite-mobilized and popular uprisingsthat follow the breakdown of central authority(Goldstone 1991).
Goldstone’s focus was on the effects ofpopulation growth on sociopolitical instabil-ity. But it stands to reason that there is also a
10 Annals of the New York Academy of Sciences
feedback effect of instability on population dy-namics (Turchin 2003c). Most obviously, whenthe state is weak or absent, the populationwill suffer from elevated mortality due to in-creased crime, banditry, and internal and ex-ternal warfare. Additionally, the times of trou-bles cause increased migration rate, as refugeesflee war-affected areas. Migration may leadto emigration (and we can simply add thatto mortality) and to spread of epidemics. In-creased vagrancy spreads the disease by con-necting areas that would stay isolated duringbetter times. As vagabonds and beggars ag-gregate in towns and cities, they may tip thepopulation density over the epidemiologicalthreshold (a critical density above which a dis-ease spreads). Finally, political instability causeslower reproduction rates, because during un-certain times people choose to marry later andto have fewer children. People’s choices abouttheir family sizes may be reflected not onlyin birth rates, but also in increased rates ofinfanticide.
Instability can also affect the productive ca-pacity of the society. First, the state offers pro-tection. In a stateless society people can liveonly in natural strongholds, or places that canbe made defensible. Examples include the hill-fort chiefdoms in Peru before Inca conquest(Earle 1991), and the movement of settlementsto hilltops in Italy after the collapse of the Ro-man Empire (Wickham 1981). Fearful of at-tack, peasants can cultivate only a small pro-portion of productive area that is near fortifiedsettlements. The strong state protects the pro-ductive population from external and internal(banditry, civil war) threats, and thus allows thewhole cultivable area to be put into produc-tion. Second, states often invest in increasingthe agricultural productivity by constructing ir-rigation canals, roads, and flood-control struc-tures. A protracted period of civil war results ina deterioration and outright destruction of thisproductivity-enhancing infrastructure (Turchin2003c).
In summary, the demographic–structuraltheory (so called because it asserts that the effect
of population growth is filtered through socialstructures) models the society as a system ofinteracting parts that include general popula-tion, the elites, and the state (Goldstone 1991;Nefedov 1999; Turchin 2003c). What are theimplications of these assumptions for the dy-namical behavior of the system? The only wayto answer questions of this type is by construct-ing mathematical models. In Chapter 7 of mybook Historical Dynamics (Turchin 2003c), I de-veloped a suite of dynamical models addressingvarious aspects of the demographic–structuraltheory. Here I discuss two models that weredeveloped in a recent paper (Turchin andKorotayev 2006).
A Model of Population Dynamics andInternal Warfare in Agrarian Empires
The first model is an extension of the math-ematical theory of state collapse discussed inTurchin (2003c, chap. 7). There are threestructural variables: population numbers, statestrength (measured by the amount of resourcestaxed by the state), and the intensity of inter-nal warfare (that is, such kinds of sociopoliticalinstability as major outbreaks of brigandage,peasant uprising, regional rebellions, and civilwar).
Let N (t) be the number of inhabitants at timet, S(t) be the accumulated state resources (whichwe can measure in some real terms, e.g., tons ofgrain), and W (t) the intensity of internal war-fare (measured, for example, by extra mortalityresulting from this type of conflict). To startderiving the equations we assume that the percapita rate of surplus production, ρ, is a de-clining function of N (this is Ricardo’s law ofdiminishing returns) (Ricardo 1817). Assuming,for simplicity, a linear relationship, we have
ρ(N ) = c 1(1 − N /K )
Here c1 is some proportionality constant, andK is the population size at which surplus equalszero. Thus, for N > K , the surplus is nega-tive (the population produces less food than isneeded to sustain it). To derive the equation for
Turchin: Long-Term Population Cycles in Human Societies 11
N, we start with the exponential form (Turchin2003a):
d N /d t = r N
and then modify it by assuming that the percapita rate of population increase is a linearfunction of the per capita rate of surplus pro-duction, r = c2ρ(N ). Putting together these twoassumptions, we arrive at the logistic model ofpopulation growth:
d N /d t = r0N (1 − N /K ) (1)
where r0 = c1c2 is the “intrinsic rate” of popu-lation growth, and parameter K is now seen tobe the “carrying capacity” (Gotelli 1995).
State resources, S, change as a result of twoopposite processes: revenues and expenditures.If the state collects a fixed proportion of sur-plus production as taxes, then revenues equalc3ρ(N )N , where ρ(N )N is the total surplus pro-duction (per capita rate multiplied by popula-tion numbers), and c3 the proportion of sur-plus collected as taxes. State expenditures areassumed to be proportional to the populationsize. The reason for this assumption is that aspopulation grows, the state must spend more re-sources on the army, police, bureaucracy, andpublic works. Putting together these processeswe have
d S/d t = ρ0N (1 − N /K ) − βN (2)
where ρ0 = c1c3 is the per capita taxation rateat low population density and β the per capitastate expenditure rate.
The dynamics of internal warfare intensity,W , in the absence of state is a balance of conflictinitiation and termination rates. First, we as-sume that conflict initiation rate is proportionalto the square of population density. This func-tional form is derived by analogy with chemicalkinetics (and also with the predation term in theLotka–Volterra model). The rate at which eachindividual “bumps” into others, which may po-tentially lead to a conflict between them, is pro-portional to N ; and the total rate of bumping is
proportional to N 2. This is a very crude anal-ogy, and clearly causes of human conflict aremuch more complex than that, but it serves asa useful starting point for modeling (we alsoinvestigated other functional forms; the quali-tative results were the same).
Second, we assume that the intensity ofwarfare, in the absence of hostility initiationevents, declines gradually at the exponentialrate b. This assumption reflects the “inertial”nature of warfare: war intensity cannot declineovernight, even if all objective reasons for ithave ceased to operate.
Third, the presence of the state should havea restraining effect on the intensity of inter-nal war. We model this process by assumingthat W declines at the rate proportional tostate resources, S. Putting these three assump-tions together we have the following equationfor W :
dW
dt= aN 2 − bW − αS (3)
The final ingredient of the model is the feed-back loop from W to N . We model the effects ofW on both the demography and on the produc-tive capacity of the society. The demographiceffect is modeled by assuming an extra mortal-ity term proportional to W . Additionally, weassume that K , the carrying capacity, is nega-tively affected by warfare: K (W ) = kmax – cW .Putting together all these assumptions, we havethe following equations:
dN
dt= r0N
(1 − N
kmax − cW
)− d NW
dS
dt= ρ0N
(1 − N
kmax − cW
)− bN
dW
dt= a N 2 − bW − αS
(4)
All variables are constrained to nonnegativevalues.
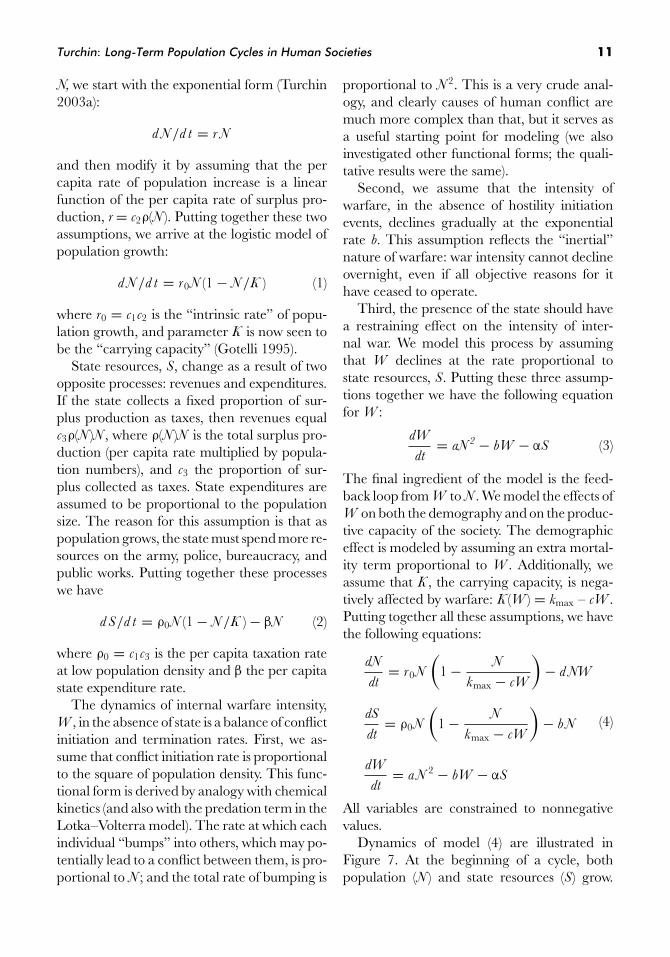
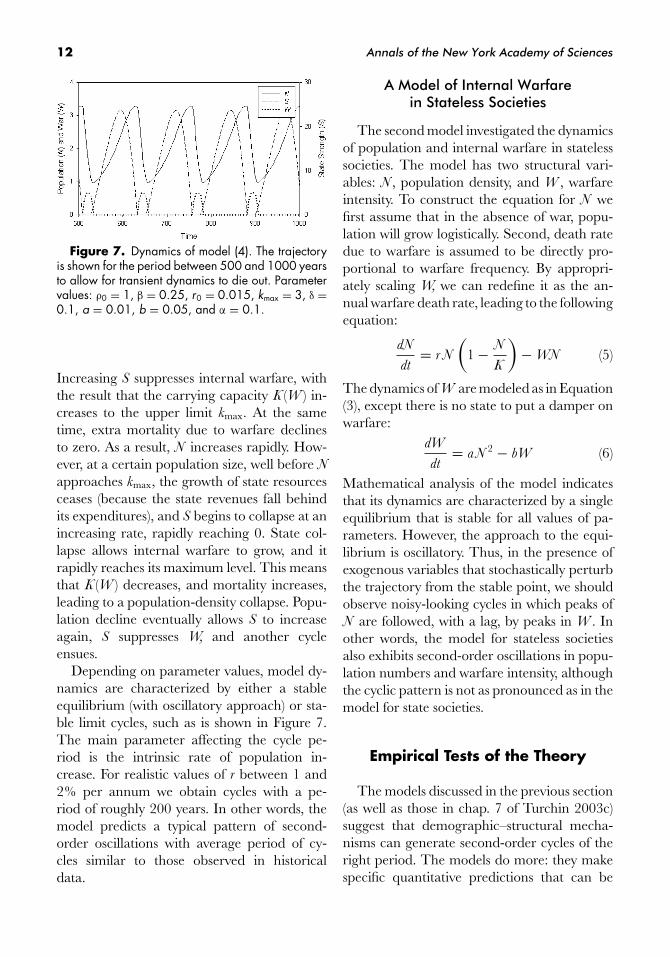
Dynamics of model (4) are illustrated inFigure 7. At the beginning of a cycle, bothpopulation (N ) and state resources (S) grow.
12 Annals of the New York Academy of Sciences
Figure 7. Dynamics of model (4). The trajectoryis shown for the period between 500 and 1000 yearsto allow for transient dynamics to die out. Parametervalues: ρ0 = 1, β = 0.25, r0 = 0.015, kmax = 3, δ =0.1, a = 0.01, b = 0.05, and α = 0.1.
Increasing S suppresses internal warfare, withthe result that the carrying capacity K (W ) in-creases to the upper limit kmax. At the sametime, extra mortality due to warfare declinesto zero. As a result, N increases rapidly. How-ever, at a certain population size, well before N
approaches kmax, the growth of state resourcesceases (because the state revenues fall behindits expenditures), and S begins to collapse at anincreasing rate, rapidly reaching 0. State col-lapse allows internal warfare to grow, and itrapidly reaches its maximum level. This meansthat K (W ) decreases, and mortality increases,leading to a population-density collapse. Popu-lation decline eventually allows S to increaseagain, S suppresses W, and another cycleensues.
Depending on parameter values, model dy-namics are characterized by either a stableequilibrium (with oscillatory approach) or sta-ble limit cycles, such as is shown in Figure 7.The main parameter affecting the cycle pe-riod is the intrinsic rate of population in-crease. For realistic values of r between 1 and2% per annum we obtain cycles with a pe-riod of roughly 200 years. In other words, themodel predicts a typical pattern of second-order oscillations with average period of cy-cles similar to those observed in historicaldata.
A Model of Internal Warfarein Stateless Societies
The second model investigated the dynamicsof population and internal warfare in statelesssocieties. The model has two structural vari-ables: N , population density, and W , warfareintensity. To construct the equation for N wefirst assume that in the absence of war, popu-lation will grow logistically. Second, death ratedue to warfare is assumed to be directly pro-portional to warfare frequency. By appropri-ately scaling W, we can redefine it as the an-nual warfare death rate, leading to the followingequation:
dN
dt= r N
(1 − N
K
)− WN (5)
The dynamics of W are modeled as in Equation(3), except there is no state to put a damper onwarfare:
dW
dt= a N 2 − bW (6)
Mathematical analysis of the model indicatesthat its dynamics are characterized by a singleequilibrium that is stable for all values of pa-rameters. However, the approach to the equi-librium is oscillatory. Thus, in the presence ofexogenous variables that stochastically perturbthe trajectory from the stable point, we shouldobserve noisy-looking cycles in which peaks ofN are followed, with a lag, by peaks in W . Inother words, the model for stateless societiesalso exhibits second-order oscillations in popu-lation numbers and warfare intensity, althoughthe cyclic pattern is not as pronounced as in themodel for state societies.
Empirical Tests of the Theory
The models discussed in the previous section(as well as those in chap. 7 of Turchin 2003c)suggest that demographic–structural mecha-nisms can generate second-order cycles of theright period. The models do more: they makespecific quantitative predictions that can be

Turchin: Long-Term Population Cycles in Human Societies 13
TABLE 1. Instability Events per Decade During the Growth and Decline Secular Phases
Growth phase Decline phase
Secular cycle Years Instability Years Instability
Plantagenet 1151–1315 0.78 1316–1485 2.53Tudor 1486–1640 0.47 1641–1730 2.44Capetian 1216–1315 0.80 1316–1450 3.26Valois 1451–1570 0.75 1571–1660 6.67Republican 350–130 BCE 0.41 130–30 BCE 4.40Principate 30 BCE–165 0.61 165–285 3.83Muscovite 1465–1565 0.60 1565–1615 3.80Average (±SE) 0.6 (±0.06) 3.8 (±0.5)
SOURCE: After Table 10.2 in Turchin and Nefedov, 2008.
tested with historical data. One striking pat-tern, predicted by theory, is that sociopoliticalinstability should oscillate with the same periodas population density, but shifted in phase, sothat the peaks of instability follow populationpeaks.
To test these predictions empirically we needcase studies for which both population and in-stability dynamics are known. However, as wasdiscussed earlier, population reconstructions formost historical societies are plagued by vari-ous problems that make their quantitative de-tails suspect. Furthermore, the demographic–structural process is not the only mechanismthat affects the dynamics of historical societies.As a result, we often observe much more com-plex patterns than the regular cycles predictedby the models involving variability in oscilla-tion periods and phase shifts between the struc-tural variables. Given the limitations of histor-ical data and the complexity of the dynamicalpattern, we need to employ an appropriatelycoarse-grained procedure for testing theoreti-cal predictions. One approach works like this.First, we identify the population growth anddecline phases. Although quantitative detailsof population dynamics for historic societiesare rarely known with any precision, there isusually a concensus among demographic his-torians about when the qualitative pattern ofgrowth changed. Second, we count instabil-ity events (peasant uprisings, separatist rebel-
lions, civil wars, etc.) that occurred during eachphase. The instability data are taken from suchcompilations as those of Sorokin (1937), Tilly(1992), or Stearns (2001). Finally, we comparethe incidence of instability events per decadebetween the two phases. The demographic–structural theory predicts that instabilityshould be higher during the population-declinephases.
This procedure was applied to all seven com-plete cycles examined in Turchin and Nefe-dov (2008) (see Table 1). The empirical reg-ularity is very strong: in all cases, instabilityis greater during the declining, compared togrowth, phases (t test: P � .001).
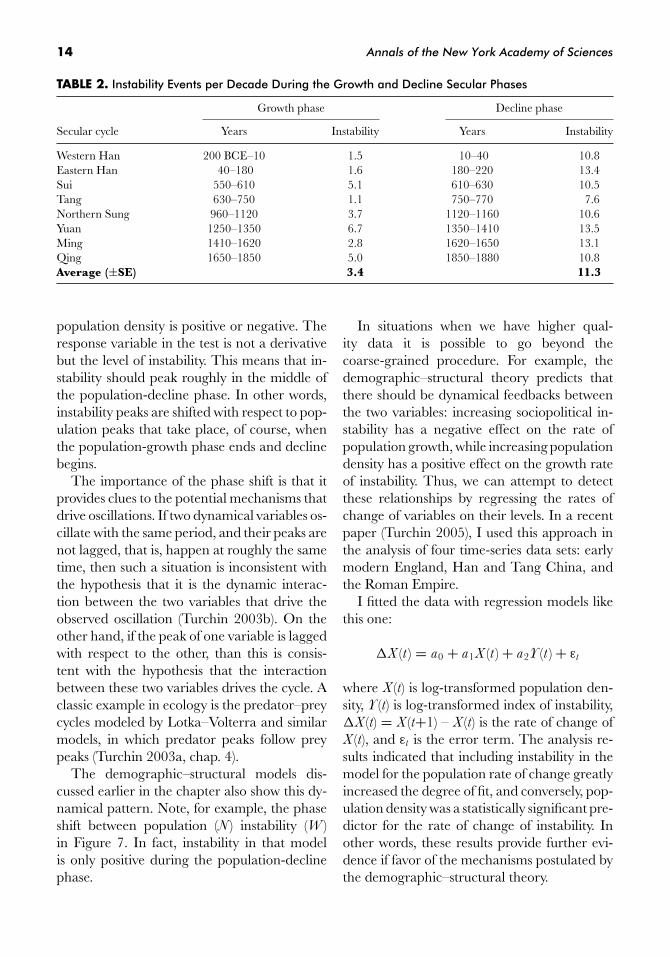
Using the same procedure, we can also testfor association between population oscillationsand the dynamics of political instability duringthe imperial period of Chinese history (fromthe Han to the Qing Dynasties). Populationdata are taken from Zhao and Xie (1988), theinstability data from Lee (1931). The test is con-ducted only for periods when China was unifiedunder one dynasty (Table 2).
Again, we observe a remarkable match be-tween the prediction and what is observed: thelevel of instability is invariably greater duringthe population decline compared to increasephases.
Note that the secular phases in this empiri-cal test were defined as periods of growth anddecline, that is, whether the first derivative of
14 Annals of the New York Academy of Sciences
TABLE 2. Instability Events per Decade During the Growth and Decline Secular Phases
Growth phase Decline phase
Secular cycle Years Instability Years Instability
Western Han 200 BCE–10 1.5 10–40 10.8Eastern Han 40–180 1.6 180–220 13.4Sui 550–610 5.1 610–630 10.5Tang 630–750 1.1 750–770 7.6Northern Sung 960–1120 3.7 1120–1160 10.6Yuan 1250–1350 6.7 1350–1410 13.5Ming 1410–1620 2.8 1620–1650 13.1Qing 1650–1850 5.0 1850–1880 10.8Average (±SE) 3.4 11.3
population density is positive or negative. Theresponse variable in the test is not a derivativebut the level of instability. This means that in-stability should peak roughly in the middle ofthe population-decline phase. In other words,instability peaks are shifted with respect to pop-ulation peaks that take place, of course, whenthe population-growth phase ends and declinebegins.
The importance of the phase shift is that itprovides clues to the potential mechanisms thatdrive oscillations. If two dynamical variables os-cillate with the same period, and their peaks arenot lagged, that is, happen at roughly the sametime, then such a situation is inconsistent withthe hypothesis that it is the dynamic interac-tion between the two variables that drive theobserved oscillation (Turchin 2003b). On theother hand, if the peak of one variable is laggedwith respect to the other, than this is consis-tent with the hypothesis that the interactionbetween these two variables drives the cycle. Aclassic example in ecology is the predator–preycycles modeled by Lotka–Volterra and similarmodels, in which predator peaks follow preypeaks (Turchin 2003a, chap. 4).
The demographic–structural models dis-cussed earlier in the chapter also show this dy-namical pattern. Note, for example, the phaseshift between population (N ) instability (W )in Figure 7. In fact, instability in that modelis only positive during the population-declinephase.
In situations when we have higher qual-ity data it is possible to go beyond thecoarse-grained procedure. For example, thedemographic–structural theory predicts thatthere should be dynamical feedbacks betweenthe two variables: increasing sociopolitical in-stability has a negative effect on the rate ofpopulation growth, while increasing populationdensity has a positive effect on the growth rateof instability. Thus, we can attempt to detectthese relationships by regressing the rates ofchange of variables on their levels. In a recentpaper (Turchin 2005), I used this approach inthe analysis of four time-series data sets: earlymodern England, Han and Tang China, andthe Roman Empire.
I fitted the data with regression models likethis one:
�X (t ) = a0 + a1X (t ) + a2Y (t ) + εt
where X (t) is log-transformed population den-sity, Y (t) is log-transformed index of instability,�X (t) = X (t+1) – X (t) is the rate of change ofX (t), and εt is the error term. The analysis re-sults indicated that including instability in themodel for the population rate of change greatlyincreased the degree of fit, and conversely, pop-ulation density was a statistically significant pre-dictor for the rate of change of instability. Inother words, these results provide further evi-dence if favor of the mechanisms postulated bythe demographic–structural theory.
Turchin: Long-Term Population Cycles in Human Societies 15
Conclusions
The main conclusion I draw from the em-pirical review is that the typical pattern foundin historical populations is neither exponen-tial growth nor small fluctuations around somestable carrying capacity. Instead, we usuallyobserve that long-term oscillations (around agradually rising level). These “secular cycles”(called so because they consist of alternatingincrease and decline population phases, eachroughly a century long) appear to be the rule foragrarian state-level societies, and we see themwhenever we have reasonably good quantita-tive data on population dynamics. Where suchdata are absent, we can infer the presence ofsecular cycles from the empirical observationthat the great majority of agrarian states in his-tory were affected by recurring instability waves(Turchin and Nefedov 2008).
Secular oscillations are not strict, mathemat-ically precise cycles. Rather, they appear tobe characterized by an average period witha fairly large amount of variation around it.This is to be expected because human soci-eties are complex dynamical systems with manyparts cross-linked by nonlinear feedbacks. Itis well known that such dynamical systemsare prone to mathematical chaos, or in moretechnical terms, sensitive dependence on initialconditions (Ruelle 1989). Furthermore, socialsystems are open in the sense that they are influ-enced by exogenous influences such as climaticchange, or sudden appearances of evolutionarynovel pathogens. Finally, humans have free will,and their actions and decisions at the individualmicrolevel can have societal macrolevel con-sequences. Sensitive dependence (chaos), ex-ogenous influences, and human free will allcombine to produce very complex dynam-ics whose future trajectories are very difficult(and probably impossible) to predict with anydegree of accuracy. Additionally, there is thewell-known problems of self-fulfilling and self-defeating prophecies—situations when makinga forecast affects the trajectory that is beingforecast.
Although future trajectories of human so-cial systems (including its demographic part,which is the focus of this article) may be diffi-cult to predict with any accuracy, it does notmean that these dynamics are not worth study-ing. The strong empirical patterns that I re-viewed in this article suggest that there may begeneral principles operating, that history is not“just one damn thing after another.” If so, thenunderstanding such governing principles caninform governments and societies about theconsequences of social choices that they con-template. There is no reason to believe thatthere is any inevitability about the social dy-namics that I have discussed in this article. Ofparticular interest are such undesirable conse-quences of sustained population growth as in-stability waves.
Political instability in collapsed or collapsingstates is one of the greatest sources of humanmisery today. Since the end of the Cold War,interstate warfare accounted for less than 10%of conflicts. The great majority of wars todayare within-state conflicts, such as civil wars andseparatist rebellions (Harbom and Wallensteen2007). I do not see why humanity must con-tinue to endure these periods of state collapseand civil strife forever. However, at this point,we still know too little about social mechanismsleading to instability waves. We lack good the-ories to tell us how to rebuild states and avoidcivil wars, although there are promises of one(Turchin 2008). This is an area where researcheffort has a good chance of paying off, both ingenerating empirically tested theoretical break-throughs and in alleviating human misery.
Returning to the issue of long-term forecastsof the global population, probably the mostimportant conclusion that follows from my re-view is this: The smooth logistic-like curves pro-duced by various government and U.N. agen-cies (and copied in many ecological textbooks),in which the global population nicely equi-librates around some number, 10 or 12 bil-lion, are essentially worthless as serious fore-casts. The global population is a dynamicalquantity that is determined by the balance of

16 Annals of the New York Academy of Sciences
mortality and natality rates. There is no rea-son to believe that these two rates will equili-brate and cancel each other out. In the last twocrises experienced by the global population, inthe seventeenth and the fourteenth centuries,global population declined substantially, and inmany regions, precipitously. In the fourteenthcentury many regions of Eurasia lost betweena third and a half of their populations (Mc-Neill 1976). In the seventeenth century, fewerplaces in Eurasia were hit as badly (althoughGermany and central China lost between athird and a half of their populations). The pop-ulation of North America, on the other hand,was reduced perhaps tenfold, although this re-mains a matter of controversy. Thus, a forecastbased on historical patterns suggests that thetwenty-first century should also be a period ofpopulation decline.
On the other hand, probably the most im-portant aspect of recent human history is therapid acceleration of social evolution in the lasttwo centuries that usually goes under the nameof industrialization (or modernization). Theglobal carrying capacity (Cohen 1995) duringthis period has increased dramatically, and it isvery difficult to predict how it will continue tochange. Thus, it is conceivable that the trend togreater carrying capacity will continue and thatit will overwhelm the negative delayed effects oftwentieth century’s population growth. We donot know which of these two opposing tenden-cies will prevail, but what is clear is that theywill not simply cancel each other out. Thus,equilibration of the global population aroundsome constant level in the twenty-first centuryis actually a most unlikely outcome.
Conflicts of Interest
The author declares no conflicts of interest.
References
Abel, W. 1980. Agricultural Fluctations in Europe: From the
Thirteenth to the Twentieth Centuries. St. Martin’s Press.New York.
Berryman, A.A. & M.A. Valenti. 1994. The doomsdayprediction. Bull. Ecol. Soc. Am. 75: 123–124.
Bintliff, J. & K. Sbonias, Eds. 1999. Reconstructing Past Pop-
ulation Trends in Mediterranean Europe (3000 BC–AD
1800). Oxbow. Oxford, UK.Chu, C.Y.C. & R.D. Lee. 1994. Famine, revolt, and dy-
nastic cycle: population dynamics in historic China.J. Popul. Econ. 7: 351–378.
Cohen, J.E. 1995. How Many People Can the Earth Support?
W. W. Norton. New York.Dewar, R.E. 1991. Incorporating variation in occupation
span into settlement-pattern analysis. Am. Antiquity
56: 604–620.Durand, J.D. 1960. The population statistics of China,
AD 2-1953. Popul. Stud. 13: 209–256.Earle, T., Ed. 1991. Chiefdoms: Power, Economy, and Ideology.
Cambridge University Press. Cambridge, UK.Easterlin, R. 1980. Birth and Fortune. Basic Books. New
York.Ehrlich, P.R. 1968. The Population Bomb. Ballantine Books.
New York.Goldstone, J.A. 1991. Revolution and Rebellion in the Early
Modern World. University of California Press. Berke-ley.
Gotelli, N.J. 1995. A Primer of Ecology. Sinauer. Sunderland,MA.
Harbom, L. & P. Wallensteen. 2007. Armed conflict,1989–2006. J. Peace Res. 44: 623–634.
Ho, P.T. 1959. Studies on the Population of China: 1368–1953.Harvard University Press. Cambridge, MA.
Izyumova, S.A. 1959. On the history of leather and shoemanufacture in Novgorod the Great (in Russian).Mater. Stud. Archaeol. USSR 65: 197.
Le Roy Ladurie, E. 1974. The Peasants of Languedoc. Uni-versity of Illinois Press. Urbana.
Lee, J.S. 1931. The periodic recurrence of intrnecinewars in China. China J. (March/April 1931): 111–163.
Lee, R.D. 1987. Population dynamics of humans andother animals. Demography 24: 443–465.
Lewit, T. 1991. Agricultural Productivity in the Roman Economy
A.D. 200–400. Tempus Reparaturm. Oxford, UK.Lieberman, V. 2003. Strange Parallels: Southeast Asia in Global
Context, c.800–1830. Cambridge University Press.Cambridge, UK.
Malthus, T.R. 1798. AnEssay on the Principle of Population. J.Johnson. London.
McEvedy, C. & R. Jones. 1978. Atlas of World Population
History. Facts on File. New York.McNeill, W.H. 1976. Plagues and Peoples. Anchor Books.
New York.Nefedov, S. 1999. The Method of Demographic Cycles in a Study
of Socioeconomic History of Preindustrial Society. Ph.D. Dis-sertation (in Russian), Ekaterinburg University, Eka-terinburg, Russia.
Turchin: Long-Term Population Cycles in Human Societies 17
Nefedov, S.A. 2002. On the demographic cycles in thehistory of the medieval Russia (in Russian). Klio 3:193–203.
Postan, M.M. 1966. Medieval agrarian society in itsprime: England. In Cambridge Economic History, Vol. I.M.M. Postan, Ed: 221–246. Cambridge UniversityPress. Cambridge.
Reinhard, M.R., A. Armengaud & J. Dupaquier. 1968.Histoire Generale de la Population Mondiale. EditionsMontchrestien. Paris.
Ricardo, D. 1817. On the Principles of Political Economy and
Taxation. John Murray. London.Ruelle, D. 1989. Chaotic Evolution and Strange Attractors. Cam-
bridge University Press. Cambridge, UK.Rybina, E.A. 1978. Arkheologicheskie Ocherki Istorii Novgorod-
skoy Torgovli X–XIV vv. Moscow University Press.Moscow.
Scheidel, W., Ed. 2001. Debating Roman Demography. Brill.Leiden, the Netherland
Song, J., C.H. Tuan & J.Y. Yu. 1985. Population Control in
China: Theory and Applications. Praeger Scientific. NewYork.
Sorokin, P. A. 1937. Social and Cultural Dynamics. Vol. III.
Fluctuations of Social Relationships, War, and Revolution.
American Book Company. New York.Stearns, P. N. 2001. The Encyclopedia of World History (6th
ed.). Houghton Mifflin. Boston.Tilly, C. 1993. European Revolutions: 1492–1992. Blackwell.
Oxford, UK.Turchin, P. 2003a. Complex Population Dynamics: A
Theoretical/Empirical Synthesis. Princeton UniversityPress. Princeton, NJ.
Turchin, P. 2003b. Evolution in population dynamics. Na-
ture 424: 257–258.Turchin, P. 2003c. Historical Dynamics: Why States Rise and
fall. Princeton University Press. Princeton, NJ.Turchin, P. 2005. Dynamical feedbacks between popula-
tion growth and sociopolitical instability in agrarianstates. Structure and Dynamics 1: Article 3.
Turchin, P. 2008. Building nations after conflict. Nature
453: 986–987.Turchin, P. & A. Korotayev. 2006. Population dynamics
and internal warfare: a reconsideration. Soc. Sci. Hist.
5: 121–158.Turchin, P. & S. Nefedov. 2008. Secular Cycles. Princeton
University Press. Princeton, NJ.Von Foerster, H., P.M. Mora & L.W. Amiot. 1960. Dooms-
day: Friday, 13 November, AD 2026. Science 132:1291–1295.
Wachter, K.W. & R.D. Lee. 1989. US births and limitcycle models. Demography 26: 99–115.
Wickham, C. 1981. Early Medieval Italy: Central Power and
Local Society, 400–1000. Macmillan. London.Wood, J.W. 1990. Fertility in anthropological populations.
Annu. Rev. Anthropol. 19: 211–242.Wrigley, E.A., R.S. Davis, J.E. Oeppen & R.S. Schofield.
1997. English Population History from Family Reconstruc-
tion: 1580–1837. Cambridge University Press. Cam-bridge, UK.
Yanin, V.L. 1990. The archaeology of Novgorod. Sci. Am.
262: 84.Zhao, W. & S.Z. Xie. 1988. Zhongguo ren kou shi: China
Population History (in Chinese). People’s Publisher.Peking.