Liver and Biliary Tract Cancers Highlights
23
Lorenza Rimassa Oncologia Medica e Ematologia Humanitas Cancer Center Humanitas Research Hospital Rozzano (Milano) Liver and Biliary Tract Cancers Highlights
Transcript of Liver and Biliary Tract Cancers Highlights

Lorenza Rimassa
Oncologia Medica e Ematologia
Humanitas Cancer Center
Humanitas Research Hospital
Rozzano (Milano)
Liver and Biliary Tract Cancers
Highlights

Hepatocellular Carcinoma (HCC) - Outline and Disclosure
Two General Sessions
• Innovative Approaches to Hepatopancreatobiliary Disease.
Appropriate title: Innovative Approaches to Pancreatic Disease
• Hepatocellular Carcinoma Tumor Board. Finn RS: Medical
Oncologist (Panelist): Video unavailable
Two Oral Presentations
• Abou-Alfa GK (Venook AP) et al: Phase III randomized study of
sorafenib plus doxorubicin versus sorafenib in patients with
advanced HCC: CALGB 80802 (Alliance) (Abstract 192). Slides,
video, and poster unavailable
• Rimassa L et al: Tumor and circulating biomarker analysis from the
randomized controlled phase 2 trial of tivantinib in second-line HCC
(Abstract 197)

Biliary Tract Cancers (BTCs) - Outline
One Breakout Session
• Valle JW: Bile Duct Cancer
One Expert Editorial on GI Cancers Symposium Daily News,
Saturday January 23
• Mody K & Patel T: Precision Medicine for Cholangiocarcinoma

First-line
Child-Pugh A
ECOG PS 0-1
Stratification by
extent of disease (locally
advanced vs metastatic)
Randomization 1:1
(Planned N=480; N=346*)
Sorafenib 400 mg PO BID + Doxorubicin 60 mg/m2 iv q 21 days
(N=173)
Sorafenib 400 mg PO BID
(N=173)
CALGB 80802 (Alliance) - Sorafenib +/- doxorubicin phase III trial
Abou-Alfa GK et al. J Clin Oncol 34, 2016 (suppl 4S; abstr 192)
Background
• Randomized phase 2 study in 96 pts comparing doxorubicin (D) to
doxorubicin plus sorafenib (D+S): OS: 6.5 vs 13.7 mos, p=0.006 (JAMA 2010)
Primary endpoint: OS
Secondary endpoint: PFS
*Study halted after accrual of
346 pts due to futility at planned
interim analysis

Results
• Efficacy for D+S vs S
• OS: 9.3 vs 10.5 mos, HR: 1.06 (95%CI: 0.8-1.4)
• PFS: 3.6 vs 3.2 mos, HR: 0.90 (95%CI: 0.72-1.2)
• Safety for D+S vs S
• Grade 3-4 hematologic adverse events (AEs): 37.8% vs 8.1%
• Non-hematologic AEs and deaths: comparable
Conclusions
• D+S resulted in higher toxicity and did not improve OS or PFS
• The S mOS of about 10 months is consistent with previous reports
CALGB 80802 (Alliance)
Abou-Alfa GK et al. J Clin Oncol 34, 2016 (suppl 4S; abstr 192)
Rimassa L et al. J Clin Oncol 34, 2016 (suppl 4S; abstr 197)
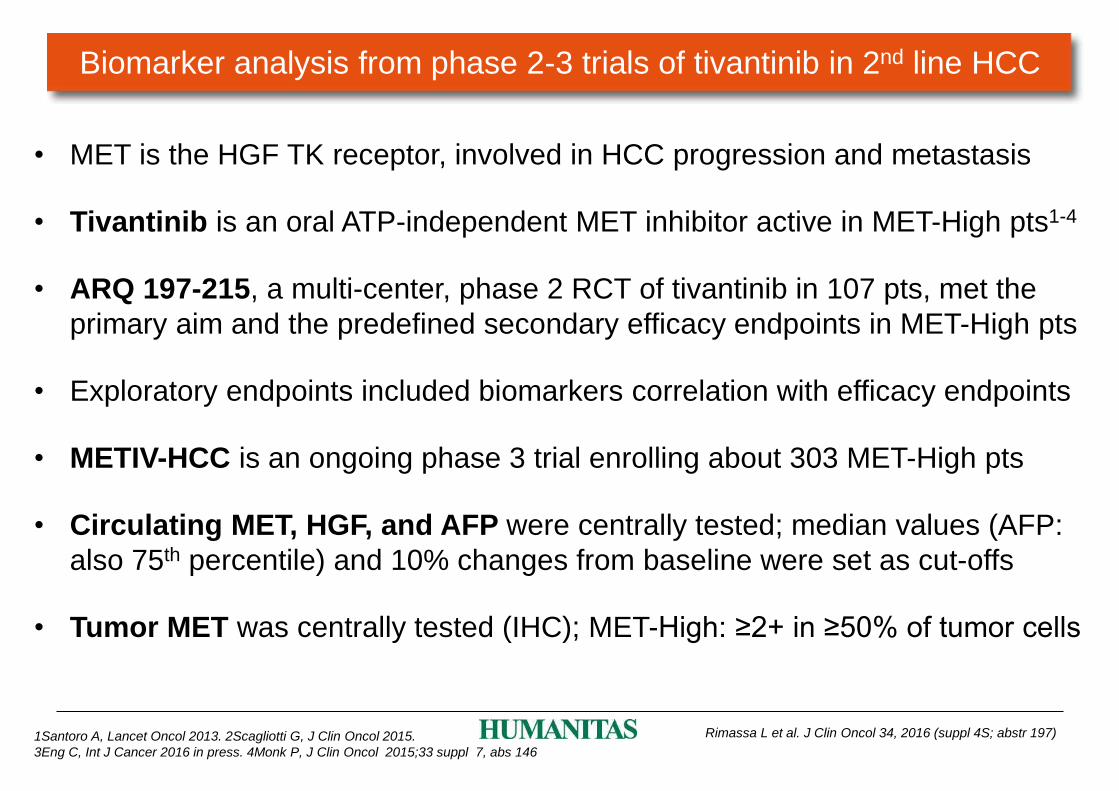
Biomarker analysis from phase 2-3 trials of tivantinib in 2nd line HCC
• MET is the HGF TK receptor, involved in HCC progression and metastasis
• Tivantinib is an oral ATP-independent MET inhibitor active in MET-High pts1-4
• ARQ 197-215, a multi-center, phase 2 RCT of tivantinib in 107 pts, met the
primary aim and the predefined secondary efficacy endpoints in MET-High pts
• Exploratory endpoints included biomarkers correlation with efficacy endpoints
• METIV-HCC is an ongoing phase 3 trial enrolling about 303 MET-High pts
• Circulating MET, HGF, and AFP were centrally tested; median values (AFP:
also 75th percentile) and 10% changes from baseline were set as cut-offs
• Tumor MET was centrally tested (IHC); MET-High: ≥2+ in ≥50% of tumor cells
1Santoro A, Lancet Oncol 2013. 2Scagliotti G, J Clin Oncol 2015.
3Eng C, Int J Cancer 2016 in press. 4Monk P, J Clin Oncol 2015;33 suppl 7, abs 146

ITT Baseline N=102 Median OS Patients Events
Low (<median) 8.9 mos 51 40
High (≥median) 4.6 mos 51 42
HR: 0.42 (95% CI: 0.20-0.91) p=0.02
Baseline median circulating MET concentration: 13.26ng/mL (1.29-49.8ng/mL)
Circulating MET as a Prognostic Factor
HR: 0.61 (95% CI: 0.39-0.94) p=0.03
Placebo Baseline N=34 Median OS Patients Events
Low (<median) 9.4 mos 19 15
High (≥median) 3.8 mos 15 14
Presented by: Lorenza Rimassa, MD
Trend in predictive value for circulating MET-High: tivantinib vs placebo HR: 0.55, p=0.07
(interaction test not significant)
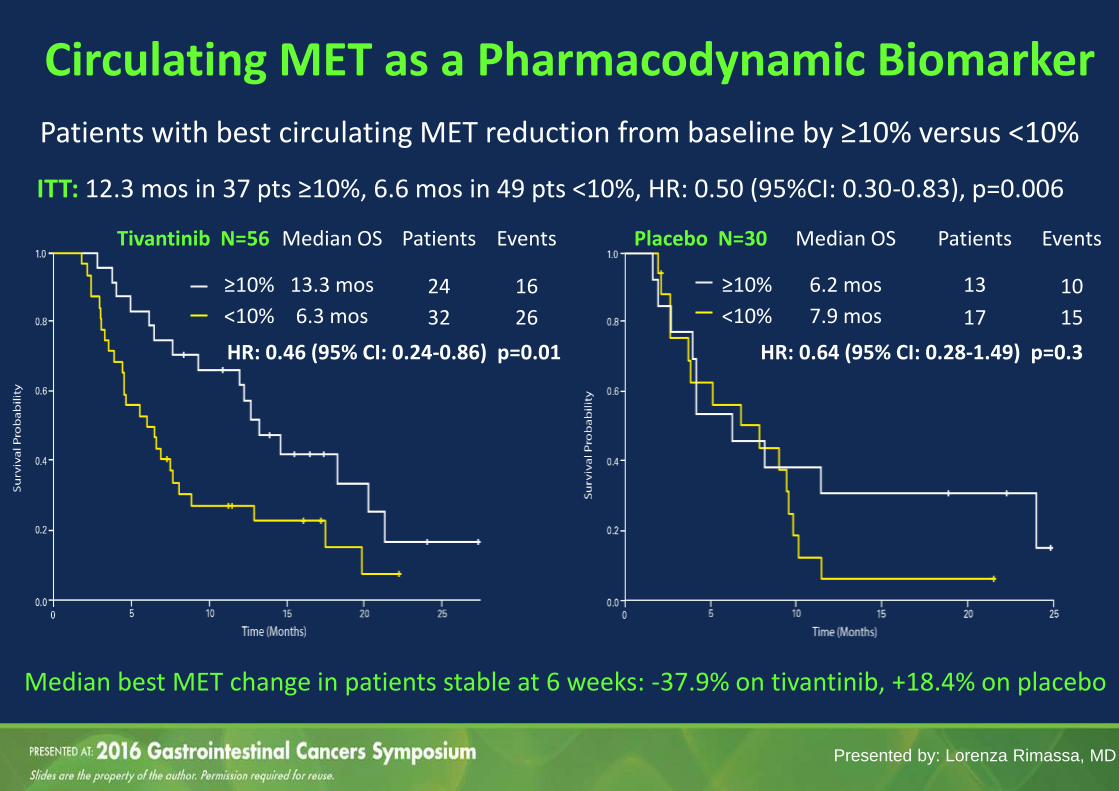
Circulating MET as a Pharmacodynamic Biomarker
ITT: 12.3 mos in 37 pts ≥10%, 6.6 mos in 49 pts <10%, HR: 0.50 (95%CI: 0.30-0.83), p=0.006
Tivantinib N=56 Median OS Patients Events
≥10% 13.3 mos 24 16
<10% 6.3 mos 32 26
HR: 0.46 (95% CI: 0.24-0.86) p=0.01
Placebo N=30 Median OS Patients Events
≥10% 6.2 mos 13 10
<10% 7.9 mos 17 15
HR: 0.64 (95% CI: 0.28-1.49) p=0.3
Patients with best circulating MET reduction from baseline by ≥10% versus <10%
Median best MET change in patients stable at 6 weeks: -37.9% on tivantinib, +18.4% on placebo
Presented by: Lorenza Rimassa, MD

Circulating HGF as a Prognostic Factor
Baseline median circulating HGF concentration: 2307 pg/mL (421-58080 pg/mL)
ITT Baseline N=102 Median OS Patients Events
Low (<median) 9.0 mos 51 36
High (≥median) 5.0 mos 51 46
HR: 0.60 (95% CI: 0.39-0.94) p=0.02
ITT Best Change N=86 Median OS Patients Events
≥10% 9.8 mos 39 29
<10% 6.5 mos 47 38
HR: 0.60 (95% CI: 0.36-0.98) p=0.04
Presented by: Lorenza Rimassa, MD
Results were overall confirmed when analyzed by treatment arm

Circulating AFP as a Prognostic Factor Baseline median: 186 (1.5-440008) IU/mL. Baseline 75th percentile (Q3): 3507.50 IU/mL
AFP <median vs AFP ≥median HR: 0.75 (95% CI: 0.48-1.15), p=0.18
No difference by best AFP change from baseline observed in 43 patients with AFP ≥20 IU/mL
ITT Baseline by Q3 N=104 Median OS Patients Events
<75th percentile 7.9 mos 78 58
≥75th percentile 3.0 mos 26 25
HR: 0.36 (95% CI: 0.22-0.58) p<0.0001
Presented by: Lorenza Rimassa, MD

Baseline Tumor MET Status
1Shi B, J Histochem Cytochem 2013
H-score: percentage of cells staining per the intensity of the stain1
Tum
or
H-S
core
Presented by: Lorenza Rimassa, MD
H-Score Median Min Max
MET-High Patients 175 120 300
MET-Low Patients 40 0 125 Correlations: none between tumor MET, circulating MET, HGF; possible between AFP and tumor and circulating MET
MET-High Samples
(rate)
Tested samples (N=77) 37 (48%)
Samples with available biopsy date (N=72)
36 (50%)
Tumor samples taken before sorafenib (N=55)
22 (40%)
Tumor samples taken after sorafenib (N=17)
14 (82%)
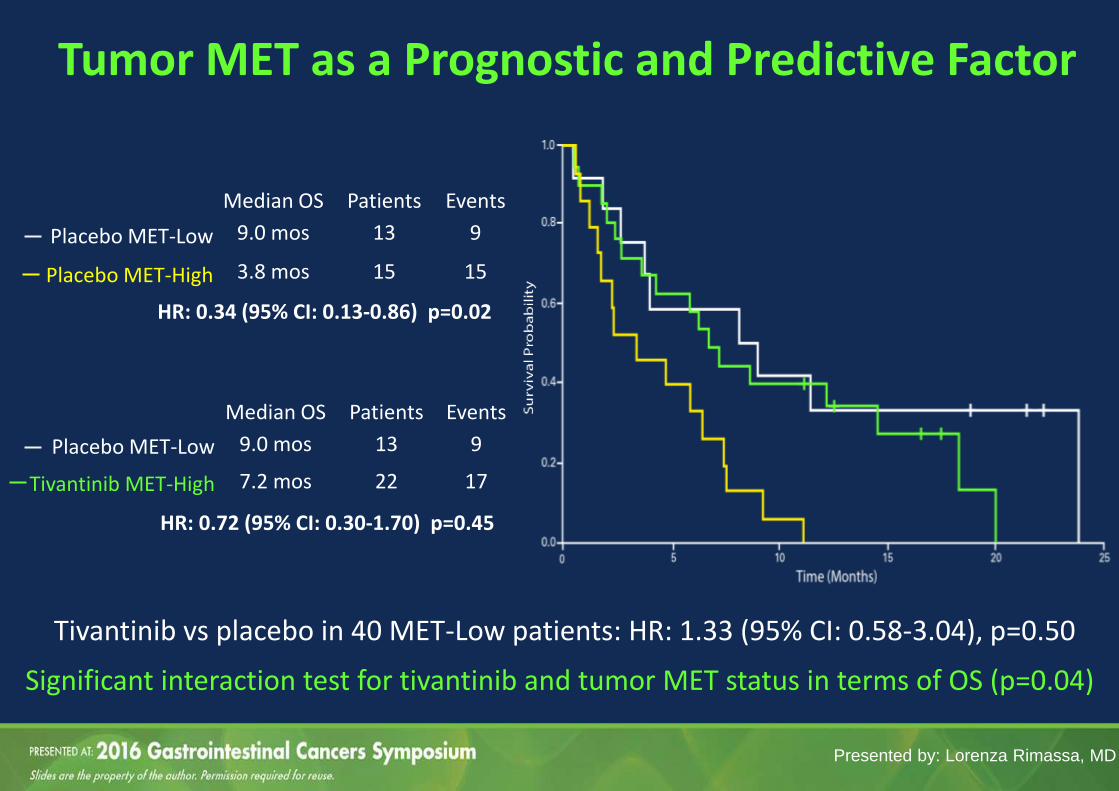
Median OS Patients Events
Placebo MET-Low 9.0 mos 13 9
Tivantinib MET-High 7.2 mos 22 17
Tumor MET as a Prognostic and Predictive Factor
Significant interaction test for tivantinib and tumor MET status in terms of OS (p=0.04)
HR: 0.72 (95% CI: 0.30-1.70) p=0.45
Median OS Patients Events
Placebo MET-Low 9.0 mos 13 9
Placebo MET-High 3.8 mos 15 15
HR: 0.34 (95% CI: 0.13-0.86) p=0.02
Presented by: Lorenza Rimassa, MD
Tivantinib vs placebo in 40 MET-Low patients: HR: 1.33 (95% CI: 0.58-3.04), p=0.50

MET-High Samples
(rate)
Tested samples (N=1138) 576 (51%)
Samples with available biopsy date (N=925)
527 (57%)
Tumor samples taken before sorafenib (N=438)
173 (39%)
Tumor samples taken after sorafenib (N=487)
354 (73%)
METIV-HCC: Baseline Tumor MET Status* Tu
mo
r H
-Sco
re
Presented by: Lorenza Rimassa, MD
*Data are preliminary, from non-cleaned database, from biopsied patients regardless of their enrolment status
H-Score Median Min Max
MET-High Patients 170 120 300
MET-Low Patients 90 0 180
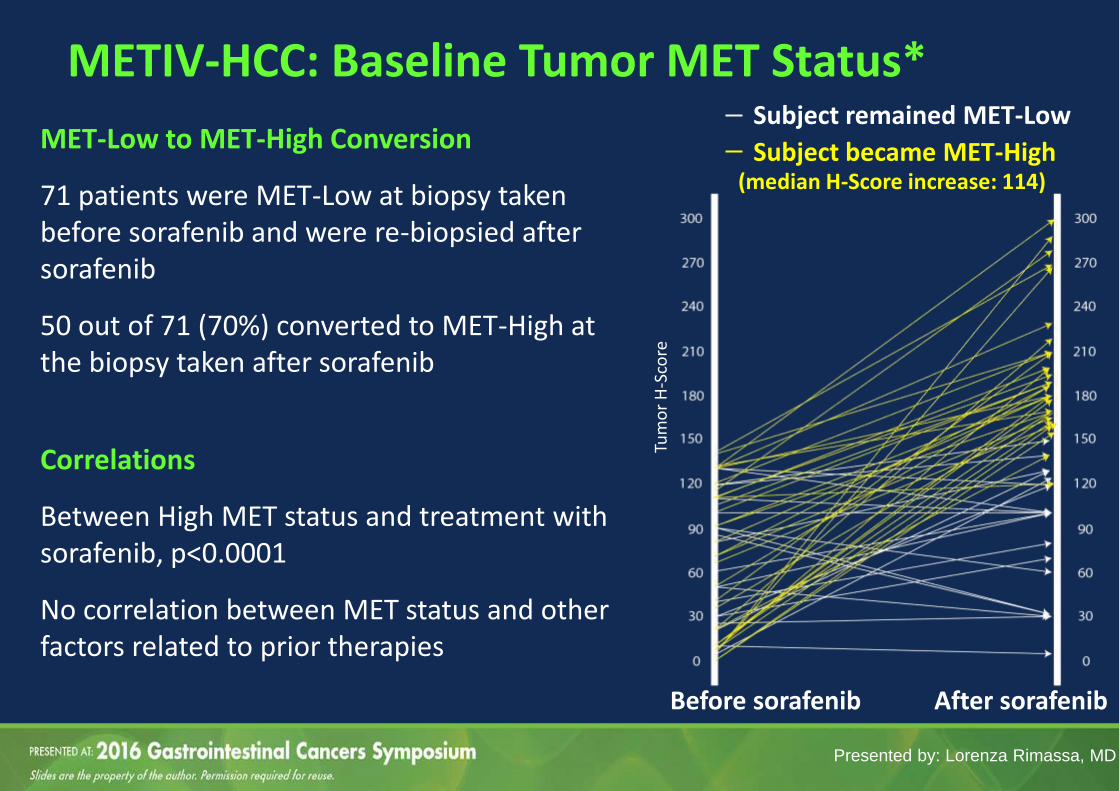
MET-Low to MET-High Conversion
71 patients were MET-Low at biopsy taken before sorafenib and were re-biopsied after sorafenib
50 out of 71 (70%) converted to MET-High at the biopsy taken after sorafenib
Correlations
Between High MET status and treatment with sorafenib, p<0.0001
No correlation between MET status and other factors related to prior therapies
Presented by: Lorenza Rimassa, MD
METIV-HCC: Baseline Tumor MET Status*
Before sorafenib After sorafenib
Subject remained MET-Low
Subject became MET-High (median H-Score increase: 114)
Tum
or
H-S
core

Rimassa L et al. J Clin Oncol 34, 2016 (suppl 4S; abstr 197)
Conclusions from the phase 2 trial
• Circulating MET, HGF, and AFP by 75th percentile hold a prognostic value
• Circulating MET is a pharmacodynamic biomarker for tivantinib
• Tumor MET is the only prognostic and predictive biomarker, and is more
frequently “High” after sorafenib
• This analysis supports the use of tivantinib in MET-High pts only
Conclusions from the phase 2 and 3 trials
• Tumor MET results are comparable, strict criteria can make MET IHC more
reliable
• Tumor MET is more frequently “High” after sorafenib as the tumor becomes
more aggressive
• The METIV-HCC trial will validate the role of the analyzed biomarkers
Biomarker analysis from phase 2-3 trials of tivantinib in 2nd line HCC

Slide 29
Presented By Juan Valle at TBD
Bile Duct Cancer
Recent advances in
the understanding
of the genomics of
BTCs offer new
opportunities for
more effective
systemic
therapeutic
approaches that
could improve
outcomes

Slide 35
Presented By Juan Valle at TBD

Slide 36
Presented By Juan Valle at TBD
• Some genomic alterations (e.g., KRAS, TP53, MAPK/mTOR) are associated with a worse prognosis
• Others (e.g., FGFR) correlate with a relatively indolent disease

Slide 37
Presented By Juan Valle at TBD

Slide 38
Presented By Juan Valle at TBD

Slide 39
Presented By Juan Valle at TBD
Limitations of clinical studies
• enrollment not guided by genomic / biomarker analyses
• e.g., CALGB 80802
• lack of distinction among different subgroups (heterogeneity)
• small sample size (especially for BTCs)
Clinical / translational studies may identify genomic changes or
molecular-defined subgroups associated with clinically actionable
factors indicative of drug sensitivity, leading to a truly personalized
therapeutic approach
The use of genomic / biomarker-guided strategy is a meaningful
alternative approach to identify effective therapies
• e.g., MET / tivantinib
Conclusions – HCC and BTCs
Liver and Biliary Tract Cancers
Highlights
Thank you!