Liquid Argon Dielectric Breakdown Studies with the ... · PDF filePreprint typeset in JINST...
14
Preprint typeset in JINST style - HYPER VERSION Liquid Argon Dielectric Breakdown Studies with the MicroBooNE Purification System R. Acciarri, B. Carls, C. James, B. Johnson, H. Jostlein, S. Lockwitz * , B. Lundberg, J.L. Raaf, R. Rameika, B. Rebel, G.P. Zeller, and M. Zuckerbrot Fermi National Accelerator Laboratory, P.O. Box 500, Batavia, IL, 60510, USA ABSTRACT: The proliferation of liquid argon time projection chamber detectors makes the char- acterization of the dielectric properties of liquid argon a critical task. To improve understanding of these properties, a systematic study of the breakdown electric field in liquid argon was conducted using a dedicated cryostat connected to the MicroBooNE cryogenic system at Fermilab. An elec- trode sphere-plate geometry was implemented using spheres with diameters of 1.3 mm, 5.0 mm, and 76 mm. The MicroBooNE cryogenic system allowed measurements to be taken at a variety of electronegative contamination levels ranging from a few parts-per-million to tens of parts-per- trillion. The cathode-anode distance was varied from 0.1 mm to 2.5 cm. The results demonstrate a geometric dependence of the electric field strength at breakdown. This study is the first time that the dependence of the breakdown field on stressed cathode area has been shown for liquid argon. KEYWORDS: Liquid Argon; Time Projection Chambers; Dielectric Strength, Electric Breakdown; Stressed Area. * Corresponding author: [email protected] (S. Lockwitz) arXiv:1408.0264v1 [physics.ins-det] 1 Aug 2014
Transcript of Liquid Argon Dielectric Breakdown Studies with the ... · PDF filePreprint typeset in JINST...
Preprint typeset in JINST style - HYPER VERSION
Liquid Argon Dielectric Breakdown Studies with theMicroBooNE Purification System
R. Acciarri, B. Carls, C. James, B. Johnson, H. Jostlein, S. Lockwitz∗, B. Lundberg,J.L. Raaf, R. Rameika, B. Rebel, G.P. Zeller, and M. Zuckerbrot
Fermi National Accelerator Laboratory, P.O. Box 500, Batavia, IL, 60510, USA
ABSTRACT: The proliferation of liquid argon time projection chamber detectors makes the char-acterization of the dielectric properties of liquid argon a critical task. To improve understanding ofthese properties, a systematic study of the breakdown electric field in liquid argon was conductedusing a dedicated cryostat connected to the MicroBooNE cryogenic system at Fermilab. An elec-trode sphere-plate geometry was implemented using spheres with diameters of 1.3 mm, 5.0 mm,and 76 mm. The MicroBooNE cryogenic system allowed measurements to be taken at a varietyof electronegative contamination levels ranging from a few parts-per-million to tens of parts-per-trillion. The cathode-anode distance was varied from 0.1 mm to 2.5 cm. The results demonstrate ageometric dependence of the electric field strength at breakdown. This study is the first time thatthe dependence of the breakdown field on stressed cathode area has been shown for liquid argon.
KEYWORDS: Liquid Argon; Time Projection Chambers; Dielectric Strength, Electric Breakdown;Stressed Area.
∗Corresponding author: [email protected] (S. Lockwitz)
arX
iv:1
408.
0264
v1 [
phys
ics.
ins-
det]
1 A
ug 2
014
Contents
1. Motivation 1
2. Experimental Setup 22.1 HV breakdown test device 22.2 Liquid argon filtration and recirculation system 42.3 Experimental Procedure 5
3. Results 6
4. Comparison to Previous Measurements 10
5. Conclusion 12
6. Acknowledgements 12
1. Motivation
Liquid argon time projection chambers (LArTPCs) are a popular and effective detection techniquefor neutrino interactions thanks to their capability to perform three-dimensional imaging of chargedparticle interactions with fine spatial resolution and accurate calorimetry. Neutrino experiments aredriving the design of these detectors to contain increasingly larger volumes of argon. The increasein argon volumes implies both the application of higher voltages and the capability to maintainsuch voltages in the detector, avoiding discharge.
In this context, a precise characterization of the dielectric properties of liquid argon becomesextremely important. Several research activities have been devoted to this subject [1, 2, 3, 4].Nonetheless, parameters related to dielectric breakdown through liquid argon are still not wellknown due to the varied values found among studies characterized by different liquid argon elec-tronegative contamination levels, electrode sizes, electrode shapes, and materials.
To address the origin of these differences, a systematic study was conducted of the breakdownelectric field in liquid argon as a function of electrode size, liquid argon electronegative contamina-tion level, and cathode-anode distance. These studies were conducted at Fermilab’s Liquid ArgonTest Facility using a dedicated test stand linked to the MicroBooNE cryogenic system.
– 1 –
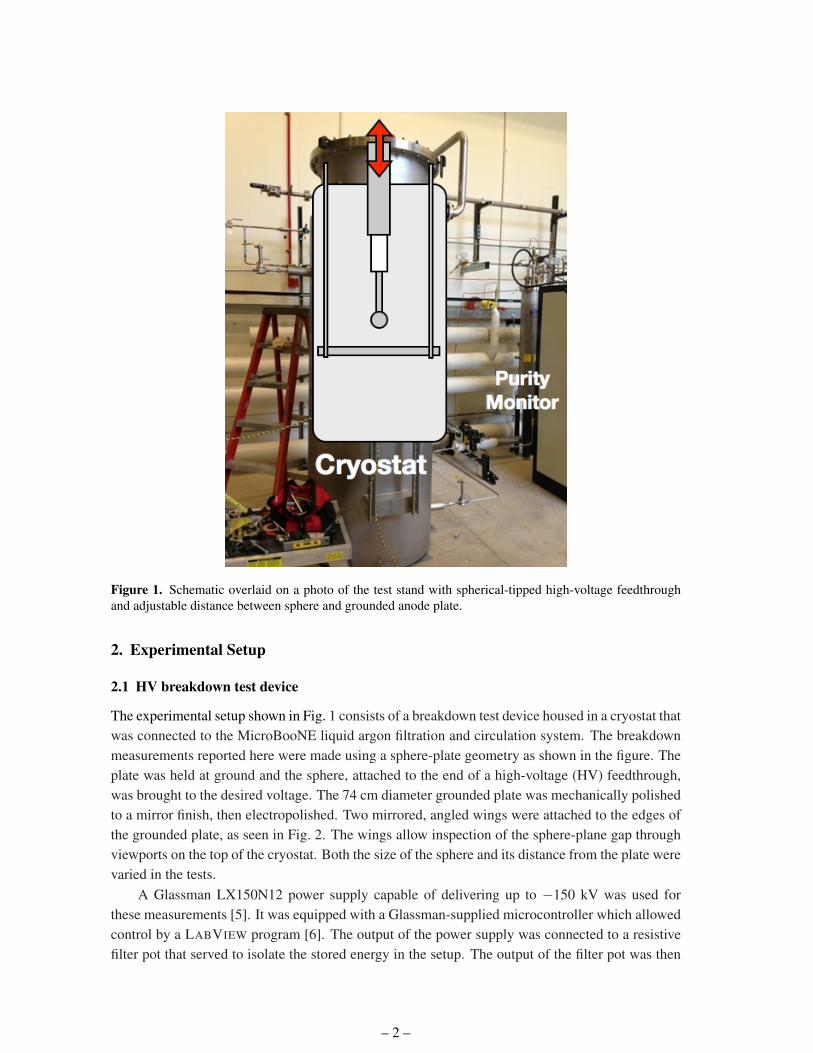
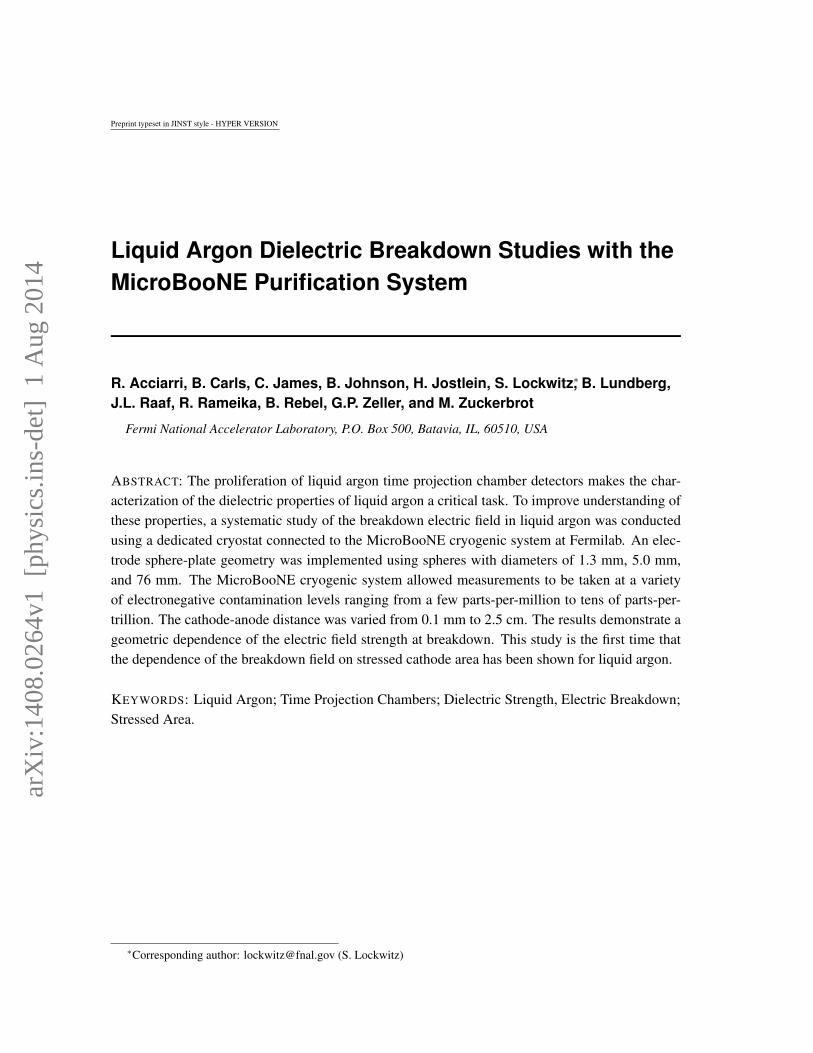
Figure 1. Schematic overlaid on a photo of the test stand with spherical-tipped high-voltage feedthroughand adjustable distance between sphere and grounded anode plate.
2. Experimental Setup
2.1 HV breakdown test device
The experimental setup shown in Fig. 1 consists of a breakdown test device housed in a cryostat thatwas connected to the MicroBooNE liquid argon filtration and circulation system. The breakdownmeasurements reported here were made using a sphere-plate geometry as shown in the figure. Theplate was held at ground and the sphere, attached to the end of a high-voltage (HV) feedthrough,was brought to the desired voltage. The 74 cm diameter grounded plate was mechanically polishedto a mirror finish, then electropolished. Two mirrored, angled wings were attached to the edges ofthe grounded plate, as seen in Fig. 2. The wings allow inspection of the sphere-plane gap throughviewports on the top of the cryostat. Both the size of the sphere and its distance from the plate werevaried in the tests.
A Glassman LX150N12 power supply capable of delivering up to −150 kV was used forthese measurements [5]. It was equipped with a Glassman-supplied microcontroller which allowedcontrol by a LABVIEW program [6]. The output of the power supply was connected to a resistivefilter pot that served to isolate the stored energy in the setup. The output of the filter pot was then
– 2 –
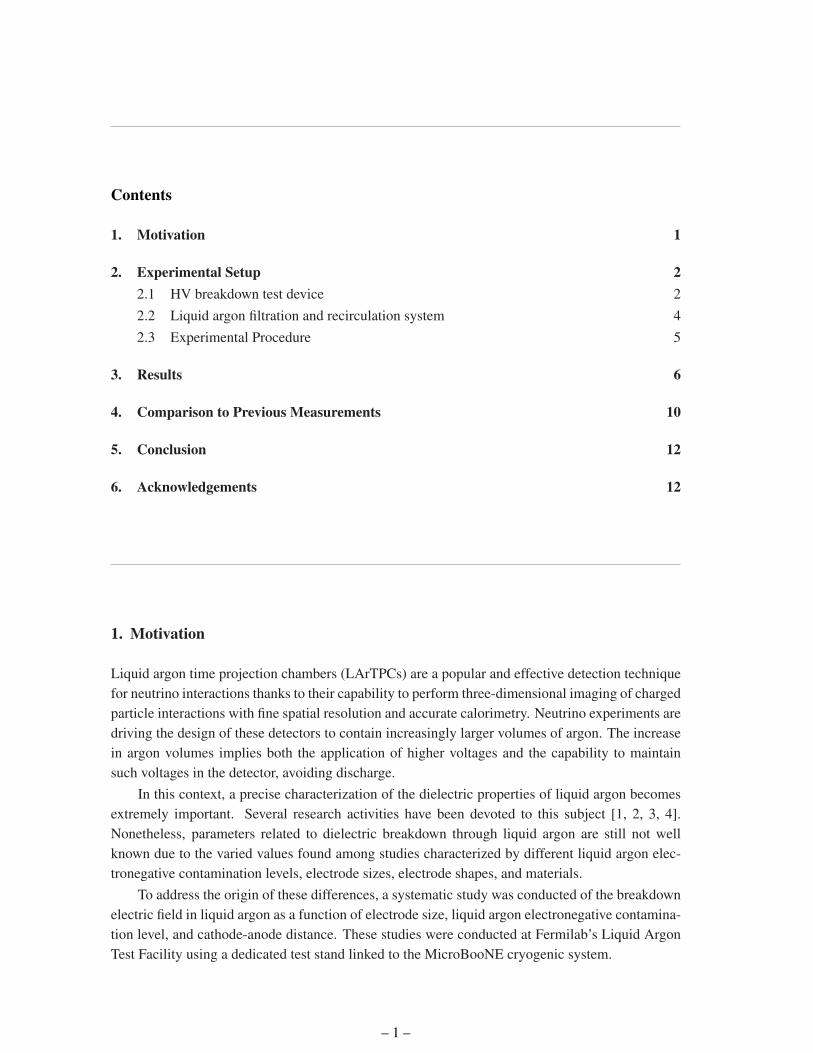
Figure 2. Breakdown test device. The stainless steel ground plate was mechanically polished and thenelectropolished. Angled, mirrored wings were installed for viewing from above. The spherical-tipped HVfeedthrough was brought within proximity of the plate for the tests. The white block seen in the photographwas used to calibrate the device and was removed during operation.
connected to a high-voltage feedthrough with swappable spherical probe tips.
(a)
UNITED STATES DEPARTMENT OF ENERGYFERMI NATIONAL ACCELERATOR LABORATORY
ORIGINATOR
DRAWN
CHECKED
APPROVED
SCALE SHEET NO.DRAWING NUMBER REV.
A
B
C
D
E
F
G
H
A
B
C
D
E
F
G
H
12345678
12345678
MicroBooNE High Voltage Feed Through
Assembly and Notes
PARTS LIST
DESCRIPTIONITEMNO.
QTYREQ
PART NO.
Item 1
Item 2
Item 3Item 4
86 in
0.61Variable 1.5 +/- 1.0 in
1 Assembly Central Conductor Sheet 2 & 3 1
1
1
1
2
3
4
Assembly
Assembly
25% 1 of 8
3 PE Insulator Sheet 4
Ground Tube Sheet 5 & 6
Spring Tip Sheet 7
(a) Fabrication begins with the aquisition of PE insulator material. Supplers of extruded polyethelene insulator cannotguarantee precise tolerances on diameters. One needs to purchase more than will be used, and down-select basedon surface quality and uniformity of extrusion. The ID and OD of selected PE extrusions are measured at roomtemperature and at cryogenic temperature. These measurements dictate the selection of SS materials for the centralconductor and for the ground tube.Dimensions provided in this drawing set represent as-builts, and can be used as guidelines
(c) The assembled Central Conductor is forced at room temperature into the PE insulator, termed the "warm tight fit.Further details in Notes on Sheet 4.
(b) Assemble the Central Conductor, Sheets 2 & 3. Fabricate the Warm Fit fixture, Sheet 8.
(d) The PE-Central Conductor assembly is submerged in LN2 to determine OD-cold and compare to OD-warm of the "tight fit"portion at the location of the central conductor slug. These values are used to select the ground tube material ID andwall thickness. Further details in Notes on Sheet 4.
(f) Assemble the Ground Tube, Sheets 5 & 6.
(g) Cold-fit the Ground Tube assembly onto the PE-Central Conductor assembly.Fit is performed by immersing the PE-Conductor assembly into LN2, upside-down (grooved portion of PE pointing up).The ground tube, flange-end first, is pushed over the PE-Conductor. A PE spacer ring at the bottom of the LN2 vessel isused to give the PE just enough extra length so that when the full assembly is warm, the PE expands with its upper edgeflush with the top flange of the ground tube
11.25 in +/- 0.12
(e) Finish the PE, length and grooves, as on Sheet 4.
(h) Other important final parameters :(i) there must be a minimum of 11-in of grooved PE between the ground tube base and the exposed central conductor(ii) the grooves must extend up into the ground tube for a minimum of 2 in.(iii) the PE cannot cover the screw holes for the spring tip
(b)
Figure 3. Photograph (a) and drawing (b) of the production HV feedthrough. The spherical probe tipattached to the end of the inner conductor, on the right side of these figures.
The feedthrough was a prototype of the MicroBooNE design, shown in Fig. 3. The designwas based on the ICARUS feedthrough [7], with a stainless steel center conductor surrounded byinsulating ultra high molecular weight polyethylene (UHMW PE) that was inserted into an outerground tube. The swappable spherical probe tips attached directly to the center conductor of thefeedthrough. The tests reported in this paper evaluated 1.3 mm, 5.0 mm, and 76 mm diameter
– 3 –
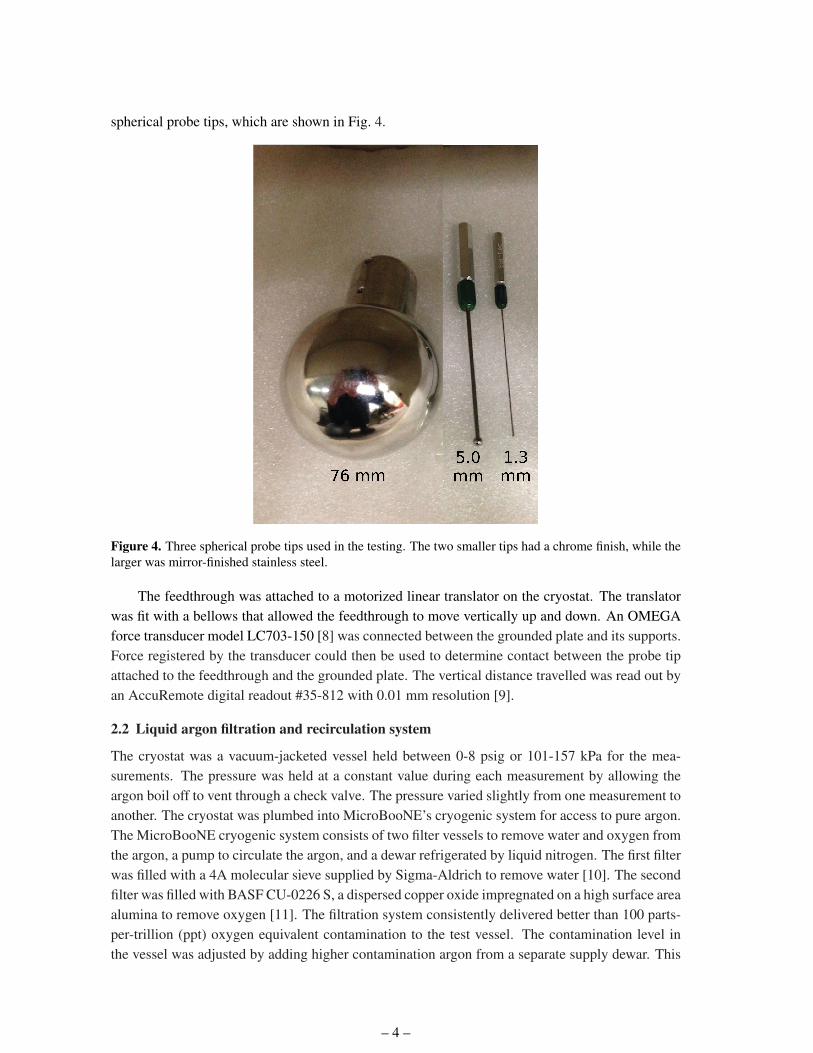
spherical probe tips, which are shown in Fig. 4.
Figure 4. Three spherical probe tips used in the testing. The two smaller tips had a chrome finish, while thelarger was mirror-finished stainless steel.
The feedthrough was attached to a motorized linear translator on the cryostat. The translatorwas fit with a bellows that allowed the feedthrough to move vertically up and down. An OMEGAforce transducer model LC703-150 [8] was connected between the grounded plate and its supports.Force registered by the transducer could then be used to determine contact between the probe tipattached to the feedthrough and the grounded plate. The vertical distance travelled was read out byan AccuRemote digital readout #35-812 with 0.01 mm resolution [9].
2.2 Liquid argon filtration and recirculation system
The cryostat was a vacuum-jacketed vessel held between 0-8 psig or 101-157 kPa for the mea-surements. The pressure was held at a constant value during each measurement by allowing theargon boil off to vent through a check valve. The pressure varied slightly from one measurement toanother. The cryostat was plumbed into MicroBooNE’s cryogenic system for access to pure argon.The MicroBooNE cryogenic system consists of two filter vessels to remove water and oxygen fromthe argon, a pump to circulate the argon, and a dewar refrigerated by liquid nitrogen. The first filterwas filled with a 4A molecular sieve supplied by Sigma-Aldrich to remove water [10]. The secondfilter was filled with BASF CU-0226 S, a dispersed copper oxide impregnated on a high surface areaalumina to remove oxygen [11]. The filtration system consistently delivered better than 100 parts-per-trillion (ppt) oxygen equivalent contamination to the test vessel. The contamination level inthe vessel was adjusted by adding higher contamination argon from a separate supply dewar. This
– 4 –

allowed the production of oxygen equivalent contaminations ranging from 1.5 parts-per-million(ppm) to less than 100 ppt for the testing.
The level of oxygen contamination in the argon was measured using two Servomex gas an-alyzers, a DF-310E and a DF-560E [12]. Combined, the two oxygen analyzers covered a rangeof 0.1 parts-per-billion (ppb) to 5000 ppm. The level of nitrogen contamination in the argon wasmeasured using an LD8000 Trace Impurity Analyzer [13].
Additionally, contamination values ranging between 300 and 50 ppt oxygen equivalent weremeasured with a double-gridded ion chamber, henceforth referred to as a purity monitor, immersedin liquid argon. The purity monitor was based on the design in Reference [14]. A measure ofelectronegative impurities was determined from looking at the fraction of electrons generated at thecathode that arrived at the anode (QA/QC) after a drift time, t. The fraction can also be interpretedas an electron lifetime, τ such that
QA/QC = e−t/τ . (2.1)
A thorough description of the purity monitor and the data acquisition hardware and softwarecan be found in Reference [15]. The purity monitor had a total drift distance from cathode to anodeof 19 cm. It resided in a vessel downstream of the cryostat used for the breakdown tests. Beforeand after breakdown measurements were taken in the cryostat, argon was allowed to flow into thepurity monitor vessel for a purity measurement.
The systematic uncertainties of the purity measurement had the effect of decreasing the frac-tion of QA/QC, consequently decreasing the observed lifetime [15]. Therefore, the reported elec-tron lifetimes from the purity monitor should be interpreted as a lower bound on the true lifetime.
2.3 Experimental Procedure
Measurements over the range of distances between 0 and 2.5 cm were collected over a 12 hourperiod for a given probe and contamination level. First, the zero spacing point was found using theforce transducer described in Section 2.1, and the current was monitored as voltage was applied.The probe was then moved to a distance of 0.1 mm away from the ground plate and the voltageramped up at a rate of 50 V/s until breakdown occurred. Breakdown voltage is defined as thevoltage where the current drawn by the power supply changes its value by more than +100% for afraction of a second.
The cycle of ramping the voltage up until breakdown and recording the voltage at which thebreakdown occurred was repeated multiple times at each distance. The distances considered inthese tests are 0.0, 0.1, 0.3, 0.5, and 0.8 mm; 1 through 10 mm in millimeter steps; and 15, 20,and 25 mm. The zero-point of the probe with respect to the ground plate was measured each timethe probe was moved. For gap spacings of 1 mm and above, the HV ramp rate was increased from50 V/s to 250 V/s. No significant effect on the breakdown voltages was found by making thischange for the larger distances. Increasing the rate for the spacings above 1 mm allowed the fullset of gap spacing measurements to be completed for a given test configuration before a significantamount of argon boiled off.
With the geometry of the test setup, it was found that the liquid argon boil-off caused theliquid level to decrease to nearly the bottom edge of the ground tube at times during testing. In
– 5 –
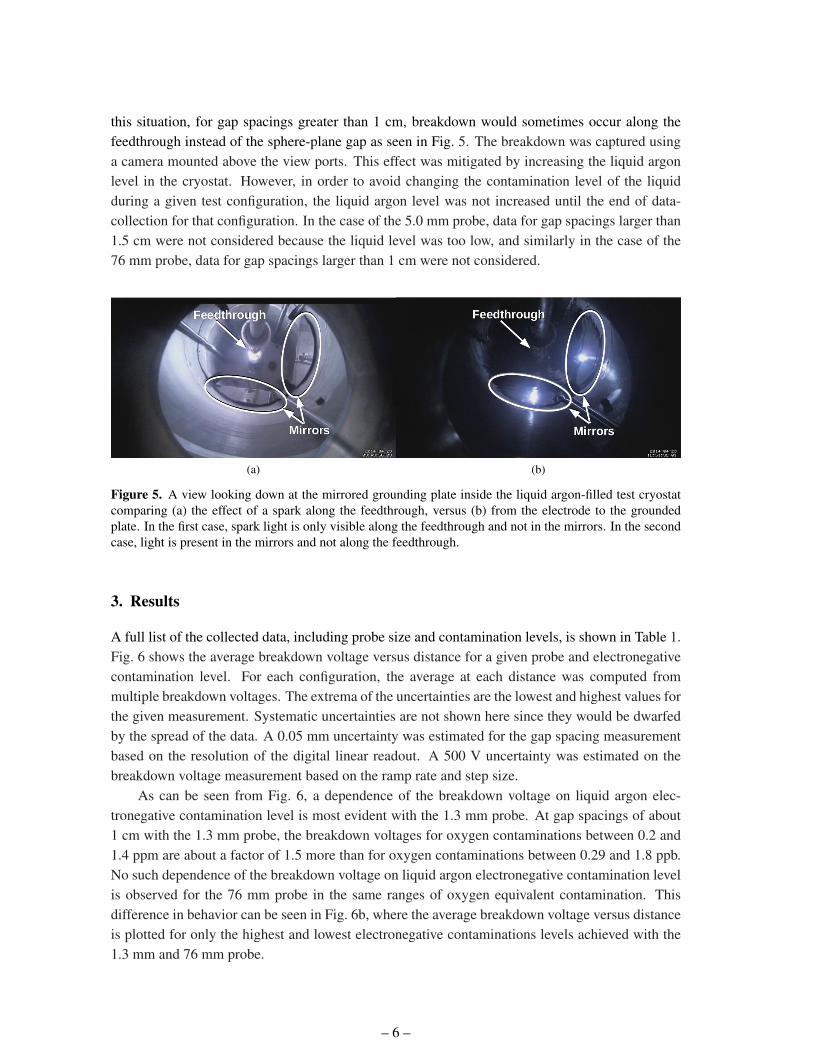
this situation, for gap spacings greater than 1 cm, breakdown would sometimes occur along thefeedthrough instead of the sphere-plane gap as seen in Fig. 5. The breakdown was captured usinga camera mounted above the view ports. This effect was mitigated by increasing the liquid argonlevel in the cryostat. However, in order to avoid changing the contamination level of the liquidduring a given test configuration, the liquid argon level was not increased until the end of data-collection for that configuration. In the case of the 5.0 mm probe, data for gap spacings larger than1.5 cm were not considered because the liquid level was too low, and similarly in the case of the76 mm probe, data for gap spacings larger than 1 cm were not considered.
(a) (b)
Figure 5. A view looking down at the mirrored grounding plate inside the liquid argon-filled test cryostatcomparing (a) the effect of a spark along the feedthrough, versus (b) from the electrode to the groundedplate. In the first case, spark light is only visible along the feedthrough and not in the mirrors. In the secondcase, light is present in the mirrors and not along the feedthrough.
3. Results
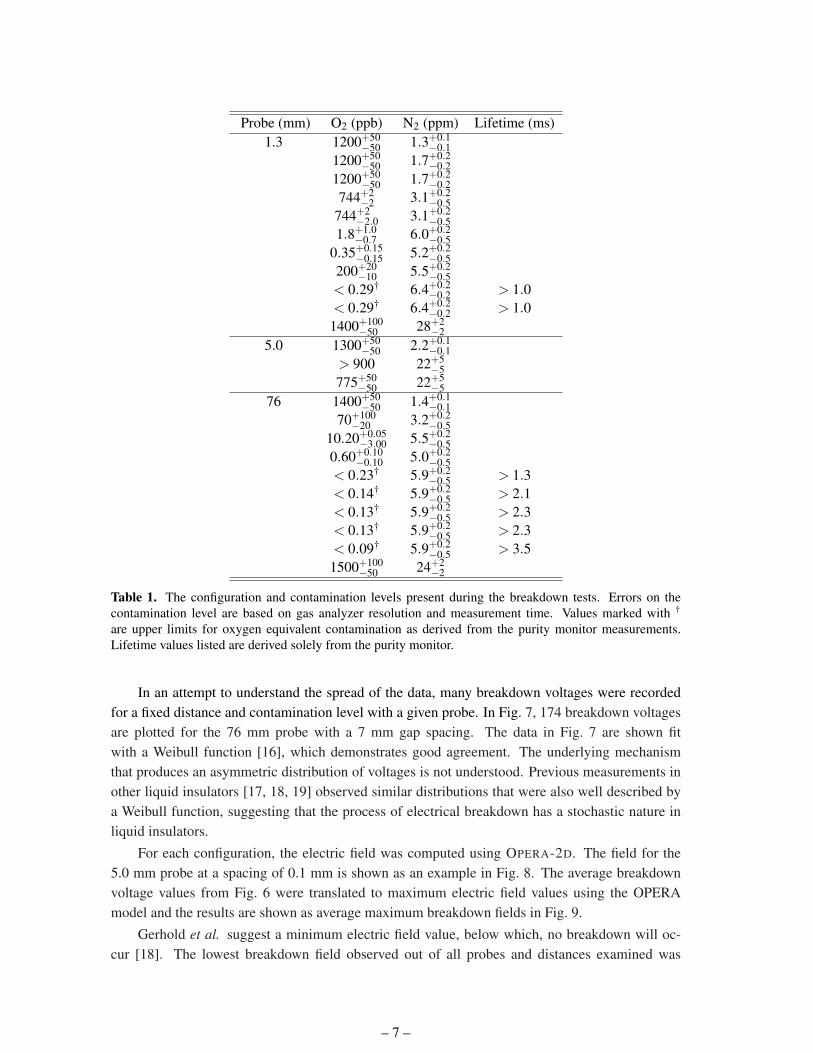
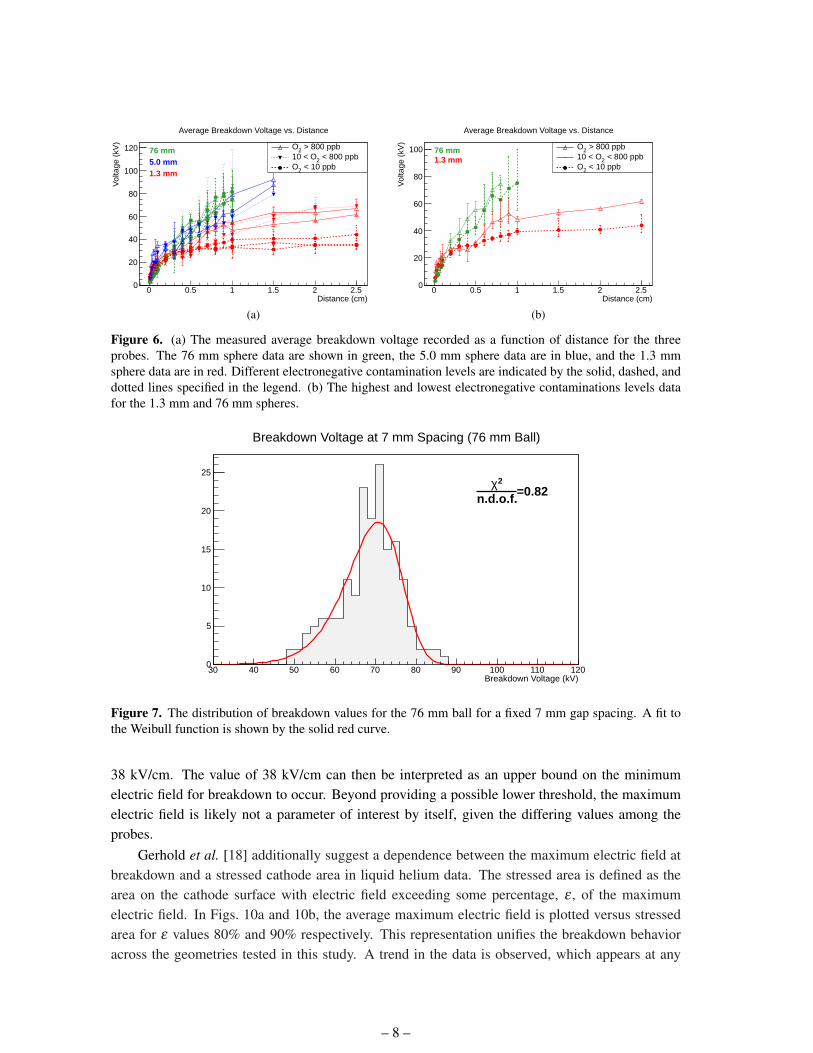
A full list of the collected data, including probe size and contamination levels, is shown in Table 1.Fig. 6 shows the average breakdown voltage versus distance for a given probe and electronegativecontamination level. For each configuration, the average at each distance was computed frommultiple breakdown voltages. The extrema of the uncertainties are the lowest and highest values forthe given measurement. Systematic uncertainties are not shown here since they would be dwarfedby the spread of the data. A 0.05 mm uncertainty was estimated for the gap spacing measurementbased on the resolution of the digital linear readout. A 500 V uncertainty was estimated on thebreakdown voltage measurement based on the ramp rate and step size.
As can be seen from Fig. 6, a dependence of the breakdown voltage on liquid argon elec-tronegative contamination level is most evident with the 1.3 mm probe. At gap spacings of about1 cm with the 1.3 mm probe, the breakdown voltages for oxygen contaminations between 0.2 and1.4 ppm are about a factor of 1.5 more than for oxygen contaminations between 0.29 and 1.8 ppb.No such dependence of the breakdown voltage on liquid argon electronegative contamination levelis observed for the 76 mm probe in the same ranges of oxygen equivalent contamination. Thisdifference in behavior can be seen in Fig. 6b, where the average breakdown voltage versus distanceis plotted for only the highest and lowest electronegative contaminations levels achieved with the1.3 mm and 76 mm probe.
– 6 –
Probe (mm) O2 (ppb) N2 (ppm) Lifetime (ms)1.3 1200+50
−50 1.3+0.1−0.1
1200+50−50 1.7+0.2
−0.21200+50
−50 1.7+0.2−0.2
744+2−2 3.1+0.2
−0.5744+2
−2.0 3.1+0.2−0.5
1.8+1.0−0.7 6.0+0.2
−0.50.35+0.15
−0.15 5.2+0.2−0.5
200+20−10 5.5+0.2
−0.5< 0.29† 6.4+0.2
−0.2 > 1.0< 0.29† 6.4+0.2
−0.2 > 1.01400+100
−50 28+2−2
5.0 1300+50−50 2.2+0.1
−0.1> 900 22+5
−5775+50
−50 22+5−5
76 1400+50−50 1.4+0.1
−0.170+100
−20 3.2+0.2−0.5
10.20+0.05−3.00 5.5+0.2
−0.50.60+0.10
−0.10 5.0+0.2−0.5
< 0.23† 5.9+0.2−0.5 > 1.3
< 0.14† 5.9+0.2−0.5 > 2.1
< 0.13† 5.9+0.2−0.5 > 2.3
< 0.13† 5.9+0.2−0.5 > 2.3
< 0.09† 5.9+0.2−0.5 > 3.5
1500+100−50 24+2
−2
Table 1. The configuration and contamination levels present during the breakdown tests. Errors on thecontamination level are based on gas analyzer resolution and measurement time. Values marked with †
are upper limits for oxygen equivalent contamination as derived from the purity monitor measurements.Lifetime values listed are derived solely from the purity monitor.
In an attempt to understand the spread of the data, many breakdown voltages were recordedfor a fixed distance and contamination level with a given probe. In Fig. 7, 174 breakdown voltagesare plotted for the 76 mm probe with a 7 mm gap spacing. The data in Fig. 7 are shown fitwith a Weibull function [16], which demonstrates good agreement. The underlying mechanismthat produces an asymmetric distribution of voltages is not understood. Previous measurements inother liquid insulators [17, 18, 19] observed similar distributions that were also well described bya Weibull function, suggesting that the process of electrical breakdown has a stochastic nature inliquid insulators.
For each configuration, the electric field was computed using OPERA-2D. The field for the5.0 mm probe at a spacing of 0.1 mm is shown as an example in Fig. 8. The average breakdownvoltage values from Fig. 6 were translated to maximum electric field values using the OPERAmodel and the results are shown as average maximum breakdown fields in Fig. 9.
Gerhold et al. suggest a minimum electric field value, below which, no breakdown will oc-cur [18]. The lowest breakdown field observed out of all probes and distances examined was
– 7 –
Distance (cm)0 0.5 1 1.5 2 2.5
Vol
tage
(kV
)
0
20
40
60
80
100
120 > 800 ppb2O < 800 ppb210 < O
< 10 ppb2O
76 mm5.0 mm1.3 mm
Average Breakdown Voltage vs. Distance
(a) Distance (cm)
0 0.5 1 1.5 2 2.5
Vol
tage
(kV
)
0
20
40
60
80
100 > 800 ppb2O < 800 ppb210 < O
< 10 ppb2O
76 mm1.3 mm
Average Breakdown Voltage vs. Distance
(b)
Figure 6. (a) The measured average breakdown voltage recorded as a function of distance for the threeprobes. The 76 mm sphere data are shown in green, the 5.0 mm sphere data are in blue, and the 1.3 mmsphere data are in red. Different electronegative contamination levels are indicated by the solid, dashed, anddotted lines specified in the legend. (b) The highest and lowest electronegative contaminations levels datafor the 1.3 mm and 76 mm spheres.
Breakdown Voltage (kV)30 40 50 60 70 80 90 100 110 1200
5
10
15
20
25
=0.82n.d.o.f.
2χ
Breakdown Voltage at 7 mm Spacing (76 mm Ball)
Figure 7. The distribution of breakdown values for the 76 mm ball for a fixed 7 mm gap spacing. A fit tothe Weibull function is shown by the solid red curve.
38 kV/cm. The value of 38 kV/cm can then be interpreted as an upper bound on the minimumelectric field for breakdown to occur. Beyond providing a possible lower threshold, the maximumelectric field is likely not a parameter of interest by itself, given the differing values among theprobes.
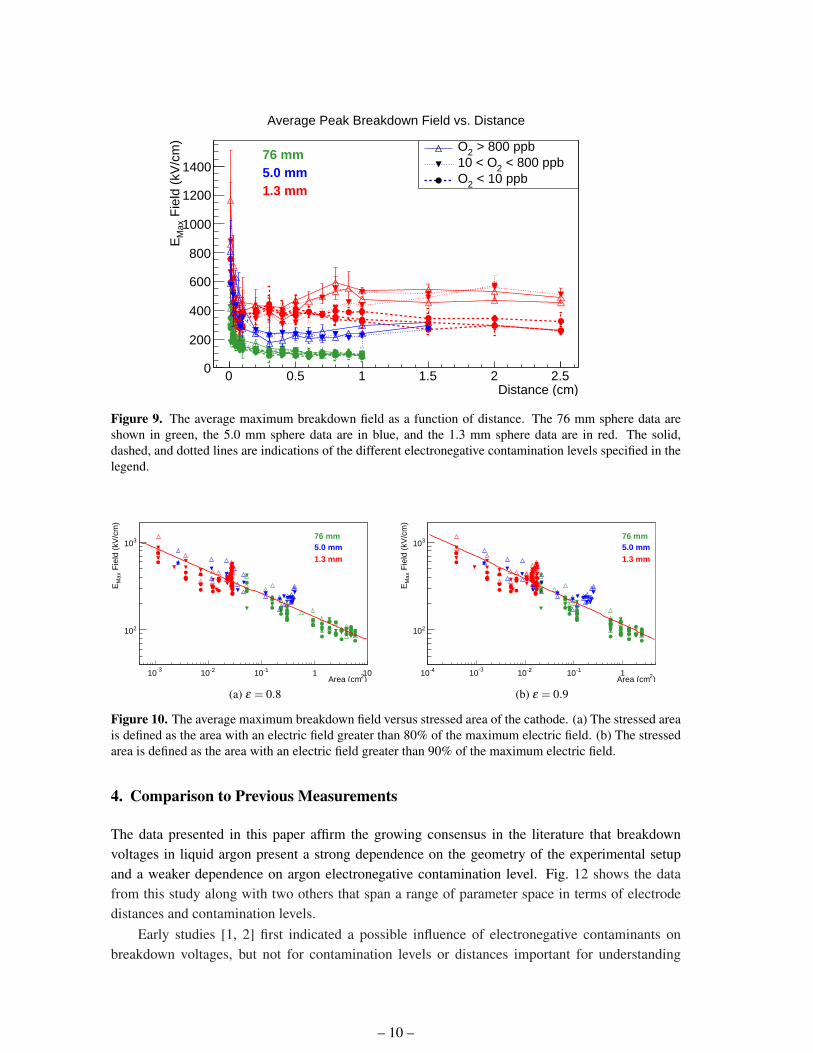
Gerhold et al. [18] additionally suggest a dependence between the maximum electric field atbreakdown and a stressed cathode area in liquid helium data. The stressed area is defined as thearea on the cathode surface with electric field exceeding some percentage, ε , of the maximumelectric field. In Figs. 10a and 10b, the average maximum electric field is plotted versus stressedarea for ε values 80% and 90% respectively. This representation unifies the breakdown behavioracross the geometries tested in this study. A trend in the data is observed, which appears at any
– 8 –
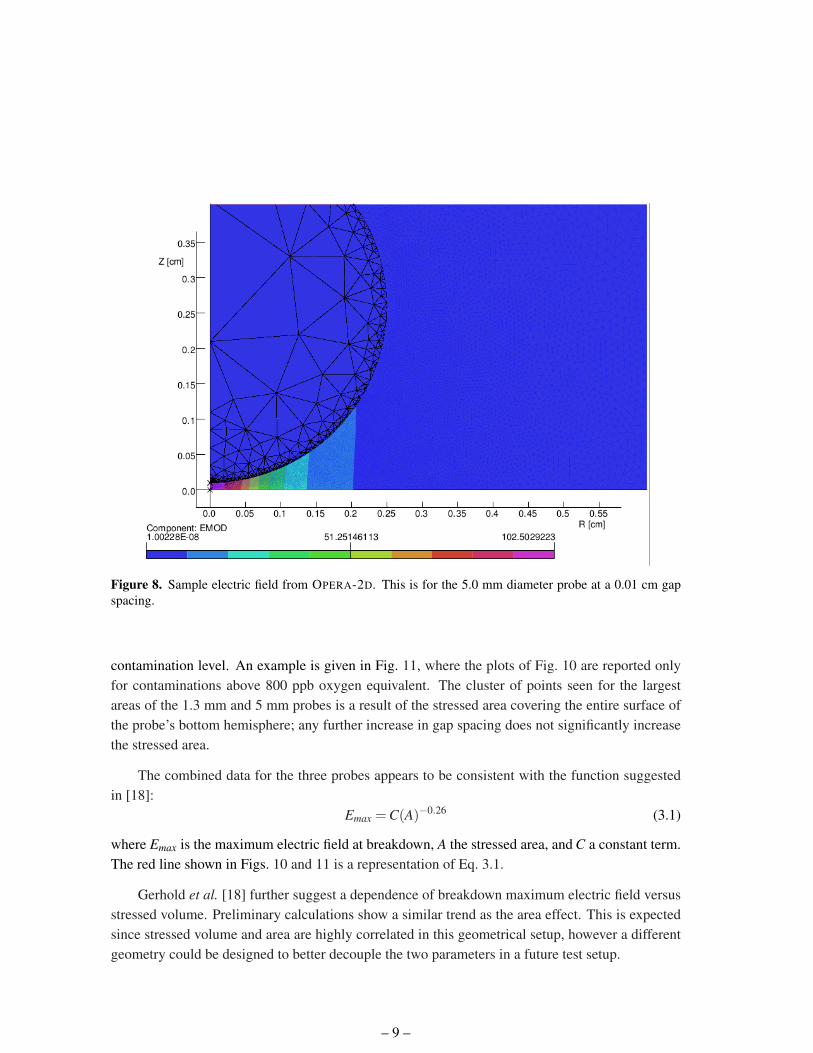
Figure 8. Sample electric field from OPERA-2D. This is for the 5.0 mm diameter probe at a 0.01 cm gapspacing.
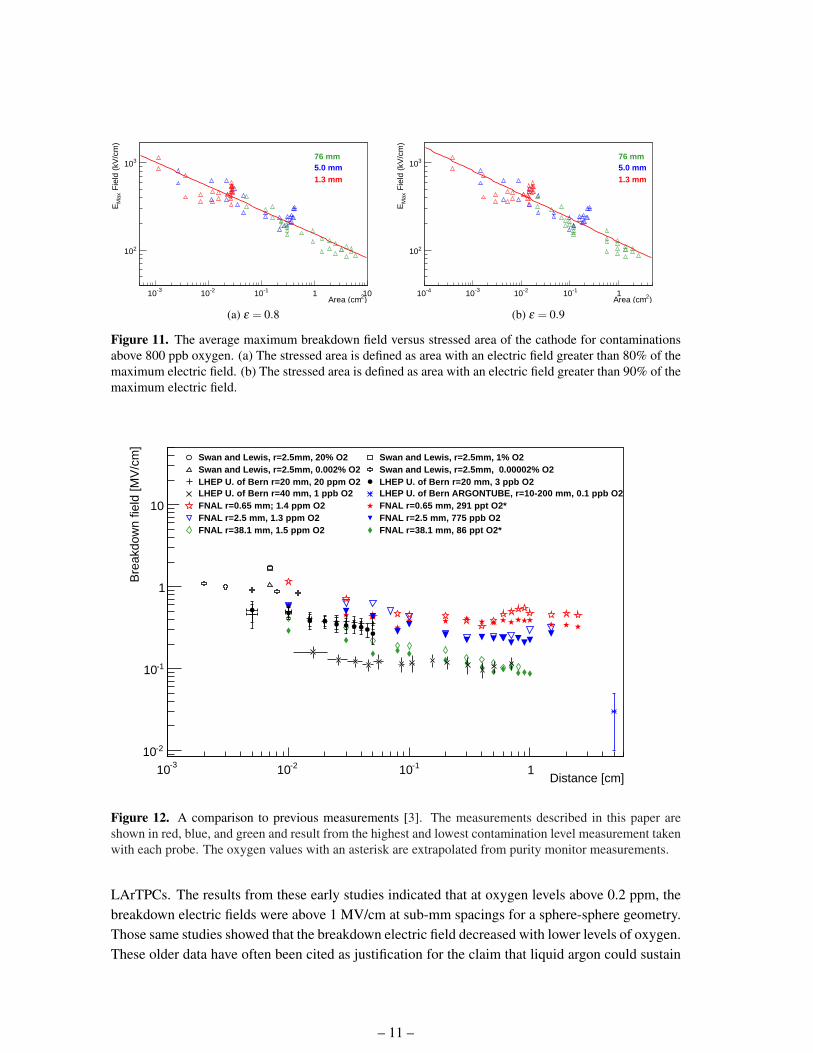
contamination level. An example is given in Fig. 11, where the plots of Fig. 10 are reported onlyfor contaminations above 800 ppb oxygen equivalent. The cluster of points seen for the largestareas of the 1.3 mm and 5 mm probes is a result of the stressed area covering the entire surface ofthe probe’s bottom hemisphere; any further increase in gap spacing does not significantly increasethe stressed area.
The combined data for the three probes appears to be consistent with the function suggestedin [18]:
Emax =C(A)−0.26 (3.1)
where Emax is the maximum electric field at breakdown, A the stressed area, and C a constant term.The red line shown in Figs. 10 and 11 is a representation of Eq. 3.1.
Gerhold et al. [18] further suggest a dependence of breakdown maximum electric field versusstressed volume. Preliminary calculations show a similar trend as the area effect. This is expectedsince stressed volume and area are highly correlated in this geometrical setup, however a differentgeometry could be designed to better decouple the two parameters in a future test setup.
– 9 –
Distance (cm)0 0.5 1 1.5 2 2.5
Fie
ld (
kV/c
m)
Max
E
0
200
400
600
800
1000
1200
1400
> 800 ppb2O < 800 ppb210 < O
< 10 ppb2O
76 mm5.0 mm1.3 mm
Average Peak Breakdown Field vs. Distance
Figure 9. The average maximum breakdown field as a function of distance. The 76 mm sphere data areshown in green, the 5.0 mm sphere data are in blue, and the 1.3 mm sphere data are in red. The solid,dashed, and dotted lines are indications of the different electronegative contamination levels specified in thelegend.
)2 Area (cm-310 -210 -110 1 10
Fie
ld (
kV/c
m)
Max
E
210
31076 mm5.0 mm1.3 mm
(a) ε = 0.8)2 Area (cm
-410 -310 -210 -110 1
Fie
ld (
kV/c
m)
Max
E
210
31076 mm5.0 mm1.3 mm
(b) ε = 0.9
Figure 10. The average maximum breakdown field versus stressed area of the cathode. (a) The stressed areais defined as the area with an electric field greater than 80% of the maximum electric field. (b) The stressedarea is defined as the area with an electric field greater than 90% of the maximum electric field.
4. Comparison to Previous Measurements
The data presented in this paper affirm the growing consensus in the literature that breakdownvoltages in liquid argon present a strong dependence on the geometry of the experimental setupand a weaker dependence on argon electronegative contamination level. Fig. 12 shows the datafrom this study along with two others that span a range of parameter space in terms of electrodedistances and contamination levels.
Early studies [1, 2] first indicated a possible influence of electronegative contaminants onbreakdown voltages, but not for contamination levels or distances important for understanding
– 10 –
)2 Area (cm-310 -210 -110 1 10
Fie
ld (
kV/c
m)
Max
E
210
31076 mm5.0 mm1.3 mm
(a) ε = 0.8)2 Area (cm
-410 -310 -210 -110 1
Fie
ld (
kV/c
m)
Max
E
210
31076 mm5.0 mm1.3 mm
(b) ε = 0.9
Figure 11. The average maximum breakdown field versus stressed area of the cathode for contaminationsabove 800 ppb oxygen. (a) The stressed area is defined as area with an electric field greater than 80% of themaximum electric field. (b) The stressed area is defined as area with an electric field greater than 90% of themaximum electric field.
Distance [cm]-310 -210 -110 1
Bre
akdo
wn
field
[MV
/cm
]
-210
-110
1
10
Swan and Lewis, r=2.5mm, 20% O2 Swan and Lewis, r=2.5mm, 1% O2Swan and Lewis, r=2.5mm, 0.002% O2 Swan and Lewis, r=2.5mm, 0.00002% O2LHEP U. of Bern r=20 mm, 20 ppm O2 LHEP U. of Bern r=20 mm, 3 ppb O2 LHEP U. of Bern r=40 mm, 1 ppb O2 LHEP U. of Bern ARGONTUBE, r=10-200 mm, 0.1 ppb O2FNAL r=0.65 mm; 1.4 ppm O2 FNAL r=0.65 mm, 291 ppt O2*FNAL r=2.5 mm, 1.3 ppm O2 FNAL r=2.5 mm, 775 ppb O2FNAL r=38.1 mm, 1.5 ppm O2 FNAL r=38.1 mm, 86 ppt O2*
Figure 12. A comparison to previous measurements [3]. The measurements described in this paper areshown in red, blue, and green and result from the highest and lowest contamination level measurement takenwith each probe. The oxygen values with an asterisk are extrapolated from purity monitor measurements.
LArTPCs. The results from these early studies indicated that at oxygen levels above 0.2 ppm, thebreakdown electric fields were above 1 MV/cm at sub-mm spacings for a sphere-sphere geometry.Those same studies showed that the breakdown electric field decreased with lower levels of oxygen.These older data have often been cited as justification for the claim that liquid argon could sustain
– 11 –
electric fields on the order of 1 MV/cm. Recent studies using the same sphere-plate geometryas reported in this paper [3] found that argon electronegative contamination level had a relativelysmall impact in comparison to geometry in influencing the breakdown field.
5. Conclusion
A study of the dielectric strength of liquid argon has been performed wherein both the argon elec-tronegative contamination level and the electrode size and separation have been controlled. Theresults show a dependence of the electric field strength at breakdown on the geometry of the test.Breakdown occurs at lower field strengths as the separation between electrodes increases fromsub-millimeter to centimeter scales.
Breakdown also occurs at lower field strength as the stressed surface area of the electrodeincreases; the maximum electric field at breakdown scales roughly as the stressed area to the −0.3power. This study is the first time that the dependence of the breakdown field on stressed cathodearea has been shown for liquid argon.
There is some dependence between breakdown field and argon electronegative contaminationlevel, but the effect from contamination level is small relative to that of the geometries used in thisstudy. The 1.3 mm electrode experienced breakdown at lower electric fields when the argon hadlower contamination level: breakdown electric field values for oxygen contaminations between 0.2and 1.4 ppm were about a factor of 1.5 more than for oxygen contaminations between 0.29 and1.8 ppb at gap spacings of about 1 cm. However, the 76 mm electrode showed no clear dependencebetween electric field at breakdown and argon electronegative contamination level.
Electrical breakdown in liquid argon is a stochastic process; the chain of events which leadto the breakdown is not precisely repeatable. A given geometric setup experienced breakdownover a range of voltages; marks left by sparks on the surface of the larger electrodes show that thelocation of the breakdown can shift when all else is held static. This observation is consistent withthe hypothesis mentioned in [3] that space charge effects in the stressed volume near the cathodecontribute to breakdown probability.
The observed geometric effects are of critical importance in the design of LArTPC detectorsfor neutrino experiments, where drift distances must be on the scale of meters. Ideally, one woulduse a well-known breakdown probability distribution to design LArTPCs. A suitable operatingpoint could then be chosen to minimize damage or dead time while accounting for signal-to-noiserequirements. It is difficult in practice to extrapolate these measurements to TPCs given theirunique and complicated geometries. However, it is possible that stressed area may need to beminimized in TPC design to prevent dielectric breakdown.
6. Acknowledgements
The authors wish to thank the staff at Fermilab for their technical assistance, specifically Jim Wal-ton. Additionally, a great deal of thanks is due to the authors of [3] from the Laboratory for HighEnergy Physics at University Bern for graciously providing their data.
Fermilab is operated by Fermi Research Alliance, LLC under Contract No. De-AC02-07CH11359with the United States Department of Energy.
– 12 –
References
[1] D. Swan and T. Lewis, “Influence of electrode surface conditions on the electrical strength of liquifiedgases,” J. Electrochem. Soc. 107 (1960) 180.
[2] D. Swan and T. Lewis, “The influence of cathode and anode surfaces on the electric strength of liquidargon,” Proc. Phys. Soc. 78 (1961) 448.
[3] A. Blatter et al., “Experimental study of electric breakdowns in liquid argon at centimeter scale,”JINST 9 (2014) P04006, arXiv:1401.6693 [physics.ins-det].
[4] F. Bay et al., “Evidence of electrical breakdown induced by bubbles in liquid argon,”arXiv:1401.2777 [physics.ins-det].
[5] Glassman High Voltage Inc., PO Box 317, 124 West Main Street, High Bridge, NJ 08829-0317,U.S.A.
[6] National Instruments Corp., 11500 N Mopac Expwy, Austin, TX 78759-3504.
[7] S. Amerio et al., “Design, construction and tests of the ICARUS T600 detector,” Nucl. Instrum.Methods 527 (2004) 329.
[8] OMEGA Engineering Inc., One Omega Drive, P.O. Box 4047, Stamford, Connecticut 06907-0047.
[9] AccuRemote, 1301 Calle Avanzado, San Clemente, CA 92673, USA.
[10] Sigma-Aldrich, P.O. Box 14508, St. Louis, MO 63178 USA.
[11] BASF Corp., 100 Park Avenue, Florham Park, NJ 07932 USA.
[12] Spectris plc, Heritage House, Church Road, Egham, TW20 9QD, United Kingdom.
[13] LDetek Inc., 271 Saint-Alphonse Sud, Thetford Mines, Quebec, Canada G6G 3V7.
[14] G. Carugno et al., “Electron lifetime detector for liquid argon,” Nucl. Instrum. Meth. A 292 (1990)580.
[15] M. Adamowski et al., “The Liquid Argon Purity Demonstrator,” JINST 9 (2014) P07005,arXiv:1403.7236 [physics.ins-det].
[16] W. F. Gauster, “Über oberflächeneffekte beim elektrischen durchbruch von flüssigkeiten,” IngenieurArchiv 10 (1956) 160.
[17] J. Gerhold, M. Hubmann, and E. Telser, “Breakdown probability and size effect in liquid helium,”IEEE Transactions on Dielectrics and Electrical Insulation 5 no. 3, (1998) 321.
[18] J. Gerhold, M. Hubmann, and E. Telser, “Gap size effect on liquid helium breakdown,” Cryogenics 34no. 7, (1994) 579.
[19] A. L. Kupershtokh et al., “Stochastic regularities of electrical breakdown initiation in transformer oil,”Industry Applications Conference. Conference Record of the 2001 IEEE 4 (2001) 2729.
– 13 –


![Time-Dependent Dielectric Breakdown in High-Voltage GaN MIS … paper.pdf · We also found evidence of pro-gressive breakdown (PBD) prior to final hard breakdown [7]. Fig. 1 shows](https://static.fdocuments.net/doc/165x107/5f52e924da7dff34614b6513/time-dependent-dielectric-breakdown-in-high-voltage-gan-mis-paperpdf-we-also.jpg)