Lesson 6 – Quadratic Functions and Equations · PDF fileLesson 6 – Quadratic...
31
Lesson 6 – Quadratic Functions and Equations 219 Lesson 6 – Quadratic Functions and Equations We are leaving exponential functions behind and entering an entirely different world. As you work through this lesson, you will learn to identify quadratic functions and their graphs (called parabolas). You will learn the important parts of the parabola including the direction of opening, vertex, intercepts and axis of symmetry. You will use graphs of quadratic functions to solve quadratic equations and, finally, you will learn how to use the characteristics of quadratic functions to solve applications. Even if you are not asked to graph a given quadratic function, doing so is always a good idea so that you can get a visual feel for the problem at hand. Lesson Topics Section 6.1: Quadratic Functions and their Characteristics Vertical Intercept Vertex Axis of Symmetry Domain and Range Horizontal Intercepts Section 6.2: Applications of Quadratic Functions Section 6.3: Quadratic Equations in Standard Form Section 6.4: Solving Quadratic Equations Graphically Section 6.5: Solving Quadratic Inequalities Graphically Section 6.6: Quadratic Regression
Transcript of Lesson 6 – Quadratic Functions and Equations · PDF fileLesson 6 – Quadratic...
Lesson 6 – Quadratic Functions and Equations
219
Lesson 6 – Quadratic Functions and Equations
We are leaving exponential functions behind and entering an entirely different world. As you work through this lesson, you will learn to identify quadratic functions and their graphs (called parabolas). You will learn the important parts of the parabola including the direction of opening, vertex, intercepts and axis of symmetry.
You will use graphs of quadratic functions to solve quadratic equations and, finally, you will learn how to use the characteristics of quadratic functions to solve applications. Even if you are not asked to graph a given quadratic function, doing so is always a good idea so that you can get a visual feel for the problem at hand.
Lesson Topics
Section 6.1: Quadratic Functions and their Characteristics
§ Vertical Intercept § Vertex § Axis of Symmetry § Domain and Range § Horizontal Intercepts
Section 6.2: Applications of Quadratic Functions Section 6.3: Quadratic Equations in Standard Form Section 6.4: Solving Quadratic Equations Graphically
Section 6.5: Solving Quadratic Inequalities Graphically Section 6.6: Quadratic Regression

Lesson 6 – Quadratic Functions and Equations
220
Lesson 6 – Quadratic Functions and Equations - MiniLesson
221
Lesson 6 - MiniLesson
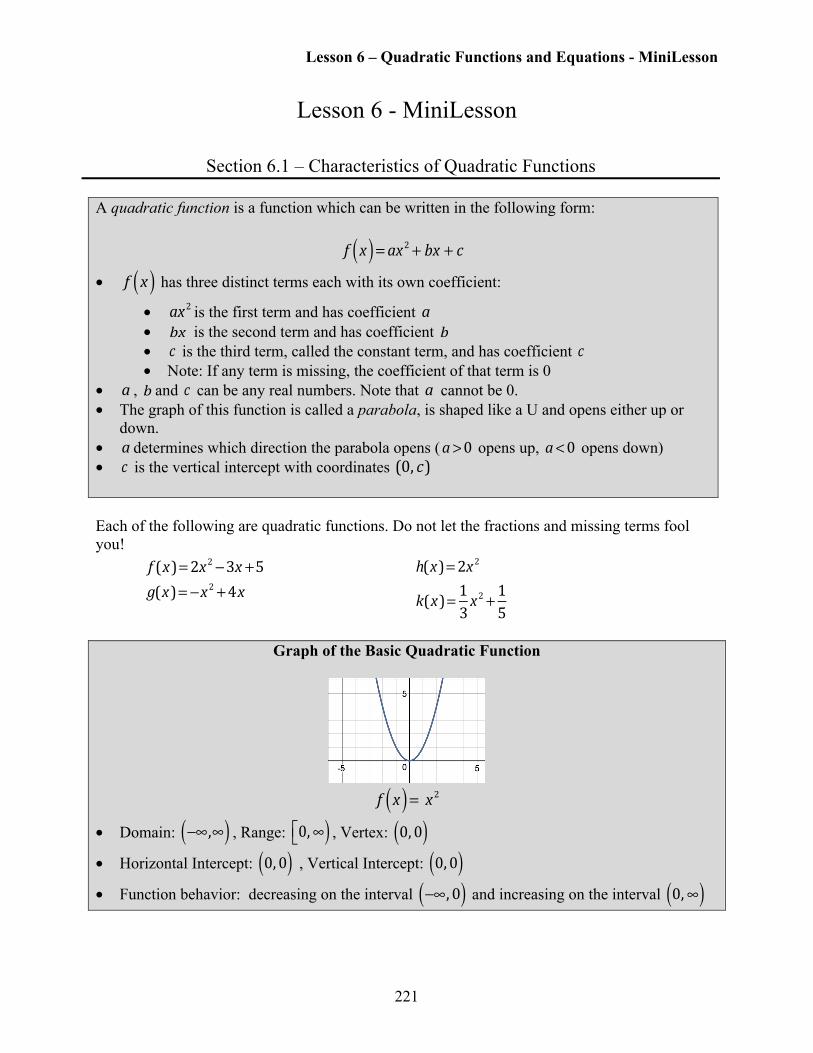
Section 6.1 – Characteristics of Quadratic Functions A quadratic function is a function which can be written in the following form:
!!f x( ) = ax2 + bx + c
• !f x( ) has three distinct terms each with its own coefficient:
• !!ax2 is the first term and has coefficient !a • !bx is the second term and has coefficient !b • !c is the third term, called the constant term, and has coefficient !c • Note: If any term is missing, the coefficient of that term is 0
• !a , !b and !c can be any real numbers. Note that !a cannot be 0. • The graph of this function is called a parabola, is shaped like a U and opens either up or
down. • !a determines which direction the parabola opens (!!a>0 opens up, !!a<0 opens down) • !c is the vertical intercept with coordinates !!(0, c) Each of the following are quadratic functions. Do not let the fractions and missing terms fool you!
!!f (x)=2x2 −3x +5g(x)= −x2 +4x
!!
h(x)=2x2
k(x)= 13 x2 + 15
Graph of the Basic Quadratic Function
!!f x( ) = !x2
• Domain: ! −∞,∞( ) , Range: ! 0,∞⎡⎣ ) , Vertex: ! 0, 0( )
• Horizontal Intercept: ! 0, 0( ) , Vertical Intercept: ! 0, 0( )
• Function behavior: decreasing on the interval ! −∞, 0( ) and increasing on the interval ! 0,∞( )
Lesson 6 – Quadratic Functions and Equations - MiniLesson
222
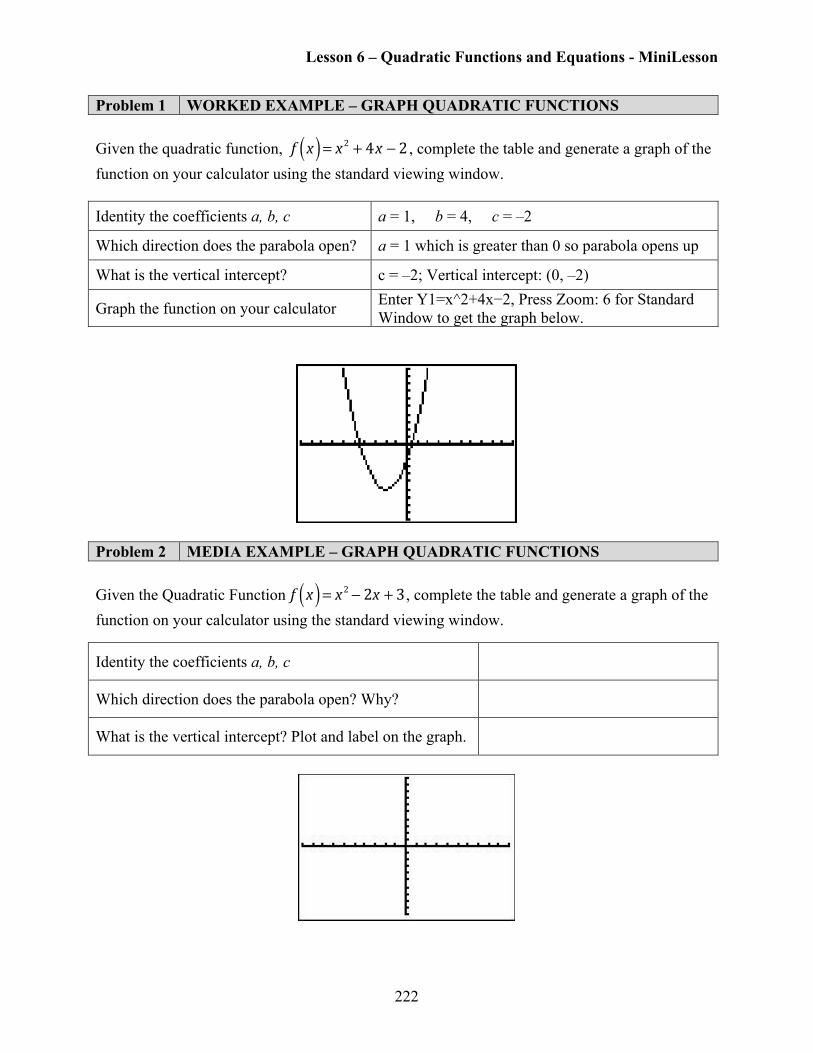
Problem 1 WORKED EXAMPLE – GRAPH QUADRATIC FUNCTIONS Given the quadratic function, !!f x( ) = x2 + 4x − 2 , complete the table and generate a graph of the function on your calculator using the standard viewing window. Identity the coefficients a, b, c a = 1, b = 4, c = –2
Which direction does the parabola open? a = 1 which is greater than 0 so parabola opens up
What is the vertical intercept? c = –2; Vertical intercept: (0, –2)
Graph the function on your calculator Enter Y1=x^2+4x−2, Press Zoom: 6 for Standard Window to get the graph below.
Problem 2 MEDIA EXAMPLE – GRAPH QUADRATIC FUNCTIONS Given the Quadratic Function!!f x( ) = x2 − 2x + 3, complete the table and generate a graph of the function on your calculator using the standard viewing window.
Identity the coefficients a, b, c
Which direction does the parabola open? Why?
What is the vertical intercept? Plot and label on the graph.
Lesson 6 – Quadratic Functions and Equations - MiniLesson
223
Problem 3 YOU TRY – GRAPH QUADRATIC FUNCTIONS a) Given the quadratic function !!f x( ) =2x2 − !5 , complete the table and generate a graph of the function on your calculator using the standard viewing window.
Identity the coefficients a, b, c
Which direction does the parabola open? Why?
What is the vertical intercept? Plot and label on the graph.
b) Given the quadratic function !!f x( ) = −4x2 +2x −1 , complete the table and generate a graph of the function on your calculator using the standard viewing window.
Identity the coefficients a, b, c
Which direction does the parabola open? Why?
What is the vertical intercept? Plot and label on the graph.
Lesson 6 – Quadratic Functions and Equations - MiniLesson
224
Quadratic Functions: Vertex/Axis Of Symmetry Given a quadratic function, !!f x( ) = ax2 +bx + c The vertex is the lowest or highest point of the associated parabola and is always written as an ordered pair.
• To find the vertex input value, identify coefficients a and b then compute ab2
− .
• Substitute this input value into !f x( ) to determine the corresponding output value.
The axis of symmetry equation is the equation of the vertical line that passes through the vertex and divides the parabola in half.
• Axis of symmetry equation !!x ! = − b
2a
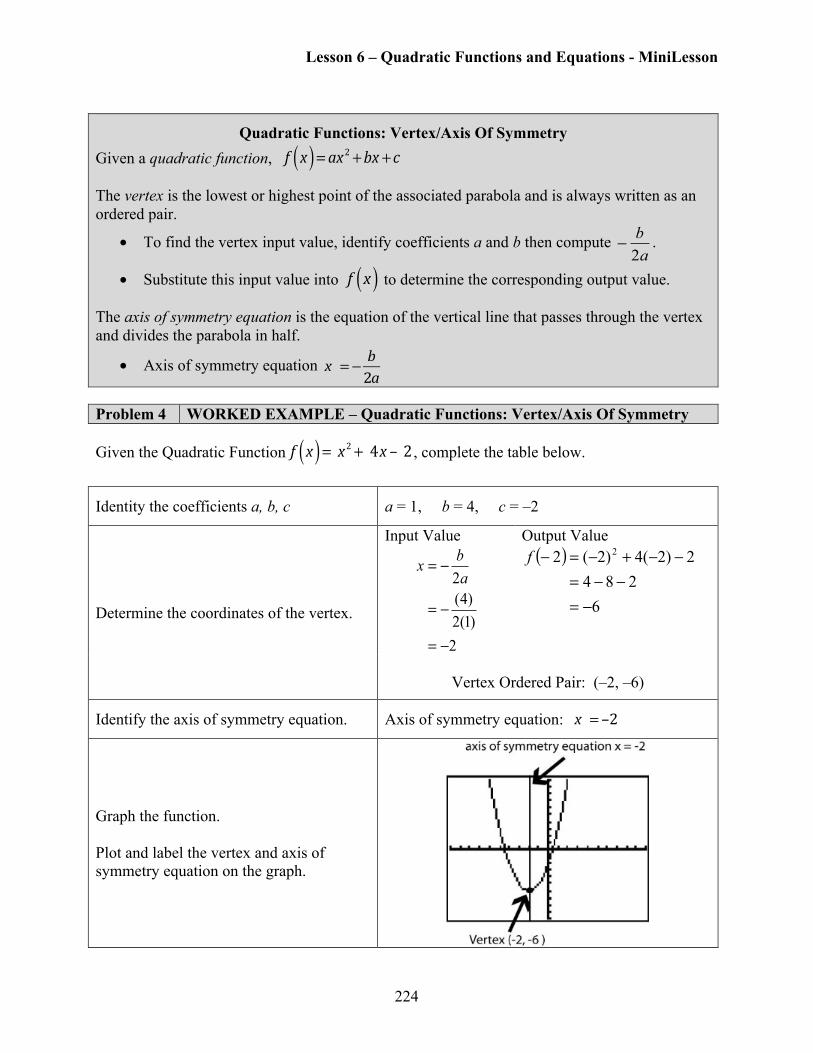
Problem 4 WORKED EXAMPLE – Quadratic Functions: Vertex/Axis Of Symmetry
Given the Quadratic Function!!f x( ) = !x2 + !4x – !2 , complete the table below.
Identity the coefficients a, b, c a = 1, b = 4, c = –2
Determine the coordinates of the vertex.
Input Value
2)1(2)4(
2
−=
−=
−=abx
Output Value ( )
6284
2)2(4)2(2 2
−=−−=
−−+−=−f
Vertex Ordered Pair: (–2, –6)
Identify the axis of symmetry equation. Axis of symmetry equation: !!x ! = –2
Graph the function. Plot and label the vertex and axis of symmetry equation on the graph.
Lesson 6 – Quadratic Functions and Equations - MiniLesson
225
Problem 5 MEDIA EXAMPLE – Quadratic Functions: Vertex/Axis Of Symmetry
Given the quadratic function!!f (x)= x2 −2x +3 , complete the table below.
Identity the coefficients a, b, c
Determine the coordinates of the vertex.
Identify the axis of symmetry equation.
Graph the function. Plot and label the vertex and axis of symmetry equation on the graph.
Problem 6 YOU TRY – Quadratic Functions: Vertex/Axis Of Symmetry
Given the quadratic function!!f x( ) =2x2 – !5 , complete the table below.
Identity the coefficients a, b, c
Determine the coordinates of the vertex.
Identify the axis of symmetry equation.
Graph the function. Plot and label the vertex and axis of symmetry equation on the graph.
Lesson 6 – Quadratic Functions and Equations - MiniLesson
226
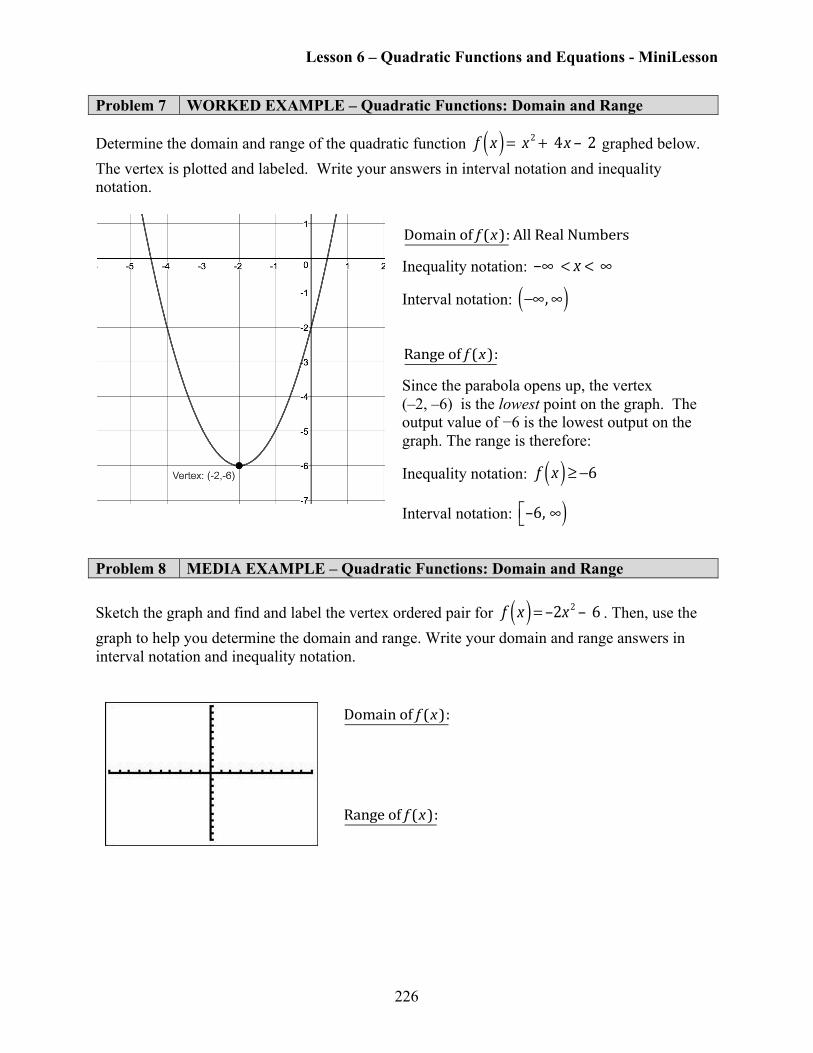
Problem 7 WORKED EXAMPLE – Quadratic Functions: Domain and Range
Determine the domain and range of the quadratic function !!f x( ) = !x2 + !4x – !2 graphed below. The vertex is plotted and labeled. Write your answers in interval notation and inequality notation.
!!Domain!of!f (x): All!Real!Numbers
Inequality notation: !!–∞! < x < !∞!!!!! Interval notation: ! −∞,∞( )
!!Range!of!f (x): Since the parabola opens up, the vertex (–2, –6) is the lowest point on the graph. The output value of −6 is the lowest output on the graph. The range is therefore:
Inequality notation: !!f x( )≥ −6
Interval notation: ! –6,!∞⎡⎣ )!!!
Problem 8 MEDIA EXAMPLE – Quadratic Functions: Domain and Range Sketch the graph and find and label the vertex ordered pair for !!f x( ) = –2x2 – !6 . Then, use the graph to help you determine the domain and range. Write your domain and range answers in interval notation and inequality notation.
!!Domain!of!f (x):
!!Range!of!f (x):
Lesson 6 – Quadratic Functions and Equations - MiniLesson
227
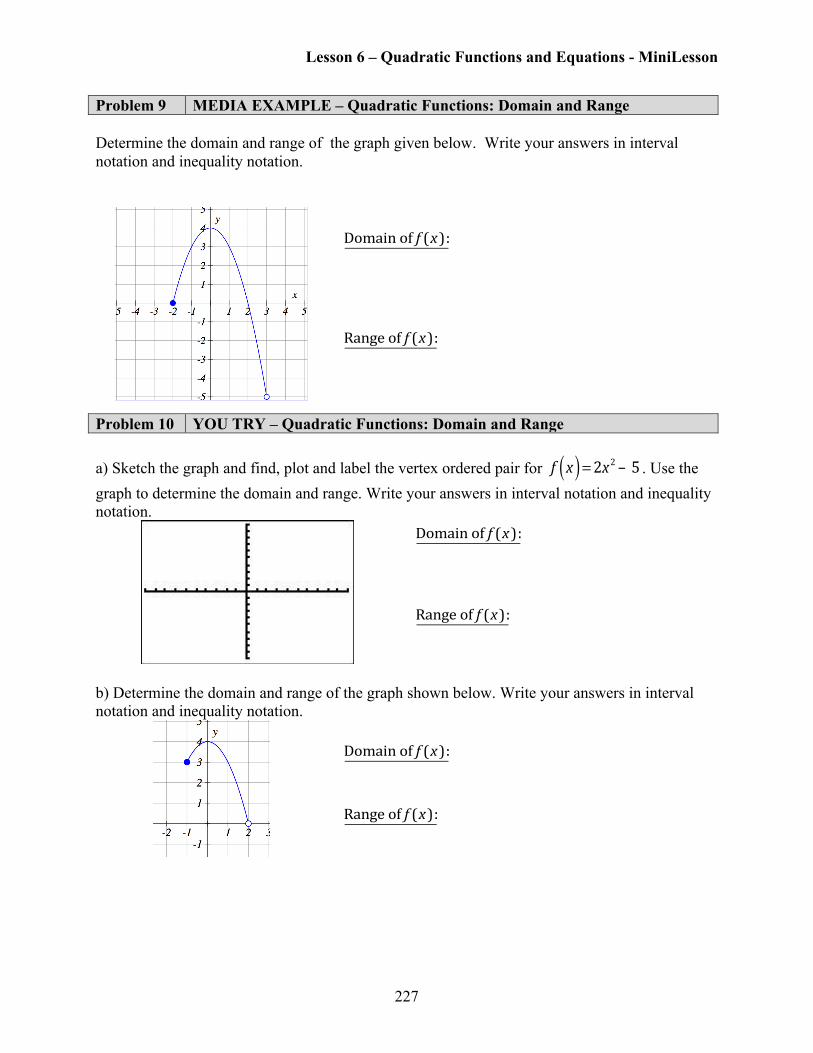
Problem 9 MEDIA EXAMPLE – Quadratic Functions: Domain and Range Determine the domain and range of the graph given below. Write your answers in interval notation and inequality notation.
!!Domain!of!f (x):
!!Range!of!f (x):
Problem 10 YOU TRY – Quadratic Functions: Domain and Range a) Sketch the graph and find, plot and label the vertex ordered pair for !!f x( ) =2x2 – !5 . Use the graph to determine the domain and range. Write your answers in interval notation and inequality notation.
!!Domain!of!f (x):
!!Range!of!f (x):
b) Determine the domain and range of the graph shown below. Write your answers in interval notation and inequality notation.
!!Domain!of!f (x):
!!Range!of!f (x):
Lesson 6 – Quadratic Functions and Equations - MiniLesson
228
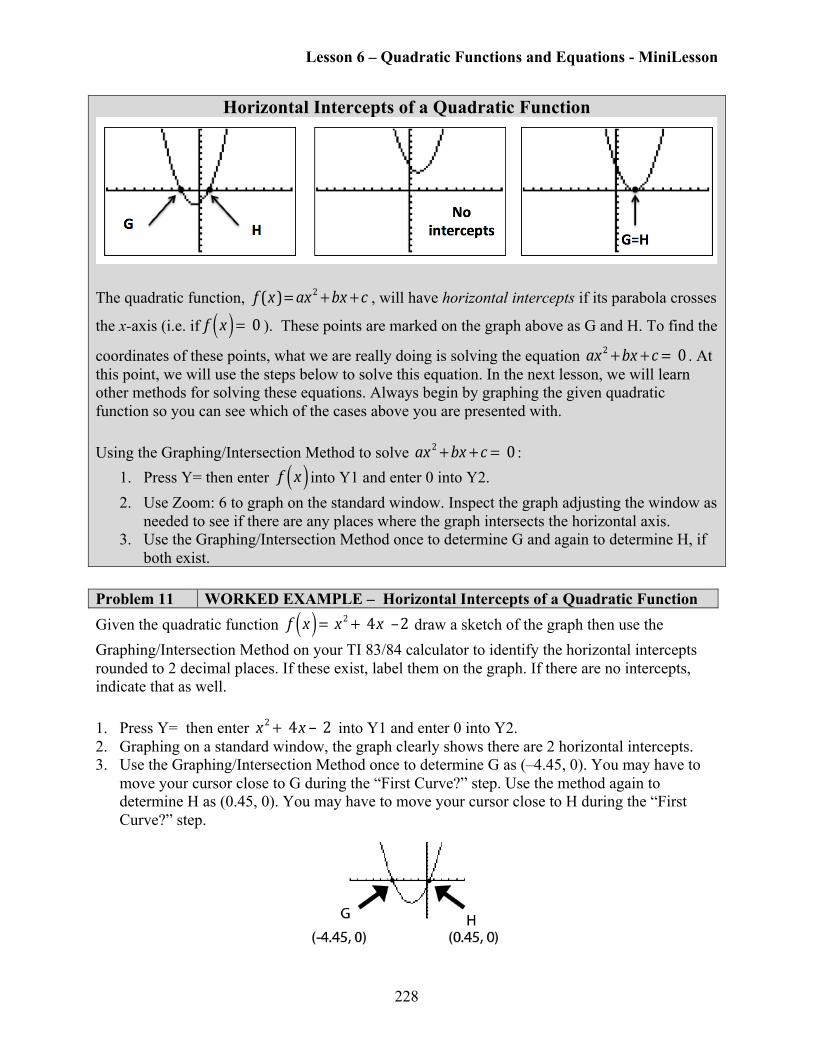
Horizontal Intercepts of a Quadratic Function
The quadratic function, !!f (x)= ax
2 +bx + c , will have horizontal intercepts if its parabola crosses
the x-axis (i.e. if!!f x( ) = !0 ). These points are marked on the graph above as G and H. To find the
coordinates of these points, what we are really doing is solving the equation !!ax2 +bx + c = !0 . At this point, we will use the steps below to solve this equation. In the next lesson, we will learn other methods for solving these equations. Always begin by graphing the given quadratic function so you can see which of the cases above you are presented with. Using the Graphing/Intersection Method to solve !!ax2 +bx + c = !0 :
1. Press Y= then enter !f x( ) into Y1 and enter 0 into Y2.
2. Use Zoom: 6 to graph on the standard window. Inspect the graph adjusting the window as needed to see if there are any places where the graph intersects the horizontal axis.
3. Use the Graphing/Intersection Method once to determine G and again to determine H, if both exist.
Problem 11 WORKED EXAMPLE – Horizontal Intercepts of a Quadratic Function Given the quadratic function !!f x( ) = !x2 + !4x ! –2 draw a sketch of the graph then use the Graphing/Intersection Method on your TI 83/84 calculator to identify the horizontal intercepts rounded to 2 decimal places. If these exist, label them on the graph. If there are no intercepts, indicate that as well.
1. Press Y= then enter !!x2 + !4x – !2! into Y1 and enter 0 into Y2. 2. Graphing on a standard window, the graph clearly shows there are 2 horizontal intercepts. 3. Use the Graphing/Intersection Method once to determine G as (–4.45, 0). You may have to
move your cursor close to G during the “First Curve?” step. Use the method again to determine H as (0.45, 0). You may have to move your cursor close to H during the “First Curve?” step.
Lesson 6 – Quadratic Functions and Equations - MiniLesson
229
Problem 12 MEDIA EXAMPLE – Horizontal Intercepts of a Quadratic Function For each of the following functions, draw a sketch of the graph then use the Graphing /Intersection Method on your TI 83/84 calculator to identify the horizontal intercepts rounded to 2 decimal places. If these exist, label them on the graph. If there are no intercepts, indicate that as well. a) !!f x( ) = −2x2 + 6x + 3
b) !!g x( ) = !x2 − x !+ !2
c) !!h x( ) = !x2 − 6x !+ !9
Lesson 6 – Quadratic Functions and Equations - MiniLesson
230
Problem 13 YOU TRY – Horizontal Intercepts of a Quadratic Function a) Given the quadratic function!!f x( ) =2x2 − 5 , sketch the graph then use the Graphing /Intersection Method on your TI 83/84 calculator to identify the horizontal intercepts rounded to 2 decimal places. If these exist, label them on the graph. If there are no intercepts, indicate that as well.
b) Given the quadratic function!!f x( ) = −3x2 + 2x + 5 , sketch the graph then use the Graphing /Intersection Method on your TI 83/84 calculator to identify the horizontal intercepts rounded to 2 decimal places. If these exist, label them on the graph. If there are no intercepts, indicate that as well.
Lesson 6 – Quadratic Functions and Equations - MiniLesson
231
Section 6.2 – Applications of Quadratic Functions A large number of quadratic applications involve launching objects into the sky (arrows, baseballs, rockets, etc…) or throwing things off buildings or spanning a distance with an arched shape. While the specifics of each problem are certainly different, the information below will guide you as you decipher the different parts.
How to Solve Quadratic Application Problems
1. Draw an accurate graph of the function using first quadrant values only. Label the x-axis
with the input quantity and units. Label the y-axis with the output quantity and units. 2. Identify, plot and label the vertical intercept. 3. Identify, plot and label the vertex. 4. Identify, plot and label the positive horizontal intercept(s). Usually, there is only one
horizontal intercept that is importat. If both are needed, then plot them both and include negative input values in your graph for part 1.
5. Once you have completed steps 1–4, read the specific questions you are asked to solve. Sample questions that involve the vertical intercept !! 0, c( ) :
• How high was the object at time!!t =0 ? Answer: c • What was the starting height of the object? Answer: c
Sample questions that involve the vertex:
• How high was the object at its highest point? Answer: y-value of the vertex • What was the max height of the object? Answer: y-value of the vertex • How long did it take the object to get to its max height? Answer: x-value of the vertex • What is the practical range of this function? [0, y-value of the vertex]
Sample questions that usually involve the positive horizontal intercept !! x2 , !0( ) :
• When did the object hit the ground? Answer: !!x2
• What is the practical domain of this function? !! 0,x2⎡⎣ ⎤⎦
• How far was the object from the center? !!x2
Lesson 6 – Quadratic Functions and Equations - MiniLesson
232
Problem 14 WORKED EXAMPLE –Applications of Quadratic Functions
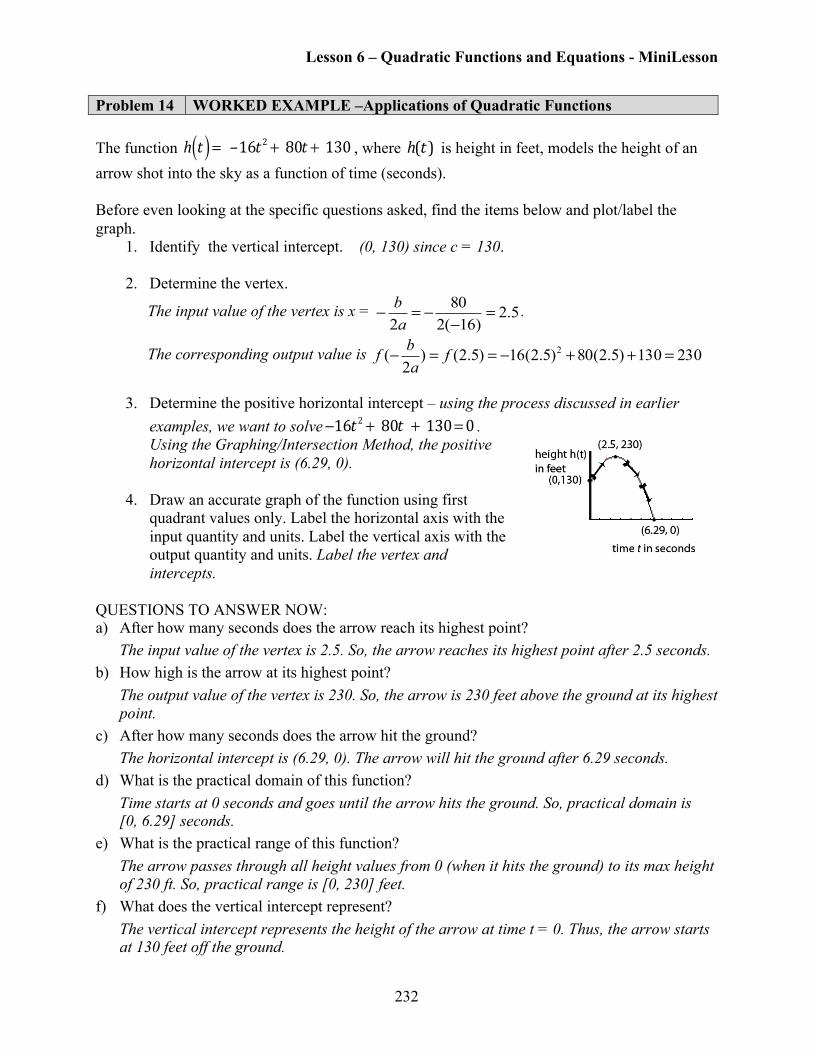
The function !!h t( ) = ! –16t2 + !80t + !130 , where !!h(t) is height in feet, models the height of an arrow shot into the sky as a function of time (seconds). Before even looking at the specific questions asked, find the items below and plot/label the graph.
1. Identify the vertical intercept. (0, 130) since c = 130.
2. Determine the vertex.
The input value of the vertex is x = 5.2)16(2
802
=−
−=−ab .
The corresponding output value is 230130)5.2(80)5.2(16)5.2()2
( 2 =++−==− fabf
3. Determine the positive horizontal intercept – using the process discussed in earlier
examples, we want to solve!!−16t2 + !80t !+ !130=0 . Using the Graphing/Intersection Method, the positive horizontal intercept is (6.29, 0).
4. Draw an accurate graph of the function using first
quadrant values only. Label the horizontal axis with the input quantity and units. Label the vertical axis with the output quantity and units. Label the vertex and intercepts.
QUESTIONS TO ANSWER NOW: a) After how many seconds does the arrow reach its highest point? The input value of the vertex is 2.5. So, the arrow reaches its highest point after 2.5 seconds. b) How high is the arrow at its highest point? The output value of the vertex is 230. So, the arrow is 230 feet above the ground at its highest
point. c) After how many seconds does the arrow hit the ground? The horizontal intercept is (6.29, 0). The arrow will hit the ground after 6.29 seconds. d) What is the practical domain of this function? Time starts at 0 seconds and goes until the arrow hits the ground. So, practical domain is
[0, 6.29] seconds. e) What is the practical range of this function? The arrow passes through all height values from 0 (when it hits the ground) to its max height
of 230 ft. So, practical range is [0, 230] feet. f) What does the vertical intercept represent? The vertical intercept represents the height of the arrow at time t = 0. Thus, the arrow starts
at 130 feet off the ground.
Lesson 6 – Quadratic Functions and Equations - MiniLesson
233
Problem 15 MEDIA EXAMPLE – Applications of Quadratic Functions The height of a train tunnel is modeled by the quadratic function !!h x( ) = ! –0.35x2 + !25 , where x
is the distance, in feet, from the center of the tracks and !h x( ) is the height of the tunnel, also in
feet. Assume that the high point of the tunnel is directly in line with the center of the train tracks. a) Draw a complete diagram of this situation. Find and label each of the following: vertex, horizontal intercept (positive side), and vertical intercept. b) How wide is the base of the tunnel? c) A train with a flatbed car 6 feet off the ground is carrying a large object that is 15 feet high. How much room will there be between the top of the object and the top of the tunnel?
Lesson 6 – Quadratic Functions and Equations - MiniLesson
234
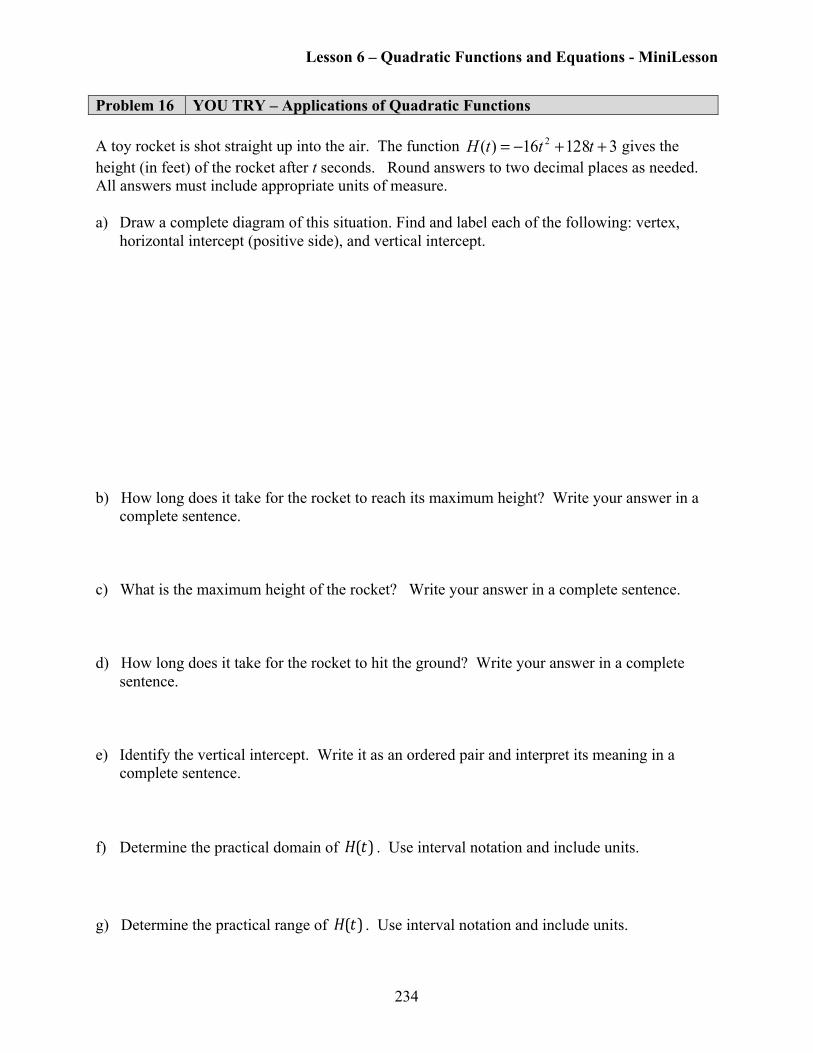
Problem 16 YOU TRY – Applications of Quadratic Functions A toy rocket is shot straight up into the air. The function 312816)( 2 ++−= tttH gives the height (in feet) of the rocket after t seconds. Round answers to two decimal places as needed. All answers must include appropriate units of measure.
a) Draw a complete diagram of this situation. Find and label each of the following: vertex,
horizontal intercept (positive side), and vertical intercept.
b) How long does it take for the rocket to reach its maximum height? Write your answer in a
complete sentence.
c) What is the maximum height of the rocket? Write your answer in a complete sentence.
d) How long does it take for the rocket to hit the ground? Write your answer in a complete sentence.
e) Identify the vertical intercept. Write it as an ordered pair and interpret its meaning in a complete sentence.
f) Determine the practical domain of !!H(t) . Use interval notation and include units.
g) Determine the practical range of !!H(t) . Use interval notation and include units.
Lesson 6 – Quadratic Functions and Equations - MiniLesson
235
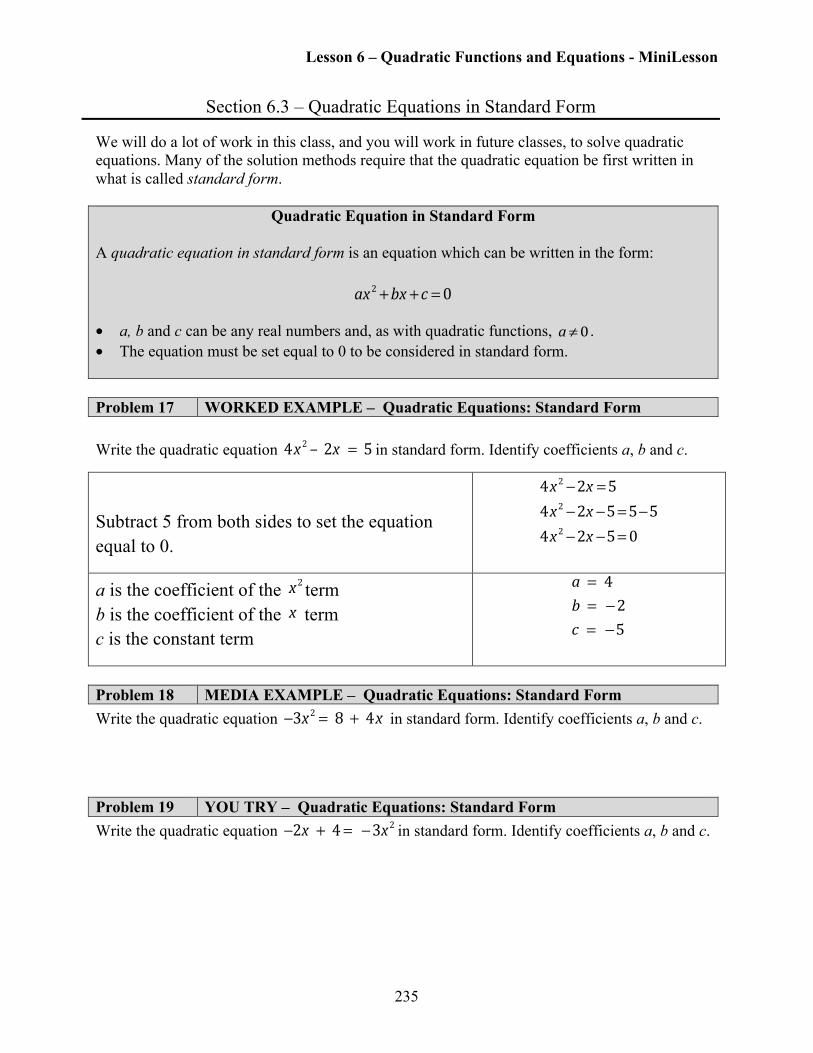
Section 6.3 – Quadratic Equations in Standard Form We will do a lot of work in this class, and you will work in future classes, to solve quadratic equations. Many of the solution methods require that the quadratic equation be first written in what is called standard form.
Quadratic Equation in Standard Form A quadratic equation in standard form is an equation which can be written in the form:
!!ax2 +bx + c =0
• a, b and c can be any real numbers and, as with quadratic functions, !!a≠0 . • The equation must be set equal to 0 to be considered in standard form. Problem 17 WORKED EXAMPLE – Quadratic Equations: Standard Form Write the quadratic equation !!4x2 – !2x ! = !5 in standard form. Identify coefficients a, b and c.
Subtract 5 from both sides to set the equation equal to 0. !!
4x2 −2x =54x2 −2x −5=5−54x2 −2x −5=0
a is the coefficient of the !!x2 term b is the coefficient of the !x term c is the constant term !!
a! = !4b! = !−2c ! = !−5
Problem 18 MEDIA EXAMPLE – Quadratic Equations: Standard Form Write the quadratic equation !!−3x2 = !8!+ !4x in standard form. Identify coefficients a, b and c.
Problem 19 YOU TRY – Quadratic Equations: Standard Form Write the quadratic equation !!−2x !+ !4 = !−3x2 in standard form. Identify coefficients a, b and c.
Lesson 6 – Quadratic Functions and Equations - MiniLesson
236
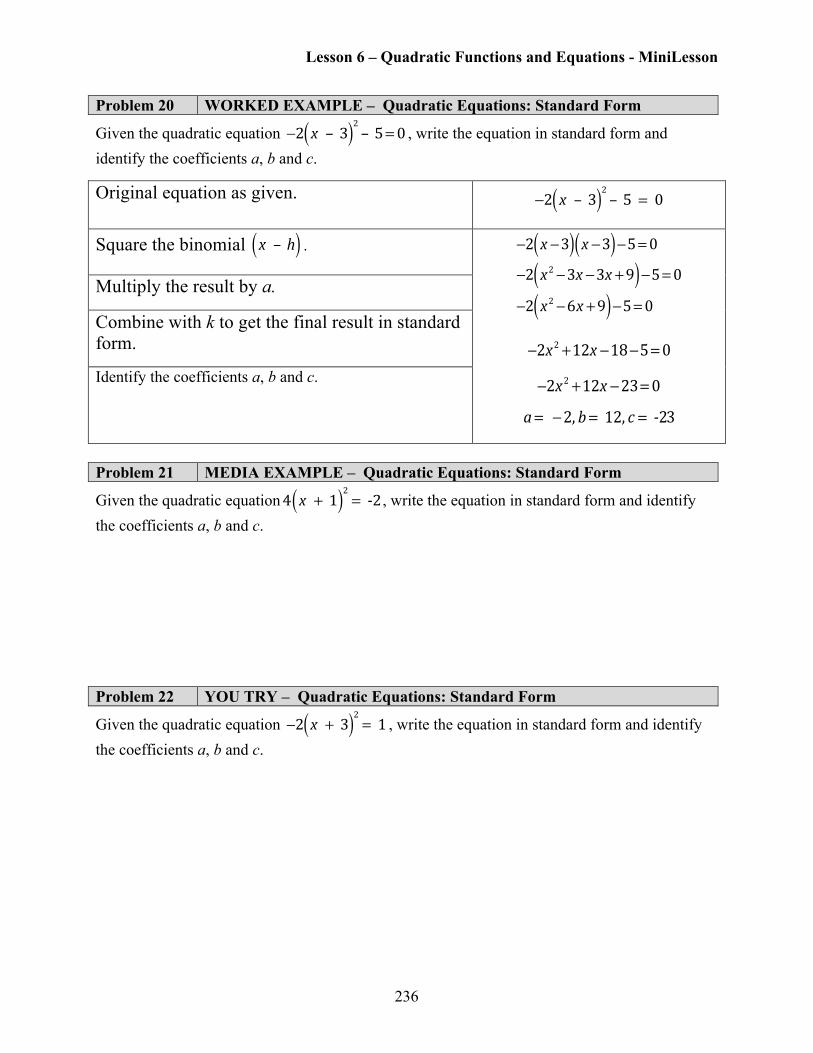
Problem 20 WORKED EXAMPLE – Quadratic Equations: Standard Form
Given the quadratic equation !!−2 x ! – !3( )2 – !5=0 , write the equation in standard form and identify the coefficients a, b and c.
Original equation as given. !!−2 x ! – !3( )2 – !5! = !0
Square the binomial !! x ! – !h( ) .
!!
−2 x −3( ) x −3( )−5=0−2 x2 −3x −3x +9( )−5=0−2 x2 −6x +9( )−5=0
!!−2x2 +12x −18−5=0
!!−2x2 +12x −23=0
!!a= !−2, b= !12, c = !%23
Multiply the result by a.
Combine with k to get the final result in standard form.
Identify the coefficients a, b and c.
Problem 21 MEDIA EXAMPLE – Quadratic Equations: Standard Form
Given the quadratic equation!!4 x !+ !1( )2 = !%2, write the equation in standard form and identify the coefficients a, b and c.
Problem 22 YOU TRY – Quadratic Equations: Standard Form
Given the quadratic equation !!−2 x !+ !3( )2 = !1 , write the equation in standard form and identify the coefficients a, b and c.
Lesson 6 – Quadratic Functions and Equations - MiniLesson
237
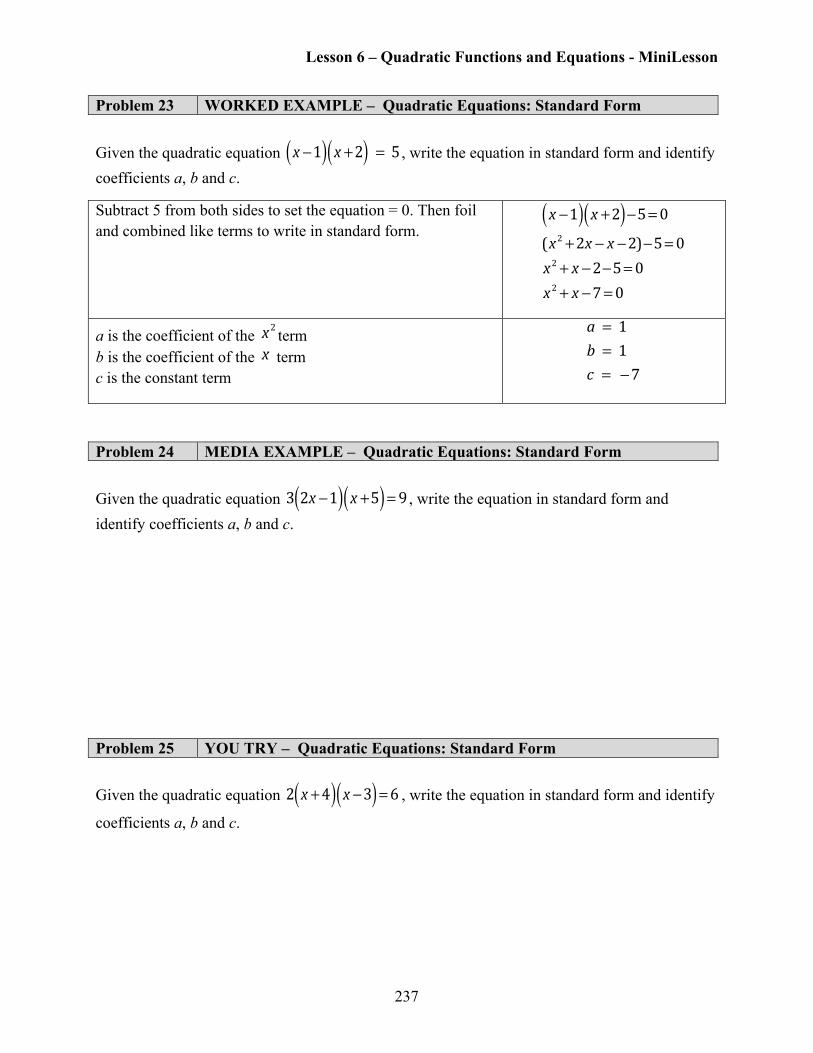
Problem 23 WORKED EXAMPLE – Quadratic Equations: Standard Form Given the quadratic equation !! x −1( ) x +2( ) ! = !5 , write the equation in standard form and identify coefficients a, b and c.
Subtract 5 from both sides to set the equation = 0. Then foil and combined like terms to write in standard form.
!!
x −1( ) x +2( )−5=0(x2 +2x − x −2)−5=0x2 + x −2−5=0x2 + x −7=0
a is the coefficient of the !!x2 term b is the coefficient of the !x term c is the constant term !!
a! = !1b! = !1c ! = !−7
Problem 24 MEDIA EXAMPLE – Quadratic Equations: Standard Form Given the quadratic equation !!3 2x −1( ) x +5( ) = 9 , write the equation in standard form and identify coefficients a, b and c.
Problem 25 YOU TRY – Quadratic Equations: Standard Form
Given the quadratic equation !!2 x +4( ) x −3( ) =6 , write the equation in standard form and identify
coefficients a, b and c.
Lesson 6 – Quadratic Functions and Equations - MiniLesson
238
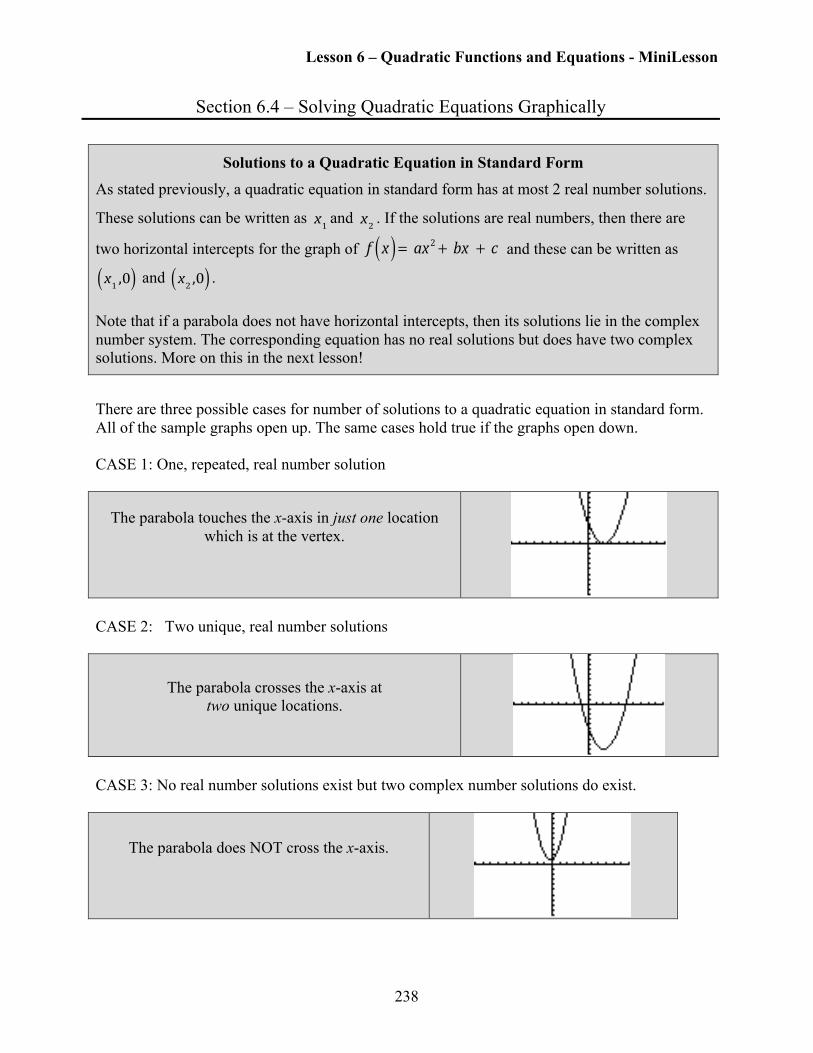
Section 6.4 – Solving Quadratic Equations Graphically
Solutions to a Quadratic Equation in Standard Form
As stated previously, a quadratic equation in standard form has at most 2 real number solutions.
These solutions can be written as !!x1 and !!x2 . If the solutions are real numbers, then there are
two horizontal intercepts for the graph of !!f x( ) = !ax2 + !bx !+ !c ! and these can be written as
!! x1 ,0( ) and !! x2 ,0( ) . Note that if a parabola does not have horizontal intercepts, then its solutions lie in the complex number system. The corresponding equation has no real solutions but does have two complex solutions. More on this in the next lesson! There are three possible cases for number of solutions to a quadratic equation in standard form. All of the sample graphs open up. The same cases hold true if the graphs open down. CASE 1: One, repeated, real number solution
The parabola touches the x-axis in just one location which is at the vertex.
CASE 2: Two unique, real number solutions
The parabola crosses the x-axis at two unique locations.
CASE 3: No real number solutions exist but two complex number solutions do exist.
The parabola does NOT cross the x-axis.
Lesson 6 – Quadratic Functions and Equations - MiniLesson
239
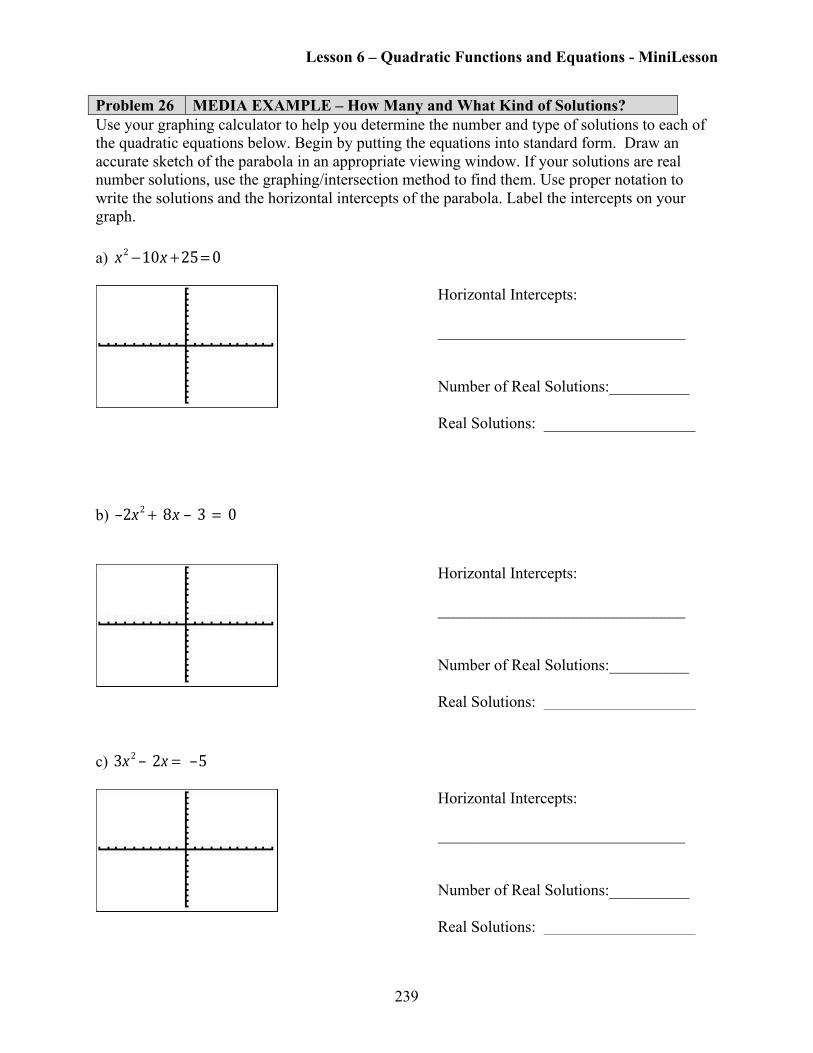
Problem 26 MEDIA EXAMPLE – How Many and What Kind of Solutions? Use your graphing calculator to help you determine the number and type of solutions to each of the quadratic equations below. Begin by putting the equations into standard form. Draw an accurate sketch of the parabola in an appropriate viewing window. If your solutions are real number solutions, use the graphing/intersection method to find them. Use proper notation to write the solutions and the horizontal intercepts of the parabola. Label the intercepts on your graph. a) !!x2 −10x +25=0
Horizontal Intercepts: _______________________________ Number of Real Solutions:__________
Real Solutions: ___________________
b) !!–2x
2 + !8x – !3! = !0
Horizontal Intercepts: _______________________________ Number of Real Solutions:__________
Real Solutions: ___________________ c) !!3x2 – !2x = ! –5
Horizontal Intercepts: _______________________________ Number of Real Solutions:__________
Real Solutions: ___________________
Lesson 6 – Quadratic Functions and Equations - MiniLesson
240
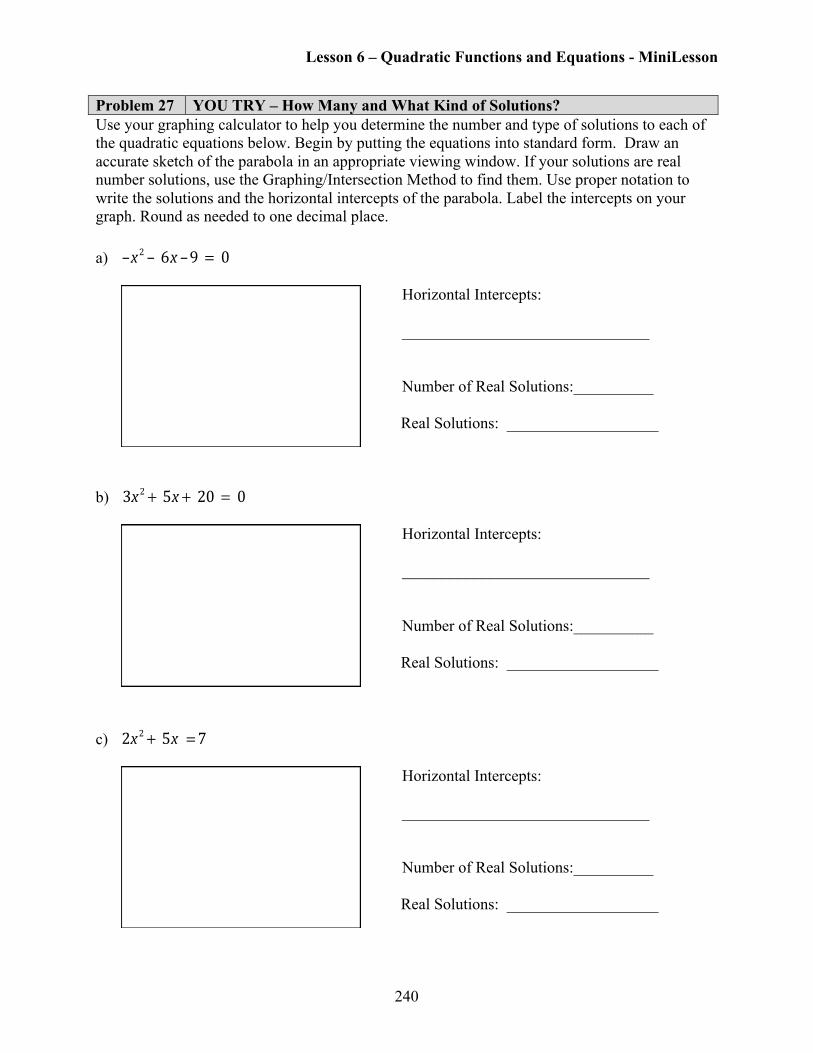
Problem 27 YOU TRY – How Many and What Kind of Solutions? Use your graphing calculator to help you determine the number and type of solutions to each of the quadratic equations below. Begin by putting the equations into standard form. Draw an accurate sketch of the parabola in an appropriate viewing window. If your solutions are real number solutions, use the Graphing/Intersection Method to find them. Use proper notation to write the solutions and the horizontal intercepts of the parabola. Label the intercepts on your graph. Round as needed to one decimal place. a) !!–x2 – !6x –9! = !0
Horizontal Intercepts: _______________________________ Number of Real Solutions:__________ Real Solutions: ___________________
b) !!3x2 + !5x + !20! = !0
Horizontal Intercepts: _______________________________ Number of Real Solutions:__________ Real Solutions: ___________________
c) !!2x2 + !5x ! =7
Horizontal Intercepts: _______________________________ Number of Real Solutions:__________ Real Solutions: ___________________
Lesson 6 – Quadratic Functions and Equations - MiniLesson
241
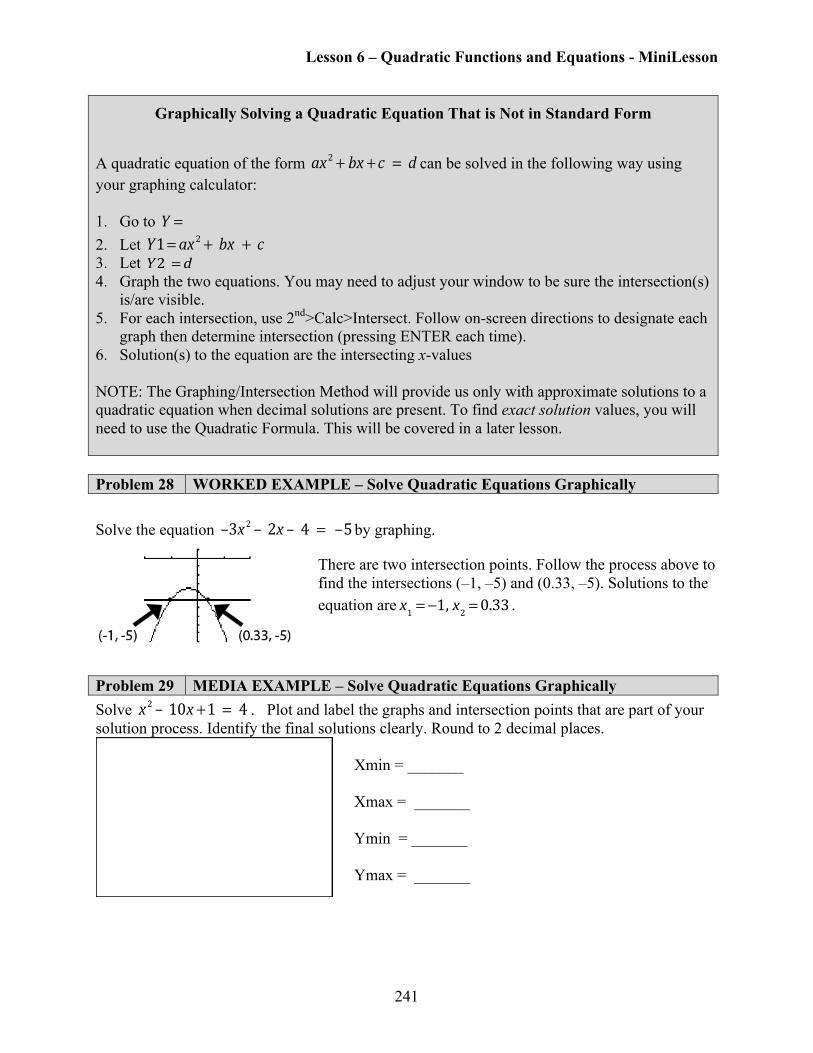
Graphically Solving a Quadratic Equation That is Not in Standard Form
A quadratic equation of the form !!ax
2 + bx + c ! = !d can be solved in the following way using your graphing calculator: 1. Go to !Y = 2. Let !!Y1= ax2 + !bx !+ !c 3. Let !!Y2! = d 4. Graph the two equations. You may need to adjust your window to be sure the intersection(s)
is/are visible. 5. For each intersection, use 2nd>Calc>Intersect. Follow on-screen directions to designate each
graph then determine intersection (pressing ENTER each time). 6. Solution(s) to the equation are the intersecting x-values NOTE: The Graphing/Intersection Method will provide us only with approximate solutions to a quadratic equation when decimal solutions are present. To find exact solution values, you will need to use the Quadratic Formula. This will be covered in a later lesson.
Problem 28 WORKED EXAMPLE – Solve Quadratic Equations Graphically Solve the equation !!–3x2 – !2x – !4! = ! –5by graphing.
There are two intersection points. Follow the process above to find the intersections (–1, –5) and (0.33, –5). Solutions to the equation are!!x1 = −1, x2 =0.33 .
Problem 29 MEDIA EXAMPLE – Solve Quadratic Equations Graphically Solve !!x2 – !10x +1! = !4 . Plot and label the graphs and intersection points that are part of your solution process. Identify the final solutions clearly. Round to 2 decimal places.
Xmin = _______ Xmax = _______ Ymin = _______ Ymax = _______
Lesson 6 – Quadratic Functions and Equations - MiniLesson
242
Problem 30 YOU TRY – Solve Quadratic Equations Graphically a) Solve !!2x2 – !5! = !6 . Plot and label the graphs and intersection points that are part of your
solution process. Round your answers to two decimal places. Identify the final solutions clearly.
Xmin = _______ Xmax = _______ Ymin = _______ Ymax = _______
b) Solve !!x2 + !9x – !18! = !32. Plot and label the graphs and intersection points that are part of
your solution process. Round your answers to two decimal places. Identify the final solutions clearly.
Xmin = _______ Xmax = _______ Ymin = _______ Ymax = _______
Lesson 6 – Quadratic Functions and Equations - MiniLesson
243
Section 6.5 – Solving Quadratic Inequalities by Graphing
In this section, we will see how a quadratic inequality written in standard form can be solved graphically. We will study an algebraic solution method in the next lesson. Quadratic inequalities are written just like quadratic equations except the “=” sign is replaced with an inequality symbol. See the forms below.
Quadratic Inequalities Quadratic inequalities can be written in one of the following standard forms:
!!ax2 +bx + c >0 !!ax2 +bx + c <0 !!ax2 +bx + c ≥0 !!ax2 +bx + c ≤0
The example below illustrates how to understand and approach these problems graphically.
Problem 31 MEDIA EXAMPLE – Solving Quadratic Inequalities Graphically
Solve the quadratic inequality, !!x2 + x − 2≥ 4 , using the Graphing/Intersection Method. Show a
sketch of your graph in the box below. Write your final result in interval and inequality notations.
Lesson 6 – Quadratic Functions and Equations - MiniLesson
244
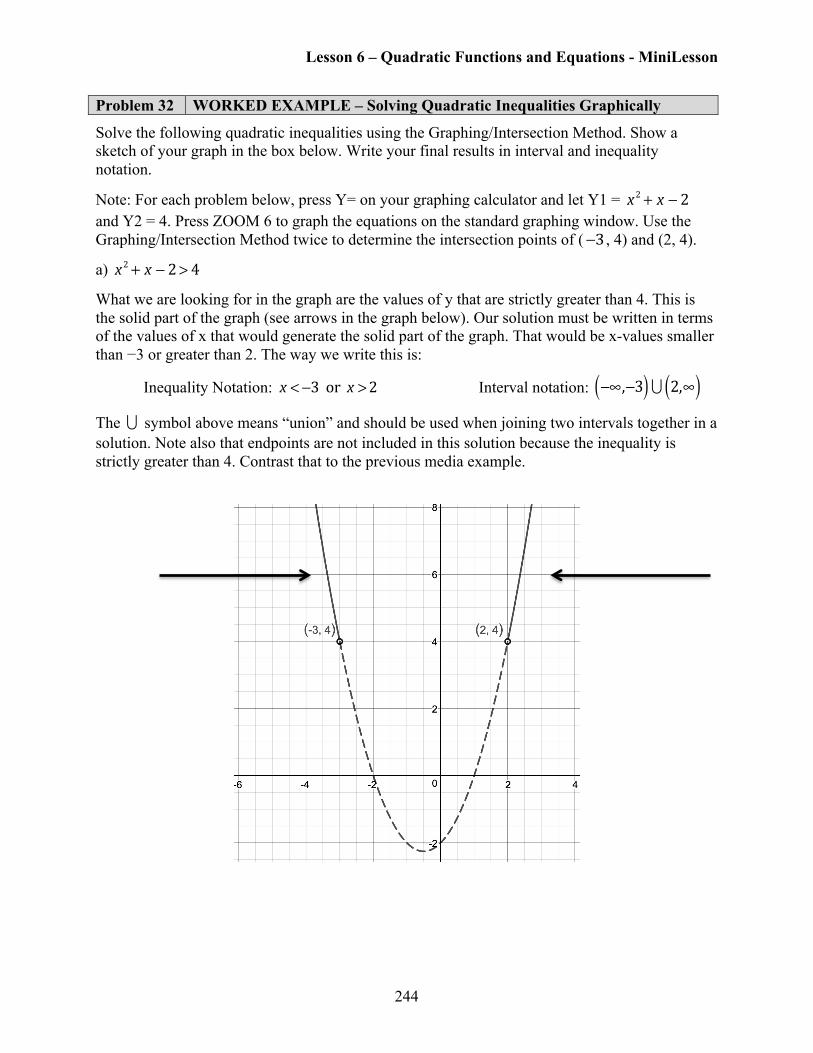
Problem 32 WORKED EXAMPLE – Solving Quadratic Inequalities Graphically
Solve the following quadratic inequalities using the Graphing/Intersection Method. Show a sketch of your graph in the box below. Write your final results in interval and inequality notation.
Note: For each problem below, press Y= on your graphing calculator and let Y1 = !!x2 + x − 2
and Y2 = 4. Press ZOOM 6 to graph the equations on the standard graphing window. Use the Graphing/Intersection Method twice to determine the intersection points of (!−3 , 4) and (2, 4).
a) !!x2 + x − 2> 4
What we are looking for in the graph are the values of y that are strictly greater than 4. This is the solid part of the graph (see arrows in the graph below). Our solution must be written in terms of the values of x that would generate the solid part of the graph. That would be x-values smaller than −3 or greater than 2. The way we write this is:
Inequality Notation: !!x < −3!!or!!x >2 Interval notation: ! −∞,−3( )∪ 2,∞( )
The ∪ symbol above means “union” and should be used when joining two intervals together in a solution. Note also that endpoints are not included in this solution because the inequality is strictly greater than 4. Contrast that to the previous media example.
Lesson 6 – Quadratic Functions and Equations - MiniLesson
245
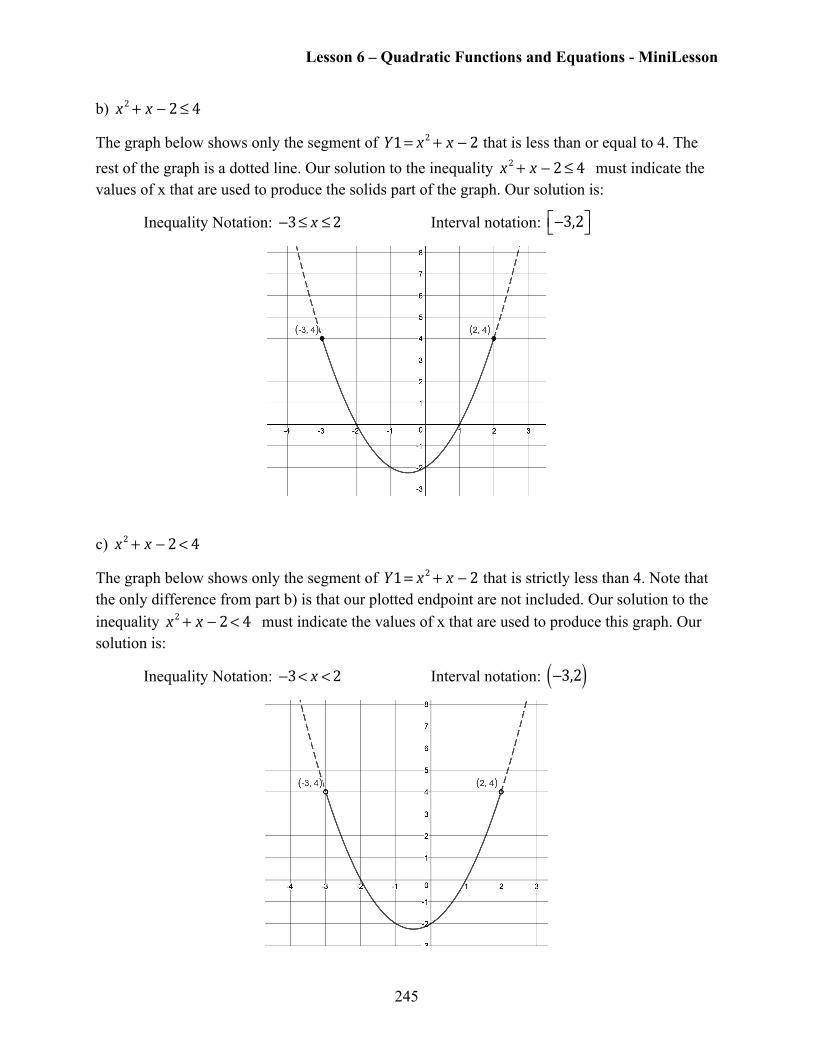
b) !!x2 + x − 2≤ 4
The graph below shows only the segment of !!Y1= x2 + x − 2 that is less than or equal to 4. The
rest of the graph is a dotted line. Our solution to the inequality !!x2 + x − 2≤ 4 must indicate the
values of x that are used to produce the solids part of the graph. Our solution is:
Inequality Notation: !!−3≤ x ≤2 Interval notation: ! −3,2⎡⎣ ⎤⎦
c) !!x2 + x − 2< 4
The graph below shows only the segment of !!Y1= x2 + x − 2 that is strictly less than 4. Note that
the only difference from part b) is that our plotted endpoint are not included. Our solution to the inequality !!x
2 + x − 2< 4 must indicate the values of x that are used to produce this graph. Our solution is:
Inequality Notation: !!−3< x <2 Interval notation: ! −3,2( )
Lesson 6 – Quadratic Functions and Equations - MiniLesson
246
Problem 33 YOU TRY – Solving Quadratic Inequalities Graphically
Solve the following quadratic inequalities using the graphing/intersection method. Show your graph in the blank space below and provide your solutions in both inequality and interval notation. This problem is similar to problem 34 so you should be able to make one graph that will help you solve all of the inequalities. Hint: You may want to let your Ymax = 20 on your calculator window for the graph.
a) !!x2 − 4 ≥12 b) !!x
2 − 4 >12 c) !!x2 − 4 ≤12 d) !!x
2 − 4 <12
Lesson 6 – Quadratic Functions and Equations - MiniLesson
247
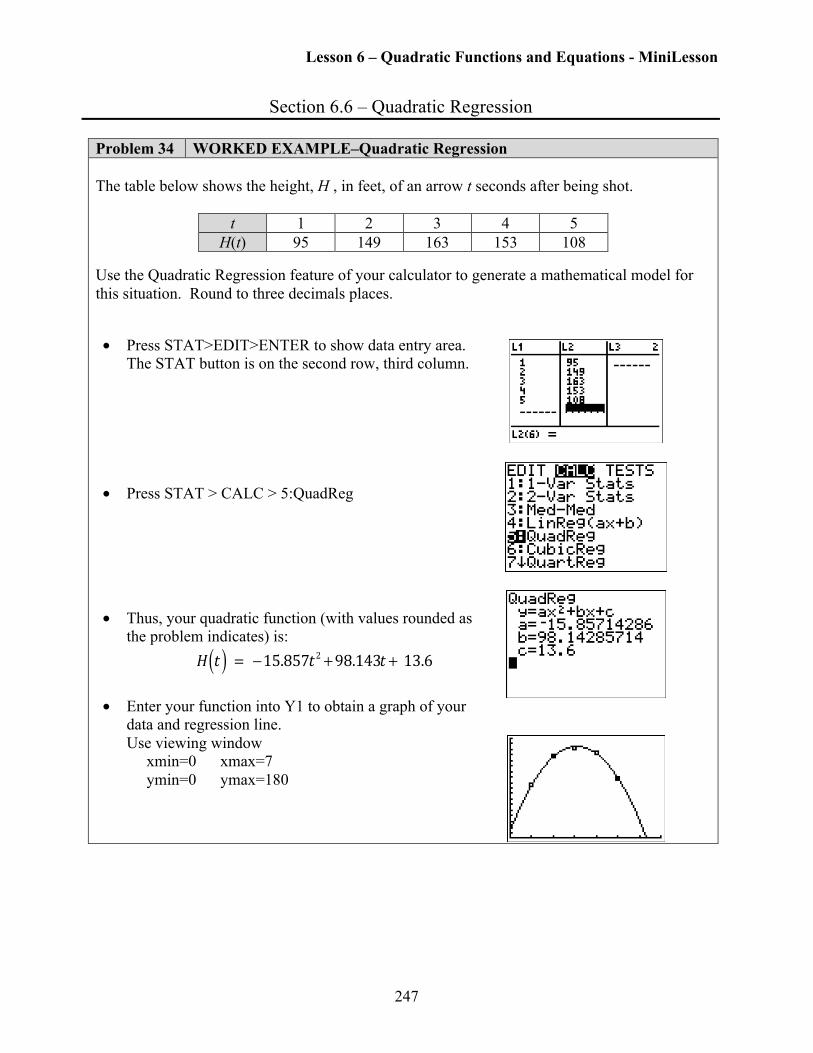
Section 6.6 – Quadratic Regression Problem 34 WORKED EXAMPLE–Quadratic Regression The table below shows the height, H , in feet, of an arrow t seconds after being shot.
t 1 2 3 4 5 H(t) 95 149 163 153 108
Use the Quadratic Regression feature of your calculator to generate a mathematical model for this situation. Round to three decimals places.
• Press STAT>EDIT>ENTER to show data entry area.
The STAT button is on the second row, third column.
• Press STAT > CALC > 5:QuadReg
• Thus, your quadratic function (with values rounded as the problem indicates) is: !!H t( ) ! = !−15.857t2 +98.143t + !13.6
• Enter your function into Y1 to obtain a graph of your data and regression line. Use viewing window xmin=0 xmax=7 ymin=0 ymax=180
Lesson 6 – Quadratic Functions and Equations - MiniLesson
248
Problem 35 MEDIA EXAMPLE – Quadratic Regression The table below shows the height, H, in feet, of a golf ball t seconds after being hit.
t 1 2 3 4 5 H(t) 81 131 148 130 87
a) Use the Quadratic Regression feature of your calculator to generate a mathematical model for this situation. Use function notation with appropriate variables. Round coefficients to two decimal places. b) Use your model to predict the height of the golf ball at 5 seconds. Round your answer to two decimal places. How does this compare to the value in the data table? c) Use your model to determine the maximum height of the golf ball. Round your answer to two decimal places. d) Use your model to determine how long it will take the golf ball to hit the ground. Round your answer to two decimal places. e) Use your model to determine the practical domain and practical range for this situation.
Practical Domain
___________________________________
Practical Range
_____________________________________
Lesson 6 – Quadratic Functions and Equations - MiniLesson
249
Problem 36 YOU TRY – Quadratic Regression The annual unemployment percentage rate data for the Phoenix-Mesa-Scottsdale area from 2008 to 2014 are shown in the table below (Source: https://www.bls.gov/data/)
Year 2008 2009 2010 2011 2012 2013 2014 Unemployment
Rate 5.5 9.3 9.6 8.6 7.4 6.7 5.9
a) Use the quadratic regression feature of your calculator to write a function, U(t), that represents the given data with t in years since 2008. Use function notation and appropriate variables. Round coefficients to two decimal places. b) Use your graphing calculator to generate a scatterplot of the data and regression line on the same screen. You must use an appropriate viewing window. In the space below, draw what you see on your calculator screen, and write down the viewing window you used.
Xmin = ____________ Xmax = ____________ Ymin = ____________ Ymax = ___________
c) Using your function from part a), identify the vertical intercept of U(t). Write it as an ordered pair and interpret its meaning in a complete sentence. Round answers to two decimals.
d) Identify the vertex of the function found in part a) and interpret its meaning in a complete sentence. Round answers to two decimals.