KOMATI CATCHMENT ECOLOGICAL WATER REQUIREMENTS STUDY …. RDM-0604 - Komati - EWR Quantity... ·...
458
KOMATI CATCHMENT ECOLOGICAL WATER REQUIREMENTS STUDY Prepared by: AfriDev Consultants PO Box 4349 White River, 1240 Tel & Fax: (013) 751 1533 RDMX100-01-CON-COMPR2-0604 December 2005 EWR REPORT: QUANTITY APPENDICES
-
Upload
nguyenkhue -
Category
Documents
-
view
219 -
download
0
Transcript of KOMATI CATCHMENT ECOLOGICAL WATER REQUIREMENTS STUDY …. RDM-0604 - Komati - EWR Quantity... ·...
KOMATI CATCHMENT ECOLOGICAL WATER
REQUIREMENTS STUDY
Prepared by:
AfriDev ConsultantsPO Box 4349White River, 1240Tel & Fax: (013) 751 1533
RDMX100-01-CON-COMPR2-0604
December 2005
EWR REPORT: QUANTITY
APPENDICES

APPENDICES
TABLE OF CONTENTS
APPENDIX A: HYDRAULICS AND HABITAT MODELLING APPENDIX B: GEOMORPHOLOGY APPENDIX C: RIPARIAN VEGETATION APPENDIX D: AQUATIC INVERTEBRATES APPENDIX E: FISH APPENDIX F: ECOSTATUS TABLES APPENDIX G: ECOLOGICAL IMPORTANCE AND SENSITIVITY TABLES APPENDIX H: SOCIO-CULTURAL IMPORTANCE APPENDIX I: FLOW STRESS INDICES FOR REC AND ALTERNATIVES APPENDIX J: FLOOD MOTIVATIONS APPENDIX K: DETAILED EWR RESULTS PRESENTED AS EWR TABLES

AfriDev Consultants Pty Ltd 2005
DWAF Report No. RDM X100-01-CON-COMPR2-0604 Komati Catchment Ecological Water Requirements Study – Quantity Report
Page A - 1
Appendix A
River Hydraulics
AL Birkhead
Streamflow Solutions CC 57A Jarvis Road, Berea, East London
CONTENTS
ACKNOWLEDGEMENTS ........................................................................................................1 LIST OF TABLES.....................................................................................................................2 LIST OF FIGURES...................................................................................................................3 ABBREVIATIONS AND ACRONYMS......................................................................................4 1 INTRODUCTION .................................................................................................................5
1.1 Methodology...............................................................................................................5 2 DATA COLLECTION .........................................................................................................13 3 MODELLING......................................................................................................................16 4 RESULTS ..........................................................................................................................20
4.1 Cross-sectional profiles ............................................................................................20 4.2 Rating Data And Functions ......................................................................................25 4.3 Tabulated modelled hydraulic data ..........................................................................29 4.4 Habitat type abundance and velocity distribution analyses ......................................60
5 THREE-DIMENSIONAL SPATIAL MODELLING...............................................................65 5.1 EWR Site K1 on the Komati River ............................................................................66 5.2 EWR Site K2 on the Komati River ............................................................................66 5.3 EWR Site L1 on the Lomati River.............................................................................66
CONFIDENCE IN THE HYDRAULIC CHARCATERISATIONS.............................................70 6 REFERENCES ..................................................................................................................71 ACKNOWLEDGEMENTS The rating data for this study were collected by AfriDev Consultants (Pty) Ltd, following the site selection and initial surveys by Streamflow Solutions CC in August 2003. Delana Louw (IWR Source to Sea), Toriso Tlou (Tlou and Mallory) and Adhishri Singh (RDM Directorate, Department of Water Affaits and Forestry (DWAF)) also assisted with data collection during a field trip in May 2004. The topographic surveys for the Digital Terrain Models (DTM’s) were carried out by the Geomatics Directorate of the DWAF.

AfriDev Consultants Pty Ltd 2005
DWAF Report No. RDM X100-01-CON-COMPR2-0604 Komati Catchment Ecological Water Requirements Study – Quantity Report
Page A - 2
LIST OF TABLES Table 1 Abundance scorings of habitat types for fish. ........................................................7 Table 2 Example of modelled habitat-type frequency distributions for a riffle...................11 Table 3 Rated habitat-type abundances using the relative scale in Table 1.....................11 Table 4 Modelled habitat-type abundances......................................................................12 Table 5 Probability velocity class predictions ...................................................................12 Table 6 Coordinates of fixed survey stations at EWR sites on the Komati and
Lomati Rivers, Gladdespruit and Teespruit. ........................................................13 Table 7 Hydraulic data collected for the Komati EWR study. ...........................................14 Table 8 Surveyed water surface slopes and calibrated resistance coefficients................17 Table 9 Hydraulic data used to extend the measured rating data. ...................................18 Table 10 Regression coefficients in equation 1 ..................................................................19 Table 11 Tabulated hydraulic data for EWR Site K1 (riffle) ................................................29 Table 12 Tabulated hydraulic data for EWR Site K2 (rapid) ...............................................32 Table 13 Tabulated hydraulic data for EWR Site M1A (upstream of rapid) ........................35 Table 14 Tabulated hydraulic data for EWR Site M1B (riffle). ............................................40 Table 15 Tabulated hydraulic data for EWR Site K3 (run)..................................................44 Table 16 Tabulated hydraulic data for EWR Site L1 (rapid) ...............................................50 Table 17 Tabulated hydraulic data for EWR Site G1A (riffle) .............................................53 Table 18 Tabulated hydraulic data for EWR Site G1B (run) ...............................................55 Table 19 Tabulated hydraulic data for EWR Site T1 (riffle) ................................................57 Table 20 Ratings of habitat type abundance for EWR Site K1 ...........................................60 Table 21 Velocity distributions for EWR Site K1 (riffle).......................................................60 Table 22 Ratings of habitat type abundance for EWR Site K2 ...........................................60 Table 23 Velocity distributions for EWR Site K2 (rapid) .....................................................62 Table 24 Ratings of habitat type abundance for EWR Site M1 ..........................................62 Table 25 Velocity distributions for EWR Site M1 ................................................................62 Table 26 Ratings of habitat type abundance for EWR Site K3 ...........................................62 Table 27 Velocity distributions for EWR Site K3 (sand bed run) ........................................63 Table 28 Ratings of habitat type abundance for EWR Site L1 ...........................................63 Table 29 Velocity distributions for EWR Site L1 (rapid) ......................................................63 Table 30 Ratings of habitat type abundance for EWR Site G1...........................................64 Table 31 Velocity distributions for EWR Site G1 (riffle) ......................................................64 Table 32 Ratings of habitat type abundance for EWR Site T1 ...........................................64 Table 33 Velocity distributions for EWR Site T1 (riffle) .......................................................64 Table 34 Confidence in the hydraulic characterisations .....................................................70

AfriDev Consultants Pty Ltd 2005
DWAF Report No. RDM X100-01-CON-COMPR2-0604 Komati Catchment Ecological Water Requirements Study – Quantity Report
Page A - 3
LIST OF FIGURES Figure 1 Kleynhans (1999) hydraulic habitat descriptions for fish (SS=slow and
shallow, SD=slow and deep, FS= fast and shallow, FD=fast and deep). The velocity and depth axes are truncated for plotting purposes at 0.8 and 1.0, respectively.....................................................................................................6
Figure 2 Cross-sectional profile for EWR Site K1 (riffle) on the Komati River. ..................20 Figure 3 Cross-sectional profile for EWR Site K2 (rapid) on the Komati River. .................20 Figure 4 Cross-sectional profile for EWR Site M1A (upstream of rapid) on the Komati
River (Swaziland).................................................................................................21 Figure 5 Cross-sectional profile for EWR Site M1B (riffle) on the Komati River
(Swaziland). .........................................................................................................21 Figure 6 Cross-sectional profile for EWR Site K3 (run) on the Komati River. ....................22 Figure 7 Cross-sectional profile for EWR Site L1 (rapid) on the Lomati River. ..................22 Figure 8 Cross-sectional profile for EWR Site G1A (rapid) on the Gladdespruit. The
profile was re-surveyed (as indicated in red) on 12/11/2003 after a high flow that resulted in changes to the river bed..............................................................23
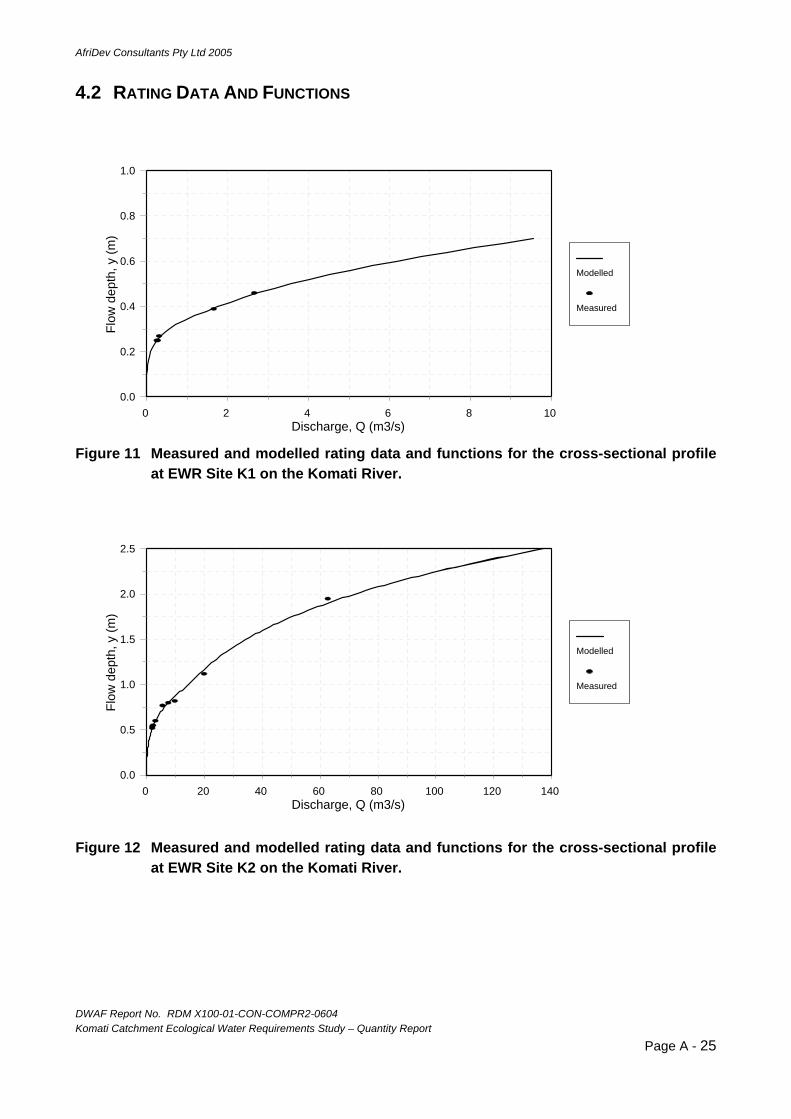
Figure 9 Cross-sectional profile for EWR Site G1B(run) on the Gladdespruit. ..................23 Figure 10 Cross-sectional profile for EWR T1 (riffle) on the Teespruit. ...............................24 Figure 11 Measured and modelled rating data and functions for the cross-sectional
profile at EWR Site K1 on the Komati River. .......................................................25 Figure 12 Measured and modelled rating data and functions for the cross-sectional
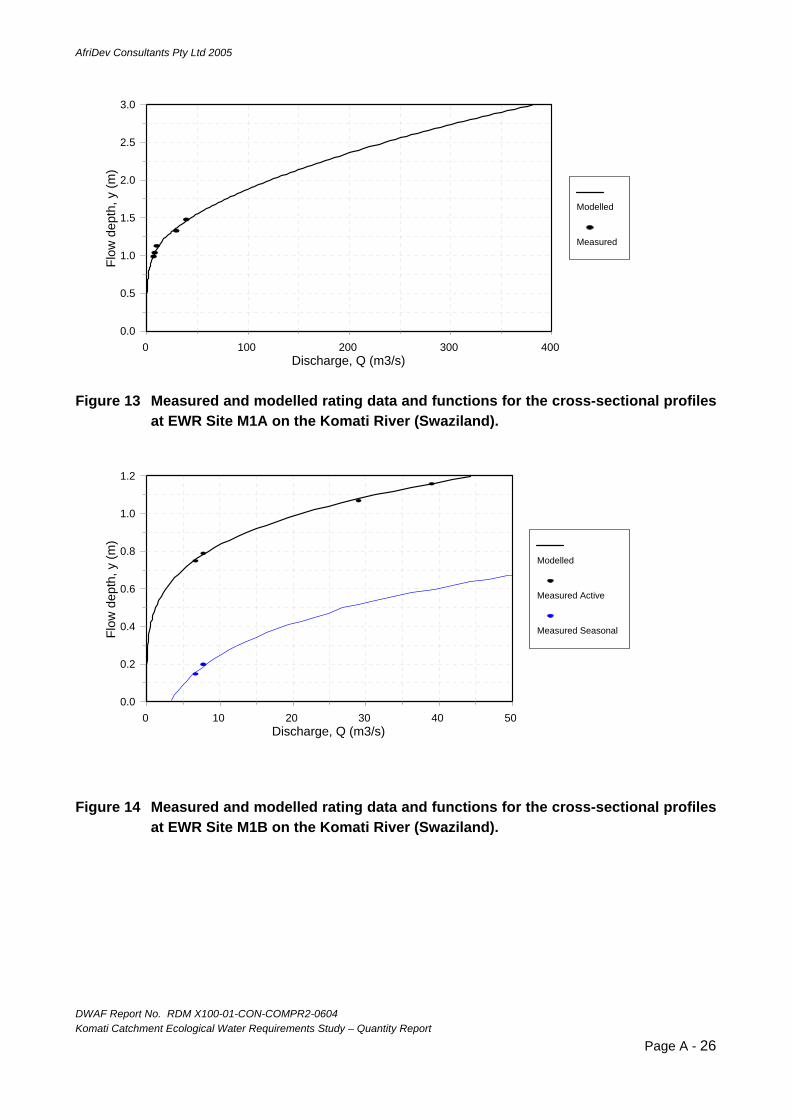
profile at EWR Site K2 on the Komati River. .......................................................25 Figure 13 Measured and modelled rating data and functions for the cross-sectional
profiles at EWR Site M1A on the Komati River (Swaziland). ...............................26 Figure 14 Measured and modelled rating data and functions for the cross-sectional
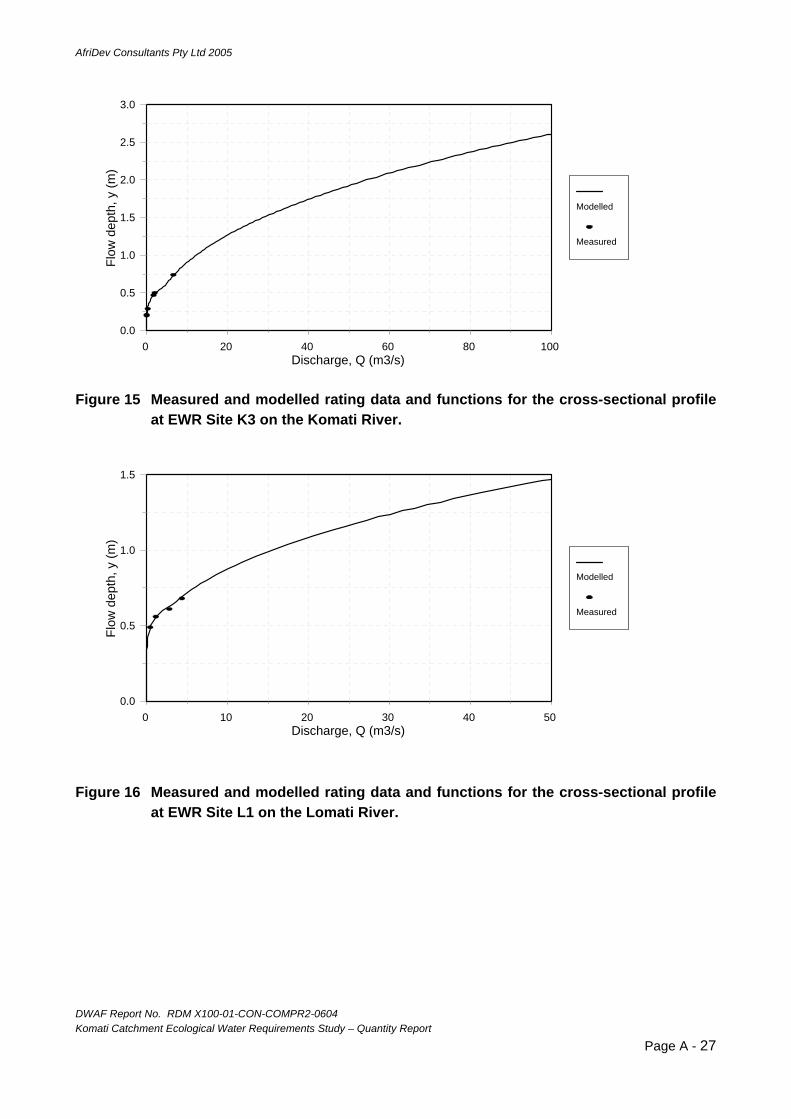
profiles at EWR Site M1B on the Komati River (Swaziland). ...............................26 Figure 15 Measured and modelled rating data and functions for the cross-sectional
profile at EWR Site K3 on the Komati River. .......................................................27 Figure 16 Measured and modelled rating data and functions for the cross-sectional
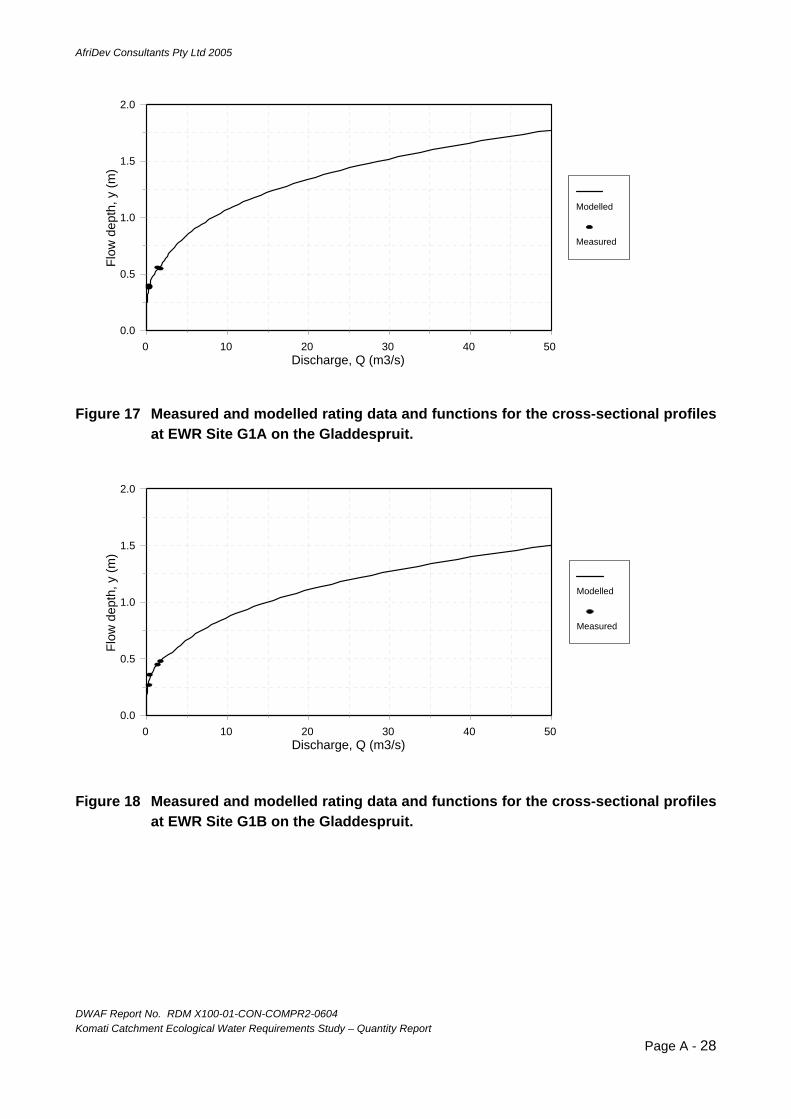
profile at EWR Site L1 on the Lomati River. ........................................................27 Figure 17 Measured and modelled rating data and functions for the cross-sectional
profiles at EWR Site G1A on the Gladdespruit. ...................................................28 Figure 18 Measured and modelled rating data and functions for the cross-sectional
profiles at EWR Site G1B on the Gladdespruit. ...................................................28 Figure 19 Measured and modelled rating data and functions for the cross-sectional
profile at EWR Site T1 on the Teespruit. .............................................................29 Figure 20 Example of the graphical output from the 3D spatial modelling for EWR Site
K1 on the Komati River. .......................................................................................67 Figure 21 Example of the graphical output from the 3D spatial modelling for EWR Site
K2 on the Komati River. .......................................................................................68 Figure 22 Example of the graphical output from the 3D spatial modelling for EWR Site
L1 on the Komati River. .......................................................................................69
AfriDev Consultants Pty Ltd 2005
DWAF Report No. RDM X100-01-CON-COMPR2-0604 Komati Catchment Ecological Water Requirements Study – Quantity Report
Page A - 4
ABBREVIATIONS AND ACRONYMS DRIFT Downstream Response to Imposed Flow Transformation DTM Digital Terrain Model DWAF Department of Water Affairs and Forestry Eamsl Elevation above mean sea level EC Ecological Category EWR Ecological Water Requirement FS-R Flow Stressor-Response H-FS-R Habitat-Flow Stressor-Response PES Present Ecological State RDM Resource Directed Measures 3D Spatial Three-dimensional Spatial model

AfriDev Consultants Pty Ltd 2005
DWAF Report No. RDM X100-01-CON-COMPR2-0604 Komati Catchment Ecological Water Requirements Study – Quantity Report
Page A - 5
1 INTRODUCTION The role of hydraulics and procedure for generating hydraulic information for ecological Reserve studies have been documented for the Comprehensive and Intermediate levels of Reserve determination (DWAF, 1999), with subsequent periodic updates (Birkhead 2002 and Jordanova et al. 2004). A brief explanation of more recent developments in the analysis and use of hydraulic information is presented first in Section 1.1. 1.1 METHODOLOGY The application of holistic methods for ecological flow determination (refer to Tharme 1996) requires water requirements to be expressed as discharge rates (including its temporal characteristics) through assessments of the presence of suitable habitat for certain biota at different flows. The interface between the way in which flow requirements are assessed and expressed is through the results of hydraulic measurements, analyses and modelling of sites along rivers. The primary product of these hydraulic analyses are relationships between discharge and the following determinants, which have been found over the course of numerous flow assessments, to be the most useful: depth (maximum and average), velocity (average), wetted perimeter, and width of the water surface. The discharge-depth (or rating) relationship is fundamental to hydraulic analysis and is generally derived from a combination of measured and synthesized data. (Refer to Rowlston et al. (2000) and Birkhead (2002) for descriptions of procedures for deriving hydraulic information for use in ecological flow requirements (or Reserves) in South Africa.) Once the rating relationship for a river section has been developed, the relationships between discharge and the other hydraulic parameters (listed above) may readily be computed using the cross-sectional geometry, and are generally provided in tabular format using look-up tables (see Section 4.3). The cross-sectional profile plots and look-up tables comprise the “standard hydraulic data” used in Reserve determinations in South Africa at the Rapid III, Intermediate and Comprehensive levels. Ecologists use these standard hydraulic data with the aid of site assessments, photographs and video exposure, to determine the quantity and quality of hydraulic habitat at different flows. Substantial experience and interpretation are required to provide assessments of site-based and reach-based biological habitats using cross-sectional surveys and the results of one-dimensional hydraulic analyses (biological habitat refers to the integration of the different components defining habitat (eg. hydraulic, substrate and cover attributes for fish)). For this reason, a procedure has been developed for using standard hydraulic information as the basis for quantifying hydraulic habitat for fish (refer to Jordanova et al (2004) for a detailed explanation of the method). The method allows the assessment of abundance of different habitat types to be applied more consistently in Reserve determinations. Procedure for assessing the habitat flow response of fish The procedure applies the concept of hydraulic habitat types (or classes) in the determination of ecological flows for fish using the FS-R methodology. It differs from the original FS-R method (O’Keeffe et al, 2002; O’Keeffe and Hughes, 2004) in that the hydraulic

AfriDev Consultants Pty Ltd 2005
DWAF Report No. RDM X100-01-CON-COMPR2-0604 Komati Catchment Ecological Water Requirements Study – Quantity Report
Page A - 6
habitat is interpreted in terms of biological habitat requirements (eg. fish), and should preferably be referred to the Habitat-Flow Stressor-Response (H-FS-R) method. It is a working method, and will benefit from future development and refinement by applied research and during the course of future ecological Reserve assessments. There has been a need to further develop the role of hydraulics in flow assessments for fish, which applies an integrated assessment of hydraulic habitat through the use of different habitat types. These types have been defined using two basic hydraulic parameters, depth (D) and depth-averaged velocity (V), as suggested by Kleynhans (1999). Water surface width or perimeter is also incorporated as a scaling factor. Together with substrate and vegetation cover information, these parameters are sufficient to broadly describe fish habitat. Further, Kleynhans suggests that velocity and depth need only be specified coarsely, and has proposed the following four velocity-depth classes (hydraulic habitat types), as adapted from Oswood and Barber (1982): • Slow (<0.3 m/s) and shallow (<0.5 m): This includes shallow pools and backwaters. • Slow (<0.3 m/s) and deep (>0.5m): This includes deep pools and backwaters. • Fast (>0.3 m/s) and shallow (<0.3 m): Shallow runs, rapids and riffles fall in this class • Fast (>0.3 m/s) and deep (>0.3 m): Deep runs, rapids and riffles fall under this class. A graphical representation of the velocity-depth domain and its division into four classes is provided in Figure 1.
Figure 1 Kleynhans (1999) hydraulic habitat descriptions for fish (SS=slow and
shallow, SD=slow and deep, FS= fast and shallow, FD=fast and deep). The velocity and depth axes are truncated for plotting purposes at 0.8 and 1.0, respectively.

AfriDev Consultants Pty Ltd 2005
DWAF Report No. RDM X100-01-CON-COMPR2-0604 Komati Catchment Ecological Water Requirements Study – Quantity Report
Page A - 7
Although the procedure (described below) has been developed within the context of the H-FS-R ecological flow assessment methodology, it is applicable for use in other holistic flow determination methods (eg. DRIFT – Downstream Response to Imposed Flow Transformation) that require a quantitative assessment of habitat suitability and abundance at different flows. The method involves the follow three steps: 1 Rating observed habitat- type abundance The first step in the method is the site scoring of the four habitat types defined for fish, taking cognisance of the substrate, cover and water column features provided at the site. The presence of these hydraulic habitat types is quantified using a relative abundance scale with associated proportional percentage occurrence, an example of which is given in Table 1. Table 1 Abundance scorings of habitat types for fish.
Descriptor Score Occurrence (%) None 0 0Rare 1 0-10Sparse 2 10-30Moderate 3 30-60Abundant 4 60-80Very abundant 5 80-100
The on-site assessment is best undertaken jointly by the hydraulician and fish ecologist, since it provides an opportunity for the specialists to develop an appreciation and understanding of relevant influences from the related disciplines. Secondly, the hydraulician is required to collect hydraulic data during the course of flow assessment studies, and it would be valuable to provide habitat type abundance scorings for each of these (since they are associated with a measured discharge rate). Although this assessment is subjective, it provides valuable information to compliment the abundance scorings of hydraulic habitat type from more quantitative hydraulic modelling. 2 Modelling hydraulic habitat information Riverine biota including fish, macroinvertebrates and vegetation display strong preferences for certain values of water depth, velocity, and bed shear stress, or combinations of these hydraulic variables (Lamouroux 1998). Hydraulic descriptions used by ecologists differ from traditional hydraulic applications: river biota responds to sets of point hydraulic variables, whereas traditional hydraulic engineering has been concerned with larger spatial scales (eg. flood analyses). Modelling point hydraulic variables in river reaches at low-flows with large resistance elements using high resolution multi-dimensional hydraulic modelling is imprecise and requires accurate topographical information (Lamouroux 1998). An alternative method for providing this information is by modelling characteristic spatial-probability distributions of

AfriDev Consultants Pty Ltd 2005
DWAF Report No. RDM X100-01-CON-COMPR2-0604 Komati Catchment Ecological Water Requirements Study – Quantity Report
Page A - 8
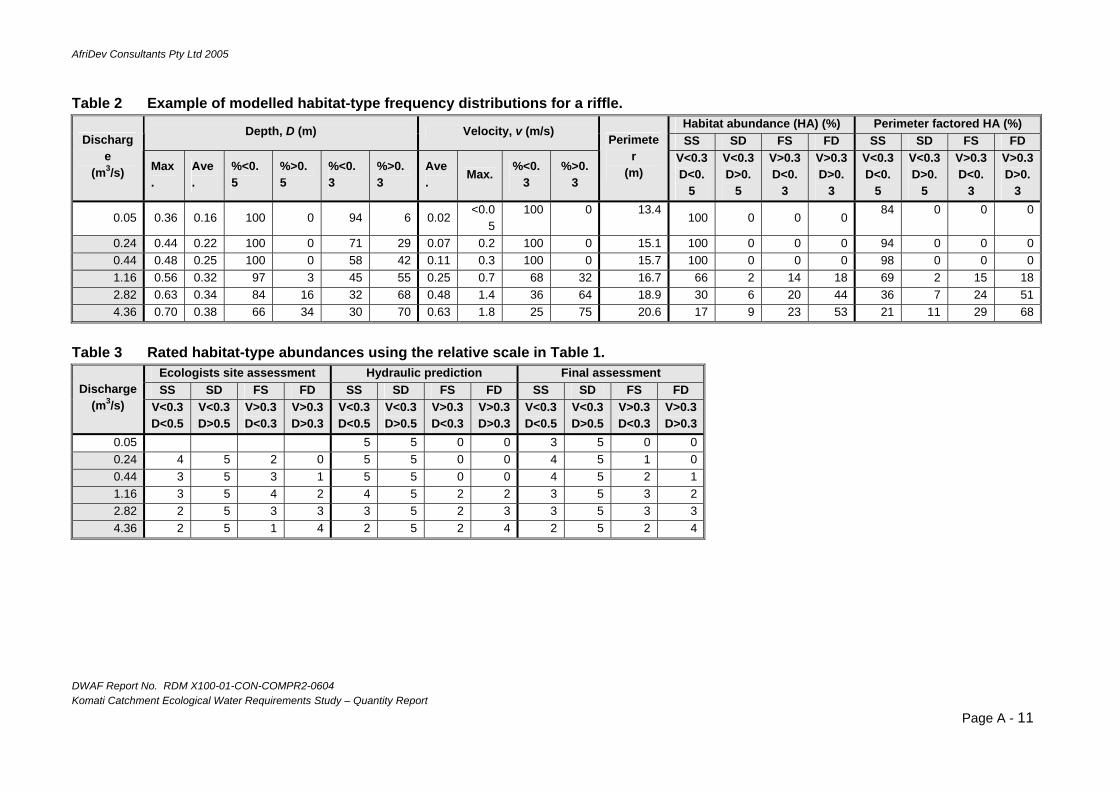
hydraulic parameters to describe typical variability in hydraulic habitats. The standard hydraulic information synthesized for a cross-section is used to represent average values for the morphological feature (eg. rapid, riffle, pool, etc.), and can therefore be used to estimate typical depth and velocity distributions. Methods for predicting distributions of the two ecologically relevant hydraulic parameters of depth and velocity are described in the following sections: Predicting frequency-depth distributions The frequency-occurrence of flow depth may be computed using surveyed cross-sectional profiles and associated rating function to provide measurement-based data. For a specified maximum depth (and related discharge), the actual depths along a cross-section are computed at equal distance increments. This is preferable to using actual surveyed ordinates across the river bed, since these are usually measured at changes in slope and with a higher density of bed elevations in the low-flow channel (ie. not valid data for a statistical analysis). The range of depths (zero to maximum) along cross-sections are divided into equal depth class increments, and the frequency of occurrence of depths less than and greater than the threshold values (ie. 0.3m and 0.5m used to distinguish between shallow and deep habitat for fast and slow velocities, respectively). If a three-dimensional spatial model has been set-up, frequency distributions of depth may be more accurately determined by calculating the proportion of inundated area that is shallow or deep (refer to Section 5). Predicting probability-velocity distributions Of the available velocity distribution models in the literature, the model of Lamouroux et al. (1995) appears to be the most robust and tested (Jordanova et al. 2004). A drawback, however, is that the model has been developed for pool-riffle sequences and not homogeneous geomorphological features. The velocity distribution model of Lamouroux et al (1995) requires estimates of average depth, average velocity and dominant bed roughness. The first two parameters are available from the standard hydraulic (cross-sectional) information. The dominant bed roughness is defined as the roughness element occupying the largest fraction of the bed, which may be determined from a visual assessment of the bed, or preferably from measured sediment size distributions (the size occupying the largest fraction of the bed is computed from the product of the projected sediment area and its frequency of occurrence). 3 Predicting habitat-type abundance as a function of discharge An example of predicted frequency-depth and probability-velocity distributions for a riffle are given in Table 2. The maximum and average depth, average velocity, and perimeter are obtained from the standard hydraulic analysis. The analysis is undertaken for a range of discharges (in the low-flow range), including measured values for which site assessments and/or photographs exist (indicated by the shaded rows in Table 2). Experience with

AfriDev Consultants Pty Ltd 2005
DWAF Report No. RDM X100-01-CON-COMPR2-0604 Komati Catchment Ecological Water Requirements Study – Quantity Report
Page A - 9
measuring velocities in riffle and rapid morphologies has indicated that the maximum value is generally 2 to 3 times the average, and this information has been used by ecologists during previous flow assessments. The velocity distribution model of Lamouroux et al (1995) supports this field-based experience, with maximum estimates approximately three times the average (refer to Table 2), and approximately 10% of the velocities are greater than twice the average value. Using depth and velocity distributions (Table 2), the probability of occurrence for each habitat-type category (expressed as a percentage) may be assessed by assuming that depth and velocity are mutually exclusive parameters. Based on this assumption, the overall abundance of a habitat type is calculated by the product of the individual frequencies or probabilities. At low flows, the hydraulic habitat may be dominated by a particular habitat type (generally slow/shallow for riffles, eg. in Table 2), but the corresponding river size may represent only a small proportion of the active channel size. To account for river scale, the habitat-type probabilities are proportioned using the relative perimeter, which is defined as the ratio of the perimeter to the value where the active channel bed becomes inundated. The active channel perimeter may be determined by an inflection on the perimeter-discharge plot. The abundance of hydraulic habitat type is converted from probability of occurrence to relative numeric values (or scores) in the range 0 to 5 using a scoring system such as that given in Table 1. Table 3 provides an example of site abundance assessments for measured discharges as well as predictions based on the hydraulic modelling described above. It is necessary to reconcile the observed site assessments with values determined from modelling to provide a final assessment. Reasons for differences include the subjectivity inherent with site observations, the use of cross-sectional specific data to represent characteristic hydraulic habitat, and the use of a reach-based velocity distribution model. Agreement in the abundance scorings derived from the hydraulic predictions and site evaluations needs to take cognisance of the above considerations. Measured flows are generally accompanied by site photographs, which provide additional visual information to verify the modelled predictions as well as the extent and suitability of cover. Hydraulic modelling forms the basis for interpolating between assessments based on observation as well as extending the discharge range. The assessments should consider the range of morphologies and hydraulic conditions (ie. both rapid/riffle and pool) to ensure that the habitat-types present are covered by the analysis. The abundances may also be expressed in terms of the amount of channel perimeter contributed by each of the habitat-type classes (e.g., Table 4). This has been used in the DRIFT (Downstream Response to Imposed Flow Transformation) flow determination method to present hydraulic information. In the H-FS-R method, a simplified habitat suitability index for a particular “target” species or group of species is used to represent the habitat stress response index (refer to Jordanova et al, 2004). The suitability of the habitat (velocity-depth class, substrate and cover) under

AfriDev Consultants Pty Ltd 2005
DWAF Report No. RDM X100-01-CON-COMPR2-0604 Komati Catchment Ecological Water Requirements Study – Quantity Report
Page A - 10
known (observed) and modelled flow conditions is scored for each of the following components: breeding, survival and abundance, cover, health, and water quality.
AfriDev Consultants Pty Ltd 2005
Table 2 Example of modelled habitat-type frequency distributions for a riffle. Habitat abundance (HA) (%) Perimeter factored HA (%) Depth, D (m) Velocity, v (m/s) SS SD FS FD SS SD FS FD Discharg
e (m3/s) Max
. Ave.
%<0.5
%>0.5
%<0.3
%>0.3
Ave. Max.
%<0.3
%>0.3
Perimeter
(m) V<0.3 D<0.
5
V<0.3 D>0.
5
V>0.3 D<0.
3
V>0.3D>0.
3
V<0.3 D<0.
5
V<0.3 D>0.
5
V>0.3 D<0.
3
V>0.3 D>0.
3
0.05 0.36 0.16
100 0 94 6 0.02 <0.0
5 100 0 13.4
100 0 0 084 0 0 0
0.24 0.44 0.22 100 0 71 29 0.07 0.2 100 0 15.1 100 0 0 0 94 0 0 00.44 0.48 0.25 100 0 58 42 0.11 0.3 100 0 15.7 100 0 0 0 98 0 0 01.16 0.56 0.32 97 3 45 55 0.25 0.7 68 32 16.7 66 2 14 18 69 2 15 182.82 0.63 0.34 84 16 32 68 0.48 1.4 36 64 18.9 30 6 20 44 36 7 24 514.36 0.70 0.38 66 34 30 70 0.63 1.8 25 75 20.6 17 9 23 53 21 11 29 68
Table 3 Rated habitat-type abundances using the relative scale in Table 1.
Ecologists site assessment Hydraulic prediction Final assessment SS SD FS FD SS SD FS FD SS SD FS FD Discharge
(m3/s) V<0.3 D<0.5
V<0.3 D>0.5
V>0.3 D<0.3
V>0.3 D>0.3
V<0.3 D<0.5
V<0.3 D>0.5
V>0.3 D<0.3
V>0.3D>0.3
V<0.3 D<0.5
V<0.3 D>0.5
V>0.3 D<0.3
V>0.3 D>0.3
0.05 5 5 0 0 3 5 0 00.24 4 5 2 0 5 5 0 0 4 5 1 00.44 3 5 3 1 5 5 0 0 4 5 2 11.16 3 5 4 2 4 5 2 2 3 5 3 22.82 2 5 3 3 3 5 2 3 3 5 3 34.36 2 5 1 4 2 5 2 4 2 5 2 4
DWAF Report No. RDM X100-01-CON-COMPR2-0604 Komati Catchment Ecological Water Requirements Study – Quantity Report
Page A - 11

AfriDev Consultants Pty Ltd 2005
DWAF Report No. RDM X100-01-CON-COMPR2-0604 Komati Catchment Ecological Water Requirements Study – Quantity Report
Table 4 Modelled habitat-type abundances. Perimeter (m)
SS SD FS FD Discharge (m3/s) V<0.3
D<0.5 V<0.3 D>0.5
V>0.3 D<0.3
V>0.3 D>0.3
0.05 13.4 0.0 0.0 0.00.24 15.1 0.0 0.0 0.00.44 15.7 0.0 0.0 0.01.16 11.0 0.3 2.4 2.92.82 5.7 1.1 3.9 8.24.36 3.4 1.8 4.6 10.8
Providing velocity information for assessing the habitat flow response of invertebrates The probability-velocity distribution model of Lamouroux et al (1995) is also applied to provide velocity estimates for assessing habitat flow response of invertebrates. Three velocity classes are used: 0-0.1m/s (very slow), 0.1-0.3m/s (slow), 0.3-0.6m/s (fast) and >0.6m/s (very fast) (refer to Jordanova et al, 2004). Table 5 provides an example of the velocity class predictions for a riffle type morphology (shaded rows represent measured flows). Table 5 Probability velocity class predictions
Velocity class (m/s) Discharge (m3/s) 0-0.1 0.1-0.3 0.3-0.6 >0.6
0.01 100 0 0 00.04 85 15 0 0
0.2 65 35 0 00.5 47 44 9 01.0 35 37 25 32.0 26 29 35 105.0 14 18 31 37
11.8 6 10 19 6522.8 3 5 12 80
Page A - 12
AfriDev Consultants Pty Ltd 2005
DWAF Report No. RDM X100-01-CON-COMPR2-0604 Komati Catchment Ecological Water Requirements Study – Quantity Report
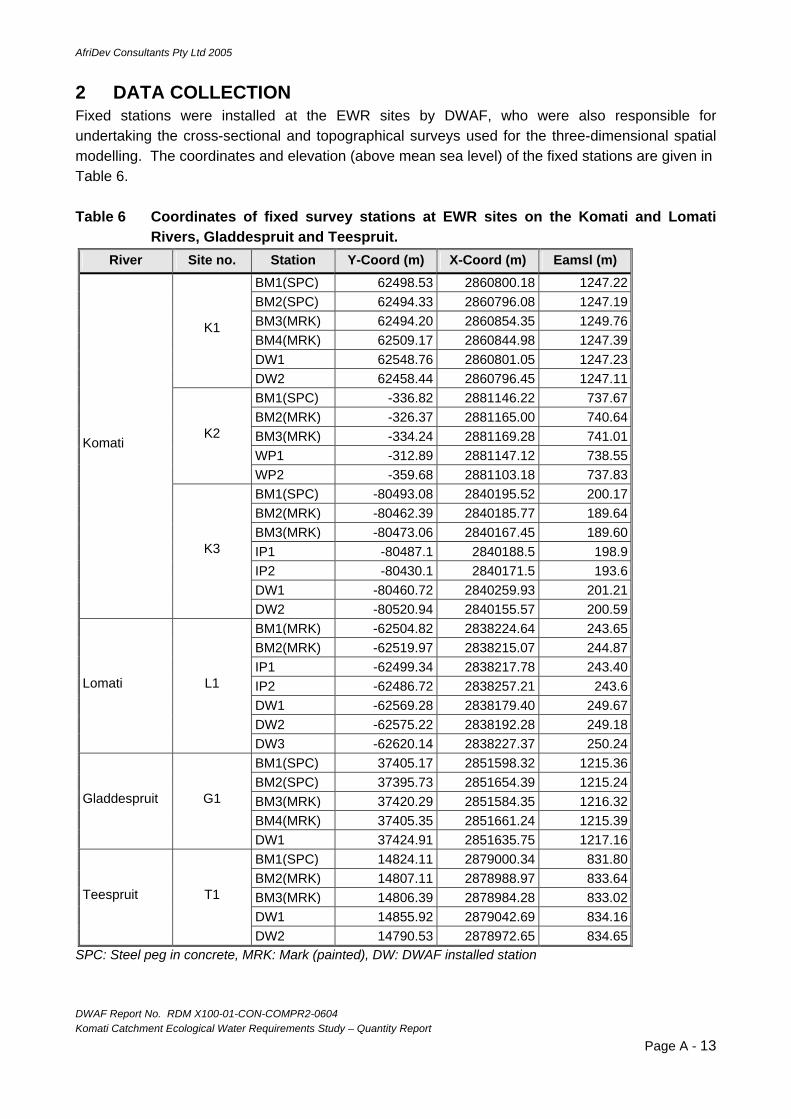
2 DATA COLLECTION Fixed stations were installed at the EWR sites by DWAF, who were also responsible for undertaking the cross-sectional and topographical surveys used for the three-dimensional spatial modelling. The coordinates and elevation (above mean sea level) of the fixed stations are given in Table 6. Table 6 Coordinates of fixed survey stations at EWR sites on the Komati and Lomati
Rivers, Gladdespruit and Teespruit. River Site no. Station Y-Coord (m) X-Coord (m) Eamsl (m)
BM1(SPC) 62498.53 2860800.18 1247.22 BM2(SPC) 62494.33 2860796.08 1247.19 BM3(MRK) 62494.20 2860854.35 1249.76 BM4(MRK) 62509.17 2860844.98 1247.39 DW1 62548.76 2860801.05 1247.23
K1
DW2 62458.44 2860796.45 1247.11 BM1(SPC) -336.82 2881146.22 737.67 BM2(MRK) -326.37 2881165.00 740.64 BM3(MRK) -334.24 2881169.28 741.01 WP1 -312.89 2881147.12 738.55
K2
WP2 -359.68 2881103.18 737.83 BM1(SPC) -80493.08 2840195.52 200.17 BM2(MRK) -80462.39 2840185.77 189.64 BM3(MRK) -80473.06 2840167.45 189.60 IP1 -80487.1 2840188.5 198.9 IP2 -80430.1 2840171.5 193.6 DW1 -80460.72 2840259.93 201.21
Komati
K3
DW2 -80520.94 2840155.57 200.59 BM1(MRK) -62504.82 2838224.64 243.65 BM2(MRK) -62519.97 2838215.07 244.87 IP1 -62499.34 2838217.78 243.40 IP2 -62486.72 2838257.21 243.6 DW1 -62569.28 2838179.40 249.67 DW2 -62575.22 2838192.28 249.18
Lomati L1
DW3 -62620.14 2838227.37 250.24 BM1(SPC) 37405.17 2851598.32 1215.36 BM2(SPC) 37395.73 2851654.39 1215.24 BM3(MRK) 37420.29 2851584.35 1216.32 BM4(MRK) 37405.35 2851661.24 1215.39
Gladdespruit G1
DW1 37424.91 2851635.75 1217.16 BM1(SPC) 14824.11 2879000.34 831.80 BM2(MRK) 14807.11 2878988.97 833.64 BM3(MRK) 14806.39 2878984.28 833.02 DW1 14855.92 2879042.69 834.16
Teespruit T1
DW2 14790.53 2878972.65 834.65 SPC: Steel peg in concrete, MRK: Mark (painted), DW: DWAF installed station
Page A - 13
AfriDev Consultants Pty Ltd 2005
DWAF Report No. RDM X100-01-CON-COMPR2-0604 Komati Catchment Ecological Water Requirements Study – Quantity Report
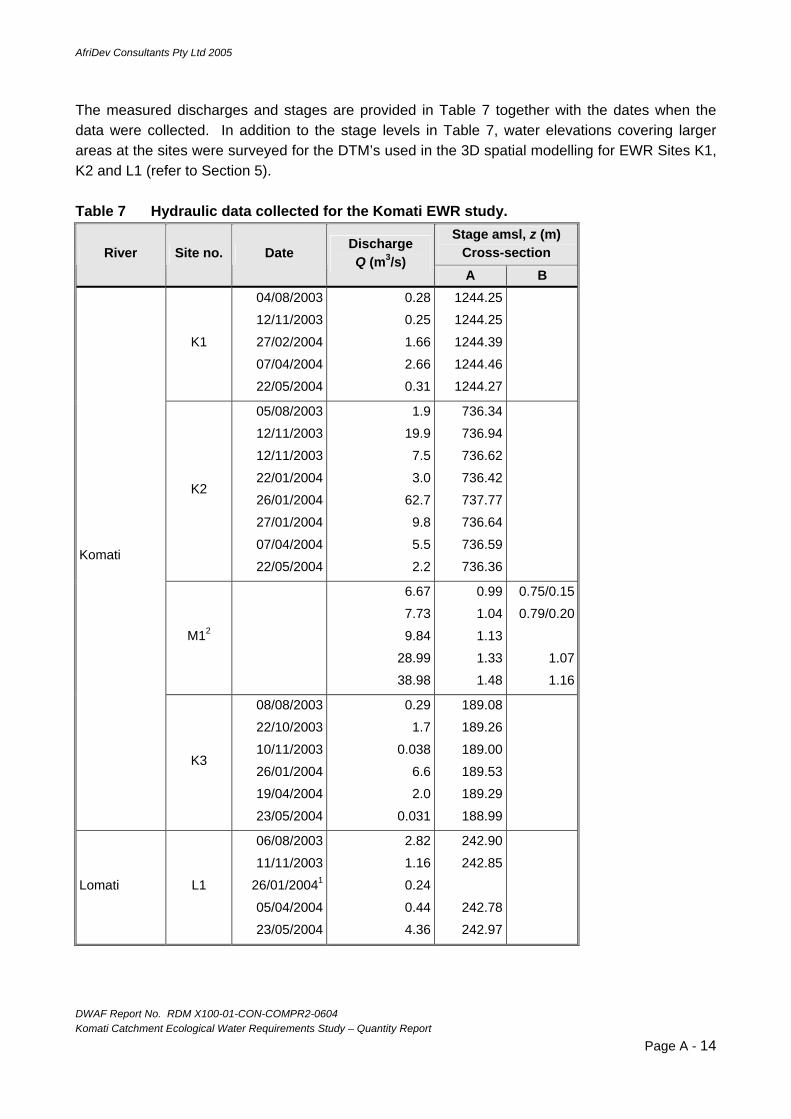
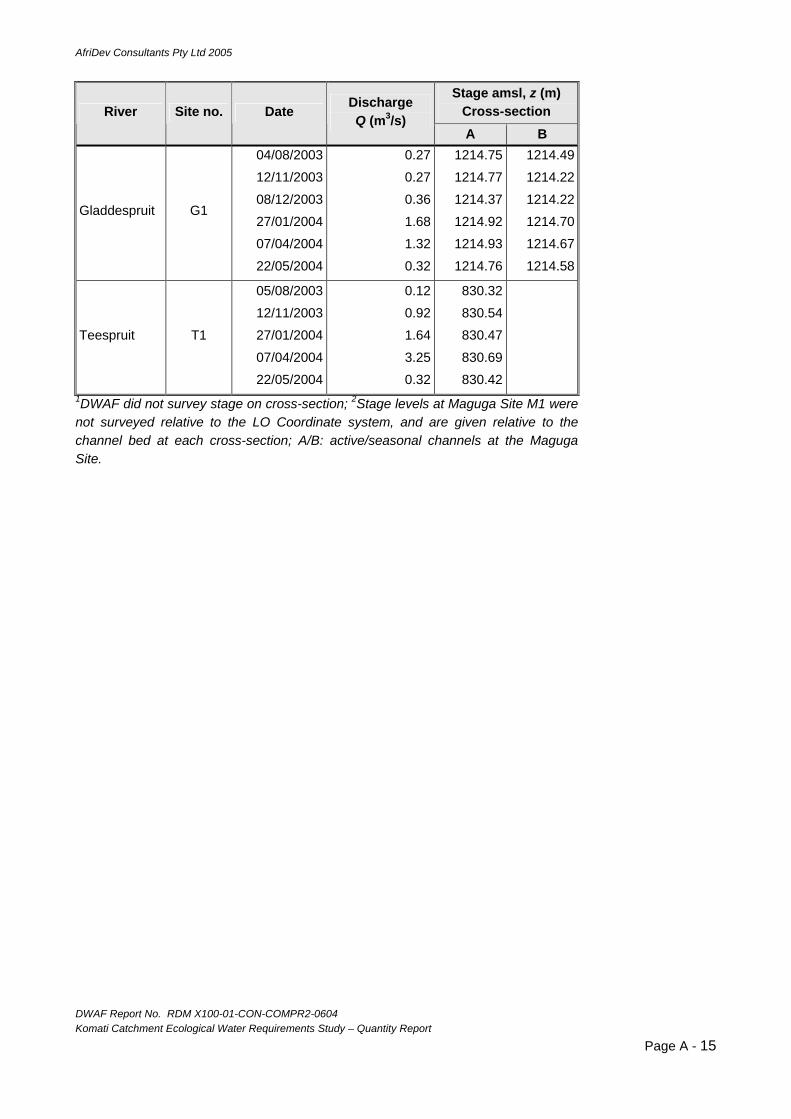
The measured discharges and stages are provided in Table 7 together with the dates when the data were collected. In addition to the stage levels in Table 7, water elevations covering larger areas at the sites were surveyed for the DTM’s used in the 3D spatial modelling for EWR Sites K1, K2 and L1 (refer to Section 5). Table 7 Hydraulic data collected for the Komati EWR study.
Stage amsl, z (m) Cross-section River Site no. Date Discharge
Q (m3/s) A B
K1
04/08/2003
12/11/2003
27/02/2004
07/04/2004
22/05/2004
0.28
0.25
1.66
2.66
0.31
1244.25
1244.25
1244.39
1244.46
1244.27
K2
05/08/2003
12/11/2003
12/11/2003
22/01/2004
26/01/2004
27/01/2004
07/04/2004
22/05/2004
1.9
19.9
7.5
3.0
62.7
9.8
5.5
2.2
736.34
736.94
736.62
736.42
737.77
736.64
736.59
736.36
M12
6.67
7.73
9.84
28.99
38.98
0.99
1.04
1.13
1.33
1.48
0.75/0.15
0.79/0.20
1.07
1.16
Komati
K3
08/08/2003
22/10/2003
10/11/2003
26/01/2004
19/04/2004
23/05/2004
0.29
1.7
0.038
6.6
2.0
0.031
189.08
189.26
189.00
189.53
189.29
188.99
Lomati L1
06/08/2003
11/11/2003
26/01/20041
05/04/2004
23/05/2004
2.82
1.16
0.24
0.44
4.36
242.90
242.85
242.78
242.97
Page A - 14
AfriDev Consultants Pty Ltd 2005
DWAF Report No. RDM X100-01-CON-COMPR2-0604 Komati Catchment Ecological Water Requirements Study – Quantity Report
Stage amsl, z (m) Cross-section River Site no. Date Discharge
Q (m3/s) A B
Gladdespruit G1
04/08/2003
12/11/2003
08/12/2003
27/01/2004
07/04/2004
22/05/2004
0.27
0.27
0.36
1.68
1.32
0.32
1214.75
1214.77
1214.37
1214.92
1214.93
1214.76
1214.49
1214.22
1214.22
1214.70
1214.67
1214.58
Teespruit T1
05/08/2003
12/11/2003
27/01/2004
07/04/2004
22/05/2004
0.12
0.92
1.64
3.25
0.32
830.32
830.54
830.47
830.69
830.42
1DWAF did not survey stage on cross-section; 2Stage levels at Maguga Site M1 were not surveyed relative to the LO Coordinate system, and are given relative to the channel bed at each cross-section; A/B: active/seasonal channels at the Maguga Site.
Page A - 15
AfriDev Consultants Pty Ltd 2005
DWAF Report No. RDM X100-01-CON-COMPR2-0604 Komati Catchment Ecological Water Requirements Study – Quantity Report
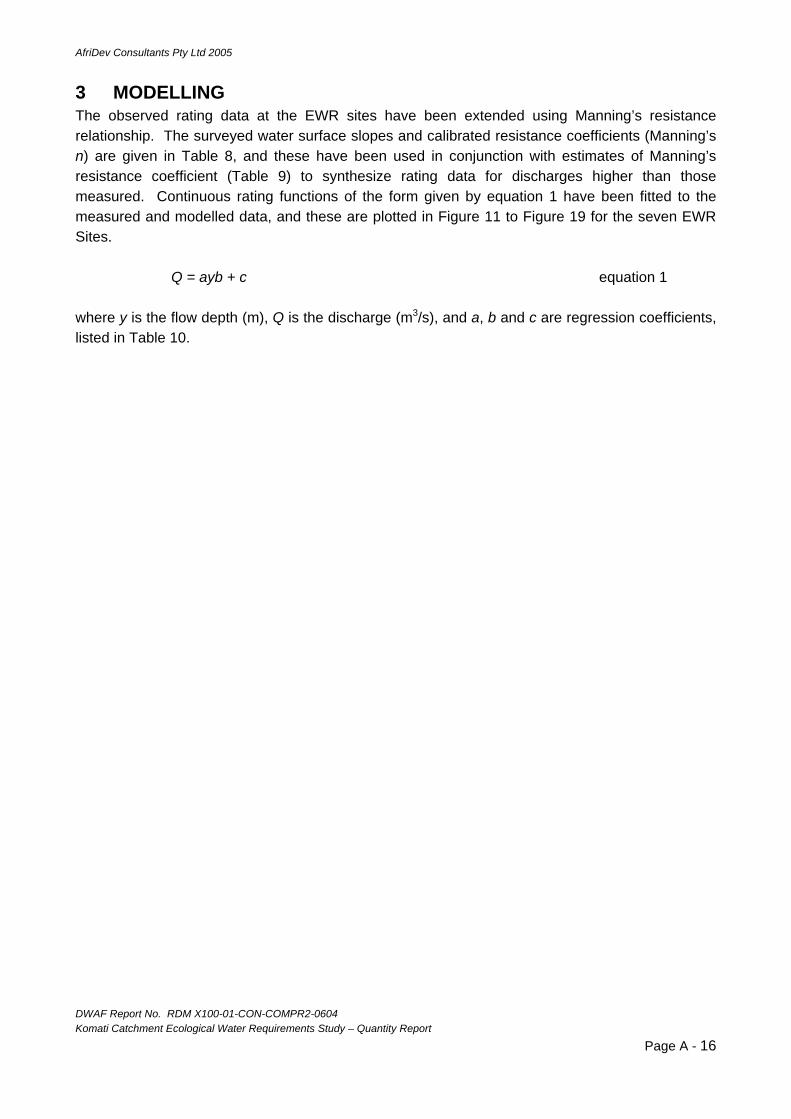
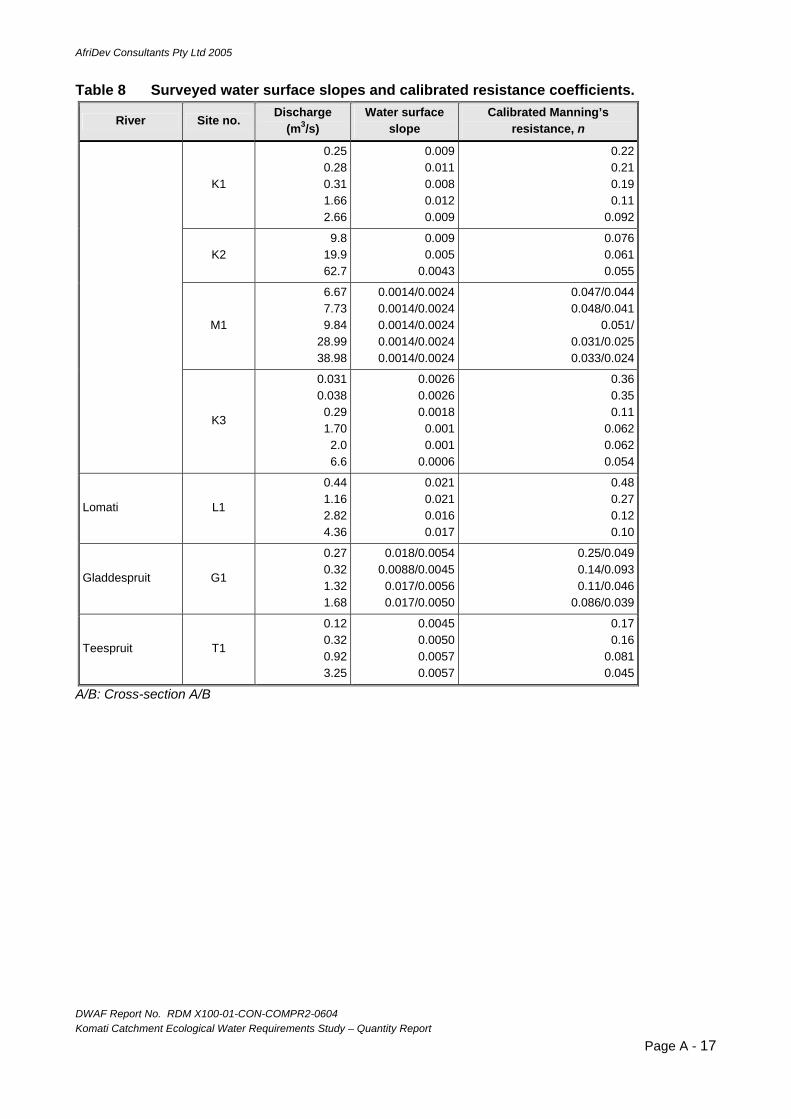
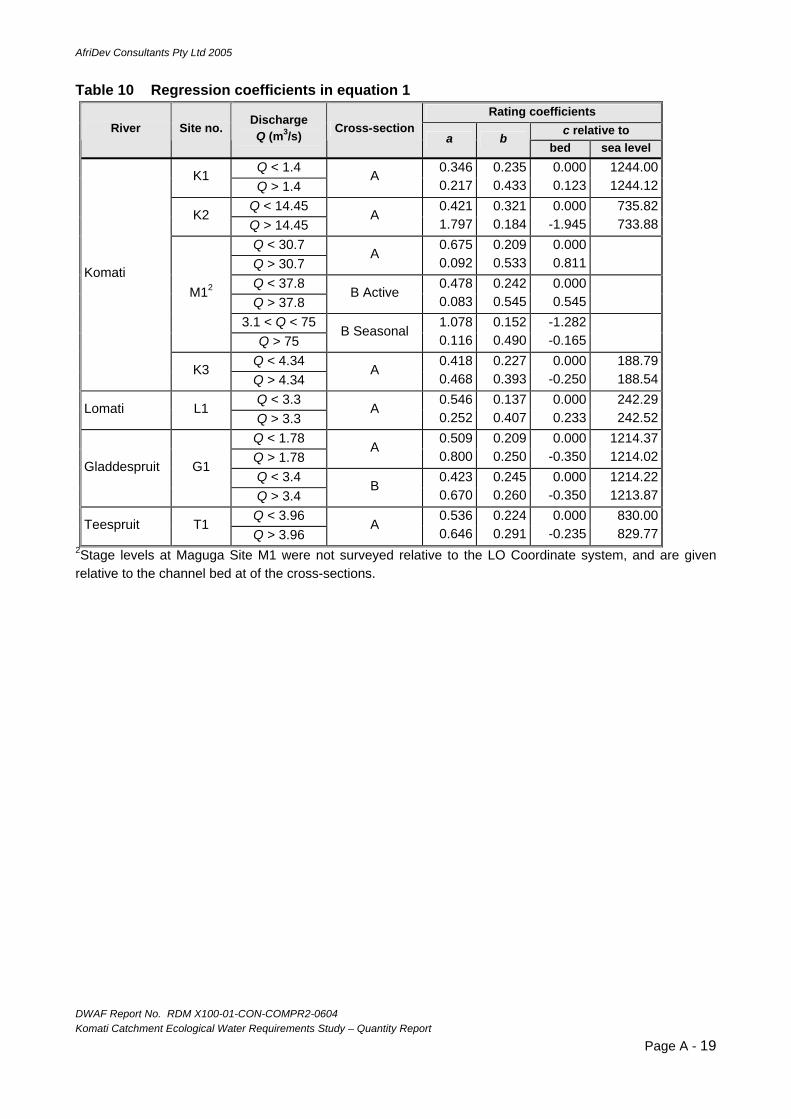
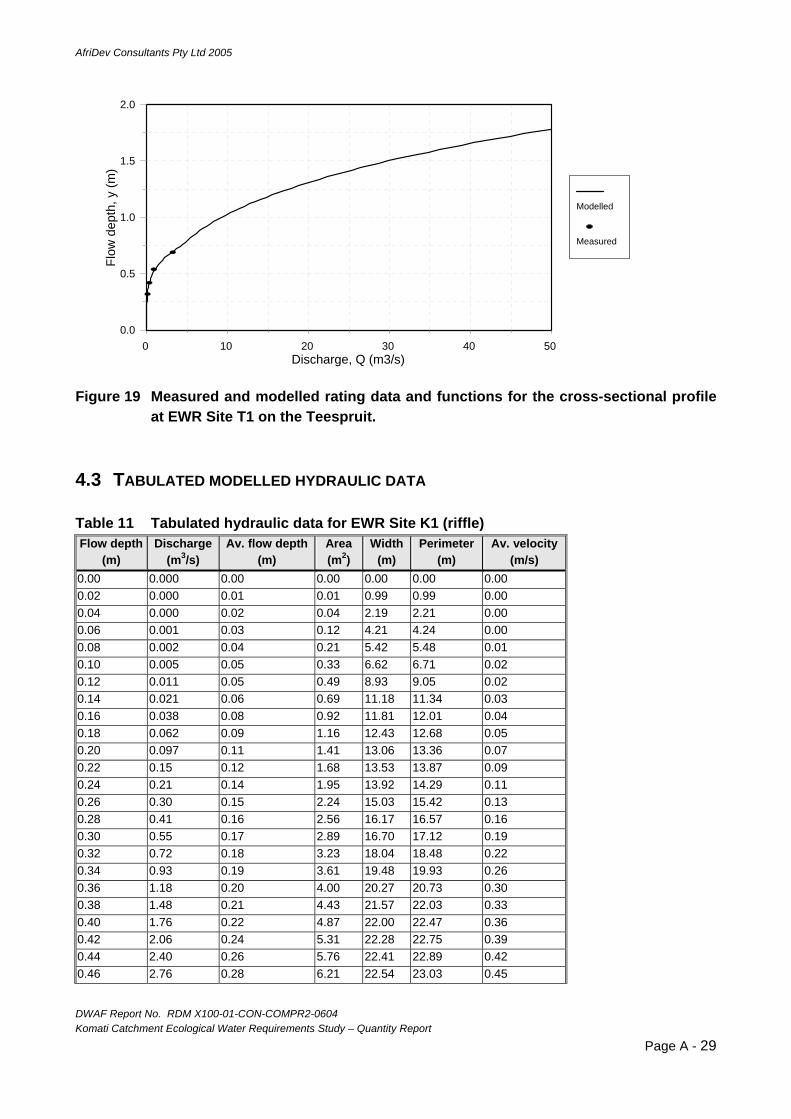
3 MODELLING The observed rating data at the EWR sites have been extended using Manning’s resistance relationship. The surveyed water surface slopes and calibrated resistance coefficients (Manning’s n) are given in Table 8, and these have been used in conjunction with estimates of Manning’s resistance coefficient (Table 9) to synthesize rating data for discharges higher than those measured. Continuous rating functions of the form given by equation 1 have been fitted to the measured and modelled data, and these are plotted in Figure 11 to Figure 19 for the seven EWR Sites.
Q = ayb + c equation 1 where y is the flow depth (m), Q is the discharge (m3/s), and a, b and c are regression coefficients, listed in Table 10.
Page A - 16
AfriDev Consultants Pty Ltd 2005
DWAF Report No. RDM X100-01-CON-COMPR2-0604 Komati Catchment Ecological Water Requirements Study – Quantity Report
Table 8 Surveyed water surface slopes and calibrated resistance coefficients.
River Site no. Discharge (m3/s)
Water surface slope
Calibrated Manning’s resistance, n
K1
0.250.280.311.662.66
0.0090.0110.0080.0120.009
0.22 0.21 0.19 0.11
0.092
K2 9.8
19.962.7
0.0090.005
0.0043
0.076 0.061 0.055
M1
6.677.739.84
28.9938.98
0.0014/0.00240.0014/0.00240.0014/0.00240.0014/0.00240.0014/0.0024
0.047/0.044 0.048/0.041
0.051/ 0.031/0.025 0.033/0.024
K3
0.0310.0380.291.702.06.6
0.00260.00260.0018
0.0010.001
0.0006
0.36 0.35 0.11
0.062 0.062 0.054
Lomati L1
0.441.162.824.36
0.0210.0210.0160.017
0.48 0.27 0.12 0.10
Gladdespruit G1
0.270.321.321.68
0.018/0.00540.0088/0.0045
0.017/0.00560.017/0.0050
0.25/0.049 0.14/0.093 0.11/0.046
0.086/0.039
Teespruit T1
0.120.320.923.25
0.00450.00500.00570.0057
0.17 0.16
0.081 0.045
A/B: Cross-section A/B
Page A - 17

AfriDev Consultants Pty Ltd 2005
DWAF Report No. RDM X100-01-CON-COMPR2-0604 Komati Catchment Ecological Water Requirements Study – Quantity Report
Table 9 Hydraulic data used to extend the measured rating data.
River Site no.
Discharge (m3/s)
Manning’s resistance,
n
Max. flow depth, y (m)
Stage amsl, z (m)
Energy slope, S
Ave. velocity v (m/s)
K1 25
144 0.060.04
1.02.0
1245.001246.00
0.009 0.009
1.32.9
K2 244 0.050 3.0 738.82 0.004 1.8
M1 Komati
K3
55 134 232 412 720
0.040.040.03
0.0350.035
2.03.04.05.06.0
190.79191.79192.79193.79194.79
0.0006 0.0006 0.0006 0.0006 0.0006
0.831.21.11.11.3
Lomati L1 14.5 121 767
0.070.060.05
1.02.04.0
243.29244.29246.29
0.015 0.015 0.015
1.02.13.3
Gladdespruit G1 8
76 0.04/0.030.03/0.03
1.0/1.02.0/2.0
1215.37/1215.221216.37/1216.22
0.01/0.0075 0.0075/0.0075
1.3/1.92.4/2.8
Teespruit T1 9.8 68
249
0.040.0350.035
1.02.03.0
831.00832.00833.00
0.006 0.007 0.008
1.22.13.3
A/B: Cross-section A/B
Page A - 18
AfriDev Consultants Pty Ltd 2005
DWAF Report No. RDM X100-01-CON-COMPR2-0604 Komati Catchment Ecological Water Requirements Study – Quantity Report
Table 10 Regression coefficients in equation 1 Rating coefficients
c relative to River Site no. Discharge Q (m3/s) Cross-section
a b bed sea level
Q < 1.4 K1 Q > 1.4
A 0.3460.217
0.2350.433
0.000 0.123
1244.001244.12
Q < 14.45 K2
Q > 14.45 A
0.4211.797
0.3210.184
0.000 -1.945
735.82733.88
Q < 30.7 Q > 30.7
A 0.6750.092
0.2090.533
0.000 0.811
Q < 37.8 Q > 37.8
B Active 0.4780.083
0.2420.545
0.000 0.545
3.1 < Q < 75
M12
Q > 75 B Seasonal
1.0780.116
0.1520.490
-1.282 -0.165
Q < 4.34
Komati
K3 Q > 4.34
A 0.4180.468
0.2270.393
0.000 -0.250
188.79188.54
Q < 3.3 Lomati L1
Q > 3.3 A
0.5460.252
0.1370.407
0.000 0.233
242.29242.52
Q < 1.78 Q > 1.78
A 0.5090.800
0.2090.250
0.000 -0.350
1214.371214.02
Q < 3.4 Gladdespruit G1
Q > 3.4 B
0.4230.670
0.2450.260
0.000 -0.350
1214.221213.87
Q < 3.96 Teespruit T1
Q > 3.96 A
0.5360.646
0.2240.291
0.000 -0.235
830.00829.77
2Stage levels at Maguga Site M1 were not surveyed relative to the LO Coordinate system, and are given relative to the channel bed at of the cross-sections.
Page A - 19

AfriDev Consultants Pty Ltd 2005
DWAF Report No. RDM X100-01-CON-COMPR2-0604 Komati Catchment Ecological Water Requirements Study – Quantity Report
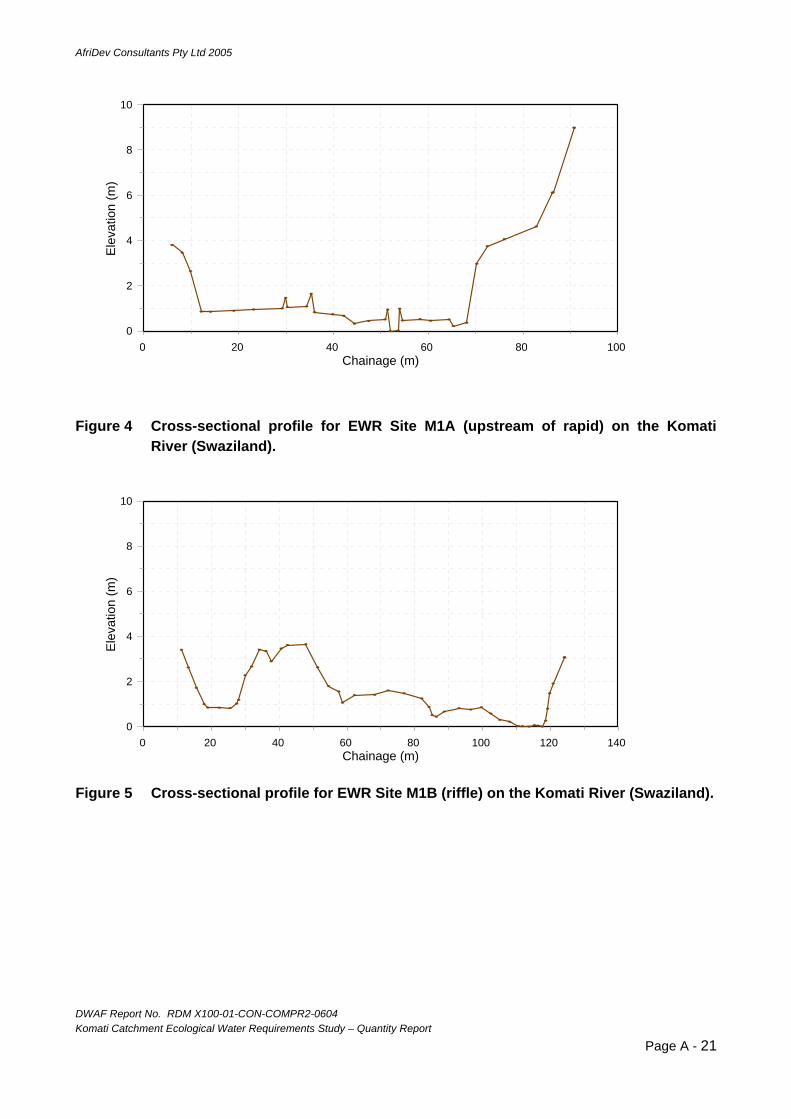
4 RESULTS 4.1 CROSS-SECTIONAL PROFILES
0
1
2
3
4
5
6
Ele
vatio
n (m
)
0 10 20 30 40 50 60 Chainage (m)
Figure 2 Cross-sectional profile for EWR Site K1 (riffle) on the Komati River.
0
1
2
3
4
5
6
7
Elev
atio
n (m
)
-80 -60 -40 -20 0 20 Chainage (m)
Figure 3 Cross-sectional profile for EWR Site K2 (rapid) on the Komati River.
Page A - 20
AfriDev Consultants Pty Ltd 2005
DWAF Report No. RDM X100-01-CON-COMPR2-0604 Komati Catchment Ecological Water Requirements Study – Quantity Report
0
2
4
6
8
10 El
evat
ion
(m)
0 20 40 60 80 100 Chainage (m)
Figure 4 Cross-sectional profile for EWR Site M1A (upstream of rapid) on the Komati
River (Swaziland).
0
2
4
6
8
10
Ele
vatio
n (m
)
0 20 40 60 80 100 120 140 Chainage (m)
Figure 5 Cross-sectional profile for EWR Site M1B (riffle) on the Komati River (Swaziland).
Page A - 21
AfriDev Consultants Pty Ltd 2005
DWAF Report No. RDM X100-01-CON-COMPR2-0604 Komati Catchment Ecological Water Requirements Study – Quantity Report
0
2
4
6
8
10
12 E
leva
tion
(m)
-300 -250 -200 -150 -100 -50 0 Chainage (m)
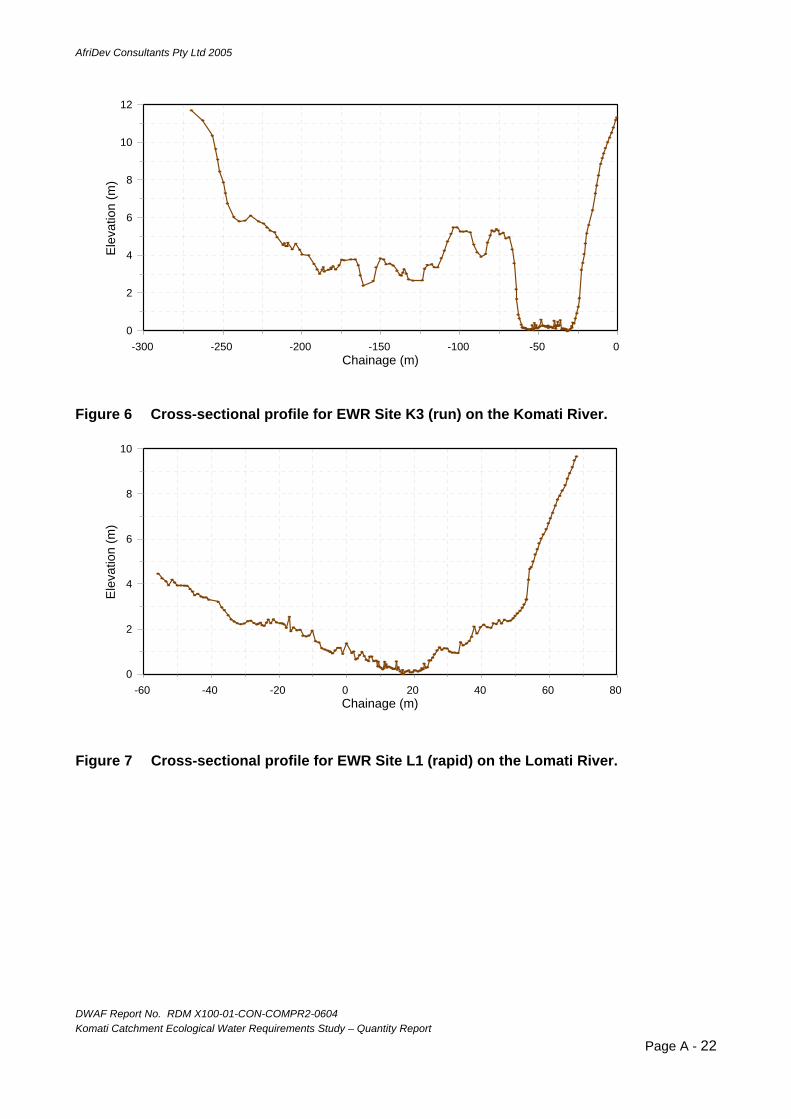
Figure 6 Cross-sectional profile for EWR Site K3 (run) on the Komati River.
0
2
4
6
8
10
Ele
vatio
n (m
)
-60 -40 -20 0 20 40 60 80 Chainage (m)
Figure 7 Cross-sectional profile for EWR Site L1 (rapid) on the Lomati River.
Page A - 22

AfriDev Consultants Pty Ltd 2005
DWAF Report No. RDM X100-01-CON-COMPR2-0604 Komati Catchment Ecological Water Requirements Study – Quantity Report
0
1
2
3
4
5 E
leva
tion
(m)
-20 -10 0 10 20 30 40 Chainage (m)
Figure 8 Cross-sectional profile for EWR Site G1A (rapid) on the Gladdespruit. The profile
was re-surveyed (as indicated in red) on 12/11/2003 after a high flow that resulted in changes to the river bed.
0
1
2
3
4
5
Ele
vatio
n (m
)
-30 -20 -10 0 10 20 30 Chainage (m)
Figure 9 Cross-sectional profile for EWR Site G1B(run) on the Gladdespruit.
Page A - 23

AfriDev Consultants Pty Ltd 2005
DWAF Report No. RDM X100-01-CON-COMPR2-0604 Komati Catchment Ecological Water Requirements Study – Quantity Report
0
1
2
3
4
5
6 El
evat
ion
(m)
-60 -50 -40 -30 -20 -10 0 10 Chainage (m)
Figure 10 Cross-sectional profile for EWR T1 (riffle) on the Teespruit.
Page A - 24
AfriDev Consultants Pty Ltd 2005
DWAF Report No. RDM X100-01-CON-COMPR2-0604 Komati Catchment Ecological Water Requirements Study – Quantity Report
4.2 RATING DATA AND FUNCTIONS
0.0
0.2
0.4
0.6
0.8
1.0
Flow
dep
th, y
(m)
0 2 4 6 8 10 Discharge, Q (m3/s)
Modelled
Measured
Figure 11 Measured and modelled rating data and functions for the cross-sectional profile
at EWR Site K1 on the Komati River.
0.0
0.5
1.0
1.5
2.0
2.5
Flow
dep
th, y
(m)
0 20 40 60 80 100 120 140 Discharge, Q (m3/s)
Modelled
Measured
Figure 12 Measured and modelled rating data and functions for the cross-sectional profile
at EWR Site K2 on the Komati River.
Page A - 25
AfriDev Consultants Pty Ltd 2005
DWAF Report No. RDM X100-01-CON-COMPR2-0604 Komati Catchment Ecological Water Requirements Study – Quantity Report
0.0
0.5
1.0
1.5
2.0
2.5
3.0 Fl
ow d
epth
, y (m
)
0 100 200 300 400 Discharge, Q (m3/s)
Modelled
Measured
Figure 13 Measured and modelled rating data and functions for the cross-sectional profiles
at EWR Site M1A on the Komati River (Swaziland).
0.0
0.2
0.4
0.6
0.8
1.0
1.2
Flow
dep
th, y
(m)
0 10 20 30 40 50 Discharge, Q (m3/s)
Modelled
Measured Active
Measured Seasonal
Figure 14 Measured and modelled rating data and functions for the cross-sectional profiles
at EWR Site M1B on the Komati River (Swaziland).
Page A - 26
AfriDev Consultants Pty Ltd 2005
DWAF Report No. RDM X100-01-CON-COMPR2-0604 Komati Catchment Ecological Water Requirements Study – Quantity Report
0.0
0.5
1.0
1.5
2.0
2.5
3.0 Fl
ow d
epth
, y (m
)
0 20 40 60 80 100 Discharge, Q (m3/s)
Modelled
Measured
Figure 15 Measured and modelled rating data and functions for the cross-sectional profile
at EWR Site K3 on the Komati River.
0.0
0.5
1.0
1.5
Flow
dep
th, y
(m)
0 10 20 30 40 50 Discharge, Q (m3/s)
Modelled
Measured
Figure 16 Measured and modelled rating data and functions for the cross-sectional profile
at EWR Site L1 on the Lomati River.
Page A - 27
AfriDev Consultants Pty Ltd 2005
DWAF Report No. RDM X100-01-CON-COMPR2-0604 Komati Catchment Ecological Water Requirements Study – Quantity Report
0.0
0.5
1.0
1.5
2.0 Fl
ow d
epth
, y (m
)
0 10 20 30 40 50 Discharge, Q (m3/s)
Modelled
Measured
Figure 17 Measured and modelled rating data and functions for the cross-sectional profiles
at EWR Site G1A on the Gladdespruit.
0.0
0.5
1.0
1.5
2.0
Flow
dep
th, y
(m)
0 10 20 30 40 50 Discharge, Q (m3/s)
Modelled
Measured
Figure 18 Measured and modelled rating data and functions for the cross-sectional profiles
at EWR Site G1B on the Gladdespruit.
Page A - 28
AfriDev Consultants Pty Ltd 2005
DWAF Report No. RDM X100-01-CON-COMPR2-0604 Komati Catchment Ecological Water Requirements Study – Quantity Report
0.0
0.5
1.0
1.5
2.0 Fl
ow d
epth
, y (m
)
0 10 20 30 40 50 Discharge, Q (m3/s)
Modelled
Measured
Figure 19 Measured and modelled rating data and functions for the cross-sectional profile
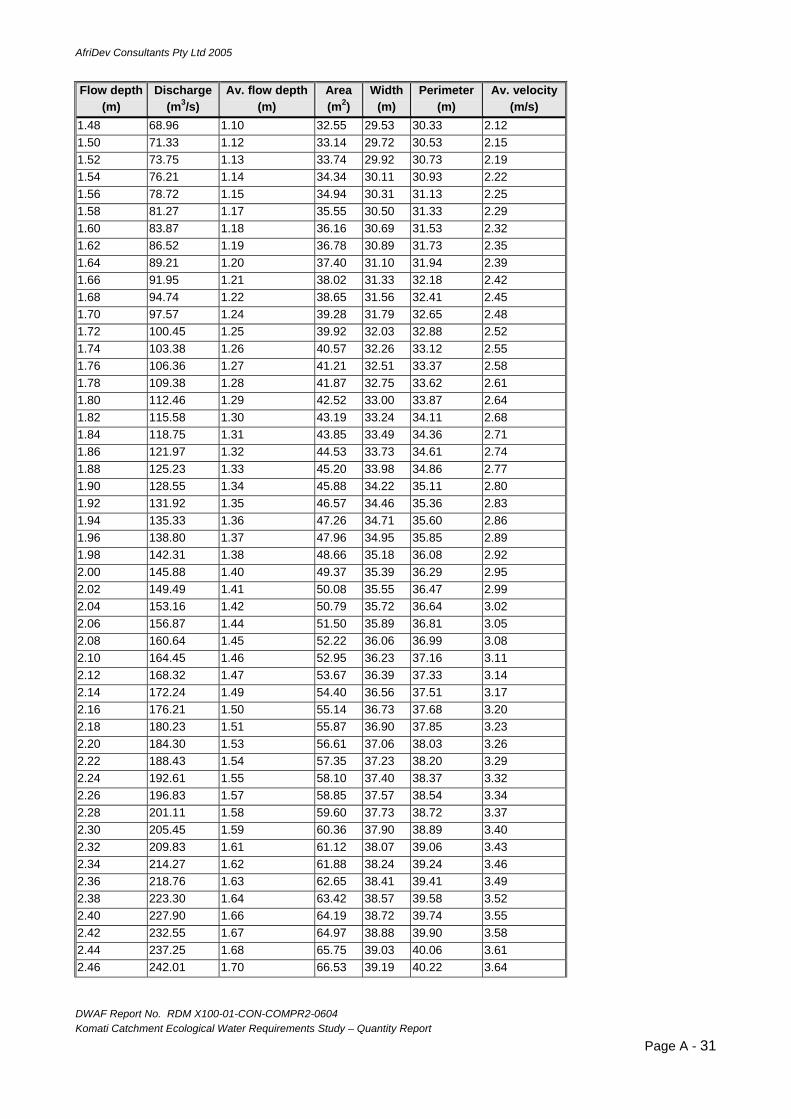
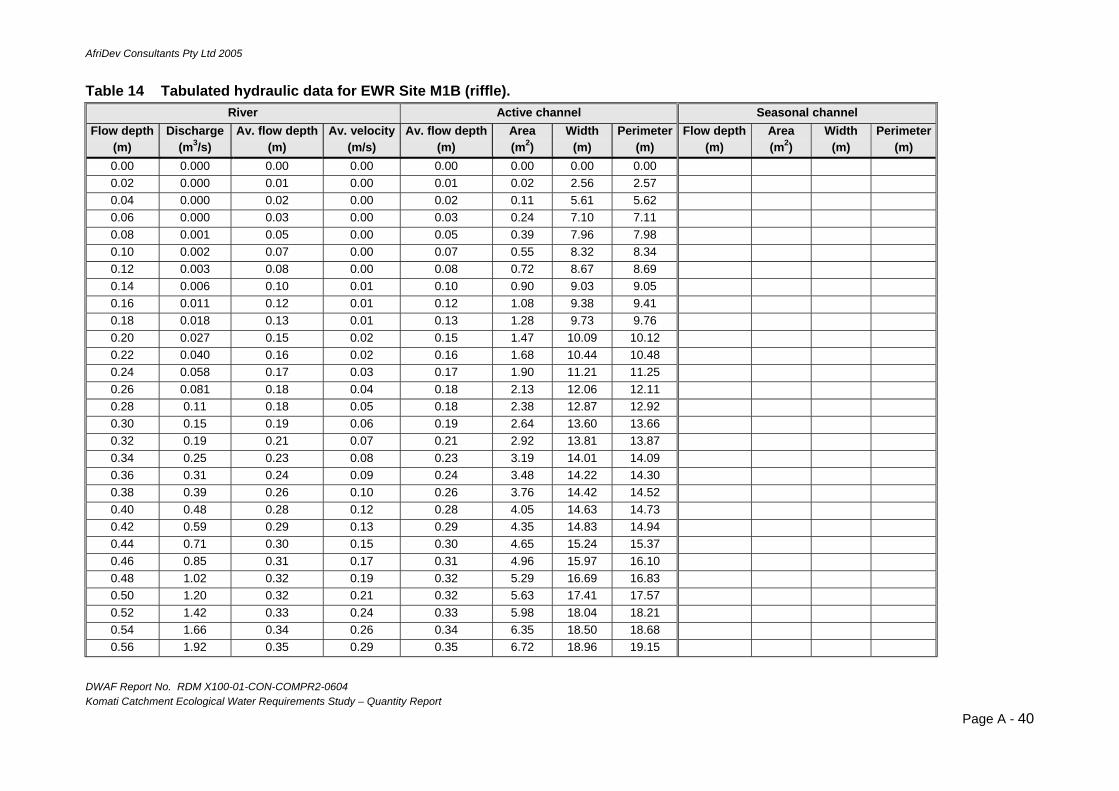
at EWR Site T1 on the Teespruit. 4.3 TABULATED MODELLED HYDRAULIC DATA Table 11 Tabulated hydraulic data for EWR Site K1 (riffle) Flow depth
(m) Discharge
(m3/s) Av. flow depth
(m) Area (m2)
Width (m)
Perimeter (m)
Av. velocity (m/s)
0.00 0.000 0.00 0.00 0.00 0.00 0.00 0.02 0.000 0.01 0.01 0.99 0.99 0.00 0.04 0.000 0.02 0.04 2.19 2.21 0.00 0.06 0.001 0.03 0.12 4.21 4.24 0.00 0.08 0.002 0.04 0.21 5.42 5.48 0.01 0.10 0.005 0.05 0.33 6.62 6.71 0.02 0.12 0.011 0.05 0.49 8.93 9.05 0.02 0.14 0.021 0.06 0.69 11.18 11.34 0.03 0.16 0.038 0.08 0.92 11.81 12.01 0.04 0.18 0.062 0.09 1.16 12.43 12.68 0.05 0.20 0.097 0.11 1.41 13.06 13.36 0.07 0.22 0.15 0.12 1.68 13.53 13.87 0.09 0.24 0.21 0.14 1.95 13.92 14.29 0.11 0.26 0.30 0.15 2.24 15.03 15.42 0.13 0.28 0.41 0.16 2.56 16.17 16.57 0.16 0.30 0.55 0.17 2.89 16.70 17.12 0.19 0.32 0.72 0.18 3.23 18.04 18.48 0.22 0.34 0.93 0.19 3.61 19.48 19.93 0.26 0.36 1.18 0.20 4.00 20.27 20.73 0.30 0.38 1.48 0.21 4.43 21.57 22.03 0.33 0.40 1.76 0.22 4.87 22.00 22.47 0.36 0.42 2.06 0.24 5.31 22.28 22.75 0.39 0.44 2.40 0.26 5.76 22.41 22.89 0.42 0.46 2.76 0.28 6.21 22.54 23.03 0.45
Page A - 29

AfriDev Consultants Pty Ltd 2005
DWAF Report No. RDM X100-01-CON-COMPR2-0604 Komati Catchment Ecological Water Requirements Study – Quantity Report
Flow depth (m)
Discharge (m3/s)
Av. flow depth (m)
Area (m2)
Width (m)
Perimeter (m)
Av. velocity (m/s)
0.48 3.16 0.29 6.66 22.67 23.17 0.47 0.50 3.58 0.31 7.11 22.81 23.30 0.50 0.52 4.04 0.33 7.57 22.94 23.44 0.53 0.54 4.52 0.35 8.03 23.07 23.58 0.56 0.56 5.04 0.37 8.49 23.20 23.72 0.59 0.58 5.59 0.38 8.96 23.33 23.85 0.62 0.60 6.17 0.40 9.43 23.46 23.99 0.65 0.62 6.78 0.42 9.90 23.59 24.13 0.68 0.64 7.43 0.44 10.37 23.72 24.27 0.72 0.66 8.11 0.45 10.85 23.86 24.41 0.75 0.68 8.82 0.47 11.32 23.98 24.53 0.78 0.70 9.57 0.49 11.81 24.10 24.66 0.81 0.72 10.35 0.51 12.29 24.22 24.79 0.84 0.74 11.17 0.52 12.77 24.34 24.92 0.87 0.76 12.03 0.54 13.26 24.46 25.05 0.91 0.78 12.92 0.56 13.75 24.59 25.18 0.94 0.80 13.84 0.58 14.25 24.71 25.31 0.97 0.82 14.80 0.59 14.74 24.83 25.44 1.00 0.84 15.80 0.61 15.24 24.95 25.56 1.04 0.86 16.84 0.63 15.74 25.07 25.69 1.07 0.88 17.91 0.64 16.24 25.19 25.82 1.10 0.90 19.03 0.66 16.75 25.32 25.95 1.14 0.92 20.18 0.68 17.25 25.44 26.08 1.17 0.94 21.37 0.70 17.76 25.56 26.21 1.20 0.96 22.59 0.71 18.28 25.68 26.34 1.24 0.98 23.86 0.73 18.79 25.80 26.46 1.27 1.00 25.16 0.74 19.31 25.92 26.59 1.30 1.02 26.51 0.76 19.83 26.04 26.72 1.34 1.04 27.89 0.78 20.35 26.16 26.85 1.37 1.06 29.32 0.79 20.88 26.28 26.98 1.40 1.08 30.79 0.81 21.40 26.41 27.11 1.44 1.10 32.29 0.83 21.93 26.53 27.23 1.47 1.12 33.84 0.84 22.46 26.65 27.36 1.51 1.14 35.43 0.86 23.00 26.77 27.49 1.54 1.16 37.06 0.87 23.53 26.92 27.65 1.57 1.18 38.73 0.89 24.07 27.08 27.81 1.61 1.20 40.44 0.90 24.62 27.23 27.97 1.64 1.22 42.20 0.92 25.16 27.39 28.13 1.68 1.24 44.00 0.93 25.71 27.54 28.29 1.71 1.26 45.84 0.95 26.27 27.69 28.45 1.75 1.28 47.72 0.96 26.82 27.85 28.60 1.78 1.30 49.65 0.98 27.38 28.00 28.76 1.81 1.32 51.62 0.99 27.94 28.15 28.92 1.85 1.34 53.63 1.01 28.51 28.31 29.08 1.88 1.36 55.69 1.02 29.07 28.46 29.24 1.92 1.38 57.79 1.04 29.64 28.62 29.40 1.95 1.40 59.93 1.05 30.22 28.77 29.56 1.98 1.42 62.12 1.06 30.79 28.94 29.74 2.02 1.44 64.36 1.08 31.38 29.14 29.93 2.05 1.46 66.64 1.09 31.96 29.33 30.13 2.09
Page A - 30
AfriDev Consultants Pty Ltd 2005
DWAF Report No. RDM X100-01-CON-COMPR2-0604 Komati Catchment Ecological Water Requirements Study – Quantity Report
Flow depth (m)
Discharge (m3/s)
Av. flow depth (m)
Area (m2)
Width (m)
Perimeter (m)
Av. velocity (m/s)
1.48 68.96 1.10 32.55 29.53 30.33 2.12 1.50 71.33 1.12 33.14 29.72 30.53 2.15 1.52 73.75 1.13 33.74 29.92 30.73 2.19 1.54 76.21 1.14 34.34 30.11 30.93 2.22 1.56 78.72 1.15 34.94 30.31 31.13 2.25 1.58 81.27 1.17 35.55 30.50 31.33 2.29 1.60 83.87 1.18 36.16 30.69 31.53 2.32 1.62 86.52 1.19 36.78 30.89 31.73 2.35 1.64 89.21 1.20 37.40 31.10 31.94 2.39 1.66 91.95 1.21 38.02 31.33 32.18 2.42 1.68 94.74 1.22 38.65 31.56 32.41 2.45 1.70 97.57 1.24 39.28 31.79 32.65 2.48 1.72 100.45 1.25 39.92 32.03 32.88 2.52 1.74 103.38 1.26 40.57 32.26 33.12 2.55 1.76 106.36 1.27 41.21 32.51 33.37 2.58 1.78 109.38 1.28 41.87 32.75 33.62 2.61 1.80 112.46 1.29 42.52 33.00 33.87 2.64 1.82 115.58 1.30 43.19 33.24 34.11 2.68 1.84 118.75 1.31 43.85 33.49 34.36 2.71 1.86 121.97 1.32 44.53 33.73 34.61 2.74 1.88 125.23 1.33 45.20 33.98 34.86 2.77 1.90 128.55 1.34 45.88 34.22 35.11 2.80 1.92 131.92 1.35 46.57 34.46 35.36 2.83 1.94 135.33 1.36 47.26 34.71 35.60 2.86 1.96 138.80 1.37 47.96 34.95 35.85 2.89 1.98 142.31 1.38 48.66 35.18 36.08 2.92 2.00 145.88 1.40 49.37 35.39 36.29 2.95 2.02 149.49 1.41 50.08 35.55 36.47 2.99 2.04 153.16 1.42 50.79 35.72 36.64 3.02 2.06 156.87 1.44 51.50 35.89 36.81 3.05 2.08 160.64 1.45 52.22 36.06 36.99 3.08 2.10 164.45 1.46 52.95 36.23 37.16 3.11 2.12 168.32 1.47 53.67 36.39 37.33 3.14 2.14 172.24 1.49 54.40 36.56 37.51 3.17 2.16 176.21 1.50 55.14 36.73 37.68 3.20 2.18 180.23 1.51 55.87 36.90 37.85 3.23 2.20 184.30 1.53 56.61 37.06 38.03 3.26 2.22 188.43 1.54 57.35 37.23 38.20 3.29 2.24 192.61 1.55 58.10 37.40 38.37 3.32 2.26 196.83 1.57 58.85 37.57 38.54 3.34 2.28 201.11 1.58 59.60 37.73 38.72 3.37 2.30 205.45 1.59 60.36 37.90 38.89 3.40 2.32 209.83 1.61 61.12 38.07 39.06 3.43 2.34 214.27 1.62 61.88 38.24 39.24 3.46 2.36 218.76 1.63 62.65 38.41 39.41 3.49 2.38 223.30 1.64 63.42 38.57 39.58 3.52 2.40 227.90 1.66 64.19 38.72 39.74 3.55 2.42 232.55 1.67 64.97 38.88 39.90 3.58 2.44 237.25 1.68 65.75 39.03 40.06 3.61 2.46 242.01 1.70 66.53 39.19 40.22 3.64
Page A - 31

AfriDev Consultants Pty Ltd 2005
DWAF Report No. RDM X100-01-CON-COMPR2-0604 Komati Catchment Ecological Water Requirements Study – Quantity Report
Flow depth (m)
Discharge (m3/s)
Av. flow depth (m)
Area (m2)
Width (m)
Perimeter (m)
Av. velocity (m/s)
2.48 246.82 1.71 67.31 39.34 40.39 3.67 2.50 251.68 1.72 68.10 39.50 40.55 3.70 2.52 256.60 1.74 68.89 39.65 40.71 3.72 2.54 261.57 1.75 69.69 39.76 40.82 3.75 2.56 266.60 1.77 70.48 39.86 40.94 3.78 2.58 271.68 1.78 71.28 39.97 41.05 3.81 2.60 276.81 1.80 72.08 40.07 41.16 3.84 2.62 282.00 1.81 72.89 40.18 41.28 3.87 2.64 287.25 1.83 73.69 40.28 41.39 3.90 2.66 292.54 1.84 74.50 40.39 41.50 3.93 2.68 297.90 1.86 75.31 40.50 41.61 3.96 2.70 303.31 1.87 76.12 40.60 41.73 3.98 2.72 308.77 1.89 76.93 40.71 41.84 4.01 2.74 314.29 1.90 77.75 40.81 41.95 4.04 2.76 319.86 1.92 78.56 40.92 42.07 4.07 2.78 325.50 1.94 79.38 41.02 42.18 4.10 2.80 331.18 1.95 80.20 41.14 42.30 4.13 2.82 336.92 1.96 81.03 41.25 42.42 4.16 2.84 342.72 1.98 81.85 41.36 42.54 4.19 2.86 348.58 1.99 82.68 41.48 42.66 4.22 2.88 354.49 2.01 83.51 41.59 42.79 4.24 2.90 360.45 2.02 84.35 41.71 42.91 4.27 2.92 366.48 2.04 85.18 41.82 43.03 4.30 2.94 372.56 2.05 86.02 41.93 43.15 4.33 2.96 378.70 2.07 86.86 42.05 43.27 4.36 2.98 384.89 2.08 87.70 42.16 43.39 4.39 3.00 391.14 2.09 88.54 42.28 43.51 4.42
Table 12 Tabulated hydraulic data for EW te K2 id) R Si (rapFlow depth Discharge Av. flow depth
(m) Area Width Perimeter Av. velocity
(m3(m) /s) (m2) (m) (m) (m/s) 0.00 0.000 0.00 0.00 0.00 0.00 0.00 0.02 0.000 0.01 0.00 0.46 0.46 0.02 0.04 0.001 0.02 0.02 0.92 0.92 0.04 0.06 0.002 0.03 0.04 1.27 1.28 0.06 0.08 0.006 0.05 0.07 1.52 1.54 0.08 0.10 0.011 0.06 0.10 1.67 1.70 0.11 0.12 0.020 0.05 0.15 3.20 3.25 0.13 0.14 0.032 0.05 0.24 5.06 5.14 0.14 0.16 0.049 0.06 0.34 5.52 5.62 0.14 0.18 0.071 0.08 0.46 6.11 6.26 0.15 0.20 0.10 0.09 0.59 6.71 6.89 0.17 0.22 0.13 0.09 0.73 7.84 8.07 0.18 0.24 0.17 0.10 0.90 9.02 9.31 0.19 0.26 0.22 0.10 1.10 10.54 10.89 0.20 0.28 0.28 0.10 1.34 13.12 13.55 0.21 0.30 0.35 0.12 1.61 13.87 14.38 0.22 0.32 0.43 0.12 1.91 15.84 16.44 0.22 0.34 0.51 0.13 2.24 16.96 17.65 0.23 0.36 0.61 0.14 2.59 18.05 18.83 0.24
Page A - 32

AfriDev Consultants Pty Ltd 2005
DWAF Report No. RDM X100-01-CON-COMPR2-0604 Komati Catchment Ecological Water Requirements Study – Quantity Report
Flow depth (m)
Discharge (m3/s)
Av. flow depth (m)
Area (m2)
Width (m)
Perimeter (m)
Av. velocity (m/s)
0.38 0.73 0.16 2.95 18.55 19.43 0.25 0.40 0.85 0.17 3.33 19.13 20.11 0.26 0.42 0.99 0.19 3.72 19.72 20.79 0.27 0.44 1.15 0.20 4.12 20.21 21.39 0.28 0.46 1.32 0.22 4.53 20.71 21.99 0.29 0.48 1.51 0.23 4.94 21.14 22.49 0.30 0.50 1.71 0.25 5.37 21.64 23.06 0.32 0.52 1.93 0.26 5.81 22.09 23.56 0.33 0.54 2.17 0.28 6.26 22.47 23.99 0.35 0.56 2.43 0.29 6.71 22.80 24.35 0.36 0.58 2.71 0.30 7.17 23.75 25.33 0.38 0.60 3.02 0.32 7.65 24.21 25.81 0.39 0.62 3.34 0.33 8.14 24.66 26.29 0.41 0.64 3.69 0.35 8.64 25.03 26.68 0.43 0.66 4.06 0.36 9.14 25.34 27.02 0.44 0.68 4.45 0.38 9.65 25.69 27.39 0.46 0.70 4.87 0.39 10.17 26.04 27.76 0.48 0.72 5.32 0.41 10.69 26.39 28.12 0.50 0.74 5.80 0.42 11.22 26.89 28.65 0.52 0.76 6.30 0.43 11.77 27.39 29.18 0.54 0.78 6.83 0.44 12.32 27.85 29.66 0.55 0.80 7.39 0.46 12.88 28.23 30.07 0.57 0.82 7.98 0.47 13.45 28.57 30.41 0.59 0.84 8.60 0.49 14.02 28.90 30.76 0.61 0.86 9.26 0.50 14.60 29.24 31.10 0.63 0.88 9.94 0.51 15.19 29.58 31.45 0.65 0.90 10.66 0.53 15.79 29.92 31.80 0.68 0.92 11.42 0.54 16.39 30.20 32.09 0.70 0.94 12.21 0.56 17.00 30.46 32.38 0.72 0.96 13.04 0.57 17.61 30.73 32.66 0.74 0.98 13.90 0.59 18.22 30.99 32.94 0.76 1.00 14.65 0.60 18.85 31.26 33.22 0.78 1.02 15.20 0.62 19.47 31.52 33.50 0.78 1.04 15.77 0.63 20.11 31.79 33.79 0.78 1.06 16.35 0.65 20.75 32.05 34.07 0.79 1.08 16.95 0.66 21.39 32.32 34.36 0.79 1.10 17.57 0.68 22.04 32.60 34.65 0.80 1.12 18.21 0.69 22.69 32.87 34.94 0.80 1.14 18.86 0.70 23.35 33.15 35.23 0.81 1.16 19.54 0.72 24.02 33.43 35.53 0.81 1.18 20.23 0.73 24.69 33.70 35.81 0.82 1.20 20.94 0.75 25.37 33.95 36.09 0.83 1.22 21.68 0.76 26.05 34.21 36.36 0.83 1.24 22.43 0.78 26.74 34.47 36.64 0.84 1.26 23.21 0.79 27.43 34.71 36.90 0.85 1.28 24.01 0.81 28.12 34.93 37.13 0.85 1.30 24.83 0.82 28.82 35.14 37.37 0.86 1.32 25.67 0.83 29.53 35.46 37.70 0.87 1.34 26.54 0.84 30.24 35.87 38.14 0.88 1.36 27.43 0.85 30.97 36.28 38.58 0.89
Page A - 33

AfriDev Consultants Pty Ltd 2005
DWAF Report No. RDM X100-01-CON-COMPR2-0604 Komati Catchment Ecological Water Requirements Study – Quantity Report
Flow depth (m)
Discharge (m3/s)
Av. flow depth (m)
Area (m2)
Width (m)
Perimeter (m)
Av. velocity (m/s)
1.38 28.34 0.86 31.69 36.70 39.02 0.89 1.40 29.28 0.87 32.43 37.14 39.49 0.90 1.42 30.24 0.88 33.18 37.53 39.90 0.91 1.44 31.23 0.90 33.93 37.86 40.27 0.92 1.46 32.25 0.91 34.69 38.19 40.63 0.93 1.48 33.29 0.92 35.46 38.53 40.99 0.94 1.50 34.36 0.93 36.24 39.08 41.58 0.95 1.52 35.46 0.93 37.03 39.95 42.47 0.96 1.54 36.59 0.93 37.83 40.80 43.35 0.97 1.56 37.74 0.93 38.66 41.62 44.20 0.98 1.58 38.93 0.93 39.50 42.33 44.94 0.99 1.60 40.15 0.94 40.35 42.92 45.56 0.99 1.62 41.39 0.95 41.22 43.51 46.19 1.00 1.64 42.67 0.95 42.09 44.10 46.81 1.01 1.66 43.98 0.96 42.98 44.69 47.43 1.02 1.68 45.32 0.97 43.88 45.24 48.01 1.03 1.70 46.70 0.98 44.79 45.79 48.60 1.04 1.72 48.11 0.99 45.71 46.34 49.18 1.05 1.74 49.55 0.99 46.64 46.89 49.76 1.06 1.76 51.03 0.98 47.60 48.64 51.53 1.07 1.78 52.55 0.94 48.60 51.68 54.60 1.08 1.80 54.10 0.92 49.66 53.91 56.86 1.09 1.82 55.69 0.92 50.75 55.04 58.03 1.10 1.84 57.31 0.90 51.88 57.60 60.61 1.10 1.86 58.98 0.88 53.06 60.13 63.17 1.11 1.88 60.68 0.86 54.29 63.10 66.17 1.12 1.90 62.43 0.86 55.56 64.71 67.79 1.12 1.92 64.21 0.86 56.87 65.87 68.97 1.13 1.94 66.04 0.87 58.20 66.68 69.80 1.13 1.96 67.91 0.89 59.54 67.18 70.30 1.14 1.98 69.82 0.90 60.89 67.67 70.80 1.15 2.00 71.78 0.91 62.24 68.17 71.31 1.15 2.02 73.78 0.93 63.61 68.66 71.81 1.16 2.04 75.82 0.94 64.99 69.16 72.31 1.17 2.06 77.91 0.95 66.38 69.65 72.82 1.17 2.08 80.05 0.97 67.78 70.15 73.32 1.18 2.10 82.24 0.98 69.18 70.65 73.82 1.19 2.12 84.47 1.00 70.60 70.79 73.97 1.20 2.14 86.75 1.02 72.02 70.93 74.11 1.20 2.16 89.09 1.03 73.44 71.08 74.27 1.21 2.18 91.47 1.05 74.86 71.23 74.43 1.22 2.20 93.91 1.07 76.29 71.39 74.60 1.23 2.22 96.40 1.09 77.71 71.55 74.76 1.24 2.24 98.94 1.10 79.15 71.71 74.92 1.25 2.26 101.54 1.12 80.58 71.87 75.09 1.26 2.28 104.19 1.14 82.02 72.03 75.25 1.27 2.30 106.90 1.16 83.46 72.18 75.41 1.28 2.32 109.66 1.17 84.91 72.34 75.58 1.29 2.34 112.49 1.19 86.36 72.50 75.74 1.30 2.36 115.37 1.21 87.81 72.66 75.90 1.31
Page A - 34

AfriDev Consultants Pty Ltd 2005
DWAF Report No. RDM X100-01-CON-COMPR2-0604 Komati Catchment Ecological Water Requirements Study – Quantity Report
Flow depth (m)
Discharge (m3/s)
Av. flow depth (m)
Area (m2)
Width (m)
Perimeter (m)
Av. velocity (m/s)
2.38 118.31 1.23 89.26 72.82 76.07 1.33 2.40 121.32 1.24 90.72 72.97 76.23 1.34 2.42 124.38 1.26 92.18 73.13 76.39 1.35 2.44 127.51 1.28 93.65 73.28 76.54 1.36 2.46 130.71 1.30 95.11 73.40 76.68 1.37 2.48 133.96 1.31 96.58 73.53 76.81 1.39 2.50 137.29 1.33 98.06 73.66 76.94 1.40 2.26 101.54 1.12 80.58 71.87 75.09 1.26 2.28 104.19 1.14 82.02 72.03 75.25 1.27 2.30 106.90 1.16 83.46 72.18 75.41 1.28 2.32 109.66 1.17 84.91 72.34 75.58 1.29 2.34 112.49 1.19 86.36 72.50 75.74 1.30 2.36 115.37 1.21 87.81 72.66 75.90 1.31 2.38 118.31 1.23 89.26 72.82 76.07 1.33 2.40 121.32 1.24 90.72 72.97 76.23 1.34 2.42 124.38 1.26 92.18 73.13 76.39 1.35 2.44 127.51 1.28 93.65 73.28 76.54 1.36 2.46 130.71 1.30 95.11 73.40 76.68 1.37 2.48 133.96 1.31 96.58 73.53 76.81 1.39 2.50 137.29 1.33 98.06 73.66 76.94 1.40
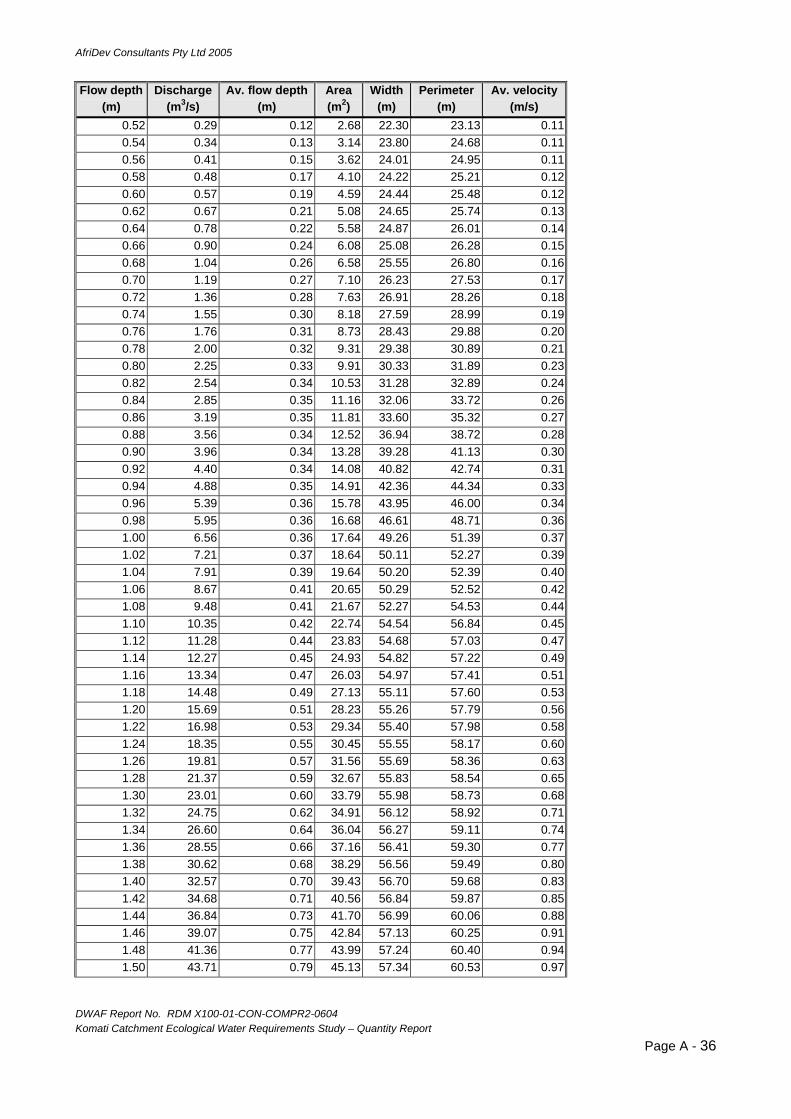
Table Tabulated hydraulic fo R Site M1A (upstream of rapid) 13 data r EWFlow depth Discharge Av. flow depth
(m) Area Width Perimeter Av. velocity
(m3(m) /s) (m2) (m) (m) (m/s) 0.00 0.000 0.00 0.00 0.00 0.00 0.00 0.02 0.000 0.01 0.02 1.58 1.59 0.00 0.04 0.000 0.03 0.05 1.75 1.79 0.00 0.06 0.000 0.05 0.09 1.77 1.83 0.00 0.08 0.000 0.07 0.12 1.78 1.87 0.00 0.10 0.000 0.09 0.16 1.80 1.92 0.00 0.12 0.000 0.11 0.19 1.82 1.96 0.00 0.14 0.001 0.13 0.23 1.84 2.01 0.00 0.16 0.001 0.14 0.27 1.85 2.05 0.00 0.18 0.002 0.16 0.30 1.87 2.09 0.01 0.20 0.003 0.18 0.34 1.89 2.14 0.01 0.22 0.005 0.20 0.38 1.91 2.18 0.01 0.24 0.007 0.18 0.42 2.30 2.61 0.02 0.26 0.010 0.17 0.47 2.77 3.10 0.02 0.28 0.015 0.16 0.53 3.23 3.60 0.03 0.30 0.021 0.16 0.60 3.69 4.09 0.03 0.32 0.028 0.16 0.68 4.16 4.58 0.04 0.34 0.038 0.15 0.77 5.01 5.46 0.05 0.36 0.049 0.14 0.88 6.11 6.60 0.06 0.38 0.064 0.14 1.01 7.07 7.59 0.06 0.40 0.082 0.15 1.16 7.80 8.37 0.07 0.42 0.10 0.16 1.33 8.54 9.15 0.08 0.44 0.13 0.16 1.50 9.27 9.92 0.09 0.46 0.16 0.16 1.70 10.82 11.51 0.09 0.48 0.20 0.14 1.95 14.15 14.89 0.10 0.50 0.24 0.12 2.27 18.29 19.07 0.10
Page A - 35
AfriDev Consultants Pty Ltd 2005
DWAF Report No. RDM X100-01-CON-COMPR2-0604 Komati Catchment Ecological Water Requirements Study – Quantity Report
Flow depth (m)
Discharge (m3/s)
Av. flow depth (m)
Area (m2)
Width (m)
Perimeter (m)
Av. velocity (m/s)
0.52 0.29 0.12 2.68 22.30 23.13 0.11 0.54 0.34 0.13 3.14 23.80 24.68 0.11 0.56 0.41 0.15 3.62 24.01 24.95 0.11 0.58 0.48 0.17 4.10 24.22 25.21 0.12 0.60 0.57 0.19 4.59 24.44 25.48 0.12 0.62 0.67 0.21 5.08 24.65 25.74 0.13 0.64 0.78 0.22 5.58 24.87 26.01 0.14 0.66 0.90 0.24 6.08 25.08 26.28 0.15 0.68 1.04 0.26 6.58 25.55 26.80 0.16 0.70 1.19 0.27 7.10 26.23 27.53 0.17 0.72 1.36 0.28 7.63 26.91 28.26 0.18 0.74 1.55 0.30 8.18 27.59 28.99 0.19 0.76 1.76 0.31 8.73 28.43 29.88 0.20 0.78 2.00 0.32 9.31 29.38 30.89 0.21 0.80 2.25 0.33 9.91 30.33 31.89 0.23 0.82 2.54 0.34 10.53 31.28 32.89 0.24 0.84 2.85 0.35 11.16 32.06 33.72 0.26 0.86 3.19 0.35 11.81 33.60 35.32 0.27 0.88 3.56 0.34 12.52 36.94 38.72 0.28 0.90 3.96 0.34 13.28 39.28 41.13 0.30 0.92 4.40 0.34 14.08 40.82 42.74 0.31 0.94 4.88 0.35 14.91 42.36 44.34 0.33 0.96 5.39 0.36 15.78 43.95 46.00 0.34 0.98 5.95 0.36 16.68 46.61 48.71 0.36 1.00 6.56 0.36 17.64 49.26 51.39 0.37 1.02 7.21 0.37 18.64 50.11 52.27 0.39 1.04 7.91 0.39 19.64 50.20 52.39 0.40 1.06 8.67 0.41 20.65 50.29 52.52 0.42 1.08 9.48 0.41 21.67 52.27 54.53 0.44 1.10 10.35 0.42 22.74 54.54 56.84 0.45 1.12 11.28 0.44 23.83 54.68 57.03 0.47 1.14 12.27 0.45 24.93 54.82 57.22 0.49 1.16 13.34 0.47 26.03 54.97 57.41 0.51 1.18 14.48 0.49 27.13 55.11 57.60 0.53 1.20 15.69 0.51 28.23 55.26 57.79 0.56 1.22 16.98 0.53 29.34 55.40 57.98 0.58 1.24 18.35 0.55 30.45 55.55 58.17 0.60 1.26 19.81 0.57 31.56 55.69 58.36 0.63 1.28 21.37 0.59 32.67 55.83 58.54 0.65 1.30 23.01 0.60 33.79 55.98 58.73 0.68 1.32 24.75 0.62 34.91 56.12 58.92 0.71 1.34 26.60 0.64 36.04 56.27 59.11 0.74 1.36 28.55 0.66 37.16 56.41 59.30 0.77 1.38 30.62 0.68 38.29 56.56 59.49 0.80 1.40 32.57 0.70 39.43 56.70 59.68 0.83 1.42 34.68 0.71 40.56 56.84 59.87 0.85 1.44 36.84 0.73 41.70 56.99 60.06 0.88 1.46 39.07 0.75 42.84 57.13 60.25 0.91 1.48 41.36 0.77 43.99 57.24 60.40 0.94 1.50 43.71 0.79 45.13 57.34 60.53 0.97
Page A - 36

AfriDev Consultants Pty Ltd 2005
DWAF Report No. RDM X100-01-CON-COMPR2-0604 Komati Catchment Ecological Water Requirements Study – Quantity Report
Flow depth (m)
Discharge (m3/s)
Av. flow depth (m)
Area (m2)
Width (m)
Perimeter Av. velocity (m) (m/s)
1.52 46.12 0.81 46.28 57.43 60.65 1.00 1.54 48.59 0.82 47.43 57.53 60.78 1.02 1.56 51.12 0.84 48.58 57.62 60.90 1.05 1.58 53.71 0.86 49.73 57.72 61.03 1.08 1.60 56.37 0.88 50.89 57.81 61.15 1.11 1.62 59.08 0.90 52.05 57.91 61.28 1.14 1.64 61.85 0.92 53.20 58.00 61.41 1.16 1.66 64.67 0.94 54.37 58.07 61.50 1.19 1.68 67.56 0.96 55.53 58.11 61.56 1.22 1.70 70.51 0.97 56.69 58.16 61.62 1.24 1.72 73.51 0.99 57.85 58.20 61.67 1.27 1.74 76.58 1.01 59.02 58.24 61.73 1.30 1.76 79.70 1.03 60.18 58.28 61.79 1.32 1.78 82.88 1.05 61.35 58.32 61.85 1.35 1.80 86.12 1.07 62.52 58.36 61.91 1.38 1.82 89.42 1.09 63.68 58.40 61.96 1.40 1.84 92.77 1.11 64.85 58.44 62.02 1.43 1.86 96.18 1.13 66.02 58.49 62.08 1.46 1.88 99.65 1.15 67.19 58.53 62.14 1.48 1.90 103.18 1.17 68.36 58.57 62.20 1.51 1.92 106.76 1.19 69.53 58.61 62.25 1.54 1.94 110.40 1.21 70.71 58.65 62.31 1.56 1.96 114.10 1.22 71.88 58.69 62.37 1.59 1.98 117.85 1.24 73.05 58.73 62.43 1.61 2.00 121.67 1.26 74.23 58.78 62.49 1.64 2.02 125.53 1.28 75.41 58.82 62.54 1.66 2.04 129.46 1.30 76.58 58.86 62.60 1.69 2.06 133.44 1.32 77.76 58.90 62.66 1.72 2.08 137.48 1.34 78.94 58.94 62.72 1.74 2.10 141.57 1.36 80.12 58.98 62.77 1.77 2.12 145.72 1.38 81.30 59.02 62.83 1.79 2.14 149.92 1.40 82.48 59.07 62.89 1.82 2.16 154.18 1.42 83.66 59.11 62.95 1.84 2.18 158.50 1.43 84.84 59.15 63.01 1.87 2.20 162.87 1.45 86.03 59.19 63.06 1.89 2.22 167.30 1.47 87.21 59.23 63.12 1.92 2.24 171.78 1.49 88.40 59.27 63.18 1.94 2.26 176.32 1.51 89.58 59.31 63.24 1.97 2.28 180.92 1.53 90.77 59.36 63.30 1.99 2.30 185.56 1.55 91.96 59.40 63.35 2.02 2.32 190.27 1.57 93.14 59.44 63.41 2.04 2.34 195.03 1.59 94.33 59.48 63.47 2.07 2.36 199.84 1.60 95.52 59.52 63.53 2.09 2.38 204.71 1.62 96.71 59.56 63.59 2.12 2.40 209.63 1.64 97.91 59.60 63.64 2.14 2.42 214.61 1.66 99.10 59.65 63.70 2.17 2.44 219.64 1.68 100.29 59.69 63.76 2.19 2.46 224.73 1.70 101.49 59.73 63.82 2.21 2.48 229.87 1.72 102.68 59.77 63.88 2.24 2.50 235.06 1.74 103.88 59.81 63.93 2.26
Page A - 37

AfriDev Consultants Pty Ltd 2005
DWAF Report No. RDM X100-01-CON-COMPR2-0604 Komati Catchment Ecological Water Requirements Study – Quantity Report
Flow depth (m)
Discharge (m3/s)
Av. flow depth (m)
Area (m2)
Width (m)
Perimeter (m)
Av. velocity (m/s)
2.52 240.31 1.76 105.07 59.85 63.99 2.29 2.54 245.62 1.77 106.27 59.89 64.05 2.31 2.56 250.97 1.79 107.47 59.93 64.11 2.34 2.58 256.39 1.81 108.67 59.98 64.17 2.36 2.60 261.85 1.83 109.87 60.02 64.22 2.38 2.62 267.37 1.85 111.07 60.06 64.28 2.41 2.64 272.94 1.87 112.27 60.10 64.34 2.43 2.66 278.57 1.89 113.47 60.15 64.40 2.45 2.68 284.25 1.90 114.68 60.20 64.47 2.48 2.70 289.98 1.92 115.88 60.26 64.55 2.50 2.72 295.77 1.94 117.09 60.32 64.62 2.53 2.74 301.61 1.96 118.29 60.38 64.69 2.55 2.76 307.50 1.98 119.50 60.44 64.77 2.57 2.78 313.45 2.00 120.71 60.50 64.84 2.60 2.80 319.45 2.01 121.92 60.56 64.92 2.62 2.82 325.50 2.03 123.13 60.62 64.99 2.64 2.84 331.61 2.05 124.35 60.68 65.06 2.67 2.86 337.77 2.07 125.56 60.74 65.14 2.69 2.88 343.98 2.09 126.78 60.80 65.21 2.71 2.90 350.25 2.10 127.99 60.86 65.28 2.74 2.92 356.56 2.12 129.21 60.92 65.36 2.76 2.94 362.93 2.14 130.43 60.98 65.43 2.78 2.96 369.36 2.16 131.65 61.04 65.50 2.81 2.98 375.83 2.17 132.87 61.11 65.58 2.83 3.00 382.36 2.19 134.09 61.21 65.69 2.85 2.52 240.31 1.76 105.07 59.85 63.99 2.29 2.54 245.62 1.77 106.27 59.89 64.05 2.31 2.56 250.97 1.79 107.47 59.93 64.11 2.34 2.58 256.39 1.81 108.67 59.98 64.17 2.36 2.60 261.85 1.83 109.87 60.02 64.22 2.38 2.62 267.37 1.85 111.07 60.06 64.28 2.41 2.64 272.94 1.87 112.27 60.10 64.34 2.43 2.66 278.57 1.89 113.47 60.15 64.40 2.45 2.68 284.25 1.90 114.68 60.20 64.47 2.48 2.70 289.98 1.92 115.88 60.26 64.55 2.50 2.72 295.77 1.94 117.09 60.32 64.62 2.53 2.74 301.61 1.96 118.29 60.38 64.69 2.55 2.76 307.50 1.98 119.50 60.44 64.77 2.57 2.78 313.45 2.00 120.71 60.50 64.84 2.60 2.80 319.45 2.01 121.92 60.56 64.92 2.62 2.82 325.50 2.03 123.13 60.62 64.99 2.64 2.84 331.61 2.05 124.35 60.68 65.06 2.67 2.86 337.77 2.07 125.56 60.74 65.14 2.69 2.88 343.98 2.09 126.78 60.80 65.21 2.71 2.90 350.25 2.10 127.99 60.86 65.28 2.74 2.92 356.56 2.12 129.21 60.92 65.36 2.76 2.94 362.93 2.14 130.43 60.98 65.43 2.78 2.96 369.36 2.16 131.65 61.04 65.50 2.81 2.98 375.83 2.17 132.87 61.11 65.58 2.83 3.00 382.36 2.19 134.09 61.21 65.69 2.85
Page A - 38
AfriDev Consultants Pty Ltd 2005
D
o. RDM X100-01-CON-COMPR2-0604 K ent Ecological Water Requirements Study – Quantity Report
Page A - 39
WAF Report Nomati Catchm
AfriDev Consultants Pty Ltd 2005
DWAF Report No. RDM X100-01-CON-COMPR2-0604 Komati Catchment Ecological Water Requirements Study – Quantity Report
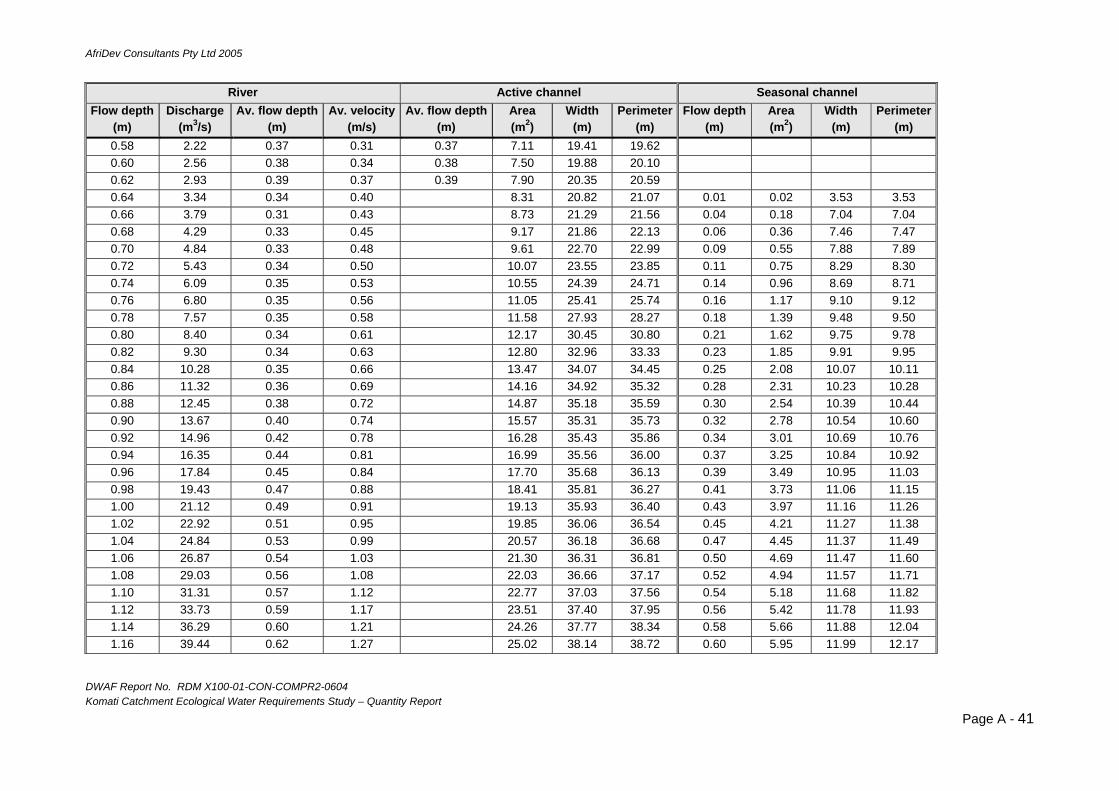
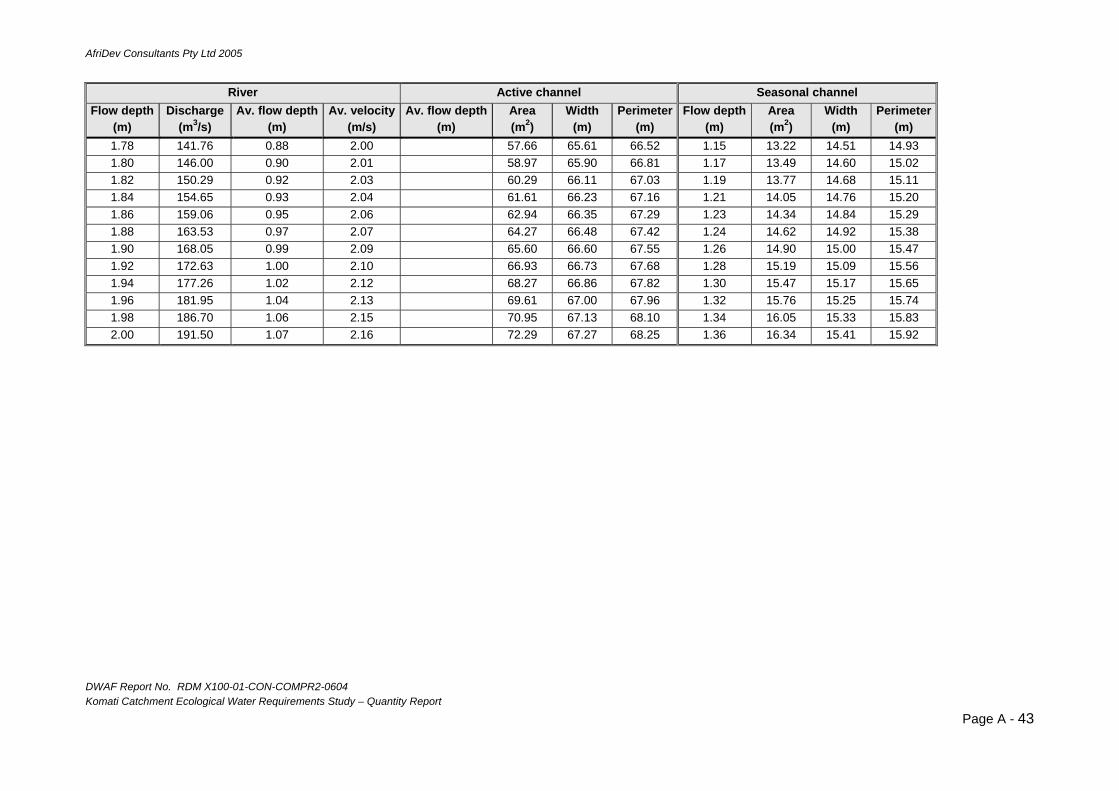
Table 14 Tabulated raulic data for EWR Site M1B (riffl hyd e). R A han S al civer ctive c nel eason hannel
Flo pth w de(m)
Di escharg(m3/s)
Av. fl epth ow d(m)
Av ty. veloci(m/s)
Av. fl epthow d(m)
Area (m2)
Width (m)
Perimeter(m)
Flo pthw de(m)
Area (m2)
Width (m)
Pe errimet(m)
0.00 0.000 0.00 0.00 0.00 0.00 0.00 0.00 0.02 0.000 0.01 0.00 0.01 0.02 2.56 2.57 0.04 0.000 0.02 0.00 0.02 0.11 5.61 5.62 0.06 0.000 0.03 0.00 0.03 0.24 7.10 7.11 0.08 0.001 0.05 0.00 0.05 0.39 7.96 7.98 0.10 0.002 0.07 0.00 0.07 0.55 8.32 8.34 0.12 0.003 0.08 0.00 0.08 0.72 8.67 8.69 0.14 0.006 0.10 0.01 0.10 0.90 9.03 9.05 0.16 0.011 0.12 0.01 0.12 1.08 9.38 9.41 0.18 0.018 0.13 0.01 0.13 1.28 9.73 9.76 0.20 0.027 0.15 0.02 0.15 1.47 10.09 10.12 0.22 0.040 0.16 0.02 0.16 1.68 10.44 10.48 0.24 0.058 0.17 0.03 0.17 1.90 11.21 11.25 0.26 0.081 0.18 0.04 0.18 2.13 12.06 12.11 0.28 0.11 0.18 0.05 0.18 2.38 12.87 12.92 0.30 0.15 0.19 0.06 0.19 2.64 13.60 13.66 0.32 0.19 0.21 0.07 0.21 2.92 13.81 13.87 0.34 0.25 0.23 0.08 0.23 3.19 14.01 14.09 0.36 0.31 0.24 0.09 0.24 3.48 14.22 14.30 0.38 0.39 0.26 0.10 0.26 3.76 14.42 14.52 0.40 0.48 0.28 0.12 0.28 4.05 14.63 14.73 0.42 0.59 0.29 0.13 0.29 4.35 14.83 14.94 0.44 0.71 0.30 0.15 0.30 4.65 15.24 15.37 0.46 0.85 0.31 0.17 0.31 4.96 15.97 16.10 0.48 1.02 0.32 0.19 0.32 5.29 16.69 16.83 0.50 1.20 0.32 0.21 0.32 5.63 17.41 17.57 0.52 1.42 0.33 0.24 0.33 5.98 18.04 18.21 0.54 1.66 0.34 0.26 0.34 6.35 18.50 18.68 0.56 1.92 0.35 0.29 0.35 6.72 18.96 19.15
Page A - 40
AfriDev Consultants Pty Ltd 2005
DWAF Report No. RDM X100-01-CON-COMPR2-0604 Komati Catchment Ecological Water Requirements Study – Quantity Report
River Active channel Seasonal channel Flow depth
(m) Discharge
(m3/s) Av. flow depth
(m) Av. velocity
(m/s) Av. flow depth
(m) Area (m2)
Width (m)
Perimeter(m)
Flow depth(m)
Area (m2)
Width (m)
Perimeter(m)
0.58 2.22 0.37 0.31 0.37 7.11 19.41 19.62 0.60 2.56 0.38 0.34 0.38 7.50 19.88 20.10 0.62 2.93 0.39 0.37 0.39 7.90 20.35 20.59 0.64 3.34 0.34 0.40 8.31 20.82 21.07 0.01 0.02 3.53 3.53 0.66 3.79 0.31 0.43 8.73 21.29 21.56 0.04 0.18 7.04 7.04 0.68 4.29 0.33 0.45 9.17 21.86 22.13 0.06 0.36 7.46 7.47 0.70 4.84 0.33 0.48 9.61 22.70 22.99 0.09 0.55 7.88 7.89 0.72 5.43 0.34 0.50 10.07 23.55 23.85 0.11 0.75 8.29 8.30 0.74 6.09 0.35 0.53 10.55 24.39 24.71 0.14 0.96 8.69 8.71 0.76 6.80 0.35 0.56 11.05 25.41 25.74 0.16 1.17 9.10 9.12 0.78 7.57 0.35 0.58 11.58 27.93 28.27 0.18 1.39 9.48 9.50 0.80 8.40 0.34 0.61 12.17 30.45 30.80 0.21 1.62 9.75 9.78 0.82 9.30 0.34 0.63 12.80 32.96 33.33 0.23 1.85 9.91 9.95 0.84 10.28 0.35 0.66 13.47 34.07 34.45 0.25 2.08 10.07 10.11 0.86 11.32 0.36 0.69 14.16 34.92 35.32 0.28 2.31 10.23 10.28 0.88 12.45 0.38 0.72 14.87 35.18 35.59 0.30 2.54 10.39 10.44 0.90 13.67 0.40 0.74 15.57 35.31 35.73 0.32 2.78 10.54 10.60 0.92 14.96 0.42 0.78 16.28 35.43 35.86 0.34 3.01 10.69 10.76 0.94 16.35 0.44 0.81 16.99 35.56 36.00 0.37 3.25 10.84 10.92 0.96 17.84 0.45 0.84 17.70 35.68 36.13 0.39 3.49 10.95 11.03 0.98 19.43 0.47 0.88 18.41 35.81 36.27 0.41 3.73 11.06 11.15 1.00 21.12 0.49 0.91 19.13 35.93 36.40 0.43 3.97 11.16 11.26 1.02 22.92 0.51 0.95 19.85 36.06 36.54 0.45 4.21 11.27 11.38 1.04 24.84 0.53 0.99 20.57 36.18 36.68 0.47 4.45 11.37 11.49 1.06 26.87 0.54 1.03 21.30 36.31 36.81 0.50 4.69 11.47 11.60 1.08 29.03 0.56 1.08 22.03 36.66 37.17 0.52 4.94 11.57 11.71 1.10 31.31 0.57 1.12 22.77 37.03 37.56 0.54 5.18 11.68 11.82 1.12 33.73 0.59 1.17 23.51 37.40 37.95 0.56 5.42 11.78 11.93 1.14 36.29 0.60 1.21 24.26 37.77 38.34 0.58 5.66 11.88 12.04 1.16 39.44 0.62 1.27 25.02 38.14 38.72 0.60 5.95 11.99 12.17
Page A - 41

AfriDev Consultants Pty Ltd 2005
DWAF Report No. RDM X100-01-CON-COMPR2-0604 Komati Catchment Ecological Water Requirements Study – Quantity Report
River Active channel Seasonal channel Flow depth
(m) Discharge
(m3/s) Av. flow depth
(m) Av. velocity
(m/s) Av. flow depth
(m) Area (m2)
Width (m)
Perimeter(m)
Flow depth(m)
Area (m2)
Width (m)
Perimeter(m)
1.18 41.83 0.63 1.31 25.79 38.51 39.11 0.62 6.15 12.07 12.26 1.20 44.28 0.64 1.35 26.56 38.89 39.50 0.64 6.35 12.16 12.34 1.22 46.79 0.66 1.38 27.34 39.26 39.88 0.65 6.55 12.23 12.43 1.24 49.36 0.67 1.42 28.13 39.63 40.27 0.67 6.74 12.31 12.51 1.26 52.00 0.68 1.45 28.93 40.10 40.76 0.68 6.93 12.39 12.60 1.28 54.70 0.69 1.48 29.74 40.82 41.49 0.70 7.12 12.46 12.68 1.30 57.46 0.70 1.52 30.56 41.53 42.22 0.71 7.31 12.53 12.75 1.32 60.29 0.71 1.55 31.40 42.25 42.95 0.73 7.49 12.60 12.83 1.34 63.17 0.72 1.58 32.25 42.96 43.67 0.74 7.67 12.67 12.91 1.36 66.12 0.73 1.61 33.12 43.67 44.40 0.76 7.85 12.74 12.98 1.38 69.13 0.73 1.64 34.00 44.39 45.13 0.77 8.03 12.81 13.06 1.40 72.20 0.74 1.68 34.89 45.10 45.86 0.78 8.20 12.88 13.13 1.42 75.32 0.68 1.70 35.87 51.78 52.55 0.80 8.40 12.95 13.21 1.44 78.51 0.69 1.72 36.92 52.72 53.50 0.82 8.66 13.05 13.31 1.46 81.76 0.70 1.74 37.98 53.65 54.45 0.84 8.92 13.14 13.42 1.48 85.07 0.71 1.76 39.06 54.59 55.40 0.86 9.18 13.24 13.52 1.50 88.44 0.72 1.78 40.17 55.80 56.62 0.88 9.44 13.33 13.63 1.52 91.87 0.72 1.80 41.30 57.11 57.95 0.90 9.70 13.43 13.73 1.54 95.36 0.73 1.82 42.45 58.43 59.27 0.92 9.96 13.51 13.82 1.56 98.90 0.73 1.84 43.63 59.75 60.60 0.94 10.23 13.60 13.92 1.58 102.51 0.74 1.85 44.84 61.26 62.12 0.96 10.49 13.68 14.01 1.60 106.17 0.74 1.87 46.08 62.78 63.64 0.98 10.76 13.77 14.10 1.62 109.89 0.76 1.88 47.35 63.26 64.13 1.00 11.03 13.85 14.20 1.64 113.67 0.77 1.90 48.61 63.55 64.43 1.01 11.30 13.93 14.29 1.66 117.51 0.79 1.91 49.89 63.85 64.72 1.03 11.57 14.02 14.38 1.68 121.41 0.81 1.93 51.17 64.14 65.02 1.05 11.84 14.10 14.47 1.70 125.36 0.82 1.94 52.45 64.43 65.32 1.07 12.11 14.18 14.56 1.72 129.38 0.84 1.96 53.74 64.73 65.62 1.09 12.39 14.27 14.66 1.74 133.45 0.85 1.97 55.04 65.02 65.92 1.11 12.66 14.35 14.75 1.76 137.57 0.87 1.99 56.35 65.31 66.22 1.13 12.94 14.43 14.84
Page A - 42
AfriDev Consultants Pty Ltd 2005
DKom
WAF Report No. RDM X100-01-CON-COMPR2-0604 ati Catchment Ecological Water Requirements Study – Quantity Report
Page A - 43
River Active channel Seasonal channel Flow depth
(m) Discharge
(m3/s) Av. flow depth
(m) Av. velocity
(m/s) Av. flow depth
(m) Area (m2)
Width (m)
Perimeter(m)
Flow depth(m)
Area (m2)
Width (m)
Perimeter(m)
1.78 141.76 0.88 2.00 57.66 65.61 66.52 1.15 13.22 14.51 14.93 1.80 146.00 0.90 2.01 58.97 65.90 66.81 1.17 13.49 14.60 15.02 1.82 150.29 0.92 2.03 60.29 66.11 67.03 1.19 13.77 14.68 15.11 1.84 154.65 0.93 2.04 61.61 66.23 67.16 1.21 14.05 14.76 15.20 1.86 159.06 0.95 2.06 62.94 66.35 67.29 1.23 14.34 14.84 15.29 1.88 163.53 0.97 2.07 64.27 66.48 67.42 1.24 14.62 14.92 15.38 1.90 168.05 0.99 2.09 65.60 66.60 67.55 1.26 14.90 15.00 15.47 1.92 172.63 1.00 2.10 66.93 66.73 67.68 1.28 15.19 15.09 15.56 1.94 177.26 1.02 2.12 68.27 66.86 67.82 1.30 15.47 15.17 15.65 1.96 181.95 1.04 2.13 69.61 67.00 67.96 1.32 15.76 15.25 15.74 1.98 186.70 1.06 2.15 70.95 67.13 68.10 1.34 16.05 15.33 15.83 2.00 191.50 1.07 2.16 72.29 67.27 68.25 1.36 16.34 15.41 15.92

AfriDev Consultants Pty Ltd 2005
DWAF Report No. RDM X100-01-CON-COMPR2-0604 Komati Catchment Ecological Water Requirements Study – Quantity Report
Table 15 Tabulated hydraulic data for EWR Site K3 (run). Flow depth
(m) Discharge
(m3/s) Av. flow depth
(m) Area (m2)
Width (m)
Perimeter (m)
Av. velocity (m/s)
0.00 0.000 0.00 0.00 0.00 0.00 0.00 0.02 0.000 0.01 0.00 0.36 0.36 0.00 0.04 0.000 0.02 0.01 0.71 0.72 0.00 0.06 0.000 0.02 0.04 1.85 1.86 0.00 0.08 0.001 0.03 0.08 2.83 2.86 0.01 0.10 0.002 0.03 0.17 5.97 6.01 0.01 0.12 0.004 0.04 0.31 8.09 8.16 0.01 0.14 0.008 0.05 0.49 9.63 9.74 0.02 0.16 0.015 0.06 0.69 10.71 10.86 0.02 0.18 0.024 0.07 0.93 13.60 13.80 0.03 0.20 0.039 0.08 1.22 15.54 15.83 0.03 0.22 0.059 0.09 1.55 17.58 17.95 0.04 0.24 0.087 0.10 1.93 20.26 20.72 0.05 0.26 0.123 0.11 2.35 22.17 22.72 0.05 0.28 0.17 0.12 2.82 24.54 25.20 0.06 0.30 0.23 0.12 3.34 26.90 27.64 0.07 0.32 0.31 0.14 3.89 27.93 28.74 0.08 0.34 0.40 0.16 4.45 28.45 29.31 0.09 0.36 0.52 0.17 5.03 28.97 29.89 0.10 0.38 0.66 0.19 5.61 29.49 30.47 0.12 0.40 0.82 0.21 6.21 30.01 31.05 0.13 0.42 1.02 0.22 6.81 30.70 31.80 0.15 0.44 1.25 0.24 7.43 31.54 32.69 0.17 0.46 1.53 0.25 8.07 32.35 33.55 0.19 0.48 1.84 0.27 8.73 32.84 34.08 0.21 0.50 2.20 0.28 9.39 33.33 34.61 0.23 0.52 2.62 0.30 10.06 33.72 35.04 0.26 0.54 3.09 0.31 10.74 34.12 35.47 0.29 0.56 3.63 0.33 11.42 34.49 35.87 0.32 0.58 4.30 0.35 12.12 34.82 36.22 0.35 0.60 4.57 0.37 12.81 35.10 36.52 0.36 0.62 4.84 0.38 13.52 35.30 36.73 0.36 0.64 5.13 0.40 14.23 35.45 36.89 0.36 0.66 5.43 0.42 14.94 35.60 37.04 0.36 0.68 5.74 0.44 15.65 35.74 37.19 0.37 0.70 6.06 0.46 16.37 35.88 37.33 0.37 0.72 6.39 0.47 17.09 36.02 37.47 0.37 0.74 6.73 0.49 17.81 36.15 37.62 0.38 0.76 7.08 0.51 18.53 36.29 37.76 0.38 0.78 7.44 0.53 19.26 36.43 37.90 0.39 0.80 7.82 0.55 19.99 36.56 38.04 0.39 0.82 8.20 0.56 20.72 36.70 38.19 0.40 0.84 8.60 0.58 21.46 36.84 38.33 0.40 0.86 9.00 0.60 22.19 36.98 38.47 0.41 0.88 9.42 0.62 22.94 37.09 38.59 0.41 0.90 9.85 0.64 23.68 37.17 38.69 0.42 0.92 10.29 0.66 24.42 37.26 38.79 0.42 0.94 10.75 0.67 25.17 37.34 38.88 0.43
Page A - 44
AfriDev Consultants Pty Ltd 2005
DWAF Report No. RDM X100-01-CON-COMPR2-0604 Komati Catchment Ecological Water Requirements Study – Quantity Report
Flow depth (m)
Discharge (m3/s)
Av. flow depth (m)
Area (m2)
Width (m)
Perimeter (m)
Av. velocity (m/s)
0.96 11.21 0.69 25.92 37.43 38.98 0.43 0.98 11.69 0.71 26.67 37.50 39.06 0.44 1.00 12.18 0.73 27.42 37.57 39.14 0.44 1.02 12.68 0.75 28.17 37.64 39.22 0.45 1.04 13.20 0.77 28.92 37.71 39.31 0.46 1.06 13.72 0.79 29.68 37.78 39.39 0.46 1.08 14.26 0.80 30.43 37.85 39.47 0.47 1.10 14.82 0.82 31.19 37.92 39.55 0.47 1.12 15.38 0.84 31.95 37.99 39.63 0.48 1.14 15.96 0.86 32.71 38.06 39.71 0.49 1.16 16.55 0.88 33.47 38.13 39.80 0.49 1.18 17.15 0.90 34.24 38.20 39.88 0.50 1.20 17.77 0.91 35.00 38.27 39.96 0.51 1.22 18.40 0.93 35.77 38.34 40.04 0.51 1.24 19.04 0.95 36.53 38.41 40.12 0.52 1.26 19.70 0.97 37.30 38.48 40.20 0.53 1.28 20.37 0.99 38.07 38.55 40.29 0.54 1.30 21.06 1.01 38.85 38.62 40.37 0.54 1.32 21.75 1.02 39.62 38.68 40.44 0.55 1.34 22.47 1.04 40.39 38.73 40.50 0.56 1.36 23.19 1.06 41.17 38.79 40.57 0.56 1.38 23.93 1.08 41.94 38.84 40.64 0.57 1.40 24.69 1.10 42.72 38.90 40.71 0.58 1.42 25.46 1.12 43.50 38.95 40.78 0.59 1.44 26.24 1.14 44.28 39.01 40.85 0.59 1.46 27.04 1.15 45.06 39.06 40.92 0.60 1.48 27.85 1.17 45.84 39.12 40.99 0.61 1.50 28.67 1.19 46.62 39.18 41.05 0.61 1.52 29.52 1.21 47.41 39.23 41.12 0.62 1.54 30.37 1.23 48.19 39.29 41.19 0.63 1.56 31.24 1.24 48.98 39.34 41.26 0.64 1.58 32.13 1.26 49.77 39.40 41.33 0.65 1.60 33.03 1.28 50.56 39.45 41.40 0.65 1.62 33.95 1.30 51.35 39.51 41.47 0.66 1.64 34.88 1.32 52.14 39.56 41.53 0.67 1.66 35.82 1.34 52.93 39.62 41.60 0.68 1.68 36.79 1.35 53.72 39.67 41.67 0.68 1.70 37.76 1.37 54.52 39.73 41.74 0.69 1.72 38.76 1.39 55.31 39.78 41.81 0.70 1.74 39.77 1.41 56.11 39.83 41.87 0.71 1.76 40.79 1.43 56.90 39.87 41.93 0.72 1.78 41.83 1.45 57.70 39.90 41.98 0.72 1.80 42.89 1.46 58.50 39.93 42.03 0.73 1.82 43.96 1.48 59.30 39.96 42.08 0.74 1.84 45.05 1.50 60.10 39.99 42.13 0.75 1.86 46.16 1.52 60.90 40.02 42.18 0.76 1.88 47.28 1.54 61.70 40.05 42.23 0.77 1.90 48.41 1.56 62.50 40.09 42.28 0.77 1.92 49.57 1.58 63.30 40.12 42.33 0.78 1.94 50.74 1.60 64.11 40.15 42.39 0.79
Page A - 45

AfriDev Consultants Pty Ltd 2005
DWAF Report No. RDM X100-01-CON-COMPR2-0604 Komati Catchment Ecological Water Requirements Study – Quantity Report
Flow depth (m)
Discharge (m3/s)
Av. flow depth (m)
Area (m2)
Width (m)
Perimeter (m)
Av. velocity (m/s)
1.96 51.93 1.62 64.91 40.18 42.44 0.80 1.98 53.13 1.63 65.71 40.21 42.49 0.81 2.00 54.35 1.65 66.52 40.24 42.54 0.82 2.02 55.59 1.67 67.32 40.27 42.59 0.83 2.04 56.84 1.69 68.13 40.30 42.64 0.83 2.06 58.12 1.71 68.93 40.33 42.69 0.84 2.08 59.40 1.73 69.74 40.36 42.74 0.85 2.10 60.71 1.75 70.55 40.39 42.79 0.86 2.12 62.03 1.77 71.36 40.42 42.84 0.87 2.14 63.37 1.78 72.16 40.45 42.89 0.88 2.16 64.73 1.80 72.97 40.48 42.94 0.89 2.18 66.11 1.82 73.78 40.51 42.99 0.90 2.20 67.50 1.84 74.59 40.54 43.04 0.90 2.22 68.91 1.86 75.41 40.57 43.09 0.91 2.24 70.34 1.88 76.22 40.61 43.15 0.92 2.26 71.79 1.89 77.03 40.65 43.20 0.93 2.28 73.25 1.91 77.84 40.69 43.26 0.94 2.30 74.74 1.93 78.66 40.73 43.31 0.95 2.32 76.24 1.95 79.47 40.76 43.37 0.96 2.34 77.75 1.97 80.29 40.80 43.42 0.97 2.36 79.29 1.99 81.10 40.84 43.48 0.98 2.38 80.85 2.00 81.92 40.88 43.53 0.99 2.40 82.42 2.01 82.74 41.19 43.87 1.00 2.42 84.01 2.00 83.57 41.79 44.49 1.01 2.44 85.62 1.99 84.41 42.39 45.11 1.01 2.46 87.25 1.98 85.27 42.99 45.73 1.02 2.48 88.90 1.98 86.13 43.59 46.35 1.03 2.50 90.57 1.97 87.01 44.19 46.97 1.04 2.52 92.25 1.96 87.90 44.79 47.59 1.05 2.54 93.96 1.96 88.80 45.39 48.21 1.06 2.56 95.68 1.95 89.72 45.99 48.83 1.07 2.58 97.42 1.95 90.64 46.58 49.45 1.07 2.60 99.18 1.94 91.58 47.18 50.07 1.08 2.62 100.96 1.94 92.53 47.78 50.68 1.09 2.64 102.76 1.93 93.49 48.38 51.30 1.10 2.66 104.58 1.94 94.46 48.75 51.70 1.11 2.68 106.42 1.83 95.46 52.30 55.27 1.11 2.70 108.28 1.72 96.56 56.27 59.27 1.12 2.72 110.16 1.71 97.69 57.27 60.29 1.13 2.74 112.05 1.70 98.85 58.26 61.32 1.13 2.76 113.97 1.71 100.02 58.56 61.64 1.14 2.78 115.91 1.72 101.19 58.85 61.97 1.15 2.80 117.87 1.73 102.37 59.15 62.29 1.15 2.82 119.84 1.74 103.56 59.44 62.62 1.16 2.84 121.84 1.75 104.75 59.74 62.94 1.16 2.86 123.85 1.76 105.95 60.03 63.27 1.17 2.88 125.89 1.78 107.15 60.32 63.59 1.17 2.90 127.95 1.79 108.36 60.62 63.92 1.18 2.92 130.03 1.80 109.57 60.91 64.24 1.19 2.94 132.12 1.80 110.80 61.48 64.84 1.19
Page A - 46

AfriDev Consultants Pty Ltd 2005
DWAF Report No. RDM X100-01-CON-COMPR2-0604 Komati Catchment Ecological Water Requirements Study – Quantity Report
Flow depth (m)
Discharge (m3/s)
Av. flow depth (m)
Area (m2)
Width (m)
Perimeter (m)
Av. velocity (m/s)
2.96 134.24 1.80 112.03 62.32 65.71 1.20 2.98 136.38 1.80 113.29 63.02 66.44 1.20 3.00 138.54 1.80 114.55 63.60 67.06 1.21 3.02 140.72 1.80 115.83 64.17 67.67 1.21 3.04 142.92 1.80 117.12 65.02 68.56 1.22 3.06 145.14 1.80 118.43 65.88 69.45 1.23 3.08 147.38 1.79 119.76 66.74 70.34 1.23 3.10 149.64 1.79 121.10 67.58 71.22 1.24 3.12 151.93 1.79 122.46 68.40 72.08 1.24 3.14 154.23 1.79 123.84 69.23 72.94 1.25 3.16 156.56 1.77 125.24 70.62 74.38 1.25 3.18 158.91 1.76 126.66 72.02 75.82 1.25 3.20 161.27 1.75 128.12 73.40 77.25 1.26 3.22 163.66 1.73 129.60 74.78 78.66 1.26 3.24 166.08 1.72 131.11 76.15 80.08 1.27 3.26 168.51 1.70 132.65 78.03 82.00 1.27 3.28 170.96 1.68 134.23 80.09 84.10 1.27 3.30 173.44 1.67 135.84 81.12 85.19 1.28 3.32 175.93 1.67 137.48 82.26 86.37 1.28 3.34 178.45 1.67 139.13 83.39 87.56 1.28 3.36 180.99 1.66 140.82 84.83 89.03 1.29 3.38 183.56 1.65 142.53 86.26 90.50 1.29 3.40 186.14 1.60 144.30 89.97 94.24 1.29 3.42 188.75 1.59 146.11 91.61 95.91 1.29 3.44 191.37 1.59 147.96 93.02 97.34 1.29 3.46 194.03 1.59 149.83 94.19 98.54 1.29 3.48 196.70 1.59 151.73 95.51 99.88 1.30 3.50 199.39 1.58 153.66 96.96 101.36 1.30 3.52 202.11 1.57 155.62 99.43 103.85 1.30 3.54 204.85 1.55 157.63 101.90 106.34 1.30 3.56 207.61 1.52 159.71 105.40 109.87 1.30 3.58 210.40 1.51 161.84 107.19 111.68 1.30 3.60 213.20 1.52 163.99 107.96 112.47 1.30 3.62 216.03 1.53 166.16 108.74 113.28 1.30 3.64 218.88 1.54 168.34 109.52 114.07 1.30 3.66 221.76 1.55 170.54 110.28 114.86 1.30 3.68 224.66 1.56 172.75 111.05 115.65 1.30 3.70 227.58 1.56 174.98 111.82 116.44 1.30 3.72 230.52 1.57 177.22 112.58 117.22 1.30 3.74 233.49 1.58 179.48 113.35 118.01 1.30 3.76 236.48 1.57 181.77 115.74 120.42 1.30 3.78 239.49 1.55 184.12 118.91 123.61 1.30 3.80 242.52 1.54 186.52 121.23 125.96 1.30 3.82 245.58 1.51 189.01 125.41 130.16 1.30 3.84 248.67 1.51 191.54 126.68 131.44 1.30 3.86 251.77 1.52 194.08 127.47 132.25 1.30 3.88 254.90 1.54 196.63 127.78 132.57 1.30 3.90 258.05 1.56 199.19 128.09 132.89 1.30 3.92 261.23 1.57 201.76 128.39 133.21 1.29 3.94 264.43 1.58 204.33 128.98 133.81 1.29
Page A - 47
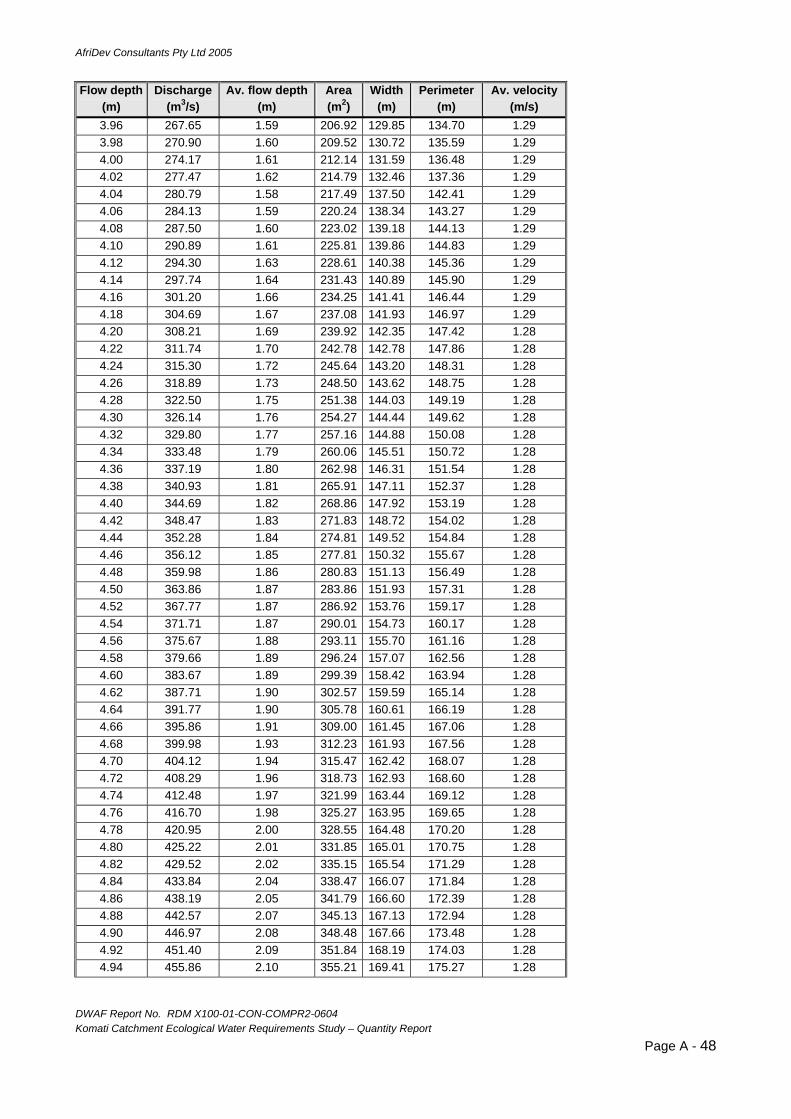
AfriDev Consultants Pty Ltd 2005
DWAF Report No. RDM X100-01-CON-COMPR2-0604 Komati Catchment Ecological Water Requirements Study – Quantity Report
Flow depth (m)
Discharge (m3/s)
Av. flow depth (m)
Area (m2)
Width (m)
Perimeter (m)
Av. velocity (m/s)
3.96 267.65 1.59 206.92 129.85 134.70 1.29 3.98 270.90 1.60 209.52 130.72 135.59 1.29 4.00 274.17 1.61 212.14 131.59 136.48 1.29 4.02 277.47 1.62 214.79 132.46 137.36 1.29 4.04 280.79 1.58 217.49 137.50 142.41 1.29 4.06 284.13 1.59 220.24 138.34 143.27 1.29 4.08 287.50 1.60 223.02 139.18 144.13 1.29 4.10 290.89 1.61 225.81 139.86 144.83 1.29 4.12 294.30 1.63 228.61 140.38 145.36 1.29 4.14 297.74 1.64 231.43 140.89 145.90 1.29 4.16 301.20 1.66 234.25 141.41 146.44 1.29 4.18 304.69 1.67 237.08 141.93 146.97 1.29 4.20 308.21 1.69 239.92 142.35 147.42 1.28 4.22 311.74 1.70 242.78 142.78 147.86 1.28 4.24 315.30 1.72 245.64 143.20 148.31 1.28 4.26 318.89 1.73 248.50 143.62 148.75 1.28 4.28 322.50 1.75 251.38 144.03 149.19 1.28 4.30 326.14 1.76 254.27 144.44 149.62 1.28 4.32 329.80 1.77 257.16 144.88 150.08 1.28 4.34 333.48 1.79 260.06 145.51 150.72 1.28 4.36 337.19 1.80 262.98 146.31 151.54 1.28 4.38 340.93 1.81 265.91 147.11 152.37 1.28 4.40 344.69 1.82 268.86 147.92 153.19 1.28 4.42 348.47 1.83 271.83 148.72 154.02 1.28 4.44 352.28 1.84 274.81 149.52 154.84 1.28 4.46 356.12 1.85 277.81 150.32 155.67 1.28 4.48 359.98 1.86 280.83 151.13 156.49 1.28 4.50 363.86 1.87 283.86 151.93 157.31 1.28 4.52 367.77 1.87 286.92 153.76 159.17 1.28 4.54 371.71 1.87 290.01 154.73 160.17 1.28 4.56 375.67 1.88 293.11 155.70 161.16 1.28 4.58 379.66 1.89 296.24 157.07 162.56 1.28 4.60 383.67 1.89 299.39 158.42 163.94 1.28 4.62 387.71 1.90 302.57 159.59 165.14 1.28 4.64 391.77 1.90 305.78 160.61 166.19 1.28 4.66 395.86 1.91 309.00 161.45 167.06 1.28 4.68 399.98 1.93 312.23 161.93 167.56 1.28 4.70 404.12 1.94 315.47 162.42 168.07 1.28 4.72 408.29 1.96 318.73 162.93 168.60 1.28 4.74 412.48 1.97 321.99 163.44 169.12 1.28 4.76 416.70 1.98 325.27 163.95 169.65 1.28 4.78 420.95 2.00 328.55 164.48 170.20 1.28 4.80 425.22 2.01 331.85 165.01 170.75 1.28 4.82 429.52 2.02 335.15 165.54 171.29 1.28 4.84 433.84 2.04 338.47 166.07 171.84 1.28 4.86 438.19 2.05 341.79 166.60 172.39 1.28 4.88 442.57 2.07 345.13 167.13 172.94 1.28 4.90 446.97 2.08 348.48 167.66 173.48 1.28 4.92 451.40 2.09 351.84 168.19 174.03 1.28 4.94 455.86 2.10 355.21 169.41 175.27 1.28
Page A - 48
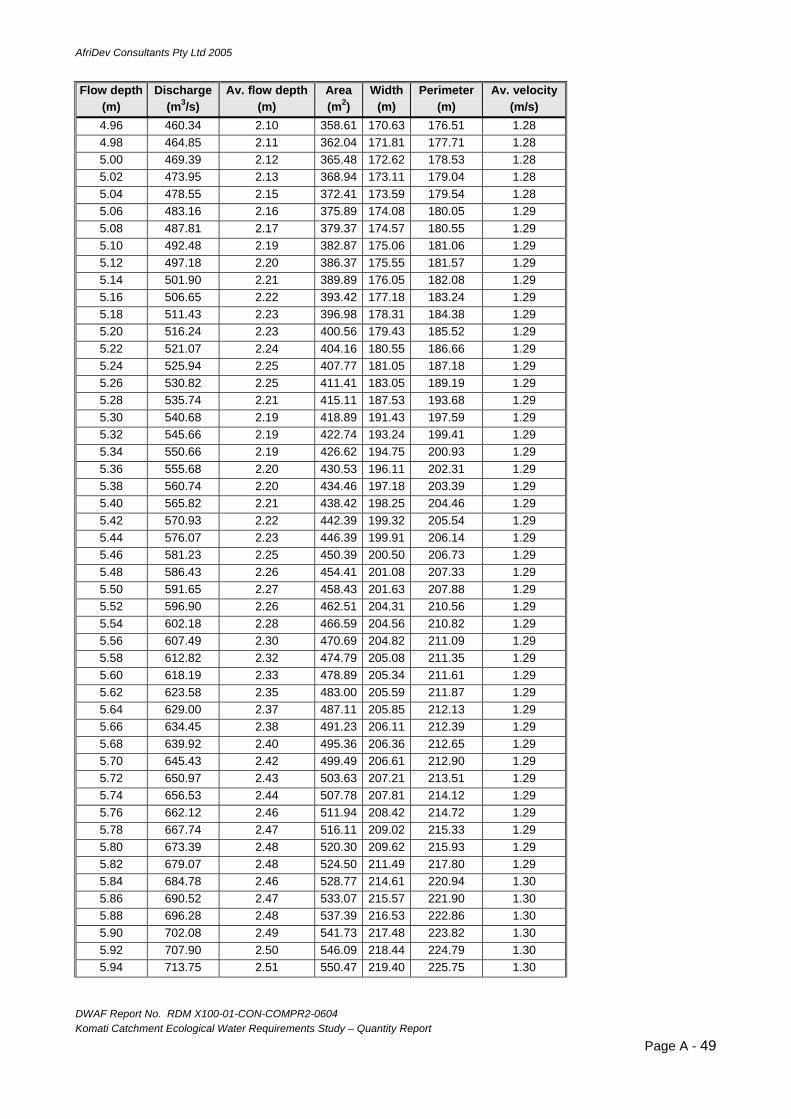
AfriDev Consultants Pty Ltd 2005
DWAF Report No. RDM X100-01-CON-COMPR2-0604 Komati Catchment Ecological Water Requirements Study – Quantity Report
Flow depth (m)
Discharge (m3/s)
Av. flow depth (m)
Area (m2)
Width (m)
Perimeter (m)
Av. velocity (m/s)
4.96 460.34 2.10 358.61 170.63 176.51 1.28 4.98 464.85 2.11 362.04 171.81 177.71 1.28 5.00 469.39 2.12 365.48 172.62 178.53 1.28 5.02 473.95 2.13 368.94 173.11 179.04 1.28 5.04 478.55 2.15 372.41 173.59 179.54 1.28 5.06 483.16 2.16 375.89 174.08 180.05 1.29 5.08 487.81 2.17 379.37 174.57 180.55 1.29 5.10 492.48 2.19 382.87 175.06 181.06 1.29 5.12 497.18 2.20 386.37 175.55 181.57 1.29 5.14 501.90 2.21 389.89 176.05 182.08 1.29 5.16 506.65 2.22 393.42 177.18 183.24 1.29 5.18 511.43 2.23 396.98 178.31 184.38 1.29 5.20 516.24 2.23 400.56 179.43 185.52 1.29 5.22 521.07 2.24 404.16 180.55 186.66 1.29 5.24 525.94 2.25 407.77 181.05 187.18 1.29 5.26 530.82 2.25 411.41 183.05 189.19 1.29 5.28 535.74 2.21 415.11 187.53 193.68 1.29 5.30 540.68 2.19 418.89 191.43 197.59 1.29 5.32 545.66 2.19 422.74 193.24 199.41 1.29 5.34 550.66 2.19 426.62 194.75 200.93 1.29 5.36 555.68 2.20 430.53 196.11 202.31 1.29 5.38 560.74 2.20 434.46 197.18 203.39 1.29 5.40 565.82 2.21 438.42 198.25 204.46 1.29 5.42 570.93 2.22 442.39 199.32 205.54 1.29 5.44 576.07 2.23 446.39 199.91 206.14 1.29 5.46 581.23 2.25 450.39 200.50 206.73 1.29 5.48 586.43 2.26 454.41 201.08 207.33 1.29 5.50 591.65 2.27 458.43 201.63 207.88 1.29 5.52 596.90 2.26 462.51 204.31 210.56 1.29 5.54 602.18 2.28 466.59 204.56 210.82 1.29 5.56 607.49 2.30 470.69 204.82 211.09 1.29 5.58 612.82 2.32 474.79 205.08 211.35 1.29 5.60 618.19 2.33 478.89 205.34 211.61 1.29 5.62 623.58 2.35 483.00 205.59 211.87 1.29 5.64 629.00 2.37 487.11 205.85 212.13 1.29 5.66 634.45 2.38 491.23 206.11 212.39 1.29 5.68 639.92 2.40 495.36 206.36 212.65 1.29 5.70 645.43 2.42 499.49 206.61 212.90 1.29 5.72 650.97 2.43 503.63 207.21 213.51 1.29 5.74 656.53 2.44 507.78 207.81 214.12 1.29 5.76 662.12 2.46 511.94 208.42 214.72 1.29 5.78 667.74 2.47 516.11 209.02 215.33 1.29 5.80 673.39 2.48 520.30 209.62 215.93 1.29 5.82 679.07 2.48 524.50 211.49 217.80 1.29 5.84 684.78 2.46 528.77 214.61 220.94 1.30 5.86 690.52 2.47 533.07 215.57 221.90 1.30 5.88 696.28 2.48 537.39 216.53 222.86 1.30 5.90 702.08 2.49 541.73 217.48 223.82 1.30 5.92 707.90 2.50 546.09 218.44 224.79 1.30 5.94 713.75 2.51 550.47 219.40 225.75 1.30
Page A - 49

AfriDev Consultants Pty Ltd 2005
DWAF Report No. RDM X100-01-CON-COMPR2-0604 Komati Catchment Ecological Water Requirements Study – Quantity Report
Flow depth (m)
Discharge (m3/s)
Av. flow depth (m)
Area (m2)
Width (m)
Perimeter (m)
Av. velocity (m/s)
5.96 719.64 2.52 554.86 220.35 226.71 1.30 5.98 725.55 2.53 559.28 221.31 227.67 1.30 6.00 731.49 2.54 563.72 222.27 228.63 1.30
Table 16 Tabulated hydraulic data for EWR Site L1 (rapid) Flow depth
(m) Discharge
(m3/s) Av. flow depth
(m) Area (m2)
Width (m)
Perimeter (m)
Av. velocity (m/s)
0.00 0.000 0.00 0.00 0.00 0.00 0.00 0.02 0.000 0.01 0.00 0.13 0.13 0.00 0.04 0.000 0.02 0.01 0.36 0.39 0.00 0.06 0.000 0.03 0.02 0.60 0.64 0.00 0.08 0.000 0.04 0.03 0.84 0.90 0.00 0.10 0.000 0.03 0.06 1.79 1.87 0.00 0.12 0.000 0.04 0.10 2.36 2.46 0.00 0.14 0.000 0.04 0.16 3.55 3.66 0.00 0.16 0.000 0.05 0.24 4.68 4.81 0.00 0.18 0.000 0.06 0.35 6.27 6.43 0.00 0.20 0.001 0.07 0.48 6.41 6.58 0.00 0.22 0.001 0.09 0.61 6.58 6.77 0.00 0.24 0.002 0.10 0.74 7.14 7.36 0.00 0.26 0.004 0.11 0.90 8.51 8.78 0.00 0.28 0.008 0.12 1.08 9.29 9.60 0.01 0.30 0.013 0.12 1.27 10.32 10.68 0.01 0.32 0.020 0.13 1.49 11.57 11.98 0.01 0.34 0.032 0.14 1.73 12.45 12.91 0.02 0.36 0.048 0.16 1.99 12.81 13.35 0.02 0.38 0.071 0.17 2.25 13.15 13.77 0.03 0.40 0.10 0.19 2.51 13.49 14.20 0.04 0.42 0.15 0.20 2.79 13.83 14.62 0.05 0.44 0.21 0.22 3.07 14.17 15.05 0.07 0.46 0.29 0.23 3.35 14.46 15.42 0.09 0.48 0.39 0.25 3.64 14.68 15.71 0.11 0.50 0.53 0.27 3.94 14.86 15.95 0.13 0.52 0.70 0.28 4.24 15.03 16.19 0.17 0.54 0.92 0.30 4.54 15.21 16.44 0.20 0.56 1.20 0.32 4.85 15.37 16.65 0.25 0.58 1.55 0.33 5.15 15.46 16.76 0.30 0.60 1.99 0.34 5.47 16.17 17.49 0.36 0.62 2.53 0.33 5.80 17.38 18.72 0.44 0.64 3.19 0.35 6.16 17.75 19.10 0.52 0.66 3.65 0.36 6.51 18.03 19.39 0.56 0.68 4.09 0.37 6.88 18.59 19.97 0.59 0.70 4.55 0.38 7.26 19.16 20.56 0.63 0.72 5.05 0.39 7.64 19.54 20.96 0.66 0.74 5.57 0.40 8.04 19.90 21.34 0.69 0.76 6.13 0.42 8.44 20.24 21.70 0.73 0.78 6.71 0.43 8.85 20.57 22.06 0.76 0.80 7.33 0.43 9.27 21.44 22.95 0.79 0.82 7.99 0.45 9.70 21.69 23.21 0.82 0.84 8.67 0.46 10.14 21.95 23.48 0.86
Page A - 50

AfriDev Consultants Pty Ltd 2005
DWAF Report No. RDM X100-01-CON-COMPR2-0604 Komati Catchment Ecological Water Requirements Study – Quantity Report
Flow depth (m)
Discharge (m3/s)
Av. flow depth (m)
Area (m2)
Width (m)
Perimeter (m)
Av. velocity (m/s)
0.86 9.39 0.48 10.58 22.22 23.77 0.89 0.88 10.14 0.49 11.03 22.51 24.07 0.92 0.90 10.93 0.50 11.48 22.81 24.38 0.95 0.92 11.75 0.51 11.94 23.22 24.81 0.98 0.94 12.61 0.52 12.41 23.79 25.40 1.02 0.96 13.51 0.50 12.90 25.65 27.29 1.05 0.98 14.44 0.48 13.44 27.75 29.42 1.07 1.00 15.41 0.48 14.01 28.98 30.69 1.10 1.02 16.41 0.49 14.60 30.00 31.73 1.12 1.04 17.46 0.49 15.21 30.79 32.54 1.15 1.06 18.54 0.50 15.83 31.59 33.37 1.17 1.08 19.66 0.51 16.47 32.46 34.25 1.19 1.10 20.82 0.51 17.13 33.62 35.45 1.22 1.12 22.02 0.51 17.82 34.80 36.65 1.24 1.14 23.26 0.51 18.52 36.00 37.87 1.26 1.16 24.54 0.51 19.26 37.89 39.79 1.27 1.18 25.86 0.51 20.03 39.21 41.13 1.29 1.20 27.22 0.53 20.82 39.65 41.59 1.31 1.22 28.63 0.54 21.62 39.87 41.83 1.32 1.24 30.08 0.56 22.42 40.10 42.06 1.34 1.26 31.56 0.58 23.22 40.32 42.30 1.36 1.28 33.10 0.59 24.03 40.54 42.54 1.38 1.30 34.67 0.60 24.84 41.09 43.10 1.40 1.32 36.29 0.62 25.67 41.63 43.66 1.41 1.34 37.95 0.63 26.51 42.18 44.23 1.43 1.36 39.66 0.64 27.36 42.72 44.79 1.45 1.38 41.41 0.65 28.22 43.17 45.26 1.47 1.42 45.05 0.68 29.96 44.03 46.14 1.50 1.44 46.94 0.69 30.85 44.54 46.65 1.52 1.46 48.87 0.70 31.74 45.04 47.15 1.54 1.48 50.85 0.72 32.65 45.39 47.50 1.56 1.50 52.88 0.74 33.56 45.51 47.63 1.58 1.52 54.95 0.76 34.47 45.63 47.76 1.59 1.54 57.08 0.77 35.38 45.75 47.89 1.61 1.56 59.25 0.79 36.30 45.88 48.02 1.63 1.58 61.46 0.81 37.22 46.00 48.14 1.65 1.60 63.73 0.83 38.14 46.12 48.27 1.67 1.62 66.05 0.84 39.06 46.24 48.40 1.69 1.64 68.41 0.86 39.99 46.36 48.53 1.71 1.66 70.82 0.88 40.92 46.48 48.66 1.73 1.68 73.29 0.90 41.85 46.58 48.76 1.75 1.70 75.80 0.89 42.79 48.01 50.21 1.77 1.72 78.37 0.90 43.76 48.57 50.78 1.79 1.74 80.98 0.92 44.73 48.79 51.02 1.81 1.76 83.65 0.93 45.71 49.02 51.26 1.83 1.78 86.37 0.95 46.69 49.24 51.50 1.85 1.80 89.13 0.96 47.68 49.46 51.74 1.87 1.82 91.96 0.98 48.67 49.75 52.04 1.89 1.84 94.83 0.99 49.67 50.09 52.41 1.91 1.86 97.76 1.00 50.67 50.44 52.78 1.93
Page A - 51
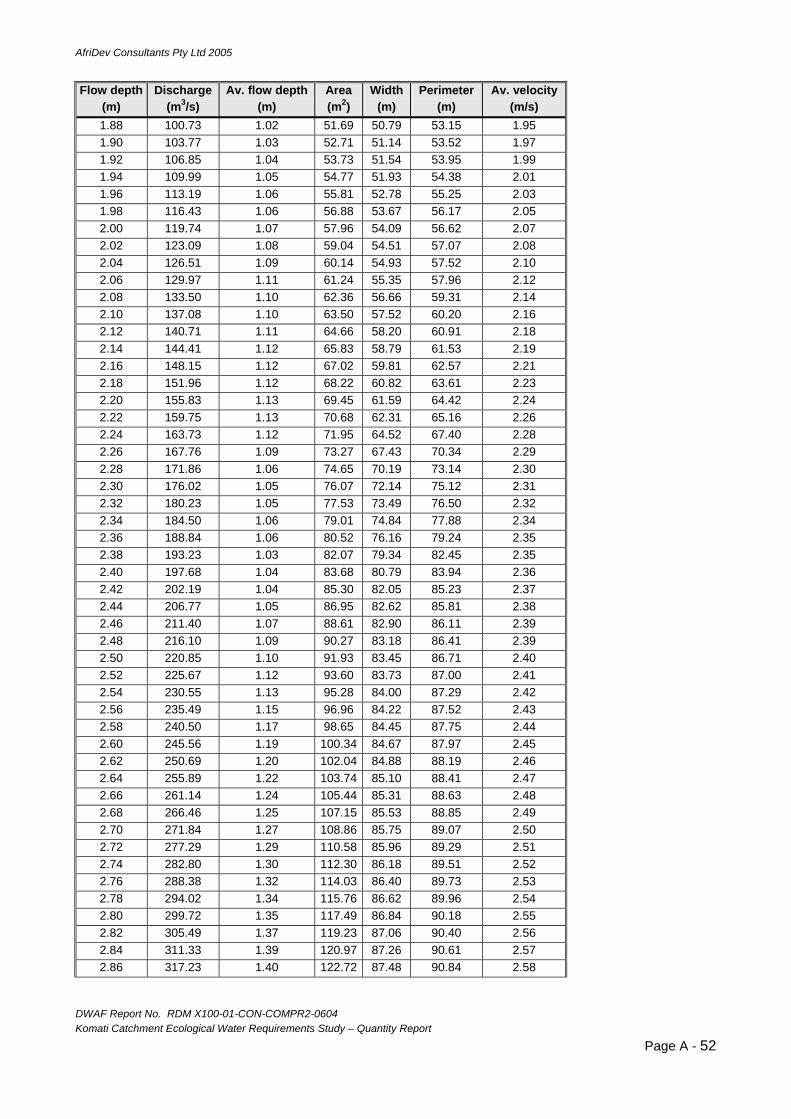
AfriDev Consultants Pty Ltd 2005
DWAF Report No. RDM X100-01-CON-COMPR2-0604 Komati Catchment Ecological Water Requirements Study – Quantity Report
Flow depth (m)
Discharge (m3/s)
Av. flow depth (m)
Area (m2)
Width (m)
Perimeter (m)
Av. velocity (m/s)
1.88 100.73 1.02 51.69 50.79 53.15 1.95 1.90 103.77 1.03 52.71 51.14 53.52 1.97 1.92 106.85 1.04 53.73 51.54 53.95 1.99 1.94 109.99 1.05 54.77 51.93 54.38 2.01 1.96 113.19 1.06 55.81 52.78 55.25 2.03 1.98 116.43 1.06 56.88 53.67 56.17 2.05 2.00 119.74 1.07 57.96 54.09 56.62 2.07 2.02 123.09 1.08 59.04 54.51 57.07 2.08 2.04 126.51 1.09 60.14 54.93 57.52 2.10 2.06 129.97 1.11 61.24 55.35 57.96 2.12 2.08 133.50 1.10 62.36 56.66 59.31 2.14 2.10 137.08 1.10 63.50 57.52 60.20 2.16 2.12 140.71 1.11 64.66 58.20 60.91 2.18 2.14 144.41 1.12 65.83 58.79 61.53 2.19 2.16 148.15 1.12 67.02 59.81 62.57 2.21 2.18 151.96 1.12 68.22 60.82 63.61 2.23 2.20 155.83 1.13 69.45 61.59 64.42 2.24 2.22 159.75 1.13 70.68 62.31 65.16 2.26 2.24 163.73 1.12 71.95 64.52 67.40 2.28 2.26 167.76 1.09 73.27 67.43 70.34 2.29 2.28 171.86 1.06 74.65 70.19 73.14 2.30 2.30 176.02 1.05 76.07 72.14 75.12 2.31 2.32 180.23 1.05 77.53 73.49 76.50 2.32 2.34 184.50 1.06 79.01 74.84 77.88 2.34 2.36 188.84 1.06 80.52 76.16 79.24 2.35 2.38 193.23 1.03 82.07 79.34 82.45 2.35 2.40 197.68 1.04 83.68 80.79 83.94 2.36 2.42 202.19 1.04 85.30 82.05 85.23 2.37 2.44 206.77 1.05 86.95 82.62 85.81 2.38 2.46 211.40 1.07 88.61 82.90 86.11 2.39 2.48 216.10 1.09 90.27 83.18 86.41 2.39 2.50 220.85 1.10 91.93 83.45 86.71 2.40 2.52 225.67 1.12 93.60 83.73 87.00 2.41 2.54 230.55 1.13 95.28 84.00 87.29 2.42 2.56 235.49 1.15 96.96 84.22 87.52 2.43 2.58 240.50 1.17 98.65 84.45 87.75 2.44 2.60 245.56 1.19 100.34 84.67 87.97 2.45 2.62 250.69 1.20 102.04 84.88 88.19 2.46 2.64 255.89 1.22 103.74 85.10 88.41 2.47 2.66 261.14 1.24 105.44 85.31 88.63 2.48 2.68 266.46 1.25 107.15 85.53 88.85 2.49 2.70 271.84 1.27 108.86 85.75 89.07 2.50 2.72 277.29 1.29 110.58 85.96 89.29 2.51 2.74 282.80 1.30 112.30 86.18 89.51 2.52 2.76 288.38 1.32 114.03 86.40 89.73 2.53 2.78 294.02 1.34 115.76 86.62 89.96 2.54 2.80 299.72 1.35 117.49 86.84 90.18 2.55 2.82 305.49 1.37 119.23 87.06 90.40 2.56 2.84 311.33 1.39 120.97 87.26 90.61 2.57 2.86 317.23 1.40 122.72 87.48 90.84 2.58
Page A - 52

AfriDev Consultants Pty Ltd 2005
DWAF Report No. RDM X100-01-CON-COMPR2-0604 Komati Catchment Ecological Water Requirements Study – Quantity Report
Flow depth (m)
Discharge (m3/s)
Av. flow depth (m)
Area (m2)
Width (m)
Perimeter (m)
Av. velocity (m/s)
2.88 323.20 1.42 124.47 87.72 91.07 2.60 2.90 329.23 1.44 126.23 87.95 91.31 2.61 2.92 335.33 1.45 127.99 88.19 91.55 2.62 2.94 341.50 1.47 129.76 88.42 91.79 2.63 2.96 347.73 1.48 131.53 88.63 92.00 2.64 2.98 354.03 1.50 133.30 88.81 92.18 2.66 3.00 360.39 1.52 135.08 88.97 92.35 2.67
Table 17 Tabulated hydraulic data for EWR Site G1A (riffle) Flow depth
(m) Discharge
(m3/s) Av. flow depth
(m) Area (m2)
Width (m)
Perimeter (m)
Av. velocity (m/s)
0.00 0.000 0.00 0.00 0.00 0.00 0.00 0.02 0.000 0.01 0.01 0.84 0.85 0.00 0.04 0.000 0.03 0.03 1.01 1.01 0.00 0.06 0.000 0.04 0.05 1.17 1.18 0.00 0.08 0.000 0.06 0.08 1.33 1.35 0.00 0.10 0.000 0.06 0.11 1.99 2.02 0.00 0.12 0.001 0.07 0.15 2.24 2.29 0.01 0.14 0.002 0.08 0.20 2.49 2.56 0.01 0.16 0.004 0.09 0.25 2.74 2.83 0.02 0.18 0.007 0.10 0.31 2.99 3.10 0.02 0.20 0.011 0.11 0.37 3.24 3.36 0.03 0.22 0.018 0.12 0.44 3.62 3.77 0.04 0.24 0.027 0.13 0.52 4.07 4.23 0.05 0.26 0.040 0.14 0.60 4.45 4.63 0.07 0.28 0.057 0.14 0.69 4.84 5.02 0.08 0.30 0.080 0.15 0.80 5.23 5.42 0.10 0.32 0.11 0.17 0.90 5.38 5.59 0.12 0.34 0.15 0.18 1.01 5.53 5.75 0.14 0.36 0.19 0.20 1.12 5.68 5.91 0.17 0.38 0.25 0.21 1.24 5.83 6.08 0.20 0.40 0.32 0.23 1.35 5.89 6.15 0.23 0.42 0.40 0.25 1.47 5.94 6.22 0.27 0.44 0.50 0.27 1.59 5.99 6.28 0.31 0.46 0.62 0.28 1.71 6.04 6.35 0.36 0.48 0.76 0.30 1.83 6.09 6.42 0.41 0.50 0.92 0.32 1.96 6.15 6.49 0.47 0.52 1.11 0.34 2.08 6.20 6.56 0.53 0.54 1.33 0.35 2.20 6.25 6.62 0.60 0.56 1.58 0.37 2.33 6.30 6.69 0.68 0.58 1.83 0.39 2.46 6.35 6.76 0.74 0.60 1.99 0.40 2.58 6.40 6.83 0.77 0.62 2.16 0.42 2.71 6.46 6.90 0.80 0.64 2.35 0.44 2.84 6.51 6.96 0.83 0.66 2.54 0.45 2.97 6.56 7.03 0.85 0.68 2.75 0.47 3.10 6.61 7.10 0.89 0.70 2.97 0.49 3.24 6.66 7.17 0.92 0.72 3.20 0.50 3.37 6.72 7.24 0.95 0.74 3.45 0.51 3.51 6.86 7.39 0.98 0.76 3.71 0.52 3.65 7.00 7.54 1.02
Page A - 53
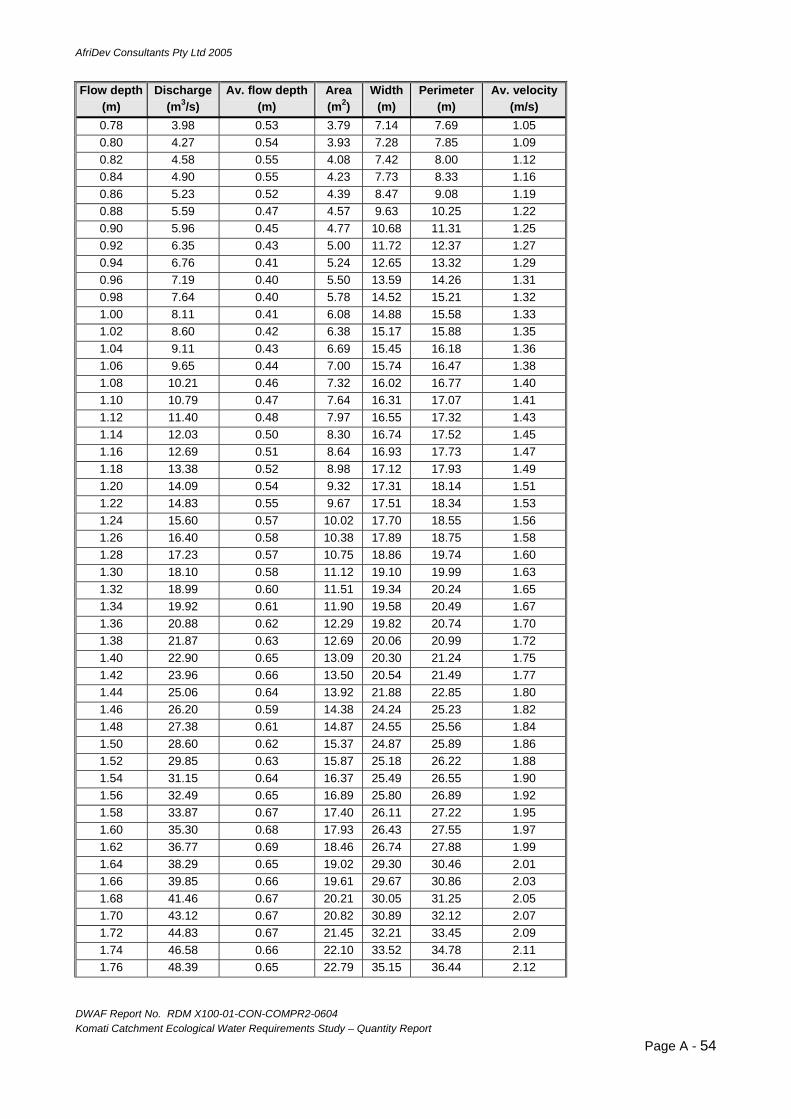
AfriDev Consultants Pty Ltd 2005
DWAF Report No. RDM X100-01-CON-COMPR2-0604 Komati Catchment Ecological Water Requirements Study – Quantity Report
Flow depth (m)
Discharge (m3/s)
Av. flow depth (m)
Area (m2)
Width (m)
Perimeter (m)
Av. velocity (m/s)
0.78 3.98 0.53 3.79 7.14 7.69 1.05 0.80 4.27 0.54 3.93 7.28 7.85 1.09 0.82 4.58 0.55 4.08 7.42 8.00 1.12 0.84 4.90 0.55 4.23 7.73 8.33 1.16 0.86 5.23 0.52 4.39 8.47 9.08 1.19 0.88 5.59 0.47 4.57 9.63 10.25 1.22 0.90 5.96 0.45 4.77 10.68 11.31 1.25 0.92 6.35 0.43 5.00 11.72 12.37 1.27 0.94 6.76 0.41 5.24 12.65 13.32 1.29 0.96 7.19 0.40 5.50 13.59 14.26 1.31 0.98 7.64 0.40 5.78 14.52 15.21 1.32 1.00 8.11 0.41 6.08 14.88 15.58 1.33 1.02 8.60 0.42 6.38 15.17 15.88 1.35 1.04 9.11 0.43 6.69 15.45 16.18 1.36 1.06 9.65 0.44 7.00 15.74 16.47 1.38 1.08 10.21 0.46 7.32 16.02 16.77 1.40 1.10 10.79 0.47 7.64 16.31 17.07 1.41 1.12 11.40 0.48 7.97 16.55 17.32 1.43 1.14 12.03 0.50 8.30 16.74 17.52 1.45 1.16 12.69 0.51 8.64 16.93 17.73 1.47 1.18 13.38 0.52 8.98 17.12 17.93 1.49 1.20 14.09 0.54 9.32 17.31 18.14 1.51 1.22 14.83 0.55 9.67 17.51 18.34 1.53 1.24 15.60 0.57 10.02 17.70 18.55 1.56 1.26 16.40 0.58 10.38 17.89 18.75 1.58 1.28 17.23 0.57 10.75 18.86 19.74 1.60 1.30 18.10 0.58 11.12 19.10 19.99 1.63 1.32 18.99 0.60 11.51 19.34 20.24 1.65 1.34 19.92 0.61 11.90 19.58 20.49 1.67 1.36 20.88 0.62 12.29 19.82 20.74 1.70 1.38 21.87 0.63 12.69 20.06 20.99 1.72 1.40 22.90 0.65 13.09 20.30 21.24 1.75 1.42 23.96 0.66 13.50 20.54 21.49 1.77 1.44 25.06 0.64 13.92 21.88 22.85 1.80 1.46 26.20 0.59 14.38 24.24 25.23 1.82 1.48 27.38 0.61 14.87 24.55 25.56 1.84 1.50 28.60 0.62 15.37 24.87 25.89 1.86 1.52 29.85 0.63 15.87 25.18 26.22 1.88 1.54 31.15 0.64 16.37 25.49 26.55 1.90 1.56 32.49 0.65 16.89 25.80 26.89 1.92 1.58 33.87 0.67 17.40 26.11 27.22 1.95 1.60 35.30 0.68 17.93 26.43 27.55 1.97 1.62 36.77 0.69 18.46 26.74 27.88 1.99 1.64 38.29 0.65 19.02 29.30 30.46 2.01 1.66 39.85 0.66 19.61 29.67 30.86 2.03 1.68 41.46 0.67 20.21 30.05 31.25 2.05 1.70 43.12 0.67 20.82 30.89 32.12 2.07 1.72 44.83 0.67 21.45 32.21 33.45 2.09 1.74 46.58 0.66 22.10 33.52 34.78 2.11 1.76 48.39 0.65 22.79 35.15 36.44 2.12
Page A - 54
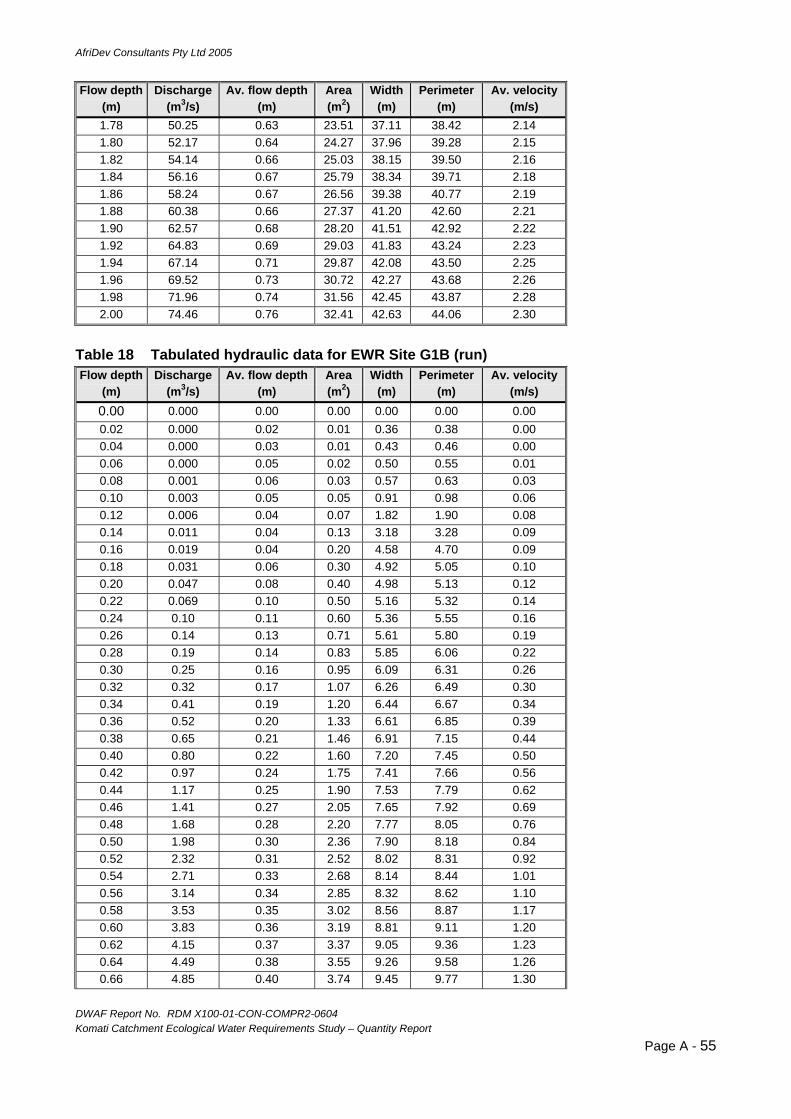
AfriDev Consultants Pty Ltd 2005
DWAF Report No. RDM X100-01-CON-COMPR2-0604 Komati Catchment Ecological Water Requirements Study – Quantity Report
Flow depth (m)
Discharge (m3/s)
Av. flow depth (m)
Area (m2)
Width (m)
Perimeter (m)
Av. velocity (m/s)
1.78 50.25 0.63 23.51 37.11 38.42 2.14 1.80 52.17 0.64 24.27 37.96 39.28 2.15 1.82 54.14 0.66 25.03 38.15 39.50 2.16 1.84 56.16 0.67 25.79 38.34 39.71 2.18 1.86 58.24 0.67 26.56 39.38 40.77 2.19 1.88 60.38 0.66 27.37 41.20 42.60 2.21 1.90 62.57 0.68 28.20 41.51 42.92 2.22 1.92 64.83 0.69 29.03 41.83 43.24 2.23 1.94 67.14 0.71 29.87 42.08 43.50 2.25 1.96 69.52 0.73 30.72 42.27 43.68 2.26 1.98 71.96 0.74 31.56 42.45 43.87 2.28 2.00 74.46 0.76 32.41 42.63 44.06 2.30
Table 18 Tabulated hydraulic data for EWR Site G1B (run) Flow depth
(m) Discharge
(m3/s) Av. flow depth
(m) Area (m2)
Width (m)
Perimeter (m)
Av. velocity (m/s)
0.00 0.000 0.00 0.00 0.00 0.00 0.00 0.02 0.000 0.02 0.01 0.36 0.38 0.00 0.04 0.000 0.03 0.01 0.43 0.46 0.00 0.06 0.000 0.05 0.02 0.50 0.55 0.01 0.08 0.001 0.06 0.03 0.57 0.63 0.03 0.10 0.003 0.05 0.05 0.91 0.98 0.06 0.12 0.006 0.04 0.07 1.82 1.90 0.08 0.14 0.011 0.04 0.13 3.18 3.28 0.09 0.16 0.019 0.04 0.20 4.58 4.70 0.09 0.18 0.031 0.06 0.30 4.92 5.05 0.10 0.20 0.047 0.08 0.40 4.98 5.13 0.12 0.22 0.069 0.10 0.50 5.16 5.32 0.14 0.24 0.10 0.11 0.60 5.36 5.55 0.16 0.26 0.14 0.13 0.71 5.61 5.80 0.19 0.28 0.19 0.14 0.83 5.85 6.06 0.22 0.30 0.25 0.16 0.95 6.09 6.31 0.26 0.32 0.32 0.17 1.07 6.26 6.49 0.30 0.34 0.41 0.19 1.20 6.44 6.67 0.34 0.36 0.52 0.20 1.33 6.61 6.85 0.39 0.38 0.65 0.21 1.46 6.91 7.15 0.44 0.40 0.80 0.22 1.60 7.20 7.45 0.50 0.42 0.97 0.24 1.75 7.41 7.66 0.56 0.44 1.17 0.25 1.90 7.53 7.79 0.62 0.46 1.41 0.27 2.05 7.65 7.92 0.69 0.48 1.68 0.28 2.20 7.77 8.05 0.76 0.50 1.98 0.30 2.36 7.90 8.18 0.84 0.52 2.32 0.31 2.52 8.02 8.31 0.92 0.54 2.71 0.33 2.68 8.14 8.44 1.01 0.56 3.14 0.34 2.85 8.32 8.62 1.10 0.58 3.53 0.35 3.02 8.56 8.87 1.17 0.60 3.83 0.36 3.19 8.81 9.11 1.20 0.62 4.15 0.37 3.37 9.05 9.36 1.23 0.64 4.49 0.38 3.55 9.26 9.58 1.26 0.66 4.85 0.40 3.74 9.45 9.77 1.30
Page A - 55

AfriDev Consultants Pty Ltd 2005
DWAF Report No. RDM X100-01-CON-COMPR2-0604 Komati Catchment Ecological Water Requirements Study – Quantity Report
Flow depth (m)
Discharge (m3/s)
Av. flow depth (m)
Area (m2)
Width (m)
Perimeter (m)
Av. velocity (m/s)
0.68 5.23 0.41 3.93 9.63 9.96 1.33 0.70 5.63 0.42 4.12 9.82 10.15 1.37 0.72 6.05 0.43 4.32 10.01 10.34 1.40 0.74 6.50 0.40 4.54 11.41 11.74 1.43 0.76 6.97 0.41 4.77 11.70 12.04 1.46 0.78 7.47 0.42 5.01 11.99 12.34 1.49 0.80 7.99 0.43 5.25 12.28 12.63 1.52 0.82 8.54 0.44 5.50 12.57 12.92 1.55 0.84 9.11 0.45 5.75 12.86 13.22 1.58 0.86 9.71 0.46 6.02 13.15 13.51 1.61 0.88 10.35 0.47 6.28 13.39 13.75 1.65 0.90 11.01 0.48 6.55 13.58 13.94 1.68 0.92 11.70 0.50 6.82 13.77 14.14 1.71 0.94 12.43 0.51 7.10 13.96 14.33 1.75 0.96 13.18 0.52 7.38 14.15 14.52 1.79 0.98 13.97 0.53 7.67 14.33 14.71 1.82 1.00 14.80 0.55 7.96 14.52 14.91 1.86 1.02 15.66 0.53 8.26 15.58 15.97 1.90 1.04 16.56 0.44 8.60 19.49 19.88 1.92 1.06 17.49 0.41 9.02 22.20 22.60 1.94 1.08 18.47 0.39 9.49 24.38 24.79 1.95 1.10 19.48 0.35 10.03 28.62 29.03 1.94 1.12 20.53 0.36 10.62 29.54 29.94 1.93 1.14 21.63 0.37 11.21 30.08 30.49 1.93 1.16 22.77 0.39 11.82 30.26 30.68 1.93 1.18 23.95 0.41 12.42 30.44 30.86 1.93 1.20 25.18 0.43 13.04 30.62 31.05 1.93 1.22 26.45 0.44 13.65 30.80 31.23 1.94 1.24 27.77 0.46 14.27 30.98 31.41 1.95 1.26 29.14 0.48 14.89 31.16 31.60 1.96 1.28 30.55 0.49 15.51 31.34 31.78 1.97 1.30 32.02 0.51 16.14 31.52 31.97 1.98 1.32 33.54 0.53 16.77 31.70 32.15 2.00 1.34 35.11 0.55 17.41 31.88 32.33 2.02 1.36 36.74 0.56 18.05 32.06 32.52 2.04 1.38 38.42 0.55 18.71 33.95 34.41 2.05 1.40 40.15 0.56 19.40 34.66 35.13 2.07 1.42 41.95 0.57 20.10 35.36 35.84 2.09 1.44 43.80 0.58 20.81 36.10 36.58 2.10 1.46 45.71 0.59 21.54 36.70 37.20 2.12 1.48 47.68 0.60 22.28 37.15 37.65 2.14 1.50 49.72 0.61 23.03 37.60 38.11 2.16 1.52 51.82 0.63 23.78 38.05 38.57 2.18 1.54 53.98 0.64 24.55 38.50 39.03 2.20 1.56 56.21 0.65 25.32 38.94 39.49 2.22 1.58 58.51 0.66 26.11 39.54 40.09 2.24 1.60 60.88 0.67 26.90 40.13 40.69 2.26 1.62 63.32 0.68 27.71 40.72 41.29 2.28 1.64 65.82 0.69 28.53 41.31 41.89 2.31 1.66 68.40 0.70 29.36 41.90 42.49 2.33
Page A - 56

AfriDev Consultants Pty Ltd 2005
DWAF Report No. RDM X100-01-CON-COMPR2-0604 Komati Catchment Ecological Water Requirements Study – Quantity Report
Flow depth (m)
Discharge (m3/s)
Av. flow depth (m)
Area (m2)
Width (m)
Perimeter (m)
Av. velocity (m/s)
1.68 71.06 0.72 30.20 42.03 42.62 2.35 1.70 73.79 0.74 31.05 42.17 42.76 2.38 1.72 76.60 0.75 31.89 42.30 42.90 2.40 1.74 79.48 0.77 32.74 42.43 43.04 2.43 1.76 82.45 0.79 33.59 42.56 43.17 2.45 1.78 85.50 0.81 34.44 42.74 43.36 2.48 1.80 88.62 0.82 35.30 42.92 43.54 2.51 1.82 91.84 0.84 36.16 43.06 43.69 2.54 1.84 95.14 0.86 37.02 43.20 43.84 2.57 1.86 98.52 0.87 37.88 43.34 43.98 2.60 1.88 101.99 0.89 38.75 43.48 44.13 2.63 1.90 105.56 0.91 39.62 43.62 44.28 2.66 1.92 109.21 0.93 40.50 43.76 44.42 2.70 1.94 112.96 0.94 41.37 43.90 44.57 2.73 1.96 116.80 0.96 42.25 44.04 44.71 2.76 1.98 120.74 0.98 43.14 44.18 44.86 2.80 2.00 124.78 0.99 44.02 44.32 45.01 2.83
Table 19 Tabulated hydraulic data for EWR Site T1 (riffle) Flow depth
(m) Discharge
(m3/s) Av. flow depth
(m) Area (m2)
Width (m)
Perimeter (m)
Av. velocity (m/s)
0.00 0.000 0.00 0.00 0.00 0.00 0.00 0.02 0.000 0.01 0.00 0.25 0.25 0.00 0.04 0.000 0.02 0.01 0.50 0.50 0.00 0.06 0.000 0.02 0.02 0.96 0.98 0.00 0.08 0.000 0.03 0.05 1.75 1.78 0.00 0.10 0.001 0.04 0.09 2.32 2.36 0.01 0.12 0.001 0.05 0.14 2.76 2.80 0.01 0.14 0.002 0.06 0.20 3.19 3.25 0.01 0.16 0.005 0.07 0.28 3.93 4.00 0.02 0.18 0.008 0.09 0.36 4.05 4.13 0.02 0.20 0.012 0.11 0.44 4.15 4.23 0.03 0.22 0.019 0.12 0.52 4.25 4.34 0.04 0.24 0.028 0.14 0.61 4.35 4.45 0.05 0.26 0.040 0.16 0.70 4.45 4.56 0.06 0.28 0.055 0.17 0.79 4.57 4.69 0.07 0.30 0.075 0.18 0.88 4.79 4.92 0.09 0.32 0.10 0.17 0.98 5.62 5.77 0.10 0.34 0.13 0.18 1.10 6.11 6.42 0.12 0.36 0.17 0.20 1.23 6.28 6.87 0.14 0.38 0.22 0.21 1.35 6.34 7.21 0.16 0.40 0.27 0.23 1.48 6.49 7.64 0.18 0.42 0.34 0.24 1.61 6.77 8.21 0.21 0.44 0.41 0.25 1.75 7.14 8.59 0.24 0.46 0.51 0.25 1.90 7.50 8.97 0.27 0.48 0.61 0.26 2.05 7.87 9.34 0.30 0.50 0.73 0.27 2.21 8.23 9.72 0.33 0.52 0.87 0.27 2.38 8.75 10.26 0.37 0.54 1.03 0.28 2.56 9.13 10.65 0.40 0.56 1.22 0.29 2.75 9.51 11.04 0.44
Page A - 57

AfriDev Consultants Pty Ltd 2005
DWAF Report No. RDM X100-01-CON-COMPR2-0604 Komati Catchment Ecological Water Requirements Study – Quantity Report
Flow depth (m)
Discharge (m3/s)
Av. flow depth (m)
Area (m2)
Width (m)
Perimeter (m)
Av. velocity (m/s)
0.58 1.42 0.30 2.94 9.89 11.43 0.48 0.60 1.66 0.31 3.14 10.27 11.82 0.53 0.62 1.92 0.32 3.35 10.52 12.08 0.57 0.64 2.21 0.33 3.56 10.73 12.31 0.62 0.66 2.53 0.35 3.78 10.89 12.49 0.67 0.68 2.89 0.36 4.00 11.04 12.68 0.72 0.70 3.29 0.38 4.22 11.20 12.86 0.78 0.72 3.73 0.39 4.45 11.35 13.04 0.84 0.74 4.12 0.41 4.68 11.51 13.22 0.88 0.76 4.41 0.42 4.91 11.66 13.40 0.90 0.78 4.72 0.44 5.14 11.82 13.58 0.92 0.80 5.05 0.45 5.38 11.97 13.77 0.94 0.82 5.40 0.46 5.62 12.13 13.95 0.96 0.84 5.76 0.48 5.87 12.28 14.13 0.98 0.86 6.13 0.49 6.11 12.39 14.27 1.00 0.88 6.53 0.51 6.36 12.49 14.41 1.03 0.90 6.94 0.52 6.61 12.60 14.54 1.05 0.92 7.37 0.54 6.86 12.71 14.68 1.07 0.94 7.81 0.55 7.12 12.84 14.85 1.10 0.96 8.28 0.57 7.38 12.98 15.02 1.12 0.98 8.77 0.58 7.64 13.12 15.19 1.15 1.00 9.27 0.60 7.90 13.26 15.35 1.17 1.02 9.80 0.61 8.17 13.39 15.52 1.20 1.04 10.34 0.62 8.44 13.53 15.69 1.23 1.06 10.91 0.64 8.71 13.67 15.86 1.25 1.08 11.50 0.60 9.00 14.96 17.18 1.28 1.10 12.12 0.60 9.30 15.43 17.69 1.30 1.12 12.75 0.60 9.61 15.91 18.19 1.33 1.14 13.41 0.56 9.95 17.80 20.13 1.35 1.16 14.09 0.55 10.32 18.71 21.07 1.37 1.18 14.80 0.56 10.69 19.10 21.49 1.38 1.20 15.53 0.57 11.08 19.49 21.92 1.40 1.22 16.29 0.58 11.47 19.81 22.28 1.42 1.24 17.07 0.59 11.87 20.14 22.64 1.44 1.26 17.88 0.60 12.28 20.47 23.00 1.46 1.28 18.71 0.61 12.69 20.69 23.25 1.47 1.30 19.57 0.63 13.11 20.81 23.40 1.49 1.32 20.46 0.65 13.52 20.94 23.56 1.51 1.34 21.38 0.66 13.94 21.06 23.71 1.53 1.36 22.33 0.68 14.37 21.24 23.91 1.55 1.38 23.31 0.69 14.79 21.39 24.09 1.58 1.40 24.31 0.71 15.22 21.55 24.28 1.60 1.42 25.35 0.72 15.65 21.70 24.46 1.62 1.44 26.42 0.74 16.09 21.81 24.61 1.64 1.46 27.52 0.75 16.53 21.96 24.79 1.67 1.48 28.65 0.77 16.97 22.15 25.01 1.69 1.50 29.82 0.78 17.41 22.34 25.23 1.71 1.52 31.01 0.79 17.86 22.53 25.45 1.74 1.54 32.25 0.80 18.32 22.92 25.87 1.76 1.56 33.51 0.79 18.78 23.84 26.82 1.78
Page A - 58
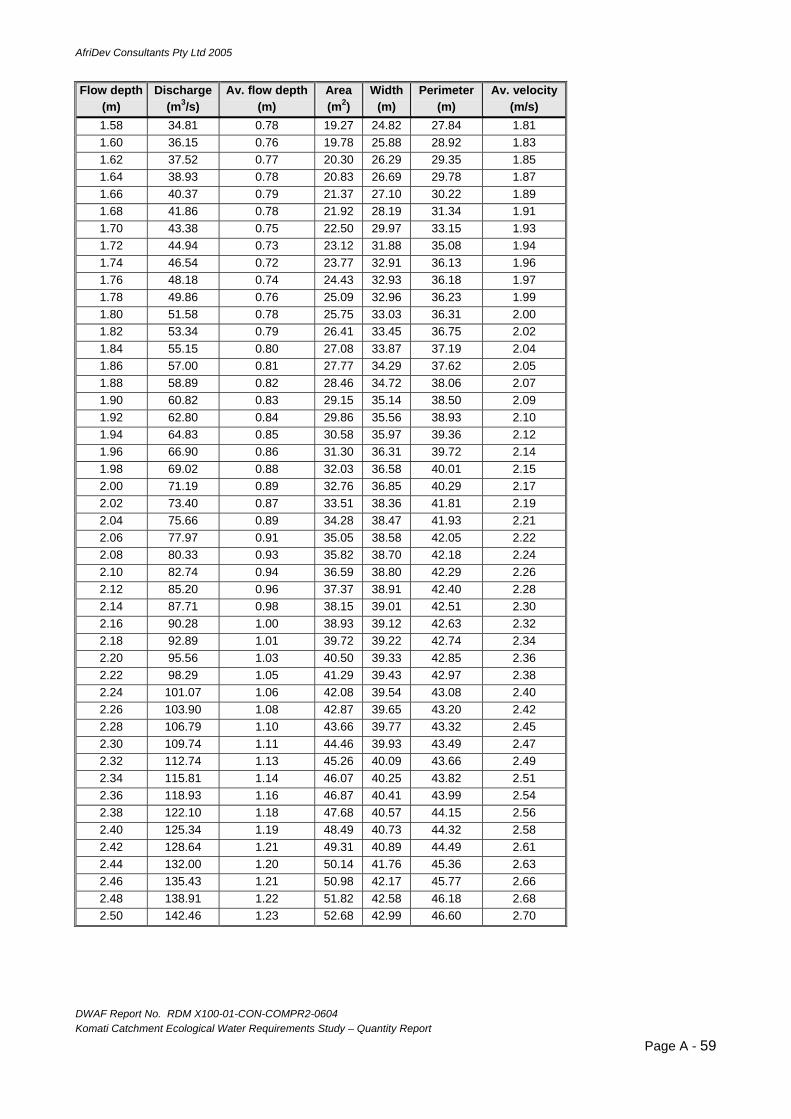
AfriDev Consultants Pty Ltd 2005
DWAF Report No. RDM X100-01-CON-COMPR2-0604 Komati Catchment Ecological Water Requirements Study – Quantity Report
Flow depth (m)
Discharge (m3/s)
Av. flow depth (m)
Area (m2)
Width (m)
Perimeter (m)
Av. velocity (m/s)
1.58 34.81 0.78 19.27 24.82 27.84 1.81 1.60 36.15 0.76 19.78 25.88 28.92 1.83 1.62 37.52 0.77 20.30 26.29 29.35 1.85 1.64 38.93 0.78 20.83 26.69 29.78 1.87 1.66 40.37 0.79 21.37 27.10 30.22 1.89 1.68 41.86 0.78 21.92 28.19 31.34 1.91 1.70 43.38 0.75 22.50 29.97 33.15 1.93 1.72 44.94 0.73 23.12 31.88 35.08 1.94 1.74 46.54 0.72 23.77 32.91 36.13 1.96 1.76 48.18 0.74 24.43 32.93 36.18 1.97 1.78 49.86 0.76 25.09 32.96 36.23 1.99 1.80 51.58 0.78 25.75 33.03 36.31 2.00 1.82 53.34 0.79 26.41 33.45 36.75 2.02 1.84 55.15 0.80 27.08 33.87 37.19 2.04 1.86 57.00 0.81 27.77 34.29 37.62 2.05 1.88 58.89 0.82 28.46 34.72 38.06 2.07 1.90 60.82 0.83 29.15 35.14 38.50 2.09 1.92 62.80 0.84 29.86 35.56 38.93 2.10 1.94 64.83 0.85 30.58 35.97 39.36 2.12 1.96 66.90 0.86 31.30 36.31 39.72 2.14 1.98 69.02 0.88 32.03 36.58 40.01 2.15 2.00 71.19 0.89 32.76 36.85 40.29 2.17 2.02 73.40 0.87 33.51 38.36 41.81 2.19 2.04 75.66 0.89 34.28 38.47 41.93 2.21 2.06 77.97 0.91 35.05 38.58 42.05 2.22 2.08 80.33 0.93 35.82 38.70 42.18 2.24 2.10 82.74 0.94 36.59 38.80 42.29 2.26 2.12 85.20 0.96 37.37 38.91 42.40 2.28 2.14 87.71 0.98 38.15 39.01 42.51 2.30 2.16 90.28 1.00 38.93 39.12 42.63 2.32 2.18 92.89 1.01 39.72 39.22 42.74 2.34 2.20 95.56 1.03 40.50 39.33 42.85 2.36 2.22 98.29 1.05 41.29 39.43 42.97 2.38 2.24 101.07 1.06 42.08 39.54 43.08 2.40 2.26 103.90 1.08 42.87 39.65 43.20 2.42 2.28 106.79 1.10 43.66 39.77 43.32 2.45 2.30 109.74 1.11 44.46 39.93 43.49 2.47 2.32 112.74 1.13 45.26 40.09 43.66 2.49 2.34 115.81 1.14 46.07 40.25 43.82 2.51 2.36 118.93 1.16 46.87 40.41 43.99 2.54 2.38 122.10 1.18 47.68 40.57 44.15 2.56 2.40 125.34 1.19 48.49 40.73 44.32 2.58 2.42 128.64 1.21 49.31 40.89 44.49 2.61 2.44 132.00 1.20 50.14 41.76 45.36 2.63 2.46 135.43 1.21 50.98 42.17 45.77 2.66 2.48 138.91 1.22 51.82 42.58 46.18 2.68 2.50 142.46 1.23 52.68 42.99 46.60 2.70
Page A - 59
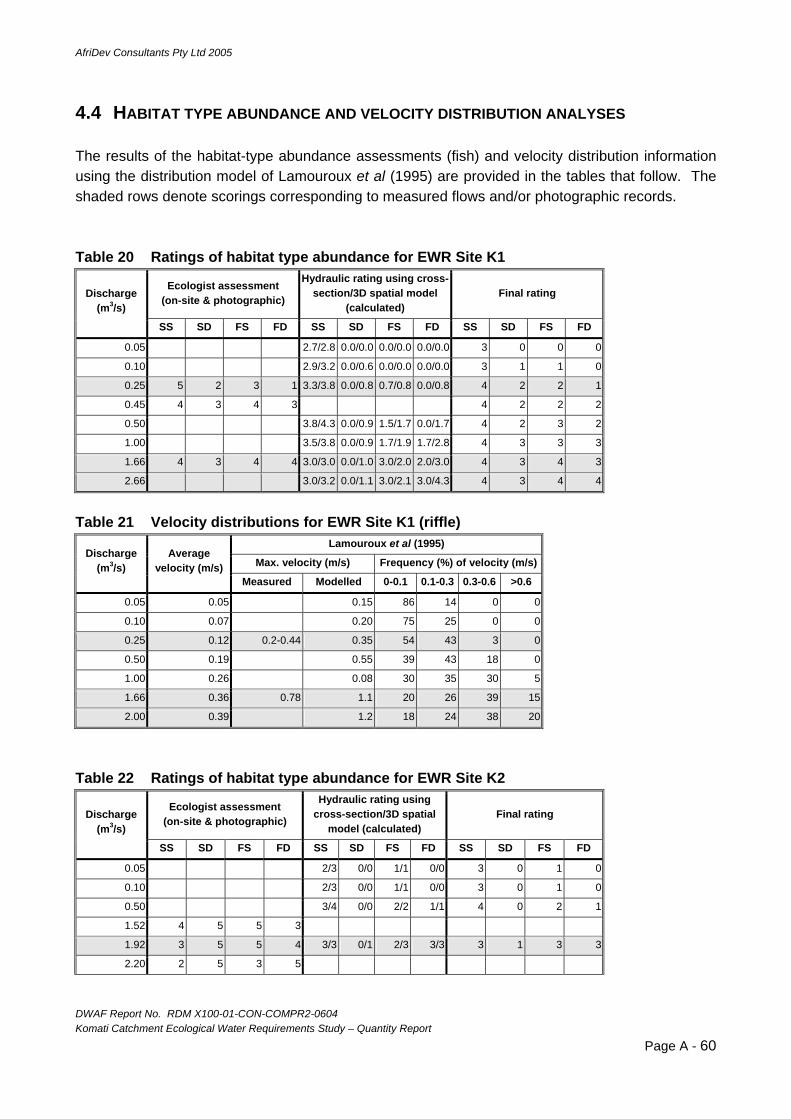
AfriDev Consultants Pty Ltd 2005
DWAF Report No. RDM X100-01-CON-COMPR2-0604 Komati Catchment Ecological Water Requirements Study – Quantity Report
4.4 HABITAT TYPE ABUNDANCE AND VELOCITY DISTRIBUTION ANALYSES The results of the habitat-type abundance assessments (fish) and velocity distribution information using the distribution model of Lamouroux et al (1995) are provided in the tables that follow. The shaded rows denote scorings corresponding to measured flows and/or photographic records. Table 20 Ratings of habitat type abundance for EWR Site K1
Ecologist assessment (on-site & photographic)
Hydraulic rating using cross-section/3D spatial model
(calculated) Final rating Discharge
(m3/s)
SS SD FS FD SS SD FS FD SS SD FS FD
0.05 2.7/2.8 0.0/0.0 0.0/0.0 0.0/0.0 3 0 0 0
0.10 2.9/3.2 0.0/0.6 0.0/0.0 0.0/0.0 3 1 1 0
0.25 5 2 3 1 3.3/3.8 0.0/0.8 0.7/0.8 0.0/0.8 4 2 2 1
0.45 4 3 4 3 4 2 2 2
0.50 3.8/4.3 0.0/0.9 1.5/1.7 0.0/1.7 4 2 3 2
1.00 3.5/3.8 0.0/0.9 1.7/1.9 1.7/2.8 4 3 3 3
1.66 4 3 4 4 3.0/3.0 0.0/1.0 3.0/2.0 2.0/3.0 4 3 4 3
2.66 3.0/3.2 0.0/1.1 3.0/2.1 3.0/4.3 4 3 4 4
Table 21 Velocity distributions for EWR Site K1 (riffle)
Lamouroux et al (1995)
Max. velocity (m/s) Frequency (%) of velocity (m/s) Discharge
(m3/s) Average
velocity (m/s) Measured Modelled 0-0.1 0.1-0.3 0.3-0.6 >0.6
0.05 0.05 0.15 86 14 0 0
0.10 0.07 0.20 75 25 0 0
0.25 0.12 0.2-0.44 0.35 54 43 3 0
0.50 0.19 0.55 39 43 18 0
1.00 0.26 0.08 30 35 30 5
1.66 0.36 0.78 1.1 20 26 39 15
2.00 0.39 1.2 18 24 38 20
Table 22 Ratings of habitat type abundance for EWR Site K2
Ecologist assessment (on-site & photographic)
Hydraulic rating using cross-section/3D spatial
model (calculated) Final rating Discharge
(m3/s)
SS SD FS FD SS SD FS FD SS SD FS FD
0.05 2/3 0/0 1/1 0/0 3 0 1 0
0.10 2/3 0/0 1/1 0/0 3 0 1 0
0.50 3/4 0/0 2/2 1/1 4 0 2 1
1.52 4 5 5 3
1.92 3 5 5 4 3/3 0/1 2/3 3/3 3 1 3 3
2.20 2 5 3 5
Page A - 60

AfriDev Consultants Pty Ltd 2005
DWAF Report No. RDM X100-01-CON-COMPR2-0604 Komati Catchment Ecological Water Requirements Study – Quantity Report
3.00 3/3 1/1 2/2 3/4 3 1 2 4
5.50 1 5 3 5
7.50 1 5 3 5 3/3 2/2 2/2 4/5 3 2 2 5
9.80 1 5 3 5 2/3 2/2 2/2 5/5 3 2 2 5
Page A - 61
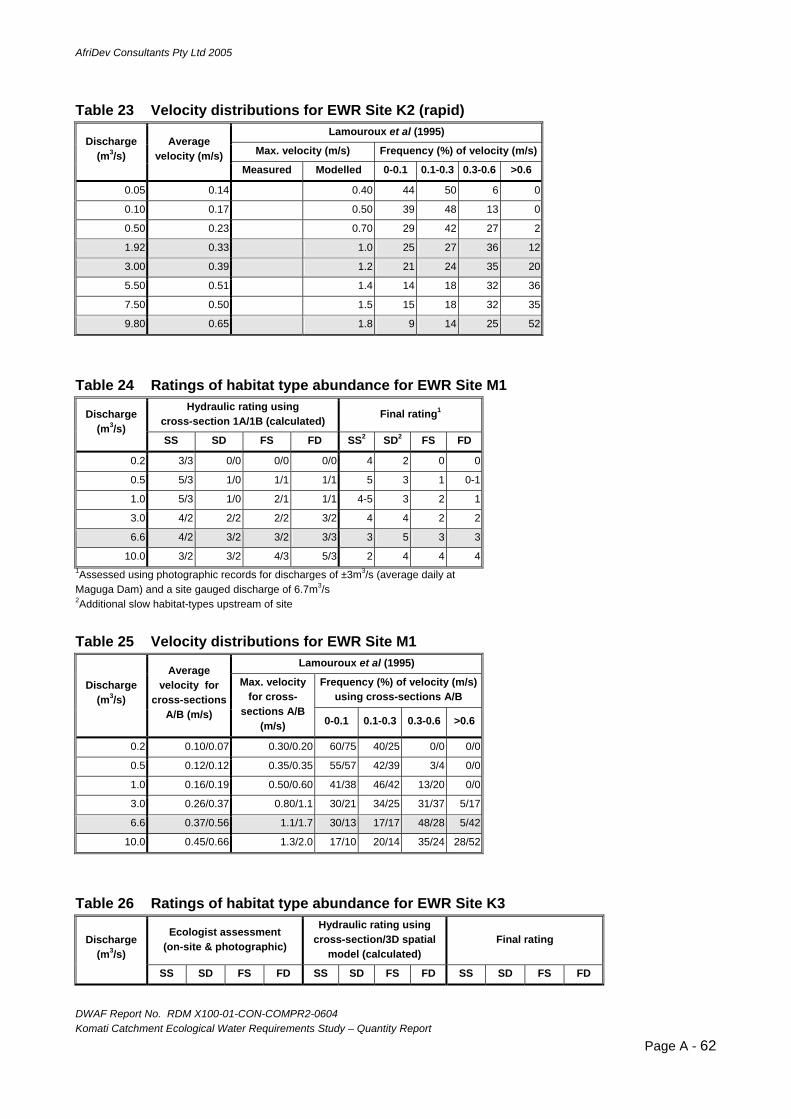
AfriDev Consultants Pty Ltd 2005
DWAF Report No. RDM X100-01-CON-COMPR2-0604 Komati Catchment Ecological Water Requirements Study – Quantity Report
Table 23 Velocity distributions for EWR Site K2 (rapid)
Lamouroux et al (1995)
Max. velocity (m/s) Frequency (%) of velocity (m/s) Discharge
(m3/s) Average
velocity (m/s) Measured Modelled 0-0.1 0.1-0.3 0.3-0.6 >0.6
0.05 0.14 0.40 44 50 6 0
0.10 0.17 0.50 39 48 13 0
0.50 0.23 0.70 29 42 27 2
1.92 0.33 1.0 25 27 36 12
3.00 0.39 1.2 21 24 35 20
5.50 0.51 1.4 14 18 32 36
7.50 0.50 1.5 15 18 32 35
9.80 0.65 1.8 9 14 25 52
Table 24 Ratings of habitat type abundance for EWR Site M1
Hydraulic rating using cross-section 1A/1B (calculated) Final rating1Discharge
(m3/s) SS SD FS FD SS2 SD2 FS FD
0.2 3/3 0/0 0/0 0/0 4 2 0 0
0.5 5/3 1/0 1/1 1/1 5 3 1 0-1
1.0 5/3 1/0 2/1 1/1 4-5 3 2 1
3.0 4/2 2/2 2/2 3/2 4 4 2 2
6.6 4/2 3/2 3/2 3/3 3 5 3 3
10.0 3/2 3/2 4/3 5/3 2 4 4 41Assessed using photographic records for discharges of ±3m3/s (average daily at Maguga Dam) and a site gauged discharge of 6.7m3/s 2Additional slow habitat-types upstream of site
Table 25 Velocity distributions for EWR Site M1
Lamouroux et al (1995)
Frequency (%) of velocity (m/s) using cross-sections A/B
Discharge (m3/s)
Average velocity for
cross-sections A/B (m/s)
Max. velocity for cross-
sections A/B (m/s) 0-0.1 0.1-0.3 0.3-0.6 >0.6
0.2 0.10/0.07 0.30/0.20 60/75 40/25 0/0 0/0
0.5 0.12/0.12 0.35/0.35 55/57 42/39 3/4 0/0
1.0 0.16/0.19 0.50/0.60 41/38 46/42 13/20 0/0
3.0 0.26/0.37 0.80/1.1 30/21 34/25 31/37 5/17
6.6 0.37/0.56 1.1/1.7 30/13 17/17 48/28 5/42
10.0 0.45/0.66 1.3/2.0 17/10 20/14 35/24 28/52
Table 26 Ratings of habitat type abundance for EWR Site K3
Ecologist assessment (on-site & photographic)
Hydraulic rating using cross-section/3D spatial
model (calculated) Final rating Discharge
(m3/s)
SS SD FS FD SS SD FS FD SS SD FS FD
Page A - 62
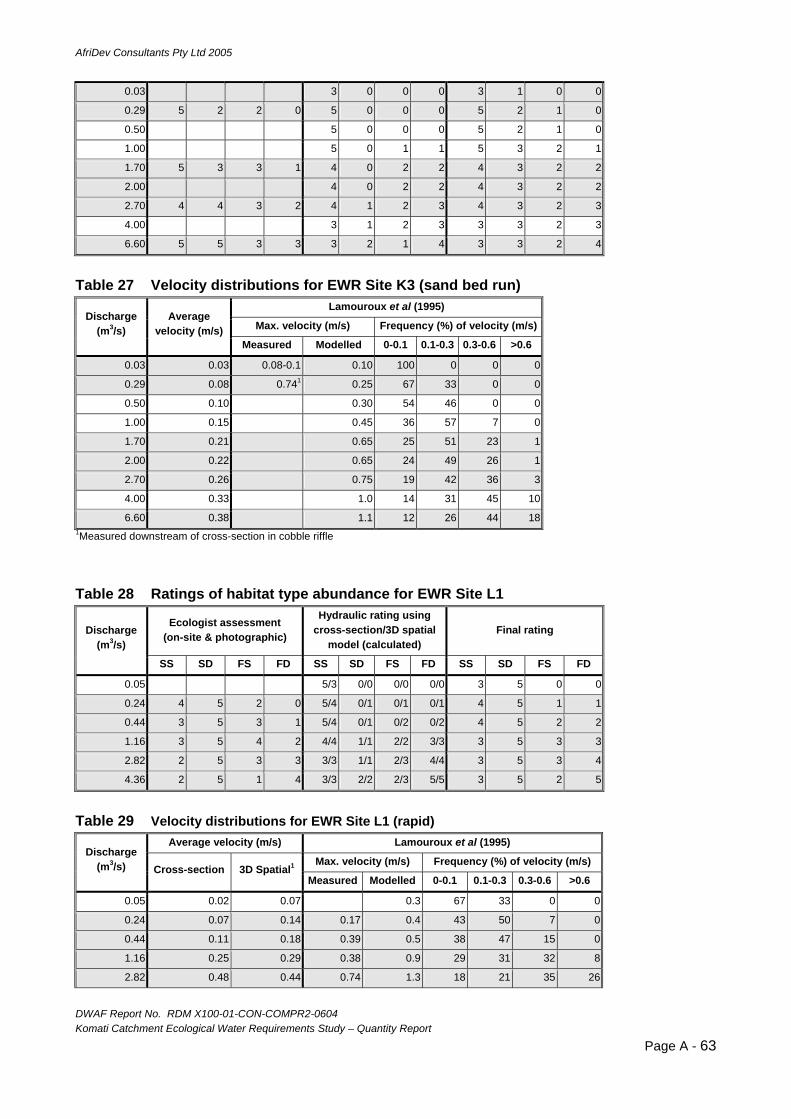
AfriDev Consultants Pty Ltd 2005
DWAF Report No. RDM X100-01-CON-COMPR2-0604 Komati Catchment Ecological Water Requirements Study – Quantity Report
0.03 3 0 0 0 3 1 0 0
0.29 5 2 2 0 5 0 0 0 5 2 1 0
0.50 5 0 0 0 5 2 1 0
1.00 5 0 1 1 5 3 2 1
1.70 5 3 3 1 4 0 2 2 4 3 2 2
2.00 4 0 2 2 4 3 2 2
2.70 4 4 3 2 4 1 2 3 4 3 2 3
4.00 3 1 2 3 3 3 2 3
6.60 5 5 3 3 3 2 1 4 3 3 2 4
Table 27 Velocity distributions for EWR Site K3 (sand bed run)
Lamouroux et al (1995)
Max. velocity (m/s) Frequency (%) of velocity (m/s) Discharge
(m3/s) Average
velocity (m/s) Measured Modelled 0-0.1 0.1-0.3 0.3-0.6 >0.6
0.03 0.03 0.08-0.1 0.10 100 0 0 0
0.29 0.08 0.741 0.25 67 33 0 0
0.50 0.10 0.30 54 46 0 0
1.00 0.15 0.45 36 57 7 0
1.70 0.21 0.65 25 51 23 1
2.00 0.22 0.65 24 49 26 1
2.70 0.26 0.75 19 42 36 3
4.00 0.33 1.0 14 31 45 10
6.60 0.38 1.1 12 26 44 181Measured downstream of cross-section in cobble riffle
Table 28 Ratings of habitat type abundance for EWR Site L1
Ecologist assessment (on-site & photographic)
Hydraulic rating using cross-section/3D spatial
model (calculated) Final rating Discharge
(m3/s)
SS SD FS FD SS SD FS FD SS SD FS FD
0.05 5/3 0/0 0/0 0/0 3 5 0 0
0.24 4 5 2 0 5/4 0/1 0/1 0/1 4 5 1 1
0.44 3 5 3 1 5/4 0/1 0/2 0/2 4 5 2 2
1.16 3 5 4 2 4/4 1/1 2/2 3/3 3 5 3 3
2.82 2 5 3 3 3/3 1/1 2/3 4/4 3 5 3 4
4.36 2 5 1 4 3/3 2/2 2/3 5/5 3 5 2 5
Table 29 Velocity distributions for EWR Site L1 (rapid)
Average velocity (m/s) Lamouroux et al (1995)
Max. velocity (m/s) Frequency (%) of velocity (m/s) Discharge
(m3/s) Cross-section 3D Spatial1Measured Modelled 0-0.1 0.1-0.3 0.3-0.6 >0.6
0.05 0.02 0.07 0.3 67 33 0 0
0.24 0.07 0.14 0.17 0.4 43 50 7 0
0.44 0.11 0.18 0.39 0.5 38 47 15 0
1.16 0.25 0.29 0.38 0.9 29 31 32 8
2.82 0.48 0.44 0.74 1.3 18 21 35 26
Page A - 63
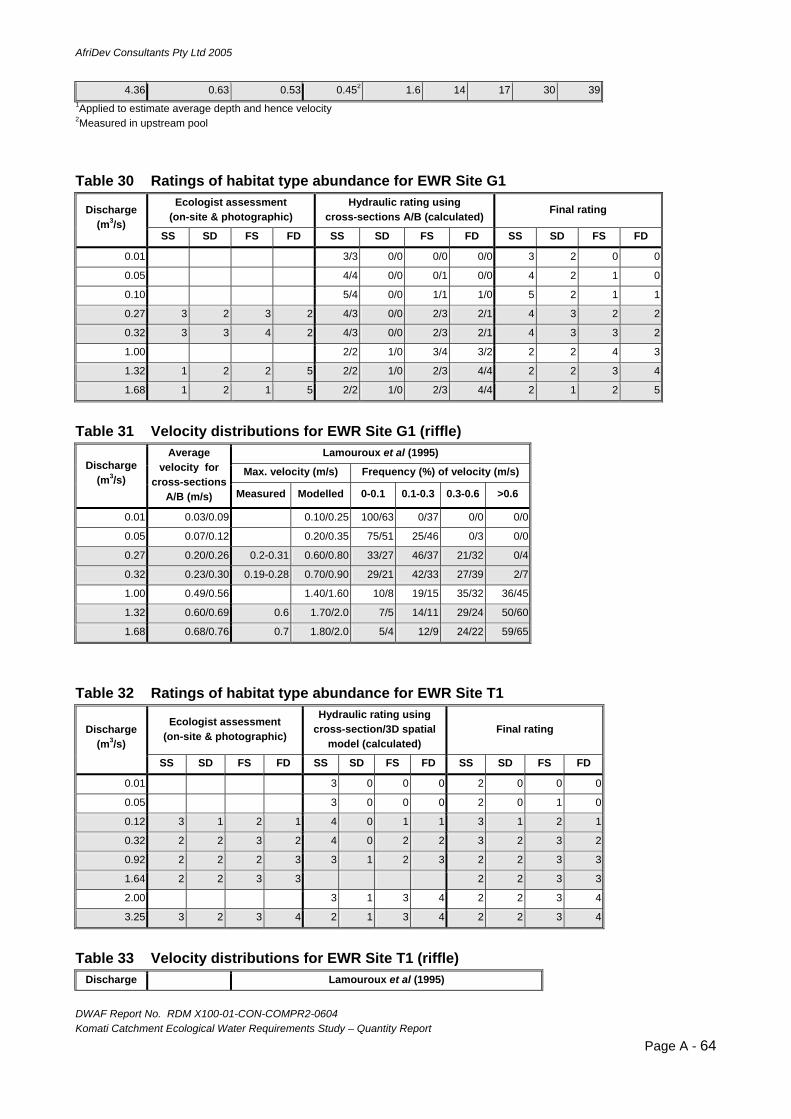
AfriDev Consultants Pty Ltd 2005
DWAF Report No. RDM X100-01-CON-COMPR2-0604 Komati Catchment Ecological Water Requirements Study – Quantity Report
4.36 0.63 0.53 0.452 1.6 14 17 30 39 1Applied to estimate average depth and hence velocity 2Measured in upstream pool
Table 30 Ratings of habitat type abundance for EWR Site G1
Ecologist assessment (on-site & photographic)
Hydraulic rating using cross-sections A/B (calculated) Final rating Discharge
(m3/s) SS SD FS FD SS SD FS FD SS SD FS FD
0.01 3/3 0/0 0/0 0/0 3 2 0 0
0.05 4/4 0/0 0/1 0/0 4 2 1 0
0.10 5/4 0/0 1/1 1/0 5 2 1 1
0.27 3 2 3 2 4/3 0/0 2/3 2/1 4 3 2 2
0.32 3 3 4 2 4/3 0/0 2/3 2/1 4 3 3 2
1.00 2/2 1/0 3/4 3/2 2 2 4 3
1.32 1 2 2 5 2/2 1/0 2/3 4/4 2 2 3 4
1.68 1 2 1 5 2/2 1/0 2/3 4/4 2 1 2 5
Table 31 Velocity distributions for EWR Site G1 (riffle)
Lamouroux et al (1995)
Max. velocity (m/s) Frequency (%) of velocity (m/s) Discharge (m3/s)
Average velocity for
cross-sections A/B (m/s) Measured Modelled 0-0.1 0.1-0.3 0.3-0.6 >0.6
0.01 0.03/0.09 0.10/0.25 100/63 0/37 0/0 0/0
0.05 0.07/0.12 0.20/0.35 75/51 25/46 0/3 0/0
0.27 0.20/0.26 0.2-0.31 0.60/0.80 33/27 46/37 21/32 0/4
0.32 0.23/0.30 0.19-0.28 0.70/0.90 29/21 42/33 27/39 2/7
1.00 0.49/0.56 1.40/1.60 10/8 19/15 35/32 36/45
1.32 0.60/0.69 0.6 1.70/2.0 7/5 14/11 29/24 50/60
1.68 0.68/0.76 0.7 1.80/2.0 5/4 12/9 24/22 59/65
Table 32 Ratings of habitat type abundance for EWR Site T1
Ecologist assessment (on-site & photographic)
Hydraulic rating using cross-section/3D spatial
model (calculated) Final rating Discharge
(m3/s)
SS SD FS FD SS SD FS FD SS SD FS FD
0.01 3 0 0 0 2 0 0 0
0.05 3 0 0 0 2 0 1 0
0.12 3 1 2 1 4 0 1 1 3 1 2 1
0.32 2 2 3 2 4 0 2 2 3 2 3 2
0.92 2 2 2 3 3 1 2 3 2 2 3 3
1.64 2 2 3 3 2 2 3 3
2.00 3 1 3 4 2 2 3 4
3.25 3 2 3 4 2 1 3 4 2 2 3 4
Table 33 Velocity distributions for EWR Site T1 (riffle)
Discharge Lamouroux et al (1995)
Page A - 64

AfriDev Consultants Pty Ltd 2005
DWAF Report No. RDM X100-01-CON-COMPR2-0604 Komati Catchment Ecological Water Requirements Study – Quantity Report
Max. velocity (m/s) Frequency (%) of velocity (m/s) (m3/s) Average velocity (m/s) Measured Modelled 0-0.1 0.1-0.3 0.3-0.6 >0.6
0.01 0.02 0.05 100 0 0 0
0.05 0.07 0.20 75 25 0 0
0.12 0.12 0.2 0.35 59 37 4 0
0.32 0.21 0.2 0.65 38 39 22 1
0.50 0.27 0.80 31 33 31 5
0.92 0.37 0.44 1.10 21 25 37 17
2.00 0.57 1.70 12 16 28 44
3.25 0.78 1.0 2.20 6 11 20 63
5 THREE-DIMENSIONAL SPATIAL MODELLING The 3D spatial modelling was undertaken using QuickSURF, RiverCAD and HEACRAS (refer to Jordanova et al, 2004), and examples of the graphical output are provided in Sections 5.1, 5.2 and 5.3 for EWR Sites K1, K2 and L1, respectively.
Page A - 65
AfriDev Consultants Pty Ltd 2005
DWAF Report No. RDM X100-01-CON-COMPR2-0604 Komati Catchment Ecological Water Requirements Study – Quantity Report
5.1 EWR SITE K1 ON THE KOMATI RIVER Figure 20 is an example of the results from the 3D spatial modelling for EWR Site K1. The yellow transects (nine) indicate the positions of cross-sections cut from the DTM. The flow direction is from right to left, with the most downstream transect corresponding to cross-section A. The greennumbers indicate the positions of surveyed riparian vegetation. For a measured discharge of 1.66m3/s (refer to Table 7), dark and light blue hatching illustrates regions of shallow (<0.3m) and deep(>0.3m) flow. Post-processing of inundated areas was used to compare with results of the cross-sectional analyses described in Section 1.1. 5.2 EWR SITE K2 ON THE KOMATI RIVER Figure 21 is an example of the results from the 3D spatial modelling for EWR Site K2. The yellow transects indicate the positions of cross-sections cut from the DTM. The flow direction is from right to left, with the most downstream transect corresponding to cross-section A. The green numbersindicate the positions of surveyed riparian vegetation, and zones have been demarcated whereappropriate. For a measured discharge of 2.2 m3/s (refer to Table 7), dark and light blue hatchingillustrates regions of shallow (<0.3m) and deep (>0.3m) flow. 5.3 EWR SITE L1 ON THE LOMATI RIVER Figure 22 is an example of the results from the 3D spatial modelling for EWR Site 7. The yellowtransects indicate the positions of cross-sections cut from the DTM. The flow direction is from bottom/right to top/left, with the most downstream transect corresponding to cross-section A. Thegreen numbers indicate the positions of surveyed riparian vegetation, and zones have beendemarcated where appropriate. For a measured discharge of 0.44 m3/s (refer to Table 7), darkand light blue hatching illustrates regions of shallow (<0.3m) and deep (>0.3m) flow.
Page A - 66

AfriDev Consultants Pty Ltd 2005
DWAF Report No. RDM X100-01-CON-COMPR2-0604 Komati Catchment Ecological Water Requirements Study – Quantity Report
Figure 20 Example of the graphical output from the 3D spatial modelling for EWR Site K1 on the
Komati River.
Page A - 67

AfriDev Consultants Pty Ltd 2005
DWAF Report No. RDM X100-01-CON-COMPR2-0604 Komati Catchment Ecological Water Requirements Study – Quantity Report
Figure 21 Example of the graphical output from the 3D spatial modelling for EWR Site K2 on the
Komati River.
Page A - 68

AfriDev Consultants Pty Ltd 2005
DWAF Report No. RDM X100-01-CON-COMPR2-0604 Komati Catchment Ecological Water Requirements Study – Quantity Report
Figure 22 Example of the graphical output from the 3D spatial modelling for EWR Site L1 on the
Komati River.
Page A - 69

AfriDev Consultants Pty Ltd 2005
DWAF Report No. RDM X100-01-CON-COMPR2-0604 Komati Catchment Ecological Water Requirements Study – Quantity Report
CONFIDENCE IN THE HYDRAULIC CHARCATERISATIONS The confidence in the characterisations of the hydraulic relationships are provided in Table 34. “Site character” refers to the suitability of the site for hydraulic modelling, “available data” refers to the range of measured rating data, and the final column refers to the confidence in the hydraulic characterisations with reference to the ecological low and high flow recommendations. Table 34 Confidence in the hydraulic characterisations
Evaluation criterion
Output2River & site number EWR site1 Available data
low/high=overall low flows high flows
Komati 1 3 4/0=2 5 2
Measured flows in the range 0.25 to 2.66m3/s. Recommended low-flows for the PES (B/C) in the range 0.25 to 1.5m3/s (ie. within measured range), and high flows in the range 3.6-30 (within year) to 49-152 (1:2-1:20) (ie. all high flows above measured values).
Komati 2 3 3/3=3 2.5 4
Measured flows in the range 1.9 to 62.7m3/s. Recommended low-flows for the PES (C) in the range 0.5 to 2.2m3/s (ie. mostly below lowest measured value), and high flows in the range 7.3-55 (within year) (ie. within measured range) to 86-382 (1:2-1:20) (ie. above measured values but reasonable estimates of flow resistance and energy slope for hydraulic modelling).
Maguga 1 3 2/3=3 2 3
Measured flows in the range 6.7 to 40m3/s. Recommended low-flows for the PES (C) in the range 1.0 to 9m3/s (ie. mostly below lowest measured value of 6.7m3/s), and high flows in the range (14-217) (within year) to 241-1637 (1:2-1:20).
Komati 3 3 4/0=2 3 2
Measured flows in the range 0.031 to 6.6m3/s. Recommended low-flows for a Category D (PES=E) in the range 0.29 to 4.0m3/s (ie. within measured range – but concern regarding backup from the raised downstream weir), and high flows in the range 12-84 (within year) to 140-663 (1:2-1:20) (ie. above measured values and concern regarding backup from raised downstream weir).
Lomati 2 2 4/1=2.5 4 2
Measured flows in the range 0.44 to 4.4m3/s. Recommended low-flows for the PES (C/D) in the range 0.20 to 2.0m3/s (ie. min. value is half lowest measured flow), and high flows in the range 2.6-21 (within year) and 30 (1:2) (ie. above measured values).
Teespruit 1 4 4/0=2 5 3
Measured flows in the range 0.12 to 3.25m3/s. Recommended low-flows for the PES (C) in the range 0.1 to 0.6m3/s, and high flows in the range 2.5-20 (within year) and 29-317 (1:2-1:20).
Gladdespruit 1 4 4/0=2 2.5 2.5
Measured flows in the range 0.27 to 1.68m3/s. Recommended low-flows for the PES (D) in the range 0.08 to 0.32m3/s, and high flows in the range 0.6-4.8 (within year) (ie. slightly above measured range) and 7-103 (1:2-1:20) (ie. above highest measured value).
Range of values: 0=none, 1=low, 2=low/medium, 3=medium, 4=medium/high, 5=high1Refers to site characteristics – see advantages and disadvantages in Resource Unit Report 2Refers to the recommended flows for the PES or relevant category.
Page A - 70
AfriDev Consultants Pty Ltd 2005
DWAF Report No. RDM X100-01-CON-COMPR2-0604 Komati Catchment Ecological Water Requirements Study – Quantity Report
Page A - 71
6 REFERENCES Birkhead AL (2002) The procedure for generating hydraulic information for the Intermediate and
Comprehensive Ecological Reserves (Quantity). Appendix in Resource Directed Measures for Protection of Water Resources: River Ecosystems - Revision of the quantity component (Louw MD and Hughes DA, eds). Prepared for the Department of Water Affairs and Forestry, South Africa.
DWAF, 1999. Resource directed measures for the protection of water resources. Volume 3:River ecosystems, Version 1.0. Department of Water Affairs and Forestry, Pretoria, South Africa. Internet address: http://www-dwaf.pwv.gov.za/Directorates/IWQS/waterlaw/index.html
Jordanova AA, Birkhead AL, James CS, and Kleynhans CL, 2004. Hydraulics for determination of the ecological Reserve for rivers. Report to the Water Research Commission on the project “Hydraulic analyses for the determination of the ecological Reserve for rivers”. WRC Report no. 1174/0/1.
Kleynhans, CL (1999). The development of a fish index to assess the biological integrity of South African rivers, Water SA, Vol. 25, No. 3, pp 265-278.
Lamouroux, N, Souchon, Y and Herouin, E (1995). Predicting velocity frequency distributions in stream reaches, Water Resources Research, Vol. 31, No. 9, pp 2367-2375.
Lamouroux, N (1998). Depth Probability Distributions in Stream Reaches, Journal of Hydraulic Engineering, February, pp 224-227.
O'Keeffe, J and Hughes, DA (2004). Flow-Stressor Response approach to environmental flow requirement assessment. In: Hughes, DA (ed) SPATSIM, an integrating framework for ecological Reserve determination and implementation. Water Research Commission Report No. 1160/1/04, Pretoria, South Africa.
O’Keeffe JH, Hughes, DA and Tharme R (2002). Linking ecological responses to altered flows, for use in enviromental flow assessments: the Flow Stress-Response method. Proceedings of the International Association of Theoretical and Applied Limnology, 28, 84-92.
Oswood, ME and Barber, WE (1982). Assessment of fish habitat in streams: Goals, constraints, and a new technique, Fishers, No. 7, pp 8-1.
Rowlston, B, Jordanova AA and Birkhead AL (2000) Hydraulics In: Environmental flow assessment for rivers: Manual for the Building Block Methodology, King, JM, Tharme, RE and de Villiers, MS, (eds), Water Research Commission report No.TT 131/00, Pretoria, South Africa.
Tharme RE (1996). Review of international methodologies for the quantification of the instream flow requirements of rivers. Water law review. Final report for policy development. Commissioned y the Department of Water Affairs and Forestry, Pretoria. Freshwater Research Unit, University of Cape Town, Cape Town. 116pp.

AfriDev Consultants (Pty) Ltd 2005
DWAF Report No. RDM X100-01-CON-COMPR2-0604 Komati River Catchment Ecological Water Requirements Study – Quantity Report
Page B - 1
Appendix B: Geomorphology
KM Rowntree, Catchment Research Group
Table of Contents 1. INTRODUCTION......................................................................................................5
1.1 Aims of this report .............................................................................................5 1.2 Conceptual background ....................................................................................5
2. GEOMORPHOLOGICAL DRIVERS.........................................................................6 2.1 Event hydrology.................................................................................................6 2.2 Sediment inputs.................................................................................................6 2.3 Vegetation .........................................................................................................7 2.4 Channel obstructions.........................................................................................7 2.5 Channel engineering .........................................................................................7
3. METHODS ...............................................................................................................8 3.1 Flow And Maintaining Geomorphological Function ...........................................8 3.2 Assessment of Present Ecological state ...........................................................9 3.3 Assessment of reference condition .................................................................11 3.4 Assessment of present day channel morphology and morphological change .11 3.5 Assessment of event hydrology ......................................................................11 3.6 Assessment of sediment input ........................................................................12 3.7 Assessment of vegetation change...................................................................12 3.8 Assessment of artificial channel structures. ....................................................13
4. OVERVIEW OF REFERENCE CONDITIONS........................................................13 5. EWR SITE K1: GEVONDEN ..................................................................................15
5.1 Reference Condition (Category A) ..................................................................15 5.2 Present Ecological State (PES).......................................................................15 5.3 Causes of Degradation....................................................................................16 5.4 Trend...............................................................................................................16 5.5 Alternative EC up ............................................................................................16 5.6 Alternative EC down........................................................................................16
6. EWR SITE K2: KROMDRAAI .................................................................................16 6.1 Reference Condition (Category A) ..................................................................16 6.2 Present Ecological State (PES).......................................................................17 6.3 Causes of Degradation....................................................................................17 6.4 Trend...............................................................................................................18 6.5 Alternative EC up ............................................................................................18 6.6 Alternative EC down........................................................................................18
7. EWR SITE K3: TONGA..........................................................................................18 7.1 Reference Condition (Category A) ..................................................................18 7.2 Present Ecological State (PES).......................................................................18 7.3 Causes of Degradation....................................................................................19 7.4 Trend...............................................................................................................19
AfriDev Consultants (Pty) Ltd 2005
DWAF Report No. RDM X100-01-CON-COMPR2-0604 Komati River Catchment Ecological Water Requirements Study – Quantity Report
Page B - 2
7.5 Alternative EC up ............................................................................................20 8. EWR SITE G1: VAALKOP......................................................................................20
8.1 Reference Condition (Category A) ..................................................................20 8.2 Present Ecological State (PES).......................................................................20 8.3 Causes of Degradation....................................................................................21 8.4 Trend...............................................................................................................21 8.5 Alternative EC up ............................................................................................21 8.6 Alternative EC down........................................................................................21
9. EWR SITE T1: TEESPRUIT...................................................................................22 9.1 Reference Condition (Category A) ..................................................................22 9.2 Present Ecological State (PES).......................................................................22 9.3 Causes of Degradation....................................................................................22 9.4 Trend...............................................................................................................23 9.5 Alternative EC up PES ....................................................................................23 9.6 Alternative EC down........................................................................................23
10. EWR SITE M1: SILINGANI.................................................................................23 10.1 Reference Condition (Category A) ..................................................................23 10.2 Present Ecological State (PES).......................................................................23 10.3 Causes of Degradation....................................................................................24 10.4 Trend...............................................................................................................25 10.5 Alternative EC up ............................................................................................25 10.6 Alternative EC down........................................................................................25
11. EWR SITE L1: KLEINDORINGKOP ...................................................................26 11.1 Reference Condition (Category A) ..................................................................26 11.2 Present Ecological State (PES).......................................................................26 11.3 Causes of Degradation....................................................................................27 11.4 Trend...............................................................................................................27 11.5 Alternative EC up ............................................................................................27 11.6 Alternative EC down........................................................................................27
12. CONCLUSIONS .................................................................................................28 12.1 Assessment of PES.........................................................................................28
REFERENCES ..............................................................................................................29
Annexures ANNEXURE 1: Potential Bed Material Load 30 ANNEXURE 2: Particle Size distribution 34 ANNEXURE 3: PES and Alternative EC’s per EWR site. 36
List of Tables Table 1. Availability of aerial photography for EWR sites .............................................10 Table 2. Dams in the Komati catchment.......................................................................11 Table 3. Estimated impact of dams on downstream sites.............................................12 Table 4. Overview of geomorphological attributes of study reaches.............................14
AfriDev Consultants (Pty) Ltd 2005
DWAF Report No. RDM X100-01-CON-COMPR2-0604 Komati River Catchment Ecological Water Requirements Study – Quantity Report
Page B - 3
ABBREVIATIONS EC Ecological Category EWR Ecological Water Requirement MAR Mean Annual Runoff PES Present Ecological State GLOSSARY CAUSE A stressor that occurs at an intensity, duration and
frequency of exposure that results in a change in the geomorphological conditions.
DRIVING FORCES These are the underlying social and economic activities that lead to environmental change. Population growth, poverty, agriculture and industrial production are common examples.
ECOLOGICAL CATEGORY A category indicating the potential management target. Values range from Category A (unmodified, natural) to Category D (largely modified). This term replaces former terms used, namely: Ecological Reserve Category (ERC), Desired Future State (DFS) and Ecological Management Class (EMC). The reasons for these changes are explained in the proceedings of a workshop to clarify the terminology used in Reserve determinations (DWAF 2003). A distinction is made between Management Classes, which form part of the National Classification System, and Ecological Categories, which forms part of the Ecological Water Requirement assessment.
ECOLOGICAL RESERVE The quantity and quality of water required to protect aquatic ecosystems in order to secure ecologically sustainable development and use of the relevant water resource (Chapter 1:1(xvii)(b) NWA, 1998).
ECOLOGICAL WATER REQUIREMENT This term refers to both quality and quantity (i.e., once the water quality component is incorporated into the flow recommendation). Ecological Water Requirements are used as input into Scenario Modelling
ECOSTATUS An overall assessment of the Ecological Category (A-F), based on a subjective integration of specialist indices (water quality, fish etc).
EFFECT A geomorphological change traceable to a cause. HIGH FLOW This term refers to the peaks in the daily
hydrograph, determined graphically from daily time series of flows (see low flows).
IMPACTS These are the consequences of the pressures on the environment, for example reductions in biodiversity, soil degradation, poor human health, and lack of clean, safe water.

AfriDev Consultants (Pty) Ltd 2005
DWAF Report No. RDM X100-01-CON-COMPR2-0604 Komati River Catchment Ecological Water Requirements Study – Quantity Report
Page B - 4
INSTREAM FLOW REQUIREMENTS (IFR)The flow patterns (magnitude, timing and duration) needed to maintain a riverine ecosystem in a particular condition. This term is used to refer to the quantity component of river flow requirements only.
PRESENT ECOLOGICAL STATE (PES) The degree to which present conditions of an area have been modified from natural (reference) conditions. The measure is based on water quality variables, biotic indicators and habitat information collected 1 to 3 years prior to the assessment. Values range from Category A (largely natural) to Category F (critically modified).
REFERENCE CONDITION The natural ecological conditions for a particular Resource Unit. The reference conditions define “protected” water resources and may be used to calibrate the other categories.
RESERVE The quantity and quality of water required (a) to satisfy basic human needs by securing a basic water supply, as prescribed under the Water Services Act, 1997 (Act No. 108 of 1997), for people who are now or who will, in the reasonably near future, be (i) relying upon; (ii) taking water from; or (iii) being supplied from, the relevant water resource; and (b) to protect aquatic ecosystems under the National Water Act, 1998 (Act No. 36 of 1998) in order to secure ecologically sustainable development and use of the relevant water resource. The Reserve refers to the modified EWR, where operational limitations and stakeholder consultation are taken into account.
RESOURCE UNIT An area of ecological similarity for which a distinct ecological Reserve and present state are determined.
RIPARIAN HABITAT The physical structure and associated vegetation of the areas associated with a watercourse which are commonly characterised by alluvial soils, and which are inundated or flooded to an extent and with a frequency sufficient to support vegetation of species with a composition and physical structure distinct from those of adjacent land areas.
RIPARIAN Pertaining to the river bank. SOURCE A source is the origin of a stressor. It is an entity or
action that releases or imposes a stressor to the waterbody
STATE This component describes the current state of the environment and recent trends in environmental quality.

AfriDev Consultants (Pty) Ltd 2005
DWAF Report No. RDM X100-01-CON-COMPR2-0604 Komati River Catchment Ecological Water Requirements Study – Quantity Report
1. INTRODUCTION
1.1 AIMS OF THIS REPORT
The aim of this report is to determine a Present Ecological Category for geomorphology at the selected Ecological Water Requirement (EWR) sites and to then describe two alternative categories (better and worse states). The report also identifies possible causes of degradation at each site and predicts future trends. Each EWR site is assumed to represent a resource unit in the Komati Basin. The report also provides background to the steps followed to determine the recommended flows required to meet geomorphological objectives for the water resource. Channel morphology is the ongoing expression of the balance between erosion and deposition of sediment within the water course. Sediment comprises the channel banks and the channel bed, thus contributing a substratum for both riparian and in-channel fauna and flora. The driving force for sediment transport processes is the flow; therefore the key driver of the geomorphological system is flood hydrology. The ecological category for geomorphology is therefore based on both an assessment of the extent to which the sediment balance of the representative site has been changed. This can only be done if the site is contextualised within the geomorphic system of the river catchment. The catchment is the source of sediment for the river system, as well as the floods that transport that sediment. It is also important to consider connectivity within the catchment and river system that controls the downstream progression of sediment. Dams and weirs are significant manmade structures that decrease system connectivity. At the site, the channel gradient is a ‘fixed’ variable that influences erosion and deposition processes, while vegetation is a ‘mutable’ variable that affects channel stability.
1.2 CONCEPTUAL BACKGROUND The Present Ecological State (PES) of a river is an assessment of the degree to which the present river ecosystem has been modified from the natural condition, and the extent to which the health of the ecosystem may be compromised by the capacity of the river to provide the range of habitats, in an appropriate quantity and quality, necessary to support it. While ecosystems are in part driven by biotic interactions (competition by alien invasive species is a good example), the availability of suitable habitat is a key criterion for ecosystem health.Channel morphology is an important habitat component because it determines the distribution of water and its hydraulic characteristics (e.g. depth and velocity) at any given discharge. Sediment ( in the form of clay, silt, sand, gravel, cobbles or boulders) or bedrock make up the morphological units and at the same time provide the substrate for vegetation and for aquatic fauna. The PES for the Komati sites has been assessed according to the system under development by Kleynhans and others through the Ecostatus project. This system considers geomorphology to be one of three drivers of habitat quality: hydrology, water quality and geomorphology. Geomorphology in turn is a response to its own set of drivers, these being event hydrology, sediment input, vegetation change, construction of artificial channel obstructions and channel engineering activities. These are considered at the scale of the channel reach within which a study site is located. It should be noted that the reach is part of a cascading system, the channel network, and therefore receives inputs both from the adjacent catchment and from the upstream reach. Each of the key drivers and the possible impacts of human activity are reviewed below.
Page B - 5
AfriDev Consultants (Pty) Ltd 2005
DWAF Report No. RDM X100-01-CON-COMPR2-0604 Komati River Catchment Ecological Water Requirements Study – Quantity Report
2. GEOMORPHOLOGICAL DRIVERS
2.1 EVENT HYDROLOGY Channel morphology is to a large extent flood driven and at any time reflects the history of past flood events. In general the size of the channel (its width and depth) can be related to the frequency and size of flood events. In many environments it appears that frequent floods of moderate magnitude (once every one to two years) are the most effective in transporting sediment and controlling the channel morphology, but any flow with sufficient stream power to initiate sediment movement will contribute to the process of morphological adjustment. Large upstream dams that trap many of the smaller floods have been shown to have major impacts on downstream channels. Land use change that impacts on floods, such as urban development, will also contribute to morphological change. The main impact of flood driven morphological change on habitat quality will be on the width and depth of the channel. Channel complexity may also be changed; for example the loss of secondary channels resulting from a reduced frequency of floods. In the long term, changes to the flood regime may also impact on riffle-pool spacing and meander wavelength of gravel bed channels. The nature and speed of changes driven by event hydrology are dependent on sediment supply, considered below.
2.2 SEDIMENT INPUTS Sediment is a major determinant of channel morphology and habitat quality. Changes to the total amount and the size of the sediment are both important considerations. These changes can be related to the catchment sediment yield, the rate of upstream bank erosion, or to storage of sediment within the channel system. Catchment sediment yields are sensitive to any land use that results in a reduction in plant cover or an increase in overland flow. Gully erosion is a good indicator of increased sediment yield. It should be noted that erosion control works in the catchment can reduce the sediment yield. The upstream channel may be an important sediment source. Bank erosion and channel incision are both possible sources of sediment. A major cause of reduced sediment inputs is an upstream dam. Most dams have a trap efficiency close to 100% for the coarse sediment that makes up the bed material and contributes to channel morphology. Weirs are also important sediment storage areas. The sediment supply to the channel reach is important in determining how quickly channel transformation in response to reductions in event hydrology can take place. For example, closure of secondary channels requires an input of sediment, as does the construction of lateral bars and benches associated with channel narrowing. Changes to the sediment load also have a direct effect on channel morphology and habitat. An increase in coarse sediment carried as bedload tends to lead to a wider, steeper channel, a reduction in meandering, and the development of sedimentary bars within the channel itself. An increase in the fine sediment load (wash load) tends to cause the channel to become narrower and deeper and enhances meandering. The ranges in sediment size are important in determining the quality of the substrate. A
Page B - 6
AfriDev Consultants (Pty) Ltd 2005
DWAF Report No. RDM X100-01-CON-COMPR2-0604 Komati River Catchment Ecological Water Requirements Study – Quantity Report
mixture of sediment sizes from fine gravels to cobble or boulder, if well sorted on the bed, enhances habitat quality. If not well sorted, so that fines cause interstitial spaces to become filled, and cobbles to become embedded in fines, habitat quality is lost. To maintain good sorting it is necessary to ensure that most of the bed is periodically mobilised and that the recession of the flood hydrograph is not too steep to prevent “dumping”of fines.
2.3 VEGETATION Vegetation is a geomorphological driver, a habitat component and a part of the ecosystem biota. It must therefore be evaluated in terms of all three of these roles. Here, we consider only its geomorphological role. Vegetation, through offering resistance to erosion, increases bank stability. Through adding to perimeter roughness it reduces flow velocities and enhances sediment deposition. At the same time the vegetation is either preserving or creating the habitat on which it grows. Thus vegetation and geomorphology are interdependent. In general terms, channels with woody bank vegetation tend to be narrower and deeper than channels with grassy banks. Thus removal of woody components will lead to bank erosion and channel widening; an increase in woody components will lead to channel narrowing and deepening. This appears to be a common response to invasion by woody aliens. Vegetation plays an important part in creating stable channel forms that can absorb variable inputs in terms of flood events. The rate of channel change and the rate at which vegetation can colonize and stabilize new ground are closely related. Encroachment of sedimentary bars by vegetation is a good indicator of incipient channel change in response to a reduction of flood events. As a general rule, any disturbance to natural riparian vegetation is likely to decrease the stability of the channel. Felling trees or heavy grazing by livestock or game would be examples. Invasion of the riparian zone by alien vegetation is another process likely to impact on geomorphological processes.
2.4 CHANNEL OBSTRUCTIONS Obstructions across the channel may be in the form of weirs or causeways. Bridges may also become blocked by woody debris, effectively causing a debris dam. The immediate effect of such artificial obstructions is to alter the longitudinal morphology. For example a weir creates a long pool upstream and a waterfall at the weir. These obstructions also trap sediment, at least until they are full. Their impact on habitat will therefore be to increase the length, and possibly depth, of pools, possible loss of mixed flow habitats associated with riffles or rapids, and an increase in the area of the channel bed covered by finer sediment. Below the weir scouring of finer sediments by ‘clean’ water will increase exposure of bedrock and boulders.
2.5 CHANNEL ENGINEERING The morphology of the channel and the perimeter conditions can be altered directly by engineering activities. The most extreme case is where a channel is converted into a concrete canal, thus altering both the shape of the channel and the fabric of the perimeter. Channel straightening and/or widening may be carried out to drain farmland or as part of a flood control scheme. Straightening a meandering channel also has the effect of steepening the channel gradient, often leading to channel incision. More moderate interventions include bank stabilization using gabions or revetments. Bridges act as local points of channel change due to engineering structures.
Page B - 7

AfriDev Consultants (Pty) Ltd 2005
DWAF Report No. RDM X100-01-CON-COMPR2-0604 Komati River Catchment Ecological Water Requirements Study – Quantity Report
The habitat response to channel engineering will depend on the nature and extent of the activity, but in general there is likely to be a loss of habitat diversity. Canals for example lack pools or riffles and are dominated by run type flows.
3. METHODS
3.1 FLOW AND MAINTAINING GEOMORPHOLOGICAL FUNCTION Channel morphology is highly dependent on the suite of flood flows that over time transport sediment through the channel and maintain the sediment balance within the river reach. The focus of flow recommendations for geomorphology is therefore the flood or high flow component. Two main groups of criteria are used to recommend flows: firstly the sediment transport capacity of flows relative to available sediment and secondly the channel morphology itself, which has been shaped by past flows. Theoretical background and details of methods used has been given in Rowntree (2000). Sediment transport is important in two respects. Firstly, in a coarse bed made up of coarse gravels or cobbles it is necessary to provide flows of a sufficient competence to overturn individual clasts. This maintains the mobility of the bed and prevents fine material infilling initially open structures that provide important cover and habitat. Secondly, it is important to provide a sufficient capacity of flow to transport available sediment trough the reach so as to maintain the sediment balance. A loss of transport capacity relative to the sediment supply will result in sediment deposition and channel aggradation. The converse will be erosion and channel degradation. The size of a channel (width and depth) is a function of the magnitude and frequency of floods. It is commonly accepted that the mean annual flood is a good indictor of channel size and can be related to morphological features such as the top of the channel bank. In incised a narrow flood bench may be equivalent to the flood plain of an unconfined channel. Reduction in the size of the mean annual flood could result in a smaller channel, as well as loss of features such as secondary channels. Other floods of a greater or lesser frequency can be related to other morphological features. These features are therefore used as indicators of the magnitude and frequency of floods that are responsible for creating and maintaining channel morphology. A group of floods are therefore believed to be effective at transporting sediment and creating the channel morphology. These floods are together known as the effective discharge (Dollar and Rowntree (2003). Dollar (2000) developed a method for estimating the effective discharge based on the long-term cumulative potential bed material load (PBML). This method was used to assist the determination of environmental flows in the Tugela River (Dollar, 2002). His method is based on applying sediment transport equations to flow duration curves. The most effective discharge tends to one with sufficient competence to transport the available sediment as well as a high frequency of occurrence. (i.e. a flood occurring on average once in one or two years). This method was used here to give a first approximation of the historical effective discharge. Flow duration curves were based on the historical record of mean daily flows. The size range of available sediment was based on the particle size distributions for the EWR sites. Yang’s model (Yang (1973) was used to estimate the sediment transport capacities of the flows. Dr Evan Dollar was subcontracted to carry out the data analysis. The competence of flow to initiate sediment movement was assessed using the critical shear applied to the median bed material size. Critical shear stress was calculated as:
Page B - 8
AfriDev Consultants (Pty) Ltd 2005
DWAF Report No. RDM X100-01-CON-COMPR2-0604 Komati River Catchment Ecological Water Requirements Study – Quantity Report
Τc = ( θc g D) /(ρs – ρ) Equation 5.1 where Τc is the critical shear stress (N/m2) required to initiate movement of a particle of diameter D (m), g is gravitational acceleration, and ρs and ρ are the density of the sediment and water respectively; θc is the dimensionless critical shear stress which is dependent on particle shape, fluid properties and arrangement of surface particles (Gordon et al. 2004). Shear stress per unit area for channel flow can be expessed as Τ = ρg RS ≈ ρg RS where R is the hydraulic radius (approximating to the mean depth d) and S is the slope of the water surface. The critical depth (d) at which the median bed material was moved was calculated as: d = Τc /(g.S.1000) Equation 5.2 All sediment entrainment and sediment transport formulae are recognized as being approximations to the complex reality of fluid dynamics in natural channels, but nonetheless can be used as a guide to the flow conditions under which sediment is likely to be moved and transported.
3.2 ASSESSMENT OF PRESENT ECOLOGICAL STATE The PES was assessed using the method under development by Kleynhans and others. For geomorphology this requires the assessment of the degree of likely impact on channel morphology and related habitat associated with each of the five drivers outlines above. The combined impact of these drivers is assessed with reference to observed channel morphology. The methods used combined a map based analysis with site visits and observations from aerial photographs (Table 1). Coarse scale hydrological data was obtained from Midgely et al. 1994.
Page B - 9
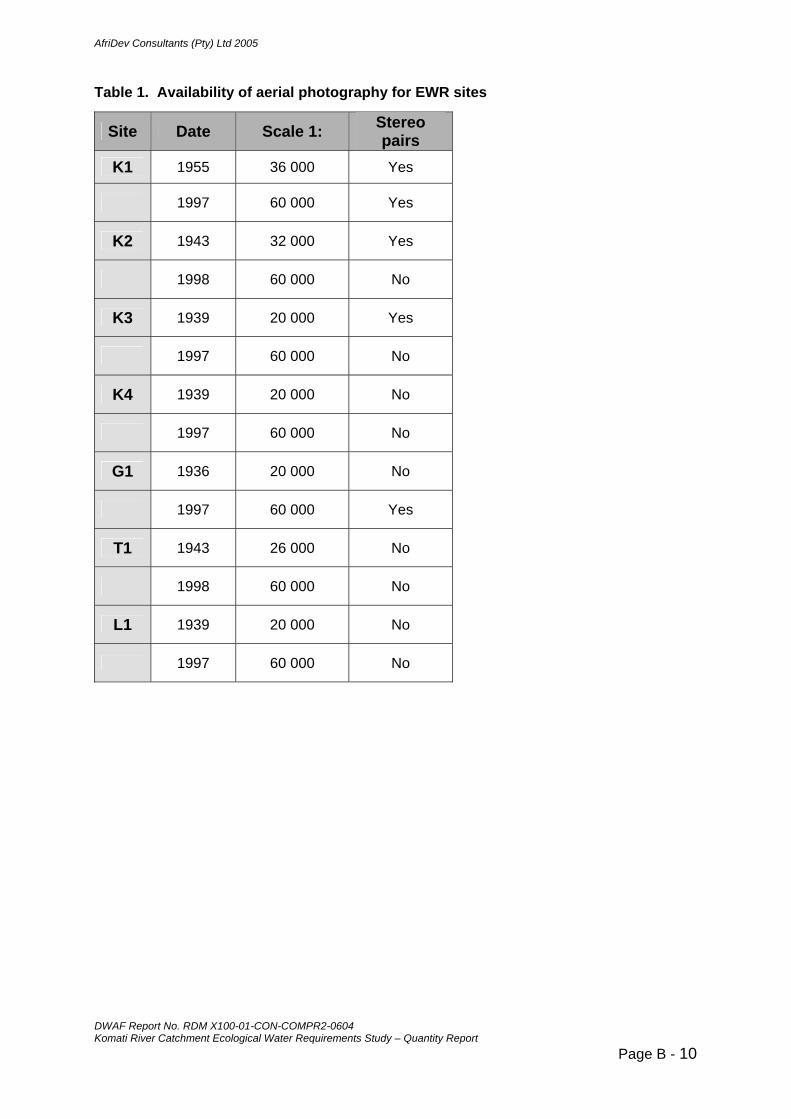
AfriDev Consultants (Pty) Ltd 2005
DWAF Report No. RDM X100-01-CON-COMPR2-0604 Komati River Catchment Ecological Water Requirements Study – Quantity Report
Table 1. Availability of aerial photography for EWR sites
Site Date Scale 1: Stereo pairs
K1 1955 36 000 Yes
1997 60 000 Yes
K2 1943 32 000 Yes
1998 60 000 No
K3 1939 20 000 Yes
1997 60 000 No
K4 1939 20 000 No
1997 60 000 No
G1 1936 20 000 No
1997 60 000 Yes
T1 1943 26 000 No
1998 60 000 No
L1 1939 20 000 No
1997 60 000 No
Page B - 10

AfriDev Consultants (Pty) Ltd 2005
DWAF Report No. RDM X100-01-CON-COMPR2-0604 Komati River Catchment Ecological Water Requirements Study – Quantity Report
3.3 ASSESSMENT OF REFERENCE CONDITION
1: 50 000 topographic maps were used to calculate the reach gradients for each EWR site and to assign a geomorphological zone. From this it was possible to infer the reference condition for the reach. This was compared to observed channel features (Table 1).
3.4 ASSESSMENT OF PRESENT DAY CHANNEL MORPHOLOGY AND
MORPHOLOGICAL CHANGE The present day channel morphology was observed during site visits. Standard data forms were used to record observations. The composition of the bed material was assessed for both the river bed and bars (if present) using a 100 point sample. Observed and inferred changes to channel morphology were noted. The reliability of these observations depends largely on the availability of a historical sequence of aerial photographs at a large scale. Although photographs were available from the ’30s and ’90s for all sites, the scale of the most recent photographs was too small to show good details. The lack of stereo pairs for some sites inhibited interpretation. It is not possible to infer bed material changes from aerial photographs. Inferences can be made depending on the channel gradient. The amount of finer materials (gravels and sand) should increase as the gradient is reduced.
Table 2. Dams in the Komati catchment
Date completed
Catchment area (km2)
Full supply capacity (mill m3)
MAR input to
dam (mill m3 .annum)
Associated EWR site
and distance
downstream (km)
Nooitgedacht 1962 1569 78.4 64 K1 (70)
Vygeboom 1971 3112 77.8 (83.4) 266 K2 (70)
Driekoppies Dec 1999 900 251 216 L1 (20
Maguga Feb 2002 6471 302 797 M1 (15)
K3 (65)
K4 (72)
Schoemans 1950 28 L1 (-20)
Weirs on lower Komati below Tonga
NA NA 16.5 NA
3.5 ASSESSMENT OF EVENT HYDROLOGY
The main impact on the event hydrology of the Komati River is the several dams: the Nooitgedacht, Vygeboom, Maguga, Driekoppies are the main dams affecting the EWR sites. These are listed in Tables 2 and 3, together with key features. The impact of these dams was assessed by comparing the size of the catchment and the volume of the MAR controlled by the dam to the catchment size and MAR for each EWR site. Another important criteria is the capacity of the dam relative to the MAR as large dams will be able to absorb more flood runoff.
Page B - 11

AfriDev Consultants (Pty) Ltd 2005
DWAF Report No. RDM X100-01-CON-COMPR2-0604 Komati River Catchment Ecological Water Requirements Study – Quantity Report
A second impact on event hydrology is catchment land use. This was assessed from map evidence and field observations.
Table 3. Estimated impact of dams on downstream sites.
Dam or EWR site
Catchment area (sq km)
Area controlled by dam
(%) MAR
(mill m3) MAR controlled
by dam (%)
Nooitgedacht 1569 64
K1 2580 61.05 162 40
Vygeboom 3112 268
K2 5459 56.85 574 47
Maguga 64711 >90 850 >90
K3 8729 76.85 1047 76
K4 10192 75.55
(including Driekoppies)
1348 75
Drikoppies 900
L1 1108 90 84
3.6 ASSESSMENT OF SEDIMENT INPUT Upstream dams play a major role in storing sediment. The probable impact of upstream dams was assessed in relation to potential sediment sources between the dam and the EWR reach. For unregulated catchments the presence of sediment sources in the form of badly eroded lands and gullies was noted from topographic maps and field observations. Further evidence of the distribution of natural sediment yields within a catchment was provided by the sediment yield maps produced by Rooseboom and available in digital format from WR90. It should be noted that local sediment sources can play a significant role in supplying sediment to the channel. These are often overlooked given the lack of time available to undertake a full catchment survey. The confidence that can be placed on sediment assessments is therefore low. Graphs displaying the results of the potential bed material load (PBML) modelling received for Dr Dollar are presented in Annexure 1.
3.7 ASSESSMENT OF VEGETATION CHANGE Likely changes to vegetation along the channel network were assessed with reference to Acocks veld type maps, available in digital format from WR90. Temporal changes to the riparian vegetation were assessed from aerial photographs available for all sites at two dates as given in Table 3. The earlier photographs were at a scale at which vegetation and channel features appeared with reasonable clarity, but the scale of the later photographs was too small to give good detail. Interpretation of the photographs was aided by availability of stereo pairs, which were available only for selected sites. The present condition of vegetation and
Page B - 12

AfriDev Consultants (Pty) Ltd 2005
DWAF Report No. RDM X100-01-CON-COMPR2-0604 Komati River Catchment Ecological Water Requirements Study – Quantity Report
its affect on channel stability was assessed in the field.
3.8 ASSESSMENT OF ARTIFICIAL CHANNEL STRUCTURES. Channel obstructions, in the form of weirs, causeways, low drifts or bridges were observed in the field and from aerial photographs. Bank stabilisation activities such as gabion walls were assessed from field observations.
4. OVERVIEW OF REFERENCE CONDITIONS
Table 1 gives the expected channel characteristics for each EWR reach based on the reach gradient. Sites are ranked according to gradient. The observed characteristics are also summarised. It is evident that most of the sites fall within the upper foothills category, albeit at the lower end. From this it would be expected that the reaches would be characterised by plane bed, pool-rapid or pool-riffle morphology, as is in fact the case at all sites. The dominant bed material of cobble or boulder also conforms to the expected condition. Thus in general terms these higher gradient sites conform to the reference condition. The reaches in the lower Komati and Lomati are all classified as belonging to the lower foothills category, verging on lowland rivers. The expected reach type would be pool-riffle or pool-rapid, but with much longer pools than would be the case for upper foothill reaches. The expected dominant bed material is gravel or sand. Although the study reaches conform to the reference type in terms of reach type, they diverge in terms of bed material. there is a much greater dominance of bedrock and boulder than would be expected. This suggests loss of fines in a sediment poor environment. The above analysis is supported by more detailed sediment analysis undertaken at each site. The results are presented in Annexure 2. The expected downstream fining between upper foothill and lower foothill sites is not apparent. K4 and L1 in particular lack any material finer than medium gravel. Of the upper foothill sites, the sites on the Komati have little material smaller than small cobble whereas G1 and T1 both have a much greater proportion of finer material in the sand and gravel fractions. K1 and K2 can be compared to the site below Maguga dam, completed in early 2002. Although of a similar (slightly steeper) gradient than the other upper foothill sites, the bed at this site has a significantly higher proportion of small cobble and gravel. These results will be referred to again when assessing the impact if various drivers on geomorphological processes.
Page B - 13

AfriDev Consultants (Pty) Ltd 2005
Table 4. Overview of geomorphological attributes of study reaches.
Site no.
gradient zone class1
valley form expected reach type
observed reach type
channel type
expected bed material
observed dominant bed
M1 0.007 foothill flood plain (incised)
pool-riffle mixed cobble & bedrock
G1 0.0067 foothill flood plain pool-riffle alluvial cobble
T1 0.0065 alternating slopes pool-rapid mixed boulder & bedrock
K2 0.0057 foothill flood plain (incised)
pool-rapid mixed boulder
K1 0.0053
UFH
V-shaped valley
plane bed,
or
pool-riffle
or
pool rapid
plane bed mixed
cobble
or
bedrock/cobble
cobble
K3 0.0021 LFH incised plain pool-rapid mixed boulder
L1 0.002 LFH incised plain
pool-riffle or pool-rapid sand bars in
pools pool-rapid mixed
gravel and sand
local bedrock control boulder & bedrock
K4 0.0015 LR/LFH incised plain regime pool-rapid mixed sand or fine gravel boulder & bedrock with sand bars in
pool
1 UFH – upper foothill; LFH – lower foothill; LR – lowland river
DWAF Report No. RDM X100-01-CON-COMPR2-0604 Komati River Catchment Ecological Water Requirements Study – Quantity Report
Page B - 14

AfriDev Consultants (Pty) Ltd 2005
DWAF Report No. RDM X100-01-CON-COMPR2-0604 Komati River Catchment Ecological Water Requirements Study – Quantity Report
Page B - 15
5. EWR SITE K1: GEVONDEN
5.1 REFERENCE CONDITION (CATEGORY A) K1 is classified as an upper foothill site on account of its channel gradient of 0.007. The expected reach type would be either plane bed, pool-riffle or pool rapid with a bed material dominated by cobble or bedrock and cobble. The channel lies within a V-shaped valley so there is little scope for lateral channel migration. The channel itself occupies a narrow channel floor. The development of secondary channels around cobble bars is a probable reference condition. These could be observed from the earliest aerial photographs.
5.2 PRESENT ECOLOGICAL STATE (PES) Summary The upstream dam at Nooitgedacht reduces effectiveness of intermediate floods and traps bed sediment. Reduced flows have led to reed encroachment and loss of secondary channels. The PES model for geomorphology (Annexure 3) determined the condition of the site to be Category C (moderately modified). Channel morphology The observed reach type is a mixed pool-riffle with a bed dominated by cobble and bedrock. There was an observed loss of secondary channels across cobble/boulder bars, possible channel narrowing and moderate coarsening of bed material. Event hydrology K1 on the Komati River lies some 70 km below Nooitgedacht Dam. This dam has a relatively high capacity compared to the Mar of its catchment (78.4 against 64 mill cubic metres). It will therefore have a significant effect on moderating flows through the dam. The Nooitgedacht dam controls 61 % of the catchment area of K1, but only 40 % of the flow due to relatively high runoff from tributary catchments downstream of the dam. The dam is therefore likely to have a moderate effect on geomorphological processes at K1. Sediment inputs Dam upstream of K1 is likely to have had a small to moderate impact on coarse sediment inputs to these sites. Some coarsening of the bed material is evident. Riparian Vegetation At site K1 vegetation on the banks offers good to moderate bank stability. All vegetation components contribute to protection of the banks. Examination of aerial photographs points to a spread of reeds onto instream features and into secondary channels. There is no evidence of changes to woody riparian vegetation. It would appear that there has been no direct disturbance of riparian vegetation in the form of clearing, but there has been an indirect impact leading to reed encroachment into the channel in response to reduced flows. There has therefore been a moderate impact in terms of riparian vegetation. Artificial Channel structures No impact.
AfriDev Consultants (Pty) Ltd 2005
DWAF Report No. RDM X100-01-CON-COMPR2-0604 Komati River Catchment Ecological Water Requirements Study – Quantity Report
Page B - 16
5.3 CAUSES OF DEGRADATION Flow-related causes:
• Reduced flood flows due to upstream dam • Vegetation encroachment
Non-flow-related causes: • Sediments trapped by upstream dam
5.4 TREND
The following predictions regarding Present Ecological State in the short and long terms can be made. The PES is deemed to be stable due to the dam having been in place for 40 years. Short term (<5 years) Long term (>20 years) Stable C C
5.5 ALTERNATIVE EC UP An increase in the frequency of intermediate floods would improve the chance for transport of a wider range of sediment classes, resulting in improved bed sorting and maintenance of channel plan form and geometry. Higher flows should help to open up secondary channels if encroaching vegetation can be uprooted by floods. Given the presence of the dam and the fact that sediment cannot realistically be managed it is unlikely that the Ecological Category for geomorphology could be raised above a high C (Moderately Modified) (Annexure 3).
5.6 ALTERNATIVE EC DOWN Geomorphology will be a Caegory D (Largely Modififed) (Annexure 3). A reduction in intermediate floods would result in a localised reduction in channel width and further loss of secondary channels, possible loss of pool depth and tendency for embedded cobbles. Loss of width would be accelerated by encroaching vegetation.
6. EWR SITE K2: KROMDRAAI
6.1 REFERENCE CONDITION (CATEGORY A) K2 is classified as an upper foothill site on account of its channel gradient of 0.0067. The expected reach type would be either plane bed, pool-riffle or pool rapid with a bed material dominated by cobble or bedrock and cobble. There is a flood plain present on the left hand side of the river. Secondary flood channels would probably have crossed this flood plain, serving to bring water, sediment and nutrients to the riparian zone.
AfriDev Consultants (Pty) Ltd 2005
DWAF Report No. RDM X100-01-CON-COMPR2-0604 Komati River Catchment Ecological Water Requirements Study – Quantity Report
Page B - 17
6.2 PRESENT ECOLOGICAL STATE (PES)
Summary The upstream dams at Nooitgedacht and Vygeboom reduces effectiveness of intermediate floods and traps bed sediment. Reduced flows have led to some reed encroachment into the channel. The PES model for geomorphology determined the condition of the site to be Category C (moderately modified) (Annexure 3). Channel morphology The observed reach type is an alluvial pool-riffle channel with a bed dominated by cobble. There has been localised channel narrowing and coalescence of vegetated islands and significant coarsening of bed material. Moderate channel incision may have reduced the frequency of overbank flooding onto the flood plain. Event hydrology K2 lies some 70 km below Vygeboom Dam. This dam has a similar capacity to Nooitgedacht Dam, but this represents a much smaller percentage of the Mar ( 78 against 266 mill cubic metres). The dam controls 57% of the catchment area, which produces 47% of the MAR at K2. This will be in addition to the impacts of Nooitgedacht dam further upstream. The dam is therefore likely to have a moderate effect on geomorphological processes at K1. Sediment inputs Dams upstream of K2 are likely to have had a small to moderate impact on coarse sediment inputs to these sites. Significant coarsening of the bed material is evident at site K2. Tributaries downstream of Vygeboom Dam bring in significant amounts of sediment. Locally, increased channel sedimentation will occur in response to reduced stream power. Riparian Vegetation At site K2 on the Komati good bank stability is afforded by woody vegetation on the flood zone and macro-channel banks and by widespread reed growth. There is also a continuous ground layer on the banks and flood zone. From the aerial photographs there is evidence of localised channel narrowing due to reed growth, though this has not occurred at the EWR site itself. There has been a moderate impact on riparian vegetation at K2, due mainly to changes in flow. Artificial Channel structures At K2 there is a bridge upstream of the study site, but within the reach, which will have a small localised effect on channel morphology.
6.3 CAUSES OF DEGRADATION Flow-related causes:
• Reduced flood flows due to upstream dam • Vegetation encroachment
Non-flow-related causes: • Sediments trapped by upstream dam • Local bridge impacts
AfriDev Consultants (Pty) Ltd 2005
DWAF Report No. RDM X100-01-CON-COMPR2-0604 Komati River Catchment Ecological Water Requirements Study – Quantity Report
Page B - 18
6.4 TREND The following predictions regarding Present Ecological State in the short and long terms can be made: Stable: all impacts been in place for over 30 years Short term (<5 years) Long term (>20 years) Stable C C
6.5 ALTERNATIVE EC UP Geomorphology will be a high Category B/C (Largely Natural to Moderately Modified) (Annexure 3). Increased frequency of intermediate floods will improve chance for transport of a wider range of sediment classes, resulting in improved bed sorting and maintenance of channel plan form and geometry. Higher floods should inhibit encroachment of vegetation onto lateral bars. The impact of the upstream weir and bridge will remain the same.
6.6 ALTERNATIVE EC DOWN Geomorphology will be a Category D (Largely Modified) (Annexure 3). A further reduction of intermediate floods with no catchment rehabilitation (dongas) will lead to increased deposition of sand and fine gravels. Predicted morphological changes include the extension and of lateral bars and their stabilization by vegetation, decreased depth of pools and some loss of open cobble habitat. Bed sorting will decrease. The impact of the weir and bridge remains the same.
7. EWR SITE K3: TONGA
7.1 REFERENCE CONDITION (CATEGORY A) K3 is classified as a lower foothill site on account of its channel gradient of 0.0021. Its gradient puts it close to a lowland river. The expected reach type would be an alluvial regime channel with a bed material dominated by gravel and sand. The bed would generally be highly mobile, forming mid-channel bars within a braided configuration. Multiple flood channels associated with a flood plain would be characteristic of this site. Stable substrate to support vegetation would be restricted to the channel margins, banks and islands. Marginal vegetation would be an important habitat.
7.2 PRESENT ECOLOGICAL STATE (PES) Sumary This site is impacted not only by upstream dams, including the recently build Maguga dam, but also by local weirs. Sediment depletion due to increased upstream storage may have been responsible for the observed channel incision. A marked loss of riparian vegetation has reduced bank stability. The PES model for geomorphology (Annexure 3) determined the condition of the site to be Category D/E (largely modified to severely modified). Channel morphology The observed reach type is a mixed pool-rapid with a bed dominated by boulder, indicating significant change from reference. A loss of finer sediments has resulted in coarsening of
AfriDev Consultants (Pty) Ltd 2005
DWAF Report No. RDM X100-01-CON-COMPR2-0604 Komati River Catchment Ecological Water Requirements Study – Quantity Report
Page B - 19
bed and exposure of bedrock Gravel patches where present were unsorted, and cobbles embedded. The nature of the cross-section indicates that there may have been significant channel incision, causing floods to be concentrated in the main channel and de-linking the active channel from the flood plain. The cause of this is not known, but could be the result of sediment depletion. Failure of the downstream weir during the 2000 floods may have increased incision. There is also evidence of channel shifting, but no clear change in width. There has been a definite extension of length of pools within reach. Event hydrology K3 lies 65 kilometers below Maguga dam, completed early in 2002. D Maguga Dam has a capacity of 302 mill cubic metres. Maguga Dam controls 77% of the catchment of K3 and 76 % of the MAR at this site. The dam is therefore likely to have a moderate to large FUTURE effect on geomorphological processes at K3. Given the short time since completion it is unlikely that these impacts will as yet be manifested in terms of morphological change. Sediment inputs Site K3 will have been impacted to a moderate extent by catchment erosion within Swaziland, but weirs will have mitigated this to some extent. Riparian Vegetation At site K3 the aerial photographs indicate a definite loss of woody vegetation from the river banks, but an increase on the flood plain. Vegetation provides a patchy cover on the banks and along the channel margins, giving moderate protection against erosion. Scattered reeds occur on the channel bed and a ground layer has colonised in-stream bars. There has been a large impact on the riparian vegetation, which can be attributed to clearing by the local population. Artificial Channel structures The lower reaches of the Komati are impacted by frequent weirs that cause long stretches of the river to be converted to pools behind the weir structure. Immediately below the weir removal of finer sediment often results in the increased exposure of bedrock and exaggeration of rapid morphological features. The reach in which K3 is situated is impacted by a number of large weirs. There is evidence that K3 may be inundated at high flows. The impact of channel obstruction is rated as large.
7.3 CAUSES OF DEGRADATION Flow-related causes:
• Reduced flood flows due to upstream dams • Terrestrialisation of vegetation
Non-flow-related causes:
• Sediments trapped by upstream dams and weirs • Removal of vegetation for fire wood, through grazing etc.
7.4 TREND
The following predictions regarding Present Ecological State in the short and long terms can be made: The site will continue to degrade due to Maguga Dam and weir building. Short term (<5 years) Long term (>20 years)
AfriDev Consultants (Pty) Ltd 2005
DWAF Report No. RDM X100-01-CON-COMPR2-0604 Komati River Catchment Ecological Water Requirements Study – Quantity Report
Page B - 20
Negative E E
7.5 ALTERNATIVE EC UP The ecological category for Geomorphology cannot be raised above a Category D (Largely Modified) (Annexure 3).. The EC score could be improved from 40 to 50 by improving the riparian vegetation (implies protection of the riparian zone). The impact of weirs and upstream dams cannot be decreased due to the effect on sediment storage. Channel incision is not reversible.
8. EWR SITE G1: VAALKOP
8.1 REFERENCE CONDITION (CATEGORY A) G1 is classified as an upper foothill site on account of its channel gradient of 0.0067. The valley floor is characterised by a flood plain so the reference condition would probably be a meandering channel with a pool-riffle sequence comprised of coarse gravels or cobble. Bank erosion would occur naturally on the outer bends of meanders.
8.2 PRESENT ECOLOGICAL STATE (PES) Summary Afforestation in the catchment is likely to have affected by storm runoff and sediment yields, increasing the frequency of small flood events and raising sediment yields. The riparian zone has been invaded by dense stands of black wattle that are presently being cleared. Both the wattles themselves and the clearing process have induced bank instability, but if properly managed the banks may become stable with time. The PES model for geomorphology (Annexure 3) determined the condition of the site to be Category C/D (modified to largely modified). Channel morphology The observed reach type is a mixed pool-riffle with a bed dominated by cobble and bedrock. There is no clear evidence for morphological change due to small scale of aerial photographs and small size of channel. Inferred channel incision is related to black wattle infestations. It is suspected that there has been an increase in fine sediments from upstream and catchment erosion, and channel widening due to increased flood runoff from roads in forested catchment. Event hydrology Gladdespruit (G1) is not impacted by upstream impoundments, but the event hydrology is likely to have been affected by land use changes within the catchment. The catchment of G1 on the Gladdespruit is extensively afforested. Dirt roads will be important source areas for storm runoff. It is therefore likely that the magnitude of flood events with a high recurrence interval may have increased. Catchment land use changes are considered to have had a small effect on geomorphological effectiveness of floods at site G1. Sediment inputs Site G1 Gladdespruit probably has a moderate increase in terms of sediment input from forest roads, other dirt roads, mining and upstream bank erosion. There is a significant proportion of sand and fine gravels in the bed material at this two site. Riparian Vegetation
AfriDev Consultants (Pty) Ltd 2005
DWAF Report No. RDM X100-01-CON-COMPR2-0604 Komati River Catchment Ecological Water Requirements Study – Quantity Report
Page B - 21
At Site G1 the riparian vegetation has undergone significant changes since 1939. At the time of the earliest aerial photographs the valley floor was either under cultivation or was used as hay meadows. Few riparian trees were present. By 1997 the river corridor was heavily infested with black wattle and the upper catchment was extensively afforested. By the time of the site visit in November 2003 the black wattle had been cleared. There is widespread field evidence that black wattle is associated with incised channels and it is likely that some of the bank steepening observed at G1 can be attributed to this. The present vegetation cover affords some bank stability in the form of patches of reeds and trees and shrubs with a continuous ground layer on the active channel banks. Locally bank erosion of steep channel banks is evident. Continuous reeds protect the channel margins. The rating for riparian vegetation impacts at G1 is large. Artificial Channel structures None.
8.3 CAUSES OF DEGRADATION Flow-related causes:
• Increased sediment yield due to increased catchment runoff • Increased channel erosion due to increased catchment runoff
Non-flow-related causes:
• Bank instability due to alien vegetation • Increased sediment yield form forest roads
8.4 TREND
Assuming current conditions, the following predictions regarding Present Ecological State in the short and long terms can be made: Channel instability will continue for some time; can be reversed with continued clearing of wattles and careful follow-up. Short term (<5 years) Long term (>20 years) Degrading / Stable D C or D depending on management
8.5 ALTERNATIVE EC UP Geomorphology moves up to a category C (Moderately Modified) (Annexure 3). Improvement to the ecological category at G1 depends on erosion control in the catchment, paying particular attention to dirt roads that connect to the stream network, and continue clearing of black wattle from the riparian zone, with adequate follow up to prevent re-establishment. After initial destabilisation, stream banks can be left to recover as long as event flows meet the requirements of the Ecological Reserve.
8.6 ALTERNATIVE EC DOWN As the site was already marginal to a D category no assessment was made for a lower category than the present state.

AfriDev Consultants (Pty) Ltd 2005
DWAF Report No. RDM X100-01-CON-COMPR2-0604 Komati River Catchment Ecological Water Requirements Study – Quantity Report
Page B - 22
9. EWR SITE T1: TEESPRUIT
9.1 REFERENCE CONDITION (CATEGORY A) K1 is classified as an upper foothill site on account of its channel gradient of 0.0065. The expected reach type would be either plane bed, pool-riffle or pool rapid with a bed material dominated by cobble or bedrock and cobble. The river channel lies within a narrow flood zone between alternating hill slopes so is semi-confined. There is some potential for the development of secondary channels.
9.2 PRESENT ECOLOGICAL STATE (PES) Summary This site is not impacted by upstream impoundments but land use changes in the catchment are thought to have increased storm flow and associated sediment loads. The PES model for geomorphology (Annexure 3) determined the condition of the site to be Category C (Moderately modified). Channel morphology The observed reach type is a mixed pool-riffle with a bed dominated by cobble and bedrock. A small secondary channel lies to the left hand side of the main channel and will be activated during flood flows. Some increase in channel width may be evident from aerial photographs, there are signs of localised bank erosion and over-bank sediment deposits are widespread,. Embedded cobbles are indicative of upstream sediment sources. Event hydrology Teespruit (T1) is not impacted by upstream impoundments, but the event hydrology is likely to have been effected by land use changes within the catchment. In the case of Teespruit this is in the form of extensive semi-formal settlements with associated catchment hardening and dirt roads. Catchment land use changes are considered to have had a small to moderate effect on geomorphological processes at site T1. Sediment inputs Site T1 probably has a small to moderate increase in terms of sediment input. There are a significant proportion of sand and fine gravels in the bed material at this site. Riparian Vegetation At site T1 the vegetation appears to be in good condition, but according to the vegetation specialist there is evidence of changes in cover and structure. A good vegetation cover on the banks provides a high level of protection against erosion along most of the banks. The rating for riparian vegetation impacts is therefore given as small. Artificial Channel structures No impact.
9.3 CAUSES OF DEGRADATION Flow-related causes:
• Increased storm flow Non-flow-related causes:
• Increased sediment yield

AfriDev Consultants (Pty) Ltd 2005
DWAF Report No. RDM X100-01-CON-COMPR2-0604 Komati River Catchment Ecological Water Requirements Study – Quantity Report
Page B - 23
9.4 TREND
Assuming current conditions, the following predictions regarding Present Ecological State in the short and long terms can be made: Short term (<5 years) Long term (>20 years) Stable C C
9.5 ALTERNATIVE EC UP PES Geomorphology will be a Category B (Largely Natural) (Annexure 3). An improved ecostatus could be achieved through controlling erosion and peri-urban runoff form the catchment, and improving bank stability through removal of aliens.
9.6 ALTERNATIVE EC DOWN Geomorphology will be a Category D (Largely Modified) (Annexure 3). Increased invasion by alien vegetation would deplete cover and structure and decrease protection against bank erosion. Increased catchment erosion and storm runoff from peri-urban areas would increase sediment inputs into channel and change the effective discharge, possibly resulting in widespread bank erosion, channel incision or channel widening.
10. EWR SITE M1: SILINGANI
10.1 REFERENCE CONDITION (CATEGORY A) M1 is classified as an upper foothill site on account of its channel gradient of 0.007. The expected reach type would be either plane bed, pool-riffle or pool rapid with a bed material dominated by cobble or bedrock and cobble. Secondary flood channels are a common feature of these rivers.
10.2 PRESENT ECOLOGICAL STATE (PES) Summary The main impact on the geomorphology of this site is the Maguga Dam, 15 km upstream. Flood magnitudes will be significantly reduced and much of the sediment that would previously have been transported through the site is now stored in the dam. The riparian vegetation is also in poor condition due to pressures from the local human population. The PES model for geomorphology determined the condition of the site to be Category C (moderately modified). Channel morphology The observed morphology at the site is pool-riffle, but the longer reach includes pool-rapid sections. The dominant bed material of cobble or boulder conforms to the expected condition. Thus in general terms this site conforms to the reference condition. The morphology at the site comprises a main channel of approximately 50 m width with steep banks on the right hand side and wide gravel bar and island with a secondary channel (2-3 m

AfriDev Consultants (Pty) Ltd 2005
DWAF Report No. RDM X100-01-CON-COMPR2-0604 Komati River Catchment Ecological Water Requirements Study – Quantity Report
Page B - 24
width) on the left hand side. This channel was observed by McGregor in 1998 To be flowing strongly at a discharge of 9 m3.s-1. The material on the channel bed ranges in size from fine gravel to medium boulder. The median particle size falls within the medium gravel class, between 16 to 64 mm in diameter. The bed is therefore poorly sorted at presented and there is as yet no sign of armouring due to the upstream dam. The bed was found to be loose and mobile, with no evidence of embeddedness. It therefore appears that the present bed material represents the full suite of particle sizes that are being transported through the section. The lateral bar has a bi-modal particle size distribution with a high percentage of material in the fine gravel class and in the small to large cobble classes. This probably represents the change in particle size distribution from the back of the bar (sand and gravels) towards the channel (cobble). Event hydrology & sediment load Dams impact on event hydrology through absorbing floods and reducing the capacity to transport sediment. They impact on sediment inputs through storing coarse sediment. A reduction in the magnitude and frequency of floods also allows woody vegetation and reeds to encroach onto otherwise active morphological features such as bars and secondary channels. This either results in a loss of specific features or their stabilisation. More stable channel banks also leads to narrower, deeper channels. M1 is situated some 15 km downstream of Maguga Dam, which was completed in early 2002. This dam controls over 90 % of both the catchment area and the MAR of the monitoring site, but because of its recent date is unlikely to have as yet had a significant impact on the geomorphology of the site. Dams upstream of Maguga (Nooitgedacht and Vygeboom) control 48 % of the catchment area and 32 % of the MAR. These dams will have had a small impact to date on geomorphological processes at M1. There may have been a small reduction in event hydrology and a depletion of sediment due to storage in the dams. Much of this sediment will, however, have been replaced through erosion of sediment from the channel bed downstream of Vygeboom dam. Riparian Vegetation There has been a moderate to large disturbance to the riparian zone vegetation. Locally the river banks have been stripped bare of vegetation, but the reach as a whole is in moderate condition. There is some encroachment of vegetation onto lateral bars, possible as a reduction of flood events following the closure of Maguga Dam. (Note that the rating for vegetation as a geomorphological factor is higher than the PES for vegetation in its own right because for geomorphology the structural characteristics are more important than the species composition). Artificial Channel structures No channel structures such as weirs or causeways were observed in this reach.
10.3 CAUSES OF DEGRADATION Flow-related causes:
• Upstream dam reducing flood magnitude and frequency • Encroaching vegetation onto lateral bars
Non-flow-related causes:
• Sediment stored in upstream dam • Removal of riparian vegetation by grazing animals, for fuel etc.

AfriDev Consultants (Pty) Ltd 2005
DWAF Report No. RDM X100-01-CON-COMPR2-0604 Komati River Catchment Ecological Water Requirements Study – Quantity Report
Page B - 25
10.4 TREND
Assuming current conditions, the following predictions regarding Present Ecological State in the short and long terms can be made. This site is likely to become seriously impacted by Maguga Dam due to sediment depletion and reduction of flood flows. A PES of a low D is predicted unless the impact of the dam is mitigated through the EWR. With completion of the dam 15 kilometres upstream of the site, significant morphological changes can be expected. Storage of sediment in the dam is likely to result in armouring of the channel bed due to removal of sands and gravels. Reduced flood flows are likely to result in less frequent activation of the secondary channel which is likely to suffer from vegetation encroachment. This is also a probable site for deposition of any available fine sediment. Encroachment of vegetation onto the cobble bars and deposition of fines here is also highly likely. Short term (<5 years) Long term (>20 years) Stable D D
10.5 ALTERNATIVE EC UP Geomorphology will be a Category C (Moderately Modified). Given the presence of Maguga dam there is no realistic way in which the PES for geomorphology can be raised to a B. The ratings given for the upgraded PES can be considered to be the recommended scenario to maintain a C status. Flow releases will be required to keep an acceptable frequency of intermediate floods. There is no practical solution to loss of bedload due to sediment trapping behind dam wall. Bank stability could increased through rehabilitation of bank vegetation and the provision of flood flows prevent encroachment on to bars.
10.6 ALTERNATIVE EC DOWN Geomorphology will be a Category D (Largely Modified). The PES-down ratings are the ratings assuming no attempt to mitigate the impact of Maguga Dam on channel geomorphology. Maguga Dam will trap all coarse sediment, reducing bedload to very low values, and will store or attenuate all but most extreme flood events. Armouring of the low flow channel will increase, with loss of fines and gravel, while the lateral bars and side channels will become stabilized, with consequent channel narrowing. The rating assumes no attempt to rehabilitate riparian vegetation. Encroachment on to lateral bars will result from a reduction in the magnitude and frequency of flood events.
AfriDev Consultants (Pty) Ltd 2005
DWAF Report No. RDM X100-01-CON-COMPR2-0604 Komati River Catchment Ecological Water Requirements Study – Quantity Report
Page B - 26
11. EWR SITE L1: KLEINDORINGKOP
11.1 REFERENCE CONDITION (CATEGORY A) L1 is classified as a lower foothill site on account of its channel gradient of 0.002. Its gradient puts it close to a lowland river. The expected reach type would be an alluvial regime channel with a bed material dominated by gravel and sand. The bed would generally be highly mobile, forming mid-channel bars within a braided configuration. Stable substrate to support vegetation would be restricted to the channel margins and banks. Marginal vegetation would be an important habitat.
11.2 PRESENT ECOLOGICAL STATE (PES) This site lies only 20 km below the Driekoppies Dam completed in 1999 and a large weir built in 1950. As a result connectivity in the system has been seriously disrupted resulting in lower floods and a significant decrease in available sediment. S a result the channel has become armoured and a stable riparian vegetation has been able to become established in the riparian zone. This has lead to narrowing and stabilisation of the channel. The PES model for geomorphology (Annexure 3). determined the condition of the site to be Category D (largely modified). Channel morphology The observed reach type is a mixed pool-rapid with a bed dominated by boulder and bedrock. This is quite different form the reference condition of a regime channel with mobile gravel bed. There has been significant coarsening of bed material. There are definite signs of channel narrowing and loss of secondary channels evident from the aerial photographs. There has also been an extension of pools behind weirs. Event hydrology L1 lies approximately 20 km below Driekoppies Dam. This dam has a large capacity relative to the MAR of its catchment. The dam controls 90 % of the catchment and 84% of the Mar at L1. The dam is therefore likely to have a serious future effect on geomorphological processes at L1. This dam was only completed in 1999, so many of its impacts will not yet have been felt in the channel. A large weir below Driekoppies, build in 1950, will also have had a moderating influence on event hydrology. The impact on flows in the past is estimated as moderate. Sediment inputs The upstream weir (Schoemans) provides significant storage for trapping coarse sediment. Trapping of coarse sediment by Driekoppies during the floods of 2000 may have also contributed to the noticeable coarsening of the bed material. Significant coarsening of the bed material is evident. The impact on sediment input is probably large. Riparian Vegetation At site L1 evidence for the aerial photographs indicates a definite narrowing of the channel since 1939, loss of secondary channels and vegetation encroachment. At the present time trees and shrubs and reeds provide a continuous cover on the flood zones, active channel banks and channel margins. These provide good protection against erosion. There is uncertainty as to the cause of vegetation change. This may be a response to changing sediment dynamics, with a reduction in unstable sandy substrate favouring woody vegetation. It may also be the case that the lack of woody vegetation in 1939 photographs
AfriDev Consultants (Pty) Ltd 2005
DWAF Report No. RDM X100-01-CON-COMPR2-0604 Komati River Catchment Ecological Water Requirements Study – Quantity Report
Page B - 27
was due to its removal by an extreme flood event at the beginning of the year. Floods and consequent loss of woody vegetation occurred in the Sabie River in the same year. The geomorphological impact of riparian vegetation is rated as large, but this may be an over estimate if changes are part of a natural cycle. Artificial Channel structures There are a few small weirs in the lower reaches of the Lomati. The impact of channel obstruction at this site is rated as small.
11.3 CAUSES OF DEGRADATION Flow-related causes:
• Reduced flood flows • Encroaching vegetation and channel stabilisation
Non-flow-related causes:
• Channel armouring due to upstream sediment storage
11.4 TREND Assuming current conditions, the following predictions regarding Present Ecological State in the short and long terms can be made. Channel morphology and bed structures will continue to adjust to changes in flow and sediment induced by Driekoppies. The class is not likely to change A key to the direction of geomorphological change will be the state of vegetation. Channel dynamics are contingent on the dynamics of the riparian vegetation. As the vegetation may be subject to flood-induced cyclical changes, the ability to recover from extreme floods is essential. It is therefore important to maintain the constructive intermediate floods, close to the one or two year flood. Short term (<5 years) Long term (>20 years) Stable D D
11.5 ALTERNATIVE EC UP Geomorphology is in a Category D (Largely Modified). Given the presence of Driekoppies Dam and its effect on sediment storage it is unrealistic to attempt to increase the ecological category to a C.
11.6 ALTERNATIVE EC DOWN The site is already in a category D for geomorphology.

AfriDev Consultants (Pty) Ltd 2005
DWAF Report No. RDM X100-01-CON-COMPR2-0604 Komati River Catchment Ecological Water Requirements Study – Quantity Report
Page B - 28
12. CONCLUSIONS
12.1 ASSESSMENT OF PES The EWR sites on the main Komati River have all to a greater or lesser extent been impacted by upstream dams that have acted to reduce the magnitude and frequency of flood flows and the availability of sediment. Sites in the upper foothill reaches (K1, K2, M1) are those most impacted by dams. In the lower foothill zones (K3, L1) storage weirs are an additional impact, acting as effective sediment traps. The overall effect of these structures has been to bring about coarsening of the bed material and narrowing and simplification of channels, with loss of secondary channels. Channel incision may have been a third affect at some sites. The effect of bed material change is thought to be greatest in the lower foothill sites, where the reference condition of braided regime channels has given way to single thread channels with beds dominated by boulders and bedrock. This represents a serious modification to both instream and riparian habitat. Modification to the riparian vegetation also impacts on channel processes, especially bank erosion. The most impacted site was G1 followed by M1 and K3. At G1, thick stands of invasive Acacia mearnsii dominated the riparian zone and have probably been responsible for channel incision and general instability of the channels. The channels at T1 and G1 were thought to be impacted by catchment disturbance due to peri-urban developments and afforestation respectively. Both activities tend to increase storm runoff and sediment supply. The present ecological state of the river channel at the seven sites ranged from a high C (T1) to a D/E (K3). While there is scope for raising the ecological category of T1 and G1 through catchment based rehabilitation (erosion control and alien clearance), dams and weirs upstream of the other sites have given rise to changes that cannot be reversed by simply regulating the flow modifications. Depletion of sediment due to upstream storage has resulted in changes to coarsening of the bed material. In a number of cases (especially M1 and K3) the Ecological Category could be maintained or improved through rehabilitation of the riparian zone, thus helping to stabilise the channel banks. In conclusion, long-term geomorphological change is an inevitable response to upstream developments that regulate flood flows and sediment supply. The aim of river managers must be to limit the extent of channel change and also to provide flows that provide the optimum range of habitats in the modified channel.

AfriDev Consultants (Pty) Ltd 2005
DWAF Report No. RDM X100-01-CON-COMPR2-0604 Komati River Catchment Ecological Water Requirements Study – Quantity Report
Page B - 29
REFERENCES
DOLLAR, E.S.J. 2000. The determination of geomorphologically effective flows for selected
eastern sea-board rivers in South Africa, Unpublished PhD Thesis, Rhodes University, Grahamstown.
DOLLAR, E.S.J. 2002. Potential bed material transport, IWR Environmental, Thukela water project decision support phase Reserve determination module, PBV000-00-10307, Pretoria
DOLLAR, E.S.J. AND ROWNTREE, K.M 2003. Geomorphological research for the conservation and management of southern African rivers, vol 2 managing flow variability: the geomorphological response. Water Research Commission Report 849/1/03
GORDON, N.D., MCMAHON, T.A. AND FINLAYSON, B.L., GIPPEL, C.J., NATHAN, R.J., 2004. Stream hydrology: an introduction for ecologists, second edition. John Wiley & Sons, Chichester.
MCGREGOR, G.K. 1999. IN AFRIDEV/KNIGHT PIESOLD JOINT VENTURE AND ASSOCIATES, MDC–6 Environmental Impact Assessment and Instream Flow Requirement CMP supporting report E. Prepared for the Komati Basin Water Authority for submission to the Swaziland Environment Authority
ROWNTREE, K.M. 2000. GEOMORPHOLOGY. IN KING, J. M. AND THARME, R. E.. Environmental flow assessments for rivers: manual for the Building Block Method. Water Research Commission Report No. TT131/00.
YANG, C.T. 1973: Incipient motion and sediment transport, Journal of the Hydraulics Division, American Society of Civil Engineers 99 (HY10), 1679-1704.
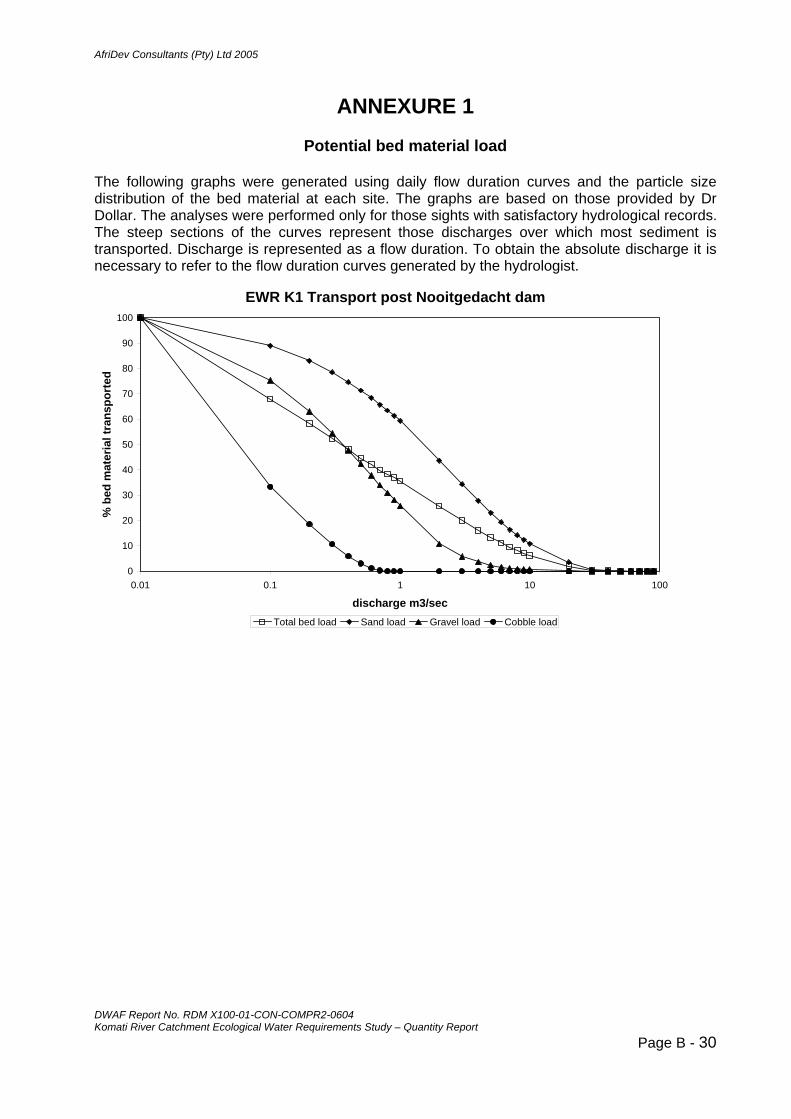
AfriDev Consultants (Pty) Ltd 2005
ANNEXURE 1
Potential bed material load The following graphs were generated using daily flow duration curves and the particle size distribution of the bed material at each site. The graphs are based on those provided by Dr Dollar. The analyses were performed only for those sights with satisfactory hydrological records. The steep sections of the curves represent those discharges over which most sediment is transported. Discharge is represented as a flow duration. To obtain the absolute discharge it is necessary to refer to the flow duration curves generated by the hydrologist.
EWR K1 Transport post Nooitgedacht dam
0
10
20
30
40
50
60
70
80
90
100
0.01 0.1 1 10 100
discharge m3/sec
% b
ed m
ater
ial t
rans
port
ed
Total bed load Sand load Gravel load Cobble load
DWAF Report No. RDM X100-01-CON-COMPR2-0604 Komati River Catchment Ecological Water Requirements Study – Quantity Report
Page B - 30

AfriDev Consultants (Pty) Ltd 2005
EWR K2 Transport post Vygeboom dam
0
10
20
30
40
50
60
70
80
90
100
0.01 0.1 1 10 100
% equalled or exceeded
% b
ed m
ater
ial t
rans
port
ed
Total bed load Sand load Gravel load Cobble load
EWR K3 Transport Post Vygeboom dam
0
10
20
30
40
50
60
70
80
90
100
0.01 0.1 1 10 100% equalled or exceeded
% b
ed m
ater
ial t
rans
port
ed
Total bed load Sand load Gravel load
DWAF Report No. RDM X100-01-CON-COMPR2-0604 Komati River Catchment Ecological Water Requirements Study – Quantity Report
Page B - 31
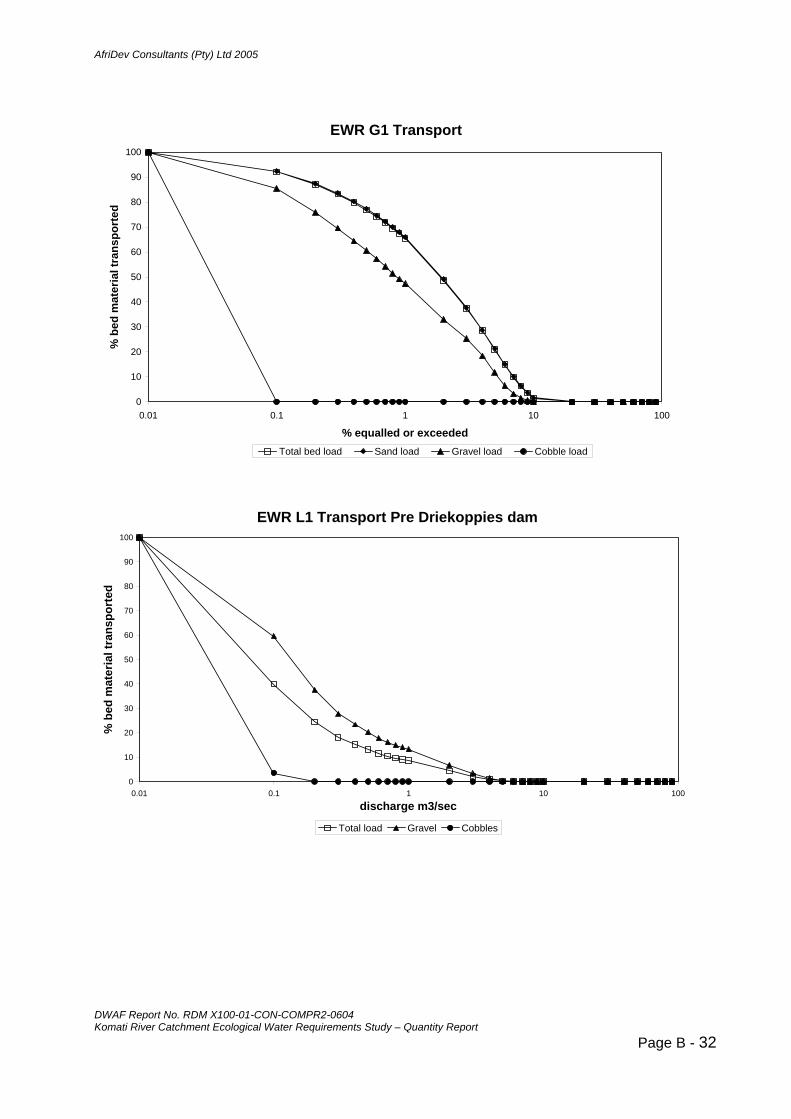
AfriDev Consultants (Pty) Ltd 2005
EWR G1 Transport
0
10
20
30
40
50
60
70
80
90
100
0.01 0.1 1 10 100
% equalled or exceeded
% b
ed m
ater
ial t
rans
port
ed
Total bed load Sand load Gravel load Cobble load
EWR L1 Transport Pre Driekoppies dam
0
10
20
30
40
50
60
70
80
90
100
0.01 0.1 1 10 100
discharge m3/sec
% b
ed m
ater
ial t
rans
port
ed
Total load Gravel Cobbles
DWAF Report No. RDM X100-01-CON-COMPR2-0604 Komati River Catchment Ecological Water Requirements Study – Quantity Report
Page B - 32
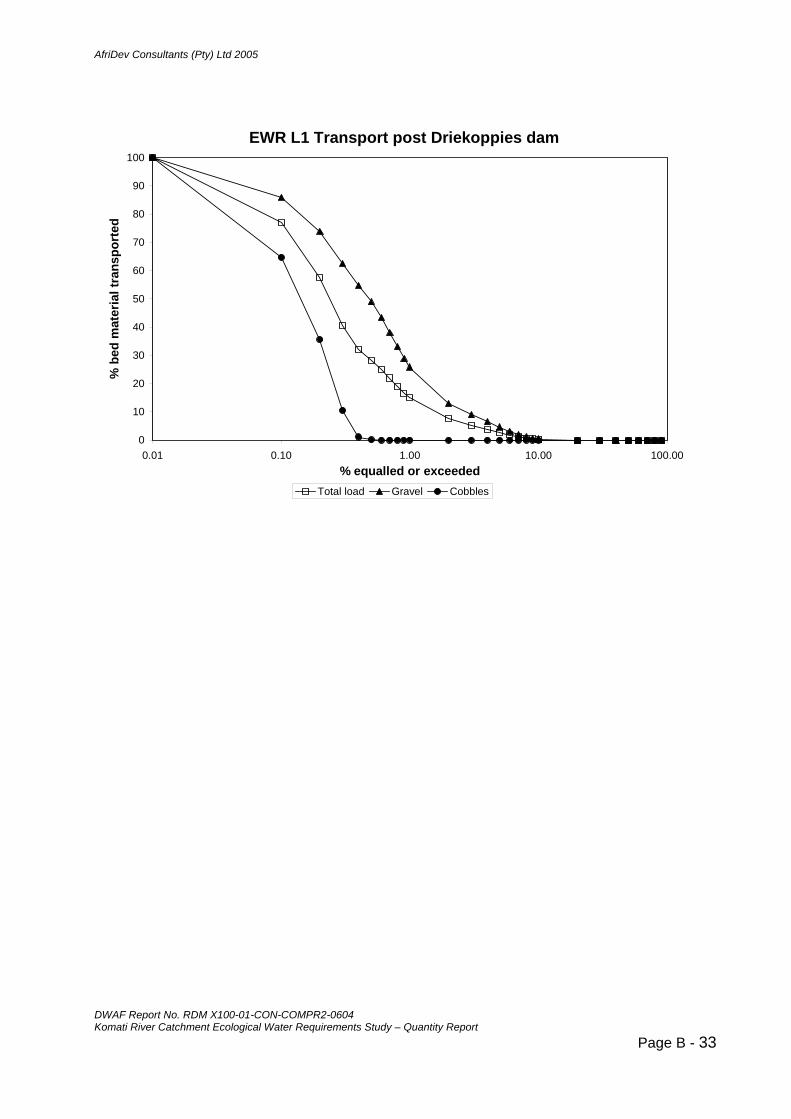
AfriDev Consultants (Pty) Ltd 2005
EWR L1 Transport post Driekoppies dam
0
10
20
30
40
50
60
70
80
90
100
0.01 0.10 1.00 10.00 100.00% equalled or exceeded
% b
ed m
ater
ial t
rans
port
ed
Total load Gravel Cobbles
DWAF Report No. RDM X100-01-CON-COMPR2-0604 Komati River Catchment Ecological Water Requirements Study – Quantity Report
Page B - 33
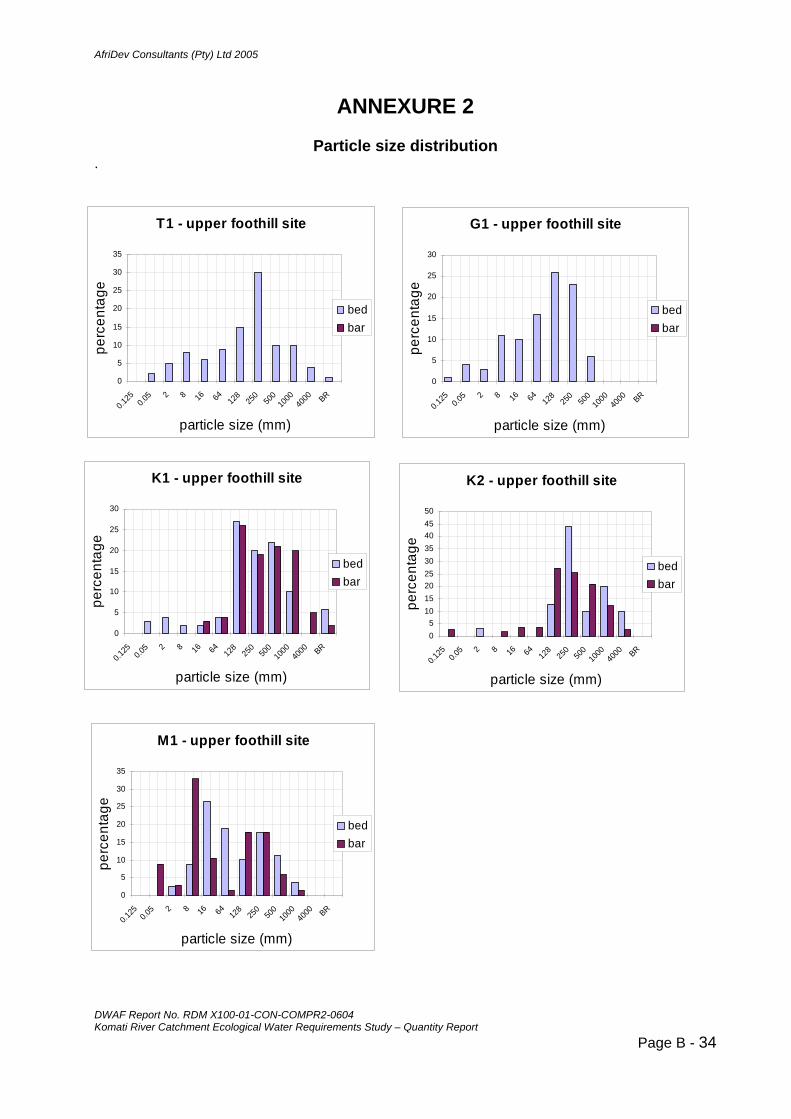
AfriDev Consultants (Pty) Ltd 2005
ANNEXURE 2
Particle size distribution .
T1 - upper foothill site
0
5
10
15
20
25
30
35
0.125 0.0
5 2 8 16 64 128
250
500
1000
4000 BR
particle size (mm)
perc
enta
ge
bedbar
G1 - upper foothill site
0
5
10
15
20
25
30
0.125 0.0
5 2 8 16 64 128
250
500
1000
4000 BR
particle size (mm)pe
rcen
tage
bedbar
K1 - upper foothill site
0
5
10
15
20
25
30
0.125 0.0
5 2 8 16 64 128
250
500
1000
4000 BR
particle size (mm)
perc
enta
ge
bedbar
K2 - upper foothill site
05
101520253035404550
0.125 0.0
5 2 8 16 64 128
250
500
1000
4000 BR
particle size (mm)
perc
enta
ge
bedbar
M1 - upper foothill site
0
5
10
15
20
25
30
35
0.125 0.0
5 2 8 16 64 128
250
500
1000
4000 BR
particle size (mm)
perc
enta
ge
bedbar
DWAF Report No. RDM X100-01-CON-COMPR2-0604 Komati River Catchment Ecological Water Requirements Study – Quantity Report
Page B - 34
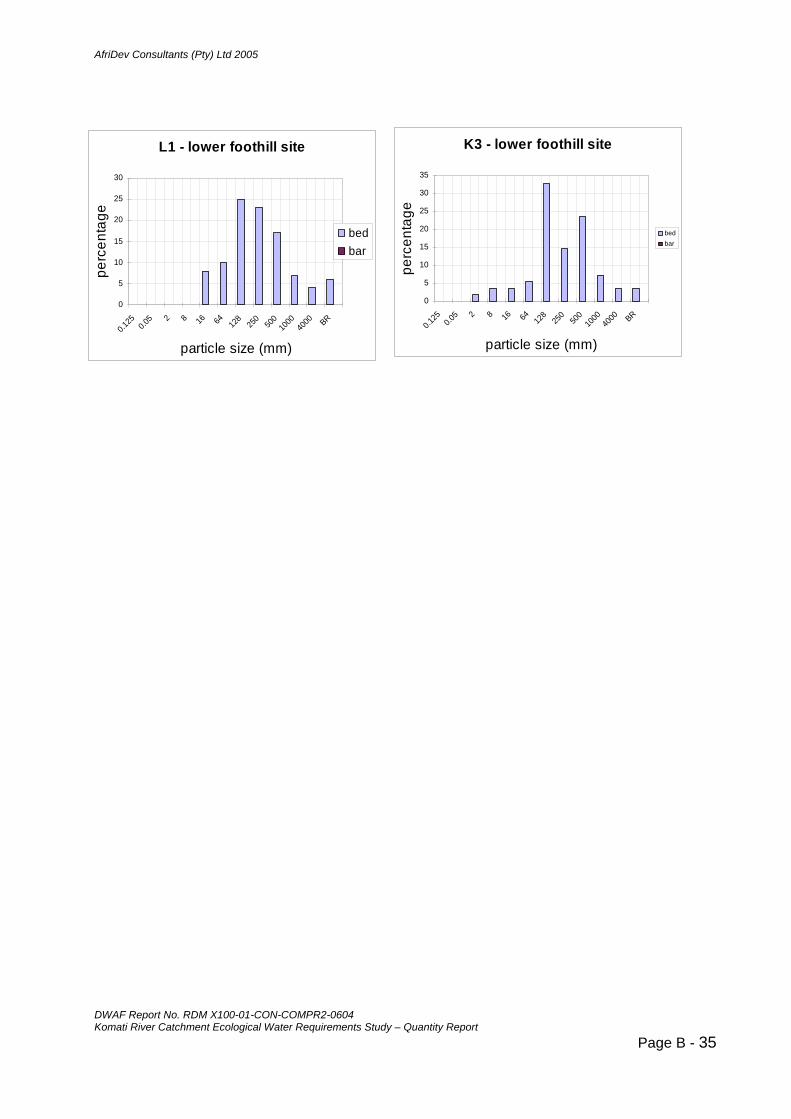
AfriDev Consultants (Pty) Ltd 2005
K3 - lower foothill site
0
5
10
15
20
25
30
35
0.125 0.0
5 2 8 16 64 128
250
500
1000
4000 BR
particle size (mm)
perc
enta
ge
bedbar
L1 - lower foothill site
0
5
10
15
20
25
30
0.125 0.0
5 2 8 16 64 128
250
500
1000
4000 BR
particle size (mm)
perc
enta
ge
bedbar
DWAF Report No. RDM X100-01-CON-COMPR2-0604 Komati River Catchment Ecological Water Requirements Study – Quantity Report
Page B - 35

AfriDev Consultants (Pty) Ltd 2005
DWAF Report No. RDM X100-01-CON-COMPR2-0604
ANNEXURE 3
PES and Alternative EC’s per EWR site
Driver status (%): >89=A; 80-89=B; 60-79=C; 40-59=D; 20-39=E; <20=F EWR site K1
GEOMORPHOLOGY DRIVERS: PES
COMPONENTS RANK RELATIVE
WEIGHTING (%)
RATING WEIGHT Weighed score
flow related (event
hydrology;high flows, floods)
CONFIDENCE
EVENT HYDROLOGY & SEDIMENT SUPPLY 1.00 100.00 2 0.43 2.61 3.00 3.00
RIPARIAN VEGETATION 2.00 80.00 2.00 0.35 2.09 3.00 3.00
CHANNEL STRUCTURES 3.00 50.00 0.00 0.22 0.00 0.00 4.00
TOTALS 230.00 2.00 1.00 4.70
Driver status (%): 68.00
HABITAT DRIVER CATEGORY C
FLOW RELATED 52.27
Komati River Catchment Ecological Water Requirements Study – Quantity Report Page B - 36
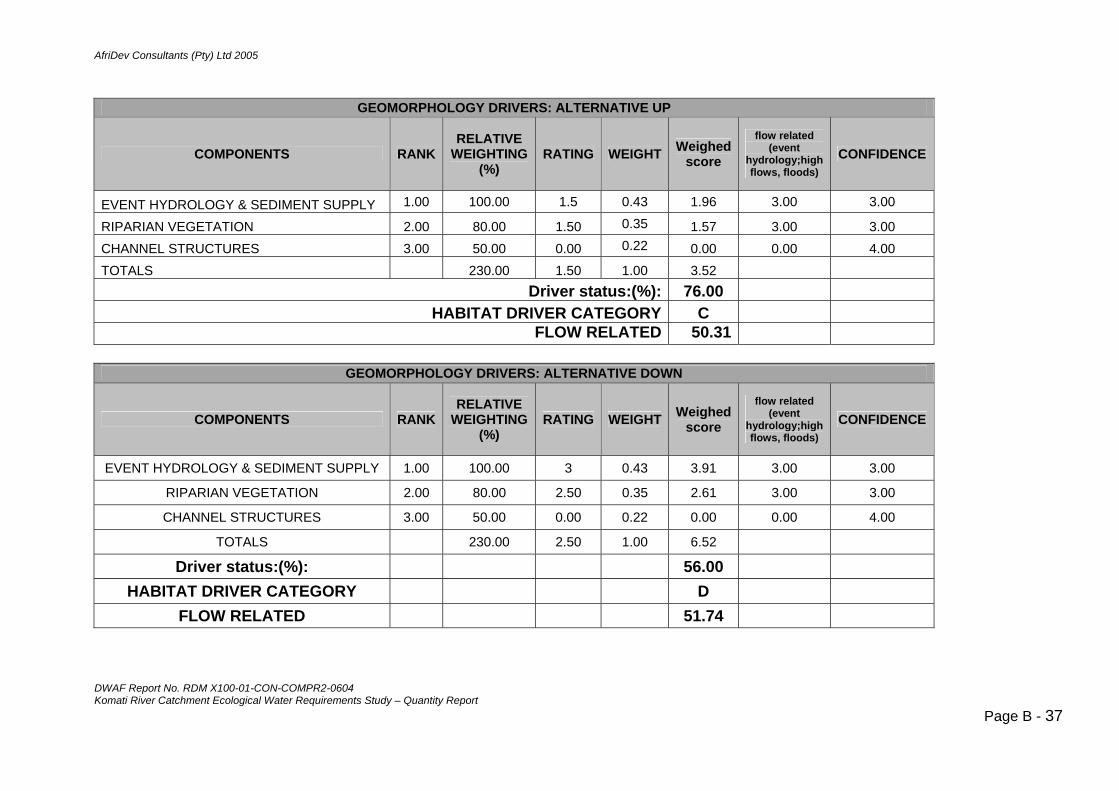
AfriDev Consultants (Pty) Ltd 2005
DWAF Report No. RDM X100-01-CON-COMPR2-0604
GEOMORPHOLOGY DRIVERS: ALTERNATIVE UP
COMPONENTS RANKRELATIVE
WEIGHTING (%)
RATING WEIGHT Weighed score
flow related (event
hydrology;high flows, floods)
CONFIDENCE
EVENT HYDROLOGY & SEDIMENT SUPPLY 1.00 100.00 1.5 0.43 1.96 3.00 3.00
RIPARIAN VEGETATION 2.00 80.00 1.50 0.35 1.57 3.00 3.00CHANNEL STRUCTURES 3.00 50.00 0.00 0.22 0.00 0.00 4.00TOTALS 230.00 1.50 1.00 3.52
Driver status:(%): 76.00 HABITAT DRIVER CATEGORY C
FLOW RELATED 50.31
GEOMORPHOLOGY DRIVERS: ALTERNATIVE DOWN
COMPONENTS RANKRELATIVE
WEIGHTING (%)
RATING WEIGHT Weighed score
flow related (event
hydrology;high flows, floods)
CONFIDENCE
EVENT HYDROLOGY & SEDIMENT SUPPLY 1.00 100.00 3 0.43 3.91 3.00 3.00
RIPARIAN VEGETATION 2.00 80.00 2.50 0.35 2.61 3.00 3.00
CHANNEL STRUCTURES 3.00 50.00 0.00 0.22 0.00 0.00 4.00
TOTALS 230.00 2.50 1.00 6.52
Driver status:(%): 56.00
HABITAT DRIVER CATEGORY D
FLOW RELATED 51.74
Komati River Catchment Ecological Water Requirements Study – Quantity Report Page B - 37

AfriDev Consultants (Pty) Ltd 2005
DWAF Report No. RDM X100-01-CON-COMPR2-0604
EWR site K2 GEOMORPHOLOGY DRIVERS: PES
COMPONENTS RANKRELATIVE
WEIGHTING (%)
RATING WEIGHT Weighed score
flow related (event
hydrology;high flows, floods)
CONFIDENCE
EVENT HYDROLOGY & SEDIMENT SUPPLY 1.00 100.00 2 0.43 2.61 3.00 3.00
RIPARIAN VEGETATION 2.00 80.00 2.00 0.35 2.09 3.00 3.00
CHANNEL STRUCTURES 3.00 50.00 0.50 0.22 0.33 0.00 4.00
TOTALS 230.00 2.50 1.00 5.02
Driver status (%): 66.00
HABITAT DRIVER CATEGORY C
FLOW RELATED 49.38
GEOMORPHOLOGY DRIVERS: ALTERNATIVE UP
COMPONENTS RANKRELATIVE
WEIGHTING (%)
RATING WEIGHT
Weighed score
flow related (event
hydrology;high flows, floods)
CONFIDENCE
EVENT HYDROLOGY & SEDIMENT SUPPLY 1.00 100.00 1.5 0.43 1.96 3.00 3.00
RIPARIAN VEGETATION 2.00 80.00 2.00 0.35 2.09 3.00 3.00
CHANNEL STRUCTURES 3.00 50.00 0.50 0.22 0.33 0.00 4.00
TOTALS 230.00 2.50 1.00 4.37
Driver status (%): 70.00
HABITAT DRIVER CATEGORY C FLOW RELATED 53.63
Komati River Catchment Ecological Water Requirements Study – Quantity Report Page B - 38

AfriDev Consultants (Pty) Ltd 2005
DWAF Report No. RDM X100-01-CON-COMPR2-0604
GEOMORPHOLOGY DRIVERS: ALTERNATIVE DOWN
COMPONENTS RANKRELATIVE
WEIGHTING (%)
RATING WEIGHT Weighed score
flow related (event
hydrology;high flows, floods)
CONFIDENCE
EVENT HYDROLOGY & SEDIMENT SUPPLY 1.00 100.00 3 0.43 3.91 3.00 3.00
RIPARIAN VEGETATION 2.00 80.00 2.50 0.35 2.61 3.00 3.00
CHANNEL STRUCTURES 3.00 50.00 0.50 0.22 0.33 0.00 4.00
TOTALS 230.00 3.00 1.00 6.85
Driver status (%): 54.00
HABITAT DRIVER CATEGORY D
FLOW RELATED 49.83
EWR site K3
GEOMORPHOLOGY DRIVERS: PES
COMPONENTS RANKRELATIVE
WEIGHTING (%)
RATING WEIGHT Weighed score
flow related (event
hydrology;high flows, floods)
CONFIDENCE
EVENT HYDROLOGY & SEDIMENT SUPPLY 1.00 100.00 3 0.42 3.75 3.00 3.00
RIPARIAN VEGETATION 2.00 80.00 3.00 0.33 3.00 3.00 3.00
CHANNEL STRUCTURES 3.00 60.00 3.00 0.25 2.25 0.00 4.00
TOTALS 240.00 6.00 1.00 9.00
Driver status (%): 40.00
HABITAT DRIVER CATEGORY D
FLOW RELATED 44.58
Komati River Catchment Ecological Water Requirements Study – Quantity Report Page B - 39
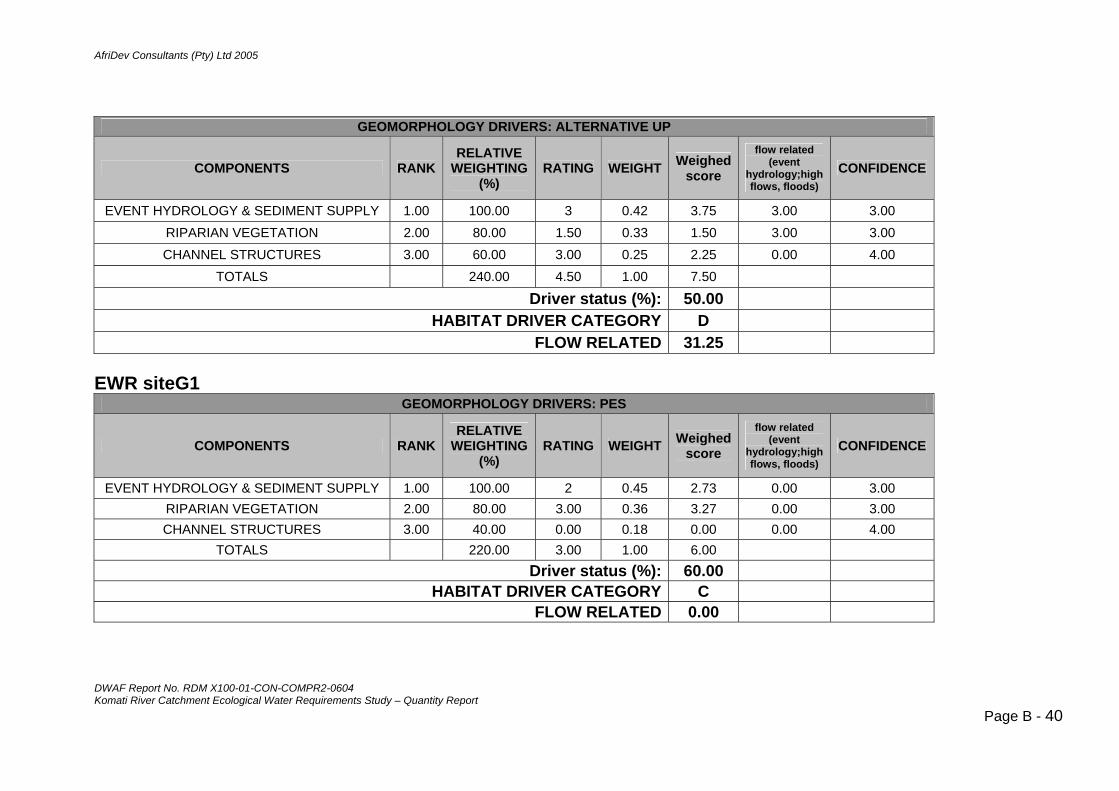
AfriDev Consultants (Pty) Ltd 2005
DWAF Report No. RDM X100-01-CON-COMPR2-0604
GEOMORPHOLOGY DRIVERS: ALTERNATIVE UP
COMPONENTS RANKRELATIVE
WEIGHTING (%)
RATING WEIGHT Weighed score
flow related (event
hydrology;high flows, floods)
CONFIDENCE
EVENT HYDROLOGY & SEDIMENT SUPPLY 1.00 100.00 3 0.42 3.75 3.00 3.00RIPARIAN VEGETATION 2.00 80.00 1.50 0.33 1.50 3.00 3.00 CHANNEL STRUCTURES 3.00 60.00 3.00 0.25 2.25 0.00 4.00
TOTALS 240.00 4.50 1.00 7.50
Driver status (%): 50.00
HABITAT DRIVER CATEGORY D
FLOW RELATED 31.25 EWR siteG1
GEOMORPHOLOGY DRIVERS: PES
COMPONENTS RANKRELATIVE
WEIGHTING (%)
RATING WEIGHT Weighed score
flow related (event
hydrology;high flows, floods)
CONFIDENCE
EVENT HYDROLOGY & SEDIMENT SUPPLY 1.00 100.00 2 0.45 2.73 0.00 3.00RIPARIAN VEGETATION 2.00 80.00 3.00 0.36 3.27 0.00 3.00 CHANNEL STRUCTURES 3.00 40.00 0.00 0.18 0.00 0.00 4.00
TOTALS 220.00 3.00 1.00 6.00 Driver status (%): 60.00
HABITAT DRIVER CATEGORY C FLOW RELATED 0.00
Komati River Catchment Ecological Water Requirements Study – Quantity Report Page B - 40
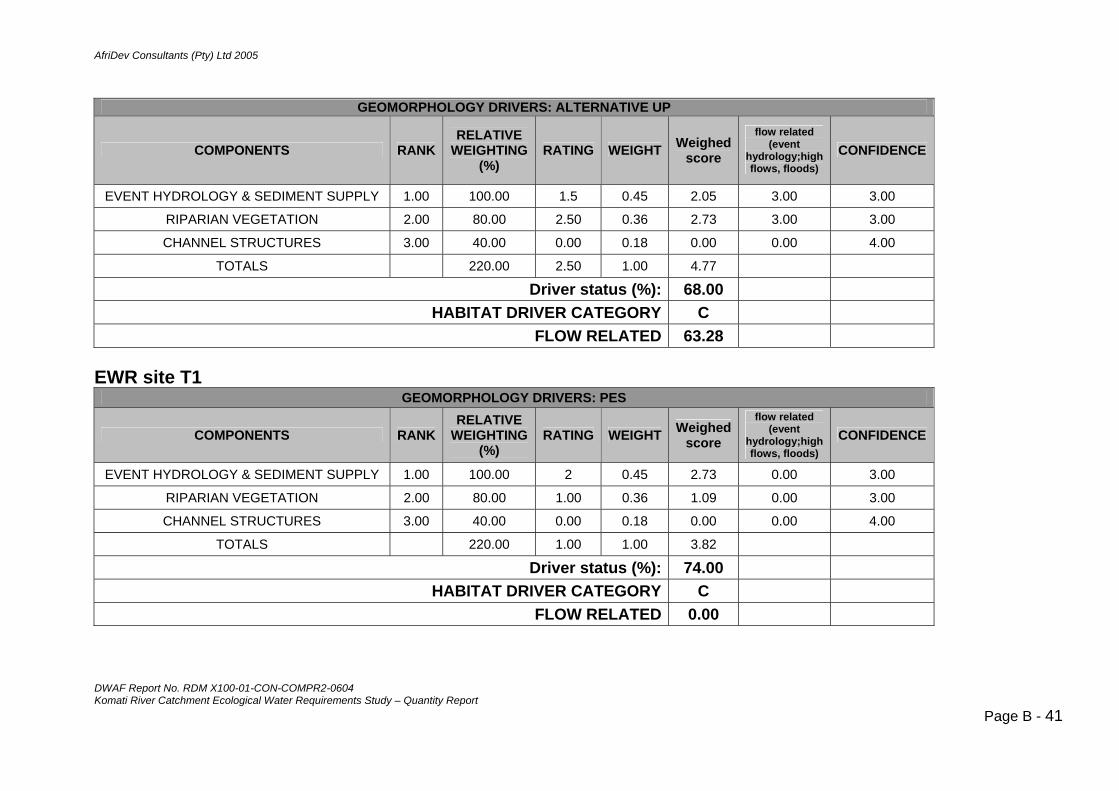
AfriDev Consultants (Pty) Ltd 2005
DWAF Report No. RDM X100-01-CON-COMPR2-0604
GEOMORPHOLOGY DRIVERS: ALTERNATIVE UP
COMPONENTS RANKRELATIVE
WEIGHTING (%)
RATING WEIGHT Weighed score
flow related (event
hydrology;high flows, floods)
CONFIDENCE
EVENT HYDROLOGY & SEDIMENT SUPPLY 1.00 100.00 1.5 0.45 2.05 3.00 3.00
RIPARIAN VEGETATION 2.00 80.00 2.50 0.36 2.73 3.00 3.00
CHANNEL STRUCTURES 3.00 40.00 0.00 0.18 0.00 0.00 4.00
TOTALS 220.00 2.50 1.00 4.77
Driver status (%): 68.00
HABITAT DRIVER CATEGORY C
FLOW RELATED 63.28
EWR site T1
GEOMORPHOLOGY DRIVERS: PES
COMPONENTS RANKRELATIVE
WEIGHTING (%)
RATING WEIGHT Weighed score
flow related (event
hydrology;high flows, floods)
CONFIDENCE
EVENT HYDROLOGY & SEDIMENT SUPPLY 1.00 100.00 2 0.45 2.73 0.00 3.00
RIPARIAN VEGETATION 2.00 80.00 1.00 0.36 1.09 0.00 3.00
CHANNEL STRUCTURES 3.00 40.00 0.00 0.18 0.00 0.00 4.00
TOTALS 220.00 1.00 1.00 3.82
Driver status (%): 74.00
HABITAT DRIVER CATEGORY C
FLOW RELATED 0.00
Komati River Catchment Ecological Water Requirements Study – Quantity Report Page B - 41
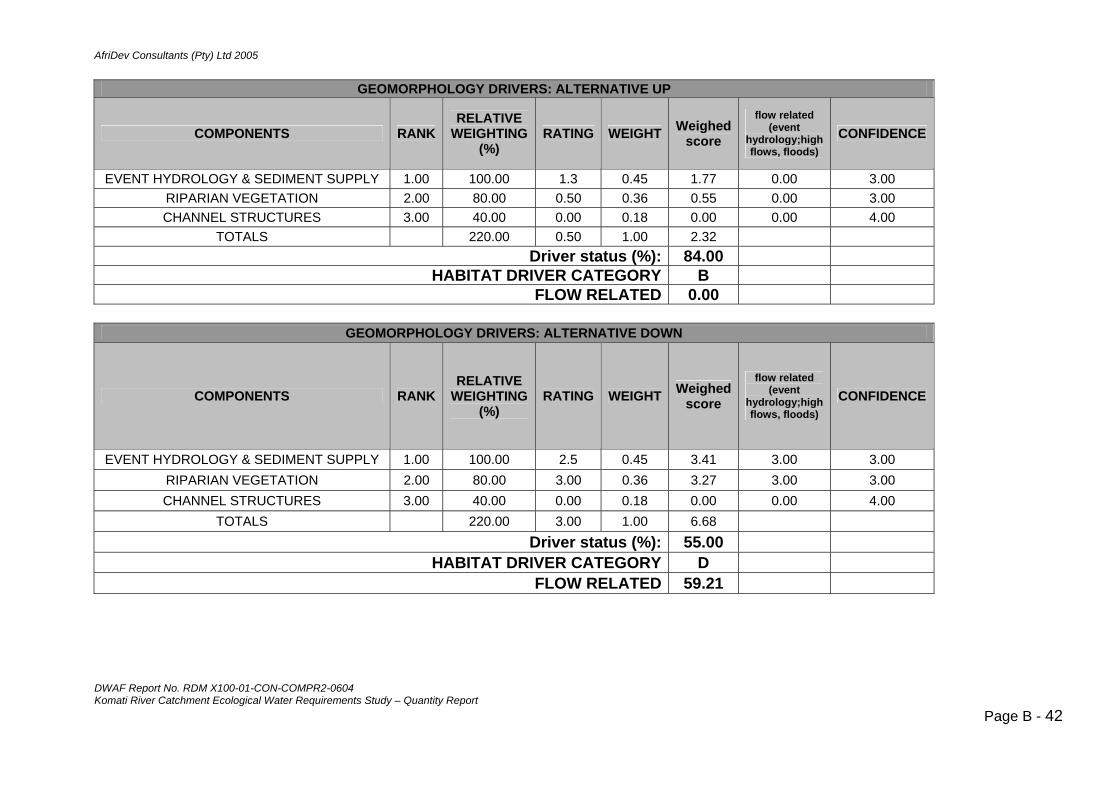
AfriDev Consultants (Pty) Ltd 2005
DWAF Report No. RDM X100-01-CON-COMPR2-0604
GEOMORPHOLOGY DRIVERS: ALTERNATIVE UP
COMPONENTS RANKRELATIVE
WEIGHTING (%)
RATING WEIGHT Weighed score
flow related (event
hydrology;high flows, floods)
CONFIDENCE
EVENT HYDROLOGY & SEDIMENT SUPPLY 1.00 100.00 1.3 0.45 1.77 0.00 3.00RIPARIAN VEGETATION 2.00 80.00 0.50 0.36 0.55 0.00 3.00 CHANNEL STRUCTURES 3.00 40.00 0.00 0.18 0.00 0.00 4.00
TOTALS 220.00 0.50 1.00 2.32 Driver status (%): 84.00
HABITAT DRIVER CATEGORY B FLOW RELATED 0.00
GEOMORPHOLOGY DRIVERS: ALTERNATIVE DOWN
COMPONENTS RANKRELATIVE
WEIGHTING (%)
RATING WEIGHT Weighed score
flow related (event
hydrology;high flows, floods)
CONFIDENCE
EVENT HYDROLOGY & SEDIMENT SUPPLY 1.00 100.00 2.5 0.45 3.41 3.00 3.00RIPARIAN VEGETATION 2.00 80.00 3.00 0.36 3.27 3.00 3.00 CHANNEL STRUCTURES 3.00 40.00 0.00 0.18 0.00 0.00 4.00
TOTALS 220.00 3.00 1.00 6.68 Driver status (%): 55.00
HABITAT DRIVER CATEGORY D FLOW RELATED 59.21
Komati River Catchment Ecological Water Requirements Study – Quantity Report Page B - 42
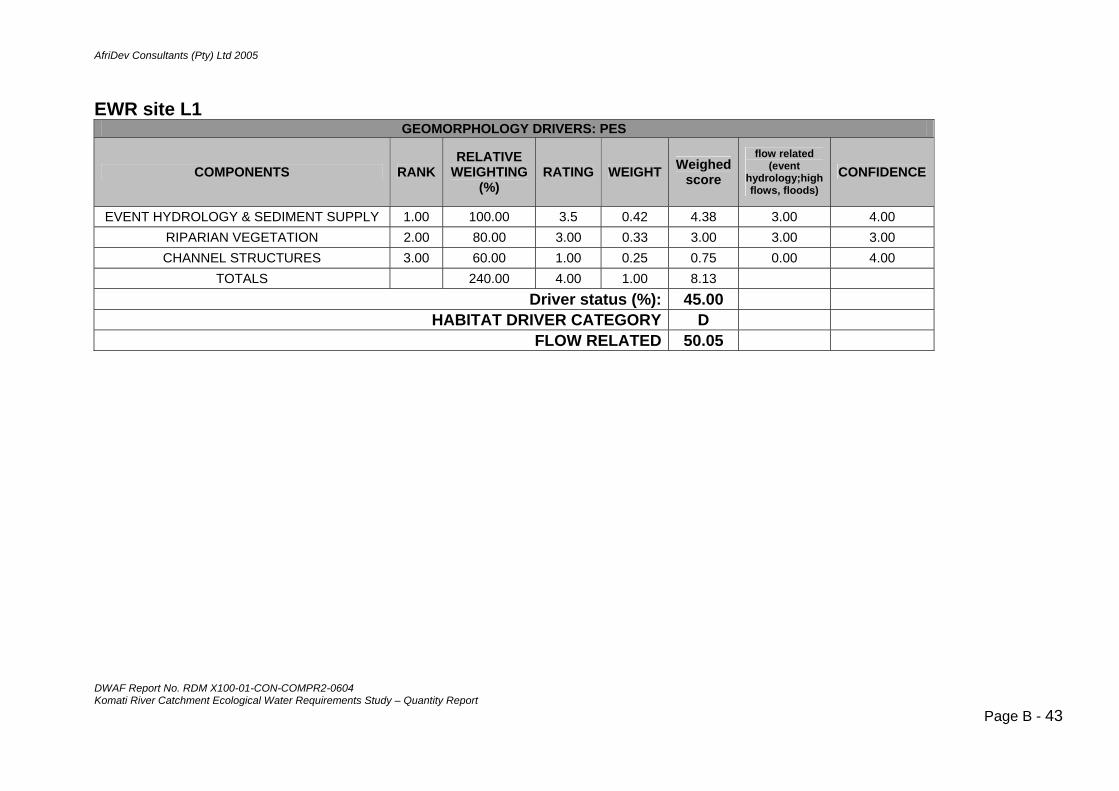
AfriDev Consultants (Pty) Ltd 2005
DWAF Report No. RDM X100-01-CON-COMPR2-0604
EWR site L1
GEOMORPHOLOGY DRIVERS: PES
COMPONENTS RANKRELATIVE
WEIGHTING (%)
RATING WEIGHT Weighed score
flow related (event
hydrology;high flows, floods)
CONFIDENCE
EVENT HYDROLOGY & SEDIMENT SUPPLY 1.00 100.00 3.5 0.42 4.38 3.00 4.00RIPARIAN VEGETATION 2.00 80.00 3.00 0.33 3.00 3.00 3.00 CHANNEL STRUCTURES 3.00 60.00 1.00 0.25 0.75 0.00 4.00
TOTALS 240.00 4.00 1.00 8.13 Driver status (%): 45.00
HABITAT DRIVER CATEGORY D FLOW RELATED 50.05
Komati River Catchment Ecological Water Requirements Study – Quantity Report Page B - 43
AfriDev Consultants (Pty) Ltd 2005
DWAF Report No. RDM X100-01-CON-COMPR2-0604 Komati River Catchment Ecological Water Requirements Study – Quantity Report
Page C - 1
Appendix C: Riparian Vegetation
G Deall, Ecorex
Table of Contents 1 INTRODUCTION......................................................................................................3 2 METHODS ...............................................................................................................3
2.1 Data collection...................................................................................................3 2.2 Data Analysis ....................................................................................................4
3 RESULTS.................................................................................................................6 3.1 EWR Site K1: Gevonden...................................................................................6
3.1.1 Reference Condition (Category A) .............................................................6 3.1.2 Present Ecological State (PES)..................................................................7 3.1.3 Causes of Degradation ..............................................................................8 3.1.4 Trend..........................................................................................................9 3.1.5 PES up to Category B (Largely Natural) ....................................................9 3.1.6 PES down to Category D (Largely Modified)............................................10
3.2 EWR Site K2: Kromdraai.................................................................................12 3.2.1 Reference Condition (Category A) ...........................................................12 3.2.2 Present Ecological State (PES)................................................................12 3.2.3 Causes Of Degradation............................................................................14 3.2.4 Trend........................................................................................................14 3.2.5 PES up to Category B (Largely Natural) ..................................................15 3.2.6 PES down to Category D (Largely Modified)............................................16
3.3 EWR Site K3: Tonga .......................................................................................18 3.3.1 Reference Condition (Category A) ...........................................................18 3.3.2 Present Ecological State (PES)................................................................18 3.3.3 Causes Of Degradation............................................................................20 3.3.4 Trend........................................................................................................21 3.3.5 PES up to Category D (Largely Modified) ................................................21
3.4 EWR Site G1: Vaalkop ....................................................................................22 3.4.1 Reference Condition (Category A) ...........................................................23 3.4.2 Present Ecological State (PES)................................................................24 3.4.3 Causes Of Degradation............................................................................26 3.4.4 Trend........................................................................................................26 3.4.5 PES up to Category C (Moderately Modified) ..........................................26
3.5 EWR Site T1: Teespruit...................................................................................28 3.5.1 Reference Condition (Category A) ...........................................................28 3.5.2 Present Ecological State (PES)................................................................29 3.5.3 Causes Of Degradation............................................................................30 3.5.4 Trend........................................................................................................31 3.5.5 PES up to Category B (Largely Natural) ..................................................31 3.5.6 PES down to Category D (Largely Modified)............................................32
3.6 EWR Site M1: Silingani ...................................................................................34
AfriDev Consultants (Pty) Ltd 2005
DWAF Report No. RDM X100-01-CON-COMPR2-0604 Komati River Catchment Ecological Water Requirements Study – Quantity Report
Page C - 2
3.6.1 Reference Condition (Category A) ...........................................................34 3.6.2 Present Ecological State (PES)................................................................35 3.6.3 Causes Of Degradation............................................................................36 3.6.4 Trend........................................................................................................37 3.6.5 PES up to Category C (Moderately Modified) ..........................................37 3.6.6 PES down to Category E (Seriously Modified) .........................................39
3.7 EWR Site L1: Kleindoringkop ..........................................................................40 3.7.1 Reference Condition (Category A) ...........................................................40 3.7.2 Present Ecological State (PES)................................................................41 3.7.3 Causes Of Degradation............................................................................43 3.7.4 Trend........................................................................................................43
4 CONCLUSIONS .....................................................................................................44 5 REFERENCES.......................................................................................................45 ANNEX A. Ecological-category models (PES and alternatives) for 7 EWR sites (Models 1 – 7) 46 ANNEX B. Vegetation profiles at EWR sites (Figures 1 – 6) 64 ANNEX C. Plant species distributions within vegetation zones of EWR sites (Tables 1 – 7) 76

AfriDev Consultants (Pty) Ltd 2005
DWAF Report No. RDM X100-01-CON-COMPR2-0604 Komati River Catchment Ecological Water Requirements Study – Quantity Report
Page C - 3
1 INTRODUCTION Riparian vegetation is an extensive and important component of a river ecosystem, both in its own right, and due to its provision of extensive habitat for fauna and flora both within as well as outside of the river. Vegetation also plays a valuable role in the stabilisation of riverbanks, attenuation of floods, prevention of erosion and associated sedimentation (Kemper, 2003). The structure, cover, abundance and composition of riparian vegetation varies in response to differences in altitude, topography, climate, geology, soils, levels of utilization, adjacent land use and flow regime. Whilst most of these factors remain constant at any particular point in the river, others such as levels of utilisation, adjacent land use and flow regime are more dynamic, being subject to anthropogenic influences. Description of the baseline status of riparian vegetation at selected sites on a river therefore provides a basis for assessing flow requirements and for monitoring long-term changes in vegetation. The purpose of this report is to describe and quantify the important riparian vegetation attributes such as structure, cover, abundance and composition at each of the EWR sites selected for the Komati River EWR study, and on this basis to define the Present Ecological State (PES) of each site compared to its perceived natural state, or ‘reference condition’. The report also identifies possible causes of degradation at each site and predicts trajectories of change. Thus a PES category for riparian vegetation is assigned to each site, and alternative categories (better and worse states) described. This provides a basis for assessing1 the flow requirements of riparian vegetation at each site for a range of defined Ecological Categories (EC) or management classes. The seven EWR sites selected for the Komati River EWR study are cited in the report as follows: K1 Gevonden G1 Vaalkop M1 Silingani K2 Kromdraai T1 Teespruit L1 Kleindoringkop K3 Tonga 2 METHODS 2.1 DATA COLLECTION Within a ±5 meter-wide strip2 running either side of a permanently marked line transect at each EWR site, the bases of individual indicator plants and boundaries of vegetation zones were tagged by means of sequentially numbered plastic nursery markers and their positions were surveyed into the river profile by the hydraulics specialist. Indicator plants were named and their height classes (<0.5m, 0.5-1m, 1-2m, 2-5m, >5m) recorded. Thus a graphic profile of the vegetation occurring at each EWR site could be constructed.
1 In context of the multidisciplinary specialist workshop

AfriDev Consultants (Pty) Ltd 2005
DWAF Report No. RDM X100-01-CON-COMPR2-0604 Komati River Catchment Ecological Water Requirements Study – Quantity Report
Page C - 4
Additional data recorded per vegetation zone included a description of the substrate3, terrain morphology, rock cover, vegetation cover, species composition4, and species cover-abundance5. Thus an informal community nomenclature could be assigned to the vegetation of each zone. Adjacent land use on both the left-hand and right-hand banks was also recorded together with an assessment of vegetation condition and factors of disturbance in both the riparian zone and adjacent vegetation. Each EWR site was visited twice. In August 2003 the vegetation profiles were surveyed in and basic environmental data recorded. In April 2004, preliminary species checklists were updated. 2.2 DATA ANALYSIS On the basis of the author’s working knowledge of the vegetation of Mpumalanga, and on classical studies such as Acocks’s (1988) description of veld types, the perceived reference conditions of riparian vegetation at each EWR site were described. The model for determining the Present Ecological State (PES) of riparian vegetation (Water Research Source-to-Sea et al, 2004) was run for each EWR site with reference to the perceived reference condition, site photos, the graphic vegetation profile, species composition, previous studies (eg. Marneweck, 1998, 1999), and in some cases data collected for Riparian Vegetation Index (RVI) determinations (AfriDev, 2004). In simple terms, the model scores different attributes of vegetation on the basis of the suspected percentage loss or increase of that attribute compared to the reference condition. The relationship between PES scores and PES categories is as follows (after Kleynhans, 1996):
PES score (%) PES category Description > 89 A Natural, unmodified (reference condition)
80 – 89 B Largely natural with few modifications 60 – 79 C Moderately modified 40 – 59 D Largely modified 20 – 39 E Seriously modified
< 20 F Critically modified The PES category for each site was then described, as well as the categories for better (up) and worse (down) ecological states. Scoring in the model is applied to each of three different zones in the river profile corresponding to levels and frequency of inundation as follows:
2 In some cases, important plants occurring outside the designated area of the belt transect were ‘pulled’ onto the profile at the level of occurrence 3 Superficial soil samples were collected and subjected to textural analysis 4 Excluding mosses and algae 5 Using the Braun-Blanquet cover scale within the broad 10 meter-wide strip
AfriDev Consultants (Pty) Ltd 2005
DWAF Report No. RDM X100-01-CON-COMPR2-0604 Komati River Catchment Ecological Water Requirements Study – Quantity Report
Page C - 5
The marginal zone is the area immediately adjacent to the river channel that is frequently inundated during the course of a wet season. This zone also includes islands and bars, which are inundated during the wet season. The upper border of this zone corresponds to the highest level to which the annual flood event reaches (excluding larger floods which occur at a lower frequency). The zone is usually characterised by an abundance of sedges and mesic grass species as well as woody species, which require rooting in continuously water logged substrates. The lower riparian zone is that area which lies immediately above that of the marginal zone and which is not inundated on an annual basis. It is characterised by a distinct absence of sedges and mesic grasses and hosts mainly terrestrial grasses and mesic woody species. This zone often serves as a nursery area for riparian seedlings and is usually susceptible to infestation by alien species. Its upper level is usually recognised by an increase in abundance of woody riparian species that occupy the adjacent upper riparian zone. The upper riparian zone is defined as that which occupies the zone adjoining the lower riparian zone beneath it. It is characterised by more xeric riparian species usually in reasonable abundance and size. It is often found on the higher part of the riparian bank. In upland and grassland areas this zone is mainly characterised by dense terrestrial grass swards, which are lusher than the adjacent terrestrial areas. Five different attributes of riparian vegetation are scored, namely abundance, cover, structure, species richness and species composition: Vegetation abundance is qualitatively assessed in terms of the extent of change in vegetation (biomass) present in the relevant zone at the site. Changes in vegetation abundance often occur due to grazing and browsing, vegetation removal, floods, fire, invasion by aliens and reeds, water abstraction and inundation. Vegetation cover is qualitatively assessed in terms of the extent of change in the (canopy) cover of vegetation in the relevant zone at the site. Cover is often reduced by soil erosion, deposition of sediments, vegetation removal, grazing and browsing, floods, fire, water abstraction, inundation and invasion by aliens and reeds. Species richness is qualitatively assessed in terms of the extent of change in the number of plant species in the relevant riparian zone at the site. Changes in species richness often occur due to invasion by alien species and reeds, grazing and browsing, vegetation removal, inundation, deposition of sediments, water abstraction and flooding. Species composition is qualitatively assessed in terms of the extent to which the suite of species occupying the relevant zone at the site has been changed. Species compositional changes often occur due to the selective removal of species, changes in low flows, changes in elevated flows, grazing and browsing, the invasion of alien species and reeds, the impacts of floods and fire, deposition of sediments, inundation and water abstraction.

AfriDev Consultants (Pty) Ltd 2005
DWAF Report No. RDM X100-01-CON-COMPR2-0604 Komati River Catchment Ecological Water Requirements Study – Quantity Report
Page C - 6
Vegetation structure is qualitatively assessed in terms of the extent of change in vertical structure in the relevant zone at the site. Changes in vertical structure occur due to the selective removal or loss of specific size classes of vegetation at the site. These often occur due to the selective removal of age/size classes or specific species, grazing and browsing, floods and fire, inundation and water abstraction. 3 RESULTS Ecological-category models, vegetation profiles and species distribution checklists for each EWR site are provided in Annexes A, B and C respectively. 3.1 EWR SITE K1: GEVONDEN 3.1.1 Reference Condition (Category A) Description of the reference condition is based on Acocks (1988) and the author’s working experience in Piet Retief Sourveld. There should be clear zoning of riparian vegetation as follows (Annex B, Figure 1; Annex C, Table 1): Marginal zone (Zones 3 and 4): Sedgeland \ Reedbed on stream banks Sidebars comprising mud in the form of cobbled, slightly clayey, silty sand would be dominated by mesophytic grass species such as Ischaemum fasciculatum and Miscanthus junceus; and sedges such as Cyperus marginatus, Schoenoplectus brachyceras and Kyllinga melanosperma (Zone 3). More frequently inundated sidebars comprising deeper mud in the form of fine sandy clayey silt would be dominated by clumps of the reed Phragmites mauritianus and the hydrophytic shrub Salix mucronata (Zone 4). Other noteworthy plants would include the medicinal geophyte Crinum sp. in Zone 3. Naturalised exotic species such as the grass Paspalum dilatatum should not be present. Lower riparian zone (Zones 2 and 5): Shrubby Grassland on firm alluvial slopes Mesophytic grasses such as Ischaemum fasciculatum and Imperata cylindrica would provide the dominant ground cover on the clayey, silty, sand substrate with cobbles (Zone 2). Return seepage from wetlands (eg. Zone 6) would potentially result in the development of anomalous vegetation communities that are not wholly river-dependent (eg. the Ischaemum fasciculatum – Cliffortia stobilefera shrubby grassland, Zone 5). Mesophytic shrubs such as Cliffortia strobilefera and Rhus gerarrdii would occur in both zones as scattered individuals. Occasional mesophytic trees such as Ficus sur and Syzygium cordatum may also be found. The shrubland structure would be maintained by regular seedling recruitment of such species. Terrestrial species such as Diospyros lycioides and Euclea crispa should not be present. Likewise, naturalized exotic species such as Verbena bonariensis and alien invader species such as Acacia mearnsii (Wattle) should not occur in this zone. Upper riparian zone (Zone 1): Open Woodland on firm alluvial slopes

AfriDev Consultants (Pty) Ltd 2005
DWAF Report No. RDM X100-01-CON-COMPR2-0604 Komati River Catchment Ecological Water Requirements Study – Quantity Report
Page C - 7
The shallow, slightly clayey sandy soils on the right slope represent an ecotone supporting relic riparian species (eg. Rhus gerarrdii, Bothriochloa insculpta) and mostly non-riparian species (eg. Dombeya rotundifolia, Themeda triandra, Diospyros lycioides and Euclea crispa). The woodland structure would be maintained by regular seedling recruitment of such species. There would be a good ground cover of grasses such as Themeda triandra, Panicum maximum and Cymbopogon validus. There should be no alien invasive species such as Acacia mearnsii (Wattle) and Solanum mauritianum (Bugweed) present. 3.1.2 Present Ecological State (PES) Based on suspected changes in vegetation attributes within three main vegetation zones compared to the reference condition, the PES model for riparian vegetation (Annex A, Model 1a) determined the condition of the site to be Category C (moderately modified). The geomorphologist’s assessment of time-lapsed aerial photos of the site and her field observations were also taken into account, namely good to moderate bank stability; encroachment of reeds onto instream features and secondary channels; no evidence of changes to woody riparian vegetation by clearing. Suspected vegetation changes from the reference condition (Category A) are described as follows (cf. Annex A, Model 1a; Annex B, Figure 1; Annex C, Table 1): Marginal zone (Zones 3 and 4): Sedgeland and Reedbank VEGETATION ABUNDANCE Moderate increase in biomass of Phragmites mauritianus reeds (Zone 4). VEGETATION COVER Moderate reduction in cover of mesophytic grasses such as Ischaemum fasciculatum and Miscanthus junceus; and of sedges such as Cyperus marginatus, Schoenoplectus brachyceras and Kyllinga melanosperma (Zone 3). SPECIES RICHNESS Small reduction in number of indigenous species of grasses and sedges and of the hydrophytic shrub Salix mucronata. SPECIES COMPOSITION Small change in overall species composition, for example the presence of the naturalized exotic grass Paspalum dilatatum. VEGETATION STRUCTURE No significant change Lower Riparian zone (Zones 2 and 5): Shrubby Grassland on firm alluvial slopes VEGETATION ABUNDANCE

AfriDev Consultants (Pty) Ltd 2005
DWAF Report No. RDM X100-01-CON-COMPR2-0604 Komati River Catchment Ecological Water Requirements Study – Quantity Report
Page C - 8
Moderate reduction in biomass as a result of losing trees such as Ficus sur and Syzygium cordatum VEGETATION COVER Moderate reduction in cover of mesophytic grasses such as Ischaemum fasciculatum and Imperata cylindrica (Zone 2) SPECIES RICHNESS Moderate reduction in number of indigenous species such as Ficus sur and Syzygium cordatum as terrestrialisation occurs. SPECIES COMPOSITION Moderate change in overall species composition as terrestrial species such as Diospyros lycioides and Euclea crispa and alien invader species such as Acacia mearnsii (Wattle) invade Zone 5. VEGETATION STRUCTURE Moderate reduction in structure due to replacement of riparian trees such as Ficus sur and Syzygium cordatum with terrestrial and invader species such as Diospyros lycioides, Euclea crispa and Acacia mearnsii (Wattle). Recruitment levels of the latter species are high. Upper Riparian zone (Zone 1): Open Woodland on firm alluvial slopes VEGETATION ABUNDANCE Small reduction in biomass as terrestrialisation takes place and the number of trees such as Rhus gerarrdii becomes depleted. VEGETATION COVER Small reduction in grass cover as a result of mesophytic species such as Bothriochloa insculpta being replaced by more xerophytic species such as Themeda triandra. SPECIES RICHNESS Small reduction in number of indigenous species SPECIES COMPOSITION Small change in overall species composition as terrestrialisation takes place and ephemeral species such as Bidens pilosa, Leonotis dysophyllla, Melinis repens and Tagetes minuta invade. VEGETATION STRUCTURE No significant change 3.1.3 Causes of Degradation Flow-related causes:
AfriDev Consultants (Pty) Ltd 2005
DWAF Report No. RDM X100-01-CON-COMPR2-0604 Komati River Catchment Ecological Water Requirements Study – Quantity Report
Page C - 9
• Attenuation of intra-annual floods caused by upstream Nooitgedacht dam and Gemsbokhoek weir resulting in reed encroachment, terrestrialization and alien-plant invasion, especially by Solanum mauritianum (Bugweed) and Acacia mearnsii (Wattle)
• Streamflow reduction caused by forestry plantations and abstraction for tourism resulting in reed encroachment, terrestrialization and alien-plant invasion, especially by Solanum mauritianum (Bugweed) and Acacia mearnsii (Wattle)
Non-flow-related causes: • Upstream forestry and tourism activities, particularly gravel-road river crossings, resulting in
bank erosion and increased sedimentation 3.1.4 Trend Assuming current conditions, as well as future control of invasive Acacia mearnsii (Wattle) the Trend is considered to be stable. The following predictions regarding Present Ecological State in the short and long terms can be made:
Short term (<5 years) Long term (>20 years) Stable C C 3.1.5 PES up to Category B (Largely Natural) Suspected vegetation changes from the reference condition (Category A) are described as follows (cf. Annex A, Model 1b; Annex B, Figure 1; Annex C, Table 1): Marginal zone (Zones 3 and 4): Sedgeland \ Reedbed on stream banks VEGETATION ABUNDANCE Small increase in biomass of Phragmites mauritianus reeds and of hydrophytic shrubs such as Salix mucronata (Zone 4). VEGETATION COVER Small reduction in cover of mesophytic grasses such as Ischaemum fasciculatum and Miscanthus junceus; and of sedges such as Cyperus marginatus, Schoenoplectus brachyceras and Kyllinga melanosperma (Zone 3). SPECIES RICHNESS No significant change SPECIES COMPOSITION No significant change VEGETATION STRUCTURE No significant change Lower Riparian zone (Zones 2 and 5): Shrubby Grassland on firm alluvial slopes VEGETATION ABUNDANCE
AfriDev Consultants (Pty) Ltd 2005
DWAF Report No. RDM X100-01-CON-COMPR2-0604 Komati River Catchment Ecological Water Requirements Study – Quantity Report
Page C - 10
Small reduction in biomass as a result of losing trees such as Syzygium cordatum VEGETATION COVER Small reduction in cover of mesophytic grasses such as Ischaemum fasciculatum and Imperata cylindrica (Zone 2) SPECIES RICHNESS Small reduction in number of indigenous species such as Syzygium cordatum SPECIES COMPOSITION Small change in species composition as naturalized exotics such as Verbena bonariensis invade. VEGETATION STRUCTURE Small reduction in structure due to loss of riparian trees such as Syzygium cordatum. Upper Riparian zone (Zone 1): Open Woodland on firm alluvial slopes VEGETATION ABUNDANCE No significant change VEGETATION COVER No significant change SPECIES RICHNESS No significant change SPECIES COMPOSITION No significant change VEGETATION STRUCTURE No significant change 3.1.6 PES down to Category D (Largely Modified) Suspected vegetation changes from the reference condition (Category A) are described as follows (cf. Annex A, Model 1c; Annex B, Figure 1; Annex C, Table 1): Marginal zone (Zones 3 and 4): Sedgeland \ Reedbed on stream banks VEGETATION ABUNDANCE Serious increase in biomass of Phragmites mauritianus reeds (Zone 4). VEGETATION COVER Large reduction in cover of mesophytic grasses such as Ischaemum fasciculatum and Miscanthus junceus; and of sedges such as Cyperus marginatus, Schoenoplectus brachyceras and Kyllinga melanosperma (Zone 3). SPECIES RICHNESS Moderate reduction in number of indigenous species of grasses and sedges and possibly of the hydrophytic shrub Salix mucronata and the geophyte Crinum sp. SPECIES COMPOSITION
AfriDev Consultants (Pty) Ltd 2005
DWAF Report No. RDM X100-01-CON-COMPR2-0604 Komati River Catchment Ecological Water Requirements Study – Quantity Report
Page C - 11
Moderate change in overall species composition, for example the presence of the naturalized exotic grass Paspalum dilatatum, and alien-invader species Acacia mearnsii (Wattle), Solanum sysimbrifolium, Solanum mauritianum (Bugweed) and Xanthium strumarium. VEGETATION STRUCTURE Moderate change in structure due to the introduction of exotic tree species. Lower Riparian zone (Zones 2 and 5): Shrubby Grassland on firm alluvial slopes VEGETATION ABUNDANCE Moderate reduction in biomass as a result of losing trees such as Ficus sur and Syzygium cordatum VEGETATION COVER Moderate reduction in cover of mesophytic grasses such as Ischaemum fasciculatum and Imperata cylindrica (Zone 2) SPECIES RICHNESS Large reduction in number of indigenous mesophytic species such as trees Ficus sur and Syzygium cordatum; grasses Imperata cylindrica and Miscanthus junceus; and shrub Cliffortia strobilefera. SPECIES COMPOSITION Large change in overall species composition as terrestrial species such as Diospyros lycioides and Euclea crispa and alien invader species such as Acacia mearnsii (Wattle) and Solanum mauritianum invade Zones 2 and 5. VEGETATION STRUCTURE Moderate reduction in structure due to replacement of riparian trees such as Ficus sur and Syzygium cordatum with terrestrial and invader species such as Diospyros lycioides, Euclea crispa and Acacia mearnsii (Wattle). Upper Riparian zone (Zone 1): Open Woodland on firm alluvial slopes VEGETATION ABUNDANCE Small reduction in biomass as terrestrialisation takes place and the number of trees such as Rhus gerarrdii becomes depleted. VEGETATION COVER Moderate reduction in grass cover as a result of mesophytic species such as Bothriochloa insculpta being replaced by more xerophytic species such as Themeda triandra. SPECIES RICHNESS Small reduction in number of indigenous species SPECIES COMPOSITION Moderate change in overall species composition as terrestrialisation takes place and ephemeral species such as Bidens pilosa, Leonotis dysophyllla, Melinis repens and Tagetes minuta invade. VEGETATION STRUCTURE Small reduction in structure due to loss of mesophytic tree species such as Rhus gerarrdii

AfriDev Consultants (Pty) Ltd 2005
DWAF Report No. RDM X100-01-CON-COMPR2-0604 Komati River Catchment Ecological Water Requirements Study – Quantity Report
Page C - 12
3.2 EWR SITE K2: KROMDRAAI 3.2.1 Reference Condition (Category A) Description of the reference condition is based on Acocks (1988) and the author’s working experience in Lowveld Sour Bushveld. There should be clear zoning of riparian vegetation as follows (Annex B, Figure 2; Annex C, Table 2): Marginal zone (Zones 1a, 2a and 3): Grassland \ Reedbed on stream banks Annual flood benches comprising mud in the form of clayey sand with occasional fine gravels would be dominated by mesophytic grass species such as Ischaemum fasciculatum and sedges such as Cyperus marginatus (Zones 1a/2a). The waterside fern Amelopteris prolifera would also be featured. Narrow lateral channels comprising firm alluvium in the form of sandy clay with occasional sub-rounded gravels and boulders would be dominated by clumps of the reed Typha capensis and Phragmites mauritianus; and the hydrophytic shrub Periscaria attenuata and the sedge Cyperus marginatus (Zone 3). Naturalised exotic species such as Verbena bonariensis and Ageratum houstianum should not be present. Lower Riparian zone (Zones 1 and 2): Open Woodland on firm alluvial plains Mesophytic grasses such as Ischaemum fasciculatum and Bothriochloa insculpta would provide the dominant ground cover on the firm alluvial flood plain comprising clayey, silty, sand with occasional coarse gravels. Mesophytic trees and shrubs such as Combretum erythrophyllum, Sesbania sesban and Ficus sycomorus would occur in both zones as scattered individuals. Occasional mesophytic trees such as Ficus sur and Syzygium cordatum may also be found. The woodland structure would be maintained by regular seedling recruitment of such species. Terrestrial species such as Euclea crispa should not be present. Likewise, naturalized exotic species such as Verbena bonariensis and Ageratum houstianum, and alien invader species such as Acacia mearnsii (Wattle) should not occur in this zone. Upper Riparian zone (Zones 0 and 4): Closed Woodland on firm colluvial slopes The clayey, silty fine/medium sands of hillslopes represent an ecotone supporting relic riparian species (eg. Combretum erythrophyllum) and mostly non-riparian species (eg. Dombeya rotundifolia, Themeda triandra, Diospyros lycioides and Euclea crispa). The woodland structure would be maintained by regular seedling recruitment of such species. There would be a good ground cover of grasses such as Themeda triandra, Panicum maximum and Cymbopogon validus. There should be no alien invasive species such as Acacia mearnsii (Wattle), Lantana camara and Zinnia peruviana present. 3.2.2 Present Ecological State (PES) Based on suspected changes in vegetation attributes within three main vegetation zones compared to the reference condition, the PES model for riparian vegetation (Annex A, Model 2a) determined the condition of the site to be Category C (moderately modified). The

AfriDev Consultants (Pty) Ltd 2005
DWAF Report No. RDM X100-01-CON-COMPR2-0604 Komati River Catchment Ecological Water Requirements Study – Quantity Report
Page C - 13
geomorphologist’s assessment of time-lapsed aerial photos of the site and her field observations were also taken into account, namely good bank stability and widespread reed growth causing localised channel narrowing. Suspected vegetation changes from the reference condition (Category A) are described as follows (cf. Annex A, Model 2a; Annex B, Figure 2; Annex C, Table 2): Marginal zone (Zones 1a, 2a and 3): Grassland \ Reedbed on stream banks VEGETATION ABUNDANCE Moderate increase in biomass of Phragmites mauritianus reeds. VEGETATION COVER Moderate increase in cover of Phragmites mauritianus reeds and of mesophytic grasses such as Ischaemum fasciculatum and Bothriochloa insculpta (Zone 3) and of hydrophytic forbs such as Persicaria attenuata and sedges such as Cyperus marginatus. SPECIES RICHNESS Moderate reduction in number of indigenous species of grasses and sedges. SPECIES COMPOSITION Moderate change in overall species composition, for example the presence of the naturalized exotic species Verbena bonariensis and Ageratum houstianum. VEGETATION STRUCTURE Moderate change in structure due to extensive spread of Phragmites mauritianus reeds. Lower Riparian zone (Zones 1 and 2): Open Woodland on firm alluvial plains VEGETATION ABUNDANCE Moderate increase in biomass as a result of encroachment by Phragmites mauritianus reeds. VEGETATION COVER Moderate increase in cover of mesophytic grasses such as Ischaemum fasciculatum and Bothriochloa insculpta; of Phragmites mauritianus and of the shrub Sesbania sesban. SPECIES RICHNESS Small reduction in number of indigenous species as terrestrialisation and encroachment by species such as Paspalum dilatatum occurs. SPECIES COMPOSITION Small change in overall species composition as alien invader species such as Solanum sysimbrifolium and Acacia mearnsii (Wattle) invade. VEGETATION STRUCTURE

AfriDev Consultants (Pty) Ltd 2005
DWAF Report No. RDM X100-01-CON-COMPR2-0604 Komati River Catchment Ecological Water Requirements Study – Quantity Report
Page C - 14
Small change in structure due to encroachment by Phragmites mauritianus and high density of Sesbania sesban. Upper Riparian zone (Zones 0 and 4): Closed Woodland on firm colluvial slopes VEGETATION ABUNDANCE Small increase in biomass due to encroachment by alien invaders such as Lantana camara. VEGETATION COVER No significant change in cover. SPECIES RICHNESS No significant change in species richness. SPECIES COMPOSITION Small change in overall species composition as terrestrialisation sets in and ephemeral species such as Zinnia peruviana and alien species such as Lantana camara invade. VEGETATION STRUCTURE Small change in structure due to presence of Lantana camara in shrub layer. 3.2.3 Causes Of Degradation Flow-related causes: • Attenuation of intra-annual floods caused by upstream Vygeboom dam resulting in reed
encroachment, terrestrialization and alien-plant invasion, especially by Lantana camara and Acacia mearnsii (Wattle)
• Reduced low-flows caused by abstraction by upstream settlements (Badplaas, Tjakastad, eKulideni) resulting in reed encroachment, terrestrialization and alien-plant invasion, especially by Lantana camara and Acacia mearnsii (Wattle)
Non-flow-related causes: • Upstream erosion from overgrazing and agriculture resulting in sedimentation,
terrestrialisation, alien-plant invasion and reed encroachment • Ground-water pollution from septic tanks / pit latrines 3.2.4 Trend Considering that current management of releases from Vygeboom Dam is not likely to change, and considering that a large portion of this RU will be converted from agriculture to a wilderness area, with associated rehabilitation of erosion dongas, the Trend is considered to be stable.

AfriDev Consultants (Pty) Ltd 2005
DWAF Report No. RDM X100-01-CON-COMPR2-0604 Komati River Catchment Ecological Water Requirements Study – Quantity Report
Page C - 15
The following predictions regarding Present Ecological State in the short and long terms can be made: Short term (<5 years) Long term (>20 years) Stable C C 3.2.5 PES up to Category B (Largely Natural) Suspected vegetation changes from the reference condition (Category A) are described as follows (cf. Annex A, Model 2b; Annex B, Figure 2; Annex C, Table 2): Marginal zone (Zones 1a, 2a and 3): Grassland \ Reedbed on stream banks VEGETATION ABUNDANCE Small increase in biomass of Phragmites mauritianus reeds. VEGETATION COVER Small increase in cover of Phragmites mauritianus reeds SPECIES RICHNESS Small reduction in number of indigenous species of grasses and sedges. SPECIES COMPOSITION Small change in overall species composition, for example the presence of the naturalized exotic species Verbena bonariensis. VEGETATION STRUCTURE Small change in structure due to spread of Phragmites mauritianus reeds. Lower Riparian zone (Zones 1 and 2): Open Woodland on firm alluvial plains VEGETATION ABUNDANCE Small increase in biomass as a result of encroachment by Phragmites mauritianus reeds. VEGETATION COVER Small increase in cover of mesophytic grasses such as Ischaemum fasciculatum and Phragmites mauritianus. SPECIES RICHNESS Small reduction in number of indigenous species as terrestrialisation and encroachment by species such as Paspalum dilatatum occurs. SPECIES COMPOSITION Small change in overall species composition as terrestrial species such as alien invader species such as Solanum sysimbrifolium and Acacia mearnsii (Wattle) invade.

AfriDev Consultants (Pty) Ltd 2005
DWAF Report No. RDM X100-01-CON-COMPR2-0604 Komati River Catchment Ecological Water Requirements Study – Quantity Report
Page C - 16
VEGETATION STRUCTURE No significant change in structure. Upper Riparian zone (Zones 0 and 4): Closed Woodland on firm colluvial slopes VEGETATION ABUNDANCE No significant change in abundance. VEGETATION COVER No significant change in cover. SPECIES RICHNESS No significant change in species richness. SPECIES COMPOSITION Small change in overall species composition as terrestrialisation sets in and ephemeral species such as Zinnia peruviana and alien species such as Lantana camara invade. VEGETATION STRUCTURE No significant change in structure. 3.2.6 PES down to Category D (Largely Modified) Suspected vegetation changes from the reference condition (Category A) are described as follows (cf. Annex A, Model 2c; Annex B, Figure 2; Annex C, Table 2): Marginal zone (Zones 1a, 2a and 3): Grassland \ Reedbed on stream banks VEGETATION ABUNDANCE Large increase in biomass of Phragmites mauritianus reeds. VEGETATION COVER Large increase in cover of mesophytic grasses such as Ischaemum fasciculatum, Bothriochloa insculpta and of Phragmites mauritianus reeds. SPECIES RICHNESS Large reduction in number of indigenous species of grasses and sedges and of the mesophytic tree Combretum erythrophyllum, the hydrophytic herb Commelina banghalensis, and the fern Amelopteris prolifera. SPECIES COMPOSITION Large change in overall species composition, for example the presence of the naturalized exotic grass Paspalum dilatatum, and alien-invader species Acacia mearnsii (Wattle) and Richardia brasilensis. The cover-abundance of Periscaria attenuata and Verbena bonariensis may also increase inordinately.
AfriDev Consultants (Pty) Ltd 2005
DWAF Report No. RDM X100-01-CON-COMPR2-0604 Komati River Catchment Ecological Water Requirements Study – Quantity Report
Page C - 17
VEGETATION STRUCTURE Large change in structure due to the introduction of exotic tree species such as Acacia mearnsii (Wattle). Lower Riparian zone (Zones 1 and 2): Open Woodland on firm alluvial plains VEGETATION ABUNDANCE Large decrease in biomass as a result of reduction in Phragmites mauritianus due to terrestrialisation. VEGETATION COVER Large decrease in cover of mesophytic grasses such as Ischaemum fasciculatum and Bothriochloa insculpta; of Phragmites mauritianus and of the shrub Sesbania sesban due to terrestrialisation. SPECIES RICHNESS Moderate reduction in number of indigenous species as terrestrialisation and encroachment by species such as Paspalum dilatatum occurs. SPECIES COMPOSITION Moderate change in overall species composition as terrestrial species such as alien invader species such as Solanum sysimbrifolium and Acacia mearnsii (Wattle) invade. VEGETATION STRUCTURE Moderate change in structure due to reduction of Phragmites mauritianus and Sesbania sesban. Upper Riparian zone (Zones 0 and 4): Closed Woodland on firm colluvial slopes VEGETATION ABUNDANCE Moderate increase in biomass due to encroachment by alien invaders such as Lantana camara. VEGETATION COVER Moderate reduction in grass cover due to encroachment by alien invaders such as Lantana camara. SPECIES RICHNESS Moderate reduction in species richness due to encroachment by alien invaders such as Lantana camara. SPECIES COMPOSITION Moderate change in overall species composition as terrestrialisation sets in and ephemeral species such as Zinnia peruviana and alien species such as Lantana camara invade. VEGETATION STRUCTURE Small change in structure due to presence of Lantana camara in shrub layer.

AfriDev Consultants (Pty) Ltd 2005
DWAF Report No. RDM X100-01-CON-COMPR2-0604 Komati River Catchment Ecological Water Requirements Study – Quantity Report
Page C - 18
3.3 EWR SITE K3: TONGA 3.3.1 Reference Condition (Category A) Description of the reference condition is based on Acocks (1988), Afridev et al (1998) and the author’s working experience in Lowveld. There should be clear zoning of riparian vegetation as follows (Annex B, Figure 3; Annex C, Table 3): Marginal zone (Zones 6 and 7): Reedbed on banks of incised main channel The banks of the main channel would comprise intermittent clumps of trees (Kraussia floribunda, Syzygium species, Breonadia salicina) and reeds (Phragmites), with sedges (Cyperus species) and mesophytic grasses occupying the more open areas. The mesophytic herb Commelina benghalensis and fern Amelopteris prolifera would also be featured, but alien invader species such as Sorghum bicolor, Flaveria bidentis and Persicaria species would be absent. Lower Riparian zone (Zones 2,3,4,5): Shrubland / Relic reedbed on loose sand terraces Mesophytic trees and shrubs such as Ficus sycomorus, Ficus capreifolia, Phyllanthus reticulatus and Nuxia oppositifolia would occur in a mosaic of closed and open-canopy woodland. The vegetation structure would be maintained by regular seedling recruitment of such species. Phragmites mauritianus and Typha capensis would be dominant at margins of seasonal pools and secondary channels. Terrestrial species such as Gymnosporia senegalensis and Ziziphus mucronata should not be dominant. Likewise, alien invader species such as Senna didymobotrya, Sesbania punicea and Ricinus communis should not occur in this zone. Upper Riparian zone (Zones 1, 8 and 9): Open Woodland on firm colluvial slopes The colluvial hillslopes would support mostly ‘non-riparian’ tree species (eg. Diospyros mespiliformis, Trichilia emetica, Combretum imberbe, Acacia robusta and Spirostachys africana). The woodland structure would be maintained by regular seedling recruitment of such species. There would be a good ground cover of grasses such as Themeda triandra and Panicum maximum. There should be no alien invasive species such as Lantana camara and Sesbania bispinosa present. 3.3.2 Present Ecological State (PES) Based on suspected changes in vegetation attributes within three main vegetation zones compared to the reference condition, the PES model for riparian vegetation (Annex A, Model 3a) determined the condition of the site to be Category E (seriously modified). The geomorphologist’s assessment of time-lapsed aerial photos of the site and her field observations were also taken into account, namely loss of woody vegetation from the river

AfriDev Consultants (Pty) Ltd 2005
DWAF Report No. RDM X100-01-CON-COMPR2-0604 Komati River Catchment Ecological Water Requirements Study – Quantity Report
Page C - 19
banks, but an increase on the floodplain. Vegetation of banks and channel margins is patchy, giving moderate protection against erosion. Suspected vegetation changes from the reference condition (Category A) are described as follows (cf. Annex A, Model 3a; Annex B, Figure 3; Annex C, Table 3): Marginal zone (Zones 6 and 7): Reedbed on banks of incised main channel VEGETATION ABUNDANCE Large decrease in biomass of Phragmites mauritianus reeds due to harvesting and/or unsuitable substrate; and demise of large Syzygium cf. guineense trees due to inundation from Nel weir back-up. VEGETATION COVER Large decrease in cover of Phragmites mauritianus reeds and of large Syzygium cf. guineense trees. Increased cover of hydrophytic annual grass Sorghum bicolor not accounted for. SPECIES RICHNESS Moderate reduction in number of indigenous species of grasses and sedges as a result of competition from Sorghum bicolor. SPECIES COMPOSITION Moderate change in overall species composition, for example the presence of the exotic species Flaveria bidentis. VEGETATION STRUCTURE Moderate change in structure due to loss of Syzygium cf. guineense trees and Phragmites mauritianus reeds. Lower Riparian zone (Zones 2,3,4,5): Shrubland / Relic reedbed on loose sand terraces VEGETATION ABUNDANCE Large decrease in biomass of Phragmites mauritianus reeds and some tree species as a result of terrestrialisation and cultivation. VEGETATION COVER Large decrease in cover of Phragmites mauritianus reeds and some tree species as a result of terrestrialisation and cultivation. SPECIES RICHNESS Large reduction in number of indigenous species as terrestrialisation and encroachment by species such as Riccinus communis, Senna bicapsularis, Senna occidentalis, Sesbania punicea, Solanum sisymbrifolium, Tithonia diversifolia and Xanthium strumarium occurs. SPECIES COMPOSITION
AfriDev Consultants (Pty) Ltd 2005
DWAF Report No. RDM X100-01-CON-COMPR2-0604 Komati River Catchment Ecological Water Requirements Study – Quantity Report
Page C - 20
Serious change in overall species composition as alien invader species such as Riccinus communis, Senna bicapsularis, Senna occidentalis, Sesbania punicea, Solanum sisymbrifolium, Tithonia diversifolia and Xanthium strumarium invade. VEGETATION STRUCTURE Serious change in structure due to thinning of Phragmites mauritianus reeds and encroachment by alien invader species such as Riccinus communis, Senna bicapsularis, Senna occidentalis, Sesbania punicea, Solanum sisymbrifolium, Tithonia diversifolia and Xanthium strumarium. Upper Riparian zone (Zones 1, 8 and 9): Open Woodland on firm colluvial slopes VEGETATION ABUNDANCE Large reduction in biomass due to deforestation of tree species such as Combretum imberbe, Diospyros mespiliformis and Trichilia emetica for construction and firewood. VEGETATION COVER Large reduction in cover due to deforestation of tree species such as Combretum imberbe, Diospyros mespiliformis and Trichilia emetica for construction and firewood. SPECIES RICHNESS Large reduction in number of indigenous species due to deforestation. SPECIES COMPOSITION Large change in overall species composition due to deforestation and invasion by alien species such as Lantana camara, Flaveria bidentis and Sesbania bispinosa. VEGETATION STRUCTURE Serious change in structure due to deforestation. 3.3.3 Causes Of Degradation Flow-related causes: • Attenuation of floods caused by upstream dams and weirs resulting in incision of main
channel and dessication of original channels with accompanying terrestrialization and alien-plant invasion, especially by Senna species, Sesbania species and Xanthium strumarium.
• Reduced low-flows caused by abstraction by upstream settlements (Tonga) resulting in terrestrialization and alien-plant invasion.
Non-flow-related causes: • Upstream erosion from overgrazing and agriculture resulting in sedimentation,
terrestrialisation and alien-plant invasion. • Deforestation of tree species such as Combretum imberbe, Diospyros mespiliformis and
Trichilia emetica in upper riparian zone for construction and firewood.

AfriDev Consultants (Pty) Ltd 2005
DWAF Report No. RDM X100-01-CON-COMPR2-0604 Komati River Catchment Ecological Water Requirements Study – Quantity Report
Page C - 21
3.3.4 Trend Considering that current management of releases from upstream impoundments is not likely to change, and considering that it would be difficult to control deforestation and cultivation in the riparian zone, the Trend is considered to be negative. The following predictions regarding Present Ecological State in the short and long terms can be made: Short term (<5 years) Long term (>20 years) Negative E F 3.3.5 PES up to Category D (Largely Modified) Suspected vegetation changes from the reference condition (Category A) are described as follows (cf. Annex A, Model 3b; Annex B, Figure 3; Annex C, Table 3): Marginal zone (Zones 6 and 7): Reedbed on banks of incised main channel VEGETATION ABUNDANCE Moderate decrease in biomass of Phragmites mauritianus reeds due to harvesting and/or unsuitable substrate; and demise of large Syzygium cf. guineense trees due to inundation from Nel weir back-up. VEGETATION COVER Moderate decrease in cover of Phragmites mauritianus reeds and of large Syzygium cf. guineense trees. Increased cover of hydrophytic annual grass Sorghum bicolor not accounted for. SPECIES RICHNESS Small reduction in number of indigenous species of grasses and sedges as a result of competition from Sorghum bicolor. SPECIES COMPOSITION Small change in overall species composition, for example the presence of the exotic species Flaveria bidentis. VEGETATION STRUCTURE Small change in structure due to loss of Syzygium cf. guineense trees and Phragmites mauritianus reeds. Lower Riparian zone (Zones 2,3,4,5): Shrubland / Relic reedbed on loose sand terraces VEGETATION ABUNDANCE

AfriDev Consultants (Pty) Ltd 2005
DWAF Report No. RDM X100-01-CON-COMPR2-0604 Komati River Catchment Ecological Water Requirements Study – Quantity Report
Page C - 22
Moderate decrease in biomass of Phragmites mauritianus reeds and some tree species as a result of terrestrialisation and cultivation. VEGETATION COVER Moderate decrease in cover of Phragmites mauritianus reeds and some tree species as a result of terrestrialisation and cultivation. SPECIES RICHNESS Moderate reduction in number of indigenous species as terrestrialisation and encroachment by species such as Riccinus communis, Senna bicapsularis, Senna occidentalis, Sesbania punicea, Solanum sisymbrifolium, Tithonia diversifolia and Xanthium strumarium occurs. SPECIES COMPOSITION Large change in overall species composition as alien invader species such as Riccinus communis, Senna bicapsularis, Senna occidentalis, Sesbania punicea, Solanum sisymbrifolium, Tithonia diversifolia and Xanthium strumarium invade. VEGETATION STRUCTURE Large change in structure due to thinning of Phragmites mauritianus reeds and encroachment by alien invader species such as Riccinus communis, Senna bicapsularis, Senna occidentalis, Sesbania punicea, Solanum sisymbrifolium, Tithonia diversifolia and Xanthium strumarium. Upper Riparian zone (Zones 1, 8 and 9): Open Woodland on firm colluvial slopes VEGETATION ABUNDANCE Moderate reduction in biomass due to deforestation of tree species such as Combretum imberbe, Diospyros mespiliformis and Trichilia emetica for construction and firewood. VEGETATION COVER Moderate reduction in cover due to deforestation of tree species such as Combretum imberbe, Diospyros mespiliformis and Trichilia emetica for construction and firewood. SPECIES RICHNESS Moderate reduction in number of indigenous species due to deforestation. SPECIES COMPOSITION Moderate change in overall species composition due to deforestation and invasion by alien species such as Lantana camara, Flaveria bidentis and Sesbania bispinosa. VEGETATION STRUCTURE Large change in structure due to deforestation. 3.4 EWR SITE G1: VAALKOP

AfriDev Consultants (Pty) Ltd 2005
DWAF Report No. RDM X100-01-CON-COMPR2-0604 Komati River Catchment Ecological Water Requirements Study – Quantity Report
Page C - 23
3.4.1 Reference Condition (Category A) Description of the reference condition is based on Acocks (1988); Ecorex (2001); and the author’s working experience in Piet Retief Sourveld. There should be clear zoning of riparian vegetation as follows (Annex B, Figure 4; Annex C, Table 4): Marginal zone (Zones 2, 3, 5): Sedgy Grassland on stream banks The relatively steep-sloping annual flood benches comprising silty sand on clay (Zones 2 and 3) are more mesic and expansive than the perched lateral channel comprising silty sand (Zone 5). Being only seasonally inundated, Zone 5 would be dominated by mesophytic grass species such as Imperata cylindrical in dry phases, and by less persistent mesophytes such as Typha capensis and Periscaria attenuata in wet phases. Zones 2 and 3 would support sedges such as Schoenoplectus brachyceras as clumps with up to 25% cover in loose silty sand / mud at water’s edge where mesophytic shrubs such as Cliffortia species would also occur. Mesophytic grasses such as Leersia hexandra and Panicum hymeniochilum should form a continuous sward (>75% cover) on the annual flood bench (between the water’s edge and the upper limit of the marginal zone). The upper limit of the marginal zone should be colonized by numerous tree ferns (Cyathea dregei), and by scattered mesophytic forbs such as Senecio inaequidens. Naturalised exotic species such as the Increaser II grass Paspalum dilatatum and the mesophytic forb Verbena bonariensis should not be present. Lower Riparian zone (Zone 1): Open Woodland on firm alluvial plain Large mesophytic tree species such as Combretum erythrophyllum with a cover of up to 25% should occur on this alluvial floodplain comprising slightly clayey, silty sand with scattered boulders. Smaller trees and shrubs such as Dais cotinifolia and Buddleja salviifolia should also be represented. The woodland structure would be maintained by regular seedling recruitment of such species. The grass layer should be dominated by species such as Cynodon dactylon with good cover. Clumps of mesophytic shrubs such as Leucosidea sericea and scattered suffrutices such as Asclepias physocarpa should also be represented on the floodplain. Typically terrestrial species such as Diospyros lycioides and Plectranthus sp. should not occur here, and neither should naturalised exotic species such as the Increaser II grass Paspalum dilatatum. Alien invasive tree species such as Acacia mearnsii (Wattle) and Solanum mauritianum (Bugweed) should definitely not be represented. Upper Riparian zone (Zones 0, 4): Gallery forest on hillslope // Scrub forest on firm alluvial terrace The steep-sloping high colluvial terrace comprising slightly clayey, silty sand with occasional fine gravels (Zone 0) is more xeric and spacious than the intermediate alluvial terrace comprising slightly clayey, silty sand (Zone 4). Whereas Zone 0 could be expected to host gallery forest, Zone 4 would support a more scrubby type of riparian forest. Typical large tree species (>5m tall) common to both zones would be Rhus species, whilst typical understorey shrubs would include Euclea crispa and Diospyros lycioides. In the herb layer grasses such as Setaria megaphylla, ferns such as Cheilanthes viridis, and suffrutices such as Rumex sagittatus
AfriDev Consultants (Pty) Ltd 2005
DWAF Report No. RDM X100-01-CON-COMPR2-0604 Komati River Catchment Ecological Water Requirements Study – Quantity Report
Page C - 24
would be typical. Typical large tree species (up to 5m tall) expected to dominate the more mesic “Zone 4” scrub forest would be Halleria lucida, Dais cotinifolia, Maesa lanceolata and Ficus sur. Smaller shrubs would include Leucosidea sericea, Buddleja salviifolia, and Rhamnus prinoides. Dominant species in the more xeric “Zone 0” gallery forest would be Celtis africana, Pittosporum viridiflorum, Apodytes dimidiata, Acacia ataxacantha, Cussonia spicata and Scolopia mundii, accompanied by understorey shrubs such as Diospyros whyteana, Plectranthus fruticosus and climbers such as Senecio tamoides. There should be no alien invasive species such as Acacia mearnsii (Wattle), Solanum mauritianum (Bugweed), Rubus sp. (Bramble) or Passiflora edulis (Granadilla) present. 3.4.2 Present Ecological State (PES) Based on suspected changes in vegetation attributes within three main vegetation zones compared to the reference condition, the PES model for riparian vegetation (Annex A, Model 4a) determined the condition of the site to be Category D (largely modified). The geomorphologist’s assessment of time-lapsed aerial photos of the site and her field observations were also taken into account, namely progressive invasion of valley floor by Acacia mearnsii (Black Wattle) since 1939, resulting in bank steepening and erosion in places. Suspected vegetation changes from the reference condition (Category A) are described as follows (cf. Annex A, Model 4a; Annex B, Figure 4; Annex C, Table 4): Marginal zone (Zones 2, 3, 5): Sedgy Grassland on stream banks VEGETATION ABUNDANCE Small reduction in biomass of Typha capensis reeds (Zone 5) and of marginal sedges and tree ferns (Cyathea dregei) in Zones 2 and 3, probably as a result of channel incision. VEGETATION COVER Small reduction in cover of mesophytic grasses such as Paspalum dilatatum, probably as a result of channel incision. SPECIES RICHNESS Moderate reduction in number of indigenous species of grasses and sedges, and of shrubs such as Cliffortia species, probably as a result of channel incision. . SPECIES COMPOSITION Moderate change in overall species composition, for example the presence of the naturalized exotic grass Paspalum dilatatum. VEGETATION STRUCTURE Small reduction in structure due to fewer tree ferns and shrubs in Zones 2 and 3, probably as a result of channel incision. Lower Riparian zone (Zone 1): Open Woodland on firm alluvial plain
AfriDev Consultants (Pty) Ltd 2005
DWAF Report No. RDM X100-01-CON-COMPR2-0604 Komati River Catchment Ecological Water Requirements Study – Quantity Report
Page C - 25
VEGETATION ABUNDANCE Large reduction in biomass as a result of losing trees and shrubs such as Combretum erythrophyllum, Buddleja salviifolia, and Leucosidea sericea (presumably because of past invasion by alien species such as Acacia mearnsii (Wattle) and Solanum mauritianum (Bugweed). VEGETATION COVER Large reduction in cover of grasses such as Cynodon dactylon due to shading by alien invaders such as Acacia mearnsii (Wattle) and Solanum mauritianum (Bugweed). SPECIES RICHNESS Serious reduction in number of indigenous species such as Combretum erythrophyllum, Dais cotinifolia, Leucosidea sericea and other mesophytic shrubs and forbs as a result of terrestrialisation and past invasion by alien species such as Acacia mearnsii (Wattle) and Solanum mauritianum (Bugweed). SPECIES COMPOSITION Serious change in overall species composition since terrestrial species such as Diospyros lycioides and alien invader species such as Acacia mearnsii (Wattle) invaded the zone. VEGETATION STRUCTURE Serious reduction in structure due to replacement of woody riparian species such as Combretum erythrophyllum, Dias cotinifolia and Leucosodea sericea with terrestrial and invader species such as Diospyros lycioides and Acacia mearnsii (Wattle). Upper Riparian zone (Zones 0, 4): Gallery forest on hillslope // Scrub forest on firm alluvial terrace VEGETATION ABUNDANCE Moderate increase in biomass as a result of invasion of understorey by Acacia mearnsii (Wattle), Passiflora edulis (Granadilla), Solanum mauritianum (Bugweed) and Rubus sp. VEGETATION COVER Moderate reduction in herbaceous cover as a result of invasion by Acacia mearnsii (Wattle), Passiflora edulis (Granadilla), Solanum mauritianum (Bugweed) and Rubus sp. SPECIES RICHNESS Large reduction in number of indigenous forest species such as Dais cotinifolia, Maesa lanceolata, Ficus sur, Leucosidea sericea, Rhamnus prinoides (Zone 4) and Pittosporum viridiflorum, Apodytes dimidiata, Cussonia spicata, Scolopia mundii (Zone 0). SPECIES COMPOSITION Large change in overall species composition as a result of invasion by Acacia mearnsii (Wattle), Passiflora edulis (Granadilla), Solanum mauritianum (Bugweed) and Rubus sp. VEGETATION STRUCTURE

AfriDev Consultants (Pty) Ltd 2005
DWAF Report No. RDM X100-01-CON-COMPR2-0604 Komati River Catchment Ecological Water Requirements Study – Quantity Report
Page C - 26
Moderate change due to alien-plant invasion but recruitment of large canopy species such as Diospyros mespiliformis, Celtis africana and Rhus chirindensis in Zone 0 still evident. 3.4.3 Causes Of Degradation Flow-related causes: • Attenuation of intra-annual floods caused by upstream trout dams and resulting in channel
incision, terrestrialization and alien-plant invasion. • Streamflow reduction caused by forestry plantations and resulting in terrestrialization and
alien-plant invasion. Non-flow-related causes: • Upstream forestry and mining activities, particularly gravel-road river crossings, resulting in
increased sedimentation • Disturbance from forestry activities (logging, burning and grazing) resulting in alien-plant
invasion, especially by Solanum mauritianum (Bugweed) and Acacia mearnsii (Wattle) 3.4.4 Trend Depending on management of alien plant invasions, the trajectory could be either stable or degrading. Despite the recent clearing of Wattle in the Lower Riparian zone, recruitment is still taking place, and if alien plant invasions are left unchecked, the current condition of the riparian vegetation is likely to decline, in which case the Trend would be degrading. Conversely, if alien invasions are consistently managed, the Trend could become stable. Assuming current conditions, the following predictions regarding Present Ecological State in the short and long terms can be made: Short term (<5 years) Long term (>20 years) Degrading / Stable D D/E 3.4.5 PES up to Category C (Moderately Modified) Suspected vegetation changes from the reference condition (Category A) are described as follows (cf. Annex A, Model 4b; Annex B, Figure 4; Annex C, Table 4): Marginal zone (Zones 2, 3, 5): Sedgy Grassland on stream banks VEGETATION ABUNDANCE No significant change. VEGETATION COVER No significant change. SPECIES RICHNESS

AfriDev Consultants (Pty) Ltd 2005
DWAF Report No. RDM X100-01-CON-COMPR2-0604 Komati River Catchment Ecological Water Requirements Study – Quantity Report
Page C - 27
Small reduction in number of indigenous species of grasses and sedges, probably as a result of channel incision. SPECIES COMPOSITION Small change in overall species composition, for example the presence of the naturalized exotic grass Paspalum dilatatum. VEGETATION STRUCTURE Small reduction in structure due to fewer tree ferns and shrubs in Zones 2 and 3, probably as a result of channel incision. Lower Riparian zone (Zone 1): Open Woodland on firm alluvial plain VEGETATION ABUNDANCE Moderate reduction in biomass as a result of losing shrubs such as Buddleja salviifolia, and Leucosidea sericea, presumably because of past invasion by alien species such as Acacia mearnsii (Wattle) and Solanum mauritianum (Bugweed). VEGETATION COVER Moderate reduction in cover of grasses such as Cynodon dactylon due to shading by alien invaders such as Acacia mearnsii (Wattle) and Solanum mauritianum (Bugweed). SPECIES RICHNESS Moderate reduction in number of indigenous species such as Dais cotinifolia, Leucosidea sericea and other mesophytic shrubs and forbs as a result of terrestrialisation and past invasion by alien species such as Acacia mearnsii (Wattle) and Solanum mauritianum (Bugweed). SPECIES COMPOSITION Moderate change in overall species composition since terrestrial species such as Diospyros lycioides and alien invader species such as Acacia mearnsii (Wattle) invaded the zone. VEGETATION STRUCTURE Moderate reduction in structure due to replacement of woody riparian species such as Dias cotinifolia and Leucosodea sericea with terrestrial and invader species such as Diospyros lycioides and Acacia mearnsii (Wattle). Upper Riparian zone (Zones 0, 4): Gallery forest on hillslope // Scrub forest on firm alluvial terrace VEGETATION ABUNDANCE Small increase in biomass as a result of invasion of understorey by Acacia mearnsii (Wattle), Passiflora edulis (Granadilla), Solanum mauritianum (Bugweed) and Rubus sp. VEGETATION COVER Small reduction in herbaceous cover as a result of invasion by Acacia mearnsii (Wattle), Passiflora edulis (Granadilla), Solanum mauritianum (Bugweed) and Rubus sp.

AfriDev Consultants (Pty) Ltd 2005
DWAF Report No. RDM X100-01-CON-COMPR2-0604 Komati River Catchment Ecological Water Requirements Study – Quantity Report
Page C - 28
SPECIES RICHNESS Moderate reduction in number of indigenous forest species such as Dais cotinifolia, Leucosidea sericea, Rhamnus prinoides (Zone 4) and Apodytes dimidiata, Scolopia mundii (Zone 0). SPECIES COMPOSITION Moderate change in overall species composition as a result of invasion by Acacia mearnsii (Wattle), Passiflora edulis (Granadilla), Solanum mauritianum (Bugweed) and Rubus sp. VEGETATION STRUCTURE Small change due to alien-plant invasion but recruitment of large canopy species such as Diospyros mespiliformis, Celtis africana and Rhus chirindensis in Zone 0 still prolific. 3.5 EWR SITE T1: TEESPRUIT 3.5.1 Reference Condition (Category A) Description of the reference condition is based on Acocks (1988) and the author’s working experience in Piet Retief Sourveld. There should be clear zoning of riparian vegetation as follows (Annex B, Figure 5; Annex C, Table 5): Marginal zone (Zones 2 and 4): Reedbed on sandy floodplain and banks Annual floodplains comprising loose sand with boulders would be dominated by mesophytic trees and shrubs such as Combretum erythrophyllum, Salix mucronata and Sesbania sesban in an open canopy (Zone 2). Grass species such as Cynodon dactylon, Ischaemum fasciculatum and Panicum maximum would dominate the field layer. Clumps of Phragmites reeds and scattered sedges such as Pycreus polystachyos and Kyllinga melanosperma would occur at water’s edge. Less frequently inundated lateral channels would also host the large-tufted grass species Miscantheus junceus (Zone 4). Other noteworthy plants in Zone 4 would include the medicinal tree species Catha edulis. Naturalised exotic species such as Ageratum houstianum and alien invader species such as Sesbania punicea and Senna occidentalis should not be present. Lower Riparian zone (Zones 1 and 3): Woodland on loose sand terraces On firm alluvial terraces, the woodland would be open, with mesophytic grasses such as Bothriochloa insculpta dominating the field layer and trees such as Combretum erythrophyllum dominating the tree layer (Zone 1). On loose sands, tree cover of species such as Combretum erythrophyllum, Morella serrata and Catha edulis would be denser, and Panicum maximum would be one of the dominant grasses (Zone 3). The woodland structure would be maintained by regular seedling recruitment of such species. Other noteworthy plants in Zone 4 would include the medicinal geophyte Dietes iridioides. Terrestrial species such as Diospyros

AfriDev Consultants (Pty) Ltd 2005
DWAF Report No. RDM X100-01-CON-COMPR2-0604 Komati River Catchment Ecological Water Requirements Study – Quantity Report
Page C - 29
lycioides should not be present. Likewise, alien invader species such as Acacia mearnsii (Wattle) and Melia azederach (Syringa) should not occur in this zone. Upper Riparian zone (Zones 0 and 5): Open Woodland on firm alluvial terraces and colluvial slopes The colluvial hillslopes would support mostly non-riparian tree species (eg. Pavetta edentula and Aloe marlothii) in an open woodland structure (Zone 0). The alluvial terrace would support mostly ‘non-riparian trees’ (eg. Acacia robusta, Celtis africana), with a field layer of grasses such as Themeda triandra and Panicum maximum). There should be no alien invasive species such as Lantana camara, Melia axedarach, Solanum mauritianum and Acacia mearnsii present. 3.5.2 Present Ecological State (PES) Based on suspected changes in vegetation attributes within three main vegetation zones compared to the reference condition, the PES model for riparian vegetation (Annex A, Model 5a) determined the condition of the site to be Category C (moderately modified). The geomorphologist’s assessment of time-lapsed aerial photos of the site and her field observations were also taken into account, namely no evidence of deforestation or encroachment. Good vegetation cover on banks provides a high level of protection against erosion. Suspected vegetation changes from the reference condition (Category A) are described as follows (cf. Annex A, Model 5a; Annex B, Figure 5; Annex C, Table 5): Marginal zone (Zones 2 and 4): Reedbed on sandy floodplain and banks VEGETATION ABUNDANCE Small decrease in biomass of trees such as Combretum erythrophyllum and Phragmites reeds as a result of reduced low flows and poor recruitment. VEGETATION COVER Small decrease in cover of trees such as Ficus sur and Phragmites reeds as a result of reduced low flows and poor recruitment. SPECIES RICHNESS Moderate decrease in number of indigenous species SPECIES COMPOSITION Moderate change in overall species composition as a result of invasion by species such as Senna occidentalis and Sesbania punicea. VEGETATION STRUCTURE Small change in structure due to invasion by species such as Senna occidentalis and Sesbania punicea, and poor recruitment of trees such as Ficus sur Lower Riparian zone (Zones 1 and 3): Woodland on loose sand terraces

AfriDev Consultants (Pty) Ltd 2005
DWAF Report No. RDM X100-01-CON-COMPR2-0604 Komati River Catchment Ecological Water Requirements Study – Quantity Report
Page C - 30
VEGETATION ABUNDANCE Small decrease in biomass VEGETATION COVER Small decrease in cover SPECIES RICHNESS Moderate decrease in number of indigenous species due to invasion by alien tree species such as Acacia mearnsii and Melia azederach SPECIES COMPOSITION Moderate change in overall species composition due to invasion by alien tree species such as Acacia mearnsii and Melia azederach VEGETATION STRUCTURE Small change in structure due to poor recruitment of species such as Cliffortia strobulifera and Morella serrata Upper Riparian zone (Zones 0 and 5): Open Woodland on firm alluvial terraces and colluvial slopes VEGETATION ABUNDANCE Small reduction in biomass due to deforestation on firm alluvial terraces (Zone 5) VEGETATION COVER Small reduction in cover due to deforestation on firm alluvial terraces (Zone 5) SPECIES RICHNESS Small reduction in number of indigenous species due to deforestation on firm alluvial terraces (Zone 5) SPECIES COMPOSITION Small change in overall species composition due to deforestation and invasion of alien species on firm alluvial terraces (Zone 5) VEGETATION STRUCTURE Small change in structure due to poor recruitment of indigenous species on firm alluvial terraces (Zone 5) 3.5.3 Causes Of Degradation Flow-related causes: • Reduced low-flows from upstream abstractions
AfriDev Consultants (Pty) Ltd 2005
DWAF Report No. RDM X100-01-CON-COMPR2-0604 Komati River Catchment Ecological Water Requirements Study – Quantity Report
Page C - 31
Non-flow-related causes: • Erosion from upstream grazing, agriculture and mining 3.5.4 Trend Under current conditions the Trend is considered to be stable. The following predictions regarding Present Ecological State in the short and long terms can be made: Short term (<5 years) Long term (>20 years) Stable C C 3.5.5 PES up to Category B (Largely Natural) Suspected vegetation changes from the reference condition (Category A) are described as follows (cf. Annex A, Model 5b; Annex B, Figure 5; Annex C, Table 5): Marginal zone (Zones 2 and 4): Reedbed on sandy floodplain and banks VEGETATION ABUNDANCE Small decrease in biomass of trees such as Combretum erythrophyllum and Phragmites reeds as a result of reduced low flows and poor recruitment. VEGETATION COVER Small decrease in cover of trees such as Ficus sur and Phragmites reeds as a result of reduced low flows and poor recruitment. SPECIES RICHNESS Small decrease in number of indigenous species SPECIES COMPOSITION Small change in overall species composition as a result of invasion by species such as Senna occidentalis and Sesbania punicea. VEGETATION STRUCTURE Small change in structure due to invasion by species such as Senna occidentalis and Sesbania punicea, and poor recruitment of trees such as Ficus sur Lower Riparian zone (Zones 1 and 3): Woodland on loose sand terraces VEGETATION ABUNDANCE No significant change in biomass

AfriDev Consultants (Pty) Ltd 2005
DWAF Report No. RDM X100-01-CON-COMPR2-0604 Komati River Catchment Ecological Water Requirements Study – Quantity Report
Page C - 32
VEGETATION COVER No significant change in cover SPECIES RICHNESS Small decrease in number of indigenous species due to invasion by alien tree species such as Acacia mearnsii and Melia azederach SPECIES COMPOSITION Small change in overall species composition due to invasion by alien tree species such as Acacia mearnsii and Melia azederach VEGETATION STRUCTURE Small change in structure due to poor recruitment of species such as Cliffortia strobulifera and Morella serrata Upper Riparian zone (Zones 0 and 5): Open Woodland on firm alluvial terraces and colluvial slopes VEGETATION ABUNDANCE No significant change in biomass VEGETATION COVER No significant change in cover SPECIES RICHNESS Small reduction in number of indigenous species due to deforestation on firm alluvial terraces (Zone 5) SPECIES COMPOSITION Small change in overall species composition due to deforestation and invasion of alien species on firm alluvial terraces (Zone 5) VEGETATION STRUCTURE Small change in structure due to poor recruitment of indigenous species on firm alluvial terraces (Zone 5) 3.5.6 PES down to Category D (Largely Modified) Suspected vegetation changes from the reference condition (Category A) are described as follows (cf. Annex A, Model 5c; Annex B, Figure 5; Annex C, Table 5): Marginal zone (Zones 2 and 4): Reedbed on sandy floodplain and banks VEGETATION ABUNDANCE Moderate decrease in biomass of trees such as Combretum erythrophyllum and Phragmites reeds as a result of reduced low flows and poor recruitment.

AfriDev Consultants (Pty) Ltd 2005
DWAF Report No. RDM X100-01-CON-COMPR2-0604 Komati River Catchment Ecological Water Requirements Study – Quantity Report
Page C - 33
VEGETATION COVER Moderate decrease in cover of trees such as Ficus sur and Phragmites reeds as a result of reduced low flows and poor recruitment. SPECIES RICHNESS Moderate decrease in number of indigenous species SPECIES COMPOSITION Moderate change in overall species composition as a result of invasion by species such as Senna occidentalis and Sesbania punicea. VEGETATION STRUCTURE Moderate change in structure due to invasion by species such as Senna occidentalis and Sesbania punicea, and poor recruitment of trees such as Ficus sur Lower Riparian zone (Zones 1 and 3): Woodland on loose sand terraces VEGETATION ABUNDANCE Moderate reduction in biomass VEGETATION COVER Moderate reduction in cover SPECIES RICHNESS Large decrease in number of indigenous species due to invasion by alien tree species such as Acacia mearnsii and Melia azederach SPECIES COMPOSITION Large change in overall species composition due to invasion by alien tree species such as Acacia mearnsii and Melia azederach VEGETATION STRUCTURE Moderate change in structure due to poor recruitment of species such as Cliffortia strobulifera and Morella serrata Upper Riparian zone (Zones 0 and 5): Open Woodland on firm alluvial terraces and colluvial slopes VEGETATION ABUNDANCE Small reduction in biomass due to deforestation on firm alluvial terraces (Zone 5) VEGETATION COVER Small reduction in cover due to deforestation on firm alluvial terraces (Zone 5) SPECIES RICHNESS

AfriDev Consultants (Pty) Ltd 2005
DWAF Report No. RDM X100-01-CON-COMPR2-0604 Komati River Catchment Ecological Water Requirements Study – Quantity Report
Page C - 34
Moderate reduction in number of indigenous species due to deforestation on firm alluvial terraces (Zone 5) SPECIES COMPOSITION Moderate change in overall species composition due to deforestation and invasion of alien species on firm alluvial terraces (Zone 5) VEGETATION STRUCTURE Small change in structure due to poor recruitment of indigenous species on firm alluvial terraces (Zone 5) 3.6 EWR SITE M1: SILINGANI 3.6.1 Reference Condition (Category A) Description of the reference condition is based on Acocks (1988), Afridev et al (1998) and the author’s working experience in Lowveld Sour Bushveld. There should be clear zoning of riparian vegetation as follows (Annex B, no figure6; Annex C, Table 6): Marginal zone (Zones 3 and 4): Woodland \ Reedbed on stream banks and grassland on annual flood bench An annual flood bench comprising a cobble bar would be dominated by mesophytic grasses and sedges (Zone 4). The mesophytic forbs, Ludwigia octovalvis and Asclepias physocarpa would also be featured, but alien invader species such as Sesbania punicea and Senna didymobotrya would be absent. The banks of the main channel and lateral channels (Zone 3) would be dominated by clumps of the reed Phragmites mauritianus, interspersed with trees such as Breonadia salicina, Olea woodiana, Nuxia oppositifolia and of sedges such as Cyperus marginatus. Alien-invader species such as Lantana camara, Chromolaena odorata and Senna didymobotrya should not be present. Lower Riparian zone (Zones 2, 5 and 6): Open / Closed Woodland on firm alluvial banks and islands Mesophytic trees and shrubs such as Combretum erythrophyllum, Sesbania sesban, Ficus sur, Syzygium guineense, Bridelia micrantha, Celtis africana, Ficus capreifolia and Phyllanthus reticulatus would occur in a mosaic of closed and open-canopy woodland. Terrestrial pioneer species such as Gymnosporia senegalensis and Trema orientalis should not be dominant. Likewise, alien invader species such as Melia azederach, Solanum mauritianum, Lantana camara, Chromolaena odorata and Caeselpinia bispinosa should not occur in this zone.
6 Data is not as comprehensive as for other sites because it is derived mainly from RVI methodology and vegetation was not surveyed onto the river profile

AfriDev Consultants (Pty) Ltd 2005
DWAF Report No. RDM X100-01-CON-COMPR2-0604 Komati River Catchment Ecological Water Requirements Study – Quantity Report
Page C - 35
Upper Riparian zone (Zones 1 and 7): Open / Closed Woodland on firm colluvial slopes The colluvial hillslopes would support mostly non-riparian tree species (eg. Dombeya rotundifolia, Erythrina lysistemon, Acacia karoo, Albizia versicolor, Terminalia sericea and Heteropyxis natalensis.) The woodland structure would be maintained by regular seedling recruitment of such species. There would be a good ground cover of grasses such as Themeda triandra, Panicum maximum and Cymbopogon validus. There should be no alien invasive species such as Lantana camara, Chromolaena odorata and Solanum mauritianum present. 3.6.2 Present Ecological State (PES) Based on suspected changes in vegetation attributes within three main vegetation zones compared to the reference condition, the PES model for riparian vegetation (Annex A, Model 6a) determined the condition of the site to be Category D (largely modified). The geomorphologist’s field observations of the site were also taken into account, namely a small reduction in event hydrology and a depletion of sediment due to upstream storage dams. Suspected vegetation changes from the reference condition (Category A) are described as follows (cf. Annex A, Model 6a; Annex B, no figure6; Annex C, Table 6): Marginal zone (Zones 3 and 4): Woodland / Reedbed on stream banks and grassland on annual flood bench VEGETATION ABUNDANCE Moderate decrease in biomass of tree species such as Breonadia salicina (Zone 3). VEGETATION COVER Small decrease in cover of Phragmites mauritianus reeds and of mesophytic grasses and sedges (Zone 3) and of sedges such as Cyperus marginatus. SPECIES RICHNESS Moderate reduction in number of indigenous species of trees, shrubs, grasses and sedges. SPECIES COMPOSITION Large change in overall species composition, for example the presence of alien-invader species such as Sesbania punicea, Senna didymobotrya and Chromolaena odorata. VEGETATION STRUCTURE Large change in structure due to poor recruitment of large riparian tree species such as Breonadia salicina. Lower Riparian zone (Zones 2, 5 and 6): Open / Closed Woodland on firm alluvial banks and islands VEGETATION ABUNDANCE Moderate increase in biomass as a result of encroachment by alien invader tree species such as Melia azedarach.
AfriDev Consultants (Pty) Ltd 2005
DWAF Report No. RDM X100-01-CON-COMPR2-0604 Komati River Catchment Ecological Water Requirements Study – Quantity Report
Page C - 36
VEGETATION COVER Moderate increase in cover of trees and shrubs due to contribution by alien-invader species such as Lantana camara, Chromalaena odorata and terrestrial species such as Gymnosporia senegalensis. SPECIES RICHNESS Large reduction in number of indigenous species as terrestrialisation and encroachment by alien-invader species such as Melia azedarach, Chromalaena odorata and Lantana camara occurs. SPECIES COMPOSITION Serious change in overall species composition as alien-invader species such as Melia azedarach, Chromalaena odorata, Lantana camara, Solanum mauritianum and Senna didymobotrya invade. VEGETATION STRUCTURE Moderate change in structure due to poor recruitment of tree species such as Celtis africana , Ficus sycomorus, Combretum erythrophyllum and Syzygium cordatum. Upper Riparian zone (Zones 1 and 7): Open / Closed Woodland on firm colluvial slopes VEGETATION ABUNDANCE Large decrease in biomass due to deforestation of indigenous tree species such as Diospyros mespiliiformis, Terminalia sericea, Dombeya rotundifolia and Acacia species. VEGETATION COVER Large decrease in cover due to deforestation of indigenous tree species such as Diospyros mespiliiformis, and overgrazing of grass layer. . SPECIES RICHNESS Moderate decrease in species richness due to deforestation of indigenous trees. SPECIES COMPOSITION Moderate change in overall species composition as deforestation takes place and alien-invader species such as Lantana camara and Chromalaena odorata invade. VEGETATION STRUCTURE Large change in structure due to deforestation and poor recruitment of tree species such as Albizia versicolor and Acacia species. 3.6.3 Causes Of Degradation Flow-related causes:

AfriDev Consultants (Pty) Ltd 2005
DWAF Report No. RDM X100-01-CON-COMPR2-0604 Komati River Catchment Ecological Water Requirements Study – Quantity Report
Page C - 37
• Attenuation of intra-annual floods caused by upstream Maguga dam resulting in terrestrialization and alien-plant invasion.
Non-flow-related causes: • Disturbance of riparian zone due to deforestation, cattle grazing and trampling. 3.6.4 Trend Considering that the effects of flood attenuation and sediment depletion from Maguga Dam have not yet been fully realised, and that riparian zone disturbances will continue, it is likely that the Trend will be negative. Besides the existing fore-mentioned effects, other effects that are likely to develop are bed armouring, channel incisement, erosion of cobble bars, bank stabilisation, reduced species diversity, and poor recruitment levels of indigenous trees. The following predictions regarding Present Ecological State in the short and long terms can be made: Short term (<5 years) Long term (>20 years) Negative D E 3.6.5 PES up to Category C (Moderately Modified) Suspected vegetation changes from the reference condition (Category A) are described as follows (cf. Annex A, Model 6b; Annex B, no figure; Annex C, Table 6): Marginal zone (Zones 3 and 4): Woodland \ Reedbed on stream banks and grassland on annual flood bench VEGETATION ABUNDANCE Small decrease in biomass of tree species such as Breonadia salicina (Zone 3). VEGETATION COVER Small decrease in cover of Phragmites mauritianus reeds and of mesophytic grasses and sedges (Zone 3) and of sedges such as Cyperus marginatus. SPECIES RICHNESS Moderate reduction in number of indigenous species of trees, shrubs, grasses and sedges. SPECIES COMPOSITION Moderate change in overall species composition, for example the presence of alien-invader species such as Sesbania punicea, Senna didymobotrya and Chromolaena odorata. VEGETATION STRUCTURE
AfriDev Consultants (Pty) Ltd 2005
DWAF Report No. RDM X100-01-CON-COMPR2-0604 Komati River Catchment Ecological Water Requirements Study – Quantity Report
Page C - 38
Moderate change in structure due to poor recruitment of large riparian tree species such as Breonadia salicina. Lower Riparian zone (Zones 2, 5 and 6): Open / Closed Woodland on firm alluvial banks and islands VEGETATION ABUNDANCE Small increase in biomass as a result of encroachment by alien invader tree species such as Melia azedarach. VEGETATION COVER Small increase in cover of trees and shrubs due to contribution by alien-invader species such as Lantana camara, Chromalaena odorata and terrestrial species such as Gymnosporia senegalensis. SPECIES RICHNESS Moderate reduction in number of indigenous species as terrestrialisation and encroachment by alien-invader species such as Melia azedarach, Chromalaena odorata and Lantana camara occurs. SPECIES COMPOSITION Large change in overall species composition as alien-invader species such as Melia azedarach, Chromalaena odorata, Lantana camara, Solanum mauritianum and Senna didymobotrya invade. VEGETATION STRUCTURE Moderate change in structure due to poor recruitment of tree species such as Celtis africana , Ficus sycomorus, Combretum erythrophyllum and Syzygium cordatum. Upper Riparian zone (Zones 1 and 7): Open / Closed Woodland on firm colluvial slopes VEGETATION ABUNDANCE Moderate decrease in biomass due to deforestation of indigenous tree species such as Diospyros mespiliiformis, Terminalia sericea, Dombeya rotundifolia and Acacia species. VEGETATION COVER Moderate decrease in cover due to deforestation of indigenous tree species such as Diospyros mespiliiformis, and overgrazing of grass layer. . SPECIES RICHNESS Moderate decrease in species richness due to deforestation of indigenous trees. SPECIES COMPOSITION Small change in overall species composition as deforestation takes place and alien-invader species such as Lantana camara and Chromalaena odorata invade.

AfriDev Consultants (Pty) Ltd 2005
DWAF Report No. RDM X100-01-CON-COMPR2-0604 Komati River Catchment Ecological Water Requirements Study – Quantity Report
Page C - 39
VEGETATION STRUCTURE Moderate change in structure due to deforestation and poor recruitment of tree species such as Albizia versicolor and Acacia species. 3.6.6 PES down to Category E (Seriously Modified) Suspected vegetation changes from the reference condition (Category A) are described as follows (cf. Annex A, Model 6c; Annex B, no figure; Annex C, Table 6): Marginal zone (Zones 3 and 4): Woodland \ Reedbed on stream banks and grassland on annual flood bench VEGETATION ABUNDANCE Moderate decrease in biomass of Phragmites reeds due to channel incision, bed armouring and erosion of cobble bars (Zone 3). VEGETATION COVER Moderate decrease in cover of Phragmites mauritianus reeds due to channel incision, bed armouring and erosion of cobble bars (Zone 3). SPECIES RICHNESS Large reduction in number of indigenous species of trees, shrubs, grasses and sedges. SPECIES COMPOSITION Large change in overall species composition, for example the presence of alien-invader species such as Sesbania punicea, Senna didymobotrya and Chromolaena odorata. VEGETATION STRUCTURE Large change in structure due to poor recruitment of large riparian tree species such as Breonadia salicina. Lower Riparian zone (Zones 2, 5 and 6): Open / Closed Woodland on firm alluvial banks and islands VEGETATION ABUNDANCE Large increase in biomass as a result of encroachment by alien invader tree species such as Melia azedarach. VEGETATION COVER Large increase in cover of alien-invader species such as Lantana camara, Chromalaena odorata and terrestrial species such as Gymnosporia senegalensis. SPECIES RICHNESS Serious reduction in number of indigenous species as terrestrialisation and encroachment by alien-invader species such as Melia azedarach, Chromalaena odorata and Lantana camara occurs.

AfriDev Consultants (Pty) Ltd 2005
DWAF Report No. RDM X100-01-CON-COMPR2-0604 Komati River Catchment Ecological Water Requirements Study – Quantity Report
Page C - 40
SPECIES COMPOSITION Serious change in overall species composition as alien-invader species such as Melia azedarach, Chromalaena odorata, Lantana camara, Solanum mauritianum and Senna didymobotrya invade. VEGETATION STRUCTURE Moderate change in structure due to poor recruitment of tree species such as Celtis africana , Ficus sycomorus, Combretum erythrophyllum and Syzygium cordatum. Upper Riparian zone (Zones 1 and 7): Open / Closed Woodland on firm colluvial slopes VEGETATION ABUNDANCE Large decrease in biomass due to deforestation of indigenous tree species such as Diospyros mespiliiformis, Terminalia sericea, Dombeya rotundifolia and Acacia species. VEGETATION COVER Large decrease in cover due to deforestation of indigenous tree species such as Diospyros mespiliiformis, and overgrazing of grass layer. . SPECIES RICHNESS Large decrease in species richness due to deforestation of indigenous trees. SPECIES COMPOSITION Large change in overall species composition as deforestation takes place and alien-invader species such as Lantana camara and Chromalaena odorata invade. VEGETATION STRUCTURE Serious change in structure due to deforestation and poor recruitment of tree species such as Albizia versicolor and Acacia species. 3.7 EWR SITE L1: KLEINDORINGKOP 3.7.1 Reference Condition (Category A) Description of the reference condition is based on Acocks (1988), Van Coller & Rogers (1996), and the author’s working experience in Lowveld. There should be clear zoning of riparian vegetation as follows (Annex B, Figure 6; Annex C, Table 7): Marginal zone (Zones 2, 3 and 4): Woodland on sandy floodplain and Reedbed on banks An annual flood bench comprising a muddy substrate at water’s edge would be dominated by clumps of Phragmites mauritianus reed and the grass Ischaemum fasciculatum. Sedges such
AfriDev Consultants (Pty) Ltd 2005
DWAF Report No. RDM X100-01-CON-COMPR2-0604 Komati River Catchment Ecological Water Requirements Study – Quantity Report
Page C - 41
as Cyperus distans and ferns such as Amelopteris prolifera would occur at water’s edge (Zone 3). A sandy / boulder floodplain would support an open canopy of trees such as Breonadia salicina, Olea woodiana, Sesbania sesban and Syzygium species (Zone 2). Mesophytic grasses such as Bothriochloa insculpta and Imperata cylindrica would dominate more clayey areas (Zone 4) where lateral channels would create seasonal pools hosting Typha capensis reeds. Alien invader species such as Chromalaena odorata, Sesbania punicea and Senna didymobotrya would be absent. Lower Riparian zone (Zones 1 and 5): Woodland on loose sand terraces Mesophytic trees and shrubs such as Combretum erythrophyllum, Ficus sycomorus Syzygium guineense, Ficus capreifolia, Nuxia oppositifolia, Kraussia floribunda and Phyllanthus reticulatus would occur in a mosaic of closed and open-canopy woodland. The woodland structure would be maintained by regular seedling recruitment of such species. Terrestrial species such as Gymnosporia senegalensis and Annona senegalensis should not be dominant. Likewise, alien invader species such as Lantana camara, Chromolaena odorata and Psidium guajava should not occur in this zone. Upper Riparian zone (Zones 0 and 6): Closed Woodland on firm colluvial slopes The colluvial hillslopes would support mostly ‘non-riparian’ tree species (eg. Acacia robusta, Albizia versicolor, Dicrostachys cinerea, Diospyros mespiliformis, Philenoptera violacea, and Sclerocarya birrea). The closed woodland structure would be maintained by regular seedling recruitment of such species. There would be a good ground cover of grasses such as Themeda triandra, Panicum maximum and Cymbopogon validus. There should be no alien invasive species such as Lantana camara, Chromolaena odorata and Psidium guajava present. 3.7.2 Present Ecological State (PES) Based on suspected changes in vegetation attributes within three main vegetation zones compared to the reference condition7, the PES model for riparian vegetation (Annex A, Model 7a) determined the condition of the site to be Category C (moderately modified). The geomorphologist’s assessment of time-lapsed aerial photos of the site and her field observations were also taken into account, namely a definite narrowing of the channel, loss of secondary channels and vegetation encroachment due to changes in flow. Continuous cover of reeds, trees and shrubs provide good protection against erosion. Suspected vegetation changes from the reference condition (Category A) are described as follows (cf. Annex A, Model 7a; Annex B, Figure 6; Annex C, Table 7): Marginal zone (Zones 2, 3 and 4): Woodland on sandy floodplain and Reedbed on banks VEGETATION ABUNDANCE
7 Compared to a proposed ‘modified reference condition’, some of the PES driver ratings would change, resulting in a higher PES score. However, the PES class would probably not change.
AfriDev Consultants (Pty) Ltd 2005
DWAF Report No. RDM X100-01-CON-COMPR2-0604 Komati River Catchment Ecological Water Requirements Study – Quantity Report
Page C - 42
Moderate increase in biomass of Phragmites mauritianus reeds and of trees such as Breonadia salicina and Syzygium species as a result of high low flows and reduced flooding. This is offset to some extent by the effects of deforestation. VEGETATION COVER Moderate increase in cover of Phragmites mauritianus reeds and of trees such as Breonadia salicina and Syzygium species as a result of high low flows and reduced flooding. This is offset to some extent by the effects of deforestation. SPECIES RICHNESS Moderate increase in number of indigenous species (eg. Antidesma venosum, Diospyros mespiliformis and Garcinia livingstonei) as a result of terrestrialisation caused by reduced flooding SPECIES COMPOSITION Small change in overall species composition due to invasion by Chromalaena odorata, Sesbania punicea and Senna didymobotrya VEGETATION STRUCTURE Moderate change in structure due to Phragmites reed encroachment caused by reduced flooding and deforestation. Lower Riparian zone (Zones 1 and 5): Woodland on loose sand terraces VEGETATION ABUNDANCE Moderate increase in biomass of trees such as Combretum erythrophyllum, Ficus sycomorus Syzygium guineense, Nuxia oppositifolia and Kraussia floribunda as a result of reduced flooding. This is offset to some extent by the effects of deforestation. VEGETATION COVER Moderate increase in cover of trees such as Combretum erythrophyllum, Ficus sycomorus Syzygium guineense, Nuxia oppositifolia and Kraussia floribunda as a result of reduced flooding. This is offset to some extent by the effects of deforestation. SPECIES RICHNESS Moderate increase in number of indigenous species (eg. Annona senegalensis, Dicrostachys cinerea, Diospyros mespiliformis, Euclea natalensis, Garcinia livingstonei and Gymnosporia senegalensis) due to terrestrialisation caused by reduced flooding. SPECIES COMPOSITION Moderate change in overall species composition as a result of invasion by alien species such as Lantana camara, Chromolaena odorata and Psidium guajava. VEGETATION STRUCTURE

AfriDev Consultants (Pty) Ltd 2005
DWAF Report No. RDM X100-01-CON-COMPR2-0604 Komati River Catchment Ecological Water Requirements Study – Quantity Report
Page C - 43
Moderate change in structure due to poor recruitment of dominant trees such as Combretum erythrophyllum and Ficus sycomorus and encroachment of shrubs and climbers such as Canavalia virosa, Crotalaria sp. and Rhynchosia hirta. Upper Riparian zone (Zones 0 and 6): Closed Woodland on firm colluvial slopes VEGETATION ABUNDANCE Small reduction in biomass of trees as a result of deforestation VEGETATION COVER Small reduction in cover of trees as a result of deforestation SPECIES RICHNESS Small reduction in number of indigenous species due to deforestation SPECIES COMPOSITION Large change in overall species composition due to invasion by alien species such as Lantana camara, Chromolaena odorata and Psidium guajava VEGETATION STRUCTURE Small change in structure due to deforestation 3.7.3 Causes Of Degradation Flow-related causes: • High low-flows • Highly variable flows and reduced flooding Non-flow-related causes: • Disturbance of riparian zone (upstream agriculture) • Deforestation of tree species 3.7.4 Trend Considering that current management of releases from upstream impoundments is not likely to change, and provided that deforestation and cultivation in the riparian zone does not escalate, the Trend is considered to be stable. The following predictions regarding Present Ecological State in the short and long terms can be made: Short term (<5 years) Long term (>20 years) Negative C C
AfriDev Consultants (Pty) Ltd 2005
DWAF Report No. RDM X100-01-CON-COMPR2-0604 Komati River Catchment Ecological Water Requirements Study – Quantity Report
Page C - 44
4 CONCLUSIONS Important riparian vegetation attributes such as structure, cover, abundance and composition within flow-related vegetation zones at each of the EWR sites selected for the Komati River EWR study have been described and quantified. This has provided a basis for defining the Present Ecological State (PES) of each site compared to its perceived natural state, or ‘reference condition’, and this in turn provides a basis for identifying and motivating flow requirements and for monitoring long-term changes in vegetation.
AfriDev Consultants (Pty) Ltd 2005
DWAF Report No. RDM X100-01-CON-COMPR2-0604 Komati River Catchment Ecological Water Requirements Study – Quantity Report
Page C - 45
5 REFERENCES Acocks, J. P. H. 1988. Veld types of South Africa. Memoirs of the Botanical Survey of South Africa. No.40. AfriDev, 2004. Aquatic monitoring of the lower Lomati and Komati Rivers. Internal report prepared for the Komati Basin Water Authority. AfriDev Knight Piesold Joint Venture and JTK Associates, 1998a. EIA and IFR: The river. Vol. 3, Chapter 2. Internal Report prepared for the Komati Basin Water Authority. AfriDev Knight Piesold Joint Venture and JTK Associates, 1998b. EIA and IFR Mitigation. Supporting Report E: Instream Flow Requirements. Chapter 1. Internal Report prepared for the Komati Basin Water Authority. Institute for Water Research Source-to-Sea, Department of Water Affairs and Forestry: Resource Quality Services, Institute for Water Research Rhodes University 2004. Ecoclassification and Habitat-Flow-Stressor-Response Manual. Draft 1 June 2004. Ecorex, 2001. Proposed expansion of Nkomati Mine on the farm Uitkomst 541JT, Waterval Boven District. In: EMPR prepared by SRK Consulting. Kemper, N.P. 2003. Olifants River Ecological Water Requirements Assessment: Appendix D. Riparian Vegetation. IWR Environmental & AfriDev. Kleynhans, C.J. 1996. A qualitative proceedure for the assessment of the habitat integrity status of the Levuvhu River (Limpopo Systrem, South Africa). Journal of Aquatic Ecosystem Health 5: 1-14. Marneweck, G.C. 1998. Impacts on riparian vegetation along the Komati River downstream of Maguga Dam. In: AfriDev et al (1998a). Marneweck, G.C. 1999. Appendix A: Starter Document. Riparian vegetation: A basis for determining the Instream Flow Requirements of the riparian vegetation along the Komati River downstream of Maguga Dam. In: AfriDev et al (1998b). Van Coller, A.L. & Rogers, K.H. 1996. A basis for determining the Instream Flow Requirements of the riparian vegetation along the Sabie River within the Kruger National Park. Centre for Water in the Environment, University of the Witwatersrand. Report No. 2/96.
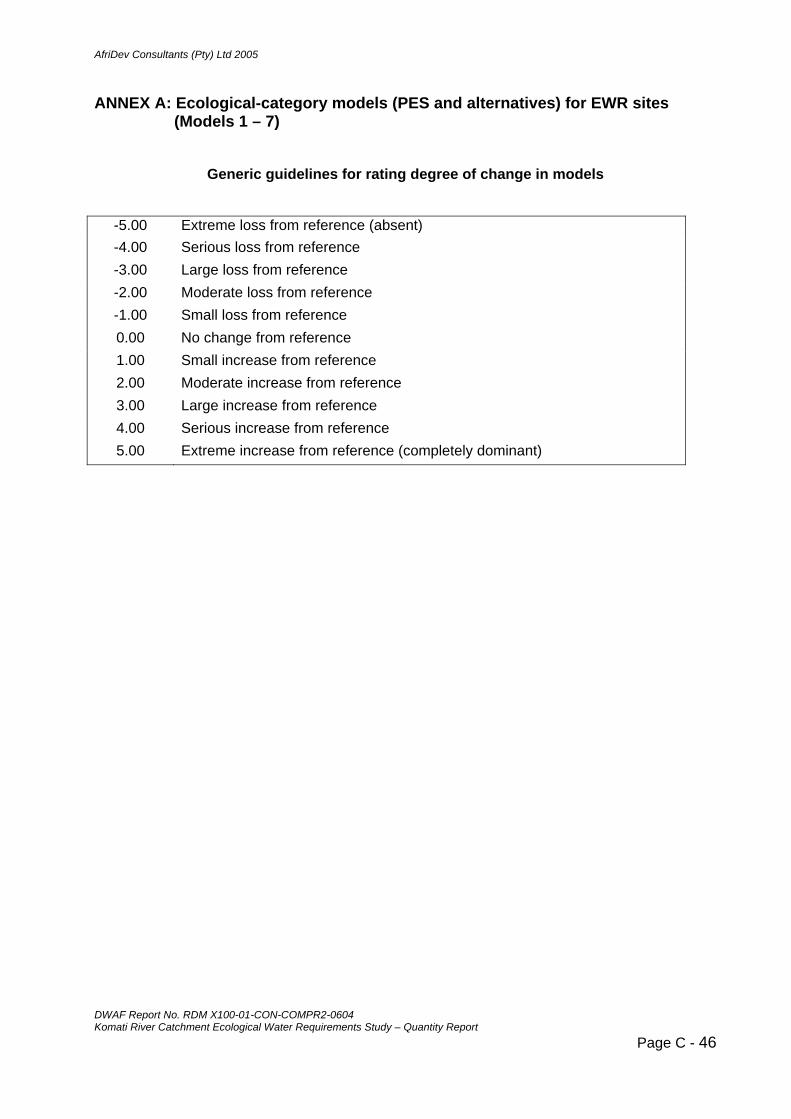
AfriDev Consultants (Pty) Ltd 2005
DWAF Report No. RDM X100-01-CON-COMPR2-0604 Komati River Catchment Ecological Water Requirements Study – Quantity Report
Page C - 46
ANNEX A: Ecological-category models (PES and alternatives) for EWR sites (Models 1 – 7)
Generic guidelines for rating degree of change in models
-5.00 Extreme loss from reference (absent) -4.00 Serious loss from reference -3.00 Large loss from reference -2.00 Moderate loss from reference -1.00 Small loss from reference 0.00 No change from reference 1.00 Small increase from reference 2.00 Moderate increase from reference 3.00 Large increase from reference 4.00 Serious increase from reference 5.00 Extreme increase from reference (completely dominant)
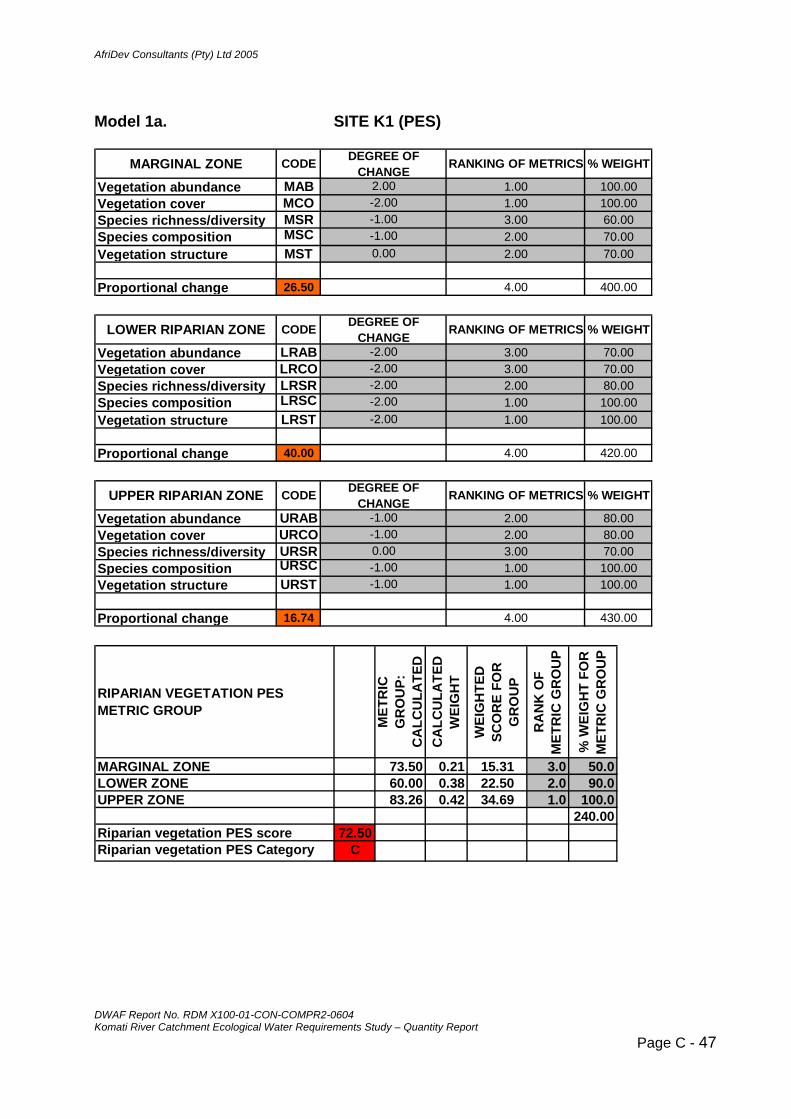
AfriDev Consultants (Pty) Ltd 2005
Model 1a. SITE K1 (PES)
MARGINAL ZONE CODE DEGREE OF CHANGE RANKING OF METRICS % WEIGHT
Vegetation abundance MAB 2.00 1.00 100.00Vegetation cover MCO -2.00 1.00 100.00Species richness/diversity MSR -1.00 3.00 60.00Species composition MSC -1.00 2.00 70.00Vegetation structure MST 0.00 2.00 70.00
Proportional change 26.50 4.00 400.00
LOWER RIPARIAN ZONE CODE DEGREE OF CHANGE RANKING OF METRICS % WEIGHT
Vegetation abundance LRAB -2.00 3.00 70.00Vegetation cover LRCO -2.00 3.00 70.00Species richness/diversity LRSR -2.00 2.00 80.00Species composition LRSC -2.00 1.00 100.00Vegetation structure LRST -2.00 1.00 100.00
Proportional change 40.00 4.00 420.00
UPPER RIPARIAN ZONE CODE DEGREE OF CHANGE RANKING OF METRICS % WEIGHT
Vegetation abundance URAB -1.00 2.00 80.00Vegetation cover URCO -1.00 2.00 80.00Species richness/diversity URSR 0.00 3.00 70.00Species composition URSC -1.00 1.00 100.00Vegetation structure URST -1.00 1.00 100.00
Proportional change 16.74 4.00 430.00
RIPARIAN VEGETATION PES METRIC GROUP
MET
RIC
G
RO
UP:
C
ALC
ULA
TED
C
ALC
ULA
TED
W
EIG
HT
WEI
GH
TED
SC
OR
E FO
R
GR
OU
P
RA
NK
OF
MET
RIC
GR
OU
P
% W
EIG
HT
FOR
M
ETR
IC G
RO
UP
MARGINAL ZONE 73.50 0.21 15.31 3.0 50.0LOWER ZONE 60.00 0.38 22.50 2.0 90.0UPPER ZONE 83.26 0.42 34.69 1.0 100.0
240.00Riparian vegetation PES score 72.50Riparian vegetation PES Category C
DWAF Report No. RDM X100-01-CON-COMPR2-0604 Komati River Catchment Ecological Water Requirements Study – Quantity Report
Page C - 47

AfriDev Consultants (Pty) Ltd 2005
Model 1b. SITE K1 (UP)
MARGINAL ZONE CODE DEGREE OF CHANGE RANKING OF METRICS % WEIGHT
Vegetation abundance MAB 1.00 1.00 100.00Vegetation cover MCO -1.00 1.00 100.00Species richness/diversity MSR -1.00 3.00 60.00Species composition MSC -1.00 2.00 70.00Vegetation structure MST 0.00 2.00 70.00
Proportional change 16.50 4.00 400.00
LOWER RIPARIAN ZONE CODE DEGREE OF CHANGE RANKING OF METRICS % WEIGHT
Vegetation abundance LRAB -1.00 3.00 70.00Vegetation cover LRCO -1.00 3.00 70.00Species richness/diversity LRSR -1.00 2.00 80.00Species composition LRSC -1.00 1.00 100.00Vegetation structure LRST -1.00 1.00 100.00
Proportional change 20.00 4.00 420.00
UPPER RIPARIAN ZONE CODE DEGREE OF CHANGE RANKING OF METRICS % WEIGHT
Vegetation abundance URAB 0.00 2.00 80.00Vegetation cover URCO 0.00 2.00 80.00Species richness/diversity URSR 0.00 3.00 70.00Species composition URSC 0.00 1.00 100.00Vegetation structure URST 0.00 1.00 100.00
Proportional change 0.00 4.00 430.00
RIPARIAN VEGETATION PES (UP) METRIC GROUP
MET
RIC
G
RO
UP:
C
ALC
ULA
TED
C
ALC
ULA
TED
W
EIG
HT
WEI
GH
TED
SC
OR
E FO
R
GR
OU
P
RA
NK
OF
MET
RIC
GR
OU
P
% W
EIG
HT
FOR
M
ETR
IC G
RO
UP
MARGINAL ZONE 83.50 0.21 17.40 3.0 50.0LOWER ZONE 80.00 0.38 30.00 2.0 90.0UPPER ZONE 100.00 0.42 41.67 1.0 100.0
240.00Riparian vegetation PES score 89.06Riparian vegetation PES Category B
DWAF Report No. RDM X100-01-CON-COMPR2-0604 Komati River Catchment Ecological Water Requirements Study – Quantity Report
Page C - 48

AfriDev Consultants (Pty) Ltd 2005
Model 1c. SITE K1 (DOWN)
MARGINAL ZONE CODE DEGREE OF CHANGE RANKING OF METRICS % WEIGHT
Vegetation abundance MAB 4.00 1.00 100.00Vegetation cover MCO -3.00 1.00 100.00Species richness/diversity MSR -2.00 3.00 60.00Species composition MSC -2.00 2.00 70.00Vegetation structure MST -1.00 2.00 70.00
Proportional change 51.50 4.00 400.00
LOWER RIPARIAN ZONE CODE DEGREE OF CHANGE RANKING OF METRICS % WEIGHT
Vegetation abundance LRAB -2.00 3.00 70.00Vegetation cover LRCO -2.00 3.00 70.00Species richness/diversity LRSR -3.00 2.00 80.00Species composition LRSC -3.00 1.00 100.00Vegetation structure LRST -2.00 1.00 100.00
Proportional change 48.57 4.00 420.00
UPPER RIPARIAN ZONE CODE DEGREE OF CHANGE RANKING OF METRICS % WEIGHT
Vegetation abundance URAB -1.00 2.00 80.00Vegetation cover URCO -2.00 2.00 80.00Species richness/diversity URSR -1.00 3.00 70.00Species composition URSC -2.00 1.00 100.00Vegetation structure URST -1.00 1.00 100.00
Proportional change 28.37 4.00 430.00
RIPARIAN VEGETATION PES (DOWN) METRIC GROUP
MET
RIC
G
RO
UP:
C
ALC
ULA
TED
C
ALC
ULA
TED
W
EIG
HT
WEI
GH
TED
SC
OR
E FO
R
GR
OU
P
RA
NK
OF
MET
RIC
GR
OU
P
% W
EIG
HT
FOR
M
ETR
IC G
RO
UP
MARGINAL ZONE 48.50 0.21 10.10 3.0 50.0LOWER ZONE 51.43 0.38 19.29 2.0 90.0UPPER ZONE 71.63 0.42 29.84 1.0 100.0
240.00Riparian vegetation PES score 59.23Riparian vegetation PES Category D
DWAF Report No. RDM X100-01-CON-COMPR2-0604 Komati River Catchment Ecological Water Requirements Study – Quantity Report
Page C - 49

AfriDev Consultants (Pty) Ltd 2005
Model 2a. SITE K2 (PES)
MARGINAL ZONE CODE DEGREE OF CHANGE RANKING OF METRICS % WEIGHT
Vegetation abundance MAB 2.00 1.00 100.00Vegetation cover MCO 2.00 1.00 100.00Species richness/diversity MSR -2.00 3.00 60.00Species composition MSC -2.00 2.00 70.00Vegetation structure MST 2.00 2.00 70.00
Proportional change 40.00 4.00 400.00
LOWER RIPARIAN ZONE CODE DEGREE OF CHANGE RANKING OF METRICS % WEIGHT
Vegetation abundance LRAB 2.00 3.00 70.00Vegetation cover LRCO 2.00 3.00 70.00Species richness/diversity LRSR -1.00 2.00 80.00Species composition LRSC -1.00 1.00 100.00Vegetation structure LRST -1.00 1.00 100.00
Proportional change 26.67 4.00 420.00
UPPER RIPARIAN ZONE CODE DEGREE OF CHANGE RANKING OF METRICS % WEIGHT
Vegetation abundance URAB 1.00 2.00 80.00Vegetation cover URCO 0.00 2.00 80.00Species richness/diversity URSR 0.00 3.00 70.00Species composition URSC -1.00 1.00 100.00Vegetation structure URST 1.00 1.00 100.00
Proportional change 13.02 4.00 430.00
RIPARIAN VEGETATION PES METRIC GROUP
MET
RIC
G
RO
UP:
C
ALC
ULA
TED
C
ALC
ULA
TED
W
EIG
HT
WEI
GH
TED
SC
OR
E FO
R
GR
OU
P
RA
NK
OF
MET
RIC
GR
OU
P
% W
EIG
HT
FOR
M
ETR
IC G
RO
UP
MARGINAL ZONE 60.00 0.21 12.50 3.0 50.0LOWER ZONE 73.33 0.38 27.50 2.0 90.0UPPER ZONE 86.98 0.42 36.24 1.0 100.0
240.00Riparian vegetation PES score 76.24Riparian vegetation PES Category C
DWAF Report No. RDM X100-01-CON-COMPR2-0604 Komati River Catchment Ecological Water Requirements Study – Quantity Report
Page C - 50
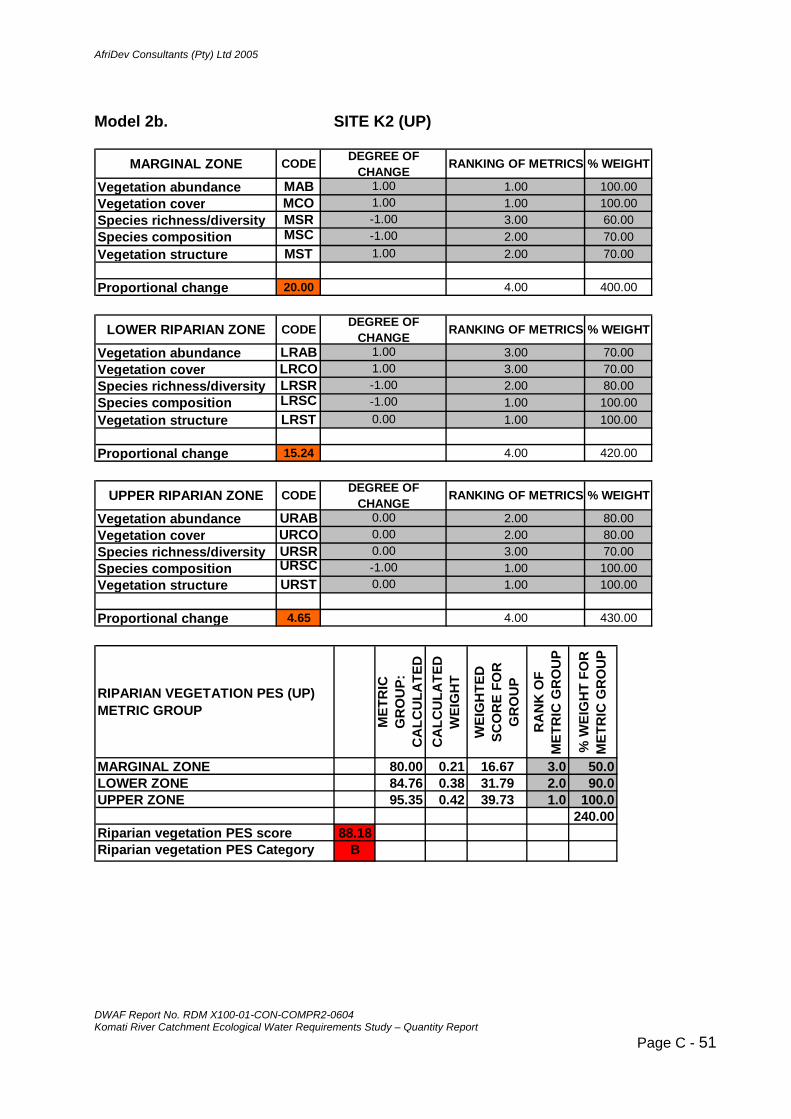
AfriDev Consultants (Pty) Ltd 2005
Model 2b. SITE K2 (UP)
MARGINAL ZONE CODE DEGREE OF CHANGE RANKING OF METRICS % WEIGHT
Vegetation abundance MAB 1.00 1.00 100.00Vegetation cover MCO 1.00 1.00 100.00Species richness/diversity MSR -1.00 3.00 60.00Species composition MSC -1.00 2.00 70.00Vegetation structure MST 1.00 2.00 70.00
Proportional change 20.00 4.00 400.00
LOWER RIPARIAN ZONE CODE DEGREE OF CHANGE RANKING OF METRICS % WEIGHT
Vegetation abundance LRAB 1.00 3.00 70.00Vegetation cover LRCO 1.00 3.00 70.00Species richness/diversity LRSR -1.00 2.00 80.00Species composition LRSC -1.00 1.00 100.00Vegetation structure LRST 0.00 1.00 100.00
Proportional change 15.24 4.00 420.00
UPPER RIPARIAN ZONE CODE DEGREE OF CHANGE RANKING OF METRICS % WEIGHT
Vegetation abundance URAB 0.00 2.00 80.00Vegetation cover URCO 0.00 2.00 80.00Species richness/diversity URSR 0.00 3.00 70.00Species composition URSC -1.00 1.00 100.00Vegetation structure URST 0.00 1.00 100.00
Proportional change 4.65 4.00 430.00
RIPARIAN VEGETATION PES (UP) METRIC GROUP
MET
RIC
G
RO
UP:
C
ALC
ULA
TED
C
ALC
ULA
TED
W
EIG
HT
WEI
GH
TED
SC
OR
E FO
R
GR
OU
P
RA
NK
OF
MET
RIC
GR
OU
P
% W
EIG
HT
FOR
M
ETR
IC G
RO
UP
MARGINAL ZONE 80.00 0.21 16.67 3.0 50.0LOWER ZONE 84.76 0.38 31.79 2.0 90.0UPPER ZONE 95.35 0.42 39.73 1.0 100.0
240.00Riparian vegetation PES score 88.18Riparian vegetation PES Category B
DWAF Report No. RDM X100-01-CON-COMPR2-0604 Komati River Catchment Ecological Water Requirements Study – Quantity Report
Page C - 51

AfriDev Consultants (Pty) Ltd 2005
Model 2c. SITE K2 (DOWN)
MARGINAL ZONE CODE DEGREE OF CHANGE RANKING OF METRICS % WEIGHT
Vegetation abundance MAB 3.00 1.00 100.00Vegetation cover MCO 3.00 1.00 100.00Species richness/diversity MSR -3.00 3.00 60.00Species composition MSC -3.00 2.00 70.00Vegetation structure MST 3.00 2.00 70.00
Proportional change 60.00 4.00 400.00
LOWER RIPARIAN ZONE CODE DEGREE OF CHANGE RANKING OF METRICS % WEIGHT
Vegetation abundance LRAB -3.00 3.00 70.00Vegetation cover LRCO -3.00 3.00 70.00Species richness/diversity LRSR -2.00 2.00 80.00Species composition LRSC -2.00 1.00 100.00Vegetation structure LRST -2.00 1.00 100.00
Proportional change 46.67 4.00 420.00
UPPER RIPARIAN ZONE CODE DEGREE OF CHANGE RANKING OF METRICS % WEIGHT
Vegetation abundance URAB 2.00 2.00 80.00Vegetation cover URCO -2.00 2.00 80.00Species richness/diversity URSR -2.00 3.00 70.00Species composition URSC -2.00 1.00 100.00Vegetation structure URST 1.00 1.00 100.00
Proportional change 35.35 4.00 430.00
RIPARIAN VEGETATION PES (DOWN) METRIC GROUP
MET
RIC
G
RO
UP:
C
ALC
ULA
TED
C
ALC
ULA
TED
W
EIG
HT
WEI
GH
TED
SC
OR
E FO
R
GR
OU
P
RA
NK
OF
MET
RIC
GR
OU
P
% W
EIG
HT
FOR
M
ETR
IC G
RO
UP
MARGINAL ZONE 40.00 0.21 8.33 3.0 50.0LOWER ZONE 53.33 0.38 20.00 2.0 90.0UPPER ZONE 64.65 0.42 26.94 1.0 100.0
240.00Riparian vegetation PES score 55.27Riparian vegetation PES Category D
DWAF Report No. RDM X100-01-CON-COMPR2-0604 Komati River Catchment Ecological Water Requirements Study – Quantity Report
Page C - 52
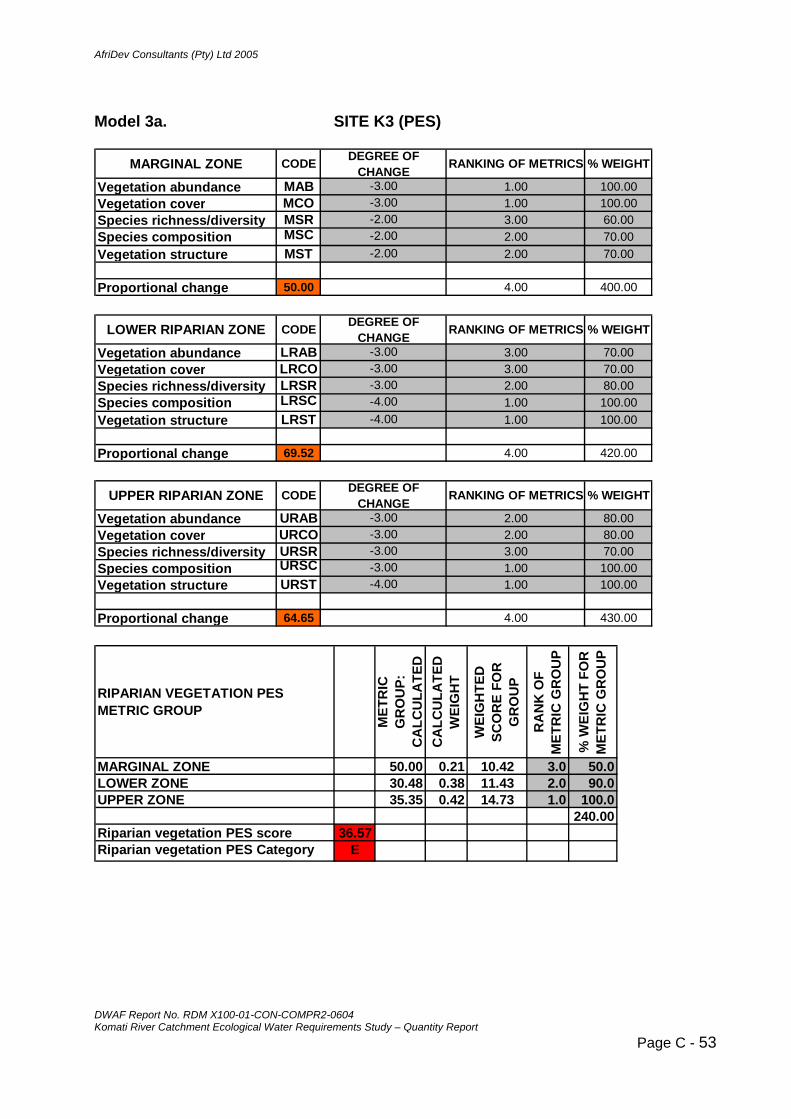
AfriDev Consultants (Pty) Ltd 2005
Model 3a. SITE K3 (PES)
MARGINAL ZONE CODE DEGREE OF CHANGE RANKING OF METRICS % WEIGHT
Vegetation abundance MAB -3.00 1.00 100.00Vegetation cover MCO -3.00 1.00 100.00Species richness/diversity MSR -2.00 3.00 60.00Species composition MSC -2.00 2.00 70.00Vegetation structure MST -2.00 2.00 70.00
Proportional change 50.00 4.00 400.00
LOWER RIPARIAN ZONE CODE DEGREE OF CHANGE RANKING OF METRICS % WEIGHT
Vegetation abundance LRAB -3.00 3.00 70.00Vegetation cover LRCO -3.00 3.00 70.00Species richness/diversity LRSR -3.00 2.00 80.00Species composition LRSC -4.00 1.00 100.00Vegetation structure LRST -4.00 1.00 100.00
Proportional change 69.52 4.00 420.00
UPPER RIPARIAN ZONE CODE DEGREE OF CHANGE RANKING OF METRICS % WEIGHT
Vegetation abundance URAB -3.00 2.00 80.00Vegetation cover URCO -3.00 2.00 80.00Species richness/diversity URSR -3.00 3.00 70.00Species composition URSC -3.00 1.00 100.00Vegetation structure URST -4.00 1.00 100.00
Proportional change 64.65 4.00 430.00
RIPARIAN VEGETATION PES METRIC GROUP
MET
RIC
G
RO
UP:
C
ALC
ULA
TED
C
ALC
ULA
TED
W
EIG
HT
WEI
GH
TED
SC
OR
E FO
R
GR
OU
P
RA
NK
OF
MET
RIC
GR
OU
P
% W
EIG
HT
FOR
M
ETR
IC G
RO
UP
MARGINAL ZONE 50.00 0.21 10.42 3.0 50.0LOWER ZONE 30.48 0.38 11.43 2.0 90.0UPPER ZONE 35.35 0.42 14.73 1.0 100.0
240.00Riparian vegetation PES score 36.57Riparian vegetation PES Category E
DWAF Report No. RDM X100-01-CON-COMPR2-0604 Komati River Catchment Ecological Water Requirements Study – Quantity Report
Page C - 53
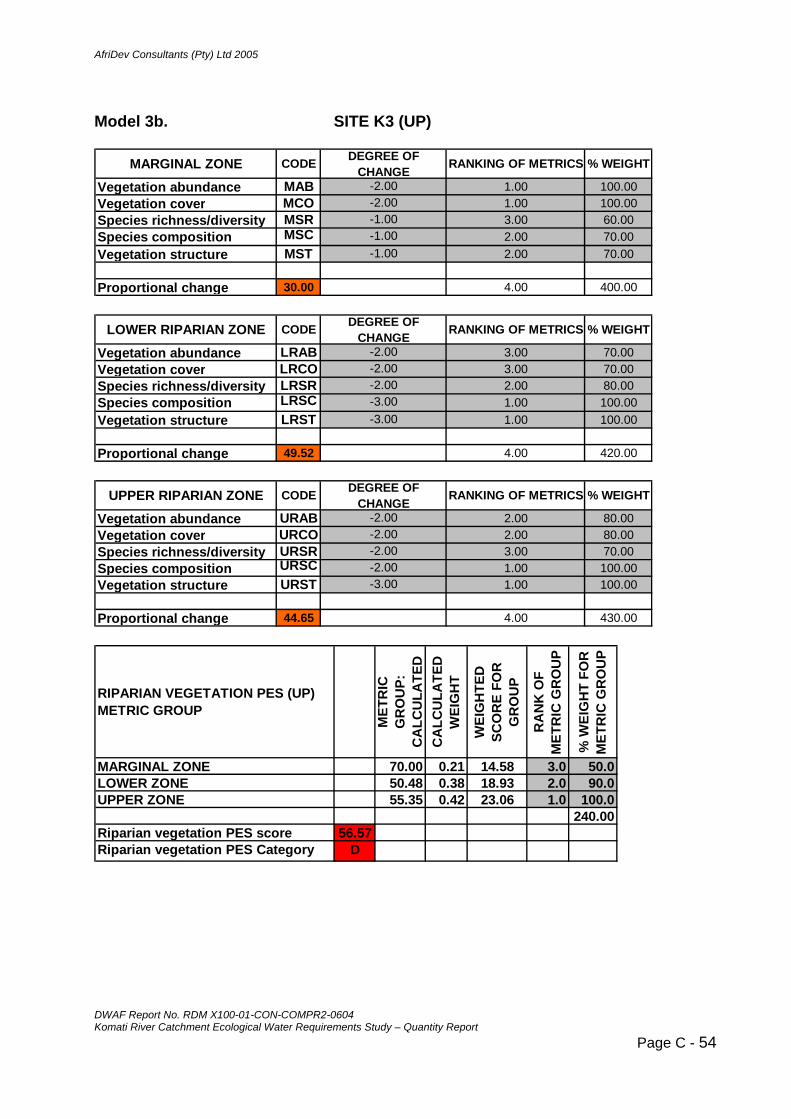
AfriDev Consultants (Pty) Ltd 2005
Model 3b. SITE K3 (UP)
MARGINAL ZONE CODE DEGREE OF CHANGE RANKING OF METRICS % WEIGHT
Vegetation abundance MAB -2.00 1.00 100.00Vegetation cover MCO -2.00 1.00 100.00Species richness/diversity MSR -1.00 3.00 60.00Species composition MSC -1.00 2.00 70.00Vegetation structure MST -1.00 2.00 70.00
Proportional change 30.00 4.00 400.00
LOWER RIPARIAN ZONE CODE DEGREE OF CHANGE RANKING OF METRICS % WEIGHT
Vegetation abundance LRAB -2.00 3.00 70.00Vegetation cover LRCO -2.00 3.00 70.00Species richness/diversity LRSR -2.00 2.00 80.00Species composition LRSC -3.00 1.00 100.00Vegetation structure LRST -3.00 1.00 100.00
Proportional change 49.52 4.00 420.00
UPPER RIPARIAN ZONE CODE DEGREE OF CHANGE RANKING OF METRICS % WEIGHT
Vegetation abundance URAB -2.00 2.00 80.00Vegetation cover URCO -2.00 2.00 80.00Species richness/diversity URSR -2.00 3.00 70.00Species composition URSC -2.00 1.00 100.00Vegetation structure URST -3.00 1.00 100.00
Proportional change 44.65 4.00 430.00
RIPARIAN VEGETATION PES (UP) METRIC GROUP
MET
RIC
G
RO
UP:
C
ALC
ULA
TED
C
ALC
ULA
TED
W
EIG
HT
WEI
GH
TED
SC
OR
E FO
R
GR
OU
P
RA
NK
OF
MET
RIC
GR
OU
P
% W
EIG
HT
FOR
M
ETR
IC G
RO
UP
MARGINAL ZONE 70.00 0.21 14.58 3.0 50.0LOWER ZONE 50.48 0.38 18.93 2.0 90.0UPPER ZONE 55.35 0.42 23.06 1.0 100.0
240.00Riparian vegetation PES score 56.57Riparian vegetation PES Category D
DWAF Report No. RDM X100-01-CON-COMPR2-0604 Komati River Catchment Ecological Water Requirements Study – Quantity Report
Page C - 54
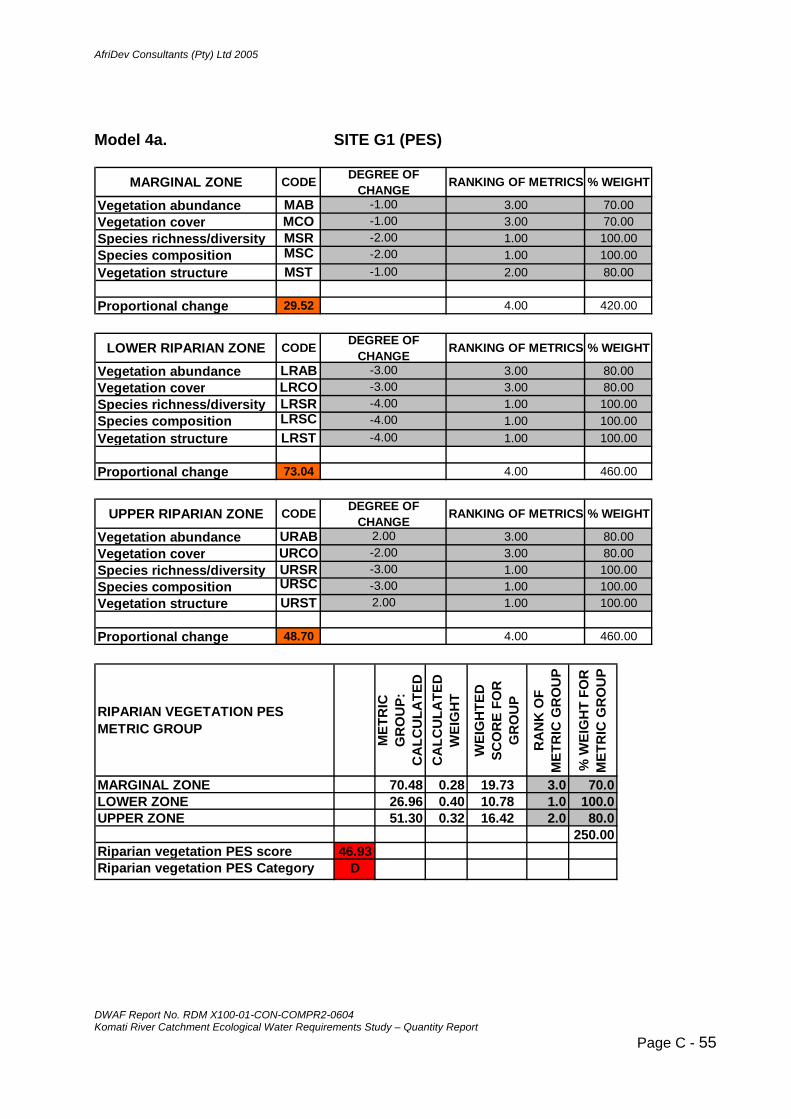
AfriDev Consultants (Pty) Ltd 2005
Model 4a. SITE G1 (PES)
MARGINAL ZONE CODE DEGREE OF CHANGE RANKING OF METRICS % WEIGHT
Vegetation abundance MAB -1.00 3.00 70.00Vegetation cover MCO -1.00 3.00 70.00Species richness/diversity MSR -2.00 1.00 100.00Species composition MSC -2.00 1.00 100.00Vegetation structure MST -1.00 2.00 80.00
Proportional change 29.52 4.00 420.00
LOWER RIPARIAN ZONE CODE DEGREE OF CHANGE RANKING OF METRICS % WEIGHT
Vegetation abundance LRAB -3.00 3.00 80.00Vegetation cover LRCO -3.00 3.00 80.00Species richness/diversity LRSR -4.00 1.00 100.00Species composition LRSC -4.00 1.00 100.00Vegetation structure LRST -4.00 1.00 100.00
Proportional change 73.04 4.00 460.00
UPPER RIPARIAN ZONE CODE DEGREE OF CHANGE RANKING OF METRICS % WEIGHT
Vegetation abundance URAB 2.00 3.00 80.00Vegetation cover URCO -2.00 3.00 80.00Species richness/diversity URSR -3.00 1.00 100.00Species composition URSC -3.00 1.00 100.00Vegetation structure URST 2.00 1.00 100.00
Proportional change 48.70 4.00 460.00
RIPARIAN VEGETATION PES METRIC GROUP
MET
RIC
G
RO
UP:
C
ALC
ULA
TED
C
ALC
ULA
TED
W
EIG
HT
WEI
GH
TED
SC
OR
E FO
R
GR
OU
P
RA
NK
OF
MET
RIC
GR
OU
P
% W
EIG
HT
FOR
M
ETR
IC G
RO
UP
MARGINAL ZONE 70.48 0.28 19.73 3.0 70.0LOWER ZONE 26.96 0.40 10.78 1.0 100.0UPPER ZONE 51.30 0.32 16.42 2.0 80.0
250.00Riparian vegetation PES score 46.93Riparian vegetation PES Category D
DWAF Report No. RDM X100-01-CON-COMPR2-0604 Komati River Catchment Ecological Water Requirements Study – Quantity Report
Page C - 55

AfriDev Consultants (Pty) Ltd 2005
Model 4b. SITE G1 (UP)
MARGINAL ZONE CODE DEGREE OF CHANGE RANKING OF METRICS % WEIGHT
Vegetation abundance MAB 0.00 3.00 70.00Vegetation cover MCO 0.00 3.00 70.00Species richness/diversity MSR -1.00 1.00 100.00Species composition MSC -1.00 1.00 100.00Vegetation structure MST -1.00 2.00 80.00
Proportional change 13.33 4.00 420.00
LOWER RIPARIAN ZONE CODE DEGREE OF CHANGE RANKING OF METRICS % WEIGHT
Vegetation abundance LRAB -2.00 3.00 80.00Vegetation cover LRCO -2.00 3.00 80.00Species richness/diversity LRSR -2.00 1.00 100.00Species composition LRSC -2.00 1.00 100.00Vegetation structure LRST -2.00 1.00 100.00
Proportional change 40.00 4.00 460.00
UPPER RIPARIAN ZONE CODE DEGREE OF CHANGE RANKING OF METRICS % WEIGHT
Vegetation abundance URAB 1.00 3.00 80.00Vegetation cover URCO -1.00 3.00 80.00Species richness/diversity URSR -2.00 1.00 100.00Species composition URSC -2.00 1.00 100.00Vegetation structure URST 1.00 1.00 100.00
Proportional change 28.70 4.00 460.00
RIPARIAN VEGETATION PES (UP) METRIC GROUP
MET
RIC
G
RO
UP:
C
ALC
ULA
TED
C
ALC
ULA
TED
W
EIG
HT
WEI
GH
TED
SC
OR
E FO
R
GR
OU
P
RA
NK
OF
MET
RIC
GR
OU
P
% W
EIG
HT
FOR
M
ETR
IC G
RO
UP
MARGINAL ZONE 86.67 0.28 24.27 3.0 70.0LOWER ZONE 60.00 0.40 24.00 1.0 100.0UPPER ZONE 71.30 0.32 22.82 2.0 80.0
250.00Riparian vegetation PES score 71.08Riparian vegetation PES Category C
DWAF Report No. RDM X100-01-CON-COMPR2-0604 Komati River Catchment Ecological Water Requirements Study – Quantity Report
Page C - 56

AfriDev Consultants (Pty) Ltd 2005
Model 5a. SITE T1 (PES)
MARGINAL ZONE CODE DEGREE OF CHANGE RANKING OF METRICS % WEIGHT
Vegetation abundance MAB -1.00 1.00 100.00Vegetation cover MCO -1.00 1.00 100.00Species richness/diversity MSR -2.00 3.00 60.00Species composition MSC -2.00 2.00 70.00Vegetation structure MST -1.00 2.00 70.00
Proportional change 26.50 4.00 400.00
LOWER RIPARIAN ZONE CODE DEGREE OF CHANGE RANKING OF METRICS % WEIGHT
Vegetation abundance LRAB -1.00 3.00 70.00Vegetation cover LRCO -1.00 3.00 70.00Species richness/diversity LRSR -2.00 2.00 80.00Species composition LRSC -2.00 1.00 100.00Vegetation structure LRST -1.00 1.00 100.00
Proportional change 28.57 4.00 420.00
UPPER RIPARIAN ZONE CODE DEGREE OF CHANGE RANKING OF METRICS % WEIGHT
Vegetation abundance URAB -1.00 2.00 80.00Vegetation cover URCO -1.00 2.00 80.00Species richness/diversity URSR -1.00 3.00 70.00Species composition URSC -1.00 1.00 100.00Vegetation structure URST -1.00 1.00 100.00
Proportional change 20.00 4.00 430.00
RIPARIAN VEGETATION PES METRIC GROUP
MET
RIC
G
RO
UP:
C
ALC
ULA
TED
C
ALC
ULA
TED
W
EIG
HT
WEI
GH
TED
SC
OR
E FO
R
GR
OU
P
RA
NK
OF
MET
RIC
GR
OU
P
% W
EIG
HT
FOR
M
ETR
IC G
RO
UP
MARGINAL ZONE 73.50 0.33 24.50 2.0 80.0LOWER ZONE 71.43 0.42 29.76 1.0 100.0UPPER ZONE 80.00 0.25 20.00 3.0 60.0
240.00Riparian vegetation PES score 74.26Riparian vegetation PES Category C
DWAF Report No. RDM X100-01-CON-COMPR2-0604 Komati River Catchment Ecological Water Requirements Study – Quantity Report
Page C - 57

AfriDev Consultants (Pty) Ltd 2005
Model 5b. SITE T1 (UP)
MARGINAL ZONE CODE DEGREE OF CHANGE RANKING OF METRICS % WEIGHT
Vegetation abundance MAB -1.00 1.00 100.00Vegetation cover MCO -1.00 1.00 100.00Species richness/diversity MSR -1.00 3.00 60.00Species composition MSC -1.00 2.00 70.00Vegetation structure MST -1.00 2.00 70.00
Proportional change 20.00 4.00 400.00
LOWER RIPARIAN ZONE CODE DEGREE OF CHANGE RANKING OF METRICS % WEIGHT
Vegetation abundance LRAB 0.00 3.00 70.00Vegetation cover LRCO 0.00 3.00 70.00Species richness/diversity LRSR -1.00 2.00 80.00Species composition LRSC -1.00 1.00 100.00Vegetation structure LRST -1.00 1.00 100.00
Proportional change 13.33 4.00 420.00
UPPER RIPARIAN ZONE CODE DEGREE OF CHANGE RANKING OF METRICS % WEIGHT
Vegetation abundance URAB 0.00 2.00 80.00Vegetation cover URCO 0.00 2.00 80.00Species richness/diversity URSR -1.00 3.00 70.00Species composition URSC -1.00 1.00 100.00Vegetation structure URST -1.00 1.00 100.00
Proportional change 12.56 4.00 430.00
RIPARIAN VEGETATION PES (UP) METRIC GROUP
MET
RIC
G
RO
UP:
C
ALC
ULA
TED
C
ALC
ULA
TED
W
EIG
HT
WEI
GH
TED
SC
OR
E FO
R
GR
OU
P
RA
NK
OF
MET
RIC
GR
OU
P
% W
EIG
HT
FOR
M
ETR
IC G
RO
UP
MARGINAL ZONE 80.00 0.33 26.67 2.0 80.0LOWER ZONE 86.67 0.42 36.11 1.0 100.0UPPER ZONE 87.44 0.25 21.86 3.0 60.0
240.00Riparian vegetation PES score 84.64Riparian vegetation PES Category B
DWAF Report No. RDM X100-01-CON-COMPR2-0604 Komati River Catchment Ecological Water Requirements Study – Quantity Report
Page C - 58
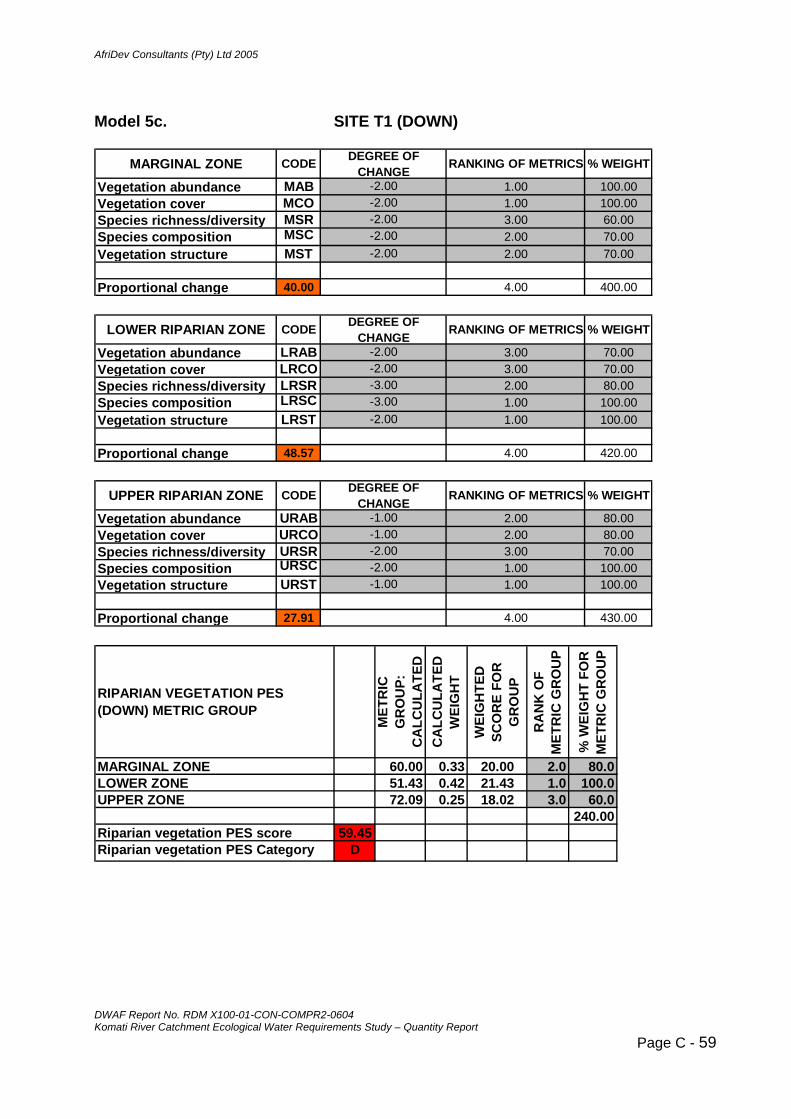
AfriDev Consultants (Pty) Ltd 2005
Model 5c. SITE T1 (DOWN)
MARGINAL ZONE CODE DEGREE OF CHANGE RANKING OF METRICS % WEIGHT
Vegetation abundance MAB -2.00 1.00 100.00Vegetation cover MCO -2.00 1.00 100.00Species richness/diversity MSR -2.00 3.00 60.00Species composition MSC -2.00 2.00 70.00Vegetation structure MST -2.00 2.00 70.00
Proportional change 40.00 4.00 400.00
LOWER RIPARIAN ZONE CODE DEGREE OF CHANGE RANKING OF METRICS % WEIGHT
Vegetation abundance LRAB -2.00 3.00 70.00Vegetation cover LRCO -2.00 3.00 70.00Species richness/diversity LRSR -3.00 2.00 80.00Species composition LRSC -3.00 1.00 100.00Vegetation structure LRST -2.00 1.00 100.00
Proportional change 48.57 4.00 420.00
UPPER RIPARIAN ZONE CODE DEGREE OF CHANGE RANKING OF METRICS % WEIGHT
Vegetation abundance URAB -1.00 2.00 80.00Vegetation cover URCO -1.00 2.00 80.00Species richness/diversity URSR -2.00 3.00 70.00Species composition URSC -2.00 1.00 100.00Vegetation structure URST -1.00 1.00 100.00
Proportional change 27.91 4.00 430.00
RIPARIAN VEGETATION PES (DOWN) METRIC GROUP
MET
RIC
G
RO
UP:
C
ALC
ULA
TED
C
ALC
ULA
TED
W
EIG
HT
WEI
GH
TED
SC
OR
E FO
R
GR
OU
P
RA
NK
OF
MET
RIC
GR
OU
P
% W
EIG
HT
FOR
M
ETR
IC G
RO
UP
MARGINAL ZONE 60.00 0.33 20.00 2.0 80.0LOWER ZONE 51.43 0.42 21.43 1.0 100.0UPPER ZONE 72.09 0.25 18.02 3.0 60.0
240.00Riparian vegetation PES score 59.45Riparian vegetation PES Category D
DWAF Report No. RDM X100-01-CON-COMPR2-0604 Komati River Catchment Ecological Water Requirements Study – Quantity Report
Page C - 59

AfriDev Consultants (Pty) Ltd 2005
Model 6a. SITE M1 (PES)
MARGINAL ZONE CODE DEGREE OF CHANGE RANKING OF METRICS % WEIGHT
Vegetation abundance MAB -2.00 1.00 100.00Vegetation cover MCO -1.00 1.00 100.00Species richness/diversity MSR -2.00 3.00 60.00Species composition MSC -3.00 2.00 70.00Vegetation structure MST -3.00 2.00 70.00
Proportional change 42.00 4.00 400.00
LOWER RIPARIAN ZONE CODE DEGREE OF CHANGE RANKING OF METRICS % WEIGHT
Vegetation abundance LRAB 2.00 3.00 70.00Vegetation cover LRCO 2.00 3.00 70.00Species richness/diversity LRSR -3.00 2.00 80.00Species composition LRSC -4.00 1.00 100.00Vegetation structure LRST -2.00 1.00 100.00
Proportional change 53.33 4.00 420.00
UPPER RIPARIAN ZONE CODE DEGREE OF CHANGE RANKING OF METRICS % WEIGHT
Vegetation abundance URAB -3.00 2.00 80.00Vegetation cover URCO -3.00 2.00 80.00Species richness/diversity URSR -2.00 3.00 70.00Species composition URSC -2.00 1.00 100.00Vegetation structure URST -3.00 1.00 100.00
Proportional change 52.09 4.00 430.00
RIPARIAN VEGETATION PES METRIC GROUP
MET
RIC
G
RO
UP:
C
ALC
ULA
TED
C
ALC
ULA
TED
W
EIG
HT
WEI
GH
TED
SC
OR
E FO
R
GR
OU
P
RA
NK
OF
MET
RIC
GR
OU
P
% W
EIG
HT
FOR
M
ETR
IC G
RO
UP
MARGINAL ZONE 58.00 0.21 12.08 3.0 50.0LOWER ZONE 46.67 0.38 17.50 2.0 90.0UPPER ZONE 47.91 0.42 19.96 1.0 100.0
240.00Riparian vegetation PES score 49.54Riparian vegetation PES Category D
DWAF Report No. RDM X100-01-CON-COMPR2-0604 Komati River Catchment Ecological Water Requirements Study – Quantity Report
Page C - 60

AfriDev Consultants (Pty) Ltd 2005
Model 6b. SITE M1 (UP)
MARGINAL ZONE CODE DEGREE OF CHANGE RANKING OF METRICS % WEIGHT
Vegetation abundance MAB -1.00 1.00 100.00Vegetation cover MCO -1.00 1.00 100.00Species richness/diversity MSR -2.00 3.00 60.00Species composition MSC -2.00 2.00 70.00Vegetation structure MST -2.00 2.00 70.00
Proportional change 30.00 4.00 400.00
LOWER RIPARIAN ZONE CODE DEGREE OF CHANGE RANKING OF METRICS % WEIGHT
Vegetation abundance LRAB 1.00 3.00 70.00Vegetation cover LRCO 1.00 3.00 70.00Species richness/diversity LRSR -2.00 2.00 80.00Species composition LRSC -3.00 1.00 100.00Vegetation structure LRST -2.00 1.00 100.00
Proportional change 38.10 4.00 420.00
UPPER RIPARIAN ZONE CODE DEGREE OF CHANGE RANKING OF METRICS % WEIGHT
Vegetation abundance URAB -2.00 2.00 80.00Vegetation cover URCO -2.00 2.00 80.00Species richness/diversity URSR -1.00 3.00 70.00Species composition URSC -1.00 1.00 100.00Vegetation structure URST -2.00 1.00 100.00
Proportional change 32.09 4.00 430.00
RIPARIAN VEGETATION PES (UP) METRIC GROUP
MET
RIC
G
RO
UP:
C
ALC
ULA
TED
C
ALC
ULA
TED
W
EIG
HT
WEI
GH
TED
SC
OR
E FO
R
GR
OU
P
RA
NK
OF
MET
RIC
GR
OU
P
% W
EIG
HT
FOR
M
ETR
IC G
RO
UP
MARGINAL ZONE 70.00 0.21 14.58 3.0 50.0LOWER ZONE 61.90 0.38 23.21 2.0 90.0UPPER ZONE 67.91 0.42 28.29 1.0 100.0
240.00Riparian vegetation PES score 66.09Riparian vegetation PES Category C
DWAF Report No. RDM X100-01-CON-COMPR2-0604 Komati River Catchment Ecological Water Requirements Study – Quantity Report
Page C - 61

AfriDev Consultants (Pty) Ltd 2005
Model 6c. SITE M1 (DOWN)
MARGINAL ZONE CODE DEGREE OF CHANGE RANKING OF METRICS % WEIGHT
Vegetation abundance MAB -2.00 1.00 100.00Vegetation cover MCO -2.00 1.00 100.00Species richness/diversity MSR -3.00 3.00 60.00Species composition MSC -2.00 2.00 70.00Vegetation structure MST -3.00 2.00 70.00
Proportional change 46.50 4.00 400.00
LOWER RIPARIAN ZONE CODE DEGREE OF CHANGE RANKING OF METRICS % WEIGHT
Vegetation abundance LRAB 3.00 3.00 70.00Vegetation cover LRCO 3.00 3.00 70.00Species richness/diversity LRSR -4.00 2.00 80.00Species composition LRSC -4.00 1.00 100.00Vegetation structure LRST -2.00 1.00 100.00
Proportional change 63.81 4.00 420.00
UPPER RIPARIAN ZONE CODE DEGREE OF CHANGE RANKING OF METRICS % WEIGHT
Vegetation abundance URAB -3.00 2.00 80.00Vegetation cover URCO -3.00 2.00 80.00Species richness/diversity URSR -3.00 3.00 70.00Species composition URSC -3.00 1.00 100.00Vegetation structure URST -4.00 1.00 100.00
Proportional change 64.65 4.00 430.00
RIPARIAN VEGETATION PES (DOWN) METRIC GROUP
MET
RIC
G
RO
UP:
C
ALC
ULA
TED
C
ALC
ULA
TED
W
EIG
HT
WEI
GH
TED
SC
OR
E FO
R
GR
OU
P
RA
NK
OF
MET
RIC
GR
OU
P
% W
EIG
HT
FOR
M
ETR
IC G
RO
UP
MARGINAL ZONE 53.50 0.21 11.15 3.0 50.0LOWER ZONE 36.19 0.38 13.57 2.0 90.0UPPER ZONE 35.35 0.42 14.73 1.0 100.0
240.00Riparian vegetation PES score 39.45Riparian vegetation PES Category E
DWAF Report No. RDM X100-01-CON-COMPR2-0604 Komati River Catchment Ecological Water Requirements Study – Quantity Report
Page C - 62

AfriDev Consultants (Pty) Ltd 2005
Model 7a. SITE L1 (PES)
MARGINAL ZONE CODE DEGREE OF CHANGE RANKING OF METRICS % WEIGHT
Vegetation abundance MAB 1.00 1.00 100.00Vegetation cover MCO 1.00 1.00 100.00Species richness/diversity MSR 1.00 3.00 60.00Species composition MSC -1.00 2.00 70.00Vegetation structure MST 1.00 2.00 70.00
Proportional change 20.00 4.00 400.00
LOWER RIPARIAN ZONE CODE DEGREE OF CHANGE RANKING OF METRICS % WEIGHT
Vegetation abundance LRAB 1.00 1.00 100.00Vegetation cover LRCO 1.00 1.00 100.00Species richness/diversity LRSR 1.00 3.00 60.00Species composition LRSC -1.00 2.00 70.00Vegetation structure LRST 1.00 2.00 70.00
Proportional change 20.00 4.00 400.00
UPPER RIPARIAN ZONE CODE DEGREE OF CHANGE RANKING OF METRICS % WEIGHT
Vegetation abundance URAB 1.00 2.00 80.00Vegetation cover URCO 1.00 2.00 80.00Species richness/diversity URSR -1.00 3.00 70.00Species composition URSC -2.00 1.00 100.00Vegetation structure URST -1.00 1.00 100.00
Proportional change 24.65 4.00 430.00
RIPARIAN VEGETATION PES METRIC GROUP
MET
RIC
G
RO
UP:
C
ALC
ULA
TED
C
ALC
ULA
TED
W
EIG
HT
WEI
GH
TED
SC
OR
E FO
R
GR
OU
P
RA
NK
OF
MET
RIC
GR
OU
P
% W
EIG
HT
FOR
M
ETR
IC G
RO
UP
MARGINAL ZONE 80.00 0.33 26.67 2.0 80.0LOWER ZONE 80.00 0.42 33.33 1.0 100.0UPPER ZONE 75.35 0.25 18.84 3.0 60.0
240.00Riparian vegetation PES score 78.84Riparian vegetation PES Category C
DWAF Report No. RDM X100-01-CON-COMPR2-0604 Komati River Catchment Ecological Water Requirements Study – Quantity Report
Page C - 63

AfriDev Consultants (Pty) Ltd 2005
ANNEX B. Vegetation profiles at EWR sites (Figures 1 – 7)
0
1
2
3
4
7
0 5 10 15 20 25 30 35 40 45 50
Distance across river (m)
Ele
vatio
n ab
ove
bed
(m)
Dio
spyr
os ly
cioi
des
Rhu
s ge
rra
nthe
eus
Va
b
ragm
ite
tia s
Cyp
erus
mar
gina
tus
Sauc
rona
Sal
ix m
ucro
nata
/ E
divi
no
Phra
gmite
s m
aurit
ian
forti
a s
haem
uic
ulat
um
ger
ra
Pite
pet
er
bon
ar
Isch
aem
liffo
rtia
ser
a
B1
B2
3
B5A
B4A
Combretum molleAloe marlothii
ZON
E 6
ZONE 5(LOWER RIPARIAN WITH
UPSLOPE SEEPAGE)
ZONE 0
Z NE 1(UPPER RIPARIAN)
ZONE 2(LOWER
ZONES 3 AND 4(MARGINAL)
k
5
6
rdii
itian
umci
cula
tum
Mis
ca
lix m
us ju
nc
ta erbe
n
Ph
Clif
for
onar
iens
is
s m
aur
trobi
lfera
um fa
s
ucle
a
umClif
rdiitro
bile
f
rum
trobi
lifer
hrag
m
a / I
sc
s / S
enna
Verb
ena
m fa
sc
sian
a
iens
is
Rhu
sC
B4
BB3/A
O
RIPARIAN)
Right ban
Left
bank
Figure 1. Site K1 (Gevonden) Vegetation profile
DWAF Report No. RDM X100-01-CON-COMPR2-0604 Komati River Catchment Ecological Water Requirements Study – Quantity Report
Page C - 64

AfriDev Consultants (Pty) Ltd 2005
DWAF Report No. RDM X100-01-CON-COMPR2-0604 Komati River Catchment Ecological Water Requirements Study – Quantity Report
Page C - 65
Index for Figure 1. Site K1 (Gevonden) Vegetation profile
No of Species %
Zone Vegetation community Morphology Substrate Texture A horizon
Rock cover
Veg cover Native Alien Invasion
0 Combretum molle - Aloe marlothii open woodland Hillslope Non-alluvium Loamy clay 70% bedrock
1 (UR) Rhus gerrardii - Diospyros lycioides open woodland Intermediate terrace Firm alluvium (B1) Slightly clayey,
siltified SAND 75% 23 1 4
2 (LR) Cliffortia strobilefera - Miscanthus junceus shrubby grassland
Annual flood bench Firm alluvium
(B2) Slightly clayey, silty crs/med/fin SAND with sub-round gravels
50% cobbles 80% 10 0 0
3 (MR) Cyperus marginatus - Miscanthus junceus sedgeland Sidebar Mud with cobbles
(B3A) Mottled slightly clayey, silty crs/med/fin SAND
5% boulders 85% 13 0 0
4 (MR) Salix mucronata - Phragmites mauritianum reedbank Sidebar Mud (B4A) Mottled fine sandy clayey SILT 75% 3 0 0
5 (LR) Iscaemum fasciculatum - Cliffortia strobilefera shrubby grassland
Annual flood bench Firm alluvium (B4) Clayey, silty
SAND 85% 12 1 8
6 Imperata cylindrica - Verbena bonariensis seepage wetland High terrace Firm alluvium Brown, loamy clay 85% 21 3 12
7 Acacia karoo woodland Hillslope Non-alluvium Sandy clay loam 85% 3 0 0
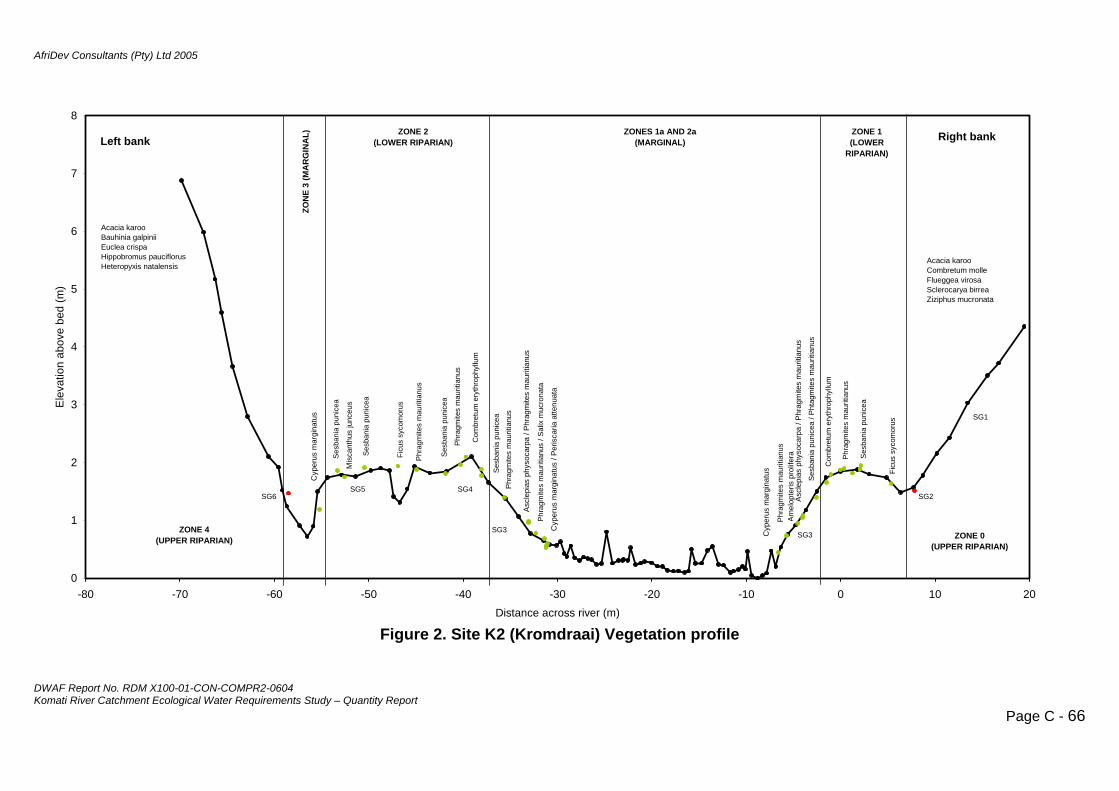
AfriDev Consultants (Pty) Ltd 2005
0
1
2
3
4
5
6
7
8
-80 -70 -60 -50 -40 -30 -20 -10 0 10 20
Distance across river (m)
Ele
vatio
n ab
ove
be)
d (m
Left bank
ZONE 0(UPPER RIPARIAN)
ZONE 1 (LOWER
RIAN)(LOWER RIPARIAN) (MARGINAL)
ON
AR
GIN
AL)
SG2
SG1
SG3
SG6
(UPPER RIPARIAN)
Ses
bani
a pu
nice
a
Ficu
s sy
com
orus
Ses
bani
a pu
nice
a
Ses
bani
a pu
htag
mite
s m
aurit
ianu
s
Ses
ban
icea
Phr
agm
ites
mau
ritia
nus
Com
bret
um e
ryth
roph
yllu
m
esia
nus
ZONE 2 ZONES 1a AND 2a
RIPA
ZE
3 (M
SG4SG5
ZONE 4
nice
a / P
ia p
un
Phr
agm
it m
aurit
Amel
opte
ris p
rolif
era
Ascl
epia
s ph
ysoc
ites
mau
ritia
nus
ar /
Peris
cen
uata
es
ianu
s / S
ucro
nata
arpa
/ Ph
ragm
Cyp
erus
m
Phr
agm
it
gina
tus
mau
rit
aria
att
alix
m
Asc
lepi
as p
hyso
carp
a / P
hrag
mite
s m
aurit
ianu
s
Phr
agm
ites
mau
s
Cum
ery
thro
phy
Ph
es m
aurit
ia
Phr
agm
ites
mau
ritia
nus
Ficu
s sy
com
orus
Ses
bani
a pu
nice
a
Ses
bani
a pu
nice
a
isca
nthu
ss
us m
argi
nat
ritia
nu
ombr
et
ragm
it
llum
nus
M
Cyp
er
junc
eu
us
AcaciCombr
a karooetu
Flueggea virosaSclerocarya birrea
hus mucr a
acia kBauhEuclea c
ppobrterop
Cyp
erus
mar
gina
tus
SG3
ank
m molle
Zizip onat
Ac arooinia galpinii
rispaomus pauciflorusyxis natalensis
HiHe
Right b
Figure 2. Site K2 (Kromdraai) Vegetation profile
DWAF Report No. RDM X100-01-CON-COMPR2-0604 Komati River Catchment Ecological Water Requirements Study – Quantity Report
Page C - 66
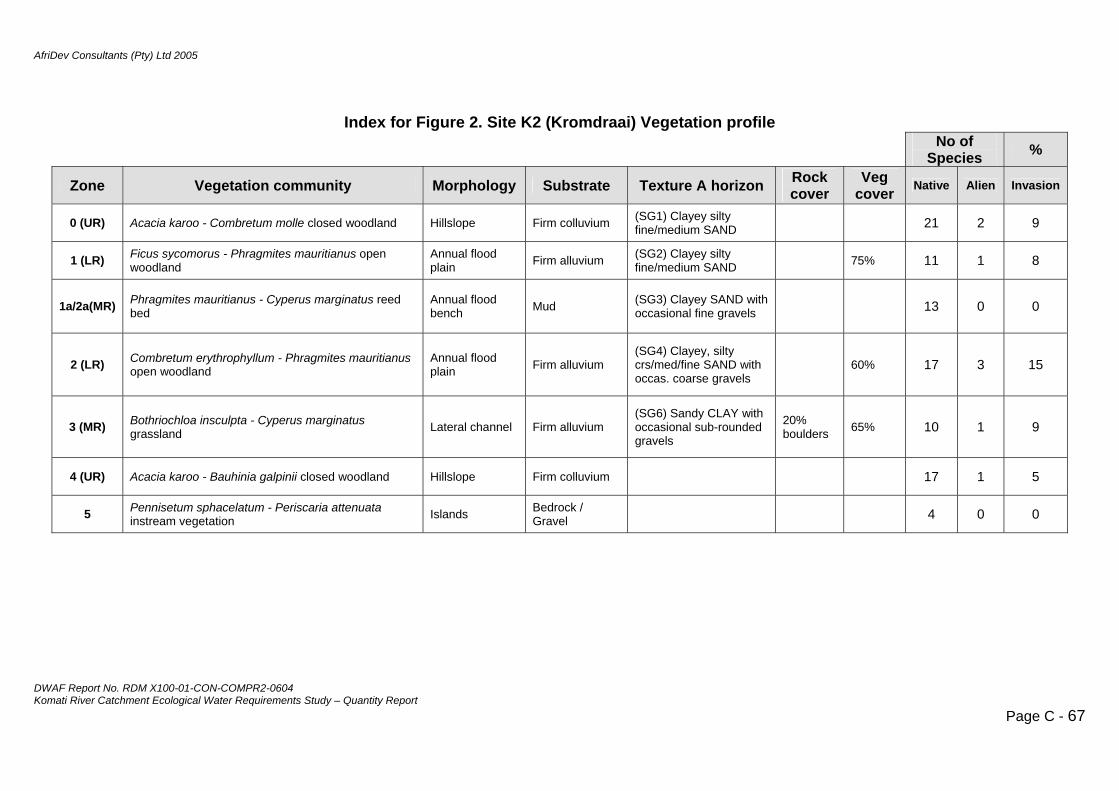
AfriDev Consultants (Pty) Ltd 2005
Index for Figure 2. Site K2 (Kromdraai) Vegetation profile
DWAF Report No. RDM X100-01-CON-COMPR2-0604 Komati River Catchment Ecological Water Requirements Study – Quantity Report
Page C - 67
No of Species %
Zone Vegetation community Morphology Substrate Texture A horizon Rock cover
Veg cover Native Alien Invasion
0 (UR) Acacia karoo - Combretum molle closed woodland Hillslope Firm colluvium (SG1) Clayey silty fine/medium SAND 21 2 9
1 (LR) Ficus sycomorus - Phragmites mauritianus open woodland
Annual flood plain Firm alluvium (SG2) Clayey silty
fine/medium SAND 75% 11 1 8
1a/2a(MR) Phragmites mauritianus - Cyperus marginatus reed bed
Annual flood bench Mud (SG3) Clayey SAND with
occasional fine gravels 13 0 0
2 (LR) Combretum erythrophyllum - Phragmites mauritianus open woodland
Annual flood plain Firm alluvium
(SG4) Clayey, silty crs/med/fine SAND with occas. coarse gravels
60% 17 3 15
3 (MR) Bothriochloa insculpta - Cyperus marginatus grassland Lateral channel Firm alluvium
(SG6) Sandy CLAY with occasional sub-rounded gravels
20% boulders 65% 10 1 9
4 (UR) Acacia karoo - Bauhinia galpinii closed woodland Hillslope Firm colluvium 17 1 5
5 Pennisetum sphacelatum - Periscaria attenuata instream vegetation Islands Bedrock /
Gravel 4 0 0
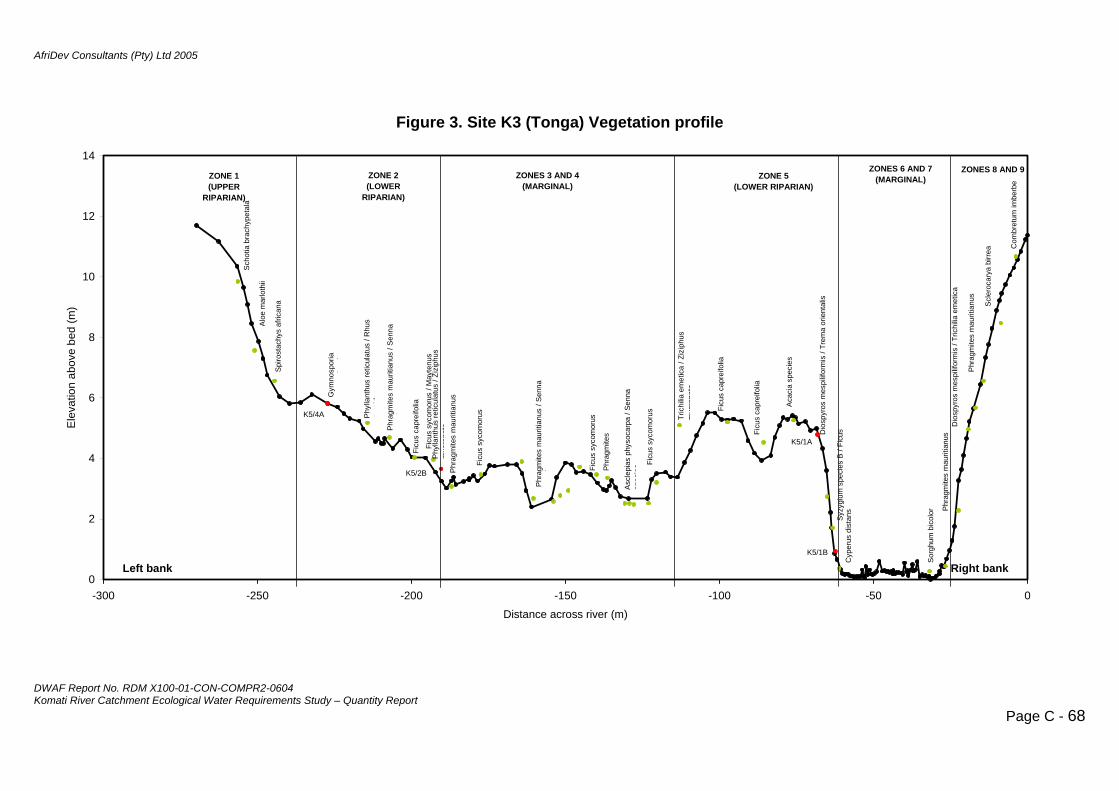
AfriDev Consultants (Pty) Ltd 2005
DWAF Report No. RDM X100-01-CON-COMPR2-0604 Komati River Catchment Ecological Water Requirements Study – Quantity Report
Page C - 68
Figure 3. Site K3 (Tonga) Vegetation profile
0
2
4
6
8
10
12
14
-300 -250 -200 -150 -100 -50 0
Distance across river (m)
Ele
vatio
n ab
ove
bed
(m)
Dio
spyr
os m
espi
lifor
mis
/ Tr
ema
orie
ntal
is
Syz
ygiu
m s
peci
es B
/ Fi
cus
Aca
cia
spec
ies
em
etus
Tr
ichi
liaic
a / Z
izip
hm
ucro
nata
Sor
ghum
bic
olor
Phr
agm
ites
mau
ritia
nus
Scl
eroc
arya
birr
ea
Dio
spyr
os m
espi
lifor
mis
/ Tr
ichi
lia e
met
ica
Com
b im
b
Ficu
s sy
com
orus
retu
mer
be
Asc
oa
lepi
as p
hys
carp
a / S
enn
spec
ies
Ficu
s ca
prei
folia
Cyp
erus
dis
tans
Phr
agm
ites
mau
ritia
nus
s ca
prei
fo
Pite
s
Ficu
lia
hrag
m iti
Ficu
s sy
es
com
orus
hrag
mit
mau
ren
na
Piti
anus
/ S
i
Ficu
s
hrag
mit
Phy
llant
hus
syc
omor
us
Pes
mau
rs
ulat
us /
Z
itian
u
retic
izip
hus
muc
rona
ta
Ficu
s s
rus
/ Ma
icus
clia
Phr
agm
ites
mau
ritia
nus
/ Sen
na
ycom
o
apre
ifo
yten
us
F
iPhy
llant
hus
reti
s / R
hus
cula
tup
roid
esGym
nosp
oria
l
i
Shy
s af
rican
api
rost
ac
Alo
e m
arlo
thii
chyp
eta
NES 8 AND 9ONES 6 (MARZO
ERZONES 3 AND 4
(MZONE 2(LOWER
RIPARIAN)
ZONE 1
K5/1B
K5/1A
Right bankLeft bank
Sch
otia
bra
al
ZOAND 7 ZGINAL)NE 5
RIPARIAN)(LOWARGINAL)(UPPER RIPARIAN)
K5/2B
K5/4A

AfriDev Consultants (Pty) Ltd 2005
Index for Figure 3. Site K3 (Tonga) Vegetation profile
DWAF Report No. RDM X100-01-CON-COMPR2-0604 Komati River Catchment Ecological Water Requirements Study – Quantity Report
Page C - 69
No of Species %
Zone Vegetation community Morphology Substrate Texture A horizon Rock cover
Veg cover Native Alien Invasion
1 (UR) Spirostachys africana - Aloe marlothii open woodland Hillslope Firm colluvium 50% 16 2 11
2 (LR) Gymnosporia senegalensis - Urochloa mosambicencis bushland High terrace Shallow sand (K5/4A) Fine sandy,
clayey SILT 75% 14 4 22
3&4 (MR) Ficus sycomorus - Phragmites mauritianus sparse reed bed Int. terrace/floodplain Loose sand
(K5/2B) Fine sandy, clayey SILT with occasional fine gravels
25% boulders / cobbles
40% 27 4 13
5 (LR) Ficus capreifolia - Phragmites mauritianus open shrubland High terrace Shallow sand (K5/1A) Clayey, silty,
fine SAND 40% 25 10 28
6&7 (MR) Phragmites mauritianus - Cyperus distans reed bed Annual flood bench Mud (K5/1B) Mottled clayey,
silty medium/fine SAND 30% boulders 65% 13 0 0
8 Ficus sycomorus - Panicum maximum open woodland Annual flood bench Firm alluvium (K5/1A) Clayey, silty,
fine SAND 70% 11 1 8
9 Sclerocarya birrea - Panicum maximum open woodland Hillslope Firm colluvium 35% 15 0 0
10 Phragmites mauritianus - Sorgum bicolor instream vegetation Islands Bedrock /
Gravel 3 0 0
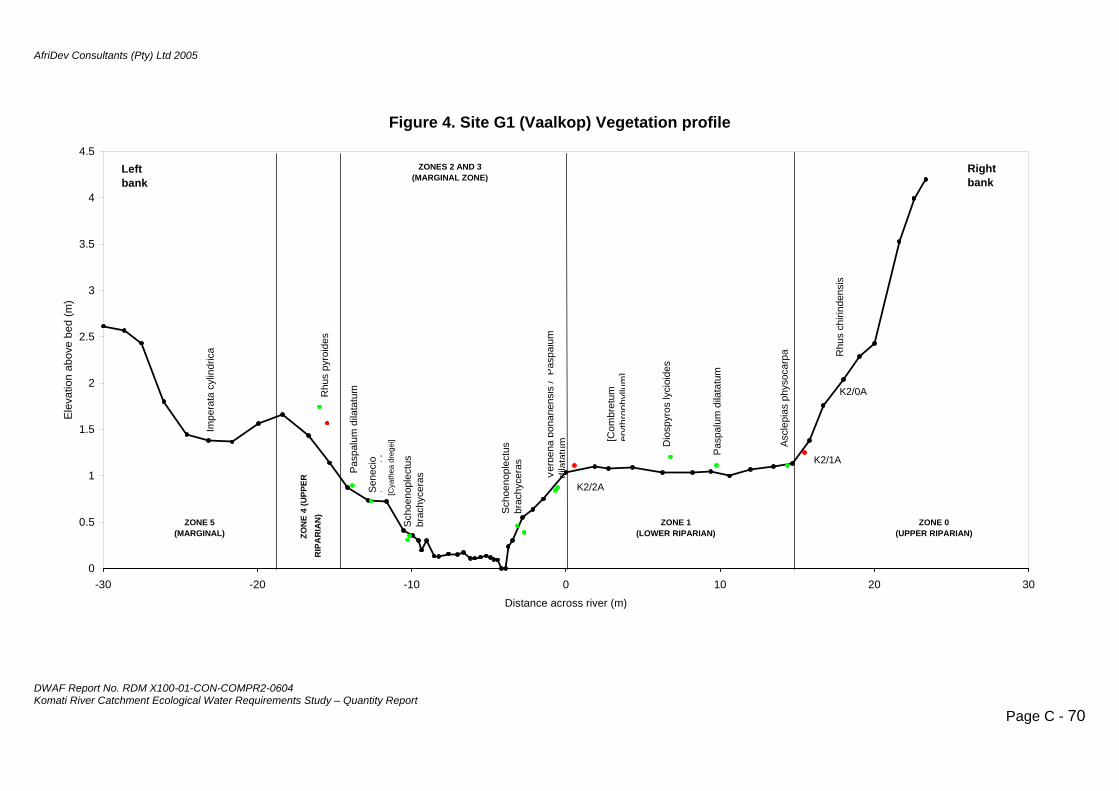
AfriDev Consultants (Pty) Ltd 2005
Figure 4. Site G1 (Vaalkop) Vegetation profile
0
0.5
1
1.5
2ion
a
2.5
ed (m
3
3.5
4
4.5
-30 -20 -10 0 10 20 30Distance across river (m)
Elev
atbo
ve b
)
Rhu
Pasp
alum
dila
tatu
m
Sen
ecio
s py
roid
es
iid
Sch
oeno
plec
tus
brac
hyce
ras
Sch
oeno
plec
tus
brac
hyce
ras
Ver
bena
bon
arie
nsis
/ P
aspa
lum
di
lata
tum D
iosp
yros
lyci
o
palu
m d
ilata
tides
umP
as Ascl
epia
s ph
ysoc
arpa
ata
cylin
dric
a Rhu
s c
Impe
r
hirin
dens
is
ZONE 1(LOWER RIPARIAN)
ZONES 2 AND 3(MARGINAL ZONE)
ZON
E 4
(UPP
ERR
IPA
RIA
N)
ZONE 5(MARGINAL)
K2/2A
K2/1A
K2/0A
[Com
bret
um
eryt
hrop
hyllu
m]
Left bank
ght
ZONE 0(UPPER RIPARIAN)
[Cya
thea
dre
gei]
Ribank
DWAF Report No. RDM X100-01-CON-COMPR2-0604 Komati River Catchment Ecological Water Requirements Study – Quantity Report
Page C - 70

AfriDev Consultants (Pty) Ltd 2005
DWAF Report No. RDM X100-01-CON-COMPR2-0604 Komati River Catchment Ecological Water Requirements Study – Quantity Report
Page C - 71
Index for Figure 4. Site G1 (Vaalkop) Vegetation profile
No of
Species %
Zone Vegetation community Morphology Substrate Texture A horizon Rock cover
Veg cover Native Alien Invasion
0 (UR) Rhus chirindensis - Diospyros lycioides open colluvium 13 2 13 woodland Hillslope Firm (K2 0/A) Slightly clayey, silty SAND with occasional fine gravels
1 (LR) Diospyros lycioides - Paspalum dilatatum disturbed shrubland Annual flood plain (K2 1/A) Slightly clayey,
silty medium/fine SAND Firm alluvium 25%
boulder 50% 9 3 25
2 (MR) Paspalum dilatatum - Schoenoplectus brachyceras grassland
Annual flood bench
Loose sand / (K2 2/A) Silty coarse/medium/fine SAND on clay
Mud 70% 5 0 0
3 (MR) Paspalum dilatatum - Schoenoplectus brachyceras grassland
Annual flood bench
Loose sand / (K2 2/A) Silty coarse/medium/fine SAND on clay
Mud 75% 7 0 0
4 (UR) Rhus pyroides var. gracilis - Diospyros lycioides Intermediate (K2 1/A) Slightly clayey, silty medium/fine SAND open woodland terrace Firm alluvium
35% boulder /cobble
55% 14 3 18
5 (MR) Imperata cylindrica grassland Lateral channel (K2 2/A) Silty
% 7 0 0 Loose sand coarse/medium/fine SAND
70

AfriDev Consultants (Pty) Ltd 2005
Figure 5. Site T1 (Teespruit) Vegetation profile
0
0.5
1
1.5
2
2.5
3
3.5
4
4.5
-40 -35 -30 -25 -20 -15 -10 -5 0 5
Distance across river (m)
Ele
vatio
n ab
ove
bed
(m)
TS1
Scho
enop
lect
us b
rach
ycer
as
Com
bret
um e
ryth
roph
yllu
m
Phra
gmite
s m
aurit
ianu
s
Asc
lepi
as
phys
ocar
pa
Salix
m
ucro
nata
Asc
lepi
as
phys
ocar
pa
Phr
agm
ites
mau
ritia
nus
Ses
bani
a se
sban
Phr
agm
ites
mau
ritia
nus
Mor
ella
ser
rata
Ses
bani
a pu
nice
a
Phr
agm
ites
mau
ritia
nus
Die
tes
iridi
oide
s
Com
bret
um e
ryth
roph
yllu
mC
atha
edu
lis
Com
bret
um e
ryth
roph
yllu
m
Phr
agm
ites
mau
ritia
nus
Mis
cant
hus
junc
eus
Phra
gmite
s m
aurit
ianu
s
Mis
cant
hus
junc
eus
TS2
Sal
ix
muc
rona
ta
Mor
ella
ser
rata
Right bank
ZONE 0(UPPER
RIPARIAN)
ZONE 1 (LOWER RIPARIAN)
ZONE 2 (MARGINAL)
ZONE 3(LOWER
RIPARIAN)ZON
E 4
(MA
RG
INA
L)
ZONE 5(UPPER
RIPARIAN)
Left bank
DWAF Report No. RDM X100-01-CON-COMPR2-0604 Komati River Catchment Ecological Water Requirements Study – Quantity Report
Page C - 72
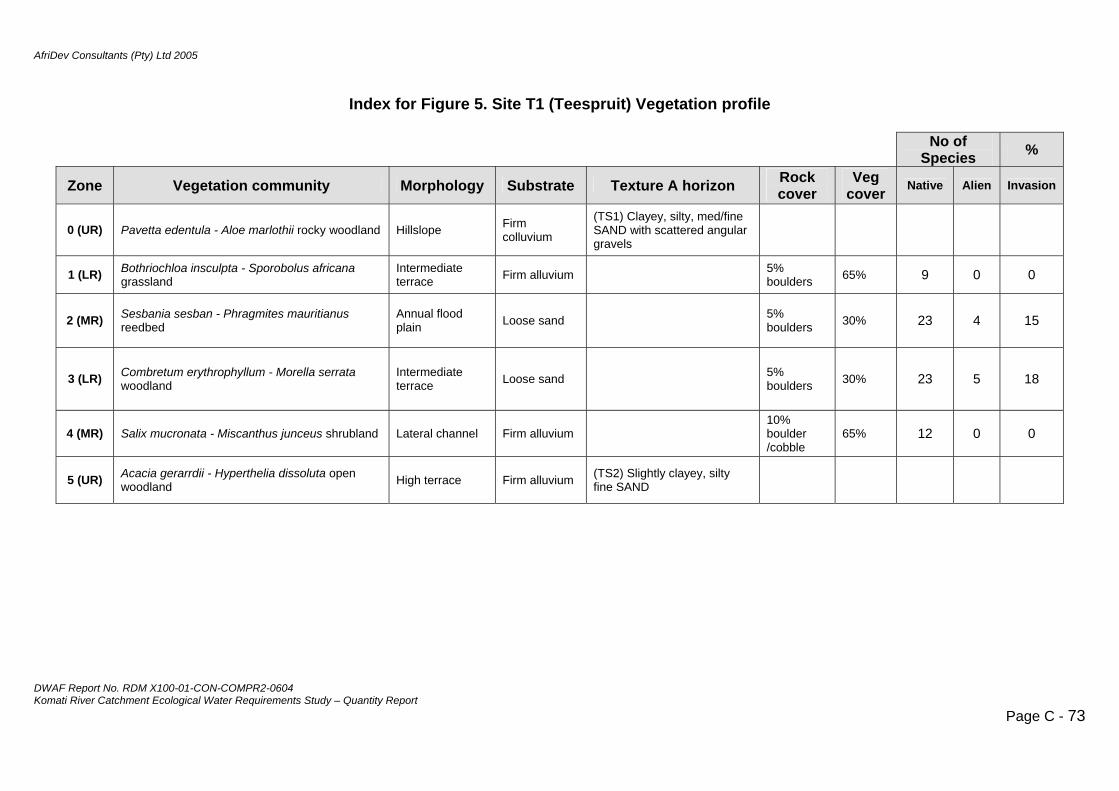
AfriDev Consultants (Pty) Ltd 2005
DWAF Report No. RDM X100-01-CON-COMPR2-0604 Komati River Catchment Ecological Water Requirements Study – Quantity Report
Page C - 73
Index for Figure 5. Site T1 (Teespruit) Vegetation profile
No of Species %
Zone Vegetation community Morphology Substrate Texture A horizon Rock cover
Veg cover Native Alien Invasion
0 (UR) Pavetta edentula - Aloe marlothii rocky woodland (TS1) Clayey, silty, med/fine
ered angular gravels
Hillslope Firm colluvium SAND with scatt
1 (LR) Bothriochloa insculpta - Sporobolus afgrassland
ricana terrace vium 0 Intermediate Firm allu 5%
boulders 65% 9 0
2 (MR) Sesbania sesban - Phragmites mauritianus reedbed 23 4 15 Annual flood
plain Loose sand 5% boulders 30%
3 (LR) llum - Morella serrata woodland
ate terrace Loose sand 5%
ers 30% 23 5 18 Combretum erythrophy Intermedibould
4 (MR) Salix mucronata - Miscanthus junceus shrubland Lateral channel Firm alluvium obble
65% 12 0 0 10% boulder /c
5 (UR) Acacia gerarrdii - Hyperthelia dissoluta opwoodland
en High terrace Firm alluvium (TS2) Slightly clayey, siltyfine SAND

AfriDev Consultants (Pty) Ltd 2005
DWAF Report No. RDM X100-01-CON-COMPR2-0604 Komati River Catchment Ecological Water Requirements Study – Quantity Report
Page C - 74
Figure 6. Site L1 (Kleindoringkop) Vegetation profile
0
1
2
3
4
5
6
7
8
9
-50 -30 -10 10 30 50Distance across river (m)
Ele
vatio
n ab
ove
bed
(m)
Right banLeft bank
ZONE 0 (UPPER RIPARIAN)
ZONE 1(LOWER RIPARIAN)
ZONE 5(LOWER
ZONE 6(UPPER
RIPARIAN)
Ficu
s s
kRIPARIAN)
ycom
orus
LOM3
Cyp
erus
dist
ans
Dio
spy
divi
noru
m
Nux
ia o
ros
mes
pilif
orm
is /
Eucl
ea
ppos
itifo
lia
May
tenu
s he
tero
phyl
la
Typh
a ca
pens
is
Breo
nadi
a sa
licin
a
Phr
agm
ites
mau
ritia
nus
/ Ses
bani
a se
sban
Isch
aem
um fa
scic
ulat
um
Syz
ygiu
m c
orda
tum
Phra
gmite
s m
aurit
ianu
s
Isch
aem
um fa
scic
ulat
um
Ses
bani
a se
sban
Bre
onad
ia
salic
ina
Syzy
gium
cf.
guin
eens
e (s
p. B
)
Cyp
erus
di
stan
s
Kra
ussi
a flo
ribun
da /
Nux
ia
oppo
sitif
olia
LOM2
May
tenu
s he
tero
phyl
la
Syz
ygiu
m c
f. gu
inee
nse
(sp.
B)
Dio
spyr
os
mes
pilif
orm
is
Syz
ygiu
m c
f. gu
inee
nse
(sp.
B)
Age
ratu
m
hous
tianu
m
Syz
ygiu
m c
f. gu
inee
nse
(sp.
B)
LOM1
Nux
ia
oppo
sitif
olia
Syz
ygiu
m c
f. gu
inee
nse
(sp.
B)
ZONES 2, 3 AND 4(MARGINAL)
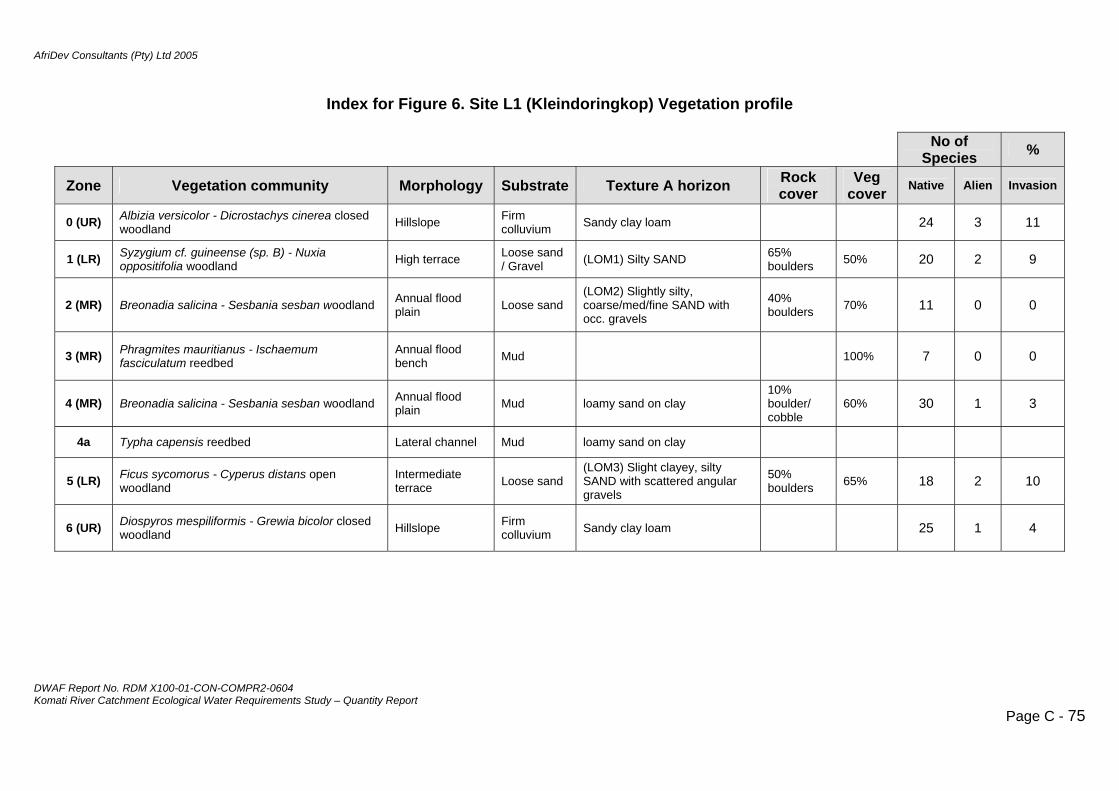
5
X100-01-CON-COMPR2-0604 Komati River Catchment Ecological Water Requirements Study – Quantity Report
Page C - 75
tion profile
o. RDM
Index for Figure 6. Site L1 (Kleindoringkop) Vegeta
No of Species %
Zone Vegetation community Morpho gy lo S bstratu e Texture A horizon Rock cover
Veg cover Native Alien Invasion
0 (U icolor - Dicrostachys cinerea closed slope ium Sandy loam 24 3 11 R) Albizia verswoodland Hill Firm
colluv clay
1 (L e (sp. B) - Nuxia land h terrac e sand
/ avel (LOM1) Silty SA 65% boulders 50% 20 2 9 R) Syzygium cf. gui
oppositifolia woodneens Hig e Loos
G
r ND
2 (M ina - Sesbania sesban woodland al flon e sand
(LOM2) Slightly s y, coarse ed/fine SAND with occ.
40% boulders 70% 11 0 0 R) Breonadia salic Annu od
plai Loos ilt
/m gravels
3 (M aemum bed
al floch 100% 7 0 0 R) Phragmites mauritianus - Isch
fasciculatum reedAnnu od ben Mud
4 (M Sesbania sesban woodland ual flon loamy nd on cl
10% boulder/ cobble
60% 30 1 3 R) Breonadia salicina - Annplai
od Mud sa ay
4a reedbed eral ch el loamy nd on cl Typha capensis Lat ann Mud sa ay
5 (L orus - Cyperus distans open rmediaace e sand
ht cla y, silty SAND th scatte d angulagravel
50% boulders 65% 18 2 10 R) Ficus sycom
woodland Inte te terr Loos
(LOM3) Slig yewi re r
s
6 (U piliformis - Grewia bicolor closed lope ium Sandy loam 25 1 4 clayFirm colluvHills
AfriDev Consultants (Pty) Ltd 200
DWAF Report N
R) woodland Diospyros mes
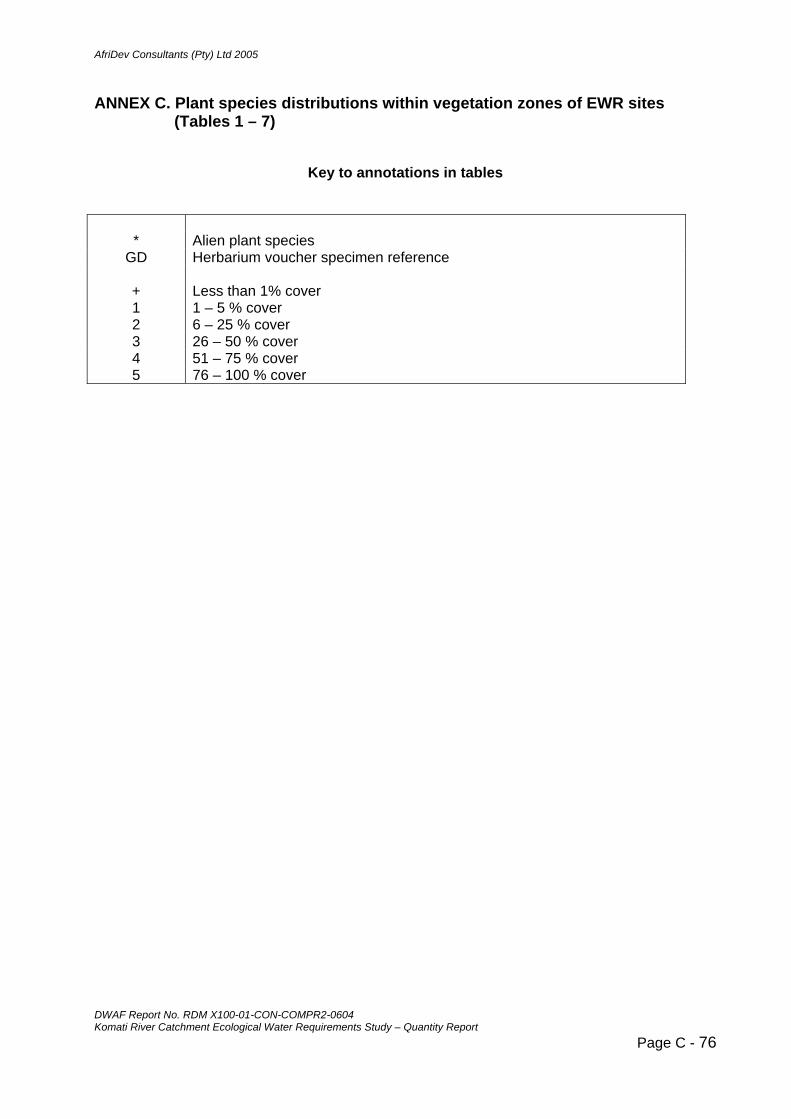
AfriDev Consultants (Pty) Ltd 2005
K ort Page C - 76
ANNEX C. Plant species distributions within vegetation zones of EWR sites (Tables 1 – 7)
Key to annotations in tables
DWAF Report Nom
o. RDtchm
Men
X100t Ec
-01olog
-CON-Cical
Oter
MPR2Req
-0604 uireati River Ca Wa ments Study – Quantity Rep
* Alien plant species GD Herbarium voucher specimen reference
+ Less than 1% cover 1 1 – 5 % cover 2 6 – 25 % cover 3 26 – 50 % cover 4 51 – 75 % cover 5 76 – 100 % cover
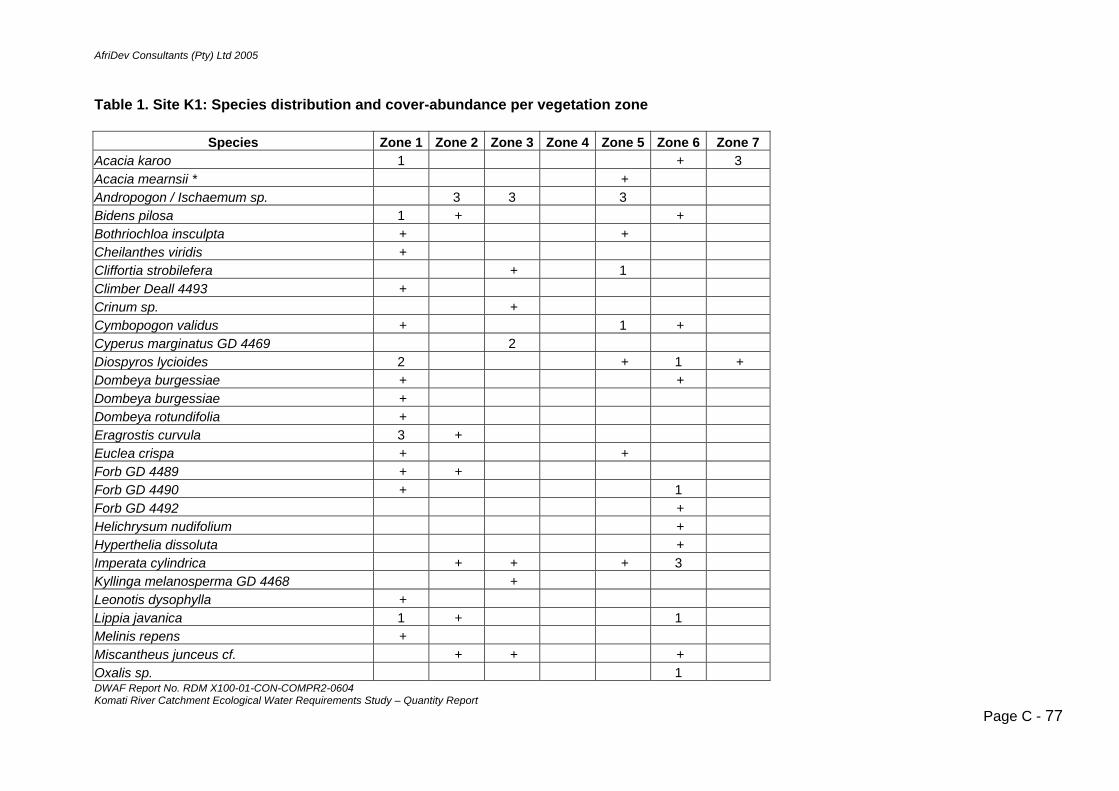
AfriDev Consultants (Pty) Ltd 2005
DWAF Report No. RDM X100-01-CON-COMPR2-0604 Komati River Catchment Ecological Water Requirements Study – Quantity Report
Page C - 77
Spe Zone 1
Table 1. Site K1: Species distribution and cover-abundance per vegetation zone
cies Zone 2 Zone 3 Zone 4 Zone 5 Zone 6 Zone 7 Acacia karoo 1 + 3 Acacia mearnsii * + Andropogon / Ischaemum sp. 3 3 3 Bidens pilosa 1 + + Bothriochloa insculpta + + Cheilanthes viridis + Cliffortia strobilefera + 1 Climber Deall 4493 + Crinum sp. + Cymbopogon validus + + 1 Cyperus marginatus GD 4469 2 Diospyros lycioides 2 1 + + Dombeya burgessiae + + Dombeya burgessiae + Dombeya rotundifolia + Eragrostis curvula 3 + Euclea crispa + + Forb GD 4489 + + Forb GD 4490 + 1 Forb GD 4492 + Helichrysum nudifolium + Hyperthelia dissoluta + Imperata cylindrica 3 + + + Kyllinga melanosperma GD 4468 + Leonotis dysophylla + Lippia javanica 1 + 1 Melinis repens + Miscantheus junceus cf. + + + Oxalis sp. 1

AfriDev Consultants (Pty) Ltd 2005
DWAF Report No. RDM X100-01-CON-COMPR2-0604 Komati River Catchment Ecological Water Requirements Study – Quantity Report
Page C - 78
1 + Panicum maximum + Paspalum dilatatum + Pennisetum sphacelatum + + Periscaria attenuata ssp. africana + + Phragmites mauritianum + 2 1 + Rhus chirindensis 1 + Rhus gerarrdii 3 1 Salix mucronata + 3 Schoenoplectus brachyceras GD 4480 + + + Senecio cf. conrathii + Solanum mauritianum * + Solanum sp. + + Solanum sysimbrifolium * + Spermacoce natalensis + Sporobolus africana + + Tagetes minuta * + Themeda triandra 1 Vangueria infausta + Verbena bonariensis 1 + + Xanthium strumarium * +
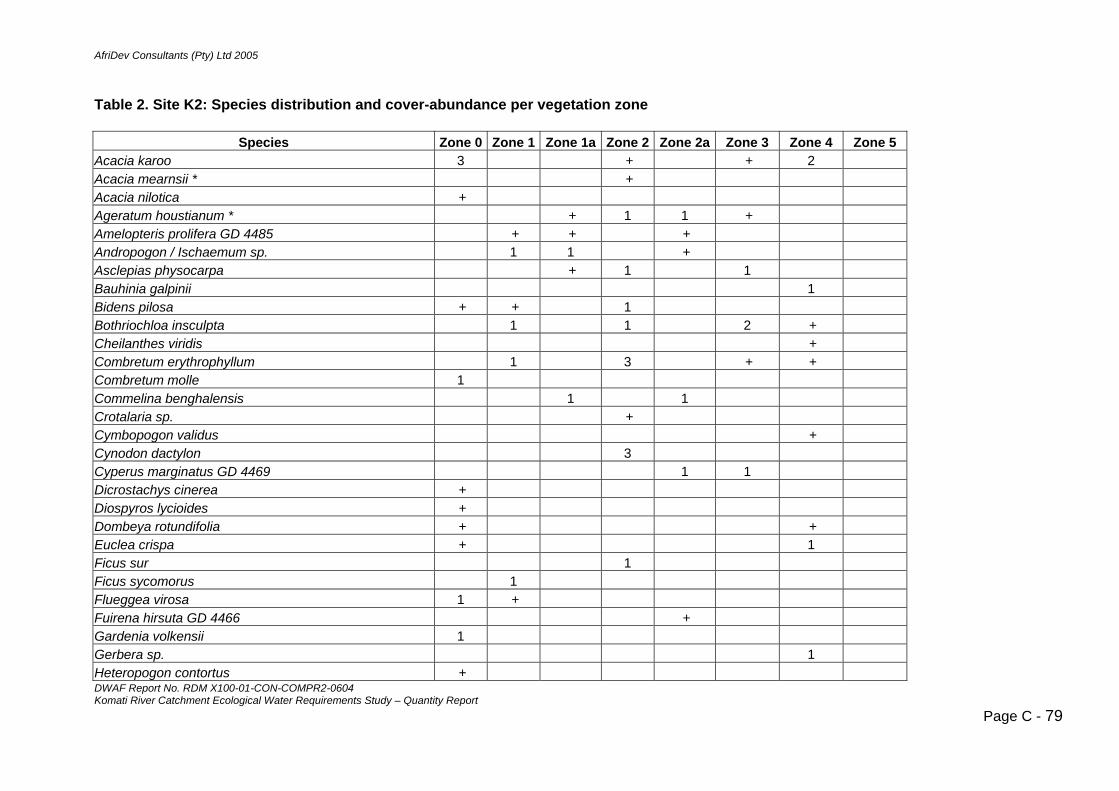
AfriDev Consultants (Pty) Ltd 2005
DWAF Report No. RDM X100-01-CON-COMPR2-0604 Komati River Catchment Ecological Water Requirements Study – Quantity Report
Page C - 79
Table 2. Site K2: Species distribution and cover-abundance per vegetation zone
Species Zone 0 Zone 1 Zone 1a Zone 2 Zone 2a Zone 3 Zone 4 Zone 5Acacia karoo 3 + + 2 Acacia mearnsii * + Acacia nilotica + Ageratum houstianum * + 1 1 + Amelopteris prolifera GD 4485 + + + Andropogon / Ischaemum sp. 1 1 + Asclepias physocarpa + 1 1 Bauhinia galpinii 1 Bidens pilosa + + 1 Bothriochloa insculpta 1 1 2 + Cheilanthes viridis + Combretum erythrophyllum 1 3 + + Combretum molle 1 Commelina benghalensis 1 1 Crotalaria sp. + Cymbopogon validus + Cynodon dactylon 3 Cyperus marginatus GD 4469 1 1 Dicrostachys cinerea + Diospyros lycioides + Dombeya rotundifolia + + Euclea crispa + 1 Ficus sur 1 Ficus sycomorus 1 Flueggea virosa 1 + Fuirena hirsuta GD 4466 + Gardenia volkensii 1 Gerbera sp. 1 Heteropogon contortus +
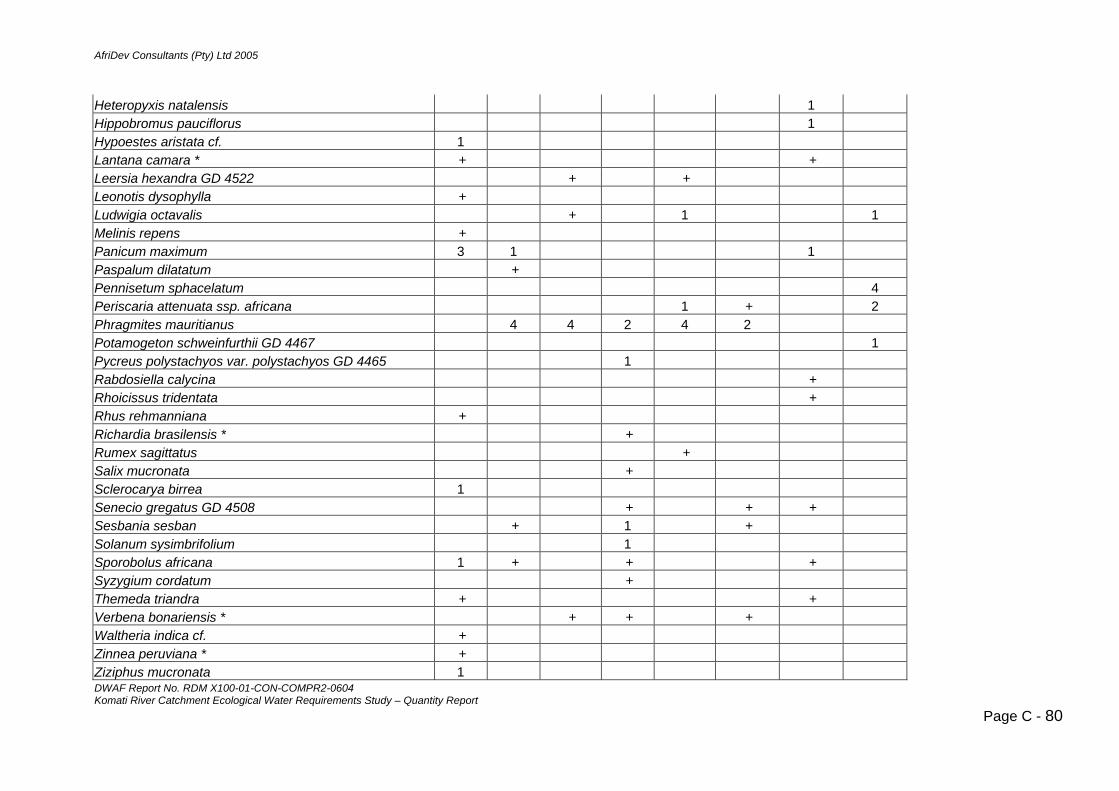
AfriDev Consultants (Pty) Ltd 2005
DWAF Report No. RDM X100-01-CON-COMPR2-0604 Komati River Catchment Ecological Water Requirements Study – Quantity Report
Page C - 80
Heteropyxis natalensis 1 Hippobromus pauciflorus 1 Hypoestes aristata cf. 1 Lantana camara * + + Leersia hexandra GD 4522 + + Leonotis dysophylla + Ludwigia octavalis + 1 1Melinis repens + Panicum maximum 3 1 1 Paspalum dilatatum + Pennisetum sphacelatum 4Periscaria attenuata ssp. africana 1 + 2Phragmites mauritianus 4 2 4 2 4 Potamogeton schweinfurthii GD 4467 1Pycreus polystachyos var. polystachyos GD 4465 1 Rabdosiella calycina + Rhoicissus tridentata + Rhus rehmanniana + Richardia brasilensis * + Rumex sagittatus + Salix mucronata + Sclerocarya birrea 1 Senecio gregatus GD 4508 + + + Sesbania sesban + 1 + Solanum sysimbrifolium 1 Sporobolus africana 1 + + + Syzygium cordatum + Themeda triandra + + Verbena bonariensis * + + + Waltheria indica cf. + Zinnea peruviana * + Ziziphus mucronata 1

AfriDev Consultants (Pty) Ltd 2005
DWAF Report No. RDM X100-01-CON-COMPR2-0604
ecies distribution and cover-a nda per geta n zon
Species
Table 3. Site K3: Sp bu nce ve tio e
Zone 1 Zone 2 Zone 3 Zone 4 Zone 5a Zone 5b Zone 6 Zone 7 Zone 8 Zone 9 Zone 10 Abutilon sonneratianum cf. + Acacia robusta + Acanthospermum hispidum GD 4500 + Aloe marlothii + Amelopteris prolifera GD 4497 + Ammaria senegalensis GD 4494 + Asclepias physocarpa + Barleria sp. 1 Berchemia discolor + Bidens pilosa + + Bulbostylis hispidula GD 4478 + Centella asiatica GD 4501 1 Ceratotheca triloba 1 + Chloris gayana GD 4524 + Clerodendrum glabrum + Combretum imberbe + Commelina benghalensis + 3 + + Crotalaria sp. + Cynodon dactylon 1 3 Cyperus articulatus GD 4475 + + + + Cyperus distans GD 4477 + + + + + Dactyloctenium aegyptium + + Dalbergia armata + Deinbollia oblongifolia + Dicrostachys cinerea + + Diospyros mespiliformis 1 1 1 Echinochloa ugandensis GD 4521? 2 + Eragrostis ciliaris GD 4520 + Eragrostis curvula +
Komati River Catchment Ecological Water Requirements Study – Quantity Report Page C - 81
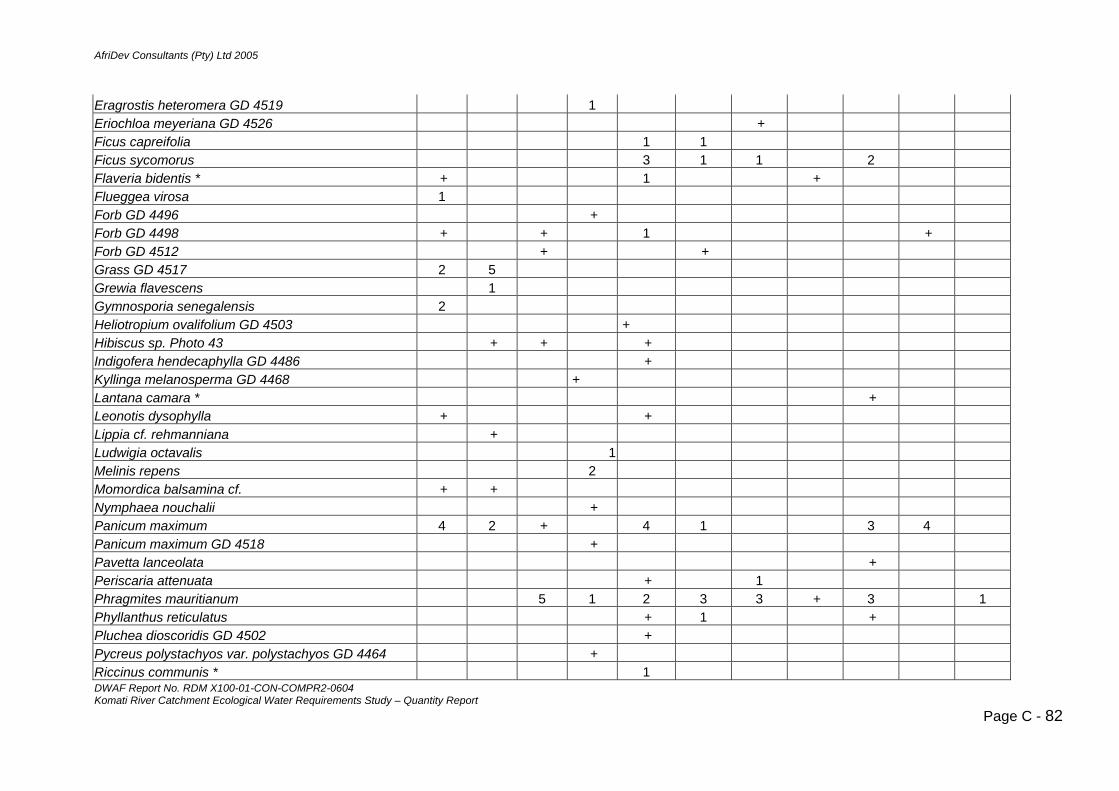
AfriDev Consultants (Pty) Ltd 2005
DWAF Report No. RDM X100-01-CON-COMPR2-0604 Komati River Catchment Ecological Water Requirements Study – Quantity Report
Page C - 82
Eragrostis heteromera GD 4519 1 Eriochloa meyeriana GD 4526 + Ficus capreifolia 1 1 Ficus sycomorus 1 2 3 1 Flaveria bidentis * + 1 + Flueggea virosa 1 Forb GD 4496 + Forb GD 4498 + + 1 + Forb GD 4512 + + Grass GD 4517 2 5 Grewia flavescens 1 Gymnosporia senegalensis 2 Heliotropium ovalifolium GD 4503 + Hibiscus sp. Photo 43 + + + Indigofera hendecaphylla GD 4486 + Kyllinga melanosperma GD 4468 + Lantana camara * + Leonotis dysophylla + + Lippia cf. rehmanniana + Ludwigia octavalis 1 Melinis repens 2 Momordica balsamina cf. + + Nymphaea nouchalii + Panicum maximum 4 2 + 4 1 3 4 Panicum maximum GD 4518 + Pavetta lanceolata + Periscaria attenuata + 1 Phragmites mauritianum 5 1 2 3 3 + 3 1 Phyllanthus reticulatus + 1 + Pluchea dioscoridis GD 4502 + Pycreus polystachyos var. polystachyos GD 4464 + Riccinus communis * 1

AfriDev Consultants (Pty) Ltd 2005
DWAF Report No. RDM X100-01-CON-COMPR2-0604
is * + + + Richardia brasilensSchotia brachypetala 1 + Sclerocary birrea 1 Senna bicapsularis * 2 Senna occidentalis * + + Sesbania bispinosa * 1 Sesbania punicea * + 1 + Sesbania sesban Shrub Photo 40 Vitaceae? + Solanum sisymbrifolium * + + 1 Sorgum bicolor ssp. arundinaceum GD 4516 + 1 4 + + Spirostachys africana 2 Sporobolus africana + + Sysygium cf. guineense (Sp. B) 1 + Tephrosia cf. rhodesica + Tithonia diversifolia * + Tragus bertoniana + Trema orientalis 1 Trichilia emetica + Tridax procumbens GD 4495 + Triumfetta sp. + + Typha capensis 2 Urochloa mosambicensis GD 4517 2 2 Vernonia glabra GD 4499 + Waltheria indica cf. + + + Withania somnifera cf. + + Xanthium strumarium * + 1 Zea mays * 4
Komati River Catchment Ecological Water Requirements Study – Quantity Report Page C - 83
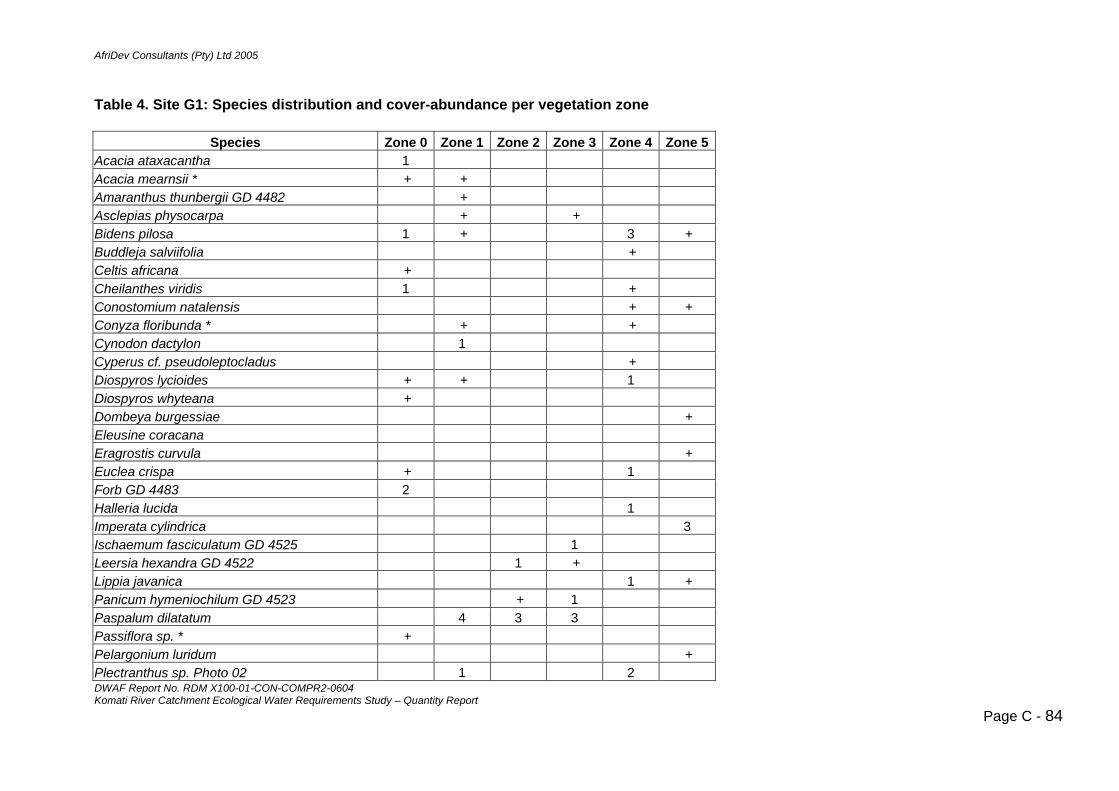
AfriDev Consultants (Pty) Ltd 2005
DWAF Report No. RDM X100-01-CON-COMPR2-0604 Komati River Catchment Ecological Water Requirements Study – Quantity Report
Page C - 84
Spe Zone 0 Zone 5
Table 4. Site G1: Species distribution and cover-abundance per vegetation zone
cies Zone 1 Zone 2 Zone 3 Zone 4Acacia ataxacantha 1 Acacia mearnsii * + + Amaranthus thunbergii GD 4482 + Asclepias physocarpa + + Bidens pilosa 1 + + 3Buddleja salviifolia +Celtis africana + Cheilanthes viridis 1 +Conostomium natalensis + +Conyza floribunda * + +Cynodon dactylon 1 Cyperus cf. pseudoleptocladus +Diospyros lycioides + + 1Diospyros whyteana + Dombeya burgessiae + Eleusine coracana Eragrostis curvula + Euclea crispa + 1Forb GD 4483 2 Halleria lucida 1Imperata cylindrica 3 Ischaemum fasciculatum GD 4525 1 Leersia hexandra GD 4522 1 + Lippia javanica + 1Panicum hymeniochilum GD 4523 + 1 Paspalum dilatatum 4 3 3 Passiflora sp. * + Pelargonium luridum + Plectranthus sp. Photo 02 1 2

AfriDev Consultants (Pty) Ltd 2005
DWAF Report No. RDM X100-01-CON-COMPR2-0604 Komati River Catchment Ecological Water Requirements Study – Quantity Report
Page C - 85
3 Rhus chirindensis Rhus pyroides var. gracilis 2Rubus sp. * +Rumex sagittatus + +Schoenoplectus brachyceras GD 4480 2 1 Senecio cf. tamoides +Senecio inaequidens GD 4507 + Senecio sp. + Setaria megaphylla 1 + 1Solanum mauritianum * + +Solanum sp. + Sporobolus africana Verbena bonariensis + Ziziphus mucronata +
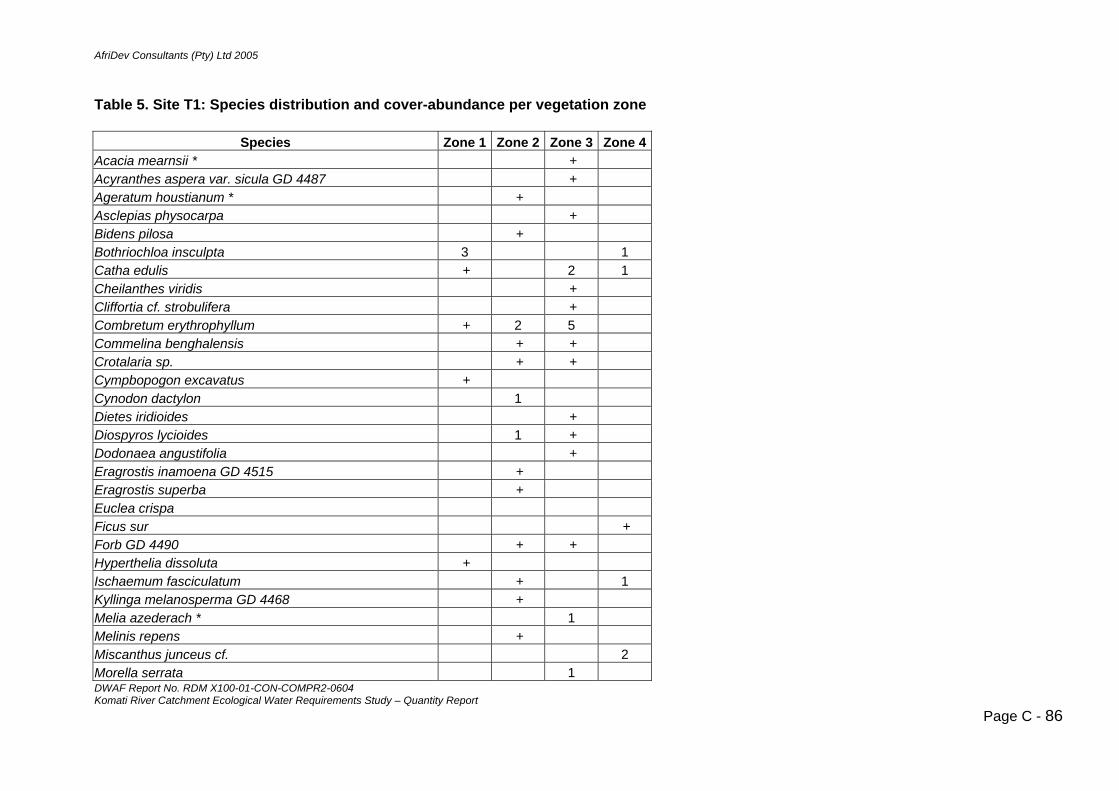
AfriDev Consultants (Pty) Ltd 2005
DWAF Report No. RDM X100-01-CON-COMPR2-0604 Komati River Catchment Ecological Water Requirements Study – Quantity Report
Page C - 86
vegeta on zone
Species n
Table 5. Site T1: Species distribution and cover-abundance pe
r ti
Zo e 1 Zone 2 Zone 3 Zone 4Acacia mearnsii * + Acyranthes aspera var. sicula GD 448 + 7 Ageratum houstianum * + Asclepias physocarpa + Bidens pilosa + Bothriochloa insculpta 3 1Catha edulis + 2 1Cheilanthes viridis + Cliffortia cf. strobulifera + Combretum erythrophyllum + 2 5 Commelina benghalensis + + Crotalaria sp. + + Cympbopogon excavatus + Cynodon dactylon 1 Dietes iridioides + Diospyros lycioides 1 + Dodonaea angustifolia + Eragrostis inamoena GD 4515 + Eragrostis superba + Euclea crispa Ficus sur +Forb GD 4490 + + Hyperthelia dissoluta + Ischaemum fasciculatum + 1 Kyllinga melanosperma GD 4468 + Melia azederach * 1 Melinis repens + Miscanthus junceus cf. 2 Morella serrata 1

AfriDev Consultants (Pty) Ltd 2005
DWAF Report No. RDM X100-01-CON-COMPR2-0604 Komati River Catchment Ecological Water Requirements Study – Quantity Report
Page C - 87
Panicum maximum 1 1 1 Paspalum dilatatum + + Pennisetum sphacelatum + + 1 Periscaria attenuata ssp. africana + + + Phragmites mauritianum 3 + 1 Pycreus polystachyos var. polystachyos GD 4465 + Richardia brasilensis * + + Salix mucronata 1 + 2 Schoenoplectus brachyceras GD 4480 + Senecio gregatus GD 4508 + Senecio sp. + Senna occidentalis * + + Sesbania punicea * 1 Sesbania sesban 2 1 Solanum sisymbrifolium * + Sporobolus africana 1 + 1 Tagetes minuta * + Themeda triandra + + Triumfetta sp. + Vangueria infausta + Vitex obovata +

AfriDev Consultants (Pty) Ltd 2005
DWAF Report No. RDM X100-01-CON-COMPR2-0604 Komati River Catchment Ecological Water Requirements Study – Quantity Report
Page C - 88
Table 6. Site M1: Species distribution per vegetation zone
Species Zone 1 Zone 2 Zone 3 Zone 4 Zone 5 Zone 6 Zone 7 Acacia karoo x Acacia sp. x Albizia versicolor x Antidesma venosum x Asclepias physocarpa x x Bauhinia galpinii x Berchemia zeyheri x Breonadia salicina x Bridelia micrantha x Caeselpinia decapetala x Celtis africana x x x Chromalaena odorata * x x x x Clerodendrum glabrum x Dicrostachys cinerea x Dombeya rotundifolia x x Erythrina lysistemon x Ficus capreifolia x Ficus sur x Flueggea virosa x Gymnosporia senegalensis x x Heteropyxis natalensis x Lantana camara * x x x x Ludwigia octovalvis x Maytenus undata x Melia azedarach * x Rubus sp. * x Senna didymobotrya * x x x Sesbania punicea * x x Solanum mauritianum * x x
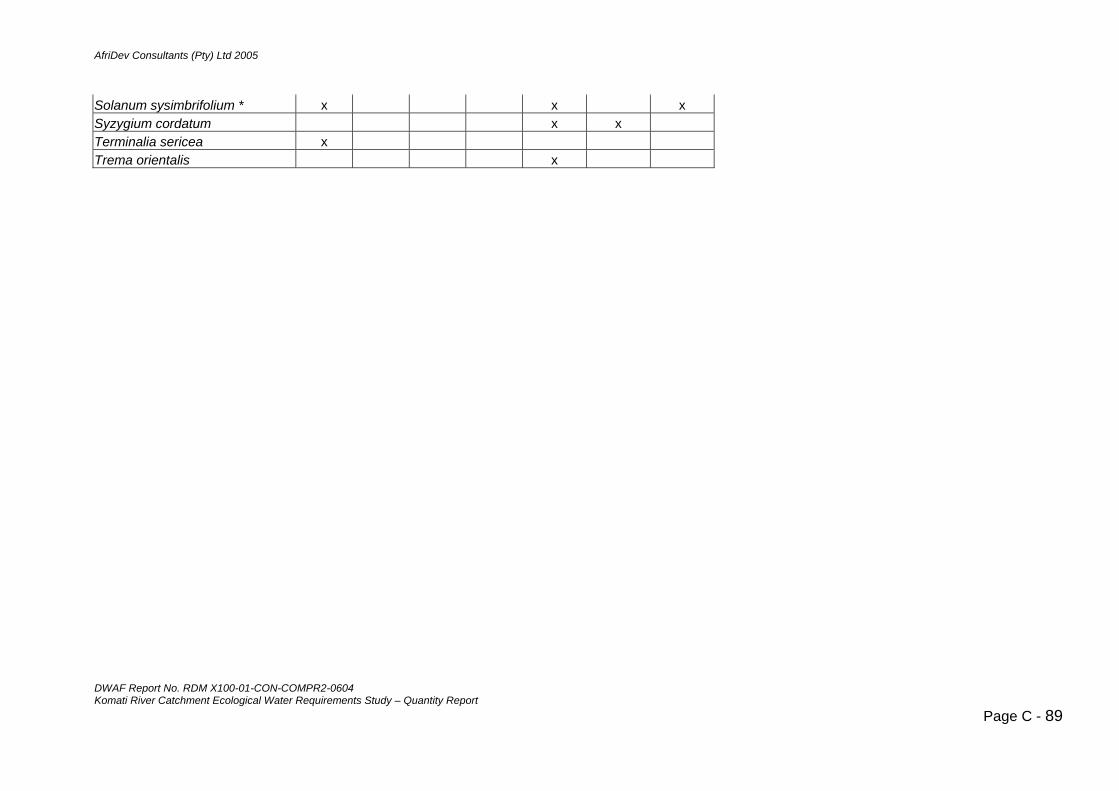
AfriDev Consultants (Pty) Ltd 2005
DWAF Report No. RDM X100-01-CON-COMPR2-0604 Komati River Catchment Ecological Water Requirements Study – Quantity Report
Page C - 89
Solanum sysimbrifolium * x x x Syzygium cordatum x x Terminalia sericea x Trema orientalis x

AfriDev Consultants (Pty) Ltd 2005
DWAF Report No. RDM X100-01-CON-COMPR2-0604 Komati River Catchment Ecological Water Requirements Study – Quantity Report
Page C - 90
Table 7. Site L1: Species distribution and cover-abundance per vegetation zone
Species Zone 0 Zone 1 Zone 2 Zone 3 Zone 4 Zone 5 Zone 6 Acacia caffra 1 Acacia sp. 1 Ageratum houstianum * + Albizia versicolor 2 Amelopteris prolifera GD 4485 + Annona senegalensis 1 + Antidesma venosum 1 + Asparagus cf. setaceus + Bidens pilosa + Bothriochloa insculpta + + 1 + Breonadia salicina 3 3 Bridelia micrantha 1 Canavalia virosa cf. + + + 2 Ceropegia distincta ssp. haygarthii + Chromalaena odorata * 2 + + + 1 Climber GD 4504 + Commelina africana + Crinum sp. + Crotalaria sp. Photo 25 1 Cyperus articulatus GD 4471 + Cyperus distans GD 4477 + 1 Cyperus sp. GD 4473 + + Desmodium sp. cf. + Dicrostachys cinerea 2 + 2 Diospyros mespiliformis 1 + + 1 2 Echinochloa pyramidalis GD 4513 1 Ehretia cf. obtusifolia 1 Eragrostis inamoena GD 4515 + + + Eragrostis superba +

AfriDev Consultants (Pty) Ltd 2005
DWAF Report No. RDM X100-01-CON-COMPR2-0604 Komati River Catchment Ecological Water Requirements Study – Quantity Report
Page C - 91
Euclea natalensis + + Euphorbia heterophylla * + Ficus cf. ingens + Ficus sur + Ficus sycomorus 2 + + 2 Fimbristylis ferruginea GD 4470 + Flemingia grahamiana + Floscopa glomerata + Flueggea virosa + + Forb GD 4506 + Forb Photo 26 + Garcinia livingstonei + 1 Gardenia sp. + Grewia bicolor 2 Gymnosporia senegalensis + 1 1 + Heteropogon contortus + + 4 Hyperthelia dissoluta + 1 Imperata cylindrica + Ischaemum fasciculatum GD 4514 + 2 1 Jasminum sp. + + Kraussia floribunda 1 + 1 Lantana camara * + + Lersia hexandra GD 4522 + Melhania sp. + Nuxia oppositifolia 1 Panicum maximum 1 + 3 Philenoptera violacea 2 Phragmites mauritianum + 5 1 Phyllanthus reticulatus + + 1 Polygala hotentotta + Psidium guajava * + + Pycreus polystachyos var. polystachyos GD 4472 +

AfriDev Consultants (Pty) Ltd 2005
DWAF Report No. RDM X100-01-CON-COMPR2-0604 Komati River Catchment Ecological Water Requirements Study – Quantity Report
Page C - 92
Rhoicissus tridentata + Rhus pyroides var. pyroides 1 + Rhynchosia cf. caribbea + Rhynchosia cf. hirta 1 1 Schotia brachypetala 1 Sclerocarya birrea 1 2 Scolopia zeyheri + Secamone sp. + + Senna cf. petersiana + Sesbania sesban 1 + 1 Solanum sp. 2 Sporobolus cf. stapfianus + + + 2 Syzygium cf. guineense (Sp. B) 3 3 1 Syzygium cordatum 2 Themeda triandra 1 + 2 Trema orientalis + Typha capensis + Vernonia colorata 1 + VITACEAE 1 Ziziphus mucronata + +

AfriDev Consultants Pty Ltd 2005
DWAF Report No. RDM X100-01-CON-COMPR2-0604 Komati Catchment Ecological Water Requirements Study – Quantity Report
Page D - 1
Appendix D
Aquatic Invertebrates
Palmer, RW
Table of Contents
TABLE OF CONTENTS.......................................................................................................................... 1
LIST OF TABLES ................................................................................................................................... 4
ACKNOWLEDGMENTS ......................................................................................................................... 5
ABBREVIATIONS................................................................................................................................... 6
GLOSSARY ............................................................................................................................................ 7
1. INTRODUCTION ............................................................................................................................. 8
1.1 AIMS OF THIS REPORT............................................................................................................ 9
2. METHODS..................................................................................................................................... 10
2.1 REFERENCE CONDITIONS .................................................................................................... 10 2.2 PRESENT ECOLOGICAL STATE ............................................................................................. 10 2.3 TRENDS.............................................................................................................................. 12 2.4 CONFIDENCE....................................................................................................................... 12
3. RESULTS...................................................................................................................................... 13
3.1 RESOURCE UNIT A – UPPER KOMATI - UPSTREAM OF NOOITGEDACHT ................................... 13 3.1.1 Reference Conditions .................................................................................................. 13 3.1.2 Present Ecological State.............................................................................................. 13 3.1.3 Trends.......................................................................................................................... 14 3.1.4 Drivers.......................................................................................................................... 14 3.1.5 Pressures..................................................................................................................... 14 3.1.6 Impacts ........................................................................................................................ 15 3.1.7 Recommended Ecological Category ........................................................................... 15

AfriDev Consultants Pty Ltd 2005
DWAF Report No. RDM X100-01-CON-COMPR2-0604 Komati Catchment Ecological Water Requirements Study – Quantity Report
Page D - 2
3.1.8 Responses ................................................................................................................... 15 3.2 RESOURCE UNIT B – UPPER KOMATI: DOWNSTREAM OF NOOITGEDACHT DAM (K1) ............... 16
3.2.1 Reference Conditions .................................................................................................. 16 3.2.2 Present Ecological State.............................................................................................. 16 3.2.3 Trends.......................................................................................................................... 17 3.2.4 Drivers.......................................................................................................................... 17 3.2.5 Pressures..................................................................................................................... 17 3.2.6 Impacts ........................................................................................................................ 18 3.2.7 Recommended Ecological Category ........................................................................... 18 3.2.8 Responses ................................................................................................................... 18
3.3 RESOURCE UNIT C – UPPER KOMATI: DOWNSTREAM OF VYGEBOOM DAM (K2) ..................... 19 3.3.1 Reference Conditions .................................................................................................. 19 3.3.2 Present Ecological State.............................................................................................. 19 3.3.3 Trends.......................................................................................................................... 21 3.3.4 Drivers.......................................................................................................................... 21 3.3.5 Pressures..................................................................................................................... 21 3.3.6 Impacts ........................................................................................................................ 22 3.3.7 Recommended Ecological Category ........................................................................... 22 3.3.8 Responses ................................................................................................................... 22
3.4 RESOURCE UNIT D – LOWER KOMATI: TONGA (K3)............................................................... 23 3.4.1 Reference Conditions .................................................................................................. 23 3.4.2 Present Ecological State.............................................................................................. 24 3.4.3 Trends.......................................................................................................................... 26 3.4.4 Drivers.......................................................................................................................... 26 3.4.5 Pressures..................................................................................................................... 26 3.4.6 Impacts ........................................................................................................................ 27 3.4.7 Recommended Ecological Category ........................................................................... 27 3.4.8 Responses ................................................................................................................... 27
3.5 RESOURCE UNIT E – LOWER KOMATI: KOMATIPOORT (K5).................................................... 28 3.6 RESOURCE UNIT G – GLADDESPRUIT (G1)........................................................................... 28
3.6.1 Reference Conditions .................................................................................................. 28 3.6.2 Present Ecological State.............................................................................................. 28 3.6.3 Trends.......................................................................................................................... 29 3.6.4 Drivers.......................................................................................................................... 29 3.6.5 Pressures..................................................................................................................... 29 3.6.6 Impacts ........................................................................................................................ 30 3.6.7 Recommended Ecological Category ........................................................................... 30 3.6.8 Responses ................................................................................................................... 30
3.7 RESOURCE UNIT S – SEEKOIESPRUIT................................................................................... 31 3.8 RESOURCE UNIT T – TEESPRUIT (T1) .................................................................................. 31
3.8.1 Reference Conditions .................................................................................................. 31 3.8.2 Present Ecological State.............................................................................................. 31 3.8.3 Trends.......................................................................................................................... 32 3.8.4 Drivers.......................................................................................................................... 32 3.8.5 Pressures..................................................................................................................... 32 3.8.6 Impacts ........................................................................................................................ 32 3.8.7 Recommended Ecological Category ........................................................................... 33 3.8.8 Responses ................................................................................................................... 33

AfriDev Consultants Pty Ltd 2005
DWAF Report No. RDM X100-01-CON-COMPR2-0604 Komati Catchment Ecological Water Requirements Study – Quantity Report
Page D - 3
3.9 RESOURCE UNIT L – UPPER LOMATI .................................................................................... 33 3.10 RESOURCE UNIT M – LOWER LOMATI: DOWNSTREAM OF DRIEKOPPIES DAM (L1) .................. 33
3.10.1 Reference Conditions .................................................................................................. 33 3.10.2 Present Ecological State.............................................................................................. 34 3.10.3 Trends.......................................................................................................................... 35 3.10.4 Drivers.......................................................................................................................... 35 3.10.5 Pressures..................................................................................................................... 35 3.10.6 Impacts ........................................................................................................................ 36 3.10.7 Recommended Ecological Category ........................................................................... 36 3.10.8 Responses ................................................................................................................... 36
3.11 RESOURCE UNIT – SWAZILAND: DOWNSTREAM OF MAGUGA DAM (M1)................................. 36 3.11.1 Reference Conditions .................................................................................................. 36 3.11.2 Present Ecological State.............................................................................................. 38 3.11.3 Trends.......................................................................................................................... 39 3.11.4 Drivers.......................................................................................................................... 40 3.11.5 Pressures..................................................................................................................... 40 3.11.6 Impacts ........................................................................................................................ 40 3.11.7 Recommended Ecological Category ........................................................................... 40 3.11.8 Responses ................................................................................................................... 40
4. DISCUSSION ................................................................................................................................ 41
5. REFERENCES .............................................................................................................................. 44
6. ANNEXURES ................................................................................................................................ 47
ANNEX A: MAPS OF SASS SAMPLING SITES, SASS SCORES AND ASPT .......................... 48
ANNEX B: DETAILED DATA........................................................................................................ 52
ANNEX C: EXPECTED AND OBSERVED INVERTEBRATES PER RESOURCE UNIT IN THE KOMATI RIVER CATCHMENT. ........................................................................................................... 60
ANNEX D: SUMMARY BIOMONITORING RESULTS PER RESOURCE UNIT. ......................... 67
ANNEX E: DETAILED RESULTS OF BENTHIC INVERTEBRATE RESPONSE ASSESSMENT INDEX (MIRAI) 73

AfriDev Consultants Pty Ltd 2005
DWAF Report No. RDM X100-01-CON-COMPR2-0604 Komati Catchment Ecological Water Requirements Study – Quantity Report
Page D - 4
LIST OF TABLES
Table 2-1. Delineation of Present State Categories in terms of invertebrate composition. ...11 Table 3-1. Summary of the available biomonitoring data within Resource Unit A.................14 Table 3-2: Summary table showing the extent to which aquatic invertebrate taxa in various
habitat preference groups at Site K1 have changed from expected reference conditions. The table shows the number of taxa recorded as a percentage of the number expected for each habitat preference group. ...............................16
Table 3-3: Summary table showing the extent to which aquatic invertebrate taxa in various habitat preference groups at Site K2 have changed from expected reference conditions. The table shows the number of taxa recorded as a percentage of the number expected for each habitat preference group. ...............................20
Table 3-4: Summary SASS results for K3 (Tonga) in 1997 and 1998, before the construction of Maguga Dam...............................................................................................24
Table 3-5: Summary table showing the extent to which aquatic invertebrate taxa in various habitat preference groups at Site K3 have changed from expected reference conditions. The table shows the number of taxa recorded as a percentage of the number expected for each habitat preference group. ...............................26
Table 3-6: Summary table showing the extent to which aquatic invertebrate taxa in various habitat preference groups at Site G1 have changed from expected reference conditions. The table shows the number of taxa recorded as a percentage of the number expected for each habitat preference group. ...............................29
Table 3-7: Summary table showing the extent to which aquatic invertebrate taxa in various habitat preference groups at Site T1 have changed from expected reference conditions. The table shows the number of taxa recorded as a percentage of the number expected for each habitat preference group. ...............................32
Table 3-8: Summary table showing the extent to which aquatic invertebrate taxa in various habitat preference groups at Site L1 have changed from expected reference conditions. The table shows the number of taxa recorded as a percentage of the number expected for each habitat preference group. ...............................34
Table 3-9. Summary SASS results for M1 in 1997 and 1998, before the construction of Maguga Dam...................................................................................................37
Table 3-10: Summary table showing the extent to which aquatic invertebrate taxa in various habitat preference groups at Site M1 have changed from expected reference conditions. The table shows the number of taxa recorded as a percentage of the number expected for each habitat preference group. ...............................39

AfriDev Consultants Pty Ltd 2005
DWAF Report No. RDM X100-01-CON-COMPR2-0604 Komati Catchment Ecological Water Requirements Study – Quantity Report
Page D - 5
ACKNOWLEDGMENTS
The following a gratefully acknowledged for information contained in this report: • Ms Christa Thirion, IWQS, for providing and assisting with the interpretation of these
data. • Mr Gerhard Diedericks, Environmental Biomonitoring Services, for providing data and
assisting with data analysis. • Dr Johan Engelbrecht, Mpumalanga Parks Board, for providing additional data. • Dr Mark Chutter, AfriDev, for providing additional data.

AfriDev Consultants Pty Ltd 2005
DWAF Report No. RDM X100-01-CON-COMPR2-0604 Komati Catchment Ecological Water Requirements Study – Quantity Report
Page D - 6
ABBREVIATIONS
D: RDM Directorate: Resource Directed Measures DWAF Department of Water Affairs and Forestry EC Ecological Category EI&S Ecological Importance and Sensitivity EWR Ecological Water Requirement MIRAI Macro Invertebrate Response Assessment Index PES Present Ecological State REC Recommended Ecological Category RU Resource Unit SASS South African Scoring System
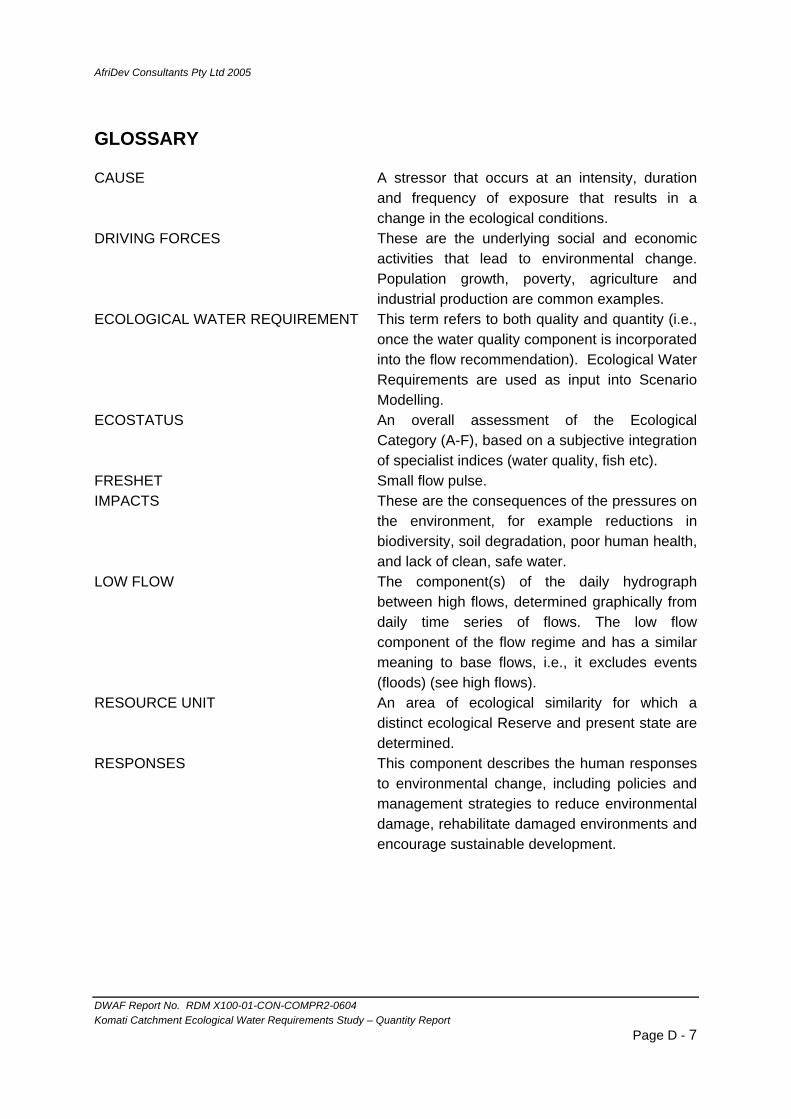
AfriDev Consultants Pty Ltd 2005
DWAF Report No. RDM X100-01-CON-COMPR2-0604 Komati Catchment Ecological Water Requirements Study – Quantity Report
Page D - 7
GLOSSARY
CAUSE A stressor that occurs at an intensity, duration and frequency of exposure that results in a change in the ecological conditions.
DRIVING FORCES These are the underlying social and economic activities that lead to environmental change. Population growth, poverty, agriculture and industrial production are common examples.
ECOLOGICAL WATER REQUIREMENT This term refers to both quality and quantity (i.e., once the water quality component is incorporated into the flow recommendation). Ecological Water Requirements are used as input into Scenario Modelling.
ECOSTATUS An overall assessment of the Ecological Category (A-F), based on a subjective integration of specialist indices (water quality, fish etc).
FRESHET Small flow pulse. IMPACTS These are the consequences of the pressures on
the environment, for example reductions in biodiversity, soil degradation, poor human health, and lack of clean, safe water.
LOW FLOW The component(s) of the daily hydrograph between high flows, determined graphically from daily time series of flows. The low flow component of the flow regime and has a similar meaning to base flows, i.e., it excludes events (floods) (see high flows).
RESOURCE UNIT An area of ecological similarity for which a distinct ecological Reserve and present state are determined.
RESPONSES This component describes the human responses to environmental change, including policies and management strategies to reduce environmental damage, rehabilitate damaged environments and encourage sustainable development.

AfriDev Consultants Pty Ltd 2005
DWAF Report No. RDM X100-01-CON-COMPR2-0604 Komati Catchment Ecological Water Requirements Study – Quantity Report
Page D - 8
1. INTRODUCTION
Aquatic invertebrates are an important consideration in water resource management because many species are sensitive to changes in flow and water quality and may therefore be used as indicators of river condition or “health”. Invertebrates are also able to transform polluted water into clean water, an ecological process of considerable economic value. Invertebrates form the bulk of biomass in most rivers and are important in ecological processes because they provide food for fishes, frogs, birds and other higher forms of life. Furthermore, burrowing invertebrates are sometimes important in aerating sediments and releasing nutrients. On the negative side, certain invertebrates are of social and economic importance because of their pest status and role as vectors or hosts of various human and animal diseases. Water resource developments usually cause major shifts in the species composition, distribution and abundance of aquatic invertebrates and this often leads to increased numbers of undesirable species. Water resource developments also change human activities and this may lead to an increase in exposure to waterborne diseases. Management for or against specific target species is straightforward because the species may be identified and their abundance monitored. This requires an understanding of the ecological requirements of the target species. Although this information is available for some species, particularly disease vectors and hosts, detailed information on the biophysical requirements for most aquatic invertebrate species is lacking. However, even if such information were available, it is unlikely to provide clear answers on how rivers should be managed because of the diversity and complexity of natural systems. The habitat requirements of many species differ as they age and this complicates the relation between habitat requirements and species. Furthermore, deciding which species to select as target species is not always straightforward. Invertebrates have evolved to withstand the natural cycle of droughts and floods and the maintenance of a diverse and healthy invertebrate assemblage requires the main components of the natural flow regime. High flows or freshets are important for mobilising sediments and flushing accumulated debris, particularly decaying organic matter, as well as various forms of pollution. Freshets are also important reproductive cues. It is generally accepted that the timing of freshets should coincide with the natural seasonal pattern. The overall composition of the invertebrate assemblage provides a useful integrated measure of river conditions or river “health”. One advantage of using an integrated measure of river conditions, such as SASS, is that the problem of bias inherent when selecting and using target species is overcome.
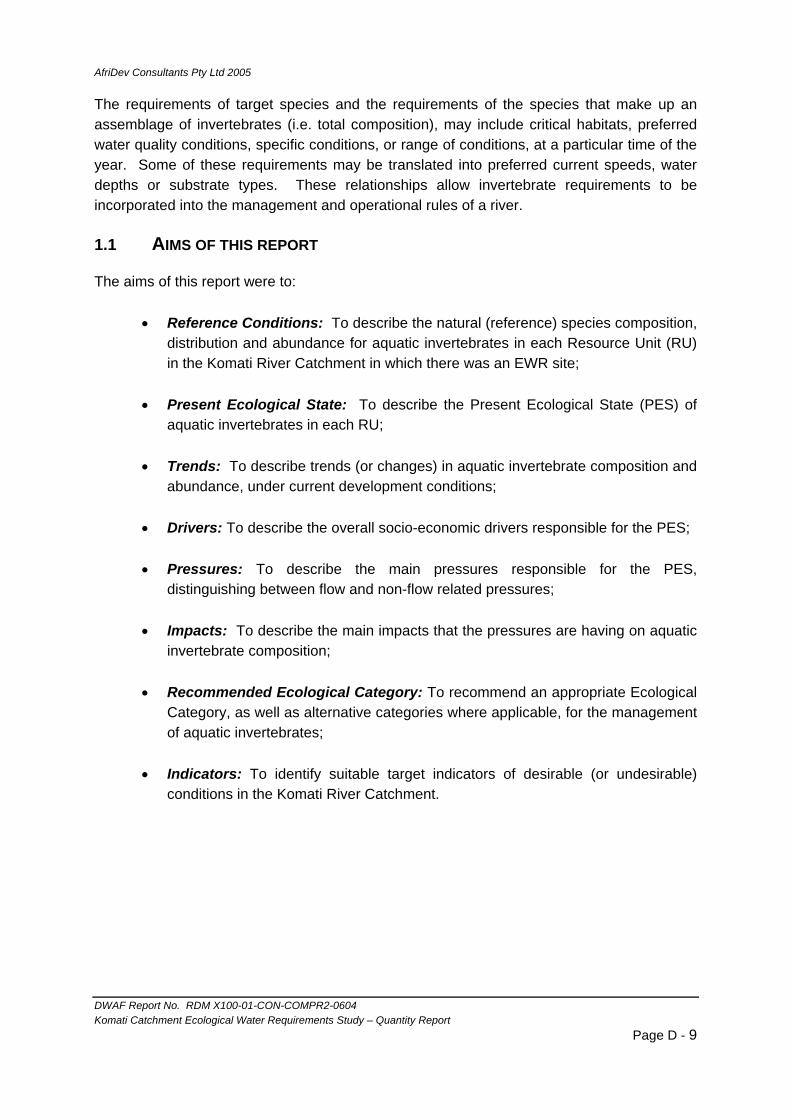
AfriDev Consultants Pty Ltd 2005
DWAF Report No. RDM X100-01-CON-COMPR2-0604 Komati Catchment Ecological Water Requirements Study – Quantity Report
Page D - 9
The requirements of target species and the requirements of the species that make up an assemblage of invertebrates (i.e. total composition), may include critical habitats, preferred water quality conditions, specific conditions, or range of conditions, at a particular time of the year. Some of these requirements may be translated into preferred current speeds, water depths or substrate types. These relationships allow invertebrate requirements to be incorporated into the management and operational rules of a river.
1.1 AIMS OF THIS REPORT
The aims of this report were to:
• Reference Conditions: To describe the natural (reference) species composition, distribution and abundance for aquatic invertebrates in each Resource Unit (RU) in the Komati River Catchment in which there was an EWR site;
• Present Ecological State: To describe the Present Ecological State (PES) of
aquatic invertebrates in each RU; • Trends: To describe trends (or changes) in aquatic invertebrate composition and
abundance, under current development conditions; • Drivers: To describe the overall socio-economic drivers responsible for the PES; • Pressures: To describe the main pressures responsible for the PES,
distinguishing between flow and non-flow related pressures; • Impacts: To describe the main impacts that the pressures are having on aquatic
invertebrate composition; • Recommended Ecological Category: To recommend an appropriate Ecological
Category, as well as alternative categories where applicable, for the management of aquatic invertebrates;
• Indicators: To identify suitable target indicators of desirable (or undesirable)
conditions in the Komati River Catchment.
AfriDev Consultants Pty Ltd 2005
DWAF Report No. RDM X100-01-CON-COMPR2-0604 Komati Catchment Ecological Water Requirements Study – Quantity Report
Page D - 10
2. METHODS
The Present Ecological State for aquatic invertebrates, or invertebrate EC, was based on the application of the Macro Invertebrate Response Assessment Index (MIRAI) (Thirion 2005).
2.1 REFERENCE CONDITIONS
An assessment of the likely reference conditions for aquatic invertebrates was made for each RU and this information was used as a baseline against which the present ecological state was quantified. The composition of invertebrates in the Komati River Catchment prior to disturbance will never be known for certain. For this reason, reference conditions were based on professional judgement and/or inferred from limited available data. Available data included present day biomonitoring data collected from sites which were least impacted by development and the following historical data:
• Once-off data on overall species composition and abundance, collected by Prof Harrison at various sites throughout the catchment in Juy 1959 (Harrison 1959).
• Data on the aquatic invertebrates in streams of the Barberton Mountainlands, collected by Hughes on two various occasions in 1961 (Hughes 1966a, b).
• Data on mayflies collected on four occasions at various locations in the 1960’s as part of an MSc thesis by Matthew (Matthew 1968, Matthew and Ryke 1969).
• Data on the distribution and abundance of snails collected on various occasions and localities in the 1950s and 1960s (Pitchford 1958; Schutte and Frank 1964; Appleton 1975, 1977).
2.2 PRESENT ECOLOGICAL STATE
Available information on aquatic invertebrates included the following: • 1994-1995: Ms Christa Thirion (DWAF: RQS), collected data for the River Health
Programme throughout the Komati River Catchment; • 1994-1996: Dr Mark Chutter (AfriDev): collected data on the impacts of gold mining
at four to seven sites in the upper Gladdespruit and surrounding tributaries on four occasions (Chutter 1996);
• 1997-1998: Dr Rob Palmer (AfriDev), collected data for KOBWA from various sites in the Komati River upstream and downstream of Maguga Dam as part of the Maguga Dam Environmental Impact Assessment (Palmer 1998);
• 2001 : Dr Johan Engelbrecht (Mpumalanga Parks Board), collected data for the River Health Programme throughout the catchment;
• 2001-2003 (n=120): Mr Gerhard Diedericks (Environmental Biomonitoring Services), collected large numbers of samples (n=120) mainly in streams affected by the forestry industry;
• 2003: Dr Rob Palmer (AfriDev) collected data at seven IFR sites for this study; • 2004: Dr Rob Palmer (AfriDev) collected data for KOBWA at three sites in the Komati
River and one site in the lower Lomati River on three occasions in 2003 and 2004.

AfriDev Consultants Pty Ltd 2005
DWAF Report No. RDM X100-01-CON-COMPR2-0604 Komati Catchment Ecological Water Requirements Study – Quantity Report
Page D - 11
Biomonitoring data that were collected using the SASS4 or earlier methods were converted to SASS5 equivalent scores, where this was possible, to allow comparison of like with like. A plot of the SASS scores against the Average Score per Taxon (ASPT) for the Komati River Catchment as a whole was used to provide a preliminary delineation of the results into one of six Present State Categories, defined in Table 2-1. The delineations were not always clear, and where scores bordered two or more classes, preference was given to the Average Score per Taxon (ASPT) rather than the total score. Additional data collected were collected as part of this study from seven sites in August 2003. Invertebrates were collected using a standard SASS net and identified to at least family level according to the SASS51 sampling technique (Dickens and Graham 2002). Results for each biotope were kept separate to enable comparison of results from similar habitats. The abundance of each SASS taxon was scored on a 5-point scale (1=1; A=2-10; 3=11-100; 4=101-1000; 5=>1000). The system of rating abundance was slightly different to that used during the Maguga Dam baseline sampling, in which a 3-point scale was used (1=present; 2=common; 3=abundant). A record was also made of species that are easily identified. The suitability of each biotope to invertebrates was assessed on a 5-point scale (1=poor, 5=excellent). This method was used in favour of the Integrated Habitat Assessment System (IHAS), developed specifically for SASS by the CSIR (MacMillan 1998), as the latter method has been shown to be of limited value (Vos et al 2002). The SASS results were classified into one of six Present Ecological States (PES) categories, ranging from Excellent (Category A), to Very Poor (Category F) (Table 2-1).
Table 2-1. Delineation of Present State Categories in terms of invertebrate composition.
Category Condition Description A Excellent Unimpaired. High diversity of taxa with numerous sensitive taxa.
B Very Good Slightly impaired. High diversity of taxa, but with fewer sensitive taxa.
C Good Moderately impaired. Moderate diversity of taxa.
D Fair Considerably impaired. Mostly tolerant taxa present.
E Poor Severely impaired. Only tolerant taxa present.
F Very Poor Very severely impaired. Very few tolerant taxa present.
1 SASS5, or South African Scoring System (version 5), is a rapid method of quantifying the condition
or health of a river, based on the presence of major invertebrate groups (mostly families), each of which have been allocated a “sensitivity” value (Dickens and Graham 2002). The values are summed to provide a Total Score, and divided by the total number of taxa to provide an Average Score Per Taxon (ASPT).

AfriDev Consultants Pty Ltd 2005
DWAF Report No. RDM X100-01-CON-COMPR2-0604 Komati Catchment Ecological Water Requirements Study – Quantity Report
Page D - 12
2.3 TRENDS
Trends refer to directional change or changes in the attributes of the drivers and biota (as a response to drivers) at the time of the PES assessment, ie, assuming no further development. Trends were categorised as:
• 0 = no trend (ie stable) • Negative (ie moving away from reference conditions) • Positive (ie moving towards reference conditions)
2.4 CONFIDENCE
Confidence in each assessment was rated on a six-point scale as follows: 0=no confidence 1= low confidence 2= low to medium confidence 3= medium confidence 4= medium to high confidence 5= high confidence
AfriDev Consultants Pty Ltd 2005
DWAF Report No. RDM X100-01-CON-COMPR2-0604 Komati Catchment Ecological Water Requirements Study – Quantity Report
Page D - 13
3. RESULTS
SASS biomonitoring data were available for 126 sites and 265 site-visits. The distribution of sites was focussed mainly in forestry areas in the middleveld, and to a lesser extent in the lowveld (Appendix A). Very few data were available for the highveld, upstream of Nooitgedacht Dam. Detailed biomonitoring results collected during this study area shown in Annexure B. The taxa that were observed and expected in each Resource Unit are listed in Appendix C. Summary SASS results per Resource Unit are shown in Appendix D, while the results of the Macro Invertebrate Response Assessment Index (MIRAI) for the PES and alternative categories are presented in Appendix E. The following section details the results for each Resource Unit.
3.1 RESOURCE UNIT A – UPPER KOMATI - UPSTREAM OF NOOITGEDACHT
3.1.1 Reference Conditions
Confidence: 3 Historical data on the composition of aquatic invertebrates in RU A were limited to data on the abundance and species composition of mayflies in the Komati River at Groblersbrug, and in the Boesmanspruit near Carolina, collected on four occasions in the 1960’s as part of an MSc thesis by Matthew (1968). The mayfly fauna was dominated by Euthraulus bugandensis, found in loose stones where the current is moderate (0.2 to 0.5 m/s), and Baetis bellus, found in the marginal vegetation, where the current was slow or absent (<0.2m/s). Average population densities of E. bugandensis varied between 364 individuals per m2 for the Boesmanspruit, to 1,023 individuals per m2 for the Komati River. Other common mayflies included Caenis spp., Afronrus barnardi, which was found in loose stones were the current speed was slow (0 to 0.2 m/s), and Ephoron savignyi, which was found in stones-out-of-current. Other noteworthy taxa included Adenophlebia sylvatica, Prosopistomatidae sp. and Pseudopannota maculosa. Baetis glaucus was noticeably absent from the area and Baetis harrisoni was recorded in low numbers only. Taxa that are expected, based on available data and professional judgement, to have occurred in each RU under natural and present conditions are listed in Appendix C.
3.1.2 Present Ecological State
PES Category: B Confidence: 3 No survey was carried out in this RU during the current investigation, apart from a reconnaissance field visit to identify potential IFR sites. A cursory examination of the fauna inhabiting a riffle upstream of the Groblers Bridge (Sector 5) in July 2003 showed an overwhelming abundance of the case-building caddisfly ?Oecetis sp. This reflected the inputs of leave litter from a stand of poplar trees growing alongside the river. The overall
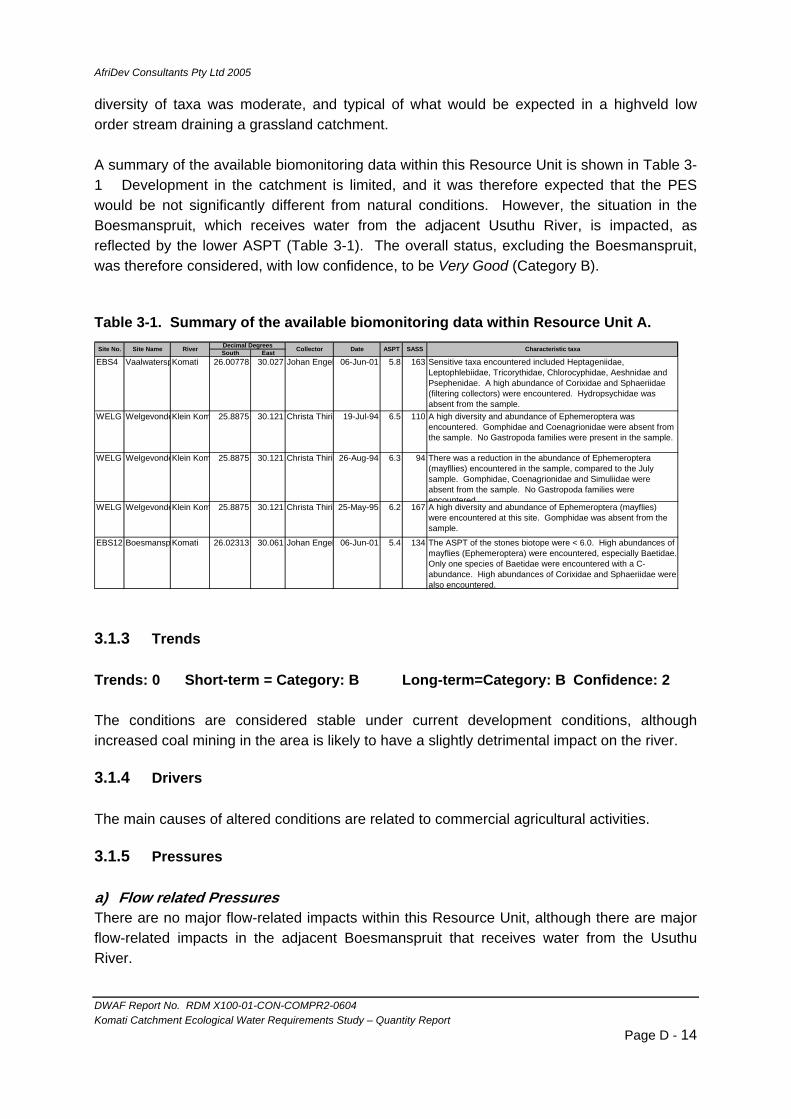
AfriDev Consultants Pty Ltd 2005
DWAF Report No. RDM X100-01-CON-COMPR2-0604 Komati Catchment Ecological Water Requirements Study – Quantity Report
Page D - 14
diversity of taxa was moderate, and typical of what would be expected in a highveld low order stream draining a grassland catchment. A summary of the available biomonitoring data within this Resource Unit is shown in Table 3-1 Development in the catchment is limited, and it was therefore expected that the PES would be not significantly different from natural conditions. However, the situation in the Boesmanspruit, which receives water from the adjacent Usuthu River, is impacted, as reflected by the lower ASPT (Table 3-1). The overall status, excluding the Boesmanspruit, was therefore considered, with low confidence, to be Very Good (Category B).
Table 3-1. Summary of the available biomonitoring data within Resource Unit A.
South EastEBS4 VaalwaterspKomati 26.00778 30.027 Johan Engel 06-Jun-01 5.8 163 Sensitive taxa encountered included Heptageniidae,
Leptophlebiidae, Tricorythidae, Chlorocyphidae, Aeshnidae and Psephenidae. A high abundance of Corixidae and Sphaeriidae (filtering collectors) were encountered. Hydropsychidae was absent from the sample.
WELG WelgevondeKlein Kom 25.8875 30.121 Christa Thirio 19-Jul-94 6.5 110 A high diversity and abundance of Ephemeroptera was encountered. Gomphidae and Coenagrionidae were absent from the sample. No Gastropoda families were present in the sample.
WELG WelgevondeKlein Kom 25.8875 30.121 Christa Thirio 26-Aug-94 6.3 94 There was a reduction in the abundance of Ephemeroptera (mayfllies) encountered in the sample, compared to the July sample. Gomphidae, Coenagrionidae and Simuliidae were absent from the sample. No Gastropoda families were encountered
WELG WelgevondeKlein Kom 25.8875 30.121 Christa Thirio25-May-95 6.2 167 A high diversity and abundance of Ephemeroptera (mayflies) were encountered at this site. Gomphidae was absent from the sample.
EBS12 Boesmansp Komati 26.02313 30.061 Johan Engel 06-Jun-01 5.4 134 The ASPT of the stones biotope were < 6.0. High abundances of mayflies (Ephemeroptera) were encountered, especially Baetidae. Only one species of Baetidae were encountered with a C-abundance. High abundances of Corixidae and Sphaeriidae were also encountered.
Characteristic taxaASPT SASSCollector DateDecimal DegreesSite No. Site Name River
3.1.3 Trends
Trends: 0 Short-term = Category: B Long-term=Category: B Confidence: 2 The conditions are considered stable under current development conditions, although increased coal mining in the area is likely to have a slightly detrimental impact on the river.
3.1.4 Drivers
The main causes of altered conditions are related to commercial agricultural activities.
3.1.5 Pressures
a) Flow related Pressures There are no major flow-related impacts within this Resource Unit, although there are major flow-related impacts in the adjacent Boesmanspruit that receives water from the Usuthu River.

AfriDev Consultants Pty Ltd 2005
DWAF Report No. RDM X100-01-CON-COMPR2-0604 Komati Catchment Ecological Water Requirements Study – Quantity Report
Page D - 15
b) Non-Flow Related Pressures The main non-flow related pressures are related to poplar plantations, fire and bank erosion and associated elevated levels of sediment that are introduced into the river at river crossings.
3.1.6 Impacts
The main impacts are elevated numbers of shredders, such as the caddisfly ?Oecetis sp.
3.1.7 Recommended Ecological Category
Recommended Category: B Achievability: Easy Confidence: 2 The recommended category for this Resource Unit is B because of the limited development in the catchment. This may be easily achievable, but the challenge will be to achieve this state with increased mining activity in the catchment, and in the Boesmanspruit.
3.1.8 Responses
c) Flow related Responses It is recommended that ecological conditions of the Boesmanspruit should be investigated, both upstream and downstream of the Lielieput canal outlet, and the results linked to the flows in the stream, and recommendations made accordingly.
d) Non-Flow Related Responses Actions needed to address the non-flow-related impacts include:
1) Sediments. Maintenance of stream crossings, with particular focus on road drainage to ensure that stormwaters from the gravel roads are directed into riparian buffer zones, rather than directly into the river,
2) Alien vegetation. Clearance of alien invasive vegetation from the riparian zone.
AfriDev Consultants Pty Ltd 2005
DWAF Report No. RDM X100-01-CON-COMPR2-0604 Komati Catchment Ecological Water Requirements Study – Quantity Report
Page D - 16
3.2 RESOURCE UNIT B – UPPER KOMATI: DOWNSTREAM OF NOOITGEDACHT
DAM (K1)
3.2.1 Reference Conditions
Confidence: 3 There are no historical records of aquatic invertebrates in Resource Unit B prior to the construction of Nooitgedacht Dam. The River Health Programme collected biomonitoring data from a total of 14 sites and 26 site-visits in the Komati and Klein Komati River in 1994, 1995 and 2001. Mayflies were generally common or abundant, and notable taxa included Polymitarcidae and Prosopistomatidae. Taxa that are expected, based on available data and professional judgement, to have occurred in the area under natural conditions are listed in Appendix C.
3.2.2 Present Ecological State
PES Category: B Confidence: 4 Data were available for 26 SASS samples recorded at 12 sampling sites within this Resource Unit, so confidence in the results was high. The data were collected by Ms Christa Thirion (June 1994 and May 1995), Dr Johan Engelbrecht (June 2001 and September 2001), and twice by Dr Rob Palmer during this study (August and October 2003). Overall, the invertebrate fauna was considered to be in a moderate to good condition (Category B to C), with lowest scores recorded at the first site downstream of Nooitgedacht Dam (Site EBS15: ASPT 5.8). There was a steady improvement in conditions downstream of the dam to a maximum recorded at the Rose Farm, just upstream of Gembsbokhoek Weir (Site EBS 16: ASPT 7.4), but conditions deteriorated downstream of Gemsbokhoek Weir (ASPT 6.6).
SASS5 ASPT ScoreMin 5.7 94Max 7.8 212Median 6.6 169n 26
Comparison of observed and expected data for K1 showed a slight reduction (73%) in the number of taxa with a preference for slow-flowing conditions, and a moderate (65-69%) reduction in the number of taxa with a preference for moderate and fast-flowing conditions (Table 3-2). There were also moderate reductions (62 to 79%) in the number of taxa associated with 1) loose cobble, 2) the water column and 3) high quality water (Table 3-2).
Table 3-2: Summary table showing the extent to which aquatic invertebrate taxa in various habitat preference groups at Site K1 have changed from expected reference
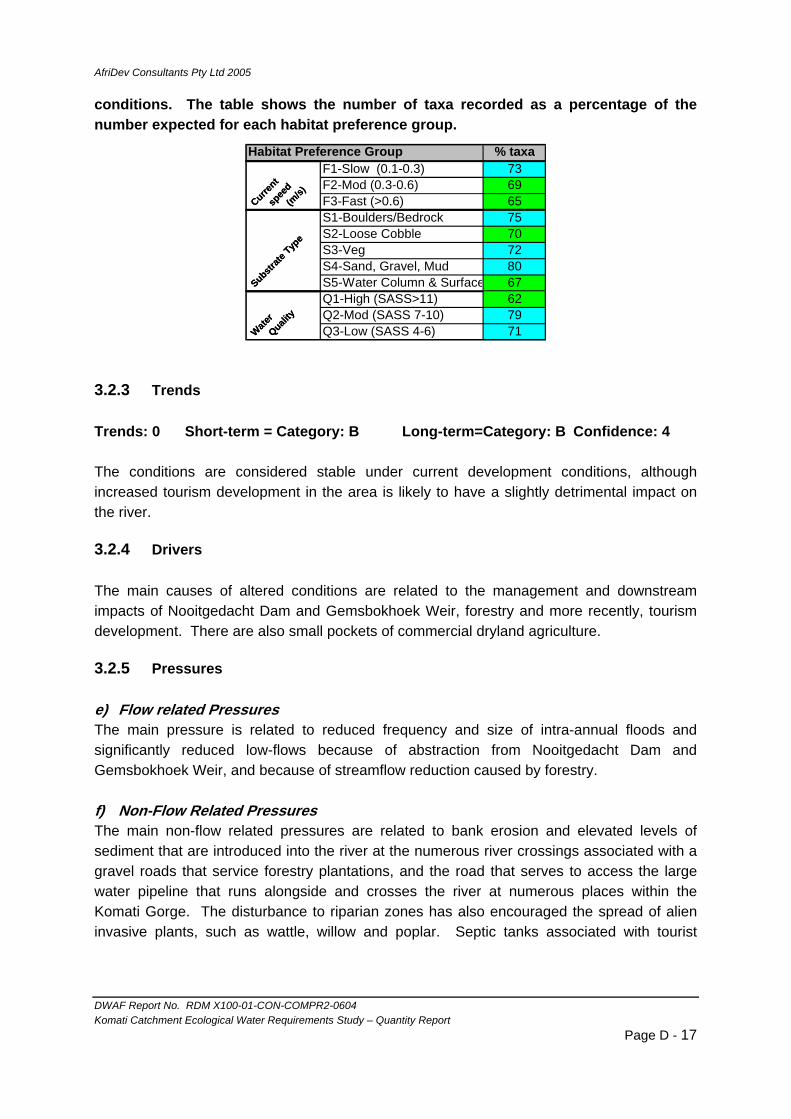
AfriDev Consultants Pty Ltd 2005
DWAF Report No. RDM X100-01-CON-COMPR2-0604 Komati Catchment Ecological Water Requirements Study – Quantity Report
Page D - 17
conditions. The table shows the number of taxa recorded as a percentage of the number expected for each habitat preference group.
% taxaHabitat Preference Group
Current
spee
d
(m/s)
F1-Slow (0.1-0.3) 73F2-Mod (0.3-0.6) 69F3-Fast (>0.6) 65Curre
nt
spee
d
(m/s)
Substrate
Type
S1-Boulders/Bedrock 75S2-Loose Cobble 70S3-Veg 72S4-Sand, Gravel, Mud 80S5-Water Column & Surface 67Substr
ate Typ
e
Water
Quality
Q1-High (SASS>11) 62Q2-Mod (SASS 7-10) 79Q3-Low (SASS 4-6) 71Wate
r
Quality
3.2.3 Trends
Trends: 0 Short-term = Category: B Long-term=Category: B Confidence: 4 The conditions are considered stable under current development conditions, although increased tourism development in the area is likely to have a slightly detrimental impact on the river.
3.2.4 Drivers
The main causes of altered conditions are related to the management and downstream impacts of Nooitgedacht Dam and Gemsbokhoek Weir, forestry and more recently, tourism development. There are also small pockets of commercial dryland agriculture.
3.2.5 Pressures
e) Flow related Pressures The main pressure is related to reduced frequency and size of intra-annual floods and significantly reduced low-flows because of abstraction from Nooitgedacht Dam and Gemsbokhoek Weir, and because of streamflow reduction caused by forestry. f) Non-Flow Related Pressures The main non-flow related pressures are related to bank erosion and elevated levels of sediment that are introduced into the river at the numerous river crossings associated with a gravel roads that service forestry plantations, and the road that serves to access the large water pipeline that runs alongside and crosses the river at numerous places within the Komati Gorge. The disturbance to riparian zones has also encouraged the spread of alien invasive plants, such as wattle, willow and poplar. Septic tanks associated with tourist

AfriDev Consultants Pty Ltd 2005
DWAF Report No. RDM X100-01-CON-COMPR2-0604 Komati Catchment Ecological Water Requirements Study – Quantity Report
Page D - 18
lodges that have been built in close proximity to the river are also likely to impact on water quality in the river.
3.2.6 Impacts
The main impacts are reduced abundance of taxa that require fast-flowing water, such Neoperla spio, Ephoron savingeuyi and Ancylidae, and reduced abundance of taxa that require good quality, clear water, such as Pyralidae and Simulium cervicornutum, and increased numbers of tolerant taxa, such as Baetis harrisoni.
3.2.7 Recommended Ecological Category
Recommended Category: B Achievability: Variable Confidence: 3 The recommended category for this Resource Unit is B because of the presence of sensitive taxa such as Neoperla spio and Polymitarcyidae, and because the PES recorded at Site K1 was a Category B. This may be easily achievable at Site K1, which is maintained by tributary accruals, but the challenge will be to achieve this state closer to Nooitgedacht Dam.
3.2.8 Responses
a) Flow related Responses Actions needed to address the flow-related impacts include:
1) Low-flows. Increasing low-flow releases and freshets from Nooitgedacht Dam, 2) High-flows. Increasing the release of freshets from Nooitgedacht Dam, and 3) Stream flow reduction. Removal of exotic plantations that are within stream courses
and subsequent rehabilitation.
b) Non-Flow Related Responses Actions needed to address the non-flow-related impacts include:
1) Sediments. Maintenance of stream crossings, with particular focus on road drainage to ensure that stormwaters from the gravel roads are directed into riparian buffer zones, rather than directly into the river,
2) Alien vegetation. Clearance of alien invasive vegetation from the riparian zone. This has been started by the Working for Water Programme, and should continue.
3) Sanitation and bacterial monitoring. Improved sanitation and monitoring of bacterial water quality is also recommended, particularly in the vicinity of lodges and other buildings.

AfriDev Consultants Pty Ltd 2005
DWAF Report No. RDM X100-01-CON-COMPR2-0604 Komati Catchment Ecological Water Requirements Study – Quantity Report
Page D - 19
3.3 RESOURCE UNIT C – UPPER KOMATI: DOWNSTREAM OF VYGEBOOM
DAM (K2)
3.3.1 Reference Conditions
Confidence: 4 Historical data on the composition of aquatic invertebrates in Resource Unit C include:
• Once-off data on overall species composition and abundance collected by Prof Harrison in Juy 1959 near Badplaas (Harrison 1959).
• Data on the abundance and species composition of mayflies at two sites in the Komati River (near Badplaas and near Mtsoli), collected on four occasions in the 1960’s as part of an MSc thesis by Matthews (1968).
The overall species composition in the stones-in-current biotope was characterised by high numbers of Chimarrha, a philopotamid caddisfly, which constituted 26% of the numbers in the sample. Other noteworthy species included the stonefly Neoperla spio, Afrorunus, Baetis harrisoni, Tricorythidae, Cheumatopsyche maculate (a highly sensitive caddisfly), and Polymorphanisus, and the filter feeding chironomid Rheotanytarsus nr fuscus. The marginal vegetation was dominated by Centroptilum excisum and Austocaenis. Blackfly species recorded included Simulium cervicornutum and S. impukane. The mayfly fauna was characterised by a very high diversity of species, with 23 species identified near Badplaas, and 27 species identified near Mtosli. The fauna near Badplaas was dominated by Afronurus scotti and Baetis bellus. The former has a preference for current speeds of 0.5 to 0.9 m/s, while the latter is found in marginal vegetation where the current speeds are low (<0.2m/s). The mayfly fauna near Mtsoli was dominated by Afronurus peringueyi and Baetis bellus. The former has a current speed preference of 0.2 to 0.5 m/s. The mayfly Baetis glaucus was noticeably absent, and Baetis harrison was recorded in low numbers only. Noteworthy taxa included Prosopistomatidae and Pseudopannota maculosa. Other taxa that are expected, based on professional judgement, to have occurred in the area under natural conditions are listed in Table Appendix C.
3.3.2 Present Ecological State
PES Category: C Confidence: 4 Data were available for 28 SASS samples recorded at 12 sampling sites within this Resource Unit, so confidence in the results was high. The data were collected by Ms Christa Thirion
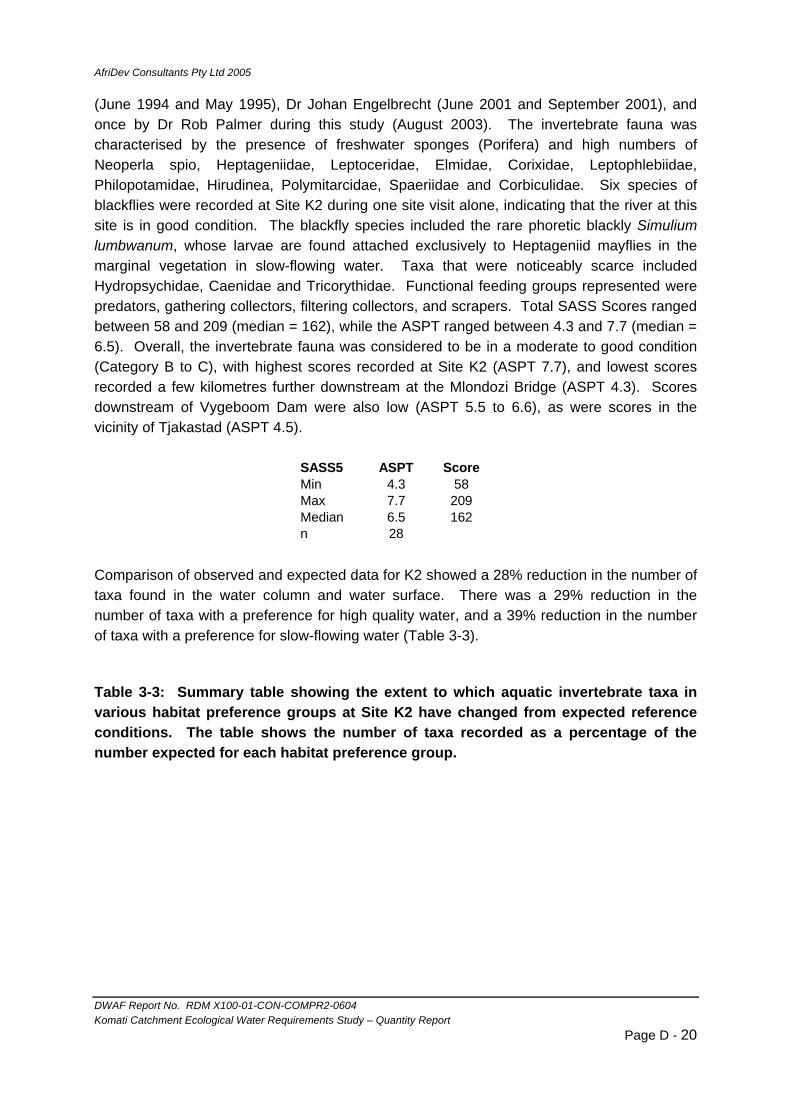
AfriDev Consultants Pty Ltd 2005
DWAF Report No. RDM X100-01-CON-COMPR2-0604 Komati Catchment Ecological Water Requirements Study – Quantity Report
Page D - 20
(June 1994 and May 1995), Dr Johan Engelbrecht (June 2001 and September 2001), and once by Dr Rob Palmer during this study (August 2003). The invertebrate fauna was characterised by the presence of freshwater sponges (Porifera) and high numbers of Neoperla spio, Heptageniidae, Leptoceridae, Elmidae, Corixidae, Leptophlebiidae, Philopotamidae, Hirudinea, Polymitarcidae, Spaeriidae and Corbiculidae. Six species of blackflies were recorded at Site K2 during one site visit alone, indicating that the river at this site is in good condition. The blackfly species included the rare phoretic blackly Simulium lumbwanum, whose larvae are found attached exclusively to Heptageniid mayflies in the marginal vegetation in slow-flowing water. Taxa that were noticeably scarce included Hydropsychidae, Caenidae and Tricorythidae. Functional feeding groups represented were predators, gathering collectors, filtering collectors, and scrapers. Total SASS Scores ranged between 58 and 209 (median = 162), while the ASPT ranged between 4.3 and 7.7 (median = 6.5). Overall, the invertebrate fauna was considered to be in a moderate to good condition (Category B to C), with highest scores recorded at Site K2 (ASPT 7.7), and lowest scores recorded a few kilometres further downstream at the Mlondozi Bridge (ASPT 4.3). Scores downstream of Vygeboom Dam were also low (ASPT 5.5 to 6.6), as were scores in the vicinity of Tjakastad (ASPT 4.5).
SASS5 ASPT ScoreMin 4.3 58Max 7.7 209Median 6.5 162n 28
Comparison of observed and expected data for K2 showed a 28% reduction in the number of taxa found in the water column and water surface. There was a 29% reduction in the number of taxa with a preference for high quality water, and a 39% reduction in the number of taxa with a preference for slow-flowing water (Table 3-3).
Table 3-3: Summary table showing the extent to which aquatic invertebrate taxa in various habitat preference groups at Site K2 have changed from expected reference conditions. The table shows the number of taxa recorded as a percentage of the number expected for each habitat preference group.

AfriDev Consultants Pty Ltd 2005
DWAF Report No. RDM X100-01-CON-COMPR2-0604 Komati Catchment Ecological Water Requirements Study – Quantity Report
Page D - 21
% taxaHabitat Preference Group
Current
spee
d
(m/s)
F1-Slow (0.1-0.3) 39F2-Mod (0.3-0.6) 62F3-Fast (>0.6) 52Curre
nt
spee
d
(m/s)
Substrate
Type
S1-Boulders/Bedrock 54S2-Loose Cobble 56S3-Veg 52S4-Sand, Gravel, Mud 73S5-Water Column & Surface 28Substr
ate Typ
e
Water
Quality
Q1-High (SASS>11) 29Q2-Mod (SASS 7-10) 53Q3-Low (SASS 4-6) 55Wate
r
Quality
3.3.3 Trends
Trends: 0 Short-term = Category: C Long-term=Category: C Confidence: 3 The conditions are considered stable under current development conditions. The conversion of a large portion of this RU from agriculture to a wilderness area, with associated rehabilitation of erosion dongas could improve conditions in much of the area. Likewise, the closure and rehabilitation of the Mtsoli Asbestos Mine, near the South Africa-Swaziland border, is likely to improve conditions in the lower portion of this RU. However, the overall conditions are unlikely to change because of the current management of releases from Vygeboom Dam, and the point and non-point sources of organic enrichment from growing settlements such as Tjakastad and eKulideni.
3.3.4 Drivers
The main causes of altered conditions are related to the management and downstream impacts of Vygeboom Dam, and impacts of settlements such as Badplaas, Tjakastad and eKulideni, which are characterised by high levels of unemployment and poverty.
3.3.5 Pressures
a) Flow related Pressures The main pressure is related to reduced frequency and size of intra-annual floods and significantly reduced low-flows as a result of abstraction from Vygeboom Dam. b) Non-Flow Related Pressures The main non-flow related pressures are related to water quality deterioration from settlements in the vicinity of Badplaas, Tjakastad and eKulideni. There are also patches of marketing gardening taking place in the riparian zone, and moderate levels of alien invasive vegetation. High levels of sediment are introduced by some tributaries on the left bank, such as the Mlondizi Stream and the Dalmeinspruit whose catchments were severely overgrazed in the past and are subject to severe erosion problems.
AfriDev Consultants Pty Ltd 2005
DWAF Report No. RDM X100-01-CON-COMPR2-0604 Komati Catchment Ecological Water Requirements Study – Quantity Report
Page D - 22
3.3.6 Impacts
The main impacts are reduced abundance of taxa that require high quality water. Taxa with a preference for high quality water that were expected but not recorded at K2 included Dicercomyzon costale, Prosopistomatidae, Elassoneuria trimeniana, Centroptiloides bifasciata, Cheumatopsyche maculata, Polymorphanisus, Pyralidae, Helodidae, Simulium impukane, Simulium unicornutum and Simulium vorax. Taxa with a preference for slow-flowing water that were expected but not recorded at K2 included Hydroptilidae, Pyralidae, Gyrinidae, Haliplidae, Helodidae, Hydraenidae, Hydrophilidae, Dixidae, Culicidae, Simulium impukane, Simulium unicornutum, Athericidae, Muscidae, Lymnaeidae, Ancylidae, Biomphalaria pfeifferi, Gyraulus costulatus and Spaeriidae. Taxa expected on the surface but not recorded included Naucoridae, Corixidae, Gerridae, Hydrometridae and Gyrinidae.
3.3.7 Recommended Ecological Category
Recommended Category: C Achievability: Easy Confidence: 4 The recommended category for this Resource Unit is C because of the presence of sensitive taxa such as Neoperla spio and Polymitarcyidae, and because the PES recorded at Site K2 was a Category C. This may be easily achievable at Site K2, which is maintained by tributary accruals, but the challenge will be to achieve this state closer to Vygeboom Dam.
3.3.8 Responses
a) Flow related Responses Actions needed to address the flow-related impacts include:
1) Low-flows: Increasing low-flow releases from Vygeboom Dam. 2) High-flows: Increasing releases of freshets from Vygeboom Dam.
b) Non-Flow Related Responses Actions needed to address the non-flow-related impacts include:
1) Alien vegetation. Control of alien invasive vegetation in the riparian zone and 2) Sanitation and Bacterial Monitoring. Improvement in sanitation facilities and the
management of sewage works, coupled with bacterial water quality monitoring of the river.
3) Erosion. Rehabilitation of erosion dongas, particularly in some of the tributaries, such as the Dalmienspruit and Mlondozi Catchments.
AfriDev Consultants Pty Ltd 2005
DWAF Report No. RDM X100-01-CON-COMPR2-0604 Komati Catchment Ecological Water Requirements Study – Quantity Report
Page D - 23
3.4 RESOURCE UNIT D – LOWER KOMATI: TONGA (K3)
3.4.1 Reference Conditions
Confidence: 4 Historical data on the composition of aquatic invertebrates in Resource Unit D include:
• Once-off data on overall species composition and abundance collected by Prof Harrison in November 1959 at Tonga rapids, situated 2.5 km upstream of K3 (Harrison 1960).
• Seasonal data on the abundance and species composition of mayflies at Mananga and Tonga Rapids, collected on four occasions in the 1960’s as part of an MSc thesis (Matthews 1968).
• Seasonal biomonitoring data (SASS4) collected on four occasions in 1997 as part of the Maguga Dam Impact assessment and comprehensive mitigation plan (AfriDev et al. 1998).
The biotopes at Tonga rapids are dominated by bedrock, and are somewhat different to the biotopes found at K3, which are dominated by large cobbles and marginal vegetation. However, it is likely that the invertebrate fauna at the sites would be similar in terms of sensitivity, and therefore similar SASS scores would be expected at these sites. Harrison's records, together with the study by Matthews, provide a good indication of what the aquatic invertebrate fauna in RU D is likely to have been prior to major development. Taxa that are certain to have occurred historically in RU D include the following:
• The freshwater shrimp Caridina nilotica; • Diverse mayfly fauna, dominated by Tricorythidae and Baetidae. Noteworthy
species include Machadorythus maculates, Compsoneuria njalensis, Caenis spp., Baetis bellus, B. glaucus and B. latus, Prosopistomatidae spp., and Pseudocloeon maculosum. Baetis harrisoni was recorded historically in low numbers only.
• Diverse caddisfly fauna, including Cheumatopsyche thomasetti, Polymorphanisus bipuntatus, Dipseudopsidae, and several genera of case building Leptoceridae, including Athripsodes, Parasetodes and Triaenodes;
• Moderate diversity of snail species, including Bulinus globosus, and the intermediate host of rectal bilharzia, Biomphalaria pfiefferi;
• Aquatic moth larvae (Nymphulidae); • Typical large river species of blackflies: namely Simulium bovis and S.
mcmahoni.
Data collected at Tonga in 1997 showed that the fauna was in generally good condition (Category A), although populations were highly variable. On one occasion (10.10.97) there was no flowing water, so invertebrates were sampled in remaining biotopes, and SASS scores in these biotopes were high (Category B), despite the intensive use of the site for
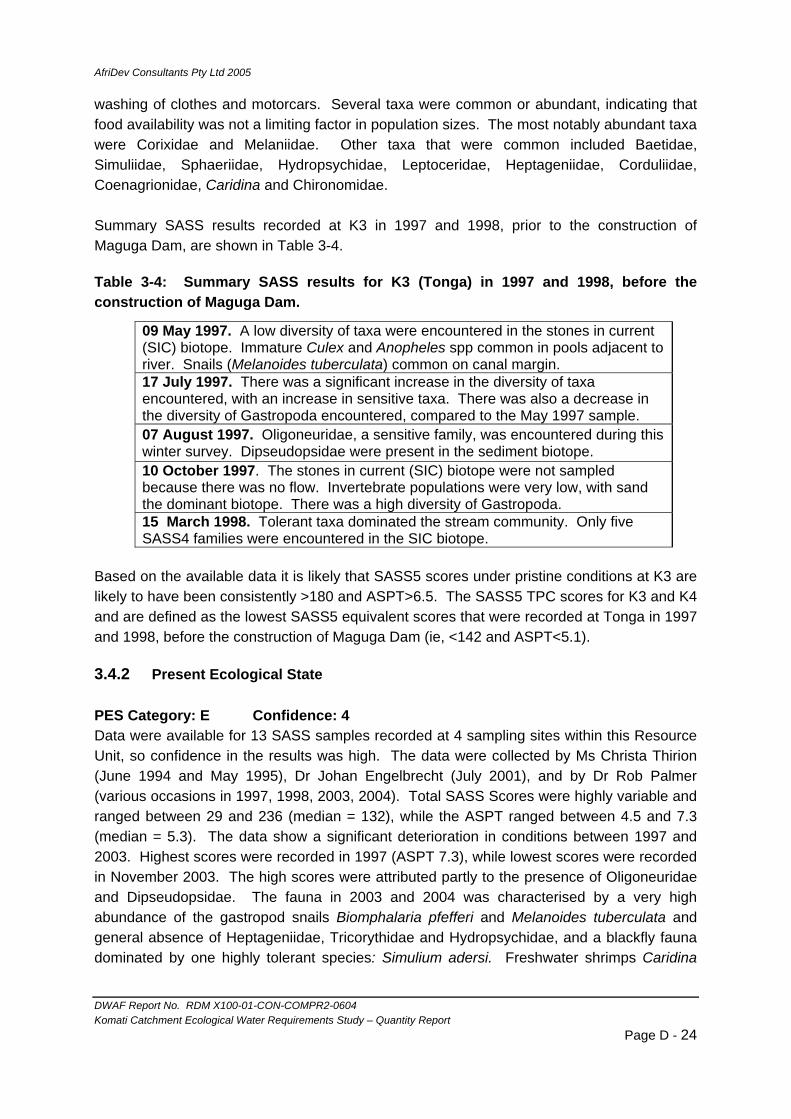
AfriDev Consultants Pty Ltd 2005
DWAF Report No. RDM X100-01-CON-COMPR2-0604 Komati Catchment Ecological Water Requirements Study – Quantity Report
Page D - 24
washing of clothes and motorcars. Several taxa were common or abundant, indicating that food availability was not a limiting factor in population sizes. The most notably abundant taxa were Corixidae and Melaniidae. Other taxa that were common included Baetidae, Simuliidae, Sphaeriidae, Hydropsychidae, Leptoceridae, Heptageniidae, Corduliidae, Coenagrionidae, Caridina and Chironomidae. Summary SASS results recorded at K3 in 1997 and 1998, prior to the construction of Maguga Dam, are shown in Table 3-4.
Table 3-4: Summary SASS results for K3 (Tonga) in 1997 and 1998, before the construction of Maguga Dam.
09 May 1997. A low diversity of taxa were encountered in the stones in current (SIC) biotope. Immature Culex and Anopheles spp common in pools adjacent to river. Snails (Melanoides tuberculata) common on canal margin. 17 July 1997. There was a significant increase in the diversity of taxa encountered, with an increase in sensitive taxa. There was also a decrease in the diversity of Gastropoda encountered, compared to the May 1997 sample. 07 August 1997. Oligoneuridae, a sensitive family, was encountered during this winter survey. Dipseudopsidae were present in the sediment biotope. 10 October 1997. The stones in current (SIC) biotope were not sampled because there was no flow. Invertebrate populations were very low, with sand the dominant biotope. There was a high diversity of Gastropoda. 15 March 1998. Tolerant taxa dominated the stream community. Only five SASS4 families were encountered in the SIC biotope.
Based on the available data it is likely that SASS5 scores under pristine conditions at K3 are likely to have been consistently >180 and ASPT>6.5. The SASS5 TPC scores for K3 and K4 and are defined as the lowest SASS5 equivalent scores that were recorded at Tonga in 1997 and 1998, before the construction of Maguga Dam (ie, <142 and ASPT<5.1).
3.4.2 Present Ecological State
PES Category: E Confidence: 4 Data were available for 13 SASS samples recorded at 4 sampling sites within this Resource Unit, so confidence in the results was high. The data were collected by Ms Christa Thirion (June 1994 and May 1995), Dr Johan Engelbrecht (July 2001), and by Dr Rob Palmer (various occasions in 1997, 1998, 2003, 2004). Total SASS Scores were highly variable and ranged between 29 and 236 (median = 132), while the ASPT ranged between 4.5 and 7.3 (median = 5.3). The data show a significant deterioration in conditions between 1997 and 2003. Highest scores were recorded in 1997 (ASPT 7.3), while lowest scores were recorded in November 2003. The high scores were attributed partly to the presence of Oligoneuridae and Dipseudopsidae. The fauna in 2003 and 2004 was characterised by a very high abundance of the gastropod snails Biomphalaria pfefferi and Melanoides tuberculata and general absence of Heptageniidae, Tricorythidae and Hydropsychidae, and a blackfly fauna dominated by one highly tolerant species: Simulium adersi. Freshwater shrimps Caridina
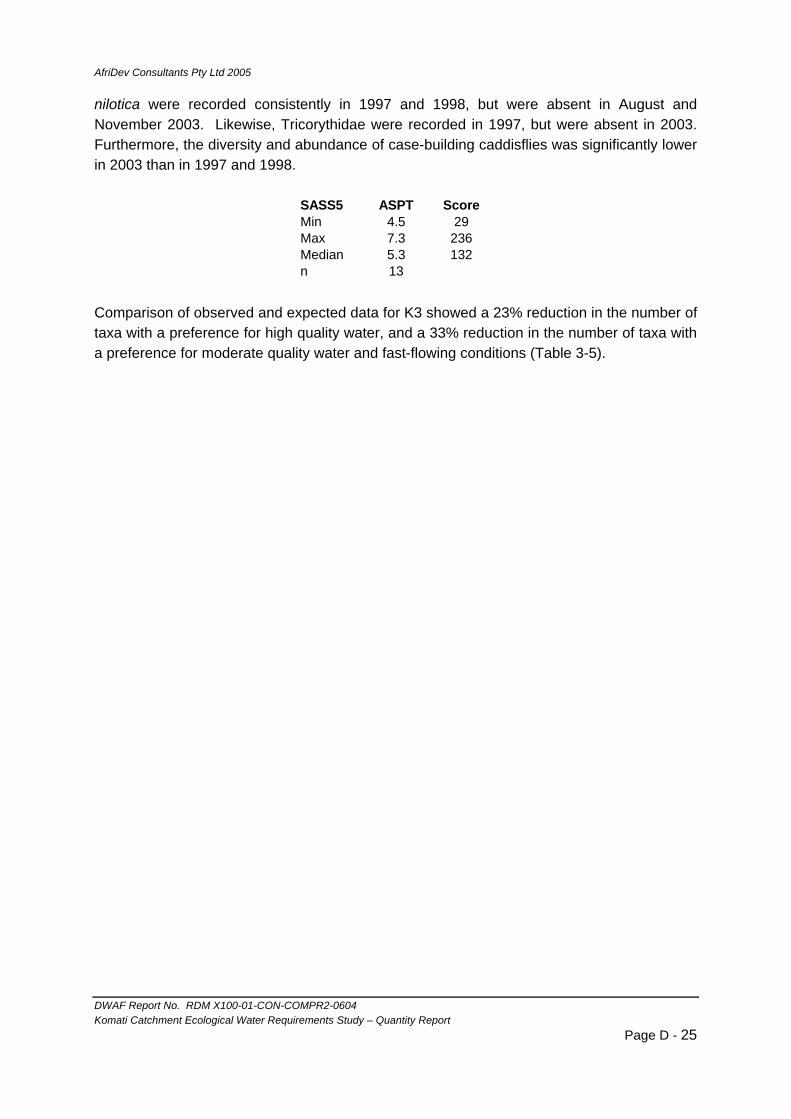
AfriDev Consultants Pty Ltd 2005
DWAF Report No. RDM X100-01-CON-COMPR2-0604 Komati Catchment Ecological Water Requirements Study – Quantity Report
Page D - 25
nilotica were recorded consistently in 1997 and 1998, but were absent in August and November 2003. Likewise, Tricorythidae were recorded in 1997, but were absent in 2003. Furthermore, the diversity and abundance of case-building caddisflies was significantly lower in 2003 than in 1997 and 1998.
SASS5 ASPT ScoreMin 4.5 29Max 7.3 236Median 5.3 132n 13
Comparison of observed and expected data for K3 showed a 23% reduction in the number of taxa with a preference for high quality water, and a 33% reduction in the number of taxa with a preference for moderate quality water and fast-flowing conditions (Table 3-5).

AfriDev Consultants Pty Ltd 2005
DWAF Report No. RDM X100-01-CON-COMPR2-0604 Komati Catchment Ecological Water Requirements Study – Quantity Report
Page D - 26
Table 3-5: Summary table showing the extent to which aquatic invertebrate taxa in various habitat preference groups at Site K3 have changed from expected reference conditions. The table shows the number of taxa recorded as a percentage of the number expected for each habitat preference group.
% taxaHabitat Preference Group
Current
spee
d
(m/s)
F1-Slow (0.1-0.3) 55F2-Mod (0.3-0.6) 43F3-Fast (>0.6) 33Curre
nt
spee
d
(m/s)
Substrate
Type
S1-Boulders/Bedrock 46S2-Loose Cobble 48S3-Veg 61S4-Sand, Gravel, Mud 60S5-Water Column & Surface 87Substr
ate Typ
e
Water
Quality
Q1-High (SASS>11) 23Q2-Mod (SASS 7-10) 33Q3-Low (SASS 4-6) 74Wate
r
Quality
3.4.3 Trends
Trends: -ve Short-term = Category: F Long-term=Category: F Confidence: 4 The available data indicate conclusively that ecological conditions within this RU are deteriorating rapidly under current development conditions.
3.4.4 Drivers
The altered conditions are partly related to the construction and management of weirs and dams that are used to supply water to the expanding sugar industry in the lowveld. Largest direct impacts are downstream of IYSIS Weir, in Swaziland, and Tonga Weir, in South Africa. The situation is aggravated by large numbers of people who were re-settled near Tonga during the apartheid era, and the sugar industry has attracted a large and expanding formal and informal settlements, with high levels of poverty, poor sanitation and low levels of food security. Historical conflict and limited job opportunities in neighbouring Mozambique has also caused an influx of immigrants in search of work and improved living conditions. The riparian zone is therefore heavily impacted upon by informal marketing gardening. The demand for housing in the area has also increased the extent of sand mining.
3.4.5 Pressures
c) Flow related Pressures The main flow-related pressures are periods of zero or very low flow, with associated deterioration in water quality.
AfriDev Consultants Pty Ltd 2005
DWAF Report No. RDM X100-01-CON-COMPR2-0604 Komati Catchment Ecological Water Requirements Study – Quantity Report
Page D - 27
d) Non-Flow Related Pressures The main non-flow related pressures are inundation caused by weirs, agricultural return flows, cultivation of riparian zones, sand and coal mining, and general use of the river for washing clothes, motorcars, the use of poisons for catching fish etc.
3.4.6 Impacts
The main impacts are absence of taxa that need high quality water, such as Perlidae, Machadorythus, Prosopistomatidae, Elassoneuria trimeniana, Centroptiloides bifasciata, Polycentropodidae, Pyralidae, Simulium cervicornutum and Simulium vorax, and very high abundance of the snail Melanoides tuberculata.
3.4.7 Recommended Ecological Category
Recommended Category: D Achievability: Moderate Confidence: 3 The recommended category for this RU is D which should be moderately easy to implement because it would simply require that the river remains perennial.
3.4.8 Responses
a) Flow related Responses Actions needed to address the flow-related impacts include:
1) Low-flows. The most important flow-related requirement is ensure that the river remains perennial. This could be achieved by installing suitably sized uncontrolled bottom outlets.
2) High-flows. Increasing the release of freshets from Driekoppies Dam. b) Non-Flow Related Pressures Actions needed to address the non-flow-related impacts include:
1) Riparian zone. Rehabilitation of the riparian zone and the control of informal market gardening in the riparian zone
2) Alien vegetation. Clearance of alien invasive vegetation from the riparian zone. This has been started by the Working for Water Programme, and should continue.
3) Sanitation and bacterial monitoring. Improved sanitation and monitoring of bacterial water quality monitoring is also recommended.
4) Sand Mining. Control of sand mining in the riparian zone

AfriDev Consultants Pty Ltd 2005
DWAF Report No. RDM X100-01-CON-COMPR2-0604 Komati Catchment Ecological Water Requirements Study – Quantity Report
Page D - 28
3.5 RESOURCE UNIT E – LOWER KOMATI: KOMATIPOORT (K5)
There are no known historical data on aquatic invertebrates from the Komati River near Komatipoort other than information collected on mayflies by Mathews (1968). The fauna is expected to be very similar to the fauna at Tonga. The only additional taxon that is known to occur at K5 is the freshwater prawn Macrobrachium sp (Engelbrecht pers comm).
3.6 RESOURCE UNIT G – GLADDESPRUIT (G1)
3.6.1 Reference Conditions
Confidence: 4 There are no known reference data available on aquatic invertebrates in the Gladdespruit, but data were collected in the Barberton Mountain in the 19060s by Hughes (1966a, b). Taxa expected to have occurred naturally in the Gladdespruit, based on professional judgement and information collected by Hughes, are listed in Appendix C.
3.6.2 Present Ecological State
PES Category: D Confidence: 4 Data were available for 21 SASS samples recorded at 13 sampling sites (including tributaries) within this Resource Unit, so confidence in the results was high. The data were collected by Dr Mark Chutter (1996), Ms Christa Thirion (1994 and 1995), Mr Gerhard Diedericks (2001, 2002, 2003), and once by Dr Rob Palmer during this study (August 2003). The fauna was characterised by a very low diversity but generally high numbers of Baetidae, Hydropsychidae, Corixidae and Chironomidae, and absence or low abundance of Tricorythidae, Heptageniidae, gastropoda and Coenagrionidae. Functional feeding groups were most often dominated by predators and gathering collectors. Total SASS Scores were highly variable and ranged between 37 and 170 (median = 103), while the ASPT ranged between 4.2 and 8.5 (median = 5.5). Overall, the invertebrate fauna was considered to be in a poor condition (Category D), with lowest scores recorded downstream of the Mamre Village (ASPT 4.2). Here raw sewage was entering directly into the Duikers Creek tributary and flowing into the Gladdespruit a few hundred meters further downstream.
SASS5 ASPT ScoreMin 4.2 37Max 8.5 170Median 5.5 103n 21
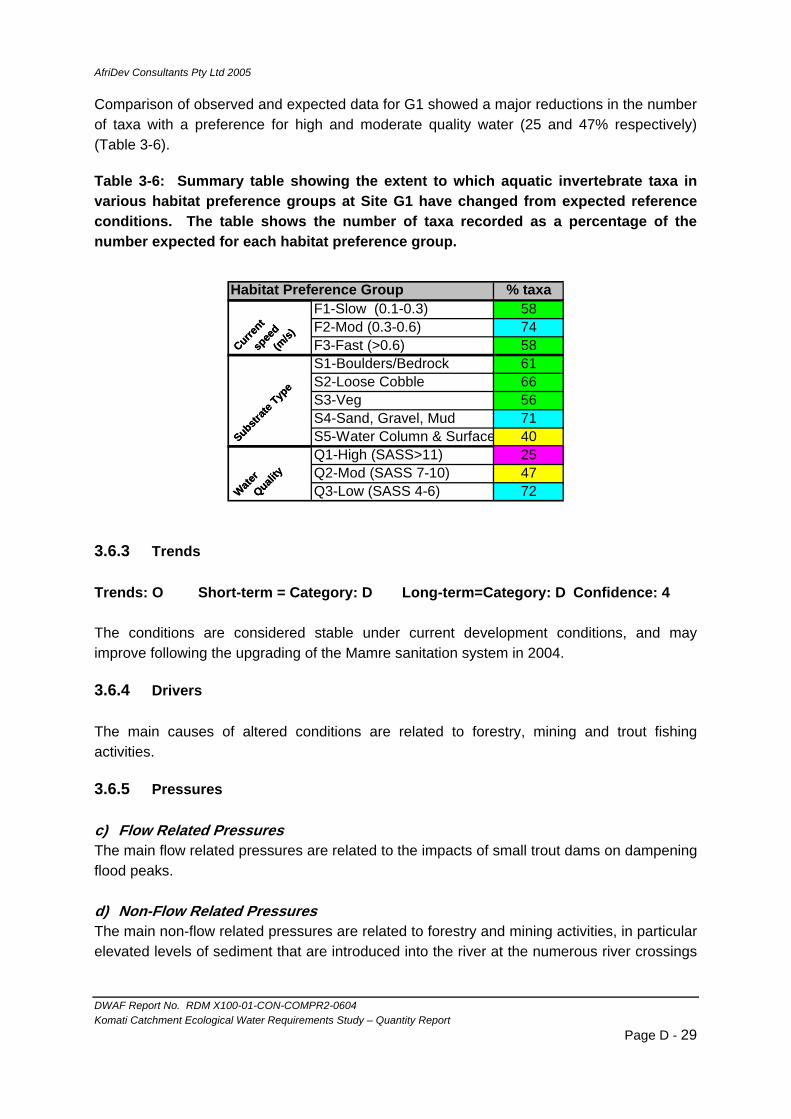
AfriDev Consultants Pty Ltd 2005
DWAF Report No. RDM X100-01-CON-COMPR2-0604 Komati Catchment Ecological Water Requirements Study – Quantity Report
Page D - 29
Comparison of observed and expected data for G1 showed a major reductions in the number of taxa with a preference for high and moderate quality water (25 and 47% respectively) (Table 3-6).
Table 3-6: Summary table showing the extent to which aquatic invertebrate taxa in various habitat preference groups at Site G1 have changed from expected reference conditions. The table shows the number of taxa recorded as a percentage of the number expected for each habitat preference group.
% taxaHabitat Preference Group
Current
spee
d
(m/s)
F1-Slow (0.1-0.3) 58F2-Mod (0.3-0.6) 74F3-Fast (>0.6) 58Curre
nt
spee
d
(m/s)
Substrate
Type
S1-Boulders/Bedrock 61S2-Loose Cobble 66S3-Veg 56S4-Sand, Gravel, Mud 71S5-Water Column & Surface 40Substr
ate Typ
e
Water
Quality
Q1-High (SASS>11) 25Q2-Mod (SASS 7-10) 47Q3-Low (SASS 4-6) 72Wate
r
Quality
3.6.3 Trends
Trends: O Short-term = Category: D Long-term=Category: D Confidence: 4 The conditions are considered stable under current development conditions, and may improve following the upgrading of the Mamre sanitation system in 2004.
3.6.4 Drivers
The main causes of altered conditions are related to forestry, mining and trout fishing activities.
3.6.5 Pressures
c) Flow Related Pressures The main flow related pressures are related to the impacts of small trout dams on dampening flood peaks. d) Non-Flow Related Pressures The main non-flow related pressures are related to forestry and mining activities, in particular elevated levels of sediment that are introduced into the river at the numerous river crossings

AfriDev Consultants Pty Ltd 2005
DWAF Report No. RDM X100-01-CON-COMPR2-0604 Komati Catchment Ecological Water Requirements Study – Quantity Report
Page D - 30
associated with a gravel roads that service forestry plantations and mining areas, burning and logging and associated increased sediment production, seepage of acid mine water from abandoned gold mines, and organic pollution from the village of Mamre. The disturbance to riparian zones has also encouraged the dramatic spread of alien invasive plants, particularly wattle and bugweed.
3.6.6 Impacts
The main impacts are related to the development of yellow boy (Sphaericus natans) and associated reduction in the suitability of instream habitats. In 2003 the yellow boy was restricted to a short stretch of river downstream of Mamre. The diversity of aquatic biota that are sensitive to changes in water quality was impoverished for the RU as a whole, and taxa that would have been expected at Site G but were not found in 2003 included Hydrachnellida, Perlidae, Heptageniidae, Blephariceridae, Tricorythidae, Protoneuridae, Calopterygidae, Naucoridae, Hydraenidae, Psephenidae, Simulium vorax and Athericidae.
3.6.7 Recommended Ecological Category
Recommended Category: D Achievability: Easy Confidence: 4 The recommended category for this Resource Unit is D because the PES recorded at Site G1 was a Category D. This may be easily achievable at Site G1, which is maintained by tributary accruals, but the challenge will be to achieve this state closer to Mamre Village.
3.6.8 Responses
a) Flow related Responses No actions are needed to address the flow-related impacts upstream of Vriesland Weir, and it is assumed that the Gladdespruit downstream of Vriesland Weir will continue to not be maintained as an ecologically functioning river.
b) Non-Flow Related Responses Actions needed to address the non-flow-related impacts include:
1) Sediments. Maintenance of stream crossings, with particular focus on road drainage to ensure that stormwaters from the gravel roads are directed into riparian buffer zones, rather than directly into the river,
2) Alien vegetation. Clearance of alien invasive vegetation from the riparian zone. 3) Sanitation and bacterial monitoring. Improved sanitation and monitoring of bacterial
water quality is also recommended, particularly in the vicinity of Mamre Village.
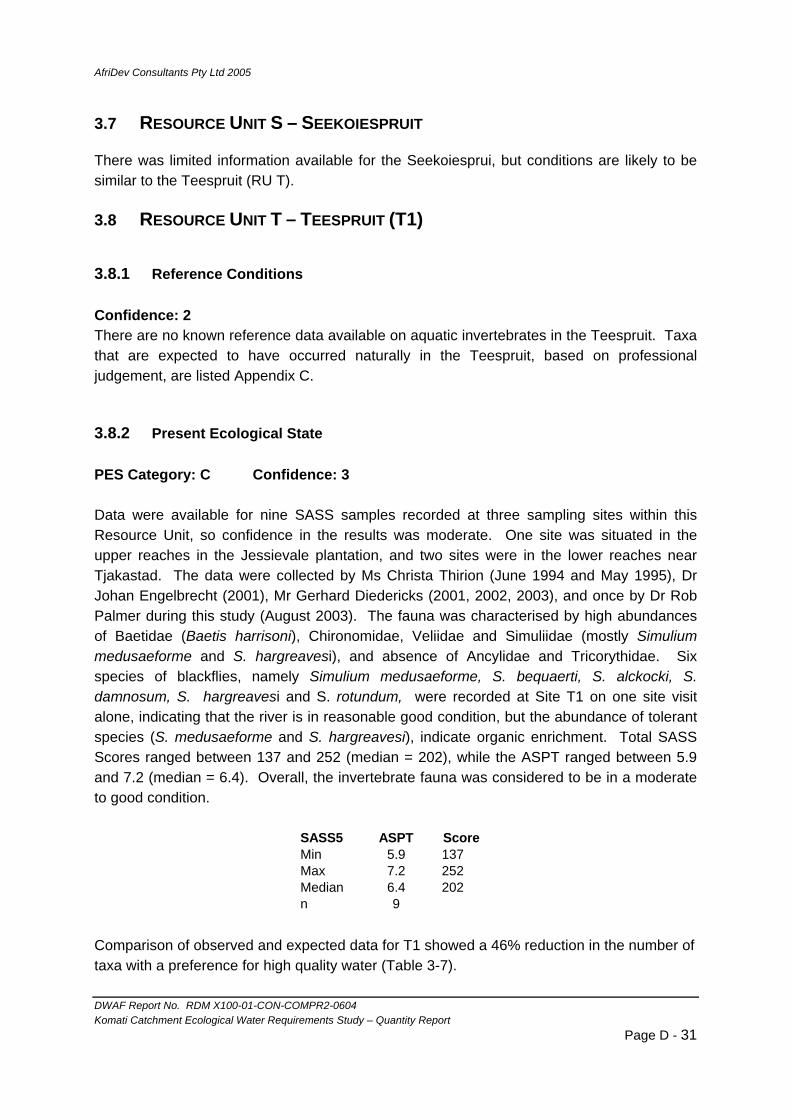
AfriDev Consultants Pty Ltd 2005
DWAF Report No. RDM X100-01-CON-COMPR2-0604 Komati Catchment Ecological Water Requirements Study – Quantity Report
Page D - 31
3.7 RESOURCE UNIT S – SEEKOIESPRUIT
There was limited information available for the Seekoiesprui, but conditions are likely to be similar to the Teespruit (RU T).
3.8 RESOURCE UNIT T – TEESPRUIT (T1)
3.8.1 Reference Conditions
Confidence: 2 There are no known reference data available on aquatic invertebrates in the Teespruit. Taxa that are expected to have occurred naturally in the Teespruit, based on professional judgement, are listed Appendix C.
3.8.2 Present Ecological State
PES Category: C Confidence: 3 Data were available for nine SASS samples recorded at three sampling sites within this Resource Unit, so confidence in the results was moderate. One site was situated in the upper reaches in the Jessievale plantation, and two sites were in the lower reaches near Tjakastad. The data were collected by Ms Christa Thirion (June 1994 and May 1995), Dr Johan Engelbrecht (2001), Mr Gerhard Diedericks (2001, 2002, 2003), and once by Dr Rob Palmer during this study (August 2003). The fauna was characterised by high abundances of Baetidae (Baetis harrisoni), Chironomidae, Veliidae and Simuliidae (mostly Simulium medusaeforme and S. hargreavesi), and absence of Ancylidae and Tricorythidae. Six species of blackflies, namely Simulium medusaeforme, S. bequaerti, S. alckocki, S. damnosum, S. hargreavesi and S. rotundum, were recorded at Site T1 on one site visit alone, indicating that the river is in reasonable good condition, but the abundance of tolerant species (S. medusaeforme and S. hargreavesi), indicate organic enrichment. Total SASS Scores ranged between 137 and 252 (median = 202), while the ASPT ranged between 5.9 and 7.2 (median = 6.4). Overall, the invertebrate fauna was considered to be in a moderate to good condition.
SASS5 ASPT ScoreMin 5.9 137Max 7.2 252Median 6.4 202n 9
Comparison of observed and expected data for T1 showed a 46% reduction in the number of taxa with a preference for high quality water (Table 3-7).
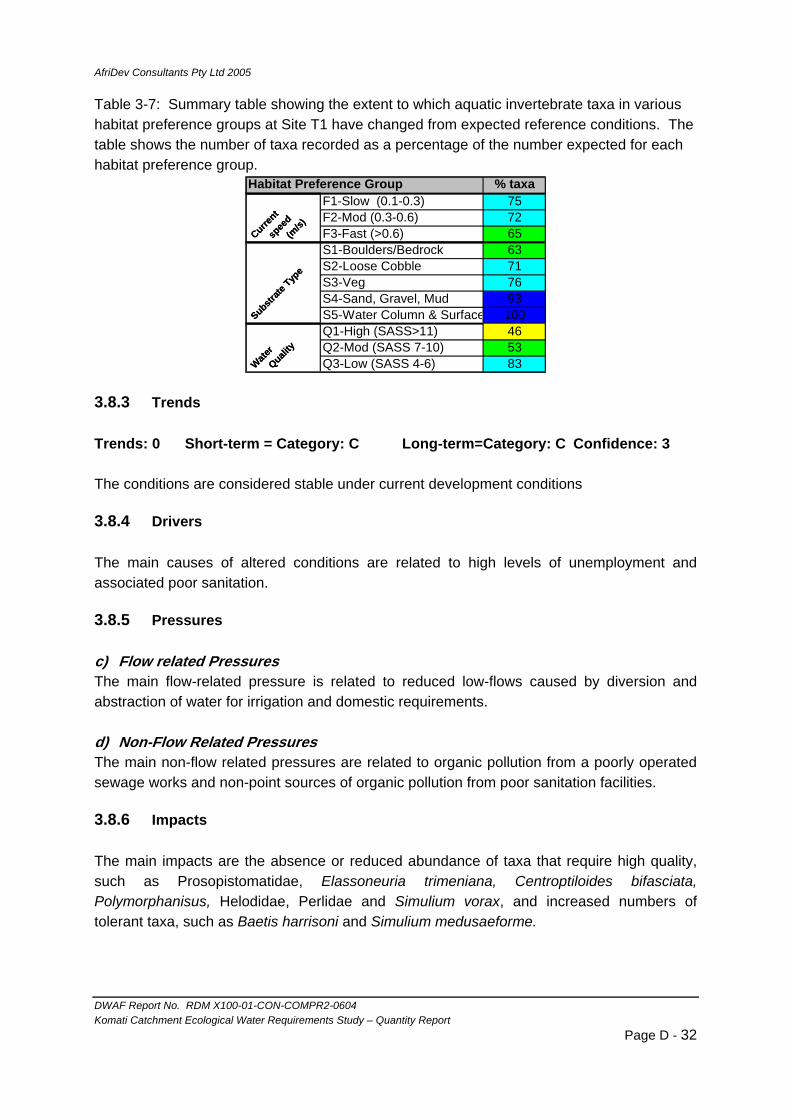
AfriDev Consultants Pty Ltd 2005
DWAF Report No. RDM X100-01-CON-COMPR2-0604 Komati Catchment Ecological Water Requirements Study – Quantity Report
Page D - 32
Table 3-7: Summary table showing the extent to which aquatic invertebrate taxa in various habitat preference groups at Site T1 have changed from expected reference conditions. The table shows the number of taxa recorded as a percentage of the number expected for each habitat preference group.
% taxaHabitat Preference Group
Current
spee
d
(m/s)
F1-Slow (0.1-0.3) 75F2-Mod (0.3-0.6) 72F3-Fast (>0.6) 65Curre
nt
spee
d
(m/s)
Substrate
Type
S1-Boulders/Bedrock 63S2-Loose Cobble 71S3-Veg 76S4-Sand, Gravel, Mud 93S5-Water Column & Surface 100Substr
ate Typ
e
Water
Quality
Q1-High (SASS>11) 46Q2-Mod (SASS 7-10) 53Q3-Low (SASS 4-6) 83Wate
r
Quality
3.8.3 Trends
Trends: 0 Short-term = Category: C Long-term=Category: C Confidence: 3 The conditions are considered stable under current development conditions
3.8.4 Drivers
The main causes of altered conditions are related to high levels of unemployment and associated poor sanitation.
3.8.5 Pressures
c) Flow related Pressures The main flow-related pressure is related to reduced low-flows caused by diversion and abstraction of water for irrigation and domestic requirements. d) Non-Flow Related Pressures The main non-flow related pressures are related to organic pollution from a poorly operated sewage works and non-point sources of organic pollution from poor sanitation facilities.
3.8.6 Impacts
The main impacts are the absence or reduced abundance of taxa that require high quality, such as Prosopistomatidae, Elassoneuria trimeniana, Centroptiloides bifasciata, Polymorphanisus, Helodidae, Perlidae and Simulium vorax, and increased numbers of tolerant taxa, such as Baetis harrisoni and Simulium medusaeforme.

AfriDev Consultants Pty Ltd 2005
DWAF Report No. RDM X100-01-CON-COMPR2-0604 Komati Catchment Ecological Water Requirements Study – Quantity Report
Page D - 33
3.8.7 Recommended Ecological Category
Recommended Category: B Achievability: Easy Confidence: 3 The recommended category for this Resource Unit is B because of the presence of sensitive taxa such as Neoperla spio and Polymitarcyidae, and because ecological conditions further upstream in the catchment are generally good. This may be easily achievable at Site T1 through improvement management of the sanitation works.
3.8.8 Responses
a) Flow related Responses Actions needed to address the flow-related impacts include:
1) Low-flows. Increasing low-flow releases from the diversion weirs. 2) Stream flow reduction. Removal of exotic plantations that are within stream courses
and subsequent rehabilitation.
b) Non-Flow Related Responses Actions needed to address the non-flow-related impacts include:
1) Sediments. Maintenance of stream crossings, with particular focus on road drainage to ensure that stormwaters from the gravel roads are directed into riparian buffer zones, rather than directly into the river,
2) Alien vegetation. Clearance of alien invasive vegetation from the riparian zone. 3) Sanitation and bacterial monitoring. Improved sanitation and monitoring of bacterial
water quality is also recommended, particularly downstream of the sewage works.
3.9 RESOURCE UNIT L – UPPER LOMATI
There was insufficient invertebrate data for the upper Lomati River to present any meaningful results for this RU, although ecological conditions are excepted to be good.
3.10 RESOURCE UNIT M – LOWER LOMATI: DOWNSTREAM OF DRIEKOPPIES
DAM (L1)
3.10.1 Reference Conditions
Confidence: 2 Historical data on the composition of aquatic invertebrates in Resource Unit M are limited to:
• Once-off data on overall species composition and abundance collected by Prof Harrison at Richtershoek in November 1959 (Harrison 1960).
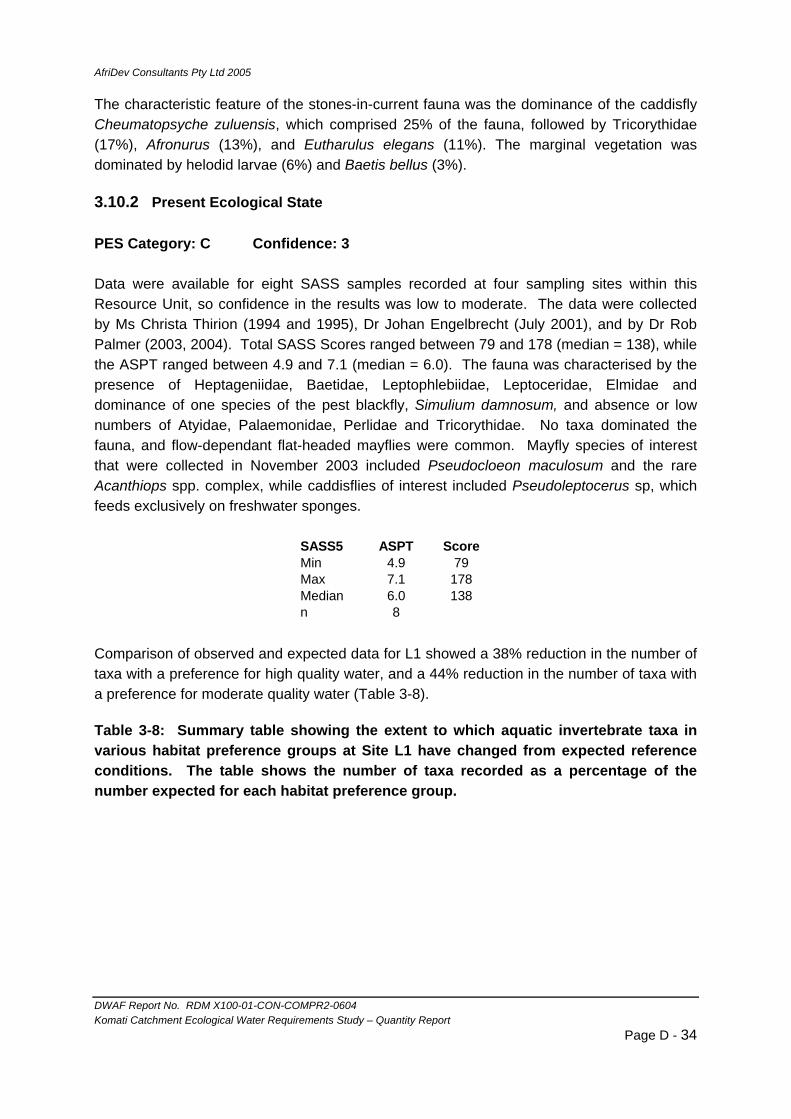
AfriDev Consultants Pty Ltd 2005
DWAF Report No. RDM X100-01-CON-COMPR2-0604 Komati Catchment Ecological Water Requirements Study – Quantity Report
Page D - 34
The characteristic feature of the stones-in-current fauna was the dominance of the caddisfly Cheumatopsyche zuluensis, which comprised 25% of the fauna, followed by Tricorythidae (17%), Afronurus (13%), and Eutharulus elegans (11%). The marginal vegetation was dominated by helodid larvae (6%) and Baetis bellus (3%).
3.10.2 Present Ecological State
PES Category: C Confidence: 3 Data were available for eight SASS samples recorded at four sampling sites within this Resource Unit, so confidence in the results was low to moderate. The data were collected by Ms Christa Thirion (1994 and 1995), Dr Johan Engelbrecht (July 2001), and by Dr Rob Palmer (2003, 2004). Total SASS Scores ranged between 79 and 178 (median = 138), while the ASPT ranged between 4.9 and 7.1 (median = 6.0). The fauna was characterised by the presence of Heptageniidae, Baetidae, Leptophlebiidae, Leptoceridae, Elmidae and dominance of one species of the pest blackfly, Simulium damnosum, and absence or low numbers of Atyidae, Palaemonidae, Perlidae and Tricorythidae. No taxa dominated the fauna, and flow-dependant flat-headed mayflies were common. Mayfly species of interest that were collected in November 2003 included Pseudocloeon maculosum and the rare Acanthiops spp. complex, while caddisflies of interest included Pseudoleptocerus sp, which feeds exclusively on freshwater sponges.
SASS5 ASPT ScoreMin 4.9 79Max 7.1 178Median 6.0 138n 8
Comparison of observed and expected data for L1 showed a 38% reduction in the number of taxa with a preference for high quality water, and a 44% reduction in the number of taxa with a preference for moderate quality water (Table 3-8).
Table 3-8: Summary table showing the extent to which aquatic invertebrate taxa in various habitat preference groups at Site L1 have changed from expected reference conditions. The table shows the number of taxa recorded as a percentage of the number expected for each habitat preference group.
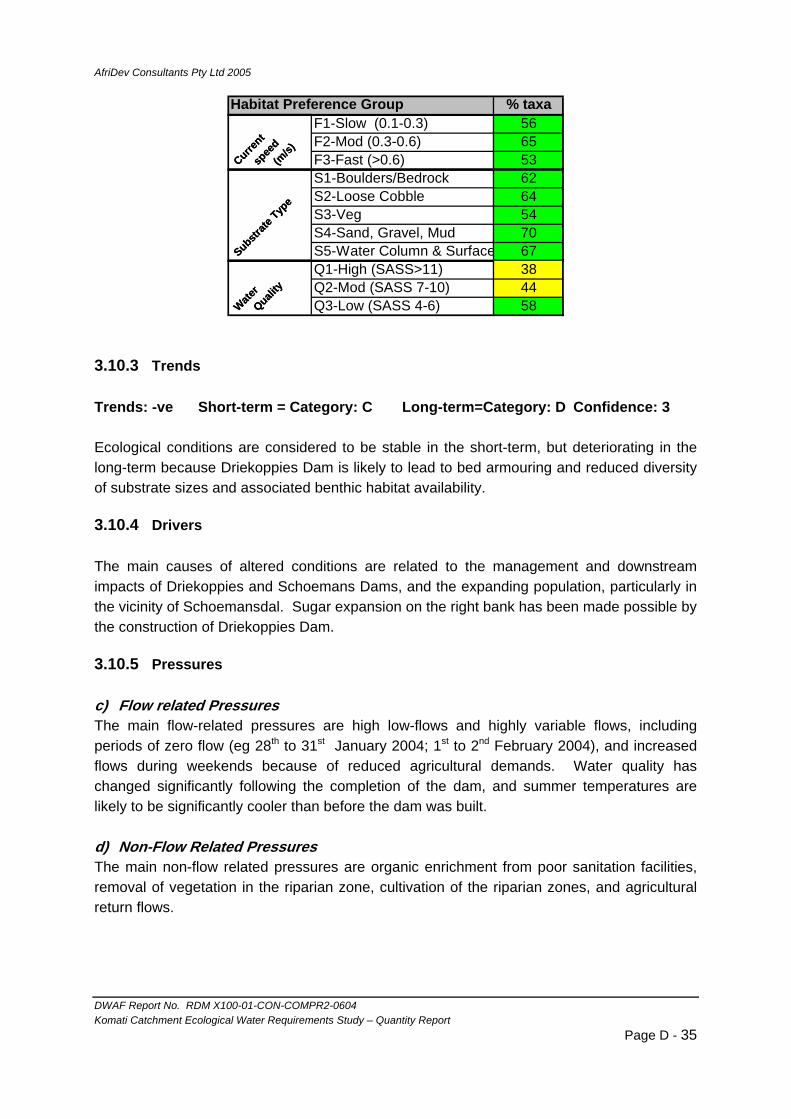
AfriDev Consultants Pty Ltd 2005
DWAF Report No. RDM X100-01-CON-COMPR2-0604 Komati Catchment Ecological Water Requirements Study – Quantity Report
Page D - 35
% taxaHabitat Preference Group
Current
spee
d
(m/s)
F1-Slow (0.1-0.3) 56F2-Mod (0.3-0.6) 65F3-Fast (>0.6) 53Curre
nt
spee
d
(m/s)
Substrate
Type
S1-Boulders/Bedrock 62S2-Loose Cobble 64S3-Veg 54S4-Sand, Gravel, Mud 70S5-Water Column & Surface 67Substr
ate Typ
e
Water
Quality
Q1-High (SASS>11) 38Q2-Mod (SASS 7-10) 44Q3-Low (SASS 4-6) 58Wate
r
Quality
3.10.3 Trends
Trends: -ve Short-term = Category: C Long-term=Category: D Confidence: 3 Ecological conditions are considered to be stable in the short-term, but deteriorating in the long-term because Driekoppies Dam is likely to lead to bed armouring and reduced diversity of substrate sizes and associated benthic habitat availability.
3.10.4 Drivers
The main causes of altered conditions are related to the management and downstream impacts of Driekoppies and Schoemans Dams, and the expanding population, particularly in the vicinity of Schoemansdal. Sugar expansion on the right bank has been made possible by the construction of Driekoppies Dam.
3.10.5 Pressures
c) Flow related Pressures The main flow-related pressures are high low-flows and highly variable flows, including periods of zero flow (eg 28th to 31st January 2004; 1st to 2nd February 2004), and increased flows during weekends because of reduced agricultural demands. Water quality has changed significantly following the completion of the dam, and summer temperatures are likely to be significantly cooler than before the dam was built. d) Non-Flow Related Pressures The main non-flow related pressures are organic enrichment from poor sanitation facilities, removal of vegetation in the riparian zone, cultivation of the riparian zones, and agricultural return flows.

AfriDev Consultants Pty Ltd 2005
DWAF Report No. RDM X100-01-CON-COMPR2-0604 Komati Catchment Ecological Water Requirements Study – Quantity Report
Page D - 36
3.10.6 Impacts
The main impacts are reduced abundance of taxa that require moderate and good quality, water, such as Machadorythus, Prosopistomatidae, Elassoneuria trimeniana, Tricorythidae, Corduliidae, Naucoridae, Ecnomidae, Aethaloptera maxima, Helodidae, Psephenidae, Dixidae, Simulium bovis, S. cervicornutum, S. impukane, S. mcmahoni, S. rotundum, S. vorax and Athericidae abundance of the pest blackfly Simulium damnosum.
3.10.7 Recommended Ecological Category
Recommended Category: C Achievability: Easy Confidence: 3 The recommended category for this Resource Unit is C because the PES recorded at Site L1 was a Category C. This may be easily achieved in the short-term, but will require particular care and management to ensure that it is maintained in the long-term.
3.10.8 Responses
a) Flow related Responses Actions needed to address the flow-related impacts include:
1) Low-flows. Stabilising low-flow releases Driekoppies Dam and avoiding periods of zero releases,
2) High-flows. Increasing the release of freshets from Driekoppies Dam.
b) Non-Flow Related Responses Actions needed to address the non-flow-related impacts include:
1) Alien vegetation. Clearance of alien invasive vegetation from the riparian zone. 2) Vegetation clearance. Monitoring and management of the removal of riparian
vegetation. 3) Bacterial monitoring. Bacterial water quality monitoring is also recommended.
3.11 RESOURCE UNIT – SWAZILAND: DOWNSTREAM OF MAGUGA DAM (M1)
3.11.1 Reference Conditions
The only available historical data on the overall composition of aquatic invertebrates from the middle Komati River were collected by Prof Harrison at Badplaas and Bordergate in the 1960s (Albany Museum records). These records, together with a study on mayflies in the Komati and Crocodile Rivers by Mathews (1968), and a study of snails by Schutte and Frank (1964), provided a fairly good indication of what the aquatic invertebrate fauna is likely to have been at M1 before major development. The site is likely to have had a large variety of habitats, including extensive sand, pebble and cobble bars with a wide range of particle size
AfriDev Consultants Pty Ltd 2005
DWAF Report No. RDM X100-01-CON-COMPR2-0604 Komati Catchment Ecological Water Requirements Study – Quantity Report
Page D - 37
distributions. Taxa that are almost certain to have occurred historically at M1 include the following:
• water mites (Hydracarina); • Diverse mayfly fauna, including Machadorythus maculatus; Prosopistomatidae,
Afronurus spp., Centroptiloides bifasciata, Demoulina crassi and Tricorythus; • Diverse caddisfly fauna, including Cheumatopsyche afra, Cheumatopsyche
maculata, Polymorphanisus bipuntatus, Chimarra and several genera of case-building Leptoceridae, including Athripsodes, Leptocerus, Leptocerina, Oecetus, Parasetodes;
• Diverse elmid beetle fauna (five species were recorded on one sampling occasion near Badplaas);
• Moderate diversity of snail species, including Lymnaea columella, Gyraulus costulatus, and the intermediate host of rectal bilharzia, Biomphalaria pfefferi.
• Moderate diversity of blackfly species, including Simulium impukane and S. cervicornutum.
Data collected at M1 in 1997 and 1998 showed that several species appear to have disappeared since the 1960s. These include the previously abundant mayfly Machadorythus maculata, and the caddisflies Cheumatopsyche maculata and Polymorphanisus bipuntatus. There has also been a significant increase in the diversity and abundance of filter-feeders since the 1960s. Filter-feeding caddisflies such as Cheumatopsyche afra, C. thomasseti, Amphipsyche scottae and Aethaloptera maxima were particularly abundant in 1997 and 1998. Likewise, a total of nine species of filter-feeding blackflies was recorded on four site visits (Simulium adersi, S. bovis, S. cervicornutum, S. damnosum, S. hargreavesi, S. mcmahoni, S. impukane, S. rotundum and S. vorax). The changes in species composition indicate a slight deterioration in ecological conditions, presumably caused by Vygeboom Dam and the associated increase in phytoplankton which favours filter-feeding invertebrates, as well as increased levels of sediment caused by roads, forestry, and general catchment development. Flow-dependant taxa that were consistently present in 1997 and 1998 included stoneflies (Neoperla spio), and flatheaded mayflies (Afronurus spp). These taxa provide useful indicactors of flow-related changes. Summary SASS results recorded at M1 in 1997 and 1998, prior to the construction of Maguga Dam, are shown in Table 3-9.
Table 3-9. Summary SASS results for M1 in 1997 and 1998, before the construction of Maguga Dam.
25 May 1997. Sensitive taxa (ASPT > 7.0) dominated the SIC biotope. Porifera were present in the stones biotope. No Gastropoda families were encountered. 16 July 1997. The ASPT of the SIC biotope were < 7.0, while the ASPT for the vegetation biotope was > 7.0. The sand/mud biotope was absent at this
AfriDev Consultants Pty Ltd 2005
DWAF Report No. RDM X100-01-CON-COMPR2-0604 Komati Catchment Ecological Water Requirements Study – Quantity Report
Page D - 38
sampling site. A high diversity of taxa was encountered in the marginal vegetation biotope. Tricorythidae and Leptophlebiidae were absent from the sample. 06 August 1997. The ASPT for the SIC biotope were < 7.0, and the ASPT for the marginal vegetation biotope were > 7.0. Leptophlebiidae and Tricorythidae were absent from the sample. No Gastropoda families were encountered. 11 October 1997. High stream flow limited SASS sampling. Sensitive taxa (ASPT > 7.0) dominated the SIC and marginal vegetation biotopes. Leptophlebiidae and Tricorythidae were absent from the sample. Prosopistomatidae were encountered in the SIC and cobble biotopes. 14 March 1998. A low diversity of taxa was encountered in the SIC biotope, but the taxa within this biotope were sensitive taxa (ASPT 8.6). Leptophlebiidae and Simuliidae were absent from the sample, and only two Baetidae species were encountered. Unionidae were present in the cobble biotope.
3.11.2 Present Ecological State
PES Category: B Confidence: 4 Data were available for nine SASS samples recorded at M1, so confidence in the results was high. The data were collected by Dr Rob Palmer during the Maguga IFR Study (May 1997 to March 1998) and subsequent IFR monitoring (November 2003 to November 2004). Since the completion of Maguga Dam in 2000 the fauna has been characterised by high abundances of baetid and leptophlebid mayflies. Flow-dependant flat-headed mayflies and stoneflies were both present, and population densities of blackflies and caddisfly larvae were not high. The results indicate that the invertebrate composition has changed following the completion of Maguga Dam, but there is no evidence to suggest that conditions have deteriorated because of Maguga Dam. Functional feeding groups have been dominated by filterers and gathering collectors. Total SASS Scores ranged between 156 and 210 (median = 189), while the ASPT ranged between 5.9 and 7.0 (median = 6.2). Overall, the invertebrate fauna was considered to be in a good condition (Category B).
SASS5 ASPT ScoreMin 5.9 156Max 7.0 210Median 6.2 189
n 9 The most significant changes since the 1997/1998 baseline data are as follows:
• Increase in Limpets: Limpets (Ancylidae) were recorded once only during baseline surveys in 1997 and 1998, but were common during this survey (in November 2003).
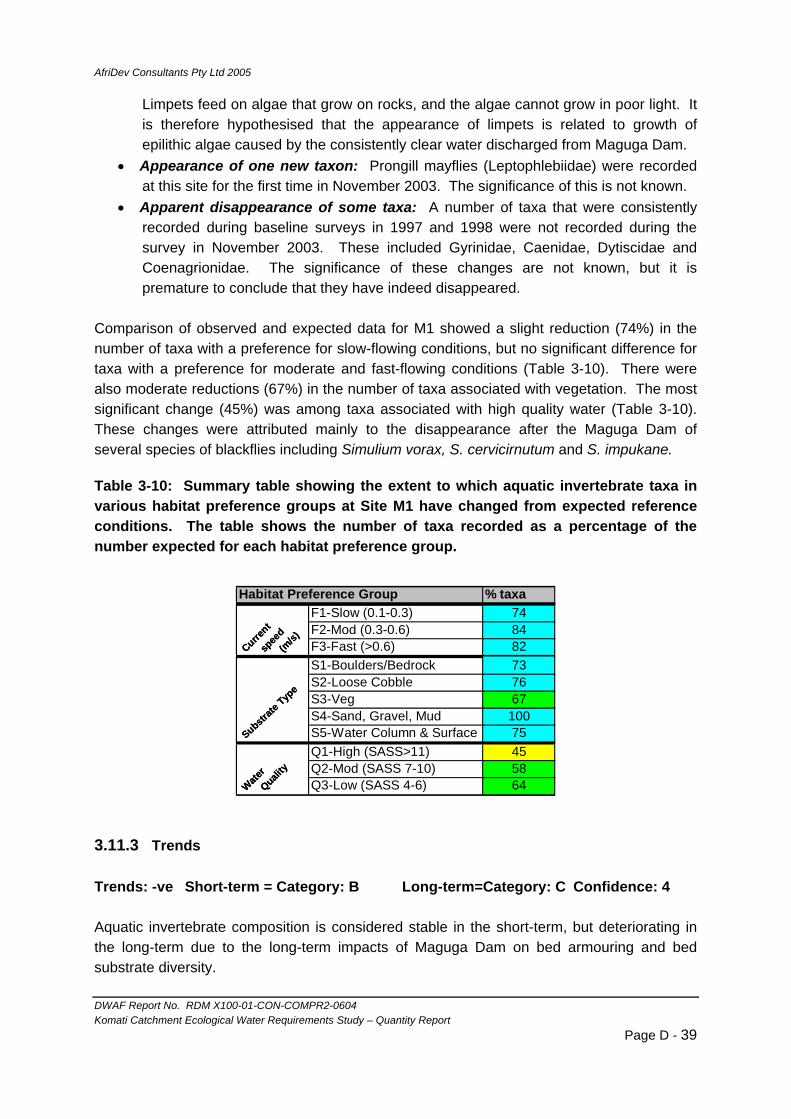
AfriDev Consultants Pty Ltd 2005
DWAF Report No. RDM X100-01-CON-COMPR2-0604 Komati Catchment Ecological Water Requirements Study – Quantity Report
Page D - 39
Limpets feed on algae that grow on rocks, and the algae cannot grow in poor light. It is therefore hypothesised that the appearance of limpets is related to growth of epilithic algae caused by the consistently clear water discharged from Maguga Dam.
• Appearance of one new taxon: Prongill mayflies (Leptophlebiidae) were recorded at this site for the first time in November 2003. The significance of this is not known.
• Apparent disappearance of some taxa: A number of taxa that were consistently recorded during baseline surveys in 1997 and 1998 were not recorded during the survey in November 2003. These included Gyrinidae, Caenidae, Dytiscidae and Coenagrionidae. The significance of these changes are not known, but it is premature to conclude that they have indeed disappeared.
Comparison of observed and expected data for M1 showed a slight reduction (74%) in the number of taxa with a preference for slow-flowing conditions, but no significant difference for taxa with a preference for moderate and fast-flowing conditions (Table 3-10). There were also moderate reductions (67%) in the number of taxa associated with vegetation. The most significant change (45%) was among taxa associated with high quality water (Table 3-10). These changes were attributed mainly to the disappearance after the Maguga Dam of several species of blackflies including Simulium vorax, S. cervicirnutum and S. impukane.
Table 3-10: Summary table showing the extent to which aquatic invertebrate taxa in various habitat preference groups at Site M1 have changed from expected reference conditions. The table shows the number of taxa recorded as a percentage of the number expected for each habitat preference group.
Habitat Preference Group % taxa
Current
spee
d
(m/s)
F1-Slow (0.1-0.3) 74F2-Mod (0.3-0.6) 84F3-Fast (>0.6) 82Curre
nt
spee
d
(m/s)
Substrate
Type
S1-Boulders/Bedrock 73S2-Loose Cobble 76S3-Veg 67S4-Sand, Gravel, Mud 100S5-Water Column & Surface 75Substr
ate Typ
e
Water
Quality
Q1-High (SASS>11) 45Q2-Mod (SASS 7-10) 58Q3-Low (SASS 4-6) 64Wate
r
Quality
3.11.3 Trends
Trends: -ve Short-term = Category: B Long-term=Category: C Confidence: 4 Aquatic invertebrate composition is considered stable in the short-term, but deteriorating in the long-term due to the long-term impacts of Maguga Dam on bed armouring and bed substrate diversity.
AfriDev Consultants Pty Ltd 2005
DWAF Report No. RDM X100-01-CON-COMPR2-0604 Komati Catchment Ecological Water Requirements Study – Quantity Report
Page D - 40
3.11.4 Drivers
The main causes of altered conditions are related to the management and downstream impacts of Maguga Dam and Nyonyane Weir.
3.11.5 Pressures
c) Flow related Pressures The main flow-related pressures are related to reduced frequency and size of intra-annual floods and reduction in low-flows. d) Non-Flow Related Pressures The main non-flow related pressures are related to altered water quality, particularly turbidity, which has decreased because of Maguga Dam.
3.11.6 Impacts
The main impacts are the increased abundance of limpets (Burnupia sp) and prongill mayflies (Euthraulus elegans), and reduction in taxa that require high quality water, such as Simulium vorax and S. cervicornutum.
3.11.7 Recommended Ecological Category
Recommended Category: B Achievability: Variable Confidence: 3 The recommended category for this Resource Unit is B because of the presence of sensitive taxa such as Neoperla spio and high diversity of caddisflies, and because the PES recorded at Site M1 was a Category B. This may be easily achievable at Site M1, which is maintained by tributary accruals, but the challenge will be to achieve this state closer to Maguga Dam, particularly if the hydroelectricity turbines are installed.
3.11.8 Responses
a) Flow related Responses Actions needed to address the flow-related impacts include:
1) Low-flows. Increasing low-flow releases from Maguga Dam, and; 2) High-flows. Increasing the release of freshets from Maguga Dam.
b) Non-Flow Related Responses Actions needed to address the non-flow-related impacts include:
1) Water Quality Monitoring. Continued monitoring of water quality in and downstream of Maguga Dam is recommended.

AfriDev Consultants Pty Ltd 2005
DWAF Report No. RDM X100-01-CON-COMPR2-0604 Komati Catchment Ecological Water Requirements Study – Quantity Report
Page D - 41
4. DISCUSSION
Target indicators Several taxa that require fast-flowing, good quality water are commonly found in the Komati River Catchment. Typical examples include stoneflies (Perlidae), flat-headed mayflies (Heptageniidae: Afronurus spp.), brushlegged mayflies (Elassoneuria sp.). These taxa are easily recognised, and could be used as reliable indicators of healthy conditions at some of the IFR sites, although it should be noted that the occurrence of brushlegged mayflies is seasonal. Freshwater prawns In South Africa, freshwater prawns (Macrobrachium spp.) are restricted to rivers in the Lowveld and the KwaZulu/Natal coastal belt. These prawns are thought to breed in saline conditions found in estuaries and then to migrate up rivers to develop to maturity, when they return to estuaries. They are restricted to riffle habitats, and are therefore susceptible to low flow periods. These prawns are expected in the lower Komati and Lomati Rivers, but the construction of dams and weirs create major barriers to the upstream migration of these prawns. The conservation status of M. lepidactylus is considered endangered, while that of M. petersii is considered endemic to southeast Africa (Taylor 1990). No weirs or dams have been designed or built to include a passageway specifically for prawns (Taylor pers. comm. 1999). Fishways are likely to be unsuitable for prawn migration because of their steep gradient. However, it would be feasible to design a passageway specifically for prawns, providing the gradient is not too steep (Taylor pers. comm. 1999). Undesirable species Three of the most undesirable invertebrate taxa in the Komati River Catchment are the snails Biomphalaria pfeifferi and Bulinus africanus, both intermediate hosts of the parasite Schistosoma spp., which causes bilharzia in man. Neither species can tolerate current speeds exceeding 0.3 m/s, and can be effectively controlled with periodic spates (Brown 1994). Other undersirable species in the Komati River Catchment are the blackflies Simulium damnosum, S. adersi, and S. bovis, whose adult females feed on blood. Their larvae are found exclusively in flowing water. Pest outbreaks are usually associated with extended periods of high flow, particularly unnatural high winter flow. Cobble and gravel bars The maintenance of cobble and gravel bars is one of the most important considerations for instream flow requirements as far as invertebrates are concerned. There are several reasons
AfriDev Consultants Pty Ltd 2005
DWAF Report No. RDM X100-01-CON-COMPR2-0604 Komati Catchment Ecological Water Requirements Study – Quantity Report
Page D - 42
for this. Firstly, cobble bars are important ecological nodes in a river system, as they are often highly productive areas and usually support a high diversity of aquatic invertebrates. Secondly, during spates, benthic invertebrates often take refuge in the protective spaces between cobbles. Highest diversity and abundance of invertebrates can be as much as 30cm below the surface of a cobble bed. By providing protection from floods and spates, cobble bars are an extremely important biotope and enable rapid recolonisation after floods and spates. Lastly, many aquatic insects lay their eggs on substrates in shallow water with a gentle current. The suitability of oviposition sites depends on the depth of water, the current speed, and the availability of partially submerged stones. Partially submerged cobble bars with a gentle flow provide ideal oviposition sites for aquatic insects. Water depth Studies have shown a parabolic relation between invertebrate diversity and depth within the stones-in-current biotope. In the Sabie River, Mpumalanga Province, highest invertebrate diversity was found at a depth of 30 cm (Weeks et al. 1996). However, a minimum depth of 5 cm was considered acceptable in September, when water temperatures are unlikely to be excessively warm (Tharme 1997). Similar values were reported for rivers in North America (28 cm: Gore 1978; 34 cm: Orth and Maughan 1983). In the Senqu River, a minimum depth in the rapids of 30 cm was recommended for aquatic invertebrates during maintenance years, and 10 cm during drought years (Chutter 1995). In the Lomati River, a minimum depth in the rapids of 20 cm was recommended during maintenance years, and 10 cm during drought years (Chutter 1994).
Current speed Studies have also shown a parabolic relation between invertebrate diversity and current speed. In the Sabie River, highest invertebrate diversity was found at current speeds of 0.63-1.0 m/s (Weeks et al 1996). Similar values were reported for rivers in North America (0.76 m/s: Gore 1978; 0.6 m/s: Orth and Maughan 1983). Freshets Freshets are important for mobilising sediments and flushing accumulated debris, particularly decaying organic matter, as well as various forms of pollution. Freshets are also important reproductive cues. It is generally accepted that the timing of freshets should coincide with the natural seasonal pattern. If releases were timed correctly, water released from the dam would supplement the inflows from the tributaries, and therefore less water would need to be released in order to achieve a specific flow. It is therefore recommended that freshets should be linked with rainfall events. It is also generally accepted that the diversity and abundance of invertebrate assemblages increases along a gradient of increasing sediment particle size, from mud to cobbles.

AfriDev Consultants Pty Ltd 2005
DWAF Report No. RDM X100-01-CON-COMPR2-0604 Komati Catchment Ecological Water Requirements Study – Quantity Report
Page D - 43
However, the relation between particle size, stream flow and invertebrate diversity is complex. As current speeds increase, the first inorganic particles to be mobilised (start eroding) are sands with a particle size of 0.3-0.6mm (Gordon et al 1992). Smaller particles need higher current velocities for mobilisation because of electrochemical forces that bind particles together. At current speeds of <0.1m/s almost no particles are mobilised (apart from light organic material). Significant mobilisation will occur at current speeds exceeding 0.3m/s.
AfriDev Consultants Pty Ltd 2005
DWAF Report No. RDM X100-01-CON-COMPR2-0604 Komati Catchment Ecological Water Requirements Study – Quantity Report
Page D - 44
5. REFERENCES
APPLETON, C. C. 1975. The influence of stream geology on the distribution of the bilharzias host snails, Biomphalaria pfeifferi and Bulinus (Physopsis) sp. Annals of Tropical Medicine and Parasitology 69(2): 241-255.
APPLETON, C. C. 1977. The influence of abiotic factors on the distribution of Biomphalaria pfeifferi (Krauss 1848)(Mollusca: Planorbidae) and its life-cycle in south-eastern Africa: a review of the role of temperature. Journal of the South African Biological Society 18: 43-55.
BROWN, D. 1994. Freshwater snails of Africa and their medical importance. Taylor and Francis.
CHUTTER, F. M. 1994. Flow requirements of riverine invertebrates. In: Driekoppies Dam IFR Worksession. Department of Water Affairs and Forestry.
CHUTTER, F. M. 1995. Status of aquatic invertebrates and their habitat requirements. In: Legge K (ed). Senqu River IFR Workshop. Mabalingwe Lodge 19-21 April 1995. Department of Water Affairs and Forestry.
CHUTTER, F. M. 1996. A report on monitoring of the composition of invertebrate communities of the Slaaihoek Stream, the Uitkoms Stream and the Gladdespruit in June 1996. Internal repprt prepared for the Nkomati Joint Venture, Anglovaal Limited, Marshalltown.
DEPARTMENT OF WATER AFFAIRS AND FORESTRY, SOUTH AFRICA. 2003. Proceedings of Ecological Reserve (Quantity) Workshop. 8&9th April, Delectus Manor, Pretoria.
DICKENS, C. W. S. AND GRAHAM P. M. 2002. The South African Scoring System (SASS) Version 5 Rapid bioassessment method for rivers. African Journal of Aquatic Science 27(1): 1-10.
DIEDERICKS, G. 2001. Water quality biomonitoring: Komati Catchment. Tributaries of the Komati River that drain commercial forestry plantations. Baseline condition establishment and future management recommendations. Internal report prepared for Mondi, Global Forest Products and SAPPI.
DIEDERICKS, G. 2002. Water quality biomonitoring: Komati Catchment. Tributaries of the Komati River that drain commercial forestry plantations. Baseline condition establishment and future management recommendations. Internal report prepared for Mondi, Global Forest Products and SAPPI.
DIEDERICKS, G. 2003. Water quality biomonitoring: Komati Catchment. Tributaries of the Komati River that drain commercial forestry plantations. Baseline condition establishment and future management recommendations. Internal report prepared for Mondi, Global Forest Products and SAPPI.
GORDON, N.D., MCMAHON, T.A. & FINLAYSON, B.L. 1992. Stream Hydrology - an introduction for ecologists. John Wiley & Sons, Chichester.
GORE, J. A. 1978. A technique for predicting in-stream flow requirements for benthic macroinvertebrates. Freshwater Biology 8: 141-151.

AfriDev Consultants Pty Ltd 2005
DWAF Report No. RDM X100-01-CON-COMPR2-0604 Komati Catchment Ecological Water Requirements Study – Quantity Report
Page D - 45
HARRISON, A. D. 1959. Exploratory survey to the eastern and northern Transvaal. South African Hydrobiological Regions. Report No 2. National Institute for Water Research. Project 6.8H. Ref W6/6/8H.
HARRISON, A. D. 1960. Exploratory survey to Region K. South African Hydrobiological Regions. Report No 3. National Institute for Water Research. Project 6.8H. Ref W6/6/8H.
HUGHES, D. A. 1966a. Mountain streams of the Barberton Area, Eastern Transvaal. Part I, A survey of the fauna. Hydrobiologia 27:401-438
HUGHES, D. A. 1966a. Mountain streams of the Barberton Area, Eastern Transvaal. Part I, A survey of the fauna. Hydrobiologia 27:401-438
MACMILLAN, P. H. (1998). An Integrated Habitat Assessment System (IHAS version 2), for the rapid biological assessment of rivers and streams. A CSIR research project, Number ENV-P-I 98132 for Water Resources Management Programme, CSIR, ii + 44 pp.
MATHEW J. AND RYKE P.A.J. 1969. New records of rare ephemeropterans in the Komati River system, Easter Transvaal. Journal of the Entomological Society of South Africa 32:431-434.
MATTHEW, J. 1968. ‘n Ondersoek na die, verpsreiding van sekere ephemeroptera (insecta) in die, Komatirivierstelsel, Oos-transvaal. MSc thesis, Potchefstroom University of Higher Christian Education, Potchefstroom.
PALMER RW 1998. Aquatic Invertebrates. In: AfriDev, Knight Piésold Joint Venture and JTK Associates. 1998b. Environmental Impact Assessment and Instream Flow Requirements Mitigation. Supporting Report E: Instream Flow Requirements. Chapter 1. Internal Report prepared for the Komati Basin Water Authority. June 1998.
PITCHFORD, R. J. 1958. Bilharzia in Swaziland. Bulletin of the World Health Organisation 8: 735-750.
SCHUTTE, C. H. J AND FRANK, G. H. 1964. Observations on the distribution of the freshwater Mollusca and chemistry of the natural waters in the south-eastern Transvaal and adjacent Swaziland. Bulletin of the World Health Organisation 30: 389-400.
TAYLOR, L.R. 1990. The ecology of and genetic variation in selected species of the freshwater prawn genus Macrobrachium. PhD Thesis, Rand Afrikaans University, Johannesburg.
THARME, R. (1997). Sabie-Sand system instream flow requirements: proceedings of IFR workshop. Aan de Vliet, 18-22 August 1996. Southern Waters Report, Commissioned by the Department of Water Affairs and Forestry and Ninham Shand Consulting Engineers. 197 pp.
THIRION, C, 2005. Macro Invertebrate Response Assessment Index (MIRAI). Chapter 8 In: Kleynhans CJ at al (eds). River Ecoclassification: Manual for Ecostatus determination. Draft Report prepared by the Department of Water Affairs and Forestry, Resource Quality Services.
AfriDev Consultants Pty Ltd 2005
DWAF Report No. RDM X100-01-CON-COMPR2-0604 Komati Catchment Ecological Water Requirements Study – Quantity Report
Page D - 46
VOS, P., WEPENER, V & CYRUS, D. P. 2002. Efficiency of the SASS4 rapid bioassessment protocol in determining river health: A case study on the Mhlathuze River, KwaZulu-Natal, South Africa. Water SA 28(1): 13-22.
WEEKS, D.C., O'KEEFFE, J.H., FOURIE, A. & DAVIES, B.R. 1996. A pre-impoundment study of the Sabie-Sand River system, Mpumalanga with special reference to predicted impacts on the Kruger National Park. Volume One: The ecological status of the Sabie-Sand River system. Water Research Commission Report No. 294/1/96

AfriDev Consultants Pty Ltd 2005
DWAF Report No. RDM X100-01-CON-COMPR2-0604 Komati Catchment Ecological Water Requirements Study – Quantity Report
Page D - 47
6. ANNEXURES
AfriDev Consultants Pty Ltd 2005
DWAF Report No. RDM X100-01-CON-COMPR2-0604
ANNEX A: Maps of SASS Sampling Sites, SASS Scores and ASPT
Komati Catchment Ecological Water Requirements Study – Quantity Report Page D - 48
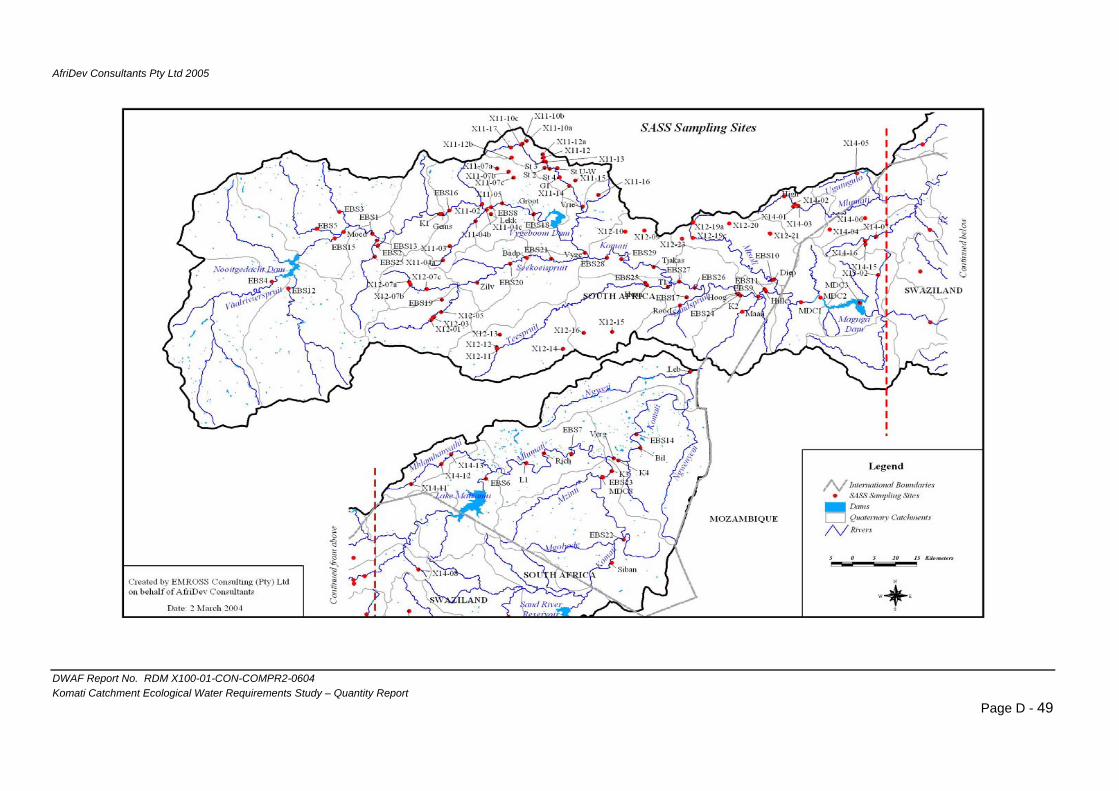
AfriDev Consultants Pty Ltd 2005
DWAF Report No. RDM X100-01-CON-COMPR2-0604
Komati Catchment Ecological Water Requirements Study – Quantity Report Page D - 49
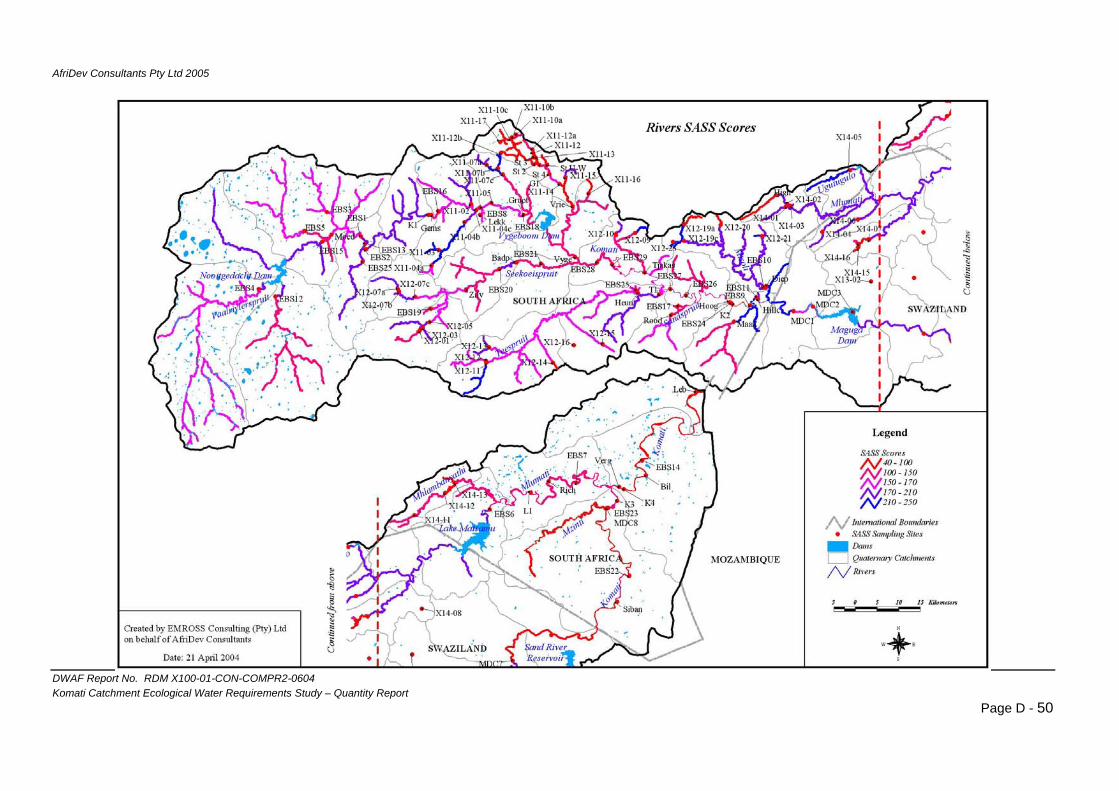
AfriDev Consultants Pty Ltd 2005
DWAF Report No. RDM X100-01-CON-COMPR2-0604 Komati Catchment Ecological Water Requirements Study – Quantity Report
Page D - 50

AfriDev Consultants Pty Ltd 2005
DWAF Report No. RDM X100-01-CON-COMPR2-0604 Komati Catchment Ecological Water Requirements Study – Quantity Report
Page D - 51
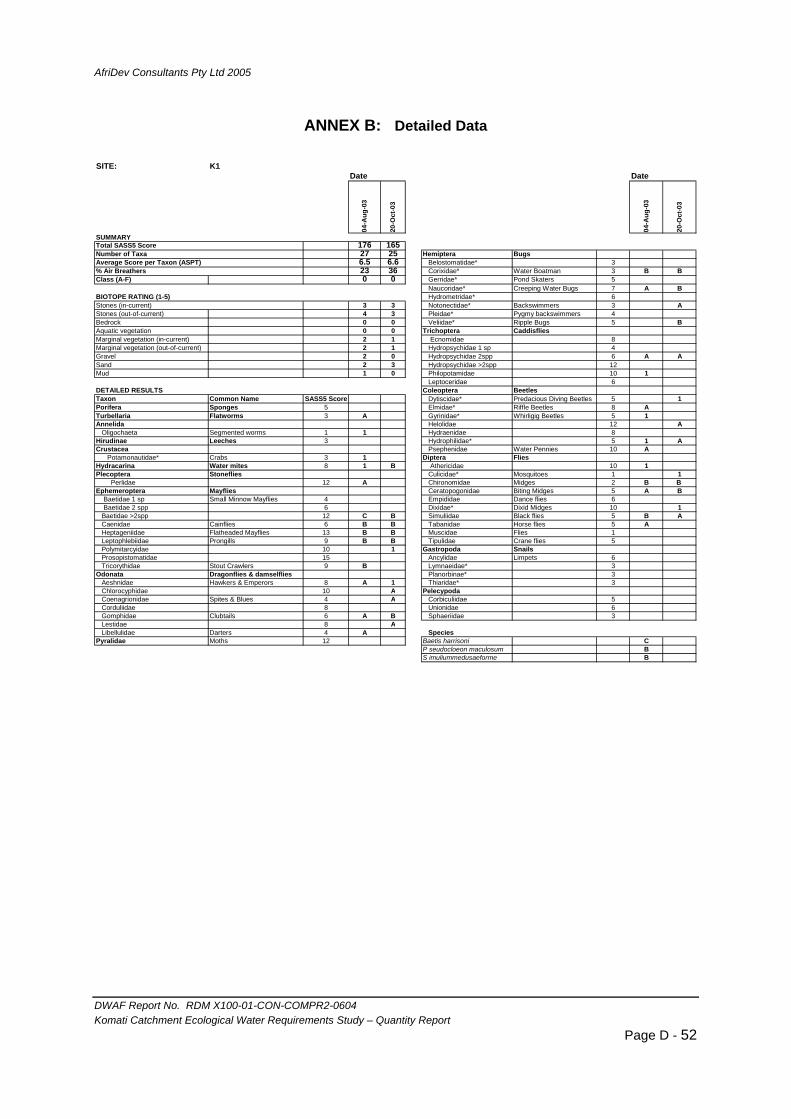
AfriDev Consultants Pty Ltd 2005
DWAF Report No. RDM X100-01-CON-COMPR2-0604 Komati Catchment Ecological Water Requirements Study – Quantity Report
Page D - 52
ANNEX B: Detailed Data
SITE: K1 Date Date
04-A
ug-0
3
20-O
ct-0
3
04-A
ug-0
3
20-O
ct-0
3
176 16527 25 Hemiptera Bugs6.5 6.6 Belostomatidae* 323 36 Corixidae* Water Boatman 3 B B
Class (A-F) 0 0 Gerridae* Pond Skaters 5Naucoridae* Creeping Water Bugs 7 A BHydrometridae* 6
3 3 Notonectidae* Backswimmers 3 AStones (out-of-current) 4 3 Pleidae* Pygmy backswimmers 4Bedrock 0 0 Veliidae* Ripple Bugs 5 BAquatic vegetation 0 0 Trichoptera CaddisfliesMarginal vegetation (in-current) 2 1 Ecnomidae 8Marginal vegetation (out-of-current) 2 1 Hydropsychidae 1 sp 4Gravel 2 0 Hydropsychidae 2spp 6 A ASand 2 3 Hydropsychidae >2spp 12Mud 1 0 Philopotamidae 10 1
Leptoceridae 6DETAILED RESULTS Coleoptera BeetlesTaxon Common Name SASS5 Score Dytiscidae* Predacious Diving Beetles 5 1Porifera Sponges 5 Elmidae* Riffle Beetles 8 ATurbellaria Flatworms 3 A Gyrinidae* Whirligig Beetles 5 1Annelida Helolidae 12 A
Oligochaeta Segmented worms 1 1 Hydraenidae 8Hirudinae Leeches 3 Hydrophilidae* 5 1 ACrustacea Psephenidae Water Pennies 10 A
Potamonautidae* Crabs 3 1 Diptera FliesHydracarina Water mites 8 1 B Athericidae 10 1Plecoptera Stoneflies Culicidae* Mosquitoes 1 1
Perlidae 12 A Chironomidae Midges 2 B B Ephemeroptera Mayflies Ceratopogonidae Biting Midges 5 A B Baetidae 1 sp Small Minnow Mayflies 4 Empididae Dance flies 6 Baetidae 2 spp 6 Dixidae* Dixid Midges 10 1
Baetidae >2spp 12 C B Simuliidae Black flies 5 B ACaenidae Cainflies 6 B B Tabanidae Horse flies 5 AHeptageniidae Flatheaded Mayflies 13 B B Muscidae Flies 1Leptophlebiidae Prongills 9 B B Tipulidae Crane flies 5Polymitarcyidae 10 1 Gastropoda SnailsProsopistomatidae 15 Ancylidae Limpets 6Tricorythidae Stout Crawlers 9 B Lymnaeidae* 3
Odonata Dragonflies & damselflies Planorbinae* 3Aeshnidae Hawkers & Emperors 8 A 1 Thiaridae* 3Chlorocyphidae 10 A PelecypodaCoenagrionidae Spites & Blues 4 A Corbiculiidae 5Corduliidae 8 Unionidae 6Gomphidae Clubtails 6 A B Sphaeriidae 3Lestidae 8 ALibellulidae Darters 4 A Species
Pyralidae Moths 12 Baetis harrisoni CP seudocloeon maculosum BS imuliummedusaeforme B
BIOTOPE RATING (1-5)Stones (in-current)
SUMMARY
Number of TaxaAverage Score per Taxon (ASPT)% Air Breathers
Total SASS5 Score

AfriDev Consultants Pty Ltd 2005
DWAF Report No. RDM X100-01-CON-COMPR2-0604 Komati Catchment Ecological Water Requirements Study – Quantity Report
Page D - 53
SITE: K2 Date Date
05-A
ug-0
3
05-A
ug-0
3
20932 Trichoptera Caddisflies6.5 Ecnomidae 818 Hydropsychidae 2spp 6
Class (A-F) 0 Hydropsychidae >2spp 12 APhilopotamidae 10 CLeptoceridae 6 A
5 Coleoptera BeetlesStones (out-of-current) 4 Dytiscidae* Predacious Diving Beetles 5 ABedrock 0 Elmidae* Riffle Beetles 8 BAquatic vegetation 5 Gyrinidae* Whirligig Beetles 5Marginal vegetation (in-current) 5 Hydraenidae 8Marginal vegetation (out-of-current) 5 Hydrophilidae* 5Gravel 4 Psephenidae Water Pennies 10Sand 3 Diptera FliesMud 0 Athericidae 10
Culicidae* Mosquitoes 1DETAILED RESULTS Chironomidae Midges 2 CTaxon Common Name SASS5 Score Ceratopogonidae Biting Midges 5 APorifera Sponges 5 A Empididae Dance flies 6Turbellaria Flatworms 3 1 Dixidae* Dixid Midges 10Annelida Simuliidae Black flies 5 B
Oligochaeta Segmented worms 1 A Tabanidae Horse flies 5 AHirudinae Leeches 3 A Muscidae Flies 1Crustacea Tipulidae Crane flies 5 1
Potamonautidae* Crabs 3 Gastropoda SnailsHydracarina Water mites 8 Ancylidae Limpets 6Plecoptera Stoneflies Bulininae 1
Perlidae 12 B Lymnaeidae* 3Ephemeroptera Mayflies Planorbinae* 3
Baetidae >2spp Small Minnow Mayflies 12 C Thiaridae* 3Caenidae Cainflies 6 B PelecypodaHeptageniidae Flatheaded Mayflies 13 B Corbiculiidae 5 BLeptophlebiidae Prongills 9 C Unionidae 6Polymitarcyidae 1 Sphaeriidae 3Prosopistomatidae 15Tricorythidae Stout Crawlers 9 A
Odonata Dragonflies & damselflies Species Aeshnidae Hawkers & Emperors 8 Amphipshyche scottae pChlorocyphidae 10 A Baetis glaucus pCoenagrionidae Spites & Blues 4 B Baetis harrisoni pChlorestidae A Bulinus africanus pCorduliidae 8 Cheumatopsyche afra pGomphidae Clubtails 6 A Cheumatopsyche thomasetti pLibellulidae Darters 4 A Choroterpes elegans p
Pyralidae Moths 12 A Ephoron pHemiptera Bugs P suedocloeon maculosum p Belostomatidae* 3 1 S medusaeforme p
Corixidae* Water Boatman 3 A Simulium adersi pGerridae* Pond Skaters 5 Simulium alckocki pNaucoridae* Creeping Water Bugs 7 Simulium cervicornutum pHydrometridae* 6 Simulium damnosum pNotonectidae* Backswimmers 3 Simulium lumbwanum pPleidae* Pygmy backswimmers 4 Simulium rotundum pVeliidae* Ripple Bugs 5 A
BIOTOPE RATING (1-5)Stones (in-current)
SUMMARY
Number of TaxaAverage Score per Taxon (ASPT)% Air Breathers
Total SASS5 Score
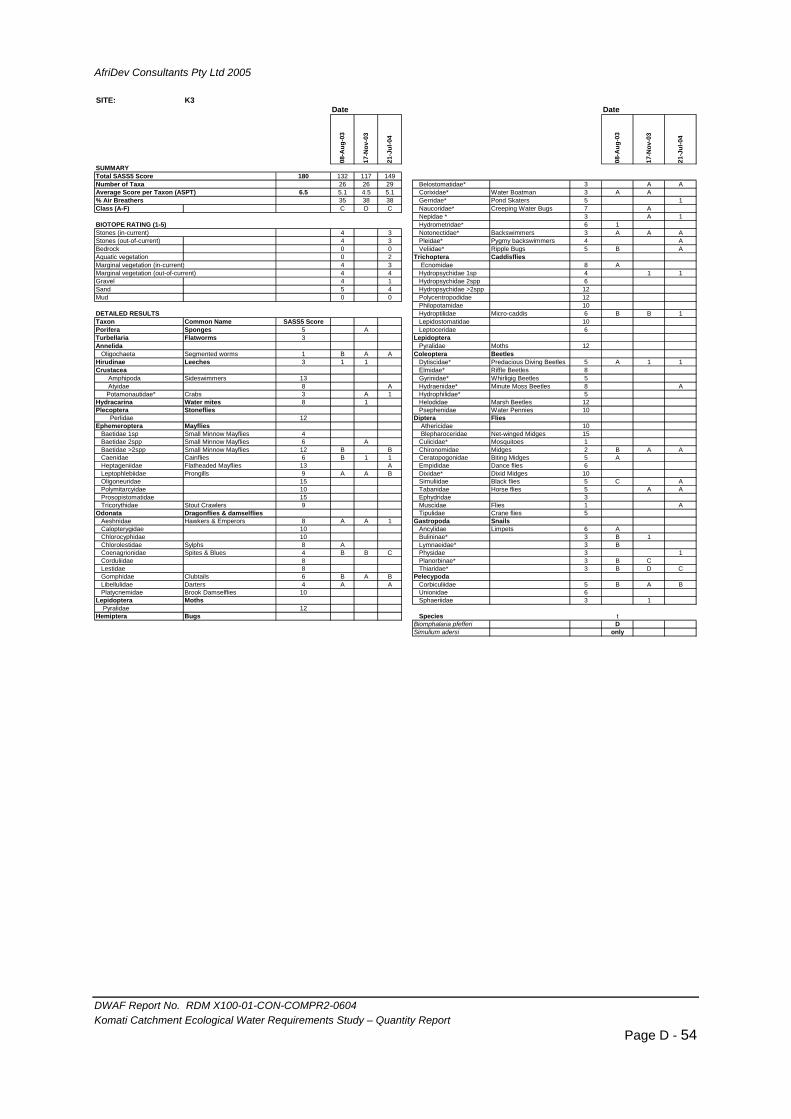
AfriDev Consultants Pty Ltd 2005
DWAF Report No. RDM X100-01-CON-COMPR2-0604 Komati Catchment Ecological Water Requirements Study – Quantity Report
Page D - 54
SITE: K3Date Date
08-A
ug-0
3
17-N
ov-0
3
21-J
ul-0
4
08-A
ug-0
3
17-N
ov-0
3
21-J
ul-0
4
180 132 117 149
26 26 29 Belostomatidae* 3 A A6.5 5.1 4.5 5.1 Corixidae* Water Boatman 3 A A
35 38 38 Gerridae* Pond Skaters 5 1Class (A-F) C D C Naucoridae* Creeping Water Bugs 7 A
Nepidae * 3 A 1Hydrometridae* 6 1
4 3 Notonectidae* Backswimmers 3 A A AStones (out-of-current) 4 3 Pleidae* Pygmy backswimmers 4 ABedrock 0 0 Veliidae* Ripple Bugs 5 B AAquatic vegetation 0 2 Trichoptera CaddisfliesMarginal vegetation (in-current) 4 3 Ecnomidae 8 AMarginal vegetation (out-of-current) 4 4 Hydropsychidae 1sp 4 1 1Gravel 4 1 Hydropsychidae 2spp 6Sand 5 4 Hydropsychidae >2spp 12Mud 0 0 Polycentropodidae 12
Philopotamidae 10DETAILED RESULTS Hydroptilidae Micro-caddis 6 B B 1Taxon Common Name SASS5 Score Lepidostomatidae 10Porifera Sponges 5 A Leptoceridae 6Turbellaria Flatworms 3 LepidopteraAnnelida Pyralidae Moths 12
Oligochaeta Segmented worms 1 B A A Coleoptera BeetlesHirudinae Leeches 3 1 1 Dytiscidae* Predacious Diving Beetles 5 A 1 1Crustacea Elmidae* Riffle Beetles 8 Amphipoda Sideswimmers 13 Gyrinidae* Whirligig Beetles 5 Atyidae 8 A Hydraenidae* Minute Moss Beetles 8 A
Potamonautidae* Crabs 3 A 1 Hydrophilidae* 5Hydracarina Water mites 8 1 Helodidae Marsh Beetles 12Plecoptera Stoneflies Psephenidae Water Pennies 10
Perlidae 12 Diptera FliesEphemeroptera Mayflies Athericidae 10
Baetidae 1sp Small Minnow Mayflies 4 Blepharoceridae Net-winged Midges 15Baetidae 2spp Small Minnow Mayflies 6 A Culicidae* Mosquitoes 1Baetidae >2spp Small Minnow Mayflies 12 B B Chironomidae Midges 2 B A ACaenidae Cainflies 6 B 1 1 Ceratopogonidae Biting Midges 5 AHeptageniidae Flatheaded Mayflies 13 A Empididae Dance flies 6Leptophlebiidae Prongills 9 A A B Dixidae* Dixid Midges 10Oligoneuridae 15 Simuliidae Black flies 5 C APolymitarcyidae 10 Tabanidae Horse flies 5 A AProsopistomatidae 15 Ephydridae 3Tricorythidae Stout Crawlers 9 Muscidae Flies 1 A
Odonata Dragonflies & damselflies Tipulidae Crane flies 5Aeshnidae Hawkers & Emperors 8 A A 1 Gastropoda SnailsCalopterygidae 10 Ancylidae Limpets 6 AChlorocyphidae 10 Bulininae* 3 B 1Chlorolestidae Sylphs 8 A Lymnaeidae* 3 BCoenagrionidae Spites & Blues 4 B B C Physidae 3 1Corduliidae 8 Planorbinae* 3 B CLestidae 8 Thiaridae* 3 B D CGomphidae Clubtails 6 B A B PelecypodaLibellulidae Darters 4 A A Corbiculiidae 5 B A BPlatycnemidae Brook Damselflies 10 Unionidae 6
Lepidoptera Moths Sphaeriidae 3 1 Pyralidae 12
Hemiptera Bugs Species tBiomphalaria pfefferi DSimulium adersi only
BIOTOPE RATING (1-5)Stones (in-current)
SUMMARY
Number of TaxaAverage Score per Taxon (ASPT)% Air Breathers
Total SASS5 Score

AfriDev Consultants Pty Ltd 2005
DWAF Report No. RDM X100-01-CON-COMPR2-0604 Komati Catchment Ecological Water Requirements Study – Quantity Report
Page D - 55
SITE: K4
07-A
ug-0
3
18-N
ov-0
3
07-A
ug-0
3
18-N
ov-0
3
128 147 Lepidoptera Moths23 26 Pyralidae 125.6 5.7 Hemiptera Bugs35 38 Belostomatidae* 3 A
Class (A-F) C C Corixidae* Water Boatman 3 A BGerridae* Pond Skaters 5
Naucoridae* Creeping Water Bugs 7 1128 128 Nepidae * 3 123 23 Hydrometridae* 65.6 5.6 Notonectidae* Backswimmers 3 125 25 Pleidae* Pygmy backswimmers 4
Veliidae* Ripple Bugs 5 ATrichoptera Caddisflies Ecnomidae 8
4 4 Hydropsychidae 1sp 4 AStones (out-of-current) 2 3 Hydropsychidae 2spp 6 ABedrock 3 1 Hydropsychidae >2spp 12Aquatic vegetation 0 5 Philopotamidae 10 AMarginal vegetation (in-current) 2 0 Hydroptilidae Micro-caddis 6 1Marginal vegetation (out-of-current) 4 4 Lepidostomatidae 10Gravel 4 Leptoceridae 6Sand 2 Coleoptera BeetlesMud 2 Dytiscidae* Predacious Diving Beetles 5 1
Elmidae* Riffle Beetles 8 ADETAILED RESULTS Gyrinidae* Whirligig Beetles 5 1Taxon Common Name SASS5 Score Hydraenidae* Minute Moss Beetles 8Porifera Sponges 5 Hydrophilidae* 5 Turbellaria Flatworms 3 Helodidae Marsh Beetles 12Annelida Psephenidae Water Pennies 10
Oligochaeta Segmented worms 1 A A Diptera FliesHirudinae Leeches 3 1 Athericidae 10Crustacea Blepharoceridae Net-winged Midges 15 Amphipoda Sideswimmers 13 Culicidae* Mosquitoes 1 Atyidae 8 A B Chironomidae Midges 2 B A
Potamonautidae* Crabs 3 1 Ceratopogonidae Biting Midges 5 AHydracarina Water mites 8 1 Empididae Dance flies 6Plecoptera Stoneflies Dixidae* Dixid Midges 10
Perlidae 12 1 B Simuliidae Black flies 5 AEphemeroptera Mayflies Tabanidae Horse flies 5
Baetidae 1sp Small Minnow Mayflies 4 Muscidae Flies 1Baetidae 2spp Small Minnow Mayflies 6 Tipulidae Crane flies 5Baetidae >2spp Small Minnow Mayflies 12 B A Gastropoda SnailsCaenidae Cainflies 6 A A Ancylidae Limpets 6Heptageniidae Flatheaded Mayflies 13 A A Bulininae* 3 1Leptophlebiidae Prongills 9 B A Lymnaeidae* 3 1 BOligoneuridae 15 Planorbinae* 3 BPolymitarcyidae 10 Thiaridae* 3 B CProsopistomatidae 15 Pelecypoda Tricorythidae Stout Crawlers 9 Corbiculiidae 5 EMPTY B
Odonata Dragonflies & damselflies Unionidae 6Aeshnidae Hawkers & Emperors 8 A Sphaeriidae 3Chlorocyphidae 10Chlorolestidae Sylphs 8 Species Coenagrionidae Spites & Blues 4 A B Cheumatopsyche thomasetti ACorduliidae 8 Macrostenum capense AGomphidae Clubtails 6 1 Noteridae ALibellulidae Darters 4 1 1 Simulium damnosum APlatycnemidae Brook Damselflies 10
ECOSPECS
BIOTOPE RATING (1-5)Stones (in-current)
Total SASS5 ScoreNumber of TaxaAverage Score per Taxon (ASPT)% Air Breathers
SUMMARY
Number of TaxaAverage Score per Taxon (ASPT)% Air Breathers
Total SASS5 Score
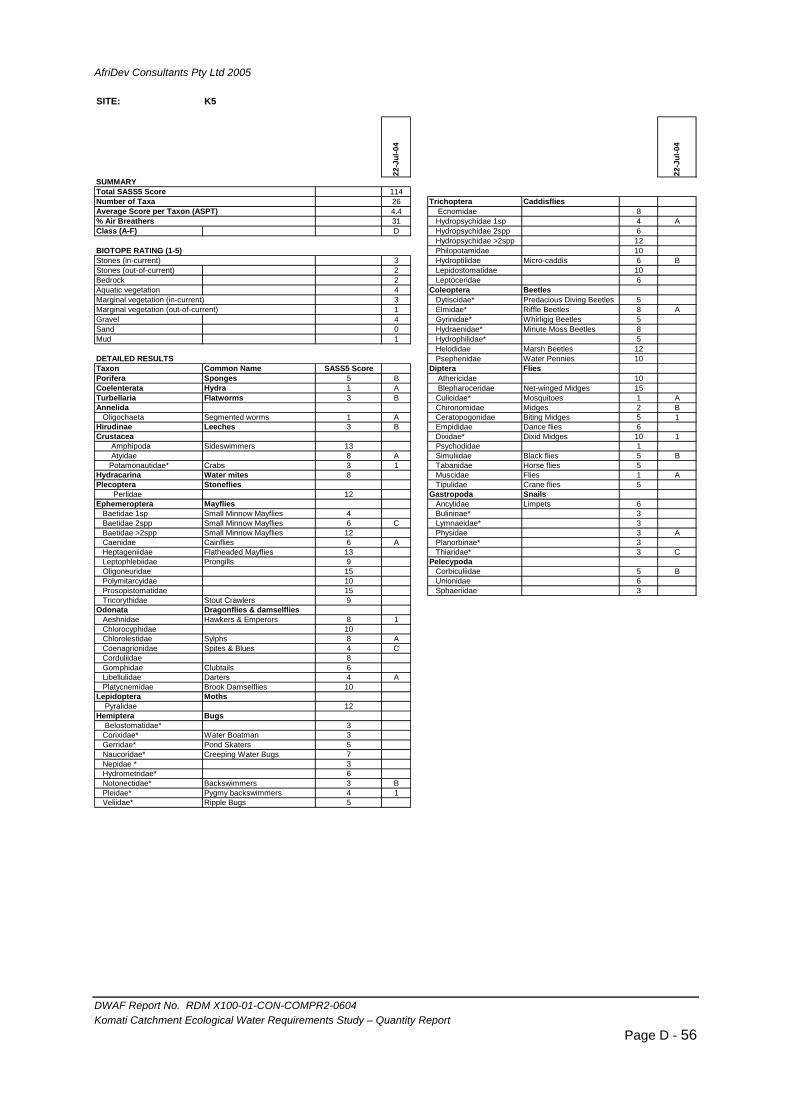
AfriDev Consultants Pty Ltd 2005
DWAF Report No. RDM X100-01-CON-COMPR2-0604 Komati Catchment Ecological Water Requirements Study – Quantity Report
Page D - 56
SITE: K5
22-J
ul-0
4
22-J
ul-0
4
11426 Trichoptera Caddisflies4.4 Ecnomidae 831 Hydropsychidae 1sp 4 A
Class (A-F) D Hydropsychidae 2spp 6Hydropsychidae >2spp 12Philopotamidae 10
3 Hydroptilidae Micro-caddis 6 BStones (out-of-current) 2 Lepidostomatidae 10Bedrock 2 Leptoceridae 6Aquatic vegetation 4 Coleoptera BeetlesMarginal vegetation (in-current) 3 Dytiscidae* Predacious Diving Beetles 5Marginal vegetation (out-of-current) 1 Elmidae* Riffle Beetles 8 AGravel 4 Gyrinidae* Whirligig Beetles 5Sand 0 Hydraenidae* Minute Moss Beetles 8Mud 1 Hydrophilidae* 5
Helodidae Marsh Beetles 12DETAILED RESULTS Psephenidae Water Pennies 10Taxon Common Name SASS5 Score Diptera FliesPorifera Sponges 5 B Athericidae 10Coelenterata Hydra 1 A Blepharoceridae Net-winged Midges 15Turbellaria Flatworms 3 B Culicidae* Mosquitoes 1 AAnnelida Chironomidae Midges 2 B
Oligochaeta Segmented worms 1 A Ceratopogonidae Biting Midges 5 1Hirudinae Leeches 3 B Empididae Dance flies 6Crustacea Dixidae* Dixid Midges 10 1 Amphipoda Sideswimmers 13 Psychodidae 1 Atyidae 8 A Simuliidae Black flies 5 B
Potamonautidae* Crabs 3 1 Tabanidae Horse flies 5Hydracarina Water mites 8 Muscidae Flies 1 APlecoptera Stoneflies Tipulidae Crane flies 5
Perlidae 12 Gastropoda SnailsEphemeroptera Mayflies Ancylidae Limpets 6
Baetidae 1sp Small Minnow Mayflies 4 Bulininae* 3Baetidae 2spp Small Minnow Mayflies 6 C Lymnaeidae* 3Baetidae >2spp Small Minnow Mayflies 12 Physidae 3 ACaenidae Cainflies 6 A Planorbinae* 3Heptageniidae Flatheaded Mayflies 13 Thiaridae* 3 CLeptophlebiidae Prongills 9 PelecypodaOligoneuridae 15 Corbiculiidae 5 BPolymitarcyidae 10 Unionidae 6Prosopistomatidae 15 Sphaeriidae 3 Tricorythidae Stout Crawlers 9
Odonata Dragonflies & damselfliesAeshnidae Hawkers & Emperors 8 1Chlorocyphidae 10Chlorolestidae Sylphs 8 ACoenagrionidae Spites & Blues 4 CCorduliidae 8Gomphidae Clubtails 6Libellulidae Darters 4 APlatycnemidae Brook Damselflies 10
Lepidoptera Moths Pyralidae 12
Hemiptera Bugs Belostomatidae* 3
Corixidae* Water Boatman 3Gerridae* Pond Skaters 5Naucoridae* Creeping Water Bugs 7Nepidae * 3Hydrometridae* 6Notonectidae* Backswimmers 3 BPleidae* Pygmy backswimmers 4 1Veliidae* Ripple Bugs 5
SUMMARY
Number of TaxaAverage Score per Taxon (ASPT)% Air Breathers
Total SASS5 Score
BIOTOPE RATING (1-5)Stones (in-current)
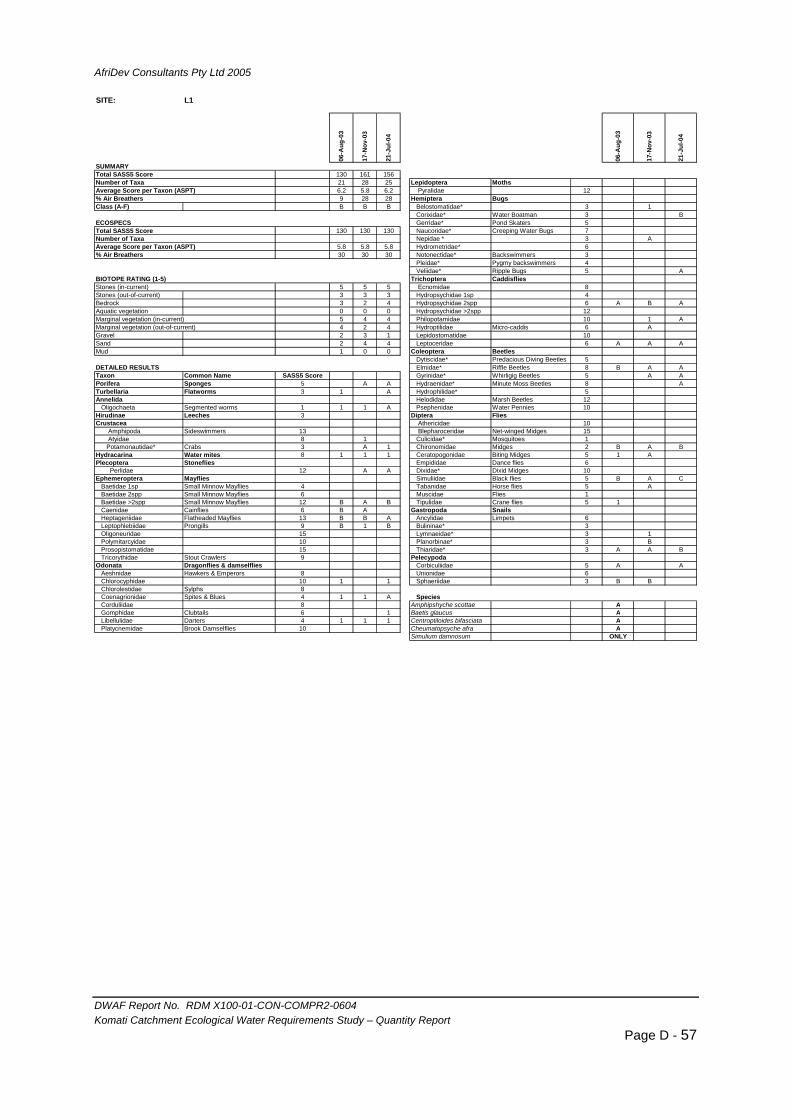
AfriDev Consultants Pty Ltd 2005
DWAF Report No. RDM X100-01-CON-COMPR2-0604 Komati Catchment Ecological Water Requirements Study – Quantity Report
Page D - 57
SITE: L1
06-A
ug-0
3
17-N
ov-0
3
21-J
ul-0
4
06-A
ug-0
3
17-N
ov-0
3
21-J
ul-0
4
130 161 15621 28 25 Lepidoptera Moths6.2 5.8 6.2 Pyralidae 129 28 28 Hemiptera Bugs
Class (A-F) B B B Belostomatidae* 3 1Corixidae* Water Boatman 3 B
Gerridae* Pond Skaters 5130 130 130 Naucoridae* Creeping Water Bugs 7
Nepidae * 3 A5.8 5.8 5.8 Hydrometridae* 630 30 30 Notonectidae* Backswimmers 3
Pleidae* Pygmy backswimmers 4Veliidae* Ripple Bugs 5 A
Trichoptera Caddisflies5 5 5 Ecnomidae 8
Stones (out-of-current) 3 3 3 Hydropsychidae 1sp 4Bedrock 3 2 4 Hydropsychidae 2spp 6 A B AAquatic vegetation 0 0 0 Hydropsychidae >2spp 12Marginal vegetation (in-current) 5 4 4 Philopotamidae 10 1 AMarginal vegetation (out-of-current) 4 2 4 Hydroptilidae Micro-caddis 6 AGravel 2 3 1 Lepidostomatidae 10Sand 2 4 4 Leptoceridae 6 A A AMud 1 0 0 Coleoptera Beetles
Dytiscidae* Predacious Diving Beetles 5DETAILED RESULTS Elmidae* Riffle Beetles 8 B A ATaxon Common Name SASS5 Score Gyrinidae* Whirligig Beetles 5 A APorifera Sponges 5 A A Hydraenidae* Minute Moss Beetles 8 ATurbellaria Flatworms 3 1 A Hydrophilidae* 5Annelida Helodidae Marsh Beetles 12
Oligochaeta Segmented worms 1 1 1 A Psephenidae Water Pennies 10Hirudinae Leeches 3 Diptera FliesCrustacea Athericidae 10 Amphipoda Sideswimmers 13 Blepharoceridae Net-winged Midges 15 Atyidae 8 1 Culicidae* Mosquitoes 1
Potamonautidae* Crabs 3 A 1 Chironomidae Midges 2 B A BHydracarina Water mites 8 1 1 1 Ceratopogonidae Biting Midges 5 1 APlecoptera Stoneflies Empididae Dance flies 6
Perlidae 12 A A Dixidae* Dixid Midges 10Ephemeroptera Mayflies Simuliidae Black flies 5 B A C
Baetidae 1sp Small Minnow Mayflies 4 Tabanidae Horse flies 5 ABaetidae 2spp Small Minnow Mayflies 6 Muscidae Flies 1Baetidae >2spp Small Minnow Mayflies 12 B A B Tipulidae Crane flies 5 1Caenidae Cainflies 6 B A Gastropoda SnailsHeptageniidae Flatheaded Mayflies 13 B B A Ancylidae Limpets 6Leptophlebiidae Prongills 9 B 1 B Bulininae* 3Oligoneuridae 15 Lymnaeidae* 3 1Polymitarcyidae 10 Planorbinae* 3 BProsopistomatidae 15 Thiaridae* 3 A A BTricorythidae Stout Crawlers 9 Pelecypoda
Odonata Dragonflies & damselflies Corbiculiidae 5 A AAeshnidae Hawkers & Emperors 8 Unionidae 6Chlorocyphidae 10 1 1 Sphaeriidae 3 B BChlorolestidae Sylphs 8Coenagrionidae Spites & Blues 4 1 1 A Species Corduliidae 8 Amphipshyche scottae AGomphidae Clubtails 6 1 Baetis glaucus ALibellulidae Darters 4 1 1 1 Centroptiloides bifasciata APlatycnemidae Brook Damselflies 10 Cheumatopsyche afra A
Simulium damnosum ONLY
SUMMARY
Number of TaxaAverage Score per Taxon (ASPT)% Air Breathers
Total SASS5 Score
ECOSPECS
BIOTOPE RATING (1-5)Stones (in-current)
Total SASS5 ScoreNumber of TaxaAverage Score per Taxon (ASPT)% Air Breathers
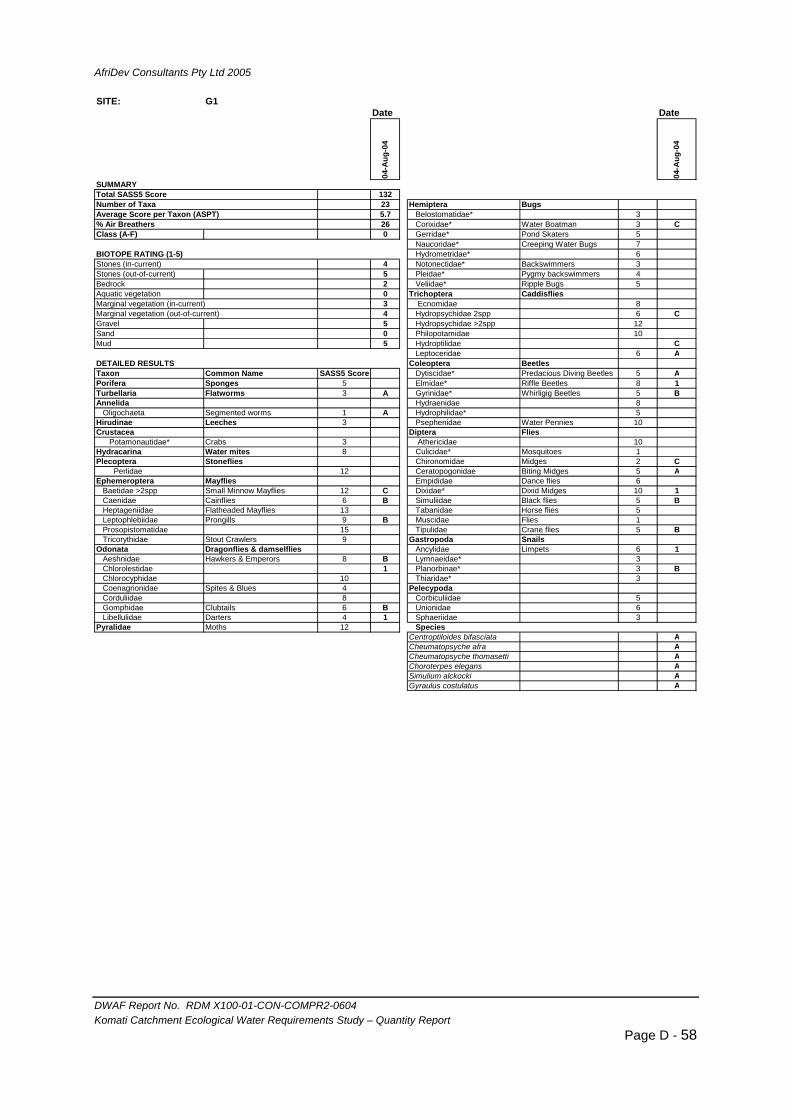
AfriDev Consultants Pty Ltd 2005
DWAF Report No. RDM X100-01-CON-COMPR2-0604 Komati Catchment Ecological Water Requirements Study – Quantity Report
Page D - 58
SITE: G1 Date Date
04-A
ug-0
4
04-A
ug-0
4
13223 Hemiptera Bugs5.7 Belostomatidae* 326 Corixidae* Water Boatman 3 C
Class (A-F) 0 Gerridae* Pond Skaters 5Naucoridae* Creeping Water Bugs 7Hydrometridae* 6
4 Notonectidae* Backswimmers 3Stones (out-of-current) 5 Pleidae* Pygmy backswimmers 4Bedrock 2 Veliidae* Ripple Bugs 5Aquatic vegetation 0 Trichoptera CaddisfliesMarginal vegetation (in-current) 3 Ecnomidae 8Marginal vegetation (out-of-current) 4 Hydropsychidae 2spp 6 CGravel 5 Hydropsychidae >2spp 12Sand 0 Philopotamidae 10Mud 5 Hydroptilidae C
Leptoceridae 6 ADETAILED RESULTS Coleoptera BeetlesTaxon Common Name SASS5 Score Dytiscidae* Predacious Diving Beetles 5 APorifera Sponges 5 Elmidae* Riffle Beetles 8 1Turbellaria Flatworms 3 A Gyrinidae* Whirligig Beetles 5 BAnnelida Hydraenidae 8
Oligochaeta Segmented worms 1 A Hydrophilidae* 5Hirudinae Leeches 3 Psephenidae Water Pennies 10Crustacea Diptera Flies
Potamonautidae* Crabs 3 Athericidae 10Hydracarina Water mites 8 Culicidae* Mosquitoes 1Plecoptera Stoneflies Chironomidae Midges 2 C
Perlidae 12 Ceratopogonidae Biting Midges 5 AEphemeroptera Mayflies Empididae Dance flies 6
Baetidae >2spp Small Minnow Mayflies 12 C Dixidae* Dixid Midges 10 1Caenidae Cainflies 6 B Simuliidae Black flies 5 BHeptageniidae Flatheaded Mayflies 13 Tabanidae Horse flies 5Leptophlebiidae Prongills 9 B Muscidae Flies 1Prosopistomatidae 15 Tipulidae Crane flies 5 BTricorythidae Stout Crawlers 9 Gastropoda Snails
Odonata Dragonflies & damselflies Ancylidae Limpets 6 1Aeshnidae Hawkers & Emperors 8 B Lymnaeidae* 3Chlorolestidae 1 Planorbinae* 3 BChlorocyphidae 10 Thiaridae* 3Coenagrionidae Spites & Blues 4 PelecypodaCorduliidae 8 Corbiculiidae 5Gomphidae Clubtails 6 B Unionidae 6Libellulidae Darters 4 1 Sphaeriidae 3
Pyralidae Moths 12 Species Centroptiloides bifasciata ACheumatopsyche afra ACheumatopsyche thomasetti AChoroterpes elegans ASimulium alckocki AGyraulus costulatus A
SUMMARY
Number of TaxaAverage Score per Taxon (ASPT)% Air Breathers
Total SASS5 Score
BIOTOPE RATING (1-5)Stones (in-current)
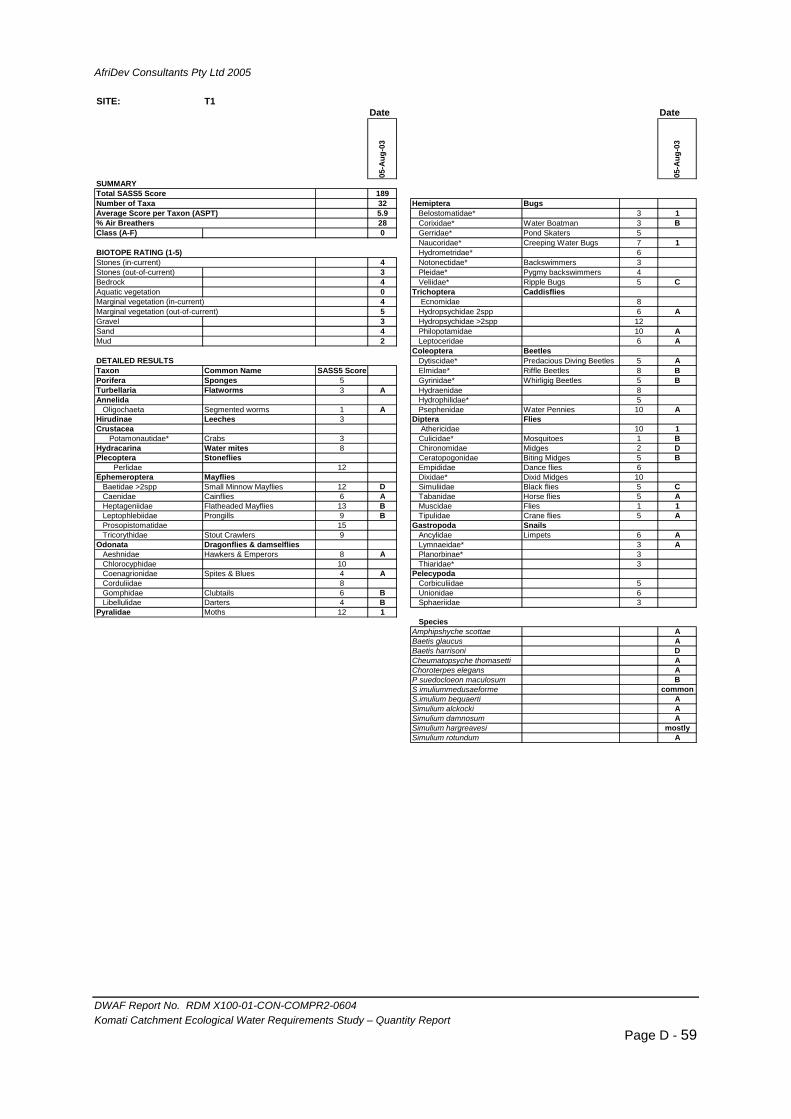
AfriDev Consultants Pty Ltd 2005
DWAF Report No. RDM X100-01-CON-COMPR2-0604 Komati Catchment Ecological Water Requirements Study – Quantity Report
Page D - 59
SITE: T1 Date Date
05-A
ug-0
3
05-A
ug-0
3
18932 Hemiptera Bugs5.9 Belostomatidae* 3 128 Corixidae* Water Boatman 3 B
Class (A-F) 0 Gerridae* Pond Skaters 5Naucoridae* Creeping Water Bugs 7 1Hydrometridae* 6
4 Notonectidae* Backswimmers 3Stones (out-of-current) 3 Pleidae* Pygmy backswimmers 4Bedrock 4 Veliidae* Ripple Bugs 5 CAquatic vegetation 0 Trichoptera CaddisfliesMarginal vegetation (in-current) 4 Ecnomidae 8Marginal vegetation (out-of-current) 5 Hydropsychidae 2spp 6 AGravel 3 Hydropsychidae >2spp 12Sand 4 Philopotamidae 10 AMud 2 Leptoceridae 6 A
Coleoptera BeetlesDETAILED RESULTS Dytiscidae* Predacious Diving Beetles 5 ATaxon Common Name SASS5 Score Elmidae* Riffle Beetles 8 BPorifera Sponges 5 Gyrinidae* Whirligig Beetles 5 BTurbellaria Flatworms 3 A Hydraenidae 8Annelida Hydrophilidae* 5
Oligochaeta Segmented worms 1 A Psephenidae Water Pennies 10 AHirudinae Leeches 3 Diptera FliesCrustacea Athericidae 10 1
Potamonautidae* Crabs 3 Culicidae* Mosquitoes 1 BHydracarina Water mites 8 Chironomidae Midges 2 DPlecoptera Stoneflies Ceratopogonidae Biting Midges 5 B
Perlidae 12 Empididae Dance flies 6Ephemeroptera Mayflies Dixidae* Dixid Midges 10
Baetidae >2spp Small Minnow Mayflies 12 D Simuliidae Black flies 5 CCaenidae Cainflies 6 A Tabanidae Horse flies 5 AHeptageniidae Flatheaded Mayflies 13 B Muscidae Flies 1 1Leptophlebiidae Prongills 9 B Tipulidae Crane flies 5 AProsopistomatidae 15 Gastropoda SnailsTricorythidae Stout Crawlers 9 Ancylidae Limpets 6 A
Odonata Dragonflies & damselflies Lymnaeidae* 3 AAeshnidae Hawkers & Emperors 8 A Planorbinae* 3Chlorocyphidae 10 Thiaridae* 3Coenagrionidae Spites & Blues 4 A PelecypodaCorduliidae 8 Corbiculiidae 5Gomphidae Clubtails 6 B Unionidae 6Libellulidae Darters 4 B Sphaeriidae 3
Pyralidae Moths 12 1Species
Amphipshyche scottae ABaetis glaucus ABaetis harrisoni DCheumatopsyche thomasetti AChoroterpes elegans AP suedocloeon maculosum BS imuliummedusaeforme commonS.imulium bequaerti ASimulium alckocki ASimulium damnosum ASimulium hargreavesi mostlySimulium rotundum A
SUMMARY
Number of TaxaAverage Score per Taxon (ASPT)% Air Breathers
Total SASS5 Score
BIOTOPE RATING (1-5)Stones (in-current)
AfriDev Consultants Pty Ltd 2005
DWAF Report No. RDM X100-01-CON-COMPR2-0604
ANNEX C: Expected and observed invertebrates per Resource Unit in the Komati River Catchment.
Komati Catchment Ecological Water Requirements Study – Quantity Report Page D - 60
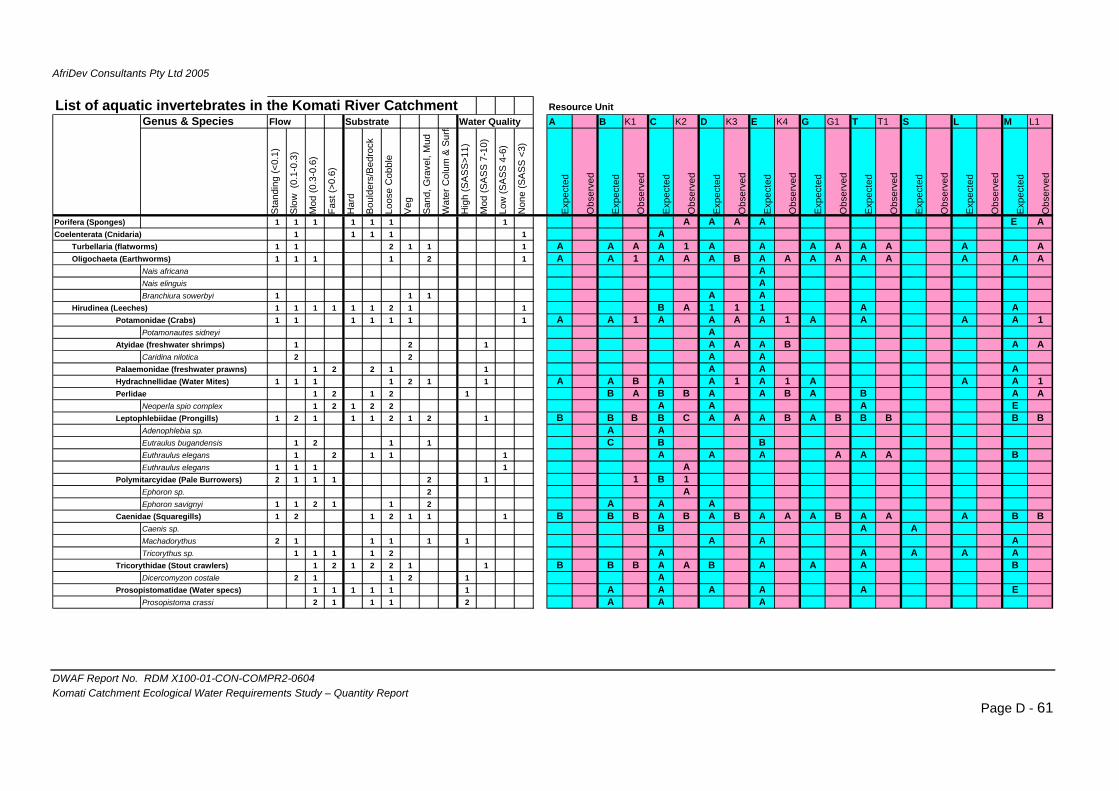
AfriDev Consultants Pty Ltd 2005
DWAF Report No. RDM X100-01-CON-COMPR2-0604
List of aquatic invertebrates in the Komati River Catchment Resource Unit Genus & Species Flow Substrate A B K1 C K2 D K3 E K4 G G1 T T1 S L M L1
Sta
ndin
g (<
0.1)
Slo
w (
0.1-
0.3)
Mod
(0.3
-0.6
)
Fast
(>0.
6)
Har
d
Bou
lder
s/B
edro
ck
Loos
e C
obbl
e
Veg
San
d, G
rave
l, M
ud
Wat
er C
olum
& S
urfa
Hig
h (S
AS
S>1
1)
Mod
(SA
SS
7-1
0)
Low
(SA
SS
4-6
)
Non
e (S
AS
S <
3)
Exp
ecte
d
Obs
erve
d
Exp
ecte
d
Obs
erve
d
Exp
ecte
d
Obs
erve
d
Exp
ecte
d
Obs
erve
d
Exp
ecte
d
Obs
erve
d
Exp
ecte
d
Obs
erve
d
Exp
ecte
d
Obs
erve
d
Exp
ecte
d
Obs
erve
d
Exp
ecte
d
Obs
erve
d
Exp
ecte
d
Obs
erve
d
Porifera (Sponges) 1 1 1 1 1 1 1 A A A A E ACoelenterata (Cnidaria) 1 1 1 1 1 A Turbellaria (flatworms) 1 1 2 1 1 1 A A A A 1 A A A A A A A A
Oligochaeta (Earthworms) 1 1 1 1 2 1 A A 1 A A A B A A A A A A A A ANais africana ANais elinguis ABranchiura sowerbyi 1 1 1 A A
Hirudinea (Leeches) 1 1 1 1 1 1 2 1 1 B A 1 1 1 A APotamonidae (Crabs) 1 1 1 1 1 1 1 A A 1 A A A A 1 A A A A 1
Potamonautes sidneyi AAtyidae (freshwater shrimps) 1 2 1 A A A B A A
Caridina nilotica 2 2 A APalaemonidae (freshwater prawns) 1 2 2 1 1 A A AHydrachnellidae (Water Mites) 1 1 1 1 2 1 1 A A B A A 1 A 1 A A A 1Perlidae 1 2 1 2 1 B A B B A A B A B A A
Neoperla spio complex 1 2 1 2 2 A A A ELeptophlebiidae (Prongills) 1 2 1 1 1 2 1 2 1 B B B B C A A A B A B B B B B
Adenophlebia sp. A AEutraulus bugandensis 1 2 1 1 C B BEuthraulus elegans 1 2 1 1 1 A A A A A A BEuthraulus elegans 1 1 1 1 A
Polymitarcyidae (Pale Burrowers) 2 1 1 1 2 1 1 B 1Ephoron sp. 2 AEphoron savignyi 1 1 2 1 1 2 A A A
Caenidae (Squaregills) 1 2 1 2 1 1 1 B B B A B A B A A A B A A A B BCaenis sp. B A AMachadorythus 2 1 1 1 1 1 A A ATricorythus sp. 1 1 1 1 2 A A A A A
Tricorythidae (Stout crawlers) 1 2 1 2 2 1 1 B B B A A B A A A BDicercomyzon costale 2 1 1 2 1 A
Prosopistomatidae (Water specs) 1 1 1 1 1 1 A A A A A EProsopistoma crassi 2 1 1 1 2 A A A
Water Quality
Komati Catchment Ecological Water Requirements Study – Quantity Report Page D - 61
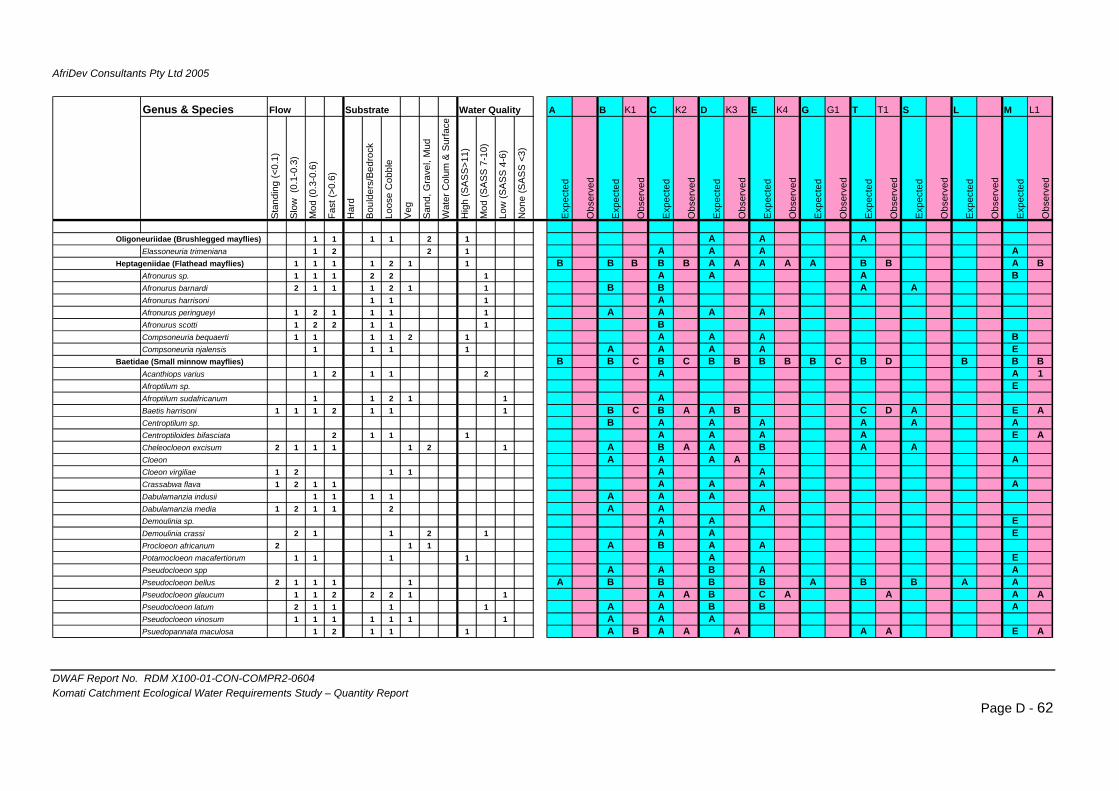
AfriDev Consultants Pty Ltd 2005
DWAF Report No. RDM X100-01-CON-COMPR2-0604
Genus & Species Flow Substrate A B K1 C K2 D K3 E K4 G G1 T T1 S L M L1
Sta
ndin
g (<
0.1)
Slo
w (
0.1-
0.3)
Mod
(0.3
-0.6
)
Fast
(>0.
6)
Har
d
Bou
lder
s/B
edro
ck
Loos
e C
obbl
e
Veg
San
d, G
rave
l, M
ud
Wat
er C
olum
& S
urfa
ce
Hig
h (S
AS
S>1
1)
Mod
(SA
SS
7-1
0)
Low
(SA
SS
4-6
)
Non
e (S
AS
S <
3)
Exp
ecte
d
Obs
erve
d
Exp
ecte
d
Obs
erve
d
Exp
ecte
d
Obs
erve
d
Exp
ecte
d
Obs
erve
d
Exp
ecte
d
Obs
erve
d
Exp
ecte
d
Obs
erve
d
Exp
ecte
d
Obs
erve
d
Exp
ecte
d
Obs
erve
d
Exp
ecte
d
Obs
erve
d
Exp
ecte
d
Obs
erve
d
Oligoneuriidae (Brushlegged mayflies) 1 1 1 1 2 1 A A AElassoneuria trimeniana 1 2 2 1 A A A A
Heptageniidae (Flathead mayflies) 1 1 1 1 2 1 1 B B B B B A A A A A B B A BAfronurus sp. 1 1 1 2 2 1 A A A BAfronurus barnardi 2 1 1 1 2 1 1 B B A AAfronurus harrisoni 1 1 1 AAfronurus peringueyi 1 2 1 1 1 1 A A A AAfronurus scotti 1 2 2 1 1 1 BCompsoneuria bequaerti 1 1 1 1 2 1 A A A BCompsoneuria njalensis 1 1 1 1 A A A A E
Baetidae (Small minnow mayflies) B B C B C B B B B B C B D B B BAcanthiops varius 1 2 1 1 2 A A 1Afroptilum sp. EAfroptilum sudafricanum 1 1 2 1 1 ABaetis harrisoni 1 1 1 2 1 1 1 B C B A A B C D A E ACentroptilum sp. B A A A A A ACentroptiloides bifasciata 2 1 1 1 A A A A E ACheleocloeon excisum 2 1 1 1 1 2 1 A B A A B A ACloeon A A A A ACloeon virgiliae 1 2 1 1 A ACrassabwa flava 1 2 1 1 A A A ADabulamanzia indusii 1 1 1 1 A A ADabulamanzia media 1 2 1 1 2 A A ADemoulinia sp. A A EDemoulinia crassi 2 1 1 2 1 A A EProcloeon africanum 2 1 1 A B A APotamocloeon macafertiorum 1 1 1 1 A EPseudocloeon spp A A B A APseudocloeon bellus 2 1 1 1 1 A B B B B A B B A APseudocloeon glaucum 1 1 2 2 2 1 1 A A B C A A A APseudocloeon latum 2 1 1 1 1 A A B B APseudocloeon vinosum 1 1 1 1 1 1 1 A A APsuedopannata maculosa 1 2 1 1 1 A B A A A A A E A
Water Quality
Komati Catchment Ecological Water Requirements Study – Quantity Report Page D - 62

AfriDev Consultants Pty Ltd 2005
DWAF Report No. RDM X100-01-CON-COMPR2-0604
Genus & Species Flow Substrate A B K1 C K2 D K3 E K4 G G1 T T1 S L M L1
Sta
ndin
g (<
0.1)
Slo
w (
0.1-
0.3)
Mod
(0.3
-0.6
)
Fast
(>0.
6)
Har
d
Bou
lder
s/B
edro
ck
Loos
e C
obbl
e
Veg
San
d, G
rave
l, M
ud
Wat
er C
olum
& S
urfa
ce
Hig
h (S
AS
S>1
1)
Mod
(SA
SS
7-1
0)
Low
(SA
SS
4-6
)
Non
e (S
AS
S <
3)
Exp
ecte
d
Obs
erve
d
Exp
ecte
d
Obs
erve
d
Exp
ecte
d
Obs
erve
d
Exp
ecte
d
Obs
erve
d
Exp
ecte
d
Obs
erve
d
Exp
ecte
d
Obs
erve
d
Exp
ecte
d
Obs
erve
d
Exp
ecte
d
Obs
erve
d
Exp
ecte
d
Obs
erve
d
Exp
ecte
d
Obs
erve
d
Chlorolestidae 1 1 2 1 A A A 1Lestidae 1 1 2 1 A 1 1Protoneuridae 1 1 2 1 A ACoenagrionidae 1 2 2 1 B A A B B B C B A A B A A A ACalopterygidae (?Agriidae) 1 1 1 A AChlorocyphidae 1 1 2 1 1 A A B A 1 1 A A 1Aeshnidae 1 2 1 A A A A A A A A A A B B A ACorduliidae 1 2 1 A A A B A EGomphidae 1 1 2 1 B A A A B B B A A B A B A A 1Libelluliidae 1 1 1 1 1 1 1 B A A A A A A A 1 A 1 A B A 1Notonectidae (Back swimmers) 2 2 1 A A A A A A 1Pleidae (Pigmy back swmmers) 2 2 1 A A A A ANaucoridae (Creeping water bugs) 2 1 1 A A B A B A B A A 1 ANepidae (Water scorpions) 2 2 1 A 1 A 1 A ABelostomatidae (Giant water bugs) 2 2 1 A A A A A A A A 1 1Corixidae (Water boatmen) 2 1 1 2 1 1 A A B A B A B A C B B C BGerridae (Water striders) 1 1 2 1 A A 1 A A EHydrometridae (Water measurers) 2 2 1 A 1 1 1Veliidae (Broad-shouldered water strider 1 1 2 1 A A B B 1 B B B A A B C A A ADipseudopsidae 1 1 2 1 A EEcnomidae 1 1 1 2 2 1 A A A AHydropsychidae 1 2 1 2 1 1 B B A B A B 1 B A B C A A A B B
Aethaloptera maxima A A EAmphipsyche scottae 1 1 2 A A A E ACheumatopsyche afra 1 2 1 A A A A E ACheumatopsyche maculata ACheumatopsyche thomasseti 1 1 2 A A A A A A A A E ACheumatopsyche zuluensis A B B A B Hydropsyche sp. AHydropsyche longifurca 2 AMacrostemum capensis A A E APolymorphanisus A A
Hydroptilidae 1 1 1 1 1 1 1 A B 1 A A B A 1 1 B AHydroptila capensis A BHydroptila sp. A A
Water Quality
Komati Catchment Ecological Water Requirements Study – Quantity Report Page D - 63

AfriDev Consultants Pty Ltd 2005
DWAF Report No. RDM X100-01-CON-COMPR2-0604
Genus & Species Flow Substrate A B K1 C K2 D K3 E K4 G G1 T T1 S L M L1
Sta
ndin
g (<
0.1)
Slo
w (
0.1-
0.3)
Mod
(0.3
-0.6
)
Fast
(>0.
6)
Har
d
Bou
lder
s/B
edro
ck
Loos
e C
obbl
e
Veg
San
d, G
rave
l, M
ud
Wat
er C
olum
& S
urfa
ce
Hig
h (S
AS
S>1
1)
Mod
(SA
SS
7-1
0)
Low
(SA
SS
4-6
)
Non
e (S
AS
S <
3)
Exp
ecte
d
Obs
erve
d
Exp
ecte
d
Obs
erve
d
Exp
ecte
d
Obs
erve
d
Exp
ecte
d
Obs
erve
d
Exp
ecte
d
Obs
erve
d
Exp
ecte
d
Obs
erve
d
Exp
ecte
d
Obs
erve
d
Exp
ecte
d
Obs
erve
d
Exp
ecte
d
Obs
erve
d
Exp
ecte
d
Obs
erve
d
Leptoceridae 1 1 1 1 1 2 1 1 A A A A B B A A A A A A E A Athripsodes sp. A A A ECeraclea sp. 1 1 2 1 1 1Leptocerus sp. A A A ELeptocerus gracilis A ALeptocerina sp. A A EOecetis sp. A A A A A A E AParasetodes sp. A A A ESetodes sp. ATriaenodes sp. A A ETrianodes falculata ATrichosetodes sp. 1 A A E 1
Philopotamidae 1 2 1 1 A 1 B C 1 1 1 A A 1Chimarra sp. C A A A
Polycentropodidae 1 1 1Psychomyiidae 2 1 APyralidae 1 1 1 2 1 2 1 1 1 A A A A 1Dytiscidae (Diving Beetles) 2 1 2 1 A A 1 A A A A A 1 A A B A A ANoteridae (Burrowing water beetles) A A AElmidae (Riffle Beetles) 1 2 2 1 1 1 A A A B A A A A 1 B B A B BGyrinidae (Whirligig Beetles) 1 2 2 2 1 B A 1 B A A 1 A B B B A 1Haliplidae (Crawling Water Beetles) 2 2 1 B AHelodidae 1 A A A BHydraenidae (Minute Moss Beetles) 1 2 1 A A A A AHydrophilidae (Water Scavenger Beetles 2 2 1 A A A A A A ALimnichidae (Marsh-loving beetles) 1 1 APsephenidae (Water Pennies) 1 2 2 1 1 A A A B 1 A A A A A ASphaeriidae (Minute bog beetles) AStaphylinidae (Rove Beetles) ATipulidae (Crane Flies) 1 1 1 1 1 1 2 1 A A A 1 1 1 A B A A A E 1Psychodidae (Moth flies) 1 1 1 A A ABlephariceridae (Net-winged midges) 2 1 2 1 ADixidae (Dxid midges) 2 2 1 1 A A A 1 A A
Water Quality
Komati Catchment Ecological Water Requirements Study – Quantity Report Page D - 64

AfriDev Consultants Pty Ltd 2005
DWAF Report No. RDM X100-01-CON-COMPR2-0604
Genus & Species Flow Substrate A B K1 C K2 D K3 E K4 G G1 T T1 S L M L1
Sta
ndin
g (<
0.1)
Slo
w (
0.1-
0.3)
Mod
(0.3
-0.6
)
Fast
(>0.
6)
Har
d
Bou
lder
s/B
edro
ck
Loos
e C
obbl
e
Veg
San
d, G
rave
l, M
ud
Wat
er C
olum
& S
urfa
ce
Hig
h (S
AS
S>1
1)
Mod
(SA
SS
7-1
0)
Low
(SA
SS
4-6
)
Non
e (S
AS
S <
3)
Exp
ecte
d
Obs
erve
d
Exp
ecte
d
Obs
erve
d
Exp
ecte
d
Obs
erve
d
Exp
ecte
d
Obs
erve
d
Exp
ecte
d
Obs
erve
d
Exp
ecte
d
Obs
erve
d
Exp
ecte
d
Obs
erve
d
Exp
ecte
d
Obs
erve
d
Exp
ecte
d
Obs
erve
d
Exp
ecte
d
Obs
erve
d
Culicidae (Mosquitoes) 2 2 1 A 1 1 1 A B ACeratopogonidae (Biting Midges) 1 1 1 1 2 1 1 A B B A A A A A A A B B A 1Chironomidae (Midges) 2 1 1 1 1 1 1 1 1 1 2 B B B B C B B B B B C B D A BSimuliidae (Blackflies) 1 2 2 2 2 2 2 1 2 1 B B B B B B C B A B B B C A C
Simulium adersi 1 1 2 2 1 1 2 1 A A C ESimulium alcocki 1 2 1 A A A ASimulium bequaerti 1 2 1 1 1 ASimulium bovis 1 2 2 1 1 A A A ESimulium cervicornutum 1 1 2 1 1 A A A ESimulium damnosum 1 1 1 1 1 2 2 A A A A A A A E BSimulium hargreavesi 1 1 1 2 1 2 1 1 A E BSimulium impukane 1 1 2 1 1 1 A ESimulium lumbwanum 1 1 1 A ASimulium mcmahoni 1 1 1 1 1 1 1 A ESimulium medusaeforme 1 2 1 2 1 2 1 1 1 B A B B C B ESimulium nigritarse 2 1 2 1 1 2 1 ASimulium rotundum 1 1 1 A A A A ESimulium unicornutum 1 1 1 ASimulium vorax 2 2 1 1 1 A A E
Tabanidae (Horse Flies) 2 1 1 1 2 1 A A A A A A A A B A A A E AAthericidae/Rhagionidae 1 1 1 1 A 1 A A A A 1 A AEmpididae (Dance Flies) 1 1 1 1 A A EEphydridae (Shore Flies) 2 1 1 1 1 A AMuscidae 1 1 1 2 1 A A A A A 1 AThiaridae 1 2 1 1 1 1 2 1 A D A C A B
Melanoides tuberculata 2 1 A A EMalanoides victoriae 1 1 1 1 A
Lymnaeidae 2 1 1 1 2 1 A A A B A B A A A ALymnaea columella 1 2 2 1 1 1 A A ELymnaea natalensis 1 2 2 1 A A A E
Ancylidae 1 1 1 1 1 1 1 1 1 A A A A A A 1 A A ABurnupia sp. 1 1 1 2 A A EFerrissia sp. 1 1 1 1 A A A
Water Quality
Komati Catchment Ecological Water Requirements Study – Quantity Report Page D - 65
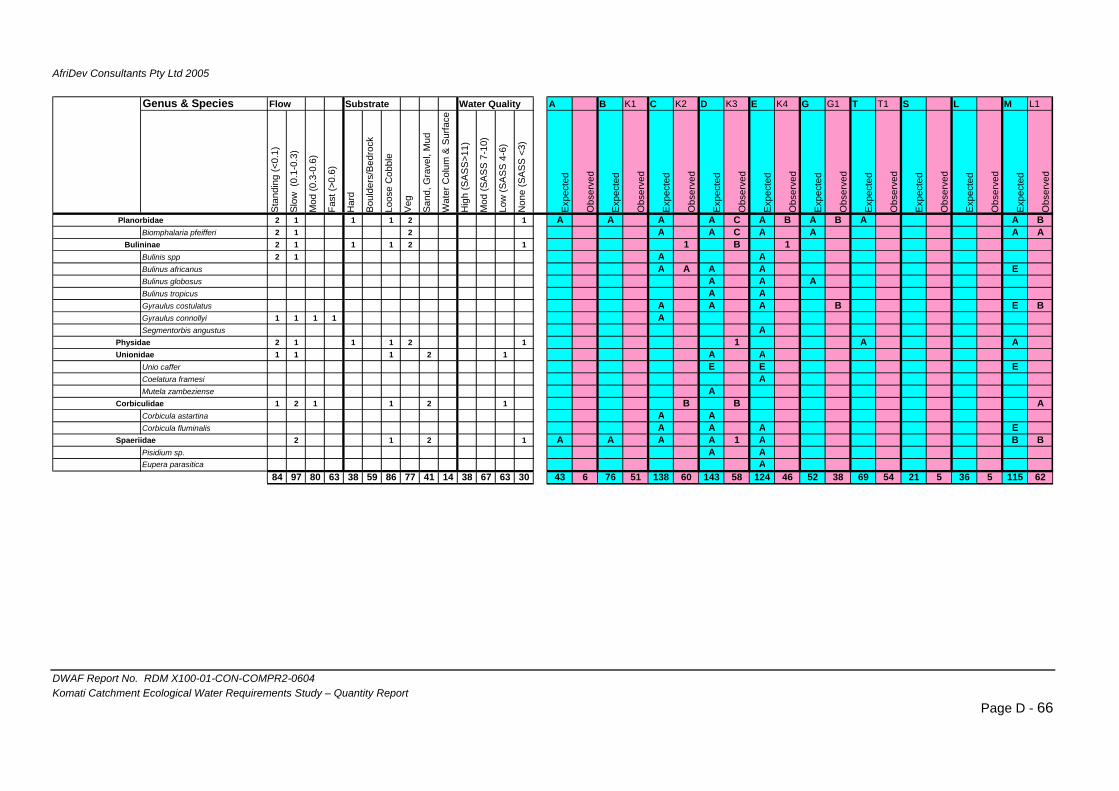
AfriDev Consultants Pty Ltd 2005
DWAF Report No. RDM X100-01-CON-COMPR2-0604
Genus & Species Flow Substrate A B K1 C K2 D K3 E K4 G G1 T T1 S L M L1
Sta
ndin
g (<
0.1)
Slo
w (
0.1-
0.3)
Mod
(0.3
-0.6
)
Fast
(>0.
6)
Har
d
Bou
lder
s/B
edro
ck
Loos
e C
obbl
e
Veg
San
d, G
rave
l, M
ud
Wat
er C
olum
& S
urfa
ce
Hig
h (S
AS
S>1
1)
Mod
(SA
SS
7-1
0)
Low
(SA
SS
4-6
)
Non
e (S
AS
S <
3)
Exp
ecte
d
Obs
erve
d
Exp
ecte
d
Obs
erve
d
Exp
ecte
d
Obs
erve
d
Exp
ecte
d
Obs
erve
d
Exp
ecte
d
Obs
erve
d
Exp
ecte
d
Obs
erve
d
Exp
ecte
d
Obs
erve
d
Exp
ecte
d
Obs
erve
d
Exp
ecte
d
Obs
erve
d
Exp
ecte
d
Obs
erve
d
Planorbidae 2 1 1 1 2 1 A A A A C A B A B A A BBiomphalaria pfeifferi 2 1 2 A A C A A A A
Bulininae 2 1 1 1 2 1 1 B 1Bulinis spp 2 1 A ABulinus africanus A A A A EBulinus globosus A A ABulinus tropicus A AGyraulus costulatus A A A B E BGyraulus connollyi 1 1 1 1 ASegmentorbis angustus A
Physidae 2 1 1 1 2 1 1 A AUnionidae 1 1 1 2 1 A A
Unio caffer E E ECoelatura framesi AMutela zambeziense A
Corbiculidae 1 2 1 1 2 1 B B ACorbicula astartina A ACorbicula fluminalis A A A E
Spaeriidae 2 1 2 1 A A A A 1 A B BPisidium sp. A AEupera parasitica A
84 97 80 63 38 59 86 77 41 14 38 67 63 30 43 6 76 51 138 60 143 58 124 46 52 38 69 54 21 5 36 5 115 62
Water Quality
Komati Catchment Ecological Water Requirements Study – Quantity Report Page D - 66
AfriDev Consultants Pty Ltd 2005
DWAF Report No. RDM X100-01-CON-COMPR2-0604
ANNEX D: Summary Biomonitoring Results per Resource Unit.
Komati Catchment Ecological Water Requirements Study – Quantity Report Page D - 67

AfriDev Consultants Pty Ltd 2005
DWAF Report No. RDM X100-01-CON-COMPR2-0604 Komati Catchment Ecological Water Requirements Study – Quantity Report
Page D - 68
SASS Biomonitoring Results
0
50
100
150
200
250
300
4.0 4.5 5.0 5.5 6.0 6.5 7.0 7.5 8.0
Average Score per Taxon (ASPT)
SASS
Sco
re
ABCDEGLMSTTribAllPoly. (All)
AB
E
D
C
F
Resource Unit

AfriDev Consultants Pty Ltd 2005
DWAF Report No. RDM X100-01-CON-COMPR2-0604 Komati Catchment Ecological Water Requirements Study – Quantity Report
Page D - 69
SASS Biomonitoring Results
0
50
100
150
200
250
300
4.0 4.5 5.0 5.5 6.0 6.5 7.0 7.5 8.0Average Score per Taxon (ASPT)
ABCAllPoly. (All)
AB
E
D
C
F
Resource Unit
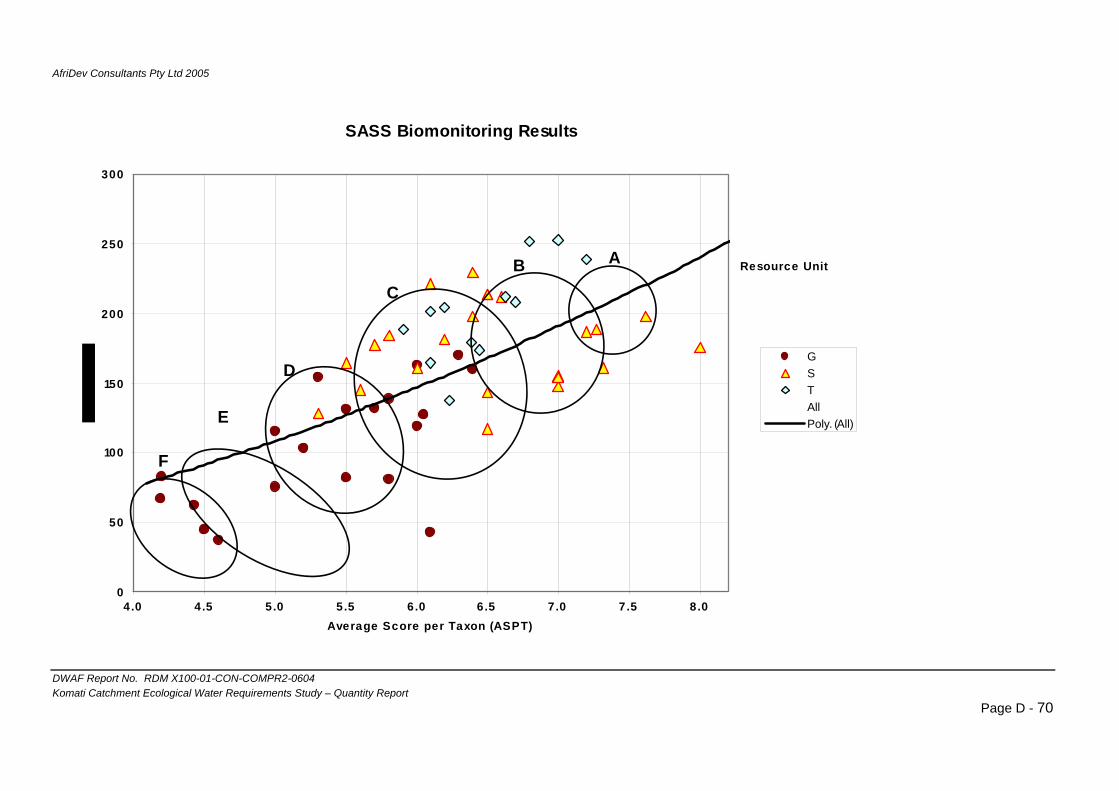
AfriDev Consultants Pty Ltd 2005
DWAF Report No. RDM X100-01-CON-COMPR2-0604 Komati Catchment Ecological Water Requirements Study – Quantity Report
Page D - 70
SASS Biomonitoring Results
0
50
100
150
200
250
300
4.0 4.5 5.0 5.5 6.0 6.5 7.0 7.5 8.0Average Score per Taxon (ASPT)
GSTAllPoly. (All)
AB
E
D
C
F
Resource Unit
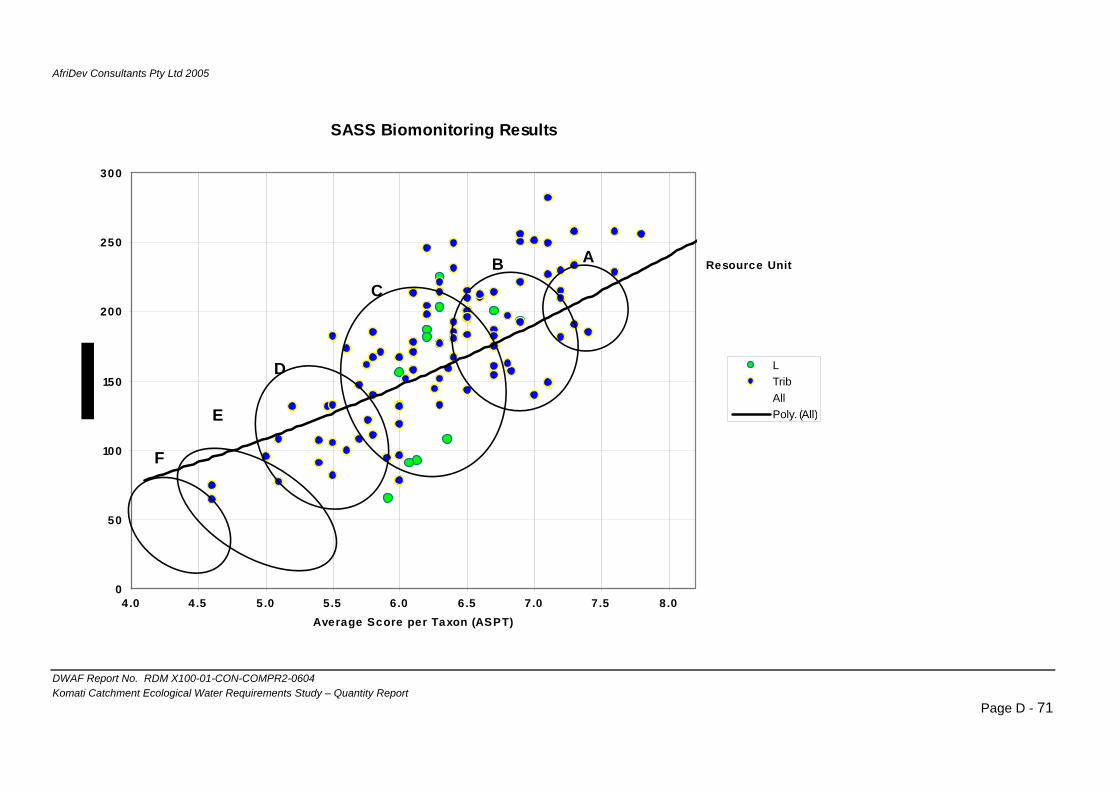
AfriDev Consultants Pty Ltd 2005
DWAF Report No. RDM X100-01-CON-COMPR2-0604 Komati Catchment Ecological Water Requirements Study – Quantity Report
Page D - 71
SASS Biomonitoring Results
0
50
100
150
200
250
300
4.0 4.5 5.0 5.5 6.0 6.5 7.0 7.5 8.0Average Score per Taxon (ASPT)
LTribAllPoly. (All)
AB
E
D
C
F
Resource Unit
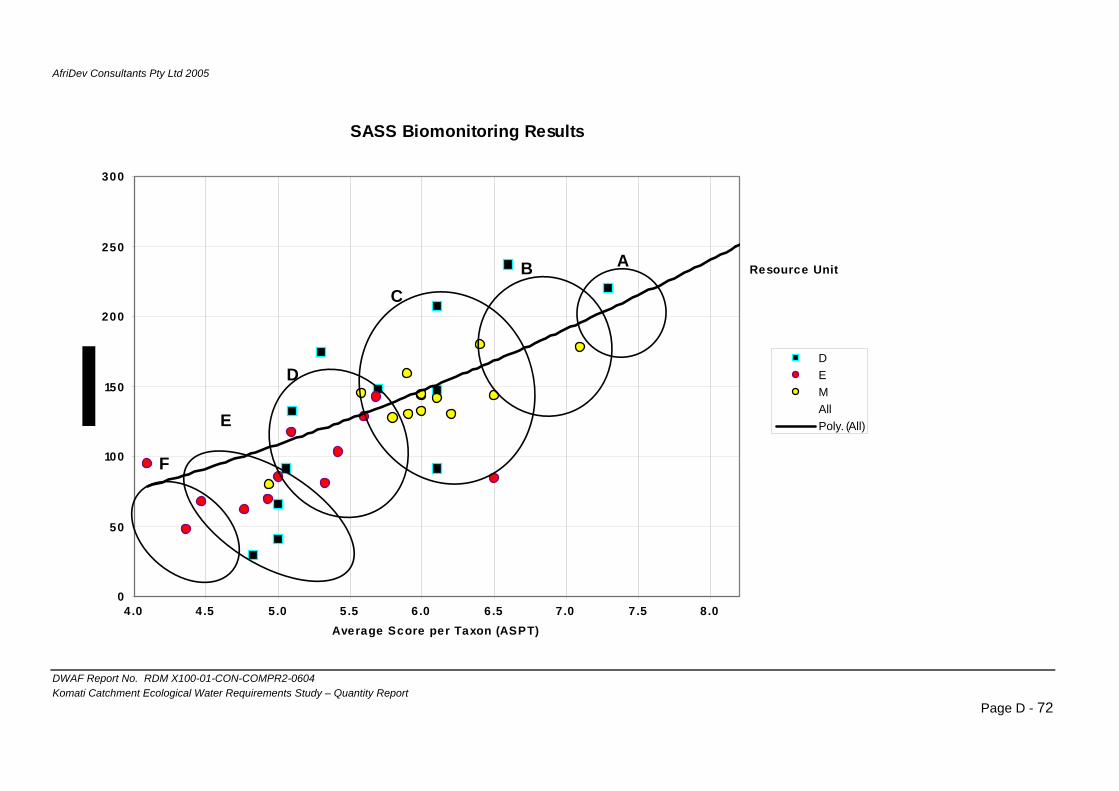
AfriDev Consultants Pty Ltd 2005
DWAF Report No. RDM X100-01-CON-COMPR2-0604 Komati Catchment Ecological Water Requirements Study – Quantity Report
Page D - 72
SASS Biomonitoring Results
0
50
100
150
200
250
300
4.0 4.5 5.0 5.5 6.0 6.5 7.0 7.5 8.0Average Score per Taxon (ASPT)
DEMAllPoly. (All)
AB
E
D
C
F
Resource Unit

AfriDev Consultants Pty Ltd 2005
DWAF Report No. RDM X100-01-CON-COMPR2-0604 Komati Catchment Ecological Water Requirements Study – Quantity Report
Page D - 73
ANNEX E: Detailed Results of Benthic Invertebrate Response Assessment Index (MIRAI)
Site K1: PES (B)
Velo
city
pr
efer
ence
sc
ores
Wei
ght
Wei
ghte
d sc
ore
Ran
k
% W
eigh
t
Std
to s
um
to 1
Presence of taxa with a preference for very fast flowing water FT 2 0.08 0.16 6 35 0.08
Abundance of taxa with a preference for very fast flowing water FTA 5 0.09 0.45 5 40 0.09
Presence of taxa with a preference for moderately fast flowing water MT 3 0.21 0.64 2 95 0.21
Abundance of taxa with a preference for moderately fast flowing water MTA 4 0.22 0.90 1 100 0.22
Presence of taxa with a preference for slow flowing water ST 3 0.19 0.57 4 85 0.19
Abundance of taxa with a preference for slow flowing water STA 4 0.20 0.81 3 90 0.20
Proportional change in average flow dependence of the assemblage 1 70.56 445 1
INDICATORS OF FLOW MODIFICATION
H
abita
t pr
efer
ence
sc
ores
Wei
ght
Wei
ghte
d sc
ore
Ran
k
%W
eigh
t
Std
to
sum
to 1
Has the proportion of invertebrates with a preference for bedrock changed relative to expected? BT 3 0.05 0.14 10 35 0.05
Has the abundance of any of the taxa with a preference for bedrock/boulders changed? BTA 4 0.05 0.22 9 40 0.05
Has the proportion of invertebrates with a preference for mobile cobbles changed relative to expected? CT 3 0.13 0.39 2 95 0.13
Has the abundance of any of the taxa with a preference for mobile cobbles changed? CTA 4 0.14 0.54 1 100 0.14
Has the proportion of invertebrates with a preference for vegetation changed relative to expected? VT 2 0.12 0.23 4 85 0.12
Has the abundance of any of the taxa with a preference for vegetation changed? VTA 4 0.12 0.49 3 90 0.12
Has the proportion of invertebrates with a preference for sand, gravel or mud changed relative to expected? GT 2 0.10 0.20 6 75 0.10
Have the abundance of any of the taxa with a preference for sand, gravel or mud changed relative to expected? GTA 5 0.11 0.54 5 80 0.11
Has the proportion of invertebrates with a preference for the water column or water surface changed relative to expected? WT 1 0.09 0.09 8 65 0.09
Has the abundance of any of the taxa with a preference for the water column/water surface changed? WTA 3 0.10 0.29 7 70 0.10
1 735 1.00Overall change in habitat assemblages 62.72
INDICATORS OF HABITAT PREFERENCE

AfriDev Consultants Pty Ltd 2005
DWAF Report No. RDM X100-01-CON-COMPR2-0604 Komati Catchment Ecological Water Requirements Study – Quantity Report
Page D - 74
Wat
er q
ualit
y re
quire
men
t sc
ore
Wei
ght
Wei
ghte
d sc
ore
Ran
k
%W
eigh
t
Std
to s
um
to 1
Are any taxa with a high requirement for unmodified water quality absent? HQ 2 0.19 0.3860 2 99 0.19Have the abundance of any of the taxa with a high requirement for unmodified water quality been decreased? HQA 0 0.19 0.0000 1 100 0.19Are any taxa with a moderate requirement for unmodified water quality absent? MQ 1 0.13 0.1267 3 65 0.13Have the abundance of any of the taxa with a moderate requirement for unmodified water quality been decreased? MQA 0 0.19 0.0000 2 99 0.19Are any taxa with a low requirement for unmodified water quality present? LQ 1 0.08 0.0780 5 40 0.08Have the abundance of any of the taxa with a low requirement for unmodified water quality been increased? LQA 0 0.09 0.0000 4 45 0.09
How does the total SASS score differ from expected?SASS 1 0.06 0.0585 7 30 0.06
How does the total ASPT score differ from expected? ASPT 1 0.07 0.0682 6 35 0.071 513
Overall change to indicators of modified water quality 14.35
INDICATORS OF WATER QUALITY
PES
met
rics
Estim
ated
in
dica
tor s
core
Wei
ght
Wei
ghte
d sc
ore
Expe
cted
N
atur
al
Ref
eren
ce
Wei
ghte
d Sc
ore
Cal
c w
eigh
t
REA
D
Ran
k
%W
eigh
t
Std
to s
um to
1
Wei
ght r
elat
ive
to 1
FLOW MODIFICATION 83.7 0.469 39.2 46.9 0.469 MTA 1 100 0.500 1HABITAT 86.5 0.263 22.8 26.3 0.263 CTA 3 40 0.200 0.4WATER QUALITY 85.7 0.268 23.0 26.8 0.268 HQA 2 60 0.300 0.6
255.9 1 100 1.000 0.500Invert PES 85.0 200 1Category 51.17 B

AfriDev Consultants Pty Ltd 2005
DWAF Report No. RDM X100-01-CON-COMPR2-0604 Komati Catchment Ecological Water Requirements Study – Quantity Report
Page D - 75
Site K1: Alternative Category Down (C)
Velo
city
pr
efer
ence
sc
ores
Wei
ght
Wei
ghte
d sc
ore
Ran
k
% W
eigh
t
Std
to s
um
to 1
Presence of taxa with a preference for very fast flowing water FT 2 0.16 0.33 4 88 0.16
Abundance of taxa with a preference for very fast flowing water FTA 1 0.17 0.17 3 90 0.17
Presence of taxa with a preference for moderately fast flowing water MT 3 0.18 0.53 2 95 0.18
Abundance of taxa with a preference for moderately fast flowing water MTA 1 0.19 0.19 1 100 0.19
Presence of taxa with a preference for slow flowing water ST 2 0.15 0.30 6 80 0.15
Abundance of taxa with a preference for slow flowing water STA 0 0.16 0.00 5 85 0.16
Proportional change in average flow dependence of the assemblage 1 30.15 538 1
INDICATORS OF FLOW MODIFICATION
Hab
itat
pref
eren
ce
scor
es
Wei
ght
Wei
ghte
d sc
ore
Ran
k
%W
eigh
t
Std
to
sum
to 1
Has the proportion of invertebrates with a preference for bedrock changed relative to expected? BT 2 0.10 0.20 6 75 0.10
Has the abundance of any of the taxa with a preference for bedrock/boulders changed? BTA 0 0.11 0.00 5 80 0.11
Has the proportion of invertebrates with a preference for mobile cobbles changed relative to expected? CT 2 0.13 0.25 2 95 0.13
Has the abundance of any of the taxa with a preference for mobile cobbles changed? CTA 0 0.13 0.00 1 100 0.13
Has the proportion of invertebrates with a preference for vegetation changed relative to expected? VT 1 0.11 0.11 4 85 0.11
Has the abundance of any of the taxa with a preference for vegetation changed? VTA 0 0.12 0.00 3 90 0.12
Has the proportion of invertebrates with a preference for sand, gravel or mud changed relative to expected? GT 1 0.08 0.08 8 60 0.08
Have the abundance of any of the taxa with a preference for sand, gravel or mud changed relative to expected? GTA 0 0.09 0.00 7 65 0.09
Has the proportion of invertebrates with a preference for the water column or water surface changed relative to expected? WT 2 0.07 0.13 10 50 0.07
Has the abundance of any of the taxa with a preference for the water column/water surface changed? WTA 0 0.07 0.00 9 55 0.07
1 755 1.00Overall change in habitat assemblages 15.50
INDICATORS OF HABITAT PREFERENCE
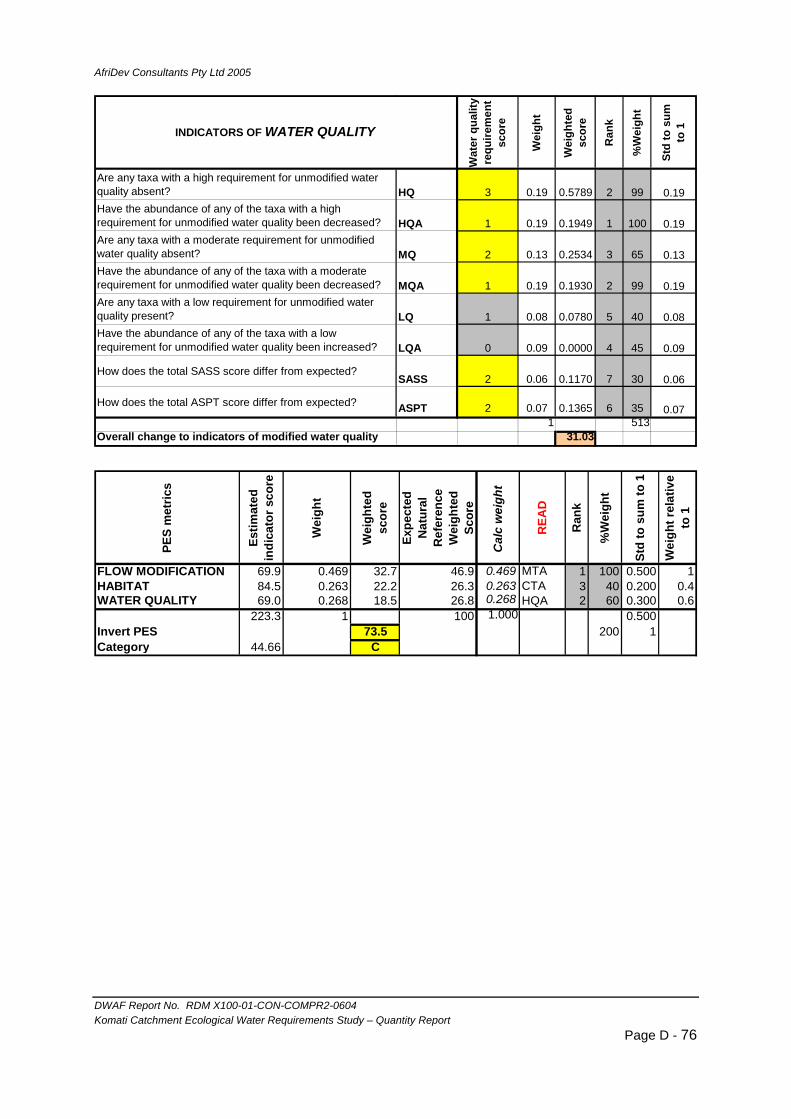
AfriDev Consultants Pty Ltd 2005
DWAF Report No. RDM X100-01-CON-COMPR2-0604 Komati Catchment Ecological Water Requirements Study – Quantity Report
Page D - 76
Wat
er q
ualit
y re
quire
men
t sc
ore
Wei
ght
Wei
ghte
d sc
ore
Ran
k
%W
eigh
t
Std
to s
um
to 1
Are any taxa with a high requirement for unmodified water quality absent? HQ 3 0.19 0.5789 2 99 0.19Have the abundance of any of the taxa with a high requirement for unmodified water quality been decreased? HQA 1 0.19 0.1949 1 100 0.19Are any taxa with a moderate requirement for unmodified water quality absent? MQ 2 0.13 0.2534 3 65 0.13Have the abundance of any of the taxa with a moderate requirement for unmodified water quality been decreased? MQA 1 0.19 0.1930 2 99 0.19Are any taxa with a low requirement for unmodified water quality present? LQ 1 0.08 0.0780 5 40 0.08Have the abundance of any of the taxa with a low requirement for unmodified water quality been increased? LQA 0 0.09 0.0000 4 45 0.09
How does the total SASS score differ from expected?SASS 2 0.06 0.1170 7 30 0.06
How does the total ASPT score differ from expected? ASPT 2 0.07 0.1365 6 35 0.071 513
Overall change to indicators of modified water quality 31.03
INDICATORS OF WATER QUALITY
PES
met
rics
Estim
ated
in
dica
tor s
core
Wei
ght
Wei
ghte
d sc
ore
Expe
cted
N
atur
al
Ref
eren
ce
Wei
ghte
d Sc
ore
Cal
c w
eigh
t
REA
D
Ran
k
%W
eigh
t
Std
to s
um to
1
Wei
ght r
elat
ive
to 1
FLOW MODIFICATION 69.9 0.469 32.7 46.9 0.469 MTA 1 100 0.500 1HABITAT 84.5 0.263 22.2 26.3 0.263 CTA 3 40 0.200 0.4WATER QUALITY 69.0 0.268 18.5 26.8 0.268 HQA 2 60 0.300 0.6
223.3 1 100 1.000 0.500Invert PES 73.5 200 1Category 44.66 C

AfriDev Consultants Pty Ltd 2005
DWAF Report No. RDM X100-01-CON-COMPR2-0604 Komati Catchment Ecological Water Requirements Study – Quantity Report
Page D - 77
Site K2: PES (C)
Velo
city
pr
efer
ence
sc
ores
Wei
ght
Wei
ghte
d sc
ore
Ran
k
% W
eigh
t
Std
to s
um
to 1
Presence of taxa with a preference for very fast flowing water FT 3 0.16 0.49 4 88 0.16
Abundance of taxa with a preference for very fast flowing water FTA 0 0.17 0.00 3 90 0.17
Presence of taxa with a preference for moderately fast flowing water MT 2 0.18 0.35 2 95 0.18
Abundance of taxa with a preference for moderately fast flowing water MTA 0 0.19 0.00 1 100 0.19
Presence of taxa with a preference for slow flowing water ST 2 0.15 0.30 6 80 0.15
Abundance of taxa with a preference for slow flowing water STA 0 0.16 0.00 5 85 0.16
Proportional change in average flow dependence of the assemblage 1 22.83 538 1
INDICATORS OF FLOW MODIFICATION
Hab
itat
pref
eren
ce
scor
es
Wei
ght
Wei
ghte
d sc
ore
Ran
k
%W
eigh
t
Std
to
sum
to 1
Has the proportion of invertebrates with a preference for bedrock changed relative to expected? BT 2 0.10 0.20 6 75 0.10
Has the abundance of any of the taxa with a preference for bedrock/boulders changed? BTA 0 0.11 0.00 5 80 0.11
Has the proportion of invertebrates with a preference for mobile cobbles changed relative to expected? CT 2 0.13 0.25 2 95 0.13
Has the abundance of any of the taxa with a preference for mobile cobbles changed? CTA 0 0.13 0.00 1 100 0.13
Has the proportion of invertebrates with a preference for vegetation changed relative to expected? VT 2 0.11 0.23 4 85 0.11
Has the abundance of any of the taxa with a preference for vegetation changed? VTA 0 0.12 0.00 3 90 0.12
Has the proportion of invertebrates with a preference for sand, gravel or mud changed relative to expected? GT 1 0.08 0.08 8 60 0.08
Have the abundance of any of the taxa with a preference for sand, gravel or mud changed relative to expected? GTA 0 0.09 0.00 7 65 0.09
Has the proportion of invertebrates with a preference for the water column or water surface changed relative to expected? WT 4 0.07 0.26 10 50 0.07
Has the abundance of any of the taxa with a preference for the water column/water surface changed? WTA 0 0.07 0.00 9 55 0.07
1 755 1.00Overall change in habitat assemblages 20.40
INDICATORS OF HABITAT PREFERENCE

AfriDev Consultants Pty Ltd 2005
DWAF Report No. RDM X100-01-CON-COMPR2-0604 Komati Catchment Ecological Water Requirements Study – Quantity Report
Page D - 78
Wat
er q
ualit
y re
quire
men
t sc
ore
Wei
ght
Wei
ghte
d sc
ore
Ran
k
%W
eigh
t
Std
to s
um
to 1
Are any taxa with a high requirement for unmodified water quality absent? HQ 4 0.19 0.7719 2 99 0.19Have the abundance of any of the taxa with a high requirement for unmodified water quality been decreased? HQA 0 0.19 0.0000 1 100 0.19Are any taxa with a moderate requirement for unmodified water quality absent? MQ 2 0.13 0.2534 3 65 0.13Have the abundance of any of the taxa with a moderate requirement for unmodified water quality been decreased? MQA 0 0.19 0.0000 2 99 0.19Are any taxa with a low requirement for unmodified water quality present? LQ 2 0.08 0.1559 5 40 0.08Have the abundance of any of the taxa with a low requirement for unmodified water quality been increased? LQA 0 0.09 0.0000 4 45 0.09
How does the total SASS score differ from expected?SASS 0 0.06 0.0000 7 30 0.06
How does the total ASPT score differ from expected? ASPT 1 0.07 0.0682 6 35 0.071 513
Overall change to indicators of modified water quality 24.99
INDICATORS OF WATER QUALITY
PES
met
rics
Estim
ated
in
dica
tor s
core
Wei
ght
Wei
ghte
d sc
ore
Expe
cted
N
atur
al
Ref
eren
ce
Wei
ghte
d Sc
ore
Cal
c w
eigh
t
REA
D
Ran
k
%W
eigh
t
Std
to s
um to
1
Wei
ght r
elat
ive
to 1
FLOW MODIFICATION 77.2 0.384 29.6 38.4 0.384 MTA 1 100 0.417 1HABITAT 79.6 0.323 25.7 32.3 0.323 CTA 3 60 0.250 0.6WATER QUALITY 75.0 0.293 22.0 29.3 0.293 HQA 2 80 0.333 0.8
231.8 1 100 1.000 0.417Invert PES 77.3 240 1Category 46.36 C
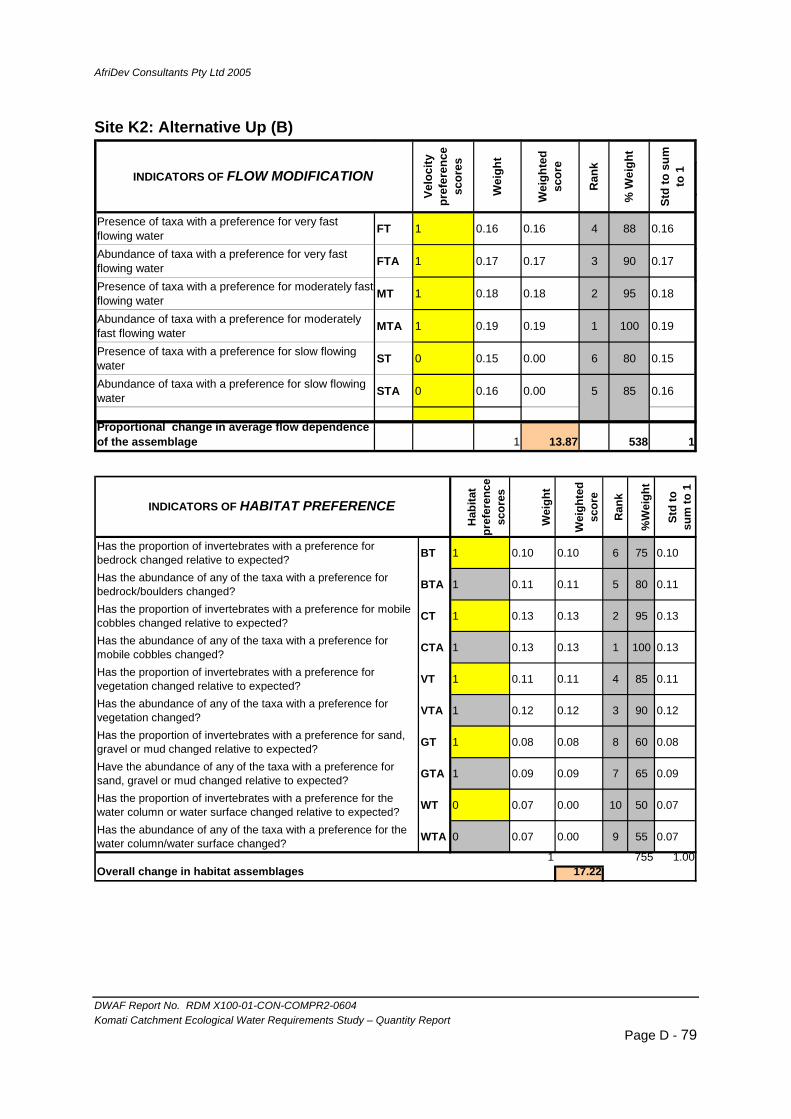
AfriDev Consultants Pty Ltd 2005
DWAF Report No. RDM X100-01-CON-COMPR2-0604 Komati Catchment Ecological Water Requirements Study – Quantity Report
Page D - 79
Site K2: Alternative Up (B)
Velo
city
pr
efer
ence
sc
ores
Wei
ght
Wei
ghte
d sc
ore
Ran
k
% W
eigh
t
Std
to s
um
to 1
Presence of taxa with a preference for very fast flowing water FT 1 0.16 0.16 4 88 0.16
Abundance of taxa with a preference for very fast flowing water FTA 1 0.17 0.17 3 90 0.17
Presence of taxa with a preference for moderately fast flowing water MT 1 0.18 0.18 2 95 0.18
Abundance of taxa with a preference for moderately fast flowing water MTA 1 0.19 0.19 1 100 0.19
Presence of taxa with a preference for slow flowing water ST 0 0.15 0.00 6 80 0.15
Abundance of taxa with a preference for slow flowing water STA 0 0.16 0.00 5 85 0.16
Proportional change in average flow dependence of the assemblage 1 13.87 538 1
INDICATORS OF FLOW MODIFICATION
Hab
itat
pref
eren
ce
scor
es
Wei
ght
Wei
ghte
d sc
ore
Ran
k
%W
eigh
t
Std
to
sum
to 1
Has the proportion of invertebrates with a preference for bedrock changed relative to expected? BT 1 0.10 0.10 6 75 0.10
Has the abundance of any of the taxa with a preference for bedrock/boulders changed? BTA 1 0.11 0.11 5 80 0.11
Has the proportion of invertebrates with a preference for mobile cobbles changed relative to expected? CT 1 0.13 0.13 2 95 0.13
Has the abundance of any of the taxa with a preference for mobile cobbles changed? CTA 1 0.13 0.13 1 100 0.13
Has the proportion of invertebrates with a preference for vegetation changed relative to expected? VT 1 0.11 0.11 4 85 0.11
Has the abundance of any of the taxa with a preference for vegetation changed? VTA 1 0.12 0.12 3 90 0.12
Has the proportion of invertebrates with a preference for sand, gravel or mud changed relative to expected? GT 1 0.08 0.08 8 60 0.08
Have the abundance of any of the taxa with a preference for sand, gravel or mud changed relative to expected? GTA 1 0.09 0.09 7 65 0.09
Has the proportion of invertebrates with a preference for the water column or water surface changed relative to expected? WT 0 0.07 0.00 10 50 0.07
Has the abundance of any of the taxa with a preference for the water column/water surface changed? WTA 0 0.07 0.00 9 55 0.07
1 755 1.00Overall change in habitat assemblages 17.22
INDICATORS OF HABITAT PREFERENCE
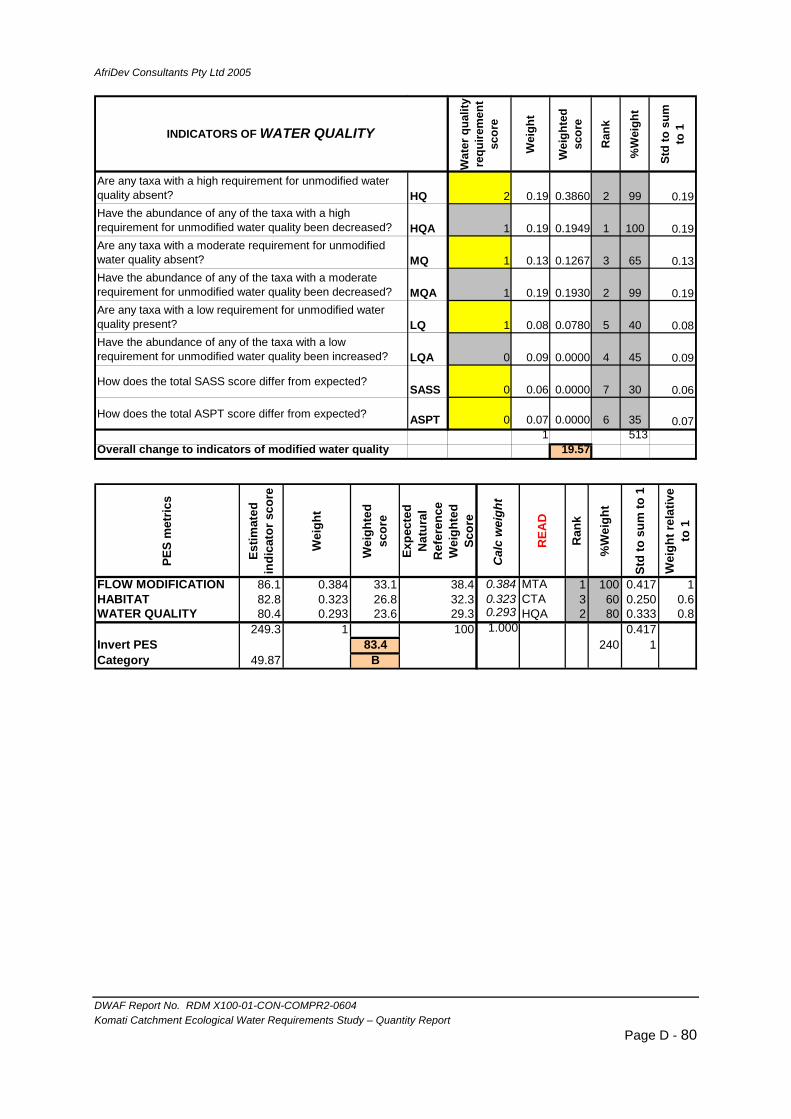
AfriDev Consultants Pty Ltd 2005
DWAF Report No. RDM X100-01-CON-COMPR2-0604 Komati Catchment Ecological Water Requirements Study – Quantity Report
Page D - 80
Wat
er q
ualit
y re
quire
men
t sc
ore
Wei
ght
Wei
ghte
d sc
ore
Ran
k
%W
eigh
t
Std
to s
um
to 1
Are any taxa with a high requirement for unmodified water quality absent? HQ 2 0.19 0.3860 2 99 0.19Have the abundance of any of the taxa with a high requirement for unmodified water quality been decreased? HQA 1 0.19 0.1949 1 100 0.19Are any taxa with a moderate requirement for unmodified water quality absent? MQ 1 0.13 0.1267 3 65 0.13Have the abundance of any of the taxa with a moderate requirement for unmodified water quality been decreased? MQA 1 0.19 0.1930 2 99 0.19Are any taxa with a low requirement for unmodified water quality present? LQ 1 0.08 0.0780 5 40 0.08Have the abundance of any of the taxa with a low requirement for unmodified water quality been increased? LQA 0 0.09 0.0000 4 45 0.09
How does the total SASS score differ from expected?SASS 0 0.06 0.0000 7 30 0.06
How does the total ASPT score differ from expected? ASPT 0 0.07 0.0000 6 35 0.071 513
Overall change to indicators of modified water quality 19.57
INDICATORS OF WATER QUALITY
PES
met
rics
Estim
ated
in
dica
tor s
core
Wei
ght
Wei
ghte
d sc
ore
Expe
cted
N
atur
al
Ref
eren
ce
Wei
ghte
d Sc
ore
Cal
c w
eigh
t
REA
D
Ran
k
%W
eigh
t
Std
to s
um to
1
Wei
ght r
elat
ive
to 1
FLOW MODIFICATION 86.1 0.384 33.1 38.4 0.384 MTA 1 100 0.417 1HABITAT 82.8 0.323 26.8 32.3 0.323 CTA 3 60 0.250 0.6WATER QUALITY 80.4 0.293 23.6 29.3 0.293 HQA 2 80 0.333 0.8
249.3 1 100 1.000 0.417Invert PES 83.4 240 1Category 49.87 B
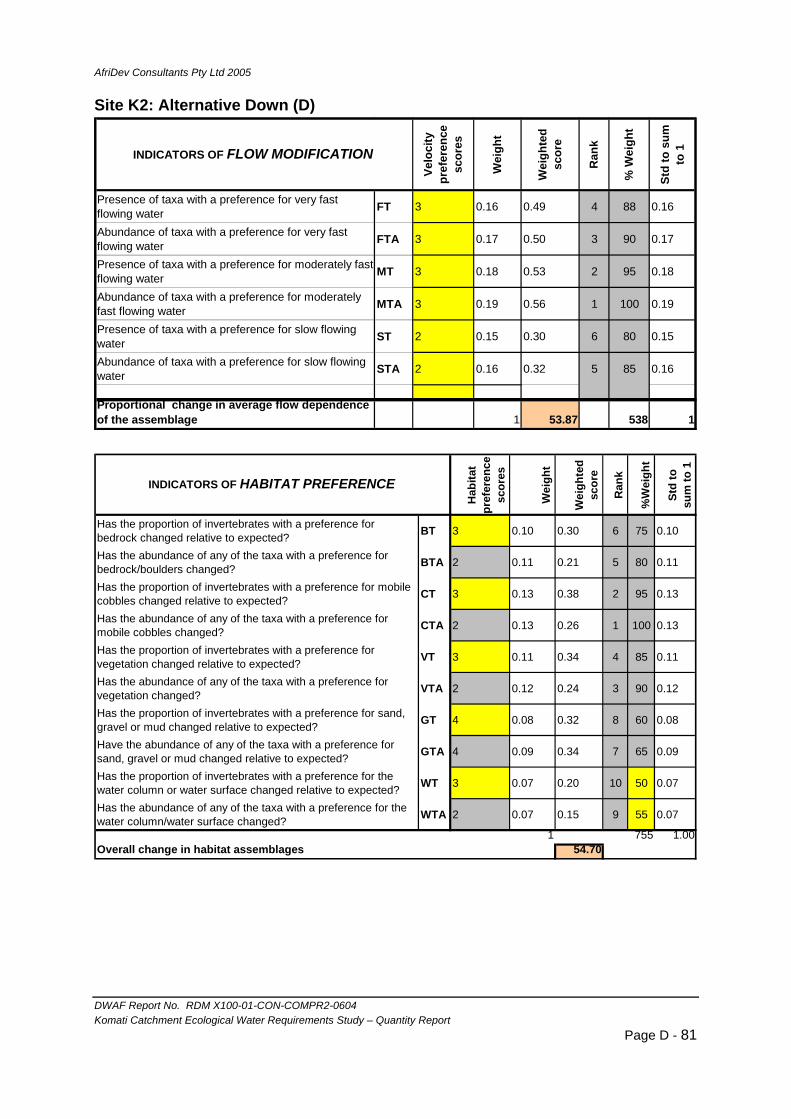
AfriDev Consultants Pty Ltd 2005
DWAF Report No. RDM X100-01-CON-COMPR2-0604 Komati Catchment Ecological Water Requirements Study – Quantity Report
Page D - 81
Site K2: Alternative Down (D)
Velo
city
pr
efer
ence
sc
ores
Wei
ght
Wei
ghte
d sc
ore
Ran
k
% W
eigh
t
Std
to s
um
to 1
Presence of taxa with a preference for very fast flowing water FT 3 0.16 0.49 4 88 0.16
Abundance of taxa with a preference for very fast flowing water FTA 3 0.17 0.50 3 90 0.17
Presence of taxa with a preference for moderately fast flowing water MT 3 0.18 0.53 2 95 0.18
Abundance of taxa with a preference for moderately fast flowing water MTA 3 0.19 0.56 1 100 0.19
Presence of taxa with a preference for slow flowing water ST 2 0.15 0.30 6 80 0.15
Abundance of taxa with a preference for slow flowing water STA 2 0.16 0.32 5 85 0.16
Proportional change in average flow dependence of the assemblage 1 53.87 538 1
INDICATORS OF FLOW MODIFICATION
Hab
itat
pref
eren
ce
scor
es
Wei
ght
Wei
ghte
d sc
ore
Ran
k
%W
eigh
t
Std
to
sum
to 1
Has the proportion of invertebrates with a preference for bedrock changed relative to expected? BT 3 0.10 0.30 6 75 0.10
Has the abundance of any of the taxa with a preference for bedrock/boulders changed? BTA 2 0.11 0.21 5 80 0.11
Has the proportion of invertebrates with a preference for mobile cobbles changed relative to expected? CT 3 0.13 0.38 2 95 0.13
Has the abundance of any of the taxa with a preference for mobile cobbles changed? CTA 2 0.13 0.26 1 100 0.13
Has the proportion of invertebrates with a preference for vegetation changed relative to expected? VT 3 0.11 0.34 4 85 0.11
Has the abundance of any of the taxa with a preference for vegetation changed? VTA 2 0.12 0.24 3 90 0.12
Has the proportion of invertebrates with a preference for sand, gravel or mud changed relative to expected? GT 4 0.08 0.32 8 60 0.08
Have the abundance of any of the taxa with a preference for sand, gravel or mud changed relative to expected? GTA 4 0.09 0.34 7 65 0.09
Has the proportion of invertebrates with a preference for the water column or water surface changed relative to expected? WT 3 0.07 0.20 10 50 0.07
Has the abundance of any of the taxa with a preference for the water column/water surface changed? WTA 2 0.07 0.15 9 55 0.07
1 755 1.00Overall change in habitat assemblages 54.70
INDICATORS OF HABITAT PREFERENCE

AfriDev Consultants Pty Ltd 2005
DWAF Report No. RDM X100-01-CON-COMPR2-0604 Komati Catchment Ecological Water Requirements Study – Quantity Report
Page D - 82
Wat
er q
ualit
y re
quire
men
t sc
ore
Wei
ght
Wei
ghte
d sc
ore
Ran
k
%W
eigh
t
Std
to s
um
to 1
Are any taxa with a high requirement for unmodified water quality absent? HQ 4 0.19 0.7719 2 99 0.19Have the abundance of any of the taxa with a high requirement for unmodified water quality been decreased? HQA 3 0.19 0.5848 1 100 0.19Are any taxa with a moderate requirement for unmodified water quality absent? MQ 4 0.13 0.5068 3 65 0.13Have the abundance of any of the taxa with a moderate requirement for unmodified water quality been decreased? MQA 3 0.19 0.5789 2 99 0.19Are any taxa with a low requirement for unmodified water quality present? LQ 2 0.08 0.1559 5 40 0.08Have the abundance of any of the taxa with a low requirement for unmodified water quality been increased? LQA 0 0.09 0.0000 4 45 0.09
How does the total SASS score differ from expected?SASS 3 0.06 0.1754 7 30 0.06
How does the total ASPT score differ from expected? ASPT 3 0.07 0.2047 6 35 0.071 513
Overall change to indicators of modified water quality 59.57
INDICATORS OF WATER QUALITY
PES
met
rics
Estim
ated
in
dica
tor s
core
Wei
ght
Wei
ghte
d sc
ore
Expe
cted
N
atur
al
Ref
eren
ce
Wei
ghte
d Sc
ore
Cal
c w
eigh
t
REA
D
Ran
k
%W
eigh
t
Std
to s
um to
1
Wei
ght r
elat
ive
to 1
FLOW MODIFICATION 46.1 0.384 17.7 38.4 0.384 MTA 1 100 0.417 1HABITAT 45.3 0.323 14.6 32.3 0.323 CTA 3 60 0.250 0.6WATER QUALITY 40.4 0.293 11.8 29.3 0.293 HQA 2 80 0.333 0.8
131.9 1 100 1.000 0.417Invert PES 44.2 240 1Category 26.37 D

AfriDev Consultants Pty Ltd 2005
DWAF Report No. RDM X100-01-CON-COMPR2-0604 Komati Catchment Ecological Water Requirements Study – Quantity Report
Page D - 83
Site K3: Present Ecological State (E)
Velo
city
pr
efer
ence
sc
ores
Wei
ght
Wei
ghte
d sc
ore
Ran
k
% W
eigh
t
Std
to s
um
to 1
Presence of taxa with a preference for very fast flowing water FT 2 0.08 0.16 6 35 0.08
Abundance of taxa with a preference for very fast flowing water FTA 5 0.09 0.45 5 40 0.09
Presence of taxa with a preference for moderately fast flowing water MT 3 0.21 0.64 2 95 0.21
Abundance of taxa with a preference for moderately fast flowing water MTA 4 0.22 0.90 1 100 0.22
Presence of taxa with a preference for slow flowing water ST 3 0.19 0.57 4 85 0.19
Abundance of taxa with a preference for slow flowing water STA 4 0.20 0.81 3 90 0.20
Proportional change in average flow dependence of the assemblage 1 70.56 445 1
INDICATORS OF FLOW MODIFICATION
Hab
itat
pref
eren
ce
scor
es
Wei
ght
Wei
ghte
d sc
ore
Ran
k
%W
eigh
t
Std
to
sum
to 1
Has the proportion of invertebrates with a preference for bedrock changed relative to expected? BT 3 0.05 0.14 10 35 0.05
Has the abundance of any of the taxa with a preference for bedrock/boulders changed? BTA 4 0.05 0.22 9 40 0.05
Has the proportion of invertebrates with a preference for mobile cobbles changed relative to expected? CT 3 0.13 0.39 2 95 0.13
Has the abundance of any of the taxa with a preference for mobile cobbles changed? CTA 4 0.14 0.54 1 100 0.14
Has the proportion of invertebrates with a preference for vegetation changed relative to expected? VT 2 0.12 0.23 4 85 0.12
Has the abundance of any of the taxa with a preference for vegetation changed? VTA 4 0.12 0.49 3 90 0.12
Has the proportion of invertebrates with a preference for sand, gravel or mud changed relative to expected? GT 2 0.10 0.20 6 75 0.10
Have the abundance of any of the taxa with a preference for sand, gravel or mud changed relative to expected? GTA 5 0.11 0.54 5 80 0.11
Has the proportion of invertebrates with a preference for the water column or water surface changed relative to expected? WT 1 0.09 0.09 8 65 0.09
Has the abundance of any of the taxa with a preference for the water column/water surface changed? WTA 3 0.10 0.29 7 70 0.10
1 735 1.00Overall change in habitat assemblages 62.72
INDICATORS OF HABITAT PREFERENCE
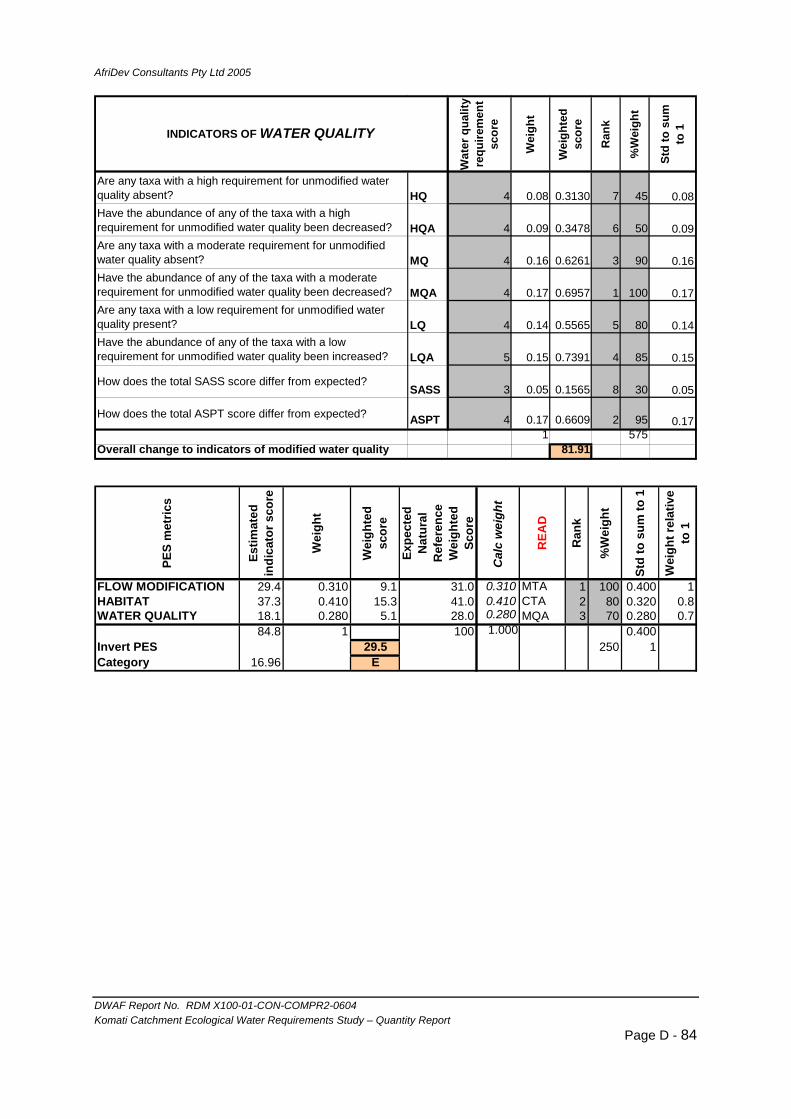
AfriDev Consultants Pty Ltd 2005
DWAF Report No. RDM X100-01-CON-COMPR2-0604 Komati Catchment Ecological Water Requirements Study – Quantity Report
Page D - 84
Wat
er q
ualit
y re
quire
men
t sc
ore
Wei
ght
Wei
ghte
d sc
ore
Ran
k
%W
eigh
t
Std
to s
um
to 1
Are any taxa with a high requirement for unmodified water quality absent? HQ 4 0.08 0.3130 7 45 0.08Have the abundance of any of the taxa with a high requirement for unmodified water quality been decreased? HQA 4 0.09 0.3478 6 50 0.09Are any taxa with a moderate requirement for unmodified water quality absent? MQ 4 0.16 0.6261 3 90 0.16Have the abundance of any of the taxa with a moderate requirement for unmodified water quality been decreased? MQA 4 0.17 0.6957 1 100 0.17Are any taxa with a low requirement for unmodified water quality present? LQ 4 0.14 0.5565 5 80 0.14Have the abundance of any of the taxa with a low requirement for unmodified water quality been increased? LQA 5 0.15 0.7391 4 85 0.15
How does the total SASS score differ from expected?SASS 3 0.05 0.1565 8 30 0.05
How does the total ASPT score differ from expected? ASPT 4 0.17 0.6609 2 95 0.171 575
Overall change to indicators of modified water quality 81.91
INDICATORS OF WATER QUALITY
PES
met
rics
Estim
ated
in
dica
tor s
core
Wei
ght
Wei
ghte
d sc
ore
Expe
cted
N
atur
al
Ref
eren
ce
Wei
ghte
d Sc
ore
Cal
c w
eigh
t
REA
D
Ran
k
%W
eigh
t
Std
to s
um to
1
Wei
ght r
elat
ive
to 1
FLOW MODIFICATION 29.4 0.310 9.1 31.0 0.310 MTA 1 100 0.400 1HABITAT 37.3 0.410 15.3 41.0 0.410 CTA 2 80 0.320 0.8WATER QUALITY 18.1 0.280 5.1 28.0 0.280 MQA 3 70 0.280 0.7
84.8 1 100 1.000 0.400Invert PES 29.5 250 1Category 16.96 E
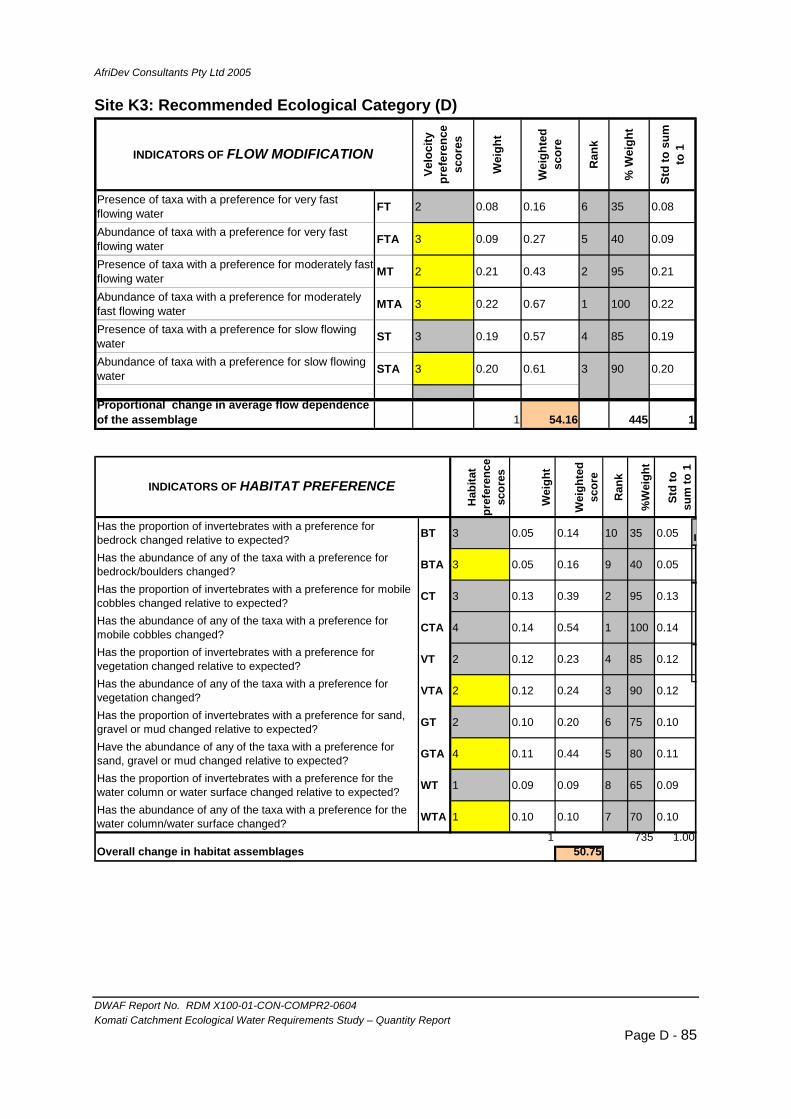
AfriDev Consultants Pty Ltd 2005
DWAF Report No. RDM X100-01-CON-COMPR2-0604 Komati Catchment Ecological Water Requirements Study – Quantity Report
Page D - 85
Site K3: Recommended Ecological Category (D)
Velo
city
pr
efer
ence
sc
ores
Wei
ght
Wei
ghte
d sc
ore
Ran
k
% W
eigh
t
Std
to s
um
to 1
Presence of taxa with a preference for very fast flowing water FT 2 0.08 0.16 6 35 0.08
Abundance of taxa with a preference for very fast flowing water FTA 3 0.09 0.27 5 40 0.09
Presence of taxa with a preference for moderately fast flowing water MT 2 0.21 0.43 2 95 0.21
Abundance of taxa with a preference for moderately fast flowing water MTA 3 0.22 0.67 1 100 0.22
Presence of taxa with a preference for slow flowing water ST 3 0.19 0.57 4 85 0.19
Abundance of taxa with a preference for slow flowing water STA 3 0.20 0.61 3 90 0.20
Proportional change in average flow dependence of the assemblage 1 54.16 445 1
INDICATORS OF FLOW MODIFICATION
Hab
itat
pref
eren
ce
scor
es
Wei
ght
Wei
ghte
d sc
ore
Ran
k
%W
eigh
t
Std
to
sum
to 1
Has the proportion of invertebrates with a preference for bedrock changed relative to expected? BT 3 0.05 0.14 10 35 0.05
Has the abundance of any of the taxa with a preference for bedrock/boulders changed? BTA 3 0.05 0.16 9 40 0.05
Has the proportion of invertebrates with a preference for mobile cobbles changed relative to expected? CT 3 0.13 0.39 2 95 0.13
Has the abundance of any of the taxa with a preference for mobile cobbles changed? CTA 4 0.14 0.54 1 100 0.14
Has the proportion of invertebrates with a preference for vegetation changed relative to expected? VT 2 0.12 0.23 4 85 0.12
Has the abundance of any of the taxa with a preference for vegetation changed? VTA 2 0.12 0.24 3 90 0.12
Has the proportion of invertebrates with a preference for sand, gravel or mud changed relative to expected? GT 2 0.10 0.20 6 75 0.10
Have the abundance of any of the taxa with a preference for sand, gravel or mud changed relative to expected? GTA 4 0.11 0.44 5 80 0.11
Has the proportion of invertebrates with a preference for the water column or water surface changed relative to expected? WT 1 0.09 0.09 8 65 0.09
Has the abundance of any of the taxa with a preference for the water column/water surface changed? WTA 1 0.10 0.10 7 70 0.10
1 735 1.00Overall change in habitat assemblages 50.75
INDICATORS OF HABITAT PREFERENCE
H
CC
SS
WW
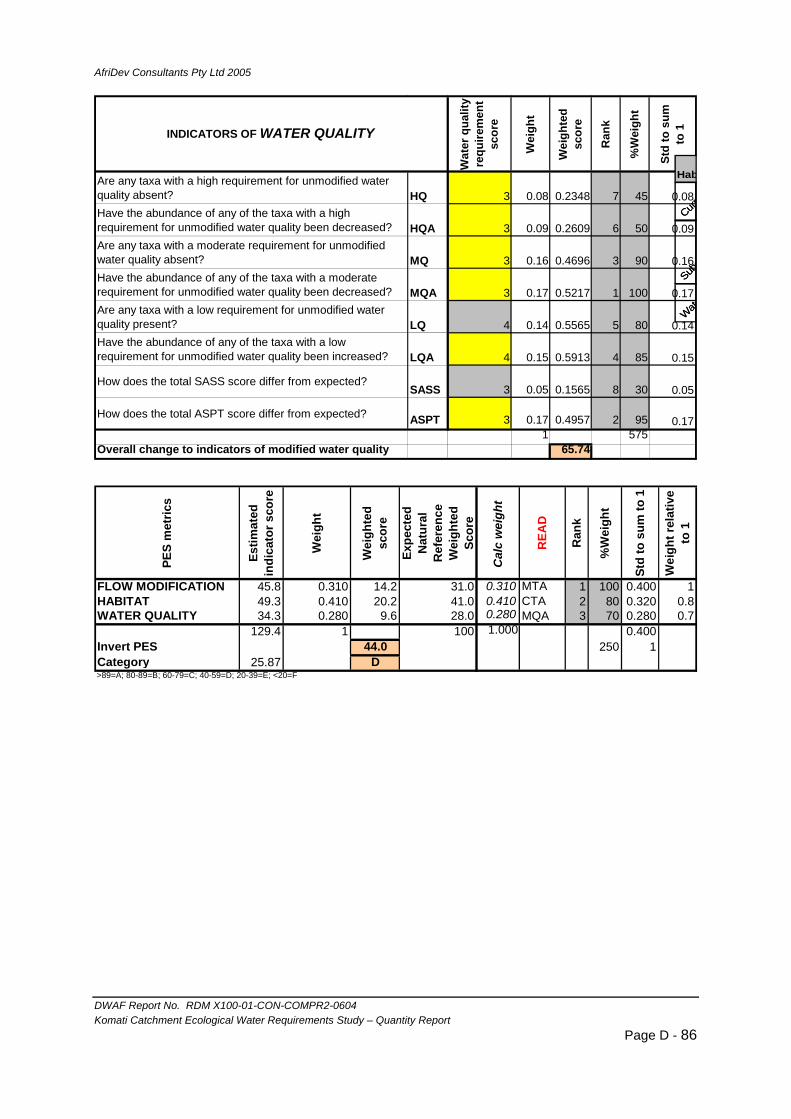
AfriDev Consultants Pty Ltd 2005
DWAF Report No. RDM X100-01-CON-COMPR2-0604 Komati Catchment Ecological Water Requirements Study – Quantity Report
Page D - 86
Wat
er q
ualit
y re
quire
men
t sc
ore
Wei
ght
Wei
ghte
d sc
ore
Ran
k
%W
eigh
t
Std
to s
um
to 1
Are any taxa with a high requirement for unmodified water quality absent? HQ 3 0.08 0.2348 7 45 0.08Have the abundance of any of the taxa with a high requirement for unmodified water quality been decreased? HQA 3 0.09 0.2609 6 50 0.09Are any taxa with a moderate requirement for unmodified water quality absent? MQ 3 0.16 0.4696 3 90 0.16Have the abundance of any of the taxa with a moderate requirement for unmodified water quality been decreased? MQA 3 0.17 0.5217 1 100 0.17Are any taxa with a low requirement for unmodified water quality present? LQ 4 0.14 0.5565 5 80 0.14Have the abundance of any of the taxa with a low requirement for unmodified water quality been increased? LQA 4 0.15 0.5913 4 85 0.15
How does the total SASS score differ from expected?SASS 3 0.05 0.1565 8 30 0.05
How does the total ASPT score differ from expected? ASPT 3 0.17 0.4957 2 95 0.171 575
Overall change to indicators of modified water quality 65.74
INDICATORS OF WATER QUALITY
Hab
Curre
Curre
Subst
Subst
Wate
Wate
PES
met
rics
Estim
ated
in
dica
tor s
core
Wei
ght
Wei
ghte
d sc
ore
Expe
cted
N
atur
al
Ref
eren
ce
Wei
ghte
d Sc
ore
Cal
c w
eigh
t
REA
D
Ran
k
%W
eigh
t
Std
to s
um to
1
Wei
ght r
elat
ive
to 1
FLOW MODIFICATION 45.8 0.310 14.2 31.0 0.310 MTA 1 100 0.400 1HABITAT 49.3 0.410 20.2 41.0 0.410 CTA 2 80 0.320 0.8WATER QUALITY 34.3 0.280 9.6 28.0 0.280 MQA 3 70 0.280 0.7
129.4 1 100 1.000 0.400Invert PES 44.0 250 1Category 25.87 D>89=A; 80-89=B; 60-79=C; 40-59=D; 20-39=E; <20=F
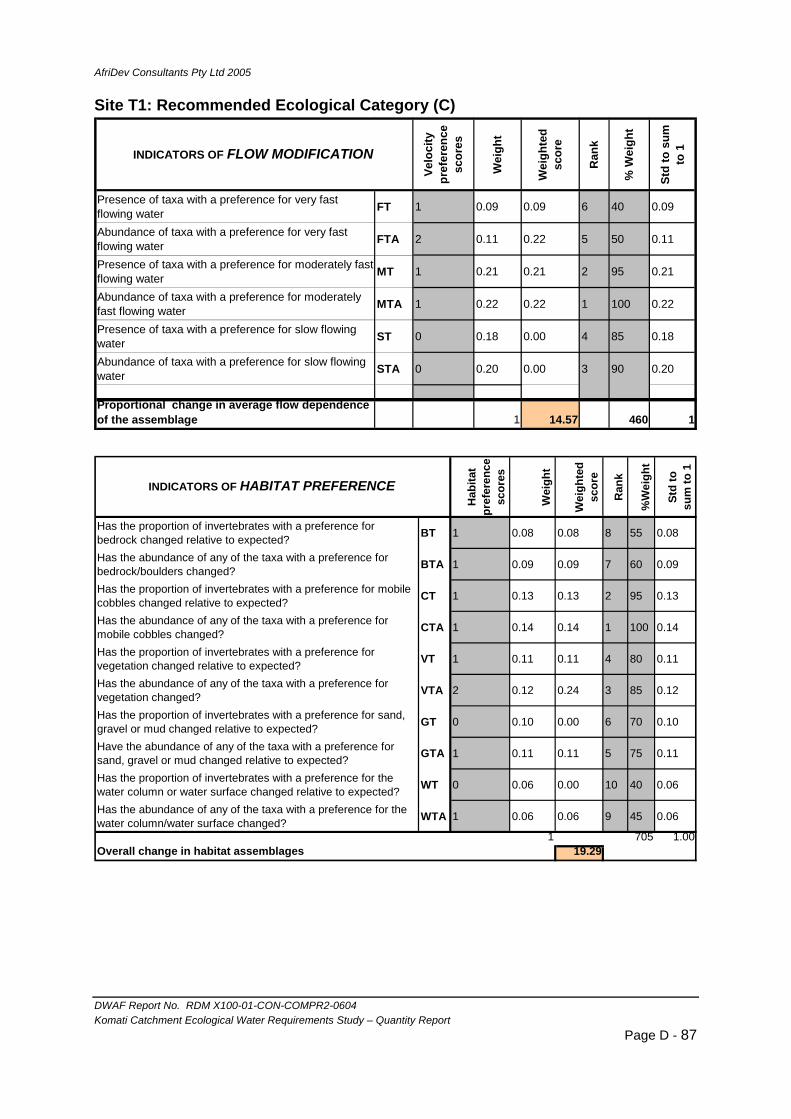
AfriDev Consultants Pty Ltd 2005
DWAF Report No. RDM X100-01-CON-COMPR2-0604 Komati Catchment Ecological Water Requirements Study – Quantity Report
Page D - 87
Site T1: Recommended Ecological Category (C)
Velo
city
pr
efer
ence
sc
ores
Wei
ght
Wei
ghte
d sc
ore
Ran
k
% W
eigh
t
Std
to s
um
to 1
Presence of taxa with a preference for very fast flowing water FT 1 0.09 0.09 6 40 0.09
Abundance of taxa with a preference for very fast flowing water FTA 2 0.11 0.22 5 50 0.11
Presence of taxa with a preference for moderately fast flowing water MT 1 0.21 0.21 2 95 0.21
Abundance of taxa with a preference for moderately fast flowing water MTA 1 0.22 0.22 1 100 0.22
Presence of taxa with a preference for slow flowing water ST 0 0.18 0.00 4 85 0.18
Abundance of taxa with a preference for slow flowing water STA 0 0.20 0.00 3 90 0.20
Proportional change in average flow dependence of the assemblage 1 14.57 460 1
INDICATORS OF FLOW MODIFICATION
Hab
itat
pref
eren
ce
scor
es
Wei
ght
Wei
ghte
d sc
ore
Ran
k
%W
eigh
t
Std
to
sum
to 1
Has the proportion of invertebrates with a preference for bedrock changed relative to expected? BT 1 0.08 0.08 8 55 0.08
Has the abundance of any of the taxa with a preference for bedrock/boulders changed? BTA 1 0.09 0.09 7 60 0.09
Has the proportion of invertebrates with a preference for mobile cobbles changed relative to expected? CT 1 0.13 0.13 2 95 0.13
Has the abundance of any of the taxa with a preference for mobile cobbles changed? CTA 1 0.14 0.14 1 100 0.14
Has the proportion of invertebrates with a preference for vegetation changed relative to expected? VT 1 0.11 0.11 4 80 0.11
Has the abundance of any of the taxa with a preference for vegetation changed? VTA 2 0.12 0.24 3 85 0.12
Has the proportion of invertebrates with a preference for sand, gravel or mud changed relative to expected? GT 0 0.10 0.00 6 70 0.10
Have the abundance of any of the taxa with a preference for sand, gravel or mud changed relative to expected? GTA 1 0.11 0.11 5 75 0.11
Has the proportion of invertebrates with a preference for the water column or water surface changed relative to expected? WT 0 0.06 0.00 10 40 0.06
Has the abundance of any of the taxa with a preference for the water column/water surface changed? WTA 1 0.06 0.06 9 45 0.06
1 705 1.00Overall change in habitat assemblages 19.29
INDICATORS OF HABITAT PREFERENCE
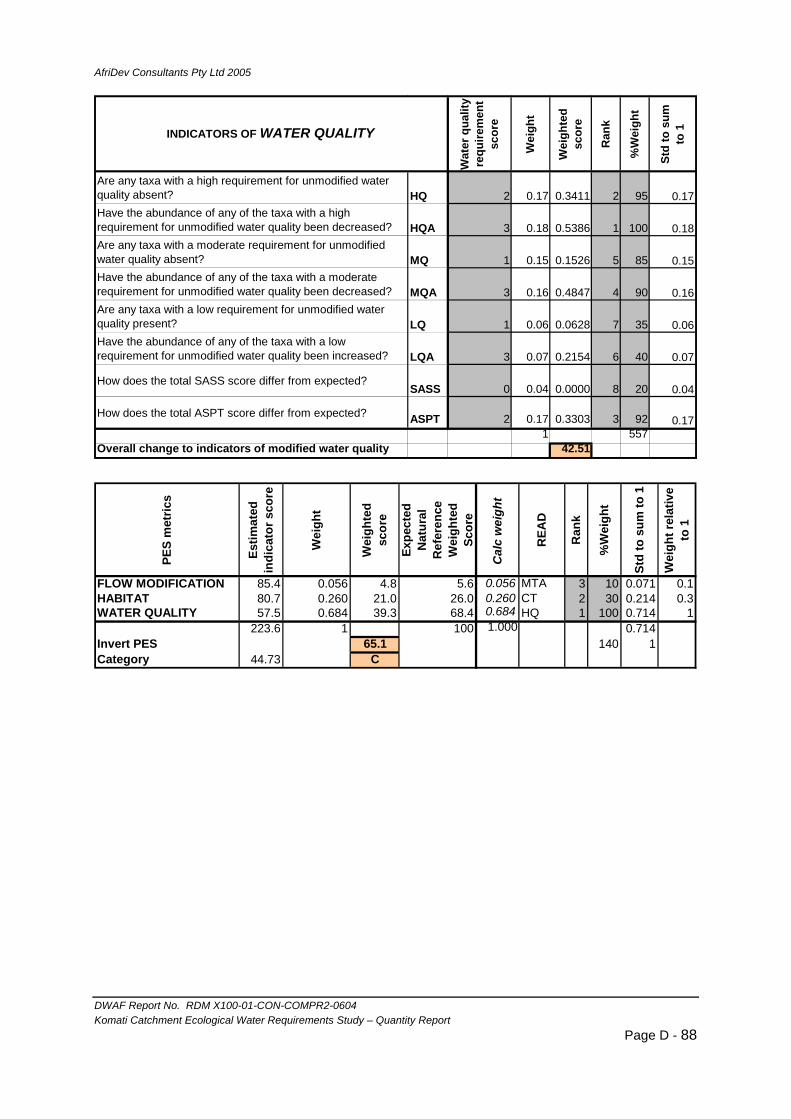
AfriDev Consultants Pty Ltd 2005
DWAF Report No. RDM X100-01-CON-COMPR2-0604 Komati Catchment Ecological Water Requirements Study – Quantity Report
Page D - 88
Wat
er q
ualit
y re
quire
men
t sc
ore
Wei
ght
Wei
ghte
d sc
ore
Ran
k
%W
eigh
t
Std
to s
um
to 1
Are any taxa with a high requirement for unmodified water quality absent? HQ 2 0.17 0.3411 2 95 0.17Have the abundance of any of the taxa with a high requirement for unmodified water quality been decreased? HQA 3 0.18 0.5386 1 100 0.18Are any taxa with a moderate requirement for unmodified water quality absent? MQ 1 0.15 0.1526 5 85 0.15Have the abundance of any of the taxa with a moderate requirement for unmodified water quality been decreased? MQA 3 0.16 0.4847 4 90 0.16Are any taxa with a low requirement for unmodified water quality present? LQ 1 0.06 0.0628 7 35 0.06Have the abundance of any of the taxa with a low requirement for unmodified water quality been increased? LQA 3 0.07 0.2154 6 40 0.07
How does the total SASS score differ from expected?SASS 0 0.04 0.0000 8 20 0.04
How does the total ASPT score differ from expected? ASPT 2 0.17 0.3303 3 92 0.171 557
Overall change to indicators of modified water quality 42.51
INDICATORS OF WATER QUALITY
PES
met
rics
Estim
ated
in
dica
tor s
core
Wei
ght
Wei
ghte
d sc
ore
Expe
cted
N
atur
al
Ref
eren
ce
Wei
ghte
d Sc
ore
Cal
c w
eigh
t
REA
D
Ran
k
%W
eigh
t
Std
to s
um to
1
Wei
ght r
elat
ive
to 1
FLOW MODIFICATION 85.4 0.056 4.8 5.6 0.056 MTA 3 10 0.071 0.1HABITAT 80.7 0.260 21.0 26.0 0.260 CT 2 30 0.214 0.3WATER QUALITY 57.5 0.684 39.3 68.4 0.684 HQ 1 100 0.714 1
223.6 1 100 1.000 0.714Invert PES 65.1 140 1Category 44.73 C

AfriDev Consultants Pty Ltd 2005
DWAF Report No. RDM X100-01-CON-COMPR2-0604 Komati Catchment Ecological Water Requirements Study – Quantity Report
Page D - 89
Site T1: Alternative Category Up (B)
Velo
city
pr
efer
ence
sc
ores
Wei
ght
Wei
ghte
d sc
ore
Ran
k
% W
eigh
t
Std
to s
um
to 1
Presence of taxa with a preference for very fast flowing water FT 1 0.09 0.09 6 40 0.09
Abundance of taxa with a preference for very fast flowing water FTA 1 0.11 0.11 5 50 0.11
Presence of taxa with a preference for moderately fast flowing water MT 1 0.21 0.21 2 95 0.21
Abundance of taxa with a preference for moderately fast flowing water MTA 1 0.22 0.22 1 100 0.22
Presence of taxa with a preference for slow flowing water ST 0 0.18 0.00 4 85 0.18
Abundance of taxa with a preference for slow flowing water STA 0 0.20 0.00 3 90 0.20
Proportional change in average flow dependence of the assemblage 1 12.39 460 1
INDICATORS OF FLOW MODIFICATION
Hab
itat
pref
eren
ce
scor
es
Wei
ght
Wei
ghte
d sc
ore
Ran
k
%W
eigh
t
Std
to
sum
to 1
Has the proportion of invertebrates with a preference for bedrock changed relative to expected? BT 1 0.08 0.08 8 55 0.08
Has the abundance of any of the taxa with a preference for bedrock/boulders changed? BTA 0 0.09 0.00 7 60 0.09
Has the proportion of invertebrates with a preference for mobile cobbles changed relative to expected? CT 1 0.13 0.13 2 95 0.13
Has the abundance of any of the taxa with a preference for mobile cobbles changed? CTA 0 0.14 0.00 1 100 0.14
Has the proportion of invertebrates with a preference for vegetation changed relative to expected? VT 1 0.11 0.11 4 80 0.11
Has the abundance of any of the taxa with a preference for vegetation changed? VTA 1 0.12 0.12 3 85 0.12
Has the proportion of invertebrates with a preference for sand, gravel or mud changed relative to expected? GT 0 0.10 0.00 6 70 0.10
Have the abundance of any of the taxa with a preference for sand, gravel or mud changed relative to expected? GTA 1 0.11 0.11 5 75 0.11
Has the proportion of invertebrates with a preference for the water column or water surface changed relative to expected? WT 0 0.06 0.00 10 40 0.06
Has the abundance of any of the taxa with a preference for the water column/water surface changed? WTA 0 0.06 0.00 9 45 0.06
1 705 1.00Overall change in habitat assemblages 11.06
INDICATORS OF HABITAT PREFERENCE

AfriDev Consultants Pty Ltd 2005
DWAF Report No. RDM X100-01-CON-COMPR2-0604 Komati Catchment Ecological Water Requirements Study – Quantity Report
Page D - 90
Wat
er q
ualit
y re
quire
men
t sc
ore
Wei
ght
Wei
ghte
d sc
ore
Ran
k
%W
eigh
t
Std
to s
um
to 1
Are any taxa with a high requirement for unmodified water quality absent? HQ 1 0.17 0.1706 2 95 0.17Have the abundance of any of the taxa with a high requirement for unmodified water quality been decreased? HQA 1 0.18 0.1795 1 100 0.18Are any taxa with a moderate requirement for unmodified water quality absent? MQ 1 0.15 0.1526 5 85 0.15Have the abundance of any of the taxa with a moderate requirement for unmodified water quality been decreased? MQA 0 0.16 0.0000 4 90 0.16Are any taxa with a low requirement for unmodified water quality present? LQ 0 0.06 0.0000 7 35 0.06Have the abundance of any of the taxa with a low requirement for unmodified water quality been increased? LQA 0 0.07 0.0000 6 40 0.07
How does the total SASS score differ from expected?SASS 0 0.04 0.0000 8 20 0.04
How does the total ASPT score differ from expected? ASPT 1 0.17 0.1652 3 92 0.171 557
Overall change to indicators of modified water quality 13.36
INDICATORS OF WATER QUALITY
PES
met
rics
Estim
ated
in
dica
tor s
core
Wei
ght
Wei
ghte
d sc
ore
Expe
cted
N
atur
al
Ref
eren
ce
Wei
ghte
d Sc
ore
Cal
c w
eigh
t
REA
D
Ran
k
%W
eigh
t
Std
to s
um to
1
Wei
ght r
elat
ive
to 1
FLOW MODIFICATION 87.6 0.056 4.9 5.6 0.056 MTA 3 10 0.071 0.1HABITAT 88.9 0.260 23.1 26.0 0.260 CT 2 30 0.214 0.3WATER QUALITY 86.6 0.684 59.3 68.4 0.684 HQ 1 100 0.714 1
263.2 1 100 1.000 0.714Invert PES 87.3 140 1Category 52.64 B

AfriDev Consultants Pty Ltd 2005
DWAF Report No. RDM X100-01-CON-COMPR2-0604 Komati Catchment Ecological Water Requirements Study – Quantity Report
Page D - 91
Site T1: Alternative Category Down (D)
Velo
city
pr
efer
ence
sc
ores
Wei
ght
Wei
ghte
d sc
ore
Ran
k
% W
eigh
t
Std
to s
um
to 1
Presence of taxa with a preference for very fast flowing water FT 3.5 0.09 0.30 6 40 0.09
Abundance of taxa with a preference for very fast flowing water FTA 2 0.11 0.22 5 50 0.11
Presence of taxa with a preference for moderately fast flowing water MT 3 0.21 0.62 2 95 0.21
Abundance of taxa with a preference for moderately fast flowing water MTA 2 0.22 0.43 1 100 0.22
Presence of taxa with a preference for slow flowing water ST 2 0.18 0.37 4 85 0.18
Abundance of taxa with a preference for slow flowing water STA 1 0.20 0.20 3 90 0.20
Proportional change in average flow dependence of the assemblage 1 42.83 460 1
INDICATORS OF FLOW MODIFICATION
Hab
itat
pref
eren
ce
scor
es
Wei
ght
Wei
ghte
d sc
ore
Ran
k
%W
eigh
t
Std
to
sum
to 1
Has the proportion of invertebrates with a preference for bedrock changed relative to expected? BT 3 0.08 0.23 8 55 0.08
Has the abundance of any of the taxa with a preference for bedrock/boulders changed? BTA 3 0.09 0.26 7 60 0.09
Has the proportion of invertebrates with a preference for mobile cobbles changed relative to expected? CT 3 0.13 0.40 2 95 0.13
Has the abundance of any of the taxa with a preference for mobile cobbles changed? CTA 2 0.14 0.28 1 100 0.14
Has the proportion of invertebrates with a preference for vegetation changed relative to expected? VT 2 0.11 0.23 4 80 0.11
Has the abundance of any of the taxa with a preference for vegetation changed? VTA 2 0.12 0.24 3 85 0.12
Has the proportion of invertebrates with a preference for sand, gravel or mud changed relative to expected? GT 2 0.10 0.20 6 70 0.10
Have the abundance of any of the taxa with a preference for sand, gravel or mud changed relative to expected? GTA 1 0.11 0.11 5 75 0.11
Has the proportion of invertebrates with a preference for the water column or water surface changed relative to expected? WT 0 0.06 0.00 10 40 0.06
Has the abundance of any of the taxa with a preference for the water column/water surface changed? WTA 0 0.06 0.00 9 45 0.06
1 705 1.00Overall change in habitat assemblages 39.01
INDICATORS OF HABITAT PREFERENCE

AfriDev Consultants Pty Ltd 2005
DWAF Report No. RDM X100-01-CON-COMPR2-0604 Komati Catchment Ecological Water Requirements Study – Quantity Report
Page D - 92
Wat
er q
ualit
y re
quire
men
t sc
ore
Wei
ght
Wei
ghte
d sc
ore
Ran
k
%W
eigh
t
Std
to s
um
to 1
Are any taxa with a high requirement for unmodified water quality absent? HQ 3 0.17 0.5117 2 95 0.17Have the abundance of any of the taxa with a high requirement for unmodified water quality been decreased? HQA 3 0.18 0.5386 1 100 0.18Are any taxa with a moderate requirement for unmodified water quality absent? MQ 2 0.15 0.3052 5 85 0.15Have the abundance of any of the taxa with a moderate requirement for unmodified water quality been decreased? MQA 3 0.16 0.4847 4 90 0.16Are any taxa with a low requirement for unmodified water quality present? LQ 2 0.06 0.1257 7 35 0.06Have the abundance of any of the taxa with a low requirement for unmodified water quality been increased? LQA 3 0.07 0.2154 6 40 0.07
How does the total SASS score differ from expected?SASS 0 0.04 0.0000 8 20 0.04
How does the total ASPT score differ from expected? ASPT 2 0.17 0.3303 3 92 0.171 557
Overall change to indicators of modified water quality 50.23
INDICATORS OF WATER QUALITY
PES
met
rics
Estim
ated
in
dica
tor s
core
Wei
ght
Wei
ghte
d sc
ore
Expe
cted
N
atur
al
Ref
eren
ce
Wei
ghte
d Sc
ore
Cal
c w
eigh
t
REA
D
Ran
k
%W
eigh
t
Std
to s
um to
1
Wei
ght r
elat
ive
to 1
FLOW MODIFICATION 57.2 0.056 3.2 5.6 0.056 MTA 3 10 0.071 0.1HABITAT 61.0 0.260 15.8 26.0 0.260 CT 2 30 0.214 0.3WATER QUALITY 49.8 0.684 34.0 68.4 0.684 HQ 1 100 0.714 1
167.9 1 100 1.000 0.714Invert PES 53.1 140 1Category 33.59 D

AfriDev Consultants Pty Ltd 2005
DWAF Report No. RDM X100-01-CON-COMPR2-0604 Komati Catchment Ecological Water Requirements Study – Quantity Report
Page D - 93
Site G1: PES (D)
Velo
city
pr
efer
ence
sc
ores
Wei
ght
Wei
ghte
d sc
ore
Ran
k
% W
eigh
t
Std
to s
um
to 1
Presence of taxa with a preference for very fast flowing water FT 2 0.11 0.23 6 50 0.11
Abundance of taxa with a preference for very fast flowing water FTA 3 0.14 0.41 5 60 0.14
Presence of taxa with a preference for moderately fast flowing water MT 1 0.21 0.21 2 90 0.21
Abundance of taxa with a preference for moderately fast flowing water MTA 3 0.23 0.69 1 100 0.23
Presence of taxa with a preference for slow flowing water ST 2 0.15 0.30 4 65 0.15
Abundance of taxa with a preference for slow flowing water STA 3 0.16 0.48 3 70 0.16
Proportional change in average flow dependence of the assemblage 1 46.44 435 1
INDICATORS OF FLOW MODIFICATION
Hab
itat
pref
eren
ce
scor
es
Wei
ght
Wei
ghte
d sc
ore
Ran
k
%W
eigh
t
Std
to
sum
to 1
Has the proportion of invertebrates with a preference for bedrock changed relative to expected? BT 2 0.08 0.15 8 50 0.08
Has the abundance of any of the taxa with a preference for bedrock/boulders changed? BTA 3 0.08 0.25 7 55 0.08
Has the proportion of invertebrates with a preference for mobile cobbles changed relative to expected? CT 2 0.14 0.29 2 95 0.14
Has the abundance of any of the taxa with a preference for mobile cobbles changed? CTA 3 0.15 0.45 1 100 0.15
Has the proportion of invertebrates with a preference for vegetation changed relative to expected? VT 2 0.09 0.18 6 60 0.09
Has the abundance of any of the taxa with a preference for vegetation changed? VTA 3 0.11 0.32 5 70 0.11
Has the proportion of invertebrates with a preference for sand, gravel or mud changed relative to expected? GT 1 0.11 0.11 4 75 0.11
Have the abundance of any of the taxa with a preference for sand, gravel or mud changed relative to expected? GTA 3 0.12 0.36 3 80 0.12
Has the proportion of invertebrates with a preference for the water column or water surface changed relative to expected? WT 3 0.05 0.16 10 35 0.05
Has the abundance of any of the taxa with a preference for the water column/water surface changed? WTA 3 0.06 0.18 9 40 0.06
1 660 1.00Overall change in habitat assemblages 49.24
INDICATORS OF HABITAT PREFERENCE

AfriDev Consultants Pty Ltd 2005
DWAF Report No. RDM X100-01-CON-COMPR2-0604 Komati Catchment Ecological Water Requirements Study – Quantity Report
Page D - 94
Wat
er q
ualit
y re
quire
men
t sc
ore
Wei
ght
Wei
ghte
d sc
ore
Ran
k
%W
eigh
t
Std
to s
um
to 1
Are any taxa with a high requirement for unmodified water quality absent? HQ 4 0.23 0.9157 2 95 0.23Have the abundance of any of the taxa with a high requirement for unmodified water quality been decreased? HQA 3 0.24 0.7229 1 100 0.24Are any taxa with a moderate requirement for unmodified water quality absent? MQ 3 0.10 0.2892 5 40 0.10Have the abundance of any of the taxa with a moderate requirement for unmodified water quality been decreased? MQA 3 0.11 0.3253 4 45 0.11Are any taxa with a low requirement for unmodified water quality present? LQ 1 0.05 0.0482 6 20 0.05Have the abundance of any of the taxa with a low requirement for unmodified water quality been increased? LQA 3 0.04 0.1084 7 15 0.04
How does the total SASS score differ from expected?SASS 2 0.02 0.0482 8 10 0.02
How does the total ASPT score differ from expected? ASPT 2 0.22 0.4337 3 90 0.221 415
Overall change to indicators of modified water quality 57.83
INDICATORS OF WATER QUALITY
PES
met
rics
Estim
ated
in
dica
tor s
core
Wei
ght
Wei
ghte
d sc
ore
Expe
cted
N
atur
al
Ref
eren
ce
Wei
ghte
d Sc
ore
Cal
c w
eigh
t
REA
D
Ran
k
%W
eigh
t
Std
to s
um to
1
Wei
ght r
elat
ive
to 1
FLOW MODIFICATION 53.6 0.055 3.0 5.5 0.055 MTA 3 10 0.063 0.1HABITAT 50.8 0.419 21.2 41.9 0.419 CTA 2 50 0.313 0.5WATER QUALITY 42.2 0.526 22.2 52.6 0.526 HQA 1 100 0.625 1
146.5 1 100 1.000 0.625Invert PES 46.4 160 1Category 29.30 D
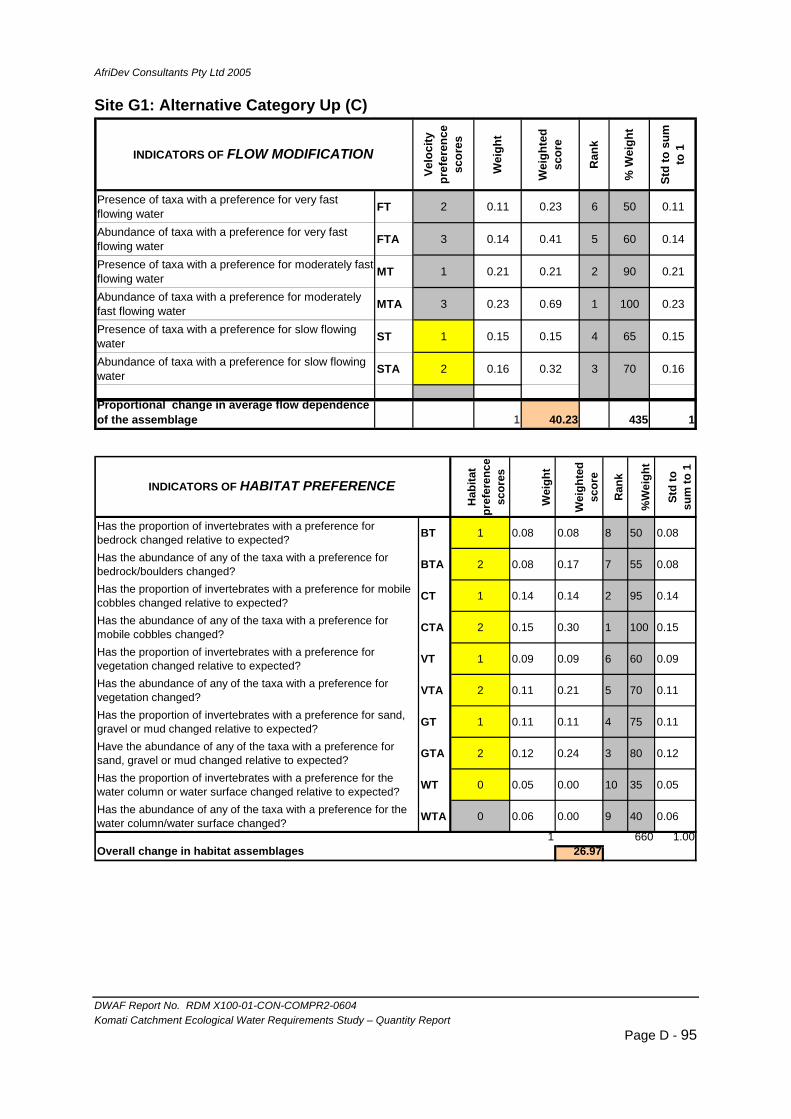
AfriDev Consultants Pty Ltd 2005
DWAF Report No. RDM X100-01-CON-COMPR2-0604 Komati Catchment Ecological Water Requirements Study – Quantity Report
Page D - 95
Site G1: Alternative Category Up (C)
Velo
city
pr
efer
ence
sc
ores
Wei
ght
Wei
ghte
d sc
ore
Ran
k
% W
eigh
t
Std
to s
um
to 1
Presence of taxa with a preference for very fast flowing water FT 2 0.11 0.23 6 50 0.11
Abundance of taxa with a preference for very fast flowing water FTA 3 0.14 0.41 5 60 0.14
Presence of taxa with a preference for moderately fast flowing water MT 1 0.21 0.21 2 90 0.21
Abundance of taxa with a preference for moderately fast flowing water MTA 3 0.23 0.69 1 100 0.23
Presence of taxa with a preference for slow flowing water ST 1 0.15 0.15 4 65 0.15
Abundance of taxa with a preference for slow flowing water STA 2 0.16 0.32 3 70 0.16
Proportional change in average flow dependence of the assemblage 1 40.23 435 1
INDICATORS OF FLOW MODIFICATION
Hab
itat
pref
eren
ce
scor
es
Wei
ght
Wei
ghte
d sc
ore
Ran
k
%W
eigh
t
Std
to
sum
to 1
Has the proportion of invertebrates with a preference for bedrock changed relative to expected? BT 1 0.08 0.08 8 50 0.08
Has the abundance of any of the taxa with a preference for bedrock/boulders changed? BTA 2 0.08 0.17 7 55 0.08
Has the proportion of invertebrates with a preference for mobile cobbles changed relative to expected? CT 1 0.14 0.14 2 95 0.14
Has the abundance of any of the taxa with a preference for mobile cobbles changed? CTA 2 0.15 0.30 1 100 0.15
Has the proportion of invertebrates with a preference for vegetation changed relative to expected? VT 1 0.09 0.09 6 60 0.09
Has the abundance of any of the taxa with a preference for vegetation changed? VTA 2 0.11 0.21 5 70 0.11
Has the proportion of invertebrates with a preference for sand, gravel or mud changed relative to expected? GT 1 0.11 0.11 4 75 0.11
Have the abundance of any of the taxa with a preference for sand, gravel or mud changed relative to expected? GTA 2 0.12 0.24 3 80 0.12
Has the proportion of invertebrates with a preference for the water column or water surface changed relative to expected? WT 0 0.05 0.00 10 35 0.05
Has the abundance of any of the taxa with a preference for the water column/water surface changed? WTA 0 0.06 0.00 9 40 0.06
1 660 1.00Overall change in habitat assemblages 26.97
INDICATORS OF HABITAT PREFERENCE

AfriDev Consultants Pty Ltd 2005
DWAF Report No. RDM X100-01-CON-COMPR2-0604 Komati Catchment Ecological Water Requirements Study – Quantity Report
Page D - 96
Wat
er q
ualit
y re
quire
men
t sc
ore
Wei
ght
Wei
ghte
d sc
ore
Ran
k
%W
eigh
t
Std
to s
um
to 1
Are any taxa with a high requirement for unmodified water quality absent? HQ 2 0.23 0.4578 2 95 0.23Have the abundance of any of the taxa with a high requirement for unmodified water quality been decreased? HQA 2 0.24 0.4819 1 100 0.24Are any taxa with a moderate requirement for unmodified water quality absent? MQ 2 0.10 0.1928 5 40 0.10Have the abundance of any of the taxa with a moderate requirement for unmodified water quality been decreased? MQA 2 0.11 0.2169 4 45 0.11Are any taxa with a low requirement for unmodified water quality present? LQ 0 0.05 0.0000 6 20 0.05Have the abundance of any of the taxa with a low requirement for unmodified water quality been increased? LQA 1 0.04 0.0361 7 15 0.04
How does the total SASS score differ from expected?SASS 2 0.02 0.0482 8 10 0.02
How does the total ASPT score differ from expected? ASPT 2 0.22 0.4337 3 90 0.221 415
Overall change to indicators of modified water quality 37.35
INDICATORS OF WATER QUALITY
PES
met
rics
Estim
ated
in
dica
tor s
core
Wei
ght
Wei
ghte
d sc
ore
Expe
cted
N
atur
al
Ref
eren
ce
Wei
ghte
d Sc
ore
Cal
c w
eigh
t
REA
D
Ran
k
%W
eigh
t
Std
to s
um to
1
Wei
ght r
elat
ive
to 1
FLOW MODIFICATION 59.8 0.055 3.3 5.5 0.055 MTA 3 10 0.063 0.1HABITAT 73.0 0.419 30.6 41.9 0.419 CTA 2 50 0.313 0.5WATER QUALITY 62.7 0.526 33.0 52.6 0.526 HQA 1 100 0.625 1
195.5 1 100 1.000 0.625Invert PES 66.8 160 1Category 39.09 C
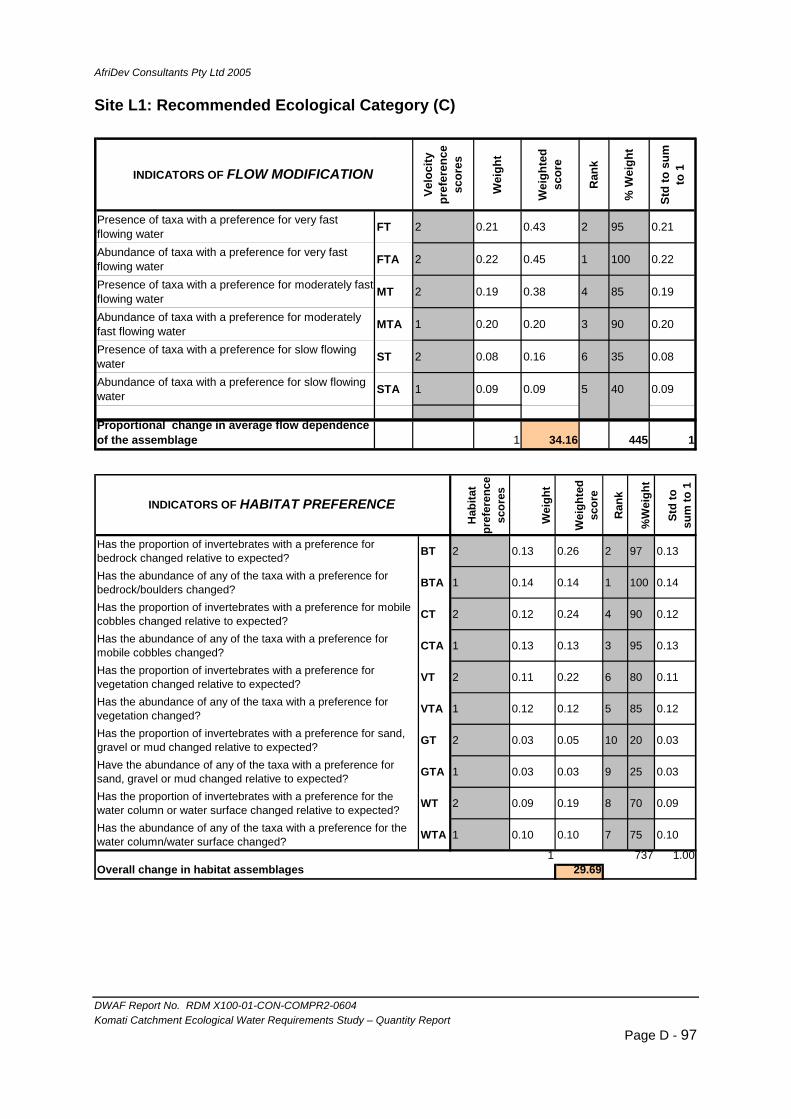
AfriDev Consultants Pty Ltd 2005
DWAF Report No. RDM X100-01-CON-COMPR2-0604 Komati Catchment Ecological Water Requirements Study – Quantity Report
Page D - 97
Site L1: Recommended Ecological Category (C)
Velo
city
pr
efer
ence
sc
ores
Wei
ght
Wei
ghte
d sc
ore
Ran
k
% W
eigh
t
Std
to s
um
to 1
Presence of taxa with a preference for very fast flowing water FT 2 0.21 0.43 2 95 0.21
Abundance of taxa with a preference for very fast flowing water FTA 2 0.22 0.45 1 100 0.22
Presence of taxa with a preference for moderately fast flowing water MT 2 0.19 0.38 4 85 0.19
Abundance of taxa with a preference for moderately fast flowing water MTA 1 0.20 0.20 3 90 0.20
Presence of taxa with a preference for slow flowing water ST 2 0.08 0.16 6 35 0.08
Abundance of taxa with a preference for slow flowing water STA 1 0.09 0.09 5 40 0.09
Proportional change in average flow dependence of the assemblage 1 34.16 445 1
INDICATORS OF FLOW MODIFICATION
Hab
itat
pref
eren
ce
scor
es
Wei
ght
Wei
ghte
d sc
ore
Ran
k
%W
eigh
t
Std
to
sum
to 1
Has the proportion of invertebrates with a preference for bedrock changed relative to expected? BT 2 0.13 0.26 2 97 0.13
Has the abundance of any of the taxa with a preference for bedrock/boulders changed? BTA 1 0.14 0.14 1 100 0.14
Has the proportion of invertebrates with a preference for mobile cobbles changed relative to expected? CT 2 0.12 0.24 4 90 0.12
Has the abundance of any of the taxa with a preference for mobile cobbles changed? CTA 1 0.13 0.13 3 95 0.13
Has the proportion of invertebrates with a preference for vegetation changed relative to expected? VT 2 0.11 0.22 6 80 0.11
Has the abundance of any of the taxa with a preference for vegetation changed? VTA 1 0.12 0.12 5 85 0.12
Has the proportion of invertebrates with a preference for sand, gravel or mud changed relative to expected? GT 2 0.03 0.05 10 20 0.03
Have the abundance of any of the taxa with a preference for sand, gravel or mud changed relative to expected? GTA 1 0.03 0.03 9 25 0.03
Has the proportion of invertebrates with a preference for the water column or water surface changed relative to expected? WT 2 0.09 0.19 8 70 0.09
Has the abundance of any of the taxa with a preference for the water column/water surface changed? WTA 1 0.10 0.10 7 75 0.10
1 737 1.00Overall change in habitat assemblages 29.69
INDICATORS OF HABITAT PREFERENCE

AfriDev Consultants Pty Ltd 2005
DWAF Report No. RDM X100-01-CON-COMPR2-0604 Komati Catchment Ecological Water Requirements Study – Quantity Report
Page D - 98
Wat
er q
ualit
y re
quire
men
t sc
ore
Wei
ght
Wei
ghte
d sc
ore
Ran
k
%W
eigh
t
Std
to s
um
to 1
Are any taxa with a high requirement for unmodified water quality absent? HQ 3 0.15 0.4615 5 80 0.15Have the abundance of any of the taxa with a high requirement for unmodified water quality been decreased? HQA 1 0.16 0.1635 4 85 0.16Are any taxa with a moderate requirement for unmodified water quality absent? MQ 3 0.18 0.5481 2 95 0.18Have the abundance of any of the taxa with a moderate requirement for unmodified water quality been decreased? MQA 1 0.19 0.1923 1 100 0.19Are any taxa with a low requirement for unmodified water quality present? LQ 2 0.05 0.0962 7 25 0.05Have the abundance of any of the taxa with a low requirement for unmodified water quality been increased? LQA 1 0.06 0.0577 6 30 0.06
How does the total SASS score differ from expected?SASS 2 0.03 0.0577 8 15 0.03
How does the total ASPT score differ from expected? ASPT 1 0.17 0.1731 3 90 0.171 520
Overall change to indicators of modified water quality 35.00
INDICATORS OF WATER QUALITY
PES
met
rics
Estim
ated
in
dica
tor s
core
Wei
ght
Wei
ghte
d sc
ore
Expe
cted
N
atur
al
Ref
eren
ce
Wei
ghte
d Sc
ore
Cal
c w
eigh
t
REA
D
Ran
k
%W
eigh
t
Std
to s
um to
1
Wei
ght r
elat
ive
to 1
FLOW MODIFICATION 65.8 0.341 22.5 34.1 0.341 FTA 1 100 0.417 1HABITAT 70.3 0.339 23.9 33.9 0.339 BTA 3 60 0.250 0.6WATER QUALITY 65.0 0.319 20.7 31.9 0.319 MQA 2 80 0.333 0.8
201.2 1 100 1.000 0.417Invert PES 67.1 240 1Category 40.23 C
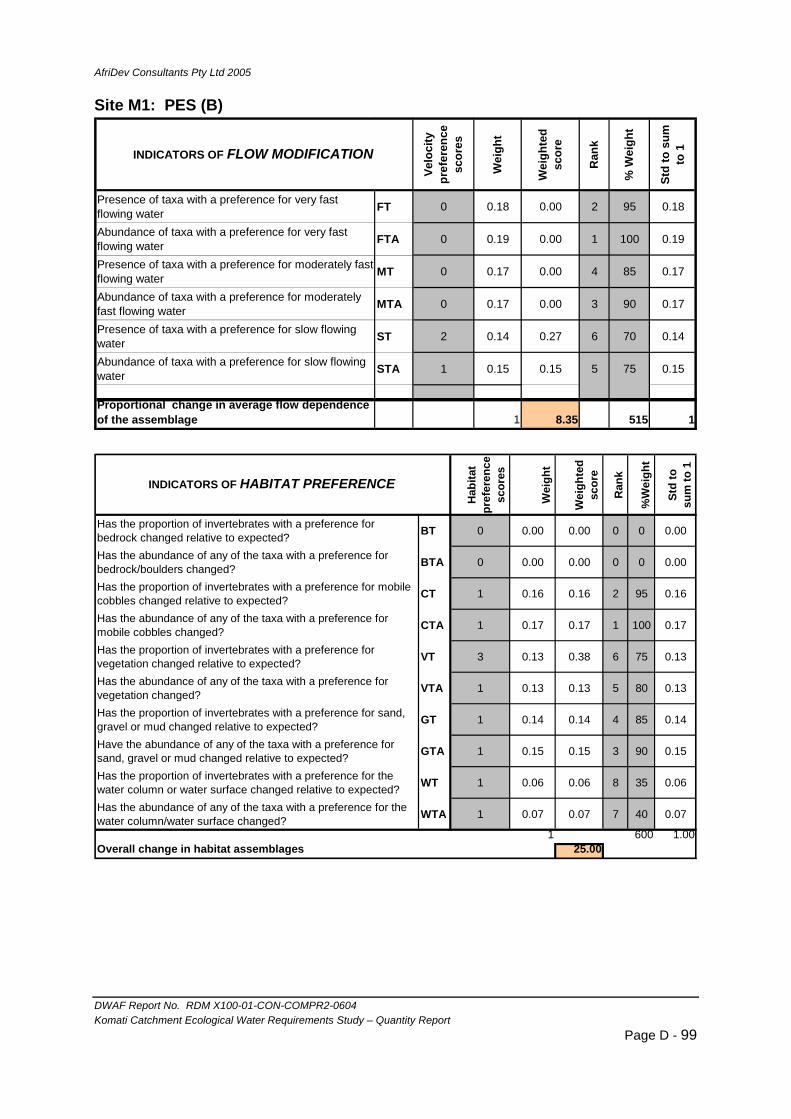
AfriDev Consultants Pty Ltd 2005
DWAF Report No. RDM X100-01-CON-COMPR2-0604 Komati Catchment Ecological Water Requirements Study – Quantity Report
Page D - 99
Site M1: PES (B)
Velo
city
pr
efer
ence
sc
ores
Wei
ght
Wei
ghte
d sc
ore
Ran
k
% W
eigh
t
Std
to s
um
to 1
Presence of taxa with a preference for very fast flowing water FT 0 0.18 0.00 2 95 0.18
Abundance of taxa with a preference for very fast flowing water FTA 0 0.19 0.00 1 100 0.19
Presence of taxa with a preference for moderately fast flowing water MT 0 0.17 0.00 4 85 0.17
Abundance of taxa with a preference for moderately fast flowing water MTA 0 0.17 0.00 3 90 0.17
Presence of taxa with a preference for slow flowing water ST 2 0.14 0.27 6 70 0.14
Abundance of taxa with a preference for slow flowing water STA 1 0.15 0.15 5 75 0.15
Proportional change in average flow dependence of the assemblage 1 8.35 515 1
INDICATORS OF FLOW MODIFICATION
Hab
itat
pref
eren
ce
scor
es
Wei
ght
Wei
ghte
d sc
ore
Ran
k
%W
eigh
t
Std
to
sum
to 1
Has the proportion of invertebrates with a preference for bedrock changed relative to expected? BT 0 0.00 0.00 0 0 0.00
Has the abundance of any of the taxa with a preference for bedrock/boulders changed? BTA 0 0.00 0.00 0 0 0.00
Has the proportion of invertebrates with a preference for mobile cobbles changed relative to expected? CT 1 0.16 0.16 2 95 0.16
Has the abundance of any of the taxa with a preference for mobile cobbles changed? CTA 1 0.17 0.17 1 100 0.17
Has the proportion of invertebrates with a preference for vegetation changed relative to expected? VT 3 0.13 0.38 6 75 0.13
Has the abundance of any of the taxa with a preference for vegetation changed? VTA 1 0.13 0.13 5 80 0.13
Has the proportion of invertebrates with a preference for sand, gravel or mud changed relative to expected? GT 1 0.14 0.14 4 85 0.14
Have the abundance of any of the taxa with a preference for sand, gravel or mud changed relative to expected? GTA 1 0.15 0.15 3 90 0.15
Has the proportion of invertebrates with a preference for the water column or water surface changed relative to expected? WT 1 0.06 0.06 8 35 0.06
Has the abundance of any of the taxa with a preference for the water column/water surface changed? WTA 1 0.07 0.07 7 40 0.07
1 600 1.00Overall change in habitat assemblages 25.00
INDICATORS OF HABITAT PREFERENCE

AfriDev Consultants Pty Ltd 2005
DWAF Report No. RDM X100-01-CON-COMPR2-0604 Komati Catchment Ecological Water Requirements Study – Quantity Report
Page D - 100
Wat
er q
ualit
y re
quire
men
t sc
ore
Wei
ght
Wei
ghte
d sc
ore
Ran
k
%W
eigh
t
Std
to s
um
to 1
Are any taxa with a high requirement for unmodified water quality absent? HQ 2 0.18 0.3519 2 95 0.18Have the abundance of any of the taxa with a high requirement for unmodified water quality been decreased? HQA 1 0.19 0.1852 1 100 0.19Are any taxa with a moderate requirement for unmodified water quality absent? MQ 1 0.16 0.1574 4 85 0.16Have the abundance of any of the taxa with a moderate requirement for unmodified water quality been decreased? MQA 1 0.17 0.1667 3 90 0.17Are any taxa with a low requirement for unmodified water quality present? LQ 0 0.05 0.0000 8 25 0.05Have the abundance of any of the taxa with a low requirement for unmodified water quality been increased? LQA 0 0.06 0.0000 7 30 0.06
How does the total SASS score differ from expected?SASS 1 0.11 0.1111 5 60 0.11
How does the total ASPT score differ from expected? ASPT 1 0.10 0.1019 6 55 0.101 540
Overall change to indicators of modified water quality 21.48
INDICATORS OF WATER QUALITY
PES
met
rics
Estim
ated
in
dica
tor s
core
Wei
ght
Wei
ghte
d sc
ore
Expe
cted
N
atur
al
Ref
eren
ce
Wei
ghte
d Sc
ore
Cal
c w
eigh
t
REA
D
Ran
k
%W
eigh
t
Std
to s
um to
1
Wei
ght r
elat
ive
to 1
FLOW MODIFICATION 91.7 0.394 36.1 39.4 0.394 MTA 1 100 0.417 1HABITAT 75.0 0.275 20.7 27.5 0.275 CTA 3 60 0.250 0.6WATER QUALITY 78.5 0.331 26.0 33.1 0.331 HQA 2 80 0.333 0.8
245.2 1 100 1.000 0.417Invert PES 82.7 240 1Category 49.03 B
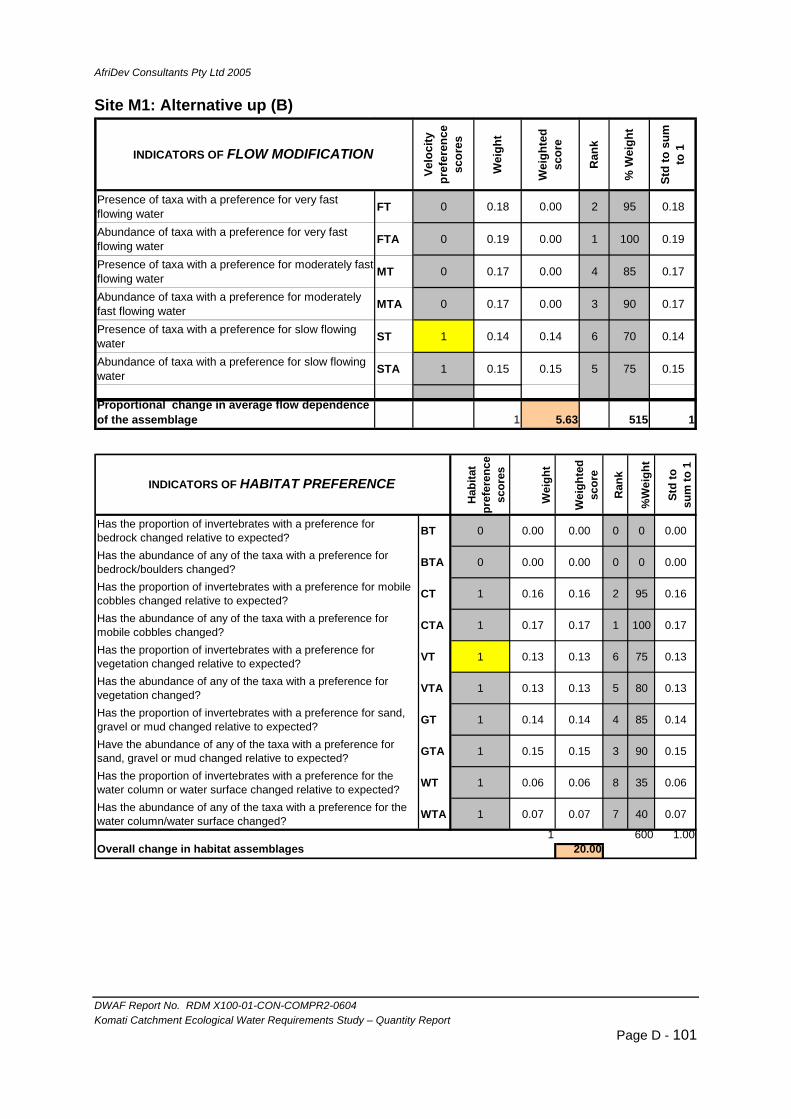
AfriDev Consultants Pty Ltd 2005
DWAF Report No. RDM X100-01-CON-COMPR2-0604 Komati Catchment Ecological Water Requirements Study – Quantity Report
Page D - 101
Site M1: Alternative up (B)
Velo
city
pr
efer
ence
sc
ores
Wei
ght
Wei
ghte
d sc
ore
Ran
k
% W
eigh
t
Std
to s
um
to 1
Presence of taxa with a preference for very fast flowing water FT 0 0.18 0.00 2 95 0.18
Abundance of taxa with a preference for very fast flowing water FTA 0 0.19 0.00 1 100 0.19
Presence of taxa with a preference for moderately fast flowing water MT 0 0.17 0.00 4 85 0.17
Abundance of taxa with a preference for moderately fast flowing water MTA 0 0.17 0.00 3 90 0.17
Presence of taxa with a preference for slow flowing water ST 1 0.14 0.14 6 70 0.14
Abundance of taxa with a preference for slow flowing water STA 1 0.15 0.15 5 75 0.15
Proportional change in average flow dependence of the assemblage 1 5.63 515 1
INDICATORS OF FLOW MODIFICATION
Hab
itat
pref
eren
ce
scor
es
Wei
ght
Wei
ghte
d sc
ore
Ran
k
%W
eigh
t
Std
to
sum
to 1
Has the proportion of invertebrates with a preference for bedrock changed relative to expected? BT 0 0.00 0.00 0 0 0.00
Has the abundance of any of the taxa with a preference for bedrock/boulders changed? BTA 0 0.00 0.00 0 0 0.00
Has the proportion of invertebrates with a preference for mobile cobbles changed relative to expected? CT 1 0.16 0.16 2 95 0.16
Has the abundance of any of the taxa with a preference for mobile cobbles changed? CTA 1 0.17 0.17 1 100 0.17
Has the proportion of invertebrates with a preference for vegetation changed relative to expected? VT 1 0.13 0.13 6 75 0.13
Has the abundance of any of the taxa with a preference for vegetation changed? VTA 1 0.13 0.13 5 80 0.13
Has the proportion of invertebrates with a preference for sand, gravel or mud changed relative to expected? GT 1 0.14 0.14 4 85 0.14
Have the abundance of any of the taxa with a preference for sand, gravel or mud changed relative to expected? GTA 1 0.15 0.15 3 90 0.15
Has the proportion of invertebrates with a preference for the water column or water surface changed relative to expected? WT 1 0.06 0.06 8 35 0.06
Has the abundance of any of the taxa with a preference for the water column/water surface changed? WTA 1 0.07 0.07 7 40 0.07
1 600 1.00Overall change in habitat assemblages 20.00
INDICATORS OF HABITAT PREFERENCE
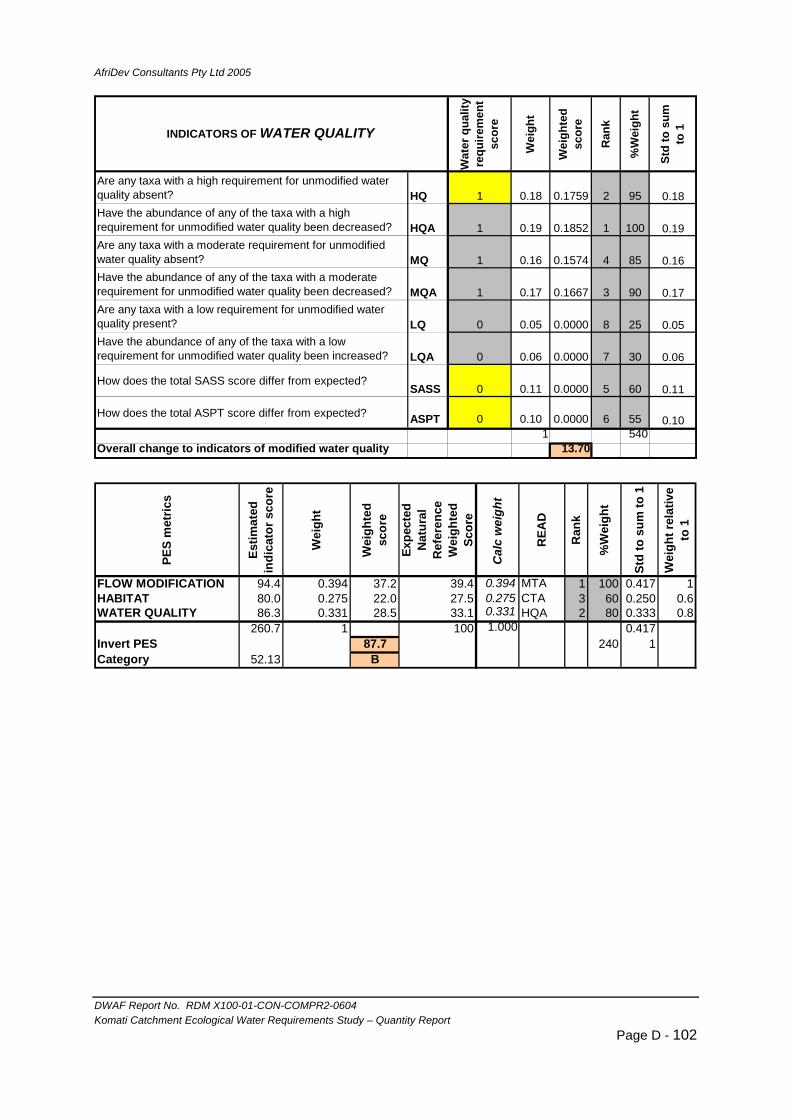
AfriDev Consultants Pty Ltd 2005
DWAF Report No. RDM X100-01-CON-COMPR2-0604 Komati Catchment Ecological Water Requirements Study – Quantity Report
Page D - 102
Wat
er q
ualit
y re
quire
men
t sc
ore
Wei
ght
Wei
ghte
d sc
ore
Ran
k
%W
eigh
t
Std
to s
um
to 1
Are any taxa with a high requirement for unmodified water quality absent? HQ 1 0.18 0.1759 2 95 0.18Have the abundance of any of the taxa with a high requirement for unmodified water quality been decreased? HQA 1 0.19 0.1852 1 100 0.19Are any taxa with a moderate requirement for unmodified water quality absent? MQ 1 0.16 0.1574 4 85 0.16Have the abundance of any of the taxa with a moderate requirement for unmodified water quality been decreased? MQA 1 0.17 0.1667 3 90 0.17Are any taxa with a low requirement for unmodified water quality present? LQ 0 0.05 0.0000 8 25 0.05Have the abundance of any of the taxa with a low requirement for unmodified water quality been increased? LQA 0 0.06 0.0000 7 30 0.06
How does the total SASS score differ from expected?SASS 0 0.11 0.0000 5 60 0.11
How does the total ASPT score differ from expected? ASPT 0 0.10 0.0000 6 55 0.101 540
Overall change to indicators of modified water quality 13.70
INDICATORS OF WATER QUALITY
PES
met
rics
Estim
ated
in
dica
tor s
core
Wei
ght
Wei
ghte
d sc
ore
Expe
cted
N
atur
al
Ref
eren
ce
Wei
ghte
d Sc
ore
Cal
c w
eigh
t
REA
D
Ran
k
%W
eigh
t
Std
to s
um to
1
Wei
ght r
elat
ive
to 1
FLOW MODIFICATION 94.4 0.394 37.2 39.4 0.394 MTA 1 100 0.417 1HABITAT 80.0 0.275 22.0 27.5 0.275 CTA 3 60 0.250 0.6WATER QUALITY 86.3 0.331 28.5 33.1 0.331 HQA 2 80 0.333 0.8
260.7 1 100 1.000 0.417Invert PES 87.7 240 1Category 52.13 B

AfriDev Consultants Pty Ltd 2005
DWAF Report No. RDM X100-01-CON-COMPR2-0604 Komati Catchment Ecological Water Requirements Study – Quantity Report
Page D - 103
Site M1: Alternative down (C)
Velo
city
pr
efer
ence
sc
ores
Wei
ght
Wei
ghte
d sc
ore
Ran
k
% W
eigh
t
Std
to s
um
to 1
Presence of taxa with a preference for very fast flowing water FT 2 0.18 0.37 2 95 0.18
Abundance of taxa with a preference for very fast flowing water FTA 2 0.19 0.39 1 100 0.19
Presence of taxa with a preference for moderately fast flowing water MT 1 0.17 0.17 4 85 0.17
Abundance of taxa with a preference for moderately fast flowing water MTA 1 0.17 0.17 3 90 0.17
Presence of taxa with a preference for slow flowing water ST 2 0.14 0.27 6 70 0.14
Abundance of taxa with a preference for slow flowing water STA 1 0.15 0.15 5 75 0.15
Proportional change in average flow dependence of the assemblage 1 30.29 515 1
INDICATORS OF FLOW MODIFICATION
Hab
itat
pref
eren
ce
scor
es
Wei
ght
Wei
ghte
d sc
ore
Ran
k
%W
eigh
t
Std
to
sum
to 1
Has the proportion of invertebrates with a preference for bedrock changed relative to expected? BT 0 0.00 0.00 0 0 0.00
Has the abundance of any of the taxa with a preference for bedrock/boulders changed? BTA 0 0.00 0.00 0 0 0.00
Has the proportion of invertebrates with a preference for mobile cobbles changed relative to expected? CT 2 0.16 0.32 2 95 0.16
Has the abundance of any of the taxa with a preference for mobile cobbles changed? CTA 2 0.17 0.33 1 100 0.17
Has the proportion of invertebrates with a preference for vegetation changed relative to expected? VT 3 0.13 0.38 6 75 0.13
Has the abundance of any of the taxa with a preference for vegetation changed? VTA 2 0.13 0.27 5 80 0.13
Has the proportion of invertebrates with a preference for sand, gravel or mud changed relative to expected? GT 2 0.14 0.28 4 85 0.14
Have the abundance of any of the taxa with a preference for sand, gravel or mud changed relative to expected? GTA 2 0.15 0.30 3 90 0.15
Has the proportion of invertebrates with a preference for the water column or water surface changed relative to expected? WT 1 0.06 0.06 8 35 0.06
Has the abundance of any of the taxa with a preference for the water column/water surface changed? WTA 2 0.07 0.13 7 40 0.07
1 600 1.00Overall change in habitat assemblages 41.33
INDICATORS OF HABITAT PREFERENCE

AfriDev Consultants Pty Ltd 2005
DWAF Report No. RDM X100-01-CON-COMPR2-0604 Komati Catchment Ecological Water Requirements Study – Quantity Report
Page D - 104
Wat
er q
ualit
y re
quire
men
t sc
ore
Wei
ght
Wei
ghte
d sc
ore
Ran
k
%W
eigh
t
Std
to s
um
to 1
Are any taxa with a high requirement for unmodified water quality absent? HQ 3 0.18 0.5278 2 95 0.18Have the abundance of any of the taxa with a high requirement for unmodified water quality been decreased? HQA 2 0.19 0.3704 1 100 0.19Are any taxa with a moderate requirement for unmodified water quality absent? MQ 1 0.16 0.1574 4 85 0.16Have the abundance of any of the taxa with a moderate requirement for unmodified water quality been decreased? MQA 1 0.17 0.1667 3 90 0.17Are any taxa with a low requirement for unmodified water quality present? LQ 0 0.05 0.0000 8 25 0.05Have the abundance of any of the taxa with a low requirement for unmodified water quality been increased? LQA 0 0.06 0.0000 7 30 0.06
How does the total SASS score differ from expected?SASS 2 0.11 0.2222 5 60 0.11
How does the total ASPT score differ from expected? ASPT 2 0.10 0.2037 6 55 0.101 540
Overall change to indicators of modified water quality 32.96
INDICATORS OF WATER QUALITY
PES
met
rics
Estim
ated
in
dica
tor s
core
Wei
ght
Wei
ghte
d sc
ore
Expe
cted
N
atur
al
Ref
eren
ce
Wei
ghte
d Sc
ore
Cal
c w
eigh
t
REA
D
Ran
k
%W
eigh
t
Std
to s
um to
1
Wei
ght r
elat
ive
to 1
FLOW MODIFICATION 69.7 0.394 27.5 39.4 0.394 MTA 1 100 0.417 1HABITAT 58.7 0.275 16.2 27.5 0.275 CTA 3 60 0.250 0.6WATER QUALITY 67.0 0.331 22.2 33.1 0.331 HQA 2 80 0.333 0.8
195.4 1 100 1.000 0.417Invert PES 65.8 240 1Category 39.08 C
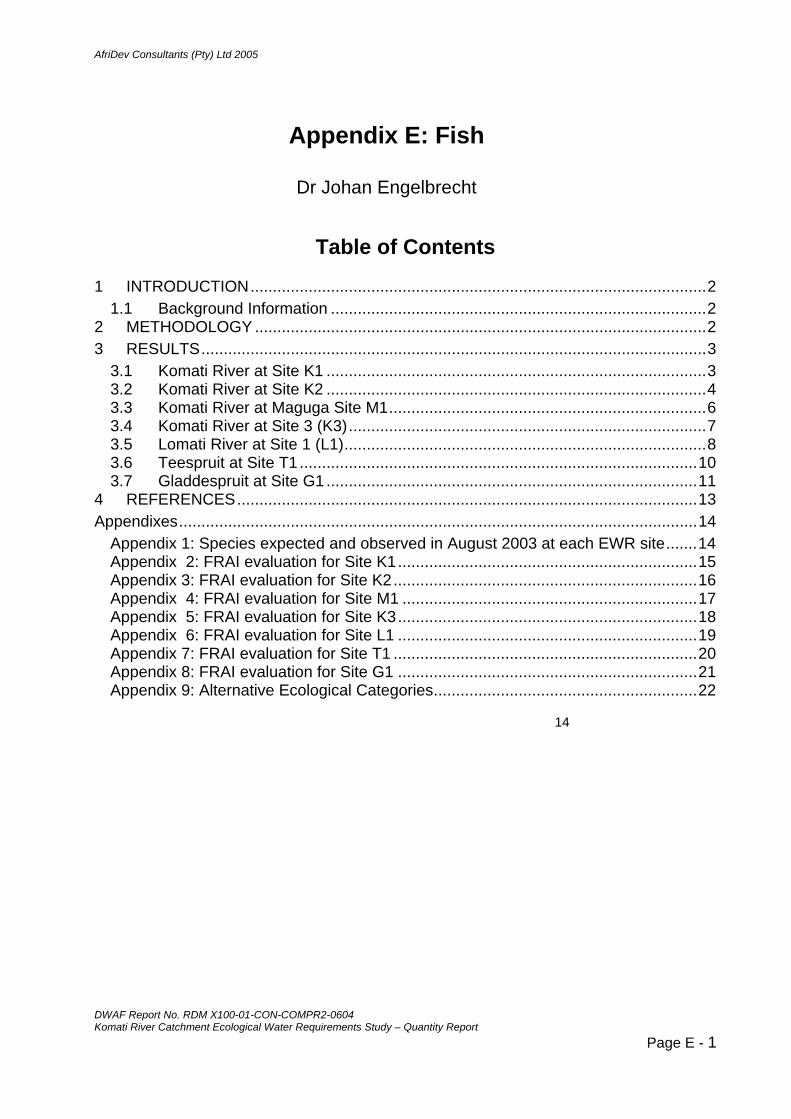
AfriDev Consultants (Pty) Ltd 2005
DWAF Report No. RDM X100-01-CON-COMPR2-0604 Komati River Catchment Ecological Water Requirements Study – Quantity Report
Page E - 1
Appendix E: Fish
Dr Johan Engelbrecht
Table of Contents 1 INTRODUCTION......................................................................................................2
1.1 Background Information ....................................................................................2 2 METHODOLOGY .....................................................................................................2 3 RESULTS.................................................................................................................3
3.1 Komati River at Site K1 .....................................................................................3 3.2 Komati River at Site K2 .....................................................................................4 3.3 Komati River at Maguga Site M1.......................................................................6 3.4 Komati River at Site 3 (K3)................................................................................7 3.5 Lomati River at Site 1 (L1).................................................................................8 3.6 Teespruit at Site T1.........................................................................................10 3.7 Gladdespruit at Site G1 ...................................................................................11
4 REFERENCES.......................................................................................................13 Appendixes....................................................................................................................14
Appendix 1: Species expected and observed in August 2003 at each EWR site.......14 Appendix 2: FRAI evaluation for Site K1...................................................................15 Appendix 3: FRAI evaluation for Site K2....................................................................16 Appendix 4: FRAI evaluation for Site M1 ..................................................................17 Appendix 5: FRAI evaluation for Site K3...................................................................18 Appendix 6: FRAI evaluation for Site L1 ...................................................................19 Appendix 7: FRAI evaluation for Site T1 ....................................................................20 Appendix 8: FRAI evaluation for Site G1 ...................................................................21 Appendix 9: Alternative Ecological Categories...........................................................22
14

AfriDev Consultants (Pty) Ltd 2005
DWAF Report No. RDM X100-01-CON-COMPR2-0604 Komati River Catchment Ecological Water Requirements Study – Quantity Report
Page E - 2
PRESENT ECOLOGICAL STATUS OF THE FISH ASSEMBLAGE IN THE KOMATI RIVER AT EWR SITES. 1 INTRODUCTION The purpose of this report is to provide information for the estimation of the ecological reserve on the comprehensive determination level. The report contains data relevant to the presenct habitat requirements of fish species in the Komati River and selected tributaries. An assessment of the biological integrity of a river is often based on indices that make use of attributes of fish assemblages, such as diversity of species and abundance. This kind of assessment, in combination with the assessment of other groups of biota, contributes to an understanding of the current ecological state of the river. It also aids formulation of an attainable desired ecological state or Ecological Management Category. 1.1 BACKGROUND INFORMATION The reference and modified reference condition of the freshwater fish assemblage in the Komati and Lomati Rivers is mainly based on available background information (Crass, 1964; Clay, 1976; Engelbrecht, 1998; Gaigher, 1969; Gaigher & Pott, 1973; Gibb, et al., 1993; Hyslop, 1994; Jubb, 1967; Kleynhans, 1983 & 1985; Schulz, 1994 and Skelton, 1993), as well as the Mpumalanga Parks Board fish data base and recent River Health Programme surveys. 2 METHODOLOGY Fish were collected during a site visit at the selected sites with electro-narcosis (AC shocking apparatus) and a small seine net (fine mesh) in August 2003. No suitable sites were available for the use of larger net types. All the collected specimens were identified and voucher specimens of some of the species collected were lodged with J. L. B. Smith Institute for Ichthyology for verification and future reference. The presence, absence or abundance of species was compared to the expected reference condition based on available data. Using a rule based model recently developed by DWAF (Fish Response Assessment Index (FRAI)), changes from the reference condition were evaluated against the known response of the fish assemblage to changes in available habitat categories within parameters such as flow depth, water quality, flow conditions and available cover. Changes were scored according to Table 1 to determine the “Present Ecological State” of the fish assemblage (Appendix 1).
Table 1: Generic guidelines for scoring changes according to preferences of fish for available habitat
-5=Extreme loss from reference (absent)
-4=Serious loss from reference
-3=Large loss from reference
-2=Moderate loss from reference
-1= Small loss from reference
0=No change from reference
1= Small increase from reference
2=Moderate increase from reference
3=Large increase from reference
4=Serious increase from reference
5=Extreme increase from reference (completely dominant)

AfriDev Consultants (Pty) Ltd 2005
DWAF Report No. RDM X100-01-CON-COMPR2-0604 Komati River Catchment Ecological Water Requirements Study – Quantity Report
Page E - 3
3 RESULTS 3.1 KOMATI RIVER AT SITE K1 Under present conditions eleven species are expected to occur in the area of which ten were recently collected (Appendix 1). The abundances of some sensitive species were low or absent towards Nooitgedact Dam. Abundances of most other species were lower than expected. The FRAI for this site was evaluated as follow (Appendix 2): Flow depth classes
• The fish fauna dependant on fast deep habitats was significantly lower in abundance downstream of Nooitgedact Dam (Chiloglanis emarginatus and Barbus argenteus absent here), but there was a steady improvement in conditions downstream towards Gembsbokhoek Weir where they occurred in low abundance. This fish downstream of this weir was also significantly lower in abundance.
• Species preferring slow flowing habitats with undercut banks and marginal vegetated areas (Barbus anoplus, Tilapia sparrmanii and Pseudocrenilabrus philander) were lower than expected.
Flow Modification
• The absence or low abundance of Anguilla mossambica in this resource unit is related to the presence of large impoundments downstream preventing recolonization of catadromous species (migrates to sea to breed).
• Migration of fish has also been effected by weirs and dams and restricted between two large impoundments.
• Flow dependant and moderately flow dependants lower in abundance than expected. Available Cover
• The fish fauna dependant on substrate in fast deep habitats was significantly lower in abundance downstream of Nooitgedact Dam (Chiloglanis emarginatus and Barbus argenteus absent) but there was a steady improvement in conditions downstream towards Gembsbokhoek Weir.
• Abundance of species preferring fast flowing habitats as well as species preferring undercut banks and marginal vegetated areas (Barbus anoplus, Tilapia sparrmanii and Pseudocrenilabrus philander) were lower than expected.
Water Quality
• Species effected above is also sensitive and moderately sensitive to changes. PES The FRAI rates this site as C/B. A category B for fish will be achieved with an increase in base flow that will provide more habitats for flow dependant and moderately flow dependant species. This will also increase the abundance of available habitat for species dependant on fast deep and fast shallow conditions. It will also provide more permanent habit for species dependant on the availability of marginal vegetation and undercut banks. A Category D for fish will be present in this reach if there is a decrease in low flows.

AfriDev Consultants (Pty) Ltd 2005
DWAF Report No. RDM X100-01-CON-COMPR2-0604 Komati River Catchment Ecological Water Requirements Study – Quantity Report
Page E - 4
Flow depth classes • This will reduce the abundance of species dependant on fast deep and fast shallow
habitats. Flow modifications
• The species dependant or moderately dependant on perennial flow will be mostly affected as the suitability of this habitat will be reduced for some species.
Cover
• The species most affected will be those that are dependant on substrate and marginal vegetation/undercut banks. The availability of this cover will decrease. This will also reduce the suitability of available fast deep habitat and may affect the available breeding habitat of yellowfish.
Water Quality
• Increase in temperatures in dominating SS and nutrients due to reduced flows will decrease the abundance of species intolerant and moderately intolerant of water quality changes.
Overall Reduced flows can result in a loss of at least 2 species (Chiloglanis emarginatus and Barbus argenteus). It is also likely that Amphilius uranoscopus may be largely affected. This will also lead to a decrease in the abundance of several other species. 3.2 KOMATI RIVER AT SITE K2 Sixteen species are expected to occur in the area of which 14 were recently collected in the general area (Appendix 1). The FRAI was evaluated as follows (Appendix 3): Flow depth classes
• The fish fauna dependant on fast deep habitats were low in abundance (Chiloglanis emarginatus and Barbus argenteus)
• Species preferring slow flowing habitats with undercut banks and marginal vegetated areas (Barbus anoplus, Tilapia sparrmanii and Pseudocrenilabrus philander) were lower in abundance than expected.
Flow Modifications
• The low abundance of Anguilla mossambica and A. bengalensis in this resource unit are related to the presence of large impoundments and a number of downstream weirs preventing recolonization of catadromous species (migrates to sea to breed).
• Migration of fish have also been effected by weirs and dams (three of them redundant and can be removed) and may re-establish movement between Maguga and Vygeboom Dams. A single Barbus polylepis was recorded only once in this resource unit related to the recent obstruction caused by upstream impoundment (Vygeboom Dam).
• Flow dependant and moderately flow dependants lower in abundance than expected. Available Cover
• The fish fauna dependant on substrate in fast deep habitats were significantly lower in abundance than expected
• Species preferring fast flowing habitats as well as species preferring undercut banks and marginal vegetated areas (Barbus anoplus, Tilapia sparrmanii and Pseudocrenilabrus philander) were lower than expected.
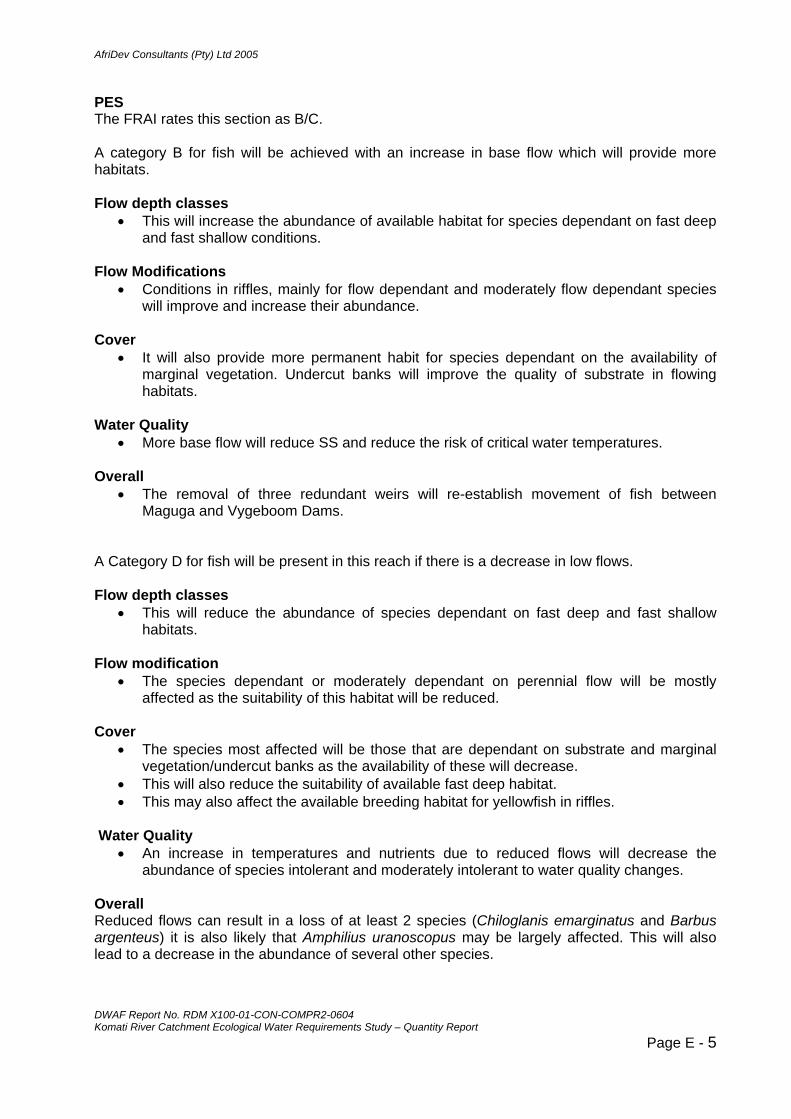
AfriDev Consultants (Pty) Ltd 2005
DWAF Report No. RDM X100-01-CON-COMPR2-0604 Komati River Catchment Ecological Water Requirements Study – Quantity Report
Page E - 5
PES The FRAI rates this section as B/C. A category B for fish will be achieved with an increase in base flow which will provide more habitats. Flow depth classes
• This will increase the abundance of available habitat for species dependant on fast deep and fast shallow conditions.
Flow Modifications
• Conditions in riffles, mainly for flow dependant and moderately flow dependant species will improve and increase their abundance.
Cover
• It will also provide more permanent habit for species dependant on the availability of marginal vegetation. Undercut banks will improve the quality of substrate in flowing habitats.
Water Quality
• More base flow will reduce SS and reduce the risk of critical water temperatures. Overall
• The removal of three redundant weirs will re-establish movement of fish between Maguga and Vygeboom Dams.
A Category D for fish will be present in this reach if there is a decrease in low flows. Flow depth classes
• This will reduce the abundance of species dependant on fast deep and fast shallow habitats.
Flow modification
• The species dependant or moderately dependant on perennial flow will be mostly affected as the suitability of this habitat will be reduced.
Cover
• The species most affected will be those that are dependant on substrate and marginal vegetation/undercut banks as the availability of these will decrease.
• This will also reduce the suitability of available fast deep habitat. • This may also affect the available breeding habitat for yellowfish in riffles.
Water Quality • An increase in temperatures and nutrients due to reduced flows will decrease the
abundance of species intolerant and moderately intolerant to water quality changes. Overall Reduced flows can result in a loss of at least 2 species (Chiloglanis emarginatus and Barbus argenteus) it is also likely that Amphilius uranoscopus may be largely affected. This will also lead to a decrease in the abundance of several other species.
AfriDev Consultants (Pty) Ltd 2005
DWAF Report No. RDM X100-01-CON-COMPR2-0604 Komati River Catchment Ecological Water Requirements Study – Quantity Report
Page E - 6
3.3 KOMATI RIVER AT MAGUGA SITE M1 The available background information indicates that this site contained about 24 both temperate and tropical species (Appendix 1) of which 21 have recently been observed. The FRAI was evaluated as follows (Appendix 4): Flow depth classes
• Although most species are still present the abundance and frequency of occurrence of all categories are negatively affected.
Flow Modifications
• Flow dependant and moderately flow dependants abundance lower than expected. The abundant species which were dependent on habitats with permanent flow during all life phases (rheophilic) such as Barbus eutaenia, Opsaridium peringueyi, Chiloglanis pretoriae and C. swierstrai lower than during pre-Maguga surveys. Most other categories also lower than expected.
• Migrations of fish have also been effected by downstream weirs and dams. The abundance and frequency of occurrence of migratory species such as Labeo molybdinus, L. cylindricus and some of the small barb species (Barbus sp.) previously collected at this site have been affected.
Available Cover
• The abundance of fish fauna dependant on substrate in fast habitats are lower than expected. All other categories have also been affected.
• Abundance of species preferring fast flowing habitats (Labeo molybdinus and C. cylindricus) as well as species preferring undercut banks and marginal vegetated areas (Barbus spp, Tilapia rendalli and Pseudocrenilabrus philander) are lower than expected.
Water Quality
• Abundance of species in most categories lower than expected. Introduced
• No records of any species yet. PES The FRAI rates this section as a C.
A Category B can be achieved throught the reinstatement of some medium flows and top releases from Maguga Dam to mitigate temperature reductions and the delayed onset of the spawning season. This will increase the abundance of most species. Flow depth
• All categories will benefit and abundances are likely to increase. Flow Modifications
• Flow dependant and moderately flow dependants abundance will increase. The abundant species which are dependent on habitats with permanent flow during all life phases (rheophilic) such as Barbus eutaenia, Opsaridium peringueyi, Chiloglanis pretoriae and C. swierstrai are likely to increase. Most other categories also benefit.
• Migration of fish will still be effected by downstream weirs and dams. The abundance and frequency of occurrence of migratory species such as Labeo molybdinus, L. cylindricus and some of the small barb species (Barbus sp.) will benefit from top releases to mitigate temperature reductions and create opportunities to cross smaller obstacles.
AfriDev Consultants (Pty) Ltd 2005
DWAF Report No. RDM X100-01-CON-COMPR2-0604 Komati River Catchment Ecological Water Requirements Study – Quantity Report
Page E - 7
Cover
• The abundance of fish fauna dependant on substrate in fast habitats are likely to increase. All other categories also benefit.
• Abundance of species preferring fast flowing habitats (Labeo molybdinus and C. cylindricus) as well as species preferring undercut banks and marginal vegetated areas (Barbus spp, Tilapia rendalli and Pseudocrenilabrus philander) will most likely increase.
Water Quality
• Intolerant and moderately intolerant species will all benefit and abundances of most are likely to increase.
A category D for fish will be achieved by maintaining present flow management, bottom releases reducing temperatures, especially during early season. This will prevent or delay in spawning events and will significantly reduce recruitment. Diatom build-up on substrate due to absence of medium floods will reduce the quality of available habitat. Flow depth classes
• Species most likely to be effected by reduced habitat quality are those that are associated with fast shallow, fast deep and slow shallow habitat. The latter habitat at this site seem specifically susceptible to diatom clogging.
Flow Modification
• Constant and/or unseasonable perennial base flow will reduce the presence and/or abundance of flow dependant and moderately flow dependant species. This will affect breeding and recruitment of all categories.
Cover
• Species most likely to be effected will be those associated with substrate and possible marginal vegetation.
Water Quality
• Reduced water temperatures, especially during early season will prevent or delay spawning especially of the intolerant and moderately intolerant species. Low flows can also increase temperatures and decrease available oxygen which will mostly affect the abovementioned categories.
3.4 KOMATI RIVER AT SITE 3 (K3) The available background information indicates that this site contained about 30 both temperate and tropical species of which 10 was recently observed (Appendix 1). The FRAI was evaluated as follows (Appendix 5): Flow depth Classes
• Abundance of species in most categories largely affected. Flow Modifications
• Flow dependant and moderately flow dependant species such as Barbus eutaenia, Opsaridium peringueyi, Chiloglanis pretoriae and C. swierstrai absent.
• Migration of fish has also been effected by downstream weirs and dams. The abundance and frequency of occurrence of migratory species such as Labeo molybdinus, L. cylindricus and some of the small barb species (Barbus sp.) previously collected at this site have been severely affected.
AfriDev Consultants (Pty) Ltd 2005
DWAF Report No. RDM X100-01-CON-COMPR2-0604 Komati River Catchment Ecological Water Requirements Study – Quantity Report
Page E - 8
Available Cover
• The abundance of fish fauna dependant on substrate in fast habitats are absent. All other categories have also been severely affected.
• Abundance of species preferring fast flowing habitats (Labeo molybdinus and C. cylindricus) as well as species preferring undercut banks and marginal vegetated areas (Barbus spp, Tilapia rendalli and Pseudocrenilabrus philander) mostly absent.
Water Quality
• Abundance of species in most categories severely affected. Introduced
• Largemouth bass (Micropterus salmoides) and Nembwe (Serranochromis robustus) has established in this area.
PES The FRAI rates this section of river as a category E. A category D for fish will be achieved with increase in base flow that will provide more habitats. Flow depth classes
• Increased base flow will increase the abundance of available habitat for species dependant on fast lowing (FS and FD). It will also improve conditions in all other categories.
Flow Modification
• Increased perennial base flow will create conditions in riffles for flow dependant and moderately flow dependant species and allow some re-colonization.
Cover
• Increased base flow will create some habitat on substrate in fast flowing waters and it will also provide more permanent habit for species dependant on the availability of marginal vegetation, root wads and undercut banks.
Water Quality
• More base flow will reduce SS and reduce the risk of critical water temperatures, nutrient build-up and reduced O2. This will improve conditions in all categories.
Overall The site will improve quite rapidly under improved conditions and improving fish movement in the river will also greatly enhance recolonization. 3.5 LOMATI RIVER AT SITE 1 (L1) The available background information indicates that this site contained about 30, both temperate and more tropical, species of which 20 was recently observed (Appendix 1). Reports from local farmers suggest that more tropical species such as Hydrocynus vittatus and Brycinus imberi historically occurred in this part of the river. The Mpumalanga Parks Board fish database and surveys by Schulz (1994) suggest that temperate species were mostly absent in this river before the construction of the dam and that species associated with large sandy pools such as Labeo rosae were very common. This data also suggest that limnophilic species dominated the fish assemblage in this river before the dam was build and that rheophilic species only occurred

AfriDev Consultants (Pty) Ltd 2005
DWAF Report No. RDM X100-01-CON-COMPR2-0604 Komati River Catchment Ecological Water Requirements Study – Quantity Report
Page E - 9
intermittently. Most of the species recorded at this site before the construction of the dam have a flow requirement for at least a part of their life cycle (eurytopic). Before the construction of the Driekoppies Dam the fish assemblage consisted mainly of eurytopic and limnophilic species. This assumption is largely confirmed by the Mpumalanga Parks Board fish database and the surveys by Schulz (1994). Since the construction of the dam the constant flow has created the opportunity for rheophollic species such as Barbus eutaenia, Opsaridium peringueyi and Chiloglanis anoterus to establish. The most noteworthy is the establishment of the population of Chiloglanis anoterus downstream of the dam since its construction. The present indigenous species diversity probably do not reflect the natural fish assemblage for this site as the abundance of temperate, sensitive and rheophilic species has probably increased (Opsaridium peringueyi, Chiloglanis anoterus and Barbus eutaenia), while the abundance of some tropical, migratory and eurytopic species has decreased (Labeo rosae, Labeobarbus marequensis, Hydrocynus vittatus and Brycinus imberi). The FRAI was evaluated as follows (Appendix 6): Flow depth classes
• The fish fauna preferring fast flowing habitats during certain life stages were lower in abundance than expected (Labeobarbus marequensis and Labeo molybdinus/cylindricus).
• Species preferring slow flowing habitats with undercut banks and marginal vegetated areas (Barbus spp, Tilapia rendalli and Pseudocrenilabrus philander) were lower in abundance than expected.
• Species preferring slow deep habitats, especially the more tropical species such as (Labeo rosae, Hydrocynus etc) are almost absent.
Flow Modification
• The presence of all three eel species (low abundance) show that this river is still important for these fish and may increase if migration routes are improved.
• Migration of yellowfish and most tropical fish has been severely effected by weirs and dams in lower Komati River.
• Flow dependant and moderately flow dependants are possibly more common in abundance than before the construction of Driekoppies Dam.
Available cover
• The fish fauna preferring gravel/cobble substrate in fast deep habitats were significantly lower in abundance (Labeobarbus marequensis and Labeo molybdinus/cylindricus).
• The fish fauna preferring sandy substrate in slow deep habitats especially the more tropical species such as (Labeo rosae, Hydrocynus etc) largely absent.
• Species preferring undercut banks and marginal vegetated areas (Barbus anoplus, Tilapia sparrmanii and Pseudocrenilabrus philander) were lower than expected.
Water Quality
• Species intolerant of water quality changes more abundant than reference condition (increase in rheophilic/temperate species)
• Abundance of all other categories less abundant than expected. Introduced
• None recorded.

AfriDev Consultants (Pty) Ltd 2005
DWAF Report No. RDM X100-01-CON-COMPR2-0604 Komati River Catchment Ecological Water Requirements Study – Quantity Report
Page E - 10
PES The FRAI evaluates this section of river as a Category C. 3.6 TEESPRUIT AT SITE T1 Sixteen species are expected to occur in the area of which 11 were recently collected (Appendix 1). The FRAI was evaluated as follows (Appendix 7): Flow depth classes
• The fish fauna dependant on fast deep habitats were in very low abundance or absent (Chiloglanis emarginatus and Barbus argenteus).
• Species preferring slow flowing habitats with undercut banks and marginal vegetated areas (Barbus anoplus, Tilapia sparrmanii and Pseudocrenilabrus philander) were lower in abundance than expected.
Flow Modifications
• The absence of Anguilla mossambica in this resource unit is related to the presence of a large number of downstream impoundments preventing recolonization of catadromous species.
• Migration of fish has also been effected by weirs and dams in mainstream. • Flow dependant and moderately flow dependants species lower in abundance than
expected. Available cover
• The fish fauna dependant on substrate in fast deep habitats, were low in abundance or absent.
• Species preferring undercut banks and marginal vegetated areas (Barbus anoplus, Tilapia sparrmanii and Pseudocrenilabrus philander) were lower than expected.
Water Quality
• Species affected are sensitive and moderately sensitive to changes in water quality. PES The FRAI rates this section of river as a Category B/C. A category B for fish will be achieved with a slight increase in base flow, water quality and a decrease in sediment inputs. The latter will reduce imbedded cobbles and gravel as well as sedimentation of pools and backwaters and:
• Provide more habitats for moderately flow dependant species. • increase the abundance of available habitat for species dependant on fast deep and
slow deep habitat conditions. • provide more permanent habit for species dependant on the availability of marginal
vegetation and undercut banks as well as substrate in fast flowing sections of the river.
A Category D for fish will be present in this reach if there is a decrease in low flows, increased sedimentation of riffles and pools and associated reduced water quality, exacerbated by non- point source pollution (mainly nutrients). Flow depth classes
• This will reduce the abundance of species dependant on fast deep and fast shallow habitats. The reduced or lost habitat is due to decreased flow and sedimentation.

AfriDev Consultants (Pty) Ltd 2005
DWAF Report No. RDM X100-01-CON-COMPR2-0604 Komati River Catchment Ecological Water Requirements Study – Quantity Report
Page E - 11
Flow modification • The species dependant or moderately dependant on perennial flow will be mostly
affected as the suitability of this habitat will be reduced for some species. This will mainly be due to reduced flow and decreased suitability of habitat in riffles due to sedimentation.
Cover
• Pools will reduce in depth and effect species dependent on water column. The species most affected will be those that are dependant on substrate and marginal vegetation/undercut banks as the availability of these will decrease due to decreased flow and sedimentation. This will also reduce the suitability of available fast deep habitat.
Water Quality
• Increase in temperatures in dominating SS and nutrients due to sedimentation and reduced flows will decrease the abundance of species intolerant and moderately intolerant of water quality changes.
Overall Reduced flows can result in a loss of at least 2 species (Chiloglanis emarginatus and Barbus argenteus) it is also likely that Amphilius uranoscopus may be largely affected. This will also lead to a decrease in the abundance of several other species. 3.7 GLADDESPRUIT AT SITE G1 Eleven species are expected to occur in Resource Unit G of which only five were recently collected (Appendix 1). The abundances of species preferring slow flowing habitats with undercut banks and marginal vegetated areas (Barbus anoplus, Tilapia sparrmanii and Pseudocrenilabrus philander) were lower than expected. The absence of Anguilla mossambica in this resource unit is related to the presence of a large number of downstream impoundments and no connectivity with the mainstream, preventing recolonization of catadromous species (migrates to sea to breed). The absence of connectivity with the mainstream is largely responsible for the absence of migratory species such as Barbus argenteus, Labeobarbus marequensis and Labeobarbus polylepis. There is a historic record for Chiloglanis emarginatus in this river and its absence may also be related to the absence of connectivity with mainstream and a reduction of flow and subsequent loss of habitat as a result of forestry. The Fish Response Assessment Index (FRAI) was evaluated as follows (Appendix 8): Flow depth categories.
• Some of the fish fauna preferring fast flowing habitats (Fast Deep and Fast Shallow) were absent (Labeobarbus marequensis, Labeobarbus polylepis and Barbus argenteus).
• Species preferring slow flowing habitats with undercut banks and marginal vegetated areas (Barbus anoplus and Pseudocrenilabrus philander) were lower in abundance than expected.
• There is a historic record for Chiloglanis emarginatus in this river and its absence may be related to the absence of connectivity with mainstream and a reduction of flow and subsequent loss of Fast Deep habitat as a result.
Flow Modification
• The absence of Anguilla mossambica in this resource unit is related to the presence of a large number of impoundments downstream and no connectivity with the mainstream, preventing recolonization of catadromous species (migrates to sea to bread).
AfriDev Consultants (Pty) Ltd 2005
DWAF Report No. RDM X100-01-CON-COMPR2-0604 Komati River Catchment Ecological Water Requirements Study – Quantity Report
Page E - 12
• The absence of connectivity with the mainstream is largely responsible for the absence of migratory species such as Barbus argenteus, Labeobarbus marequensis and Labeobarbus polylepis.
• Some of the fish species dependant on permanent flow were absent (Barbus argenteus) or low in abundance (Amphilius uranoscopus).
Available Cover
• The fish fauna preferring substrate in fast flowing habitats were significantly lower in abundance than expected (Chiloglanis pretoriae and Amphilius uranoscopus) or absent (Barbus argenteus).
• Species preferring undercut banks and marginal vegetated areas (Barbus anoplus, Tilapia sparrmanii and Pseudocrenilabrus philander) were lower than expected.
Water Quality
• Species effected above are also sensitive and moderately sensitive to changes in water quality.
PES The FRAI rates this section of river as a Category D. A category C for fish will be achieved by re-establishing fish migrations to allow some of the migratory species to re-colonize the river from time to time. All migratory species presently absent. A fishway on the Friesland weir will connect the Gladdespruit with the mainstream, Komati River. During flood events this may provide opportunity for some of the species to migrate upstream. Improving water quality may also important. It will have the following results: Flow Depth Classes
• The Diversity and abundance of species dependant on fast flowing (FS and FD) and slow flowing habitats (SD) will increase.
Flow Modification
• Higher diversity and abundance of fish dependant on permanent flow will be present if migratory species are allowed to re-establish.
Available Cover
• Species dependant on pools (water column) will have the opportunity to re-establish in the river and species dependant on rocky substrate may increase.
Water Quality
• Improved water quality conditions will improve the situation in all categories. Overall Improving fish movement in the river is the most important aspect. This will improve diversity of fish closer towards the reference condition. The rheophilic species selected for setting flow in the Gladdespruit River was Chiloglanis pretoriae which is dependant on the presence of moderately fast flowing waters. The semi-rheophilic species selected was Barbus anoplus. The rheohilic species was the most stressed under all flow conditions.

AfriDev Consultants (Pty) Ltd 2005
DWAF Report No. RDM X100-01-CON-COMPR2-0604 Komati River Catchment Ecological Water Requirements Study – Quantity Report
Page E - 13
4 REFERENCES
Clay, D. 1976. An investigation into the distribution of fish in Swaziland. Rev. Zool. Afr. 90:547-558.
Engelbrecht J. S. 1998. The distribution and habitat requirements of fish species in the Komati River within Swaziland and South Africa with specific reference to the Maguga Dam. Maguga Dam EIA, MDC6, KOBWA, Nelspruit.
Engelbrecht, J. S. and van Loggerenberg 1985. ‘n Ondersoek na die, obstruksie, wat bestaande en beplande dam- en keerwalle vir vismigrasie, in die, Komati- en Lomati Riviere. Interne verslag. Transvaalse Direktoraat Natuurbewing
Gaigher, I.G. 1969. Aspekte met betrekking tot die, ekologie, geografie, en taksonomie, van varswatervissoorte in die, Limpopo- en Incomati rivier systeem. PhD Thesis, RAU, Johannesburg.
Gaigher, I.G. 1970. Ecology of the Tiger-fish (Hydrognus vittatus) in the Incomati River System, SA. Zoologica Africana 5(2):211-227
Gibb. A. and Partners. 1993. Environmental Assessment Report. Komati River Basin Development within Swaziland. Report prepared for the Ministry of Natural Resources, Mbabane, Kingdom of Swaziland. Volume 3 of 3.
Hyslop, E.J. 1994. An annotated checklist of the freshwater fishes of Swaziland. Jubb, R. 1967. Freshwater fishes of Southern Africa. AA Balkema, Cape Town. Kleynhans, C. J. 1981. Die ekologie van skaars en moontlik bedreigde vissoorte van Transvaal.
Transvaal Division of Nature Conservation Internal Report. Kleynhans, C. J. 1984. Die, verspreiding en status van sekere seldsame vissoorte van
Transvaal en die, ekologie, van sommige soorte. PhD thesis, Pretoria University. Kleynhans, C. J. 1986. The distribution, status and conservation of some fish species of the
Transvaal. S.Afr. J. Wildl. Res. 16(4):135-144. Kleynhans, C. J. 1999. The development of a fish index to access the biological integrity of
South African rivers. Water SA, Volume 25, pp 265-278. Schulz, G. W. C. 1994. The distribution of fish species in the Mlumati River as well as the
Komati River from their confluence to Komatipoort. Chief Directorate of Nature and Environmental Conservation (Transvaal). Driekoppies Dam EWR Worksession.
Skelton , P. H. 1993 A complete guide to the freshwater fishes of southern Africa. Southern Book Publishers (PTY) Ltd. Halfway House. South Africa.

AfriDev Consultants (Pty) Ltd 2005
DWAF Report No. RDM X100-01-CON-COMPR2-0604 Komati River Catchment Ecological Water Requirements Study – Quantity Report
Page E - 14
Appendixes APPENDIX 1: SPECIES EXPECTED AND OBSERVED IN AUGUST 2003 AT EACH EWR SITE K1 K2 M1 K3 L1 T1 G1 EXP OBS EXP OBS EXP OBS EXP OBS EXP OBS EXP OBS EXP OBS
ANGUILLIDAE Anguilla bengalensis X X X X X X Anguilla marmorata X X X Anguilla mossambica X X X X X X X X AMPHILIIDAE Amphilius uranoscopus X X X X X X X X X X MORMYRIDAE Marcusenius macrolepidotus X X X X X Petrocephalus catostoma X X X X CHARACIDAE Brycinus imberi X X Hydrocynus vittatus X X Micralestes acutidens X X X X X X CYPRINIDAE Barbus annectens X X X X Barbus anoplus X X X X X X X X Barbus argenteus X X X X X X Barbus eutaenia X X X X X Barbus paludinosus X X X X X Barbus radiatus X X Barbus trimaculatus X X X X X X Barbus unitaeniatus X X X X Barbus viviparous X X X X X Labeo cylindricus X X X X X X X X X Labeo molybdinus X X X X X X X X X Labeo rosae X X Labeobarbus marequensis X X X X X X X X X X X X Labeobarbus polylepis X X X X X X Mesobola brevianalis X X X X X Opsaridium zambezense X X X X X SCHILBEIDAE Schilbe intermedius X X X CLARIIDAE Clarias gariepinus X X X X X X X X X X X X X MOCHOKIDAE Chiloglanis anoterus X X Chiloglanis emarginatus X X X X X X Chiloglanis paratus X X X X X X X X X Chiloglanis pretoriae X X X X X X X X X X X Chiloglanis swierstrai X X X X X X X X X GOBIIDAE Glossogobius giurus X X CICHLIDAE Chetia brevis X X X Oreochromis mossambicus X X X X X X Pseudocrenilabrus philander X X X X X X X X X X X X Tilapia rendalli X X X X X X Tilapia sparrmanii X X X X X X X X Number of species 11 10 16 14 24 21 30 10 30 20 16 11 11 5

AfriDev Consultants (Pty) Ltd 2005
DWAF Report No. RDM X100-01-CON-COMPR2-0604 Komati River Catchment Ecological Water Requirements Study – Quantity Report
Page E - 15
APPENDIX 2: FRAI EVALUATION FOR SITE K1
FISH RESPONSE INDICATORS OF HABITAT PREFERENCE CATEGORIES Preference scores Weight of metric Weighted score
FLOW-DEPTH CLASS METRICS Frequency of occurrence of species with very high and high preference for FAST-DEEP -1.00 0.31 -1.25 Frequency of occurrence of species with very high and high preference for FAST-SHALLOW -1.00 0.28 -1.13 Frequency of occurrence of species with very high and high preference for SLOW-DEEP -1.00 0.25 -1.00 Frequency of occurrence of species with very high and high preference for SLOW-SHALLOW -0.50 0.16 -0.31 Total weighted score 1.00 3.69 Absolute overall % change in flow-depth classes composition of assemblage 18.44 FLOW MODIFICATION METRICS Frequency of occurrence of species intolerant of no-flow conditions -0.50 0.282 -0.85 Frequency of occurrence of species moderately intolerant of no-flow conditions -0.50 0.225 -0.68 Frequency of occurrence of species moderately tolerant of no flow conditions -1.00 0.169 -1.01 Frequency of occurrence of species tolerant of no flow conditions 0.00 0.056 0.00 Presence of catadromous pecies -5.00 0.141 -4.23 Presence of migratory species. -2.00 0.127 -1.52 Total weighted score 1.00 8.28 Absolute overall % change in flow dependance of assemblage 27.61 COVER METRICS Frequency of occurrence of species with a very high to high preference for overhanging vegetation -0.5 0.24 -0.6 Frequency of occurrence of species with a very high to high preference for undercut banks -1.0 0.21 -1.1 Frequency of occurrence of species with a high to very high preference for a particular substrate -1.0 0.30 -1.5 Frequency of occurrence of species with a high to very high preference for aquatic macrophytes -0.5 0.03 -0.1 Frequency of occurrence of species with a very high to high preference for the water column -0.5 0.21 -0.5 Total weighted score 1.0 3.8 Absolute overall % change in cover of assemblages 15.15 HEALTH/CONDITION OF SPECIES Health of species intolerant of modified water quality -0.50 0.37 -0.74 Health of species moderately intolerant of modified water quality -0.50 0.30 -0.59 Health of species moderately tolerant of modified water quality -1.00 0.26 -1.04 Health of species tolerant of modified water quality 0.50 0.07 0.15 Total weighted score 1.00 2.52 Overall % change to indicators of modified water quality 12.59 INTRODUCED SPECIES METRICS The potential impact of introduced predaceous spp? 0.0 0.32 0.00 How widespread (frequency of occurrence) are introduced predaceous spp? 0.0 0.36 0.00 The potential impact of introduced habitat modifying spp? 0.0 0.18 0.00 How widespread (frequency of occurrence) are habitat modifying spp? 0.0 0.14 0.00 Total weighted score 1.0 0.00 Overall % potential impact of introduced species 0.00 FISH PES METRIC GROUP FLOW-DEPTH METRICS 81.56 0.28 22.66 FLOW MODIFICATION METRICS 72.39 0.28 20.11 COVER METRICS 84.85 0.25 21.21 HEALTH/CONDITION METRICS 87.41 0.19 17.00 IMPACT OF INTRODUCED SPP (NEGATIVE) 0.00 0.00 0.00 Total weighted score 1.00 Fish PES 80.97Fish PES Category B/C

AfriDev Consultants (Pty) Ltd 2005
DWAF Report No. RDM X100-01-CON-COMPR2-0604 Komati River Catchment Ecological Water Requirements Study – Quantity Report
Page E - 16
APPENDIX 3: FRAI EVALUATION FOR SITE K2
FISH RESPONSE INDICATORS OF HABITAT PREFERENCE CATEGORIES Preference scores Weight of metric Weighted score
FLOW-DEPTH CLASS METRICS Frequency of occurrence of species with very high and high preference for FAST-DEEP -1.00 0.31 -1.25 Frequency of occurrence of species with very high and high preference for FAST-SHALLOW -1.00 0.28 -1.13 Frequency of occurrence of species with very high and high preference for SLOW-DEEP -1.00 0.25 -1.00 Frequency of occurrence of species with very high and high preference for SLOW-SHALLOW -0.50 0.16 -0.31 Total weighted score 1.00 3.69 Absolute overall % change in flow-depth classes composition of assemblage 18.44 FLOW MODIFICATION METRICS Frequency of occurrence of species intolerant of no-flow conditions -0.50 0.282 -0.85 Frequency of occurrence of species moderately intolerant of no-flow conditions -0.50 0.225 -0.68 Frequency of occurrence of species moderately tolerant of no flow conditions -1.00 0.169 -1.01 Frequency of occurrence of species tolerant of no flow conditions -0.50 0.056 -0.17 Presence of catadromous pecies -4.00 0.141 -3.38 Presence of migratory species. -2.00 0.127 -1.52 Total weighted score 1.00 7.61 Absolute overall % change in flow dependance of assemblage 25.35 COVER METRICS Frequency of occurrence of species with a very high to high preference for overhanging vegetation -0.5 0.24 -0.6 Frequency of occurrence of species with a very high to high preference for undercut banks -1.0 0.21 -1.1 Frequency of occurrence of species with a high to very high preference for a particular substrate -1.0 0.30 -1.5 Frequency of occurrence of species with a high to very high preference for aquatic macrophytes -1.0 0.03 -0.2 Frequency of occurrence of species with a very high to high preference for the water column -0.5 0.21 -0.5 Total weighted score 1.0 3.9 Absolute overall % change in cover of assemblages 15.45 HEALTH/CONDITION OF SPECIES Health of species intolerant of modified water quality -0.50 0.37 -0.74 Health of species moderately intolerant of modified water quality -0.50 0.30 -0.59 Health of species moderately tolerant of modified water quality -1.00 0.26 -1.04 Health of species tolerant of modified water quality -1.00 0.07 -0.30 Total weighted score 1.00 2.67 Overall % change to indicators of modified water quality 13.33 INTRODUCED SPECIES METRICS The potential impact of introduced predaceous spp? 0.0 0.32 0.00 How widespread (frequency of occurrence) are introduced predaceous spp? 0.0 0.36 0.00 The potential impact of introduced habitat modifying spp? 0.0 0.18 0.00 How widespread (frequency of occurrence) are habitat modifying spp? 0.0 0.14 0.00 Total weighted score 1.0 0.00 Overall % potential impact of introduced species 0.00 FISH PES METRIC GROUP FLOW-DEPTH METRICS 81.56 0.28 22.66 FLOW MODIFICATION METRICS 74.65 0.28 20.74 COVER METRICS 84.55 0.25 21.14 HEALTH/CONDITION METRICS 86.67 0.19 16.85 IMPACT OF INTRODUCED SPP (NEGATIVE) 0.00 0.00 0.00 Total weighted score 1.00 Fish PES 81.38Fish PES Category B/C

AfriDev Consultants (Pty) Ltd 2005
DWAF Report No. RDM X100-01-CON-COMPR2-0604 Komati River Catchment Ecological Water Requirements Study – Quantity Report
Page E - 17
APPENDIX 4: FRAI EVALUATION FOR SITE M1
FISH RESPONSE INDICATORS OF HABITAT PREFERENCE CATEGORIES Preference scores Weight of metric Weighted score
FLOW-DEPTH CLASS METRICS Frequency of occurrence of species with very high and high preference for FAST-DEEP -1.00 0.31 -1.25 Frequency of occurrence of species with very high and high preference for FAST-SHALLOW -1.00 0.28 -1.13 Frequency of occurrence of species with very high and high preference for SLOW-DEEP -1.00 0.25 -1.00 Frequency of occurrence of species with very high and high preference for SLOW-SHALLOW -0.50 0.16 -0.31 Total weighted score 1.00 3.69 Absolute overall % change in flow-depth classes composition of assemblage 18.44 FLOW MODIFICATION METRICS Frequency of occurrence of species intolerant of no-flow conditions -0.50 0.282 -0.85 Frequency of occurrence of species moderately intolerant of no-flow conditions -0.50 0.225 -0.68 Frequency of occurrence of species moderately tolerant of no flow conditions -1.00 0.169 -1.01 Frequency of occurrence of species tolerant of no flow conditions -0.50 0.056 -0.17 Presence of catadromous pecies -4.00 0.141 -3.38 Presence of migratory species. -2.00 0.127 -1.52 Total weighted score 1.00 7.61 Absolute overall % change in flow dependance of assemblage 25.35 COVER METRICS Frequency of occurrence of species with a very high to high preference for overhanging vegetation -0.5 0.24 -0.6 Frequency of occurrence of species with a very high to high preference for undercut banks -1.0 0.21 -1.1 Frequency of occurrence of species with a high to very high preference for a particular substrate -1.0 0.30 -1.5 Frequency of occurrence of species with a high to very high preference for aquatic macrophytes -1.0 0.03 -0.2 Frequency of occurrence of species with a very high to high preference for the water column -0.5 0.21 -0.5 Total weighted score 1.0 3.9 Absolute overall % change in cover of assemblages 15.45 HEALTH/CONDITION OF SPECIES Health of species intolerant of modified water quality -0.50 0.37 -0.74 Health of species moderately intolerant of modified water quality -0.50 0.30 -0.59 Health of species moderately tolerant of modified water quality -1.00 0.26 -1.04 Health of species tolerant of modified water quality -1.00 0.07 -0.30 Total weighted score 1.00 2.67 Overall % change to indicators of modified water quality 13.33 INTRODUCED SPECIES METRICS The potential impact of introduced predaceous spp? 0.0 0.32 0.00 How widespread (frequency of occurrence) are introduced predaceous spp? 0.0 0.36 0.00 The potential impact of introduced habitat modifying spp? 0.0 0.18 0.00 How widespread (frequency of occurrence) are habitat modifying spp? 0.0 0.14 0.00 Total weighted score 1.0 0.00 Overall % potential impact of introduced species 0.00 FISH PES METRIC GROUP FLOW-DEPTH METRICS 81.56 0.28 22.66 FLOW MODIFICATION METRICS 74.65 0.28 20.74 COVER METRICS 84.55 0.25 21.14 HEALTH/CONDITION METRICS 86.67 0.19 16.85 IMPACT OF INTRODUCED SPP (NEGATIVE) 0.00 0.00 0.00 Total weighted score 1.00 Fish PES 81.38Fish PES Category C
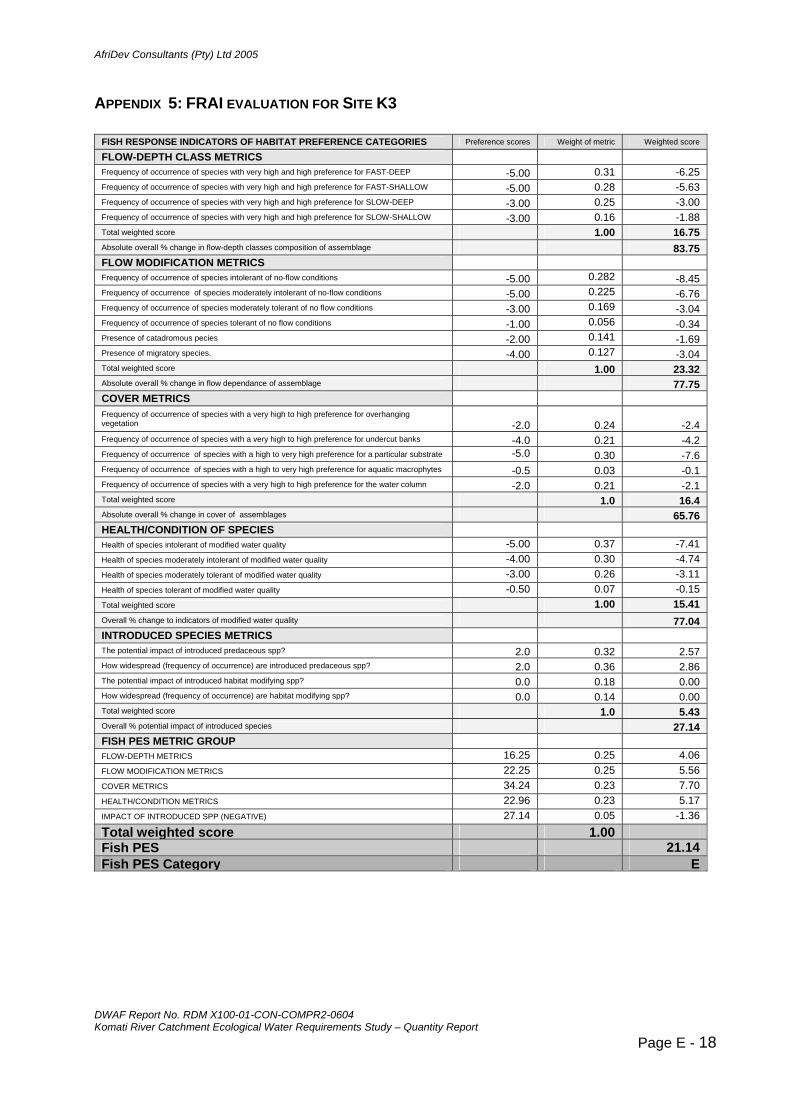
AfriDev Consultants (Pty) Ltd 2005
DWAF Report No. RDM X100-01-CON-COMPR2-0604 Komati River Catchment Ecological Water Requirements Study – Quantity Report
Page E - 18
APPENDIX 5: FRAI EVALUATION FOR SITE K3
FISH RESPONSE INDICATORS OF HABITAT PREFERENCE CATEGORIES Preference scores Weight of metric Weighted score
FLOW-DEPTH CLASS METRICS Frequency of occurrence of species with very high and high preference for FAST-DEEP -5.00 0.31 -6.25 Frequency of occurrence of species with very high and high preference for FAST-SHALLOW -5.00 0.28 -5.63 Frequency of occurrence of species with very high and high preference for SLOW-DEEP -3.00 0.25 -3.00 Frequency of occurrence of species with very high and high preference for SLOW-SHALLOW -3.00 0.16 -1.88 Total weighted score 1.00 16.75 Absolute overall % change in flow-depth classes composition of assemblage 83.75 FLOW MODIFICATION METRICS Frequency of occurrence of species intolerant of no-flow conditions -5.00 0.282 -8.45 Frequency of occurrence of species moderately intolerant of no-flow conditions -5.00 0.225 -6.76 Frequency of occurrence of species moderately tolerant of no flow conditions -3.00 0.169 -3.04 Frequency of occurrence of species tolerant of no flow conditions -1.00 0.056 -0.34 Presence of catadromous pecies -2.00 0.141 -1.69 Presence of migratory species. -4.00 0.127 -3.04 Total weighted score 1.00 23.32 Absolute overall % change in flow dependance of assemblage 77.75 COVER METRICS Frequency of occurrence of species with a very high to high preference for overhanging vegetation -2.0 0.24 -2.4 Frequency of occurrence of species with a very high to high preference for undercut banks -4.0 0.21 -4.2 Frequency of occurrence of species with a high to very high preference for a particular substrate -5.0 0.30 -7.6 Frequency of occurrence of species with a high to very high preference for aquatic macrophytes -0.5 0.03 -0.1 Frequency of occurrence of species with a very high to high preference for the water column -2.0 0.21 -2.1 Total weighted score 1.0 16.4 Absolute overall % change in cover of assemblages 65.76 HEALTH/CONDITION OF SPECIES Health of species intolerant of modified water quality -5.00 0.37 -7.41 Health of species moderately intolerant of modified water quality -4.00 0.30 -4.74 Health of species moderately tolerant of modified water quality -3.00 0.26 -3.11 Health of species tolerant of modified water quality -0.50 0.07 -0.15 Total weighted score 1.00 15.41 Overall % change to indicators of modified water quality 77.04 INTRODUCED SPECIES METRICS The potential impact of introduced predaceous spp? 2.0 0.32 2.57 How widespread (frequency of occurrence) are introduced predaceous spp? 2.0 0.36 2.86 The potential impact of introduced habitat modifying spp? 0.0 0.18 0.00 How widespread (frequency of occurrence) are habitat modifying spp? 0.0 0.14 0.00 Total weighted score 1.0 5.43 Overall % potential impact of introduced species 27.14 FISH PES METRIC GROUP FLOW-DEPTH METRICS 16.25 0.25 4.06 FLOW MODIFICATION METRICS 22.25 0.25 5.56 COVER METRICS 34.24 0.23 7.70 HEALTH/CONDITION METRICS 22.96 0.23 5.17 IMPACT OF INTRODUCED SPP (NEGATIVE) 27.14 0.05 -1.36 Total weighted score 1.00 Fish PES 21.14Fish PES Category E

AfriDev Consultants (Pty) Ltd 2005
DWAF Report No. RDM X100-01-CON-COMPR2-0604 Komati River Catchment Ecological Water Requirements Study – Quantity Report
Page E - 19
APPENDIX 6: FRAI EVALUATION FOR SITE L1
FISH RESPONSE INDICATORS OF HABITAT PREFERENCE CATEGORIES Preference scores Weight of metric Weighted score
FLOW-DEPTH CLASS METRICS Frequency of occurrence of species with very high and high preference for FAST-DEEP -1.00 0.31 -1.25 Frequency of occurrence of species with very high and high preference for FAST-SHALLOW -0.50 0.28 -0.56 Frequency of occurrence of species with very high and high preference for SLOW-DEEP -3.00 0.25 -3.00 Frequency of occurrence of species with very high and high preference for SLOW-SHALLOW -2.00 0.16 -1.25 Total weighted score 1.00 6.06 Absolute overall % change in flow-depth classes composition of assemblage 30.31 FLOW MODIFICATION METRICS Frequency of occurrence of species intolerant of no-flow conditions -0.50 0.282 -0.85 Frequency of occurrence of species moderately intolerant of no-flow conditions -0.50 0.225 -0.68 Frequency of occurrence of species moderately tolerant of no flow conditions -3.00 0.169 -3.04 Frequency of occurrence of species tolerant of no flow conditions -1.00 0.056 -0.34 Presence of catadromous pecies -1.00 0.141 -0.85 Presence of migratory species. -3.00 0.127 -2.28 Total weighted score 1.00 8.03 Absolute overall % change in flow dependance of assemblage 26.76 COVER METRICS Frequency of occurrence of species with a very high to high preference for overhanging vegetation -2.0 0.24 -2.4 Frequency of occurrence of species with a very high to high preference for undercut banks -0.5 0.21 -0.5 Frequency of occurrence of species with a high to very high preference for a particular substrate -1.5 0.30 -2.3 Frequency of occurrence of species with a high to very high preference for aquatic macrophytes -1.0 0.03 -0.2 Frequency of occurrence of species with a very high to high preference for the water column -2.0 0.21 -2.1 Total weighted score 1.0 7.5 Absolute overall % change in cover of assemblages 30.00 HEALTH/CONDITION OF SPECIES Health of species intolerant of modified water quality 0.00 0.37 0.00 Health of species moderately intolerant of modified water quality -1.00 0.30 -1.19 Health of species moderately tolerant of modified water quality -3.00 0.26 -3.11 Health of species tolerant of modified water quality -1.00 0.07 -0.30 Total weighted score 1.00 4.59 Overall % change to indicators of modified water quality 22.96 INTRODUCED SPECIES METRICS The potential impact of introduced predaceous spp? 0.0 0.32 0.00 How widespread (frequency of occurrence) are introduced predaceous spp? 0.0 0.36 0.00 The potential impact of introduced habitat modifying spp? 0.0 0.18 0.00 How widespread (frequency of occurrence) are habitat modifying spp? 0.0 0.14 0.00 Total weighted score 1.0 0.00 Overall % potential impact of introduced species 0.00 FISH PES METRIC GROUP FLOW-DEPTH METRICS 69.69 0.26 18.34 FLOW MODIFICATION METRICS 73.24 0.26 19.27 COVER METRICS 70.00 0.24 16.58 HEALTH/CONDITION METRICS 77.04 0.18 14.19 IMPACT OF INTRODUCED SPP (NEGATIVE) 0.00 0.05 0.00 Total weighted score 1.00 Fish PES 68.38Fish PES Category C

AfriDev Consultants (Pty) Ltd 2005
DWAF Report No. RDM X100-01-CON-COMPR2-0604 Komati River Catchment Ecological Water Requirements Study – Quantity Report
Page E - 20
APPENDIX 7: FRAI EVALUATION FOR SITE T1
FISH RESPONSE INDICATORS OF HABITAT PREFERENCE CATEGORIES Preference scores Weight of metric Weighted score
FLOW-DEPTH CLASS METRICS Frequency of occurrence of species with very high and high preference for FAST-DEEP -1.00 0.31 -1.25 Frequency of occurrence of species with very high and high preference for FAST-SHALLOW -1.00 0.28 -1.13 Frequency of occurrence of species with very high and high preference for SLOW-DEEP -1.00 0.25 -1.00 Frequency of occurrence of species with very high and high preference for SLOW-SHALLOW -0.50 0.16 -0.31 Total weighted score 1.00 3.69 Absolute overall % change in flow-depth classes composition of assemblage 18.44 FLOW MODIFICATION METRICS Frequency of occurrence of species intolerant of no-flow conditions -1.00 0.282 -1.69 Frequency of occurrence of species moderately intolerant of no-flow conditions -1.00 0.225 -1.35 Frequency of occurrence of species moderately tolerant of no flow conditions -1.00 0.169 -1.01 Frequency of occurrence of species tolerant of no flow conditions -0.50 0.056 -0.17 Presence of catadromous pecies -3.00 0.141 -2.54 Presence of migratory species. -1.00 0.127 -0.76 Total weighted score 1.00 7.52 Absolute overall % change in flow dependance of assemblage 25.07 COVER METRICS Frequency of occurrence of species with a very high to high preference for overhanging vegetation -0.5 0.24 -0.6 Frequency of occurrence of species with a very high to high preference for undercut banks -1.0 0.21 -1.1 Frequency of occurrence of species with a high to very high preference for a particular substrate -1.0 0.30 -1.5 Frequency of occurrence of species with a high to very high preference for aquatic macrophytes -0.5 0.03 -0.1 Frequency of occurrence of species with a very high to high preference for the water column -1.0 0.21 -1.1 Total weighted score 1.0 4.3 Absolute overall % change in cover of assemblages 17.27 HEALTH/CONDITION OF SPECIES Health of species intolerant of modified water quality -1.00 0.37 -1.48 Health of species moderately intolerant of modified water quality -1.00 0.30 -1.19 Health of species moderately tolerant of modified water quality 0.00 0.26 0.00 Health of species tolerant of modified water quality 0.00 0.07 0.00 Total weighted score 1.00 2.67 Overall % change to indicators of modified water quality 13.33 INTRODUCED SPECIES METRICS The potential impact of introduced predaceous spp? 0.0 0.32 0.00 How widespread (frequency of occurrence) are introduced predaceous spp? 0.0 0.36 0.00 The potential impact of introduced habitat modifying spp? 0.0 0.18 0.00 How widespread (frequency of occurrence) are habitat modifying spp? 0.0 0.14 0.00 Total weighted score 1.0 0.00 Overall % potential impact of introduced species 0.00 FISH PES METRIC GROUP FLOW-DEPTH METRICS 81.56 0.28 22.66 FLOW MODIFICATION METRICS 74.93 0.28 20.81 COVER METRICS 82.73 0.25 20.68 HEALTH/CONDITION METRICS 86.67 0.19 16.85 IMPACT OF INTRODUCED SPP (NEGATIVE) 0.00 0.00 0.00 Total weighted score 1.00 Fish PES 81.00Fish PES Category B/C

AfriDev Consultants (Pty) Ltd 2005
DWAF Report No. RDM X100-01-CON-COMPR2-0604 Komati River Catchment Ecological Water Requirements Study – Quantity Report
Page E - 21
APPENDIX 8: FRAI EVALUATION FOR SITE G1 FISH RESPONSE INDICATORS OF HABITAT Preference Weight of Weighted FLOW-DEPTH CLASS METRICS Frequency of occurrence of species with very high and 3.00 0.31 3.75Frequency of occurrence of species with very high and 3.00 0.28 3.38Frequency of occurrence of species with very high and 3.00 0.25 3.00Frequency of occurrence of species with very high and 1.00 0.16 0.63Total weighted score 1.00 10.75Absolute overall % change in flow-depth classes 53.75FLOW MODIFICATION METRICS Frequency of occurrence of species intolerant of no-flow -2.00 0.282 -3.38Frequency of occurrence of species moderately intolerant -2.00 0.225 -2.70Frequency of occurrence of species moderately tolerant of -1.00 0.169 -1.01Frequency of occurrence of species tolerant of no flow -1.00 0.056 -0.34Presence of catadromous pecies -5.00 0.141 -4.23Presence of migratory species. -4.00 0.127 -3.04Total weighted score 1.00 14.70Absolute overall % change in flow dependance of 49.01COVER METRICS Frequency of occurrence of species with a very high to high preference for overhanging vegetation -0.5 0.24 -0.6 Frequency of occurrence of species with a very high to -1.0 0.21 -1.1 Frequency of occurrence of species with a high to very -2.0 0.30 -3.0 Frequency of occurrence of species with a high to very -0.5 0.03 -0.1 Frequency of occurrence of species with a very high to 4.0 0.21 4.2 Total weighted score 1.0 9.0 Absolute overall % change in cover of assemblages 36.06HEALTH/CONDITION OF SPECIES Health of species intolerant of modified water quality -1.50 0.37 -2.22Health of species moderately intolerant of modified water 0.00 0.30 0.00Health of species moderately tolerant of modified water 3.00 0.26 3.11Health of species tolerant of modified water quality 1.00 0.07 0.30Total weighted score 1.00 5.63Overall % change to indicators of modified water quality 28.15INTRODUCED SPECIES METRICS The potential impact of introduced predaceous spp? 1.0 0.32 1.29How widespread (frequency of occurrence) are introduced 0.0 0.36 0.00The potential impact of introduced habitat modifying spp? 0.0 0.18 0.00How widespread (frequency of occurrence) are habitat 0.0 0.14 0.00Total weighted score 1.0 1.29Overall % potential impact of introduced species 6.43FISH PES METRIC GROUP FLOW-DEPTH METRICS 46.25 0.24 11.28FLOW MODIFICATION METRICS 50.99 0.24 12.44COVER METRICS 63.94 0.22 14.04HEALTH/CONDITION METRICS 71.85 0.17 12.27IMPACT OF INTRODUCED SPP (NEGATIVE) 6.43 0.12 -0.78Total weighted score 1.00 Fish PES 49.23 Fish PES Category D
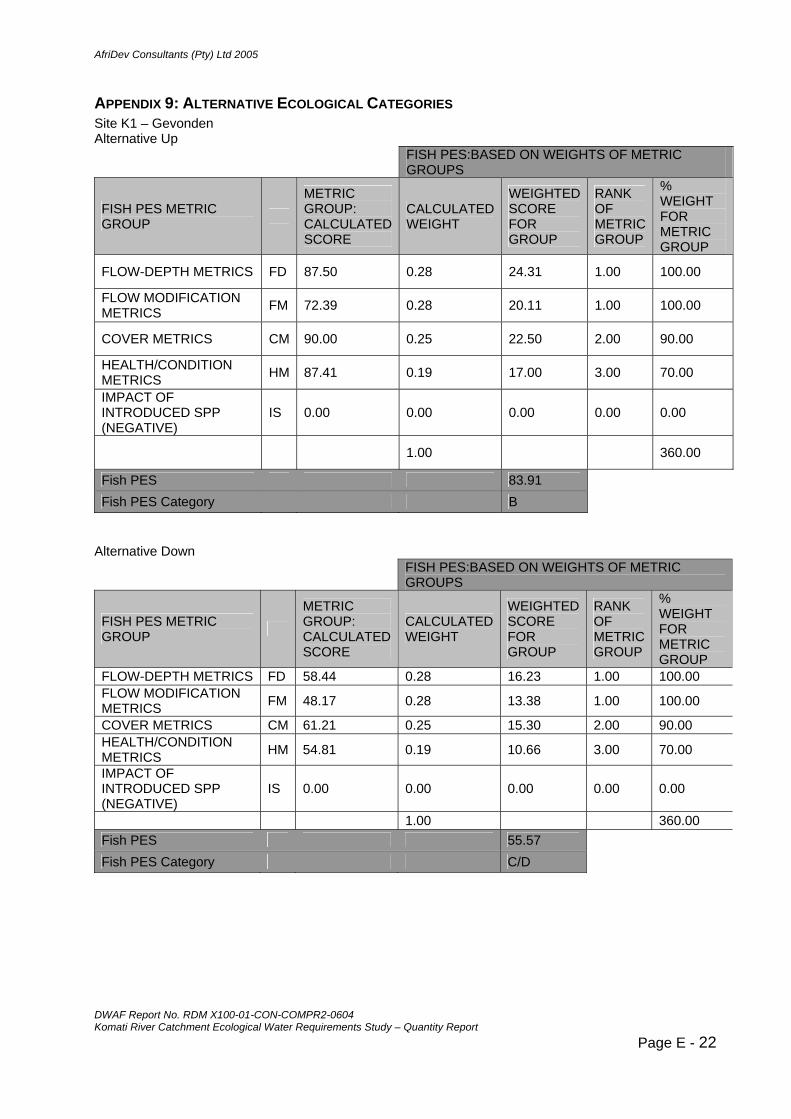
AfriDev Consultants (Pty) Ltd 2005
DWAF Report No. RDM X100-01-CON-COMPR2-0604 Komati River Catchment Ecological Water Requirements Study – Quantity Report
Page E - 22
APPENDIX 9: ALTERNATIVE ECOLOGICAL CATEGORIES Site K1 – Gevonden Alternative Up FISH PES:BASED ON WEIGHTS OF METRIC
GROUPS
FISH PES METRIC GROUP
METRIC GROUP: CALCULATED SCORE
CALCULATED WEIGHT
WEIGHTED SCORE FOR GROUP
RANK OF METRIC GROUP
% WEIGHT FOR METRIC GROUP
FLOW-DEPTH METRICS FD 87.50 0.28 24.31 1.00 100.00
FLOW MODIFICATION METRICS FM 72.39 0.28 20.11 1.00 100.00
COVER METRICS CM 90.00 0.25 22.50 2.00 90.00
HEALTH/CONDITION METRICS HM 87.41 0.19 17.00 3.00 70.00
IMPACT OF INTRODUCED SPP (NEGATIVE)
IS 0.00 0.00 0.00 0.00 0.00
1.00 360.00
Fish PES 83.91 Fish PES Category B
Alternative Down
FISH PES:BASED ON WEIGHTS OF METRIC GROUPS
FISH PES METRIC GROUP
METRIC GROUP: CALCULATED SCORE
CALCULATED WEIGHT
WEIGHTED SCORE FOR GROUP
RANK OF METRIC GROUP
% WEIGHT FOR METRIC GROUP
FLOW-DEPTH METRICS FD 58.44 0.28 16.23 1.00 100.00 FLOW MODIFICATION METRICS FM 48.17 0.28 13.38 1.00 100.00
COVER METRICS CM 61.21 0.25 15.30 2.00 90.00 HEALTH/CONDITION METRICS HM 54.81 0.19 10.66 3.00 70.00
IMPACT OF INTRODUCED SPP (NEGATIVE)
IS 0.00 0.00 0.00 0.00 0.00
1.00 360.00 Fish PES 55.57 Fish PES Category C/D

AfriDev Consultants (Pty) Ltd 2005
DWAF Report No. RDM X100-01-CON-COMPR2-0604 Komati River Catchment Ecological Water Requirements Study – Quantity Report
Page E - 23
FISH PES: BASED ON METRIC WITH HIGHEST WEIGHT IN METRIC GROUP
FISH PES METRIC GROUP CALCULATED
WEIGHT
WEIGHTED SCORE FOR HIGHEST METRIC IN GROUP
HIGHEST METRIC IN GROUP
RANK OF HIGHEST METRIC IN GROUP
% WEIGHT FOR HIGHEST METRIC IN GROUP
FLOW-DEPTH METRICS FD 0.26 15.18 FFD 1.00 100.00 FLOW MODIFICATION METRICS FM 0.26 12.51 FI 1.00 100.00
COVER METRICS CM 0.25 15.10 SUB 2.00 95.00 HEALTH/CONDITION METRICS HM 0.21 11.39 ITH 3.00 80.00
IMPACT OF INTRODUCED SPP (NEGATIVE)
IS 0.03 0.00 FP 4.00 10.00
1.00 385.00 Fish PES 54.18
Fish PES Category D Site K2 – Kromdraai Alternative Up FISH PES:BASED ON WEIGHTS OF METRIC
GROUPS
FISH PES METRIC GROUP
METRIC GROUP: CALCULATED SCORE
CALCULATED WEIGHT
WEIGHTED SCORE FOR GROUP
RANK OF METRIC GROUP
% WEIGHT FOR METRIC GROUP
FLOW-DEPTH METRICS FD 87.50 0.28 24.31 1.00 100.00 FLOW MODIFICATION METRICS FM 75.92 0.28 21.09 1.00 100.00
COVER METRICS CM 87.58 0.25 21.89 2.00 90.00 HEALTH/CONDITION METRICS HM 86.67 0.19 16.85 3.00 70.00
IMPACT OF INTRODUCED SPP (NEGATIVE)
IS 0.00 0.00 0.00 0.00 0.00
1.00 360.00 Fish PES 84.14 Fish PES Category B

AfriDev Consultants (Pty) Ltd 2005
DWAF Report No. RDM X100-01-CON-COMPR2-0604 Komati River Catchment Ecological Water Requirements Study – Quantity Report
Page E - 24
FISH PES: BASED ON METRIC WITH HIGHEST WEIGHT IN
METRIC GROUP
FISH PES METRIC GROUP CALCULATED
WEIGHT
WEIGHTED SCORE FOR HIGHEST METRIC IN GROUP
HIGHEST METRIC IN GROUP
RANK OF HIGHEST METRIC IN GROUP
% WEIGHT FOR HIGHEST METRIC IN GROUP
FLOW-DEPTH METRICS FD 0.26 22.73 FFD 1.00 100.00 FLOW MODIFICATION METRICS FM 0.26 19.72 FI 1.00 100.00
COVER METRICS CM 0.25 21.61 SUB 2.00 95.00 HEALTH/CONDITION METRICS HM 0.21 18.01 ITH 3.00 80.00
IMPACT OF INTRODUCED SPP (NEGATIVE)
IS 0.03 0.00 FP 4.00 10.00
1.00 385.00 Fish PES 82.06
Fish PES Category B Alternative Down FISH PES:BASED ON WEIGHTS OF METRIC
GROUPS
FISH PES METRIC GROUP
METRIC GROUP: CALCULATED SCORE
CALCULATED WEIGHT
WEIGHTED SCORE FOR GROUP
RANK OF METRIC GROUP
% WEIGHT FOR METRIC GROUP
FLOW-DEPTH METRICS FD 63.44 0.28 17.62 1.00 100.00 FLOW MODIFICATION METRICS FM 53.80 0.28 14.95 1.00 100.00
COVER METRICS CM 71.82 0.25 17.95 2.00 90.00
HEALTH/CONDITION METRICS HM 57.78 0.19 11.23 3.00 70.00
IMPACT OF INTRODUCED SPP (NEGATIVE)
IS 0.00 0.00 0.00 0.00 0.00
1.00 360.00 Fish PES 61.76 Fish PES Category C/D
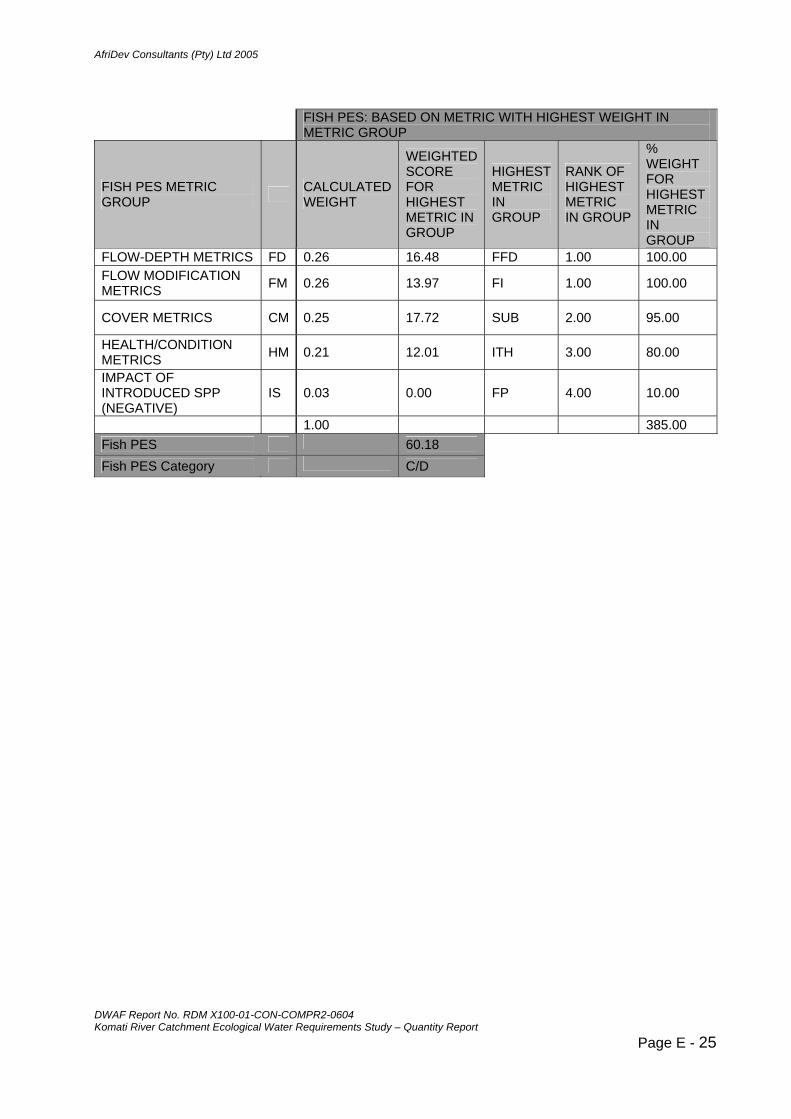
AfriDev Consultants (Pty) Ltd 2005
DWAF Report No. RDM X100-01-CON-COMPR2-0604 Komati River Catchment Ecological Water Requirements Study – Quantity Report
Page E - 25
FISH PES: BASED ON METRIC WITH HIGHEST WEIGHT IN
METRIC GROUP
FISH PES METRIC GROUP CALCULATED
WEIGHT
WEIGHTED SCORE FOR HIGHEST METRIC IN GROUP
HIGHEST METRIC IN GROUP
RANK OF HIGHEST METRIC IN GROUP
% WEIGHT FOR HIGHEST METRIC IN GROUP
FLOW-DEPTH METRICS FD 0.26 16.48 FFD 1.00 100.00 FLOW MODIFICATION METRICS FM 0.26 13.97 FI 1.00 100.00
COVER METRICS CM 0.25 17.72 SUB 2.00 95.00
HEALTH/CONDITION METRICS HM 0.21 12.01 ITH 3.00 80.00
IMPACT OF INTRODUCED SPP (NEGATIVE)
IS 0.03 0.00 FP 4.00 10.00
1.00 385.00 Fish PES 60.18
Fish PES Category C/D

AfriDev Consultants (Pty) Ltd 2005
DWAF Report No. RDM X100-01-CON-COMPR2-0604 Komati River Catchment Ecological Water Requirements Study – Quantity Report
Page E - 26
Site K3 – Tonga Alternative Up FISH PES:BASED ON WEIGHTS OF METRIC
GROUPS
FISH PES METRIC GROUP
METRIC GROUP: CALCULATED SCORE
CALCULATED WEIGHT
WEIGHTED SCORE FOR GROUP
RANK OF METRIC GROUP
% WEIGHT FOR METRIC GROUP
FLOW-DEPTH METRICS FD 48.13 0.25 12.03 1.00 100.00 FLOW MODIFICATION METRICS FM 49.01 0.25 12.25 1.00 100.00
COVER METRICS CM 59.70 0.23 13.43 2.00 90.00 HEALTH/CONDITION METRICS HM 55.56 0.23 12.50 2.00 90.00
IMPACT OF INTRODUCED SPP (NEGATIVE)
IS 27.14 0.05 -1.36 3.00 20.00
1.00 400.00 Fish PES 48.86 Fish PES Category D
FISH PES: BASED ON METRIC WITH HIGHEST WEIGHT IN
METRIC GROUP
FISH PES METRIC GROUP CALCULATED
WEIGHT
WEIGHTED SCORE FOR HIGHEST METRIC IN GROUP
HIGHEST METRIC IN GROUP
RANK OF HIGHEST METRIC IN GROUP
% WEIGHT FOR HIGHEST METRIC IN GROUP
FLOW-DEPTH METRICS FD 0.26 12.50 FFD 1.00 100.00 FLOW MODIFICATION METRICS FM 0.26 12.73 FI 1.00 100.00
COVER METRICS CM 0.25 14.73 SUB 2.00 95.00 HEALTH/CONDITION METRICS HM 0.21 11.54 ITH 3.00 80.00
IMPACT OF INTRODUCED SPP (NEGATIVE)
IS 0.03 -0.71 FP 4.00 10.00
1.00 385.00 Fish PES 50.80
Fish PES Category D
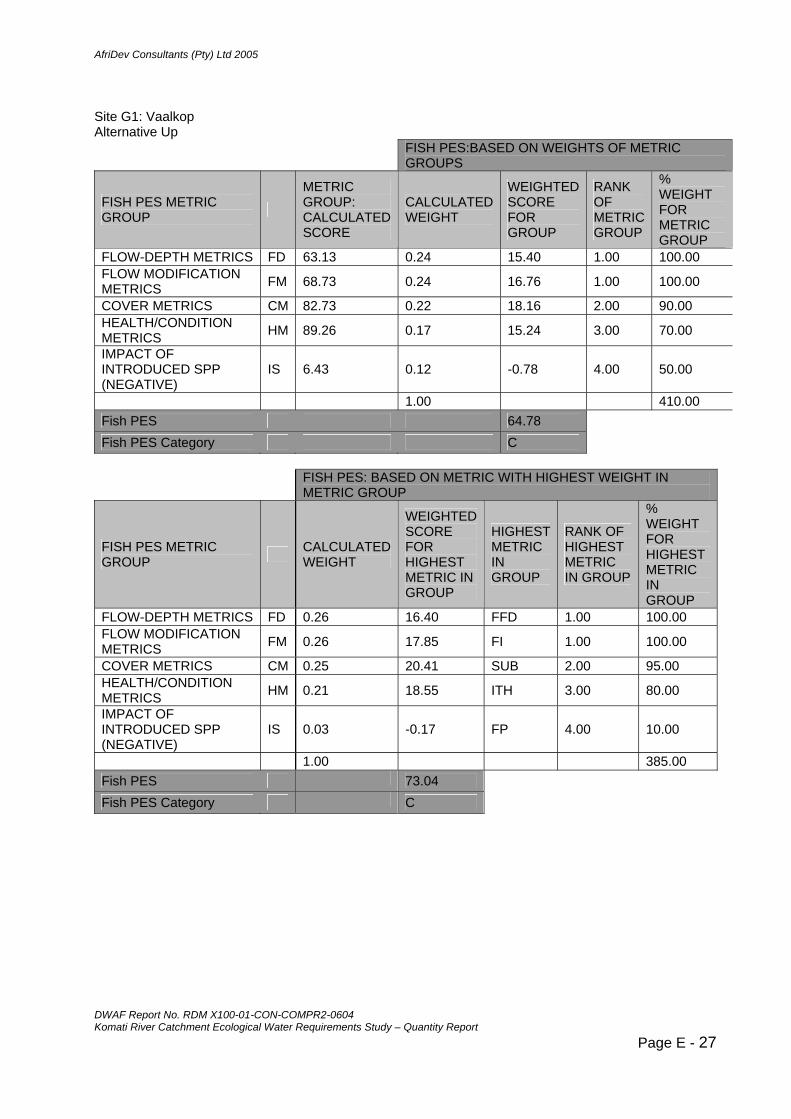
AfriDev Consultants (Pty) Ltd 2005
DWAF Report No. RDM X100-01-CON-COMPR2-0604 Komati River Catchment Ecological Water Requirements Study – Quantity Report
Page E - 27
Site G1: Vaalkop Alternative Up FISH PES:BASED ON WEIGHTS OF METRIC
GROUPS
FISH PES METRIC GROUP
METRIC GROUP: CALCULATED SCORE
CALCULATED WEIGHT
WEIGHTED SCORE FOR GROUP
RANK OF METRIC GROUP
% WEIGHT FOR METRIC GROUP
FLOW-DEPTH METRICS FD 63.13 0.24 15.40 1.00 100.00 FLOW MODIFICATION METRICS FM 68.73 0.24 16.76 1.00 100.00
COVER METRICS CM 82.73 0.22 18.16 2.00 90.00 HEALTH/CONDITION METRICS HM 89.26 0.17 15.24 3.00 70.00
IMPACT OF INTRODUCED SPP (NEGATIVE)
IS 6.43 0.12 -0.78 4.00 50.00
1.00 410.00 Fish PES 64.78 Fish PES Category C
FISH PES: BASED ON METRIC WITH HIGHEST WEIGHT IN
METRIC GROUP
FISH PES METRIC GROUP CALCULATED
WEIGHT
WEIGHTED SCORE FOR HIGHEST METRIC IN GROUP
HIGHEST METRIC IN GROUP
RANK OF HIGHEST METRIC IN GROUP
% WEIGHT FOR HIGHEST METRIC IN GROUP
FLOW-DEPTH METRICS FD 0.26 16.40 FFD 1.00 100.00 FLOW MODIFICATION METRICS FM 0.26 17.85 FI 1.00 100.00
COVER METRICS CM 0.25 20.41 SUB 2.00 95.00 HEALTH/CONDITION METRICS HM 0.21 18.55 ITH 3.00 80.00
IMPACT OF INTRODUCED SPP (NEGATIVE)
IS 0.03 -0.17 FP 4.00 10.00
1.00 385.00 Fish PES 73.04
Fish PES Category C

AfriDev Consultants (Pty) Ltd 2005
DWAF Report No. RDM X100-01-CON-COMPR2-0604 Komati River Catchment Ecological Water Requirements Study – Quantity Report
Page E - 28
Site T1 - Teespruit Alternative Up FISH PES:BASED ON WEIGHTS OF METRIC
GROUPS
FISH PES METRIC GROUP
METRIC GROUP: CALCULATED SCORE
CALCULATED WEIGHT
WEIGHTED SCORE FOR GROUP
RANK OF METRIC GROUP
% WEIGHT FOR METRIC GROUP
FLOW-DEPTH METRICS FD 86.88 0.28 24.13 1.00 100.00 FLOW MODIFICATION METRICS FM 78.87 0.28 21.91 1.00 100.00
COVER METRICS CM 87.88 0.25 21.97 2.00 90.00 HEALTH/CONDITION METRICS HM 89.63 0.19 17.43 3.00 70.00
IMPACT OF INTRODUCED SPP (NEGATIVE)
IS 0.00 0.00 0.00 0.00 0.00
1.00 360.00 Fish PES 85.44 Fish PES Category B
FISH PES: BASED ON METRIC WITH HIGHEST WEIGHT IN
METRIC GROUP
FISH PES METRIC GROUP CALCULATED
WEIGHT
WEIGHTED SCORE FOR HIGHEST METRIC IN GROUP
HIGHEST METRIC IN GROUP
RANK OF HIGHEST METRIC IN GROUP
% WEIGHT FOR HIGHEST METRIC IN GROUP
FLOW-DEPTH METRICS FD 0.26 22.56 FFD 1.00 100.00 FLOW MODIFICATION METRICS FM 0.26 20.49 FI 1.00 100.00
COVER METRICS CM 0.25 21.68 SUB 2.00 95.00 HEALTH/CONDITION METRICS HM 0.21 18.62 ITH 3.00 80.00
IMPACT OF INTRODUCED SPP (NEGATIVE)
IS 0.03 0.00 FP 4.00 10.00
1.00 385.00 Fish PES 83.36
Fish PES Category B
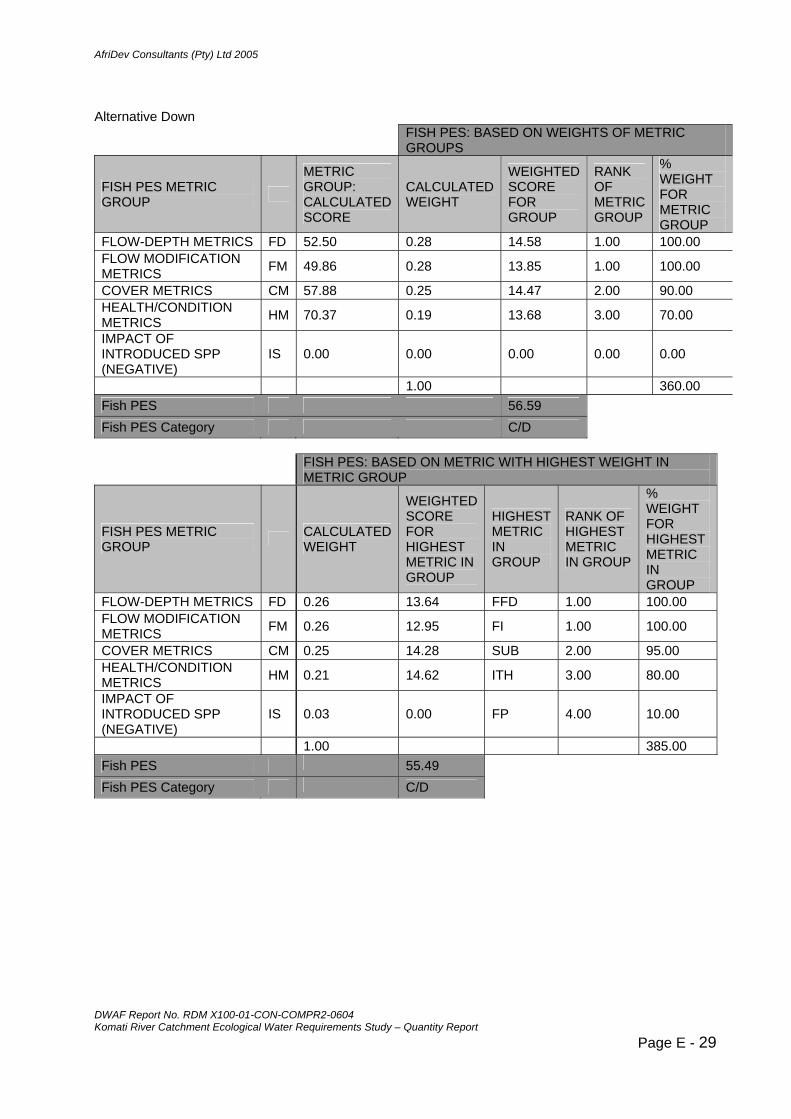
AfriDev Consultants (Pty) Ltd 2005
DWAF Report No. RDM X100-01-CON-COMPR2-0604 Komati River Catchment Ecological Water Requirements Study – Quantity Report
Page E - 29
Alternative Down FISH PES: BASED ON WEIGHTS OF METRIC
GROUPS
FISH PES METRIC GROUP
METRIC GROUP: CALCULATED SCORE
CALCULATED WEIGHT
WEIGHTED SCORE FOR GROUP
RANK OF METRIC GROUP
% WEIGHT FOR METRIC GROUP
FLOW-DEPTH METRICS FD 52.50 0.28 14.58 1.00 100.00 FLOW MODIFICATION METRICS FM 49.86 0.28 13.85 1.00 100.00
COVER METRICS CM 57.88 0.25 14.47 2.00 90.00 HEALTH/CONDITION METRICS HM 70.37 0.19 13.68 3.00 70.00
IMPACT OF INTRODUCED SPP (NEGATIVE)
IS 0.00 0.00 0.00 0.00 0.00
1.00 360.00 Fish PES 56.59 Fish PES Category C/D
FISH PES: BASED ON METRIC WITH HIGHEST WEIGHT IN
METRIC GROUP
FISH PES METRIC GROUP CALCULATED
WEIGHT
WEIGHTED SCORE FOR HIGHEST METRIC IN GROUP
HIGHEST METRIC IN GROUP
RANK OF HIGHEST METRIC IN GROUP
% WEIGHT FOR HIGHEST METRIC IN GROUP
FLOW-DEPTH METRICS FD 0.26 13.64 FFD 1.00 100.00 FLOW MODIFICATION METRICS FM 0.26 12.95 FI 1.00 100.00
COVER METRICS CM 0.25 14.28 SUB 2.00 95.00 HEALTH/CONDITION METRICS HM 0.21 14.62 ITH 3.00 80.00
IMPACT OF INTRODUCED SPP (NEGATIVE)
IS 0.03 0.00 FP 4.00 10.00
1.00 385.00 Fish PES 55.49
Fish PES Category C/D

AfriDev Consultants (Pty) Ltd 2005
DWAF Report No. RDM X100-01-CON-COMPR2-0604 Komati River Catchment Ecological Water Requirements Study – Quantity Report
Page E - 30
Site M1 – SILINGANI Alternative Up FISH PES:BASED ON WEIGHTS OF METRIC
GROUPS
FISH PES METRIC GROUP
METRIC GROUP: CALCULATED SCORE
CALCULATED WEIGHT
WEIGHTED SCORE FOR GROUP
RANK OF METRIC GROUP
% WEIGHT FOR METRIC GROUP
FLOW-DEPTH METRICS FD 85.63 0.26 22.53 1.00 100.00 FLOW MODIFICATION METRICS FM 84.23 0.26 22.16 1.00 100.00
COVER METRICS CM 82.12 0.24 19.45 2.00 90.00 HEALTH/CONDITION METRICS HM 90.74 0.24 21.49 2.00 90.00
IMPACT OF INTRODUCED SPP (NEGATIVE)
IS 0.00 0.00 0.00 3.00 0.00
1.00 380.00 Fish PES 85.64 Fish PES Category B
FISH PES: BASED ON METRIC WITH HIGHEST WEIGHT IN
METRIC GROUP
FISH PES METRIC GROUP CALCULATED
WEIGHT
WEIGHTED SCORE FOR HIGHEST METRIC IN GROUP
HIGHEST METRIC IN GROUP
RANK OF HIGHEST METRIC IN GROUP
% WEIGHT FOR HIGHEST METRIC IN GROUP
FLOW-DEPTH METRICS FD 0.26 22.24 FFD 1.00 100.00 FLOW MODIFICATION METRICS FM 0.26 21.88 FI 1.00 100.00
COVER METRICS CM 0.25 20.26 SUB 2.00 95.00 HEALTH/CONDITION METRICS HM 0.21 18.86 ITH 3.00 80.00
IMPACT OF INTRODUCED SPP (NEGATIVE)
IS 0.03 0.00 FP 4.00 10.00
1.00 385.00 Fish PES 83.24
Fish PES Category B
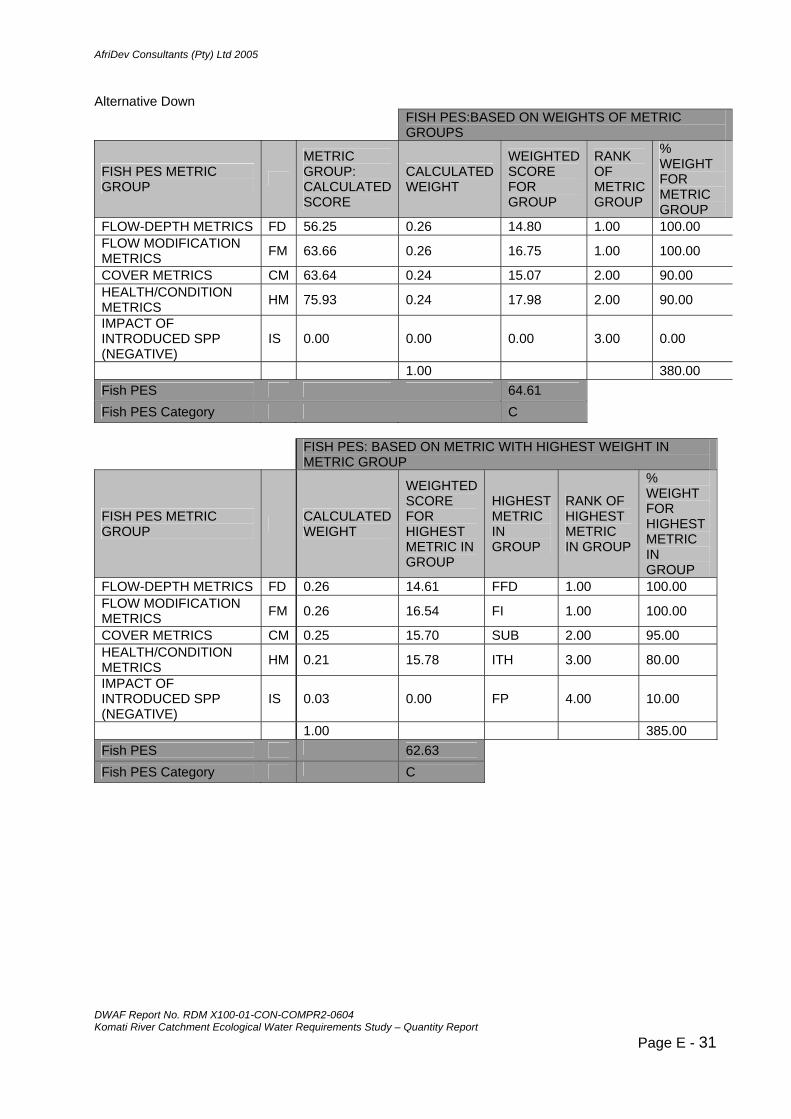
AfriDev Consultants (Pty) Ltd 2005
DWAF Report No. RDM X100-01-CON-COMPR2-0604 Komati River Catchment Ecological Water Requirements Study – Quantity Report
Page E - 31
Alternative Down FISH PES:BASED ON WEIGHTS OF METRIC
GROUPS
FISH PES METRIC GROUP
METRIC GROUP: CALCULATED SCORE
CALCULATED WEIGHT
WEIGHTED SCORE FOR GROUP
RANK OF METRIC GROUP
% WEIGHT FOR METRIC GROUP
FLOW-DEPTH METRICS FD 56.25 0.26 14.80 1.00 100.00 FLOW MODIFICATION METRICS FM 63.66 0.26 16.75 1.00 100.00
COVER METRICS CM 63.64 0.24 15.07 2.00 90.00 HEALTH/CONDITION METRICS HM 75.93 0.24 17.98 2.00 90.00
IMPACT OF INTRODUCED SPP (NEGATIVE)
IS 0.00 0.00 0.00 3.00 0.00
1.00 380.00 Fish PES 64.61 Fish PES Category C
FISH PES: BASED ON METRIC WITH HIGHEST WEIGHT IN
METRIC GROUP
FISH PES METRIC GROUP CALCULATED
WEIGHT
WEIGHTED SCORE FOR HIGHEST METRIC IN GROUP
HIGHEST METRIC IN GROUP
RANK OF HIGHEST METRIC IN GROUP
% WEIGHT FOR HIGHEST METRIC IN GROUP
FLOW-DEPTH METRICS FD 0.26 14.61 FFD 1.00 100.00 FLOW MODIFICATION METRICS FM 0.26 16.54 FI 1.00 100.00
COVER METRICS CM 0.25 15.70 SUB 2.00 95.00 HEALTH/CONDITION METRICS HM 0.21 15.78 ITH 3.00 80.00
IMPACT OF INTRODUCED SPP (NEGATIVE)
IS 0.03 0.00 FP 4.00 10.00
1.00 385.00 Fish PES 62.63
Fish PES Category C

AfriDev Consultants (Pty) Ltd 2005
Appendix F: Ecostatus Tables
Table of Contents 1. SITE K1 - GEVONDEN................................................................................................................. 2
1.1 HABITAT DRIVER CATEGORY ................................................................................................. 2 1.2 INSTREAM PRESENT ECOLOGICAL CONDITIONS ...................................................................... 2 1.3 SUMMARY OF ECOSTATUS ..................................................................................................... 2
2. SITE K2 - KROMDRAAI............................................................................................................... 3
2.1 HABITAT DRIVER CATEGORY ................................................................................................. 3 2.2 INSTREAM PRESENT ECOLOGICAL CONDITIONS ...................................................................... 3 2.3 SUMMARY OF ECOSTATUS ..................................................................................................... 3
3. SITE K3 - TONGA ........................................................................................................................ 4 3.1 HABITAT DRIVER CATEGORY ................................................................................................. 4 3.2 INSTREAM PRESENT ECOLOGICAL CONDITIONS ...................................................................... 4 3.3 SUMMARY OF ECOSTATUS ..................................................................................................... 4
4. SITE G1: VAALKOP .................................................................................................................... 5 4.1 HABITAT DRIVER CATEGORY ................................................................................................. 5 4.2 INSTREAM PRESENT ECOLOGICAL CONDITIONS ...................................................................... 5 4.3 SUMMARY OF ECOSTATUS ..................................................................................................... 5
5. SITE T1 - TEESPRUIT ................................................................................................................. 6 5.1 HABITAT DRIVER CATEGORY ................................................................................................. 6 5.2 INSTREAM PRESENT ECOLOGICAL CONDITIONS ...................................................................... 6 5.3 SUMMARY OF ECOSTATUS ..................................................................................................... 6
6. SITE L1 - KLEINDORINGKOP..................................................................................................... 7
6.1 HABITAT DRIVER CATEGORY ................................................................................................. 7 6.2 INSTREAM PRESENT ECOLOGICAL CONDITIONS ...................................................................... 7 6.3 SUMMARY OF ECOSTATUS ..................................................................................................... 7
7. SITE M1 - SILINGANI................................................................................................................... 8 7.1 HABITAT DRIVER CATEGORY ................................................................................................. 8 7.2 INSTREAM PRESENT ECOLOGICAL CONDITIONS ...................................................................... 8 7.3 SUMMARY OF ECOSTATUS ..................................................................................................... 8
DWAF Report No. RDM X100-01-CON-COMPR2-0604 Komati River Catchment Ecological Water Requirements Study – Quantity Report
Page F - 1

AfriDev Consultants (Pty) Ltd 2005
1. SITE K1 - GEVONDEN
1.1 HABITAT DRIVER CATEGORY
COMPONENTS Unweighted driver score Weight
Weighted driver score
GEOMORPHOLOGY 68.00 0.30 20.09
HYDROLOGY 67.80 0.55 37.59WATER QUALITY 83.00 0.15 12.47
Weighted driver status (%) 1.00 70.15
Unweighted driver status (%) 72.93
HABITAT DRIVER CATEGORY C C
1.2 INSTREAM PRESENT ECOLOGICAL CONDITIONS Criteria rating (0=low, 5=high)
Confidence Rating Ave Weight PES CategoryAvailability of high confidence fish information 4Diversity of fish species with different flow requirements 4Diversity of fish species with a preference for different cover types 4Diversity of fish species with a preference for different flow depth classes 3Diversity of fish species with various tolerances to modified water quality 4 3.75 0.484 81.0 B/CAvailability of high confidence invertebrate information 2Diversity of invertebrate biotopes 4Diversity of invertebrate taxa with different velocity requirements 4Diversity of invertebrate taxa with different tolerances to modified water quality 4 4 0.516 85.6 B
7.75 1 83.4 B
1.3 SUMMARY OF ECOSTATUS Separating out the proportions for Driver : Response Rating (0=low, 5=high)
Response Score Ave WeightInstream Response questionsWhat is the general level of sensitivity to modified water quality 4Fish: What is the general level of trophic specialisation 4What is the general level of habitat specialisation 4What is the general level of flow intolerance 4 4 0.62Habitat Driver QuestionsHow sensitive is channel type to change in geomorphological drivers? 2How sensitive are hydraulic habitats to flow change? 3How sensitive is water quality to flow change? 2.5 2.5 0.38
Total 6.50 1PES Category
INSTREAM CATEGORY 83.39 BDRIVER CATEGORY 70.1 C
ECOSTATUS 78.29 B/C
DWAF Report No. RDM X100-01-CON-COMPR2-0604 Komati River Catchment Ecological Water Requirements Study – Quantity Report
Page F - 2

AfriDev Consultants (Pty) Ltd 2005
2. SITE K2 - KROMDRAAI
2.1 HABITAT DRIVER CATEGORY
COMPONENTS Unweighted driver score Weight
Weighted driver score
GEOMORPHOLOGY 66.00 0.29 18.83
HYDROLOGY 60.26 0.54 32.39WATER QUALITY 80.00 0.18 14.18
Weighted driver status (%) 1.00 65.39
Unweighted driver status (%) 68.75
HABITAT DRIVER CATEGORY C C
2.2 INSTREAM PRESENT ECOLOGICAL CONDITIONS
Criteria rating (0=low, 5=high)Confidence Rating Ave Weight PES Category
Availability of high confidence fish information 41 Diversity of fish species with different flow requirements 52 Diversity of fish species with a preference for different cover types 43 Diversity of fish species with a preference for different flow depth classes 44 Diversity of fish species with various tolerances to modified water quality 4 4.25 0.515 81.4 B/C
Availability of high confidence invertebrate information 35 Diversity of invertebrate biotopes 46 Diversity of invertebrate taxa with different velocity requirements 47 Diversity of invertebrate taxa with different tolerances to modified water quality 4 4 0.485 77.3 C
8.25 1 79.4 B/C
2.3 SUMMARY OF ECOSTATUS Separating out the proportions for Driver : Response Rating (0=low, 5=high)
Response Score Ave WeightInstream Response questionsWhat is the general level of sensitivity to modified water quality 4Fish: What is the general level of trophic specialisation 4What is the general level of habitat specialisation 4What is the general level of flow intolerance 4 4 0.56Habitat Driver QuestionsHow sensitive is channel type to change in geomorphological drivers? 2.5How sensitive are hydraulic habitats to flow change? 4How sensitive is water quality to flow change? 3 3.17 0.44
Total 7.17 1PES Category
INSTREAM CATEGORY 79.41 CDRIVER CATEGORY 65.4 C
ECOSTATUS 73.22 C
DWAF Report No. RDM X100-01-CON-COMPR2-0604 Komati River Catchment Ecological Water Requirements Study – Quantity Report
Page F - 3

AfriDev Consultants (Pty) Ltd 2005
3. SITE K3 - TONGA
3.1 HABITAT DRIVER CATEGORY
COMPONENTS Unweighted driver score Weight
Weighted driver score
GEOMORPHOLOGY 40.00 0.24 9.43
HYDROLOGY 28.84 0.47 13.54WATER QUALITY 46.00 0.29 13.56
Weighted driver status (%) 1.00 36.53
Unweighted driver status (%) 38.28
HABITAT DRIVER CATEGORY E E
3.2 INSTREAM PRESENT ECOLOGICAL CONDITIONS Criteria rating (0=low, 5=high)
Confidence Rating Ave Weight PES CategoryAvailability of high confidence fish information 5Diversity of fish species with different flow requirements 3.5Diversity of fish species with a preference for different cover types 4Diversity of fish species with a preference for different flow depth classes 4Diversity of fish species with various tolerances to modified water quality 3 3.625 0.509 21.0 EAvailability of high confidence invertebrate information 5Diversity of invertebrate biotopes 3Diversity of invertebrate taxa with different velocity requirements 3.5Diversity of invertebrate taxa with different tolerances to modified water quality 4 3.5 0.491 29.5 E
7.125 1 25.2 E
3.3 SUMMARY OF ECOSTATUS Separating out the proportions for Driver : Response Rating (0=low, 5=high)
Response Score Ave WeightInstream Response questionsWhat is the general level of sensitivity to modified water quality 3.5Fish: What is the general level of trophic specialisation 4What is the general level of habitat specialisation 3.5What is the general level of flow intolerance 4 3.75 0.57Habitat Driver QuestionsHow sensitive is channel type to change in geomorphological drivers? 3How sensitive are hydraulic habitats to flow change? 2.5How sensitive is water quality to flow change? 3 2.83 0.43
Total 6.58 1PES Category
INSTREAM CATEGORY 25.18 EDRIVER CATEGORY 36.5 E
ECOSTATUS 30.07 E
DWAF Report No. RDM X100-01-CON-COMPR2-0604 Komati River Catchment Ecological Water Requirements Study – Quantity Report
Page F - 4
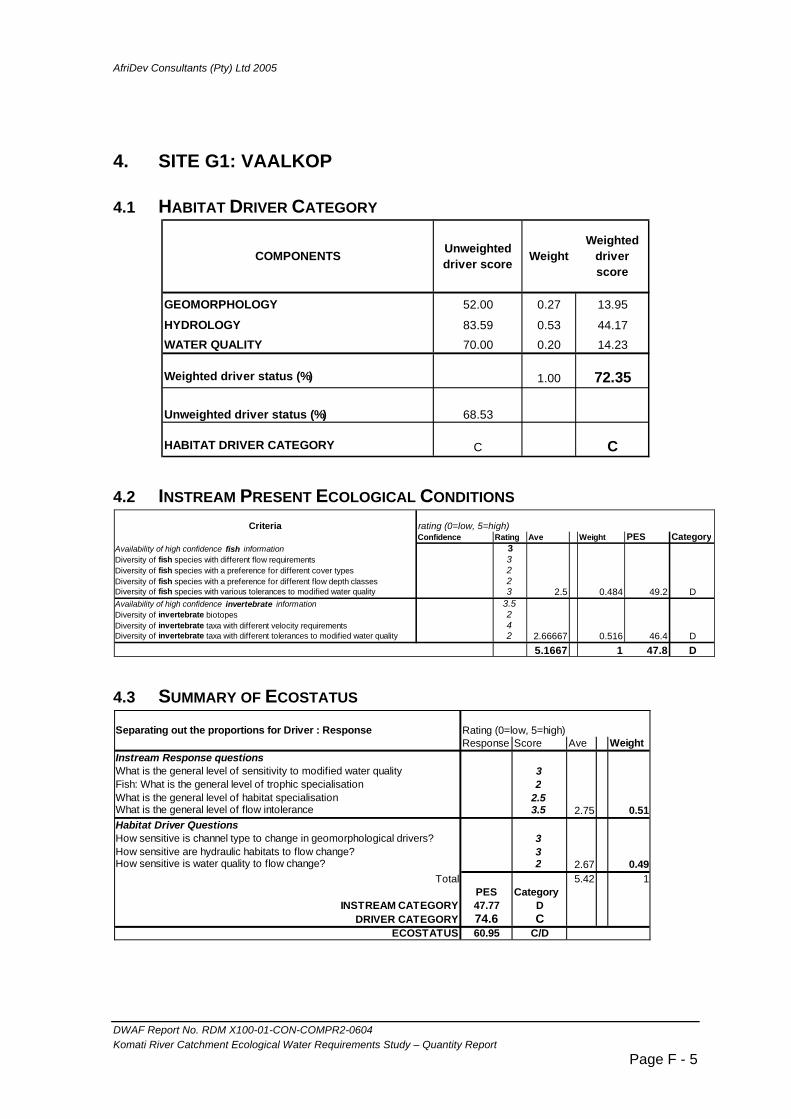
AfriDev Consultants (Pty) Ltd 2005
4. SITE G1: VAALKOP
4.1 HABITAT DRIVER CATEGORY
COMPONENTS Unweighted driver score Weight
Weighted driver score
GEOMORPHOLOGY 52.00 0.27 13.95
HYDROLOGY 83.59 0.53 44.17WATER QUALITY 70.00 0.20 14.23
Weighted driver status (%) 1.00 72.35
Unweighted driver status (%) 68.53
HABITAT DRIVER CATEGORY C C
4.2 INSTREAM PRESENT ECOLOGICAL CONDITIONS Criteria rating (0=low, 5=high)
Confidence Rating Ave Weight PES CategoryAvailability of high confidence fish information 3Diversity of fish species with different flow requirements 3Diversity of fish species with a preference for different cover types 2Diversity of fish species with a preference for different flow depth classes 2Diversity of fish species with various tolerances to modified water quality 3 2.5 0.484 49.2 DAvailability of high confidence invertebrate information 3.5Diversity of invertebrate biotopes 2Diversity of invertebrate taxa with different velocity requirements 4Diversity of invertebrate taxa with different tolerances to modified water quality 2 2.66667 0.516 46.4 D
5.1667 1 47.8 D
4.3 SUMMARY OF ECOSTATUS Separating out the proportions for Driver : Response Rating (0=low, 5=high)
Response Score Ave WeightInstream Response questionsWhat is the general level of sensitivity to modified water quality 3Fish: What is the general level of trophic specialisation 2What is the general level of habitat specialisation 2.5What is the general level of flow intolerance 3.5 2.75 0.51Habitat Driver QuestionsHow sensitive is channel type to change in geomorphological drivers? 3How sensitive are hydraulic habitats to flow change? 3How sensitive is water quality to flow change? 2 2.67 0.49
Total 5.42 1PES Category
INSTREAM CATEGORY 47.77 DDRIVER CATEGORY 74.6 C
ECOSTATUS 60.95 C/D
DWAF Report No. RDM X100-01-CON-COMPR2-0604 Komati River Catchment Ecological Water Requirements Study – Quantity Report
Page F - 5
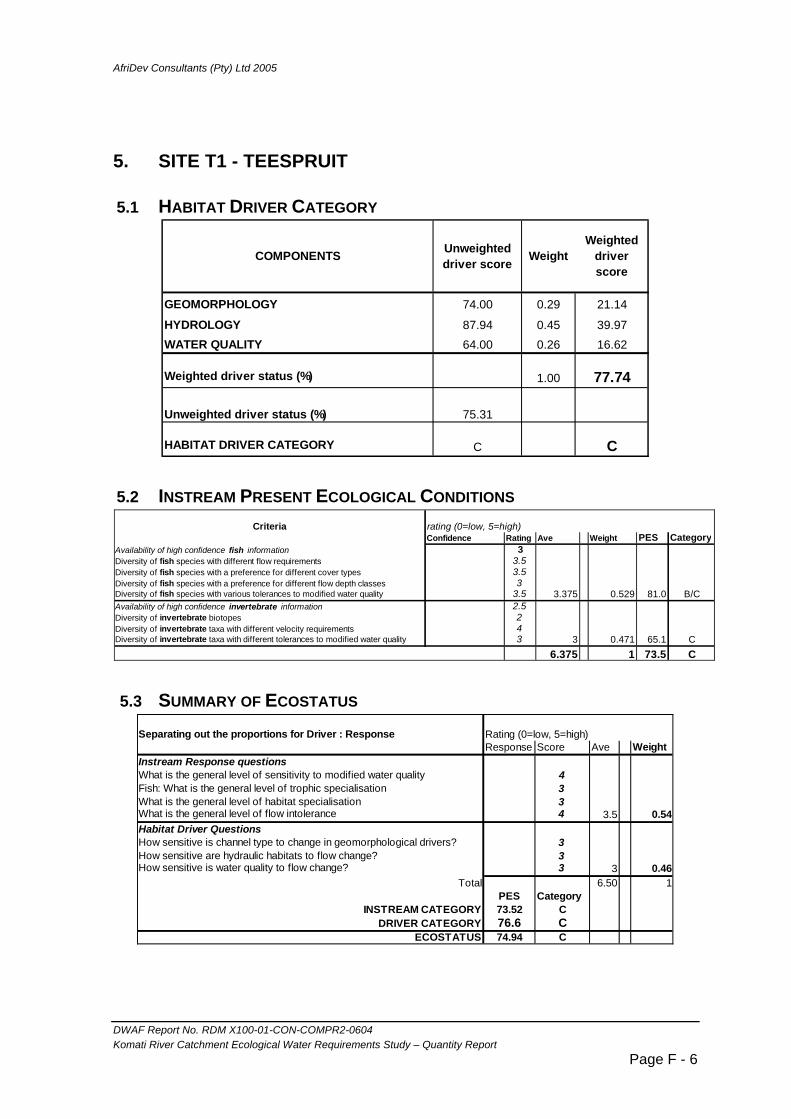
AfriDev Consultants (Pty) Ltd 2005
5. SITE T1 - TEESPRUIT
5.1 HABITAT DRIVER CATEGORY
COMPONENTS Unweighted driver score Weight
Weighted driver score
GEOMORPHOLOGY 74.00 0.29 21.14
HYDROLOGY 87.94 0.45 39.97WATER QUALITY 64.00 0.26 16.62
Weighted driver status (%) 1.00 77.74
Unweighted driver status (%) 75.31
HABITAT DRIVER CATEGORY C C
5.2 INSTREAM PRESENT ECOLOGICAL CONDITIONS Criteria rating (0=low, 5=high)
Confidence Rating Ave Weight PES CategoryAvailability of high confidence fish information 3Diversity of fish species with different flow requirements 3.5Diversity of fish species with a preference for different cover types 3.5Diversity of fish species with a preference for different flow depth classes 3Diversity of fish species with various tolerances to modified water quality 3.5 3.375 0.529 81.0 B/CAvailability of high confidence invertebrate information 2.5Diversity of invertebrate biotopes 2Diversity of invertebrate taxa with different velocity requirements 4Diversity of invertebrate taxa with different tolerances to modified water quality 3 3 0.471 65.1 C
6.375 1 73.5 C
5.3 SUMMARY OF ECOSTATUS Separating out the proportions for Driver : Response Rating (0=low, 5=high)
Response Score Ave WeightInstream Response questionsWhat is the general level of sensitivity to modified water quality 4Fish: What is the general level of trophic specialisation 3What is the general level of habitat specialisation 3What is the general level of flow intolerance 4 3.5 0.54Habitat Driver QuestionsHow sensitive is channel type to change in geomorphological drivers? 3How sensitive are hydraulic habitats to flow change? 3How sensitive is water quality to flow change? 3 3 0.46
Total 6.50 1PES Category
INSTREAM CATEGORY 73.52 CDRIVER CATEGORY 76.6 C
ECOSTATUS 74.94 C
DWAF Report No. RDM X100-01-CON-COMPR2-0604 Komati River Catchment Ecological Water Requirements Study – Quantity Report
Page F - 6
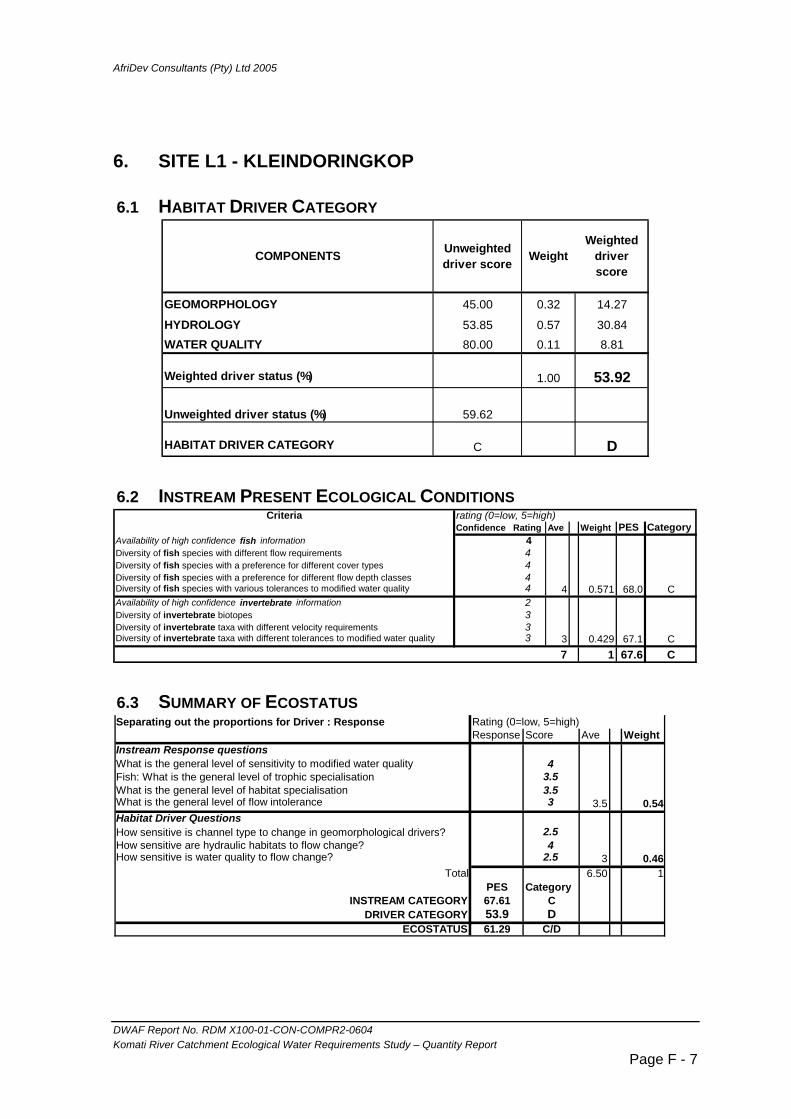
AfriDev Consultants (Pty) Ltd 2005
6. SITE L1 - KLEINDORINGKOP
6.1 HABITAT DRIVER CATEGORY
COMPONENTS Unweighted driver score Weight
Weighted driver score
GEOMORPHOLOGY 45.00 0.32 14.27
HYDROLOGY 53.85 0.57 30.84WATER QUALITY 80.00 0.11 8.81
Weighted driver status (%) 1.00 53.92
Unweighted driver status (%) 59.62
HABITAT DRIVER CATEGORY C D
6.2 INSTREAM PRESENT ECOLOGICAL CONDITIONS Criteria rating (0=low, 5=high)
Confidence Rating Ave Weight PES CategoryAvailability of high confidence fish information 4Diversity of fish species with different flow requirements 4Diversity of fish species with a preference for different cover types 4Diversity of fish species with a preference for different flow depth classes 4Diversity of fish species with various tolerances to modified water quality 4 4 0.571 68.0 CAvailability of high confidence invertebrate information 2Diversity of invertebrate biotopes 3Diversity of invertebrate taxa with different velocity requirements 3Diversity of invertebrate taxa with different tolerances to modified water quality 3 3 0.429 67.1 C
7 1 67.6 C
6.3 SUMMARY OF ECOSTATUS Separating out the proportions for Driver : Response Rating (0=low, 5=high)
Response Score Ave WeightInstream Response questionsWhat is the general level of sensitivity to modified water quality 4Fish: What is the general level of trophic specialisation 3.5What is the general level of habitat specialisation 3.5What is the general level of flow intolerance 3 3.5 0.54Habitat Driver QuestionsHow sensitive is channel type to change in geomorphological drivers? 2.5How sensitive are hydraulic habitats to flow change? 4How sensitive is water quality to flow change? 2.5 3 0.46
Total 6.50 1PES Category
INSTREAM CATEGORY 67.61 CDRIVER CATEGORY 53.9 D
ECOSTATUS 61.29 C/D
DWAF Report No. RDM X100-01-CON-COMPR2-0604 Komati River Catchment Ecological Water Requirements Study – Quantity Report
Page F - 7
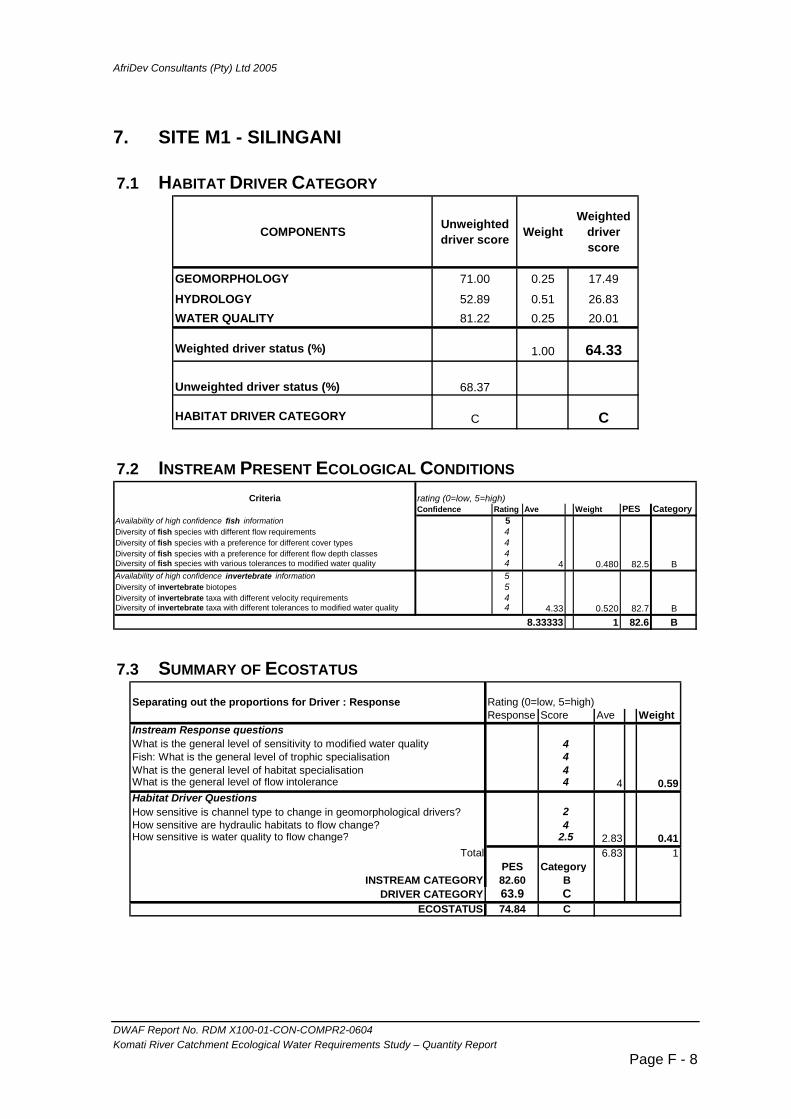
AfriDev Consultants (Pty) Ltd 2005
7. SITE M1 - SILINGANI
7.1 HABITAT DRIVER CATEGORY
COMPONENTS Unweighted driver score Weight
Weighted driver score
GEOMORPHOLOGY 71.00 0.25 17.49
HYDROLOGY 52.89 0.51 26.83WATER QUALITY 81.22 0.25 20.01
Weighted driver status (%) 1.00 64.33
Unweighted driver status (%) 68.37
HABITAT DRIVER CATEGORY C C
7.2 INSTREAM PRESENT ECOLOGICAL CONDITIONS Criteria rating (0=low, 5=high)
Confidence Rating Ave Weight PES CategoryAvailability of high confidence fish information 5Diversity of fish species with different flow requirements 4Diversity of fish species with a preference for different cover types 4Diversity of fish species with a preference for different flow depth classes 4Diversity of fish species with various tolerances to modified water quality 4 4 0.480 82.5 BAvailability of high confidence invertebrate information 5Diversity of invertebrate biotopes 5Diversity of invertebrate taxa with different velocity requirements 4Diversity of invertebrate taxa with different tolerances to modified water quality 4 4.33 0.520 82.7 B
8.33333 1 82.6 B
7.3 SUMMARY OF ECOSTATUS Separating out the proportions for Driver : Response Rating (0=low, 5=high)
Response Score Ave WeightInstream Response questionsWhat is the general level of sensitivity to modified water quality 4Fish: What is the general level of trophic specialisation 4What is the general level of habitat specialisation 4What is the general level of flow intolerance 4 4 0.59Habitat Driver QuestionsHow sensitive is channel type to change in geomorphological drivers? 2How sensitive are hydraulic habitats to flow change? 4How sensitive is water quality to flow change? 2.5 2.83 0.41
Total 6.83 1PES Category
INSTREAM CATEGORY 82.60 BDRIVER CATEGORY 63.9 C
ECOSTATUS 74.84 C
DWAF Report No. RDM X100-01-CON-COMPR2-0604 Komati River Catchment Ecological Water Requirements Study – Quantity Report
Page F - 8
AfriDev Consultants (Pty) Ltd 2005
Appendix G: Ecological Importance and Sensitivity
Table of Contents
1. FIGURE SUMMARY..................................................................................................................... 2
2. DETAILED EIS TABLE FOR EACH RESOURCE UNIT ............................................................. 3
DWAF Report No. RDM X100-01-CON-COMPR2-0604 Komati River Catchment Ecological Water Requirements Study – Quantity Report
Page G - 1

AfriDev Consultants (Pty) Ltd 2005
1. FIGURE SUMMARY
0
1
2
3
4
Rare & Endangered 0 0 4 4 4 4 4 3 4 3 4 4 4 4 4 4 4 0 4 4 4 0
Unique 0 0 4 4 4 4 4 2 4 2 2.5 2.5 4 4 4 3 1 1 2 2 3 1
Intolerant 2 2 4 2 3 3 3 2 2 1 4 4 4 4 3 4 3 3 4 4 4 4
Species/Taxon richness 1 1 4 2 4 3 4 2 4 2 3.5 3.5 3 3 3 3 3 1 3 3 2 2
Diversity of types 2 2 4 4 4 4 4 2 4 2 3 3 4 4 4 3 3 2 2 2 2 2
Refugia 2 2 3 3 3 3 4 3 4 3 2 3 3 3 4 3 1 1 2 2 1 1
Sensitivity to flow 2 2 3 3 3 3 3 3 2 1 2.5 2.5 4 4 2 3 3 2 3 3 3 3
Sensitivity to water quality 2 2 3 3 3 3 2 2 2 2 2.5 2.5 3 3 2 3 3 3 3 3 3 3
Migration 2 2 3 3 3 3 4 3 4 2 4 4 3 3 4 3 1 1 2 2 1 1
Conservation importance 0 1 0 2 0 4 0 0 0 0 0 1 0 4 0 0 0 0 0 0 0 0
MEDIAN 2 2 4 3 3 3 4 2 4 2 3 3 4 4 4 3 3 1 3 3 3 2
A B C D E Sw L M G T S
NATURAL
Very High
High
Moderate
Marginal
ECOLOGICAL IMPORTANCE AND SENSITIVITY PER RESOURCE UNIT
PRESENT DAY
Main Komati Tributaries
* Sw = Swaziland Site M1 Figure 1.1: A summary of the Ecological Importance and Sensitivity per resource unit and selected site for natural and present day conditions.
DWAF Report No. RDM X100-01-CON-COMPR2-0604 Komati River Catchment Ecological Water Requirements Study – Quantity Report
Page G - 2
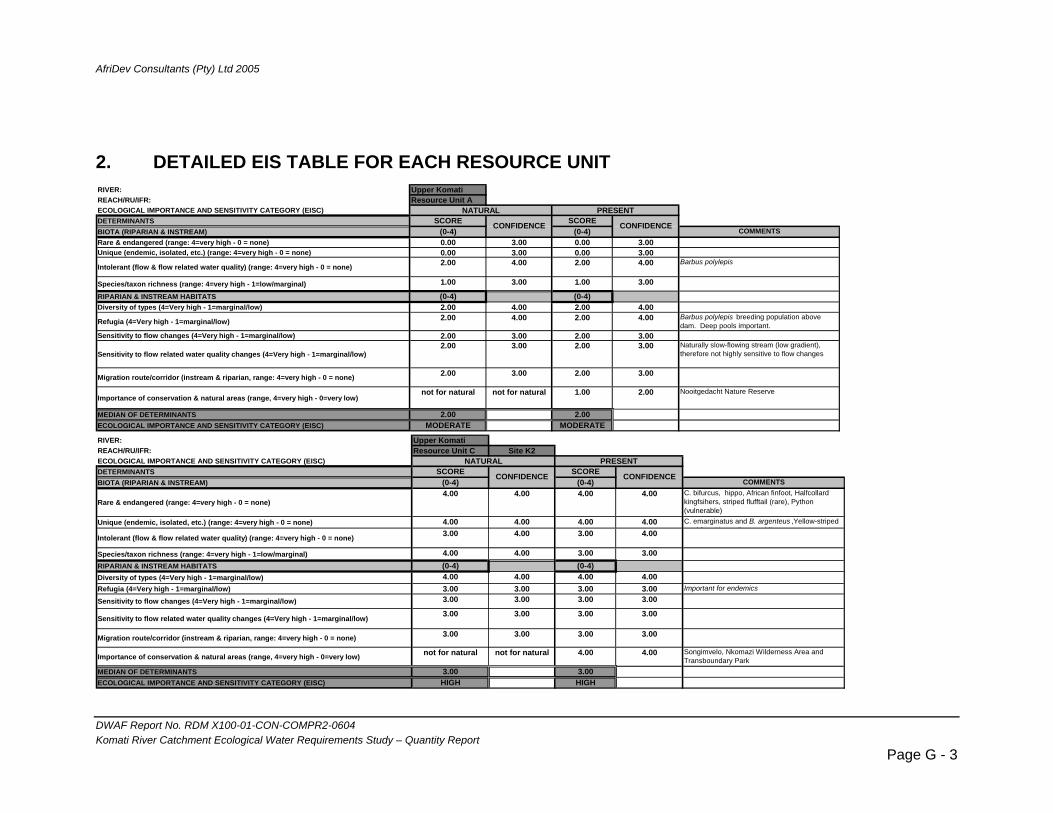
AfriDev Consultants (Pty) Ltd 2005
2. DETAILED EIS TABLE FOR EACH RESOURCE UNIT RIVER: Upper KomatiREACH/RU/IFR: Resource Unit AECOLOGICAL IMPORTANCE AND SENSITIVITY CATEGORY (EISC)DETERMINANTS SCORE SCOREBIOTA (RIPARIAN & INSTREAM) (0-4) (0-4) COMMENTSRare & endangered (range: 4=very high - 0 = none) 0.00 3.00 0.00 3.00 Unique (endemic, isolated, etc.) (range: 4=very high - 0 = none) 0.00 3.00 0.00 3.00
Intolerant (flow & flow related water quality) (range: 4=very high - 0 = none) 2.00 4.00 2.00 4.00 Barbus polylepis
Species/taxon richness (range: 4=very high - 1=low/marginal) 1.00 3.00 1.00 3.00
RIPARIAN & INSTREAM HABITATS (0-4) (0-4)Diversity of types (4=Very high - 1=marginal/low) 2.00 4.00 2.00 4.00
Refugia (4=Very high - 1=marginal/low) 2.00 4.00 2.00 4.00 Barbus polylepis breeding population above dam. Deep pools important.
Sensitivity to flow changes (4=Very high - 1=marginal/low) 2.00 3.00 2.00 3.00
Sensitivity to flow related water quality changes (4=Very high - 1=marginal/low)2.00 3.00 2.00 3.00 Naturally slow-flowing stream (low gradient),
therefore not highly sensitive to flow changes
Migration route/corridor (instream & riparian, range: 4=very high - 0 = none) 2.00 3.00 2.00 3.00
Importance of conservation & natural areas (range, 4=very high - 0=very low)not for natural not for natural 1.00 2.00 Nooitgedacht Nature Reserve
MEDIAN OF DETERMINANTS 2.00 2.00ECOLOGICAL IMPORTANCE AND SENSITIVITY CATEGORY (EISC) MODERATE MODERATE
NATURAL PRESENT
CONFIDENCE CONFIDENCE
RIVER: Upper KomatiREACH/RU/IFR: Resource Unit C Site K2ECOLOGICAL IMPORTANCE AND SENSITIVITY CATEGORY (EISC)DETERMINANTS SCORE SCOREBIOTA (RIPARIAN & INSTREAM) (0-4) (0-4) COMMENTS
Rare & endangered (range: 4=very high - 0 = none)4.00 4.00 4.00 4.00 C. bifurcus, hippo, African finfoot, Halfcollard
kingfsihers, striped flufftail (rare), Python (vulnerable)
Unique (endemic, isolated, etc.) (range: 4=very high - 0 = none) 4.00 4.00 4.00 4.00 C. emarginatus and B. argenteus ,Yellow-striped d f H li idi
Intolerant (flow & flow related water quality) (range: 4=very high - 0 = none) 3.00 4.00 3.00 4.00
Species/taxon richness (range: 4=very high - 1=low/marginal) 4.00 4.00 3.00 3.00
RIPARIAN & INSTREAM HABITATS (0-4) (0-4)Diversity of types (4=Very high - 1=marginal/low) 4.00 4.00 4.00 4.00Refugia (4=Very high - 1=marginal/low) 3.00 3.00 3.00 3.00 Important for endemics
Sensitivity to flow changes (4=Very high - 1=marginal/low) 3.00 3.00 3.00 3.00
Sensitivity to flow related water quality changes (4=Very high - 1=marginal/low) 3.00 3.00 3.00 3.00
Migration route/corridor (instream & riparian, range: 4=very high - 0 = none) 3.00 3.00 3.00 3.00
Importance of conservation & natural areas (range, 4=very high - 0=very low) not for natural not for natural 4.00 4.00 Songimvelo, Nkomazi Wilderness Area and Transboundary Park
MEDIAN OF DETERMINANTS 3.00 3.00ECOLOGICAL IMPORTANCE AND SENSITIVITY CATEGORY (EISC) HIGH HIGH
NATURAL PRESENT
CONFIDENCE CONFIDENCE
DWAF Report No. RDM X100-01-CON-COMPR2-0604 Komati River Catchment Ecological Water Requirements Study – Quantity Report
Page G - 3

AfriDev Consultants (Pty) Ltd 2005
RIVER: Lower KomatiREACH/RU/IFR: Resource Unit D Site K3ECOLOGICAL IMPORTANCE AND SENSITIVITY CATEGORY (EISC)DETERMINANTS SCORE SCOREBIOTA (RIPARIAN & INSTREAM) (0-4) (0-4) COMMENTS
Rare & endangered (range: 4=very high - 0 = none)
4.00 4.00 3.00 4.00 Black coucal (indeterminate), Little Bitten (rare), Bitten (vulnerable), Opsaridium perengueyi , hippo, crocs, White crowned plover (rare)
Unique (endemic, isolated, etc.) (range: 4=very high - 0 = none) 4.00 4.00 2.00 3.00 Macrobrachium, Machadorythus mayfly, tigerfish (historically)
Intolerant (flow & flow related water quality) (range: 4=very high - 0 = none) 3.00 4.00 2.00 3.00 Chiloglanis pretoriae, Opsaridium
Species/taxon richness (range: 4=very high - 1=low/marginal) 4.00 4.00 2.00 3.00 about 27 species of fishRIPARIAN & INSTREAM HABITATS (0-4) (0-4)Diversity of types (4=Very high - 1=marginal/low) 4.00 4.00 2.00 3.00Refugia (4=Very high - 1=marginal/low) 4.00 3.00 3.00 3.00
Sensitivity to flow changes (4=Very high - 1=marginal/low) 3.00 3.00 2.00 3.00
Sensitivity to flow related water quality changes (4=Very high - 1=marginal/low)2.00 3.00 2.00 3.00
Migration route/corridor (instream & riparian, range: 4=very high - 0 = none) 4.00 4.00 3.00 3.00 Eels, Macrobracium and local breeding migrations of fish and birds
Importance of conservation & natural areas (range, 4=very high - 0=very low)not for natural not for natural 0.00 4.00
MEDIAN OF DETERMINANTS 4.00 2.00ECOLOGICAL IMPORTANCE AND SENSITIVITY CATEGORY (EISC) VERY HIGH MODERATE
NATURAL PRESENT
CONFIDENCE CONFIDENCE
RIVER: SwazilandREACH/RU/IFR: N/AECOLOGICAL IMPORTANCE AND SENSITIVITY CATEGORY (EISC)DETERMINANTS SCORE SCOREBIOTA (RIPARIAN & INSTREAM) (0-4) (0-4) COMMENTSRare & endangered (range: 4=very high - 0 = none) 4.00 4.00 4.00 4.00 Opsaridium, Unique (endemic, isolated, etc.) (range: 4=very high - 0 = none) 2.50 4.00 2.50 4.00 Simulium lumbwanum, Sagitaria
Intolerant (flow & flow related water quality) (range: 4=very high - 0 = none) 4.00 4.00 4.00 4.00 Chiloglanis, Opsaridium, Amphilius, B. eutenea
Species/taxon richness (range: 4=very high - 1=low/marginal) 3.50 4.00 3.50 4.00RIPARIAN & INSTREAM HABITATS (0-4) (0-4)Diversity of types (4=Very high - 1=marginal/low) 3.00 4.00 3.00 4.00Refugia (4=Very high - 1=marginal/low) 2.00 4.00 3.00 4.00Sensitivity to flow changes (4=Very high - 1=marginal/low) 2.50 4.00 2.50 4.00
Sensitivity to flow related water quality changes (4=Very high - 1=marginal/low)2.50 4.00 2.50 4.00
Migration route/corridor (instream & riparian, range: 4=very high - 0 = none) 4.00 4.00 4.00 4.00 Eels, birds, Labeo, yellowfish - link lowveld to highveld
Importance of conservation & natural areas (range, 4=very high - 0=very low) not for natural not for natural 1.00 4.00
MEDIAN OF DETERMINANTS 3.00 3.00ECOLOGICAL IMPORTANCE AND SENSITIVITY CATEGORY (EISC) HIGH HIGH
NATURAL PRESENT
CONFIDENCE CONFIDENCE
DWAF Report No. RDM X100-01-CON-COMPR2-0604 Komati River Catchment Ecological Water Requirements Study – Quantity Report
Page G - 4

AfriDev Consultants (Pty) Ltd 2005
RIVER: Upper LomatiREACH/RU/IFR: Resource Unit LECOLOGICAL IMPORTANCE AND SENSITIVITY CATEGORY (EISC)DETERMINANTS SCORE SCOREBIOTA (RIPARIAN & INSTREAM) (0-4) (0-4) COMMENTS
Rare & endangered (range: 4=very high - 0 = none) 4.00 4.00 4.00 4.00 C. bifurcus, Dwarf Bitten, Laminate vlei rat, Python
Unique (endemic, isolated, etc.) (range: 4=very high - 0 = none) 4.00 4.00 4.00 4.00 B. brevipennis, Varicharinus, C. anoterus
Intolerant (flow & flow related water quality) (range: 4=very high - 0 = none)4.00 4.00 4.00 4.00 Chiloglanis, Amphilius, Varichanrinus
Species/taxon richness (range: 4=very high - 1=low/marginal) 3.00 3.00 3.00 3.00RIPARIAN & INSTREAM HABITATS (0-4) (0-4)Diversity of types (4=Very high - 1=marginal/low) 4.00 4.00 4.00 4.00Refugia (4=Very high - 1=marginal/low) 3.00 3.00 3.00 3.00Sensitivity to flow changes (4=Very high - 1=marginal/low) 4.00 3.00 4.00 3.00
Sensitivity to flow related water quality changes (4=Very high - 1=marginal/low) 3.00 3.00 3.00 3.00
Migration route/corridor (instream & riparian, range: 4=very high - 0 = none) 3.00 3.00 3.00 3.00 Eels (Anguila nebulosa )
Importance of conservation & natural areas (range, 4=very high - 0=very low)not for natural not for natural 4.00 4.00 Songimvelo - Barberton Mountainlands
MEDIAN OF DETERMINANTS 4.00 4.00ECOLOGICAL IMPORTANCE AND SENSITIVITY CATEGORY (EISC) VERY HIGH VERY HIGH
NATURAL PRESENT
CONFIDENCE CONFIDENCE
RIVER: Lower LomatiREACH/RU/IFR: Resource Unit M Site L1ECOLOGICAL IMPORTANCE AND SENSITIVITY CATEGORY (EISC)DETERMINANTS SCORE SCOREBIOTA (RIPARIAN & INSTREAM) (0-4) (0-4) COMMENTS
Rare & endangered (range: 4=very high - 0 = none) 4.00 4.00 4.00 4.00 Chetia brevis, Opsaridium, Finfoots, Halfcollard kingfisher, crocs, hippo
Unique (endemic, isolated, etc.) (range: 4=very high - 0 = none) 4.00 4.00 3.00 3.00 Tigerfish historically present, Machrobrachium, Anguilla nebulosa
Intolerant (flow & flow related water quality) (range: 4=very high - 0 = none) 3.00 2.00 4.00 4.00 Barbus utenia, Chiloglanis, Opsaridium
Species/taxon richness (range: 4=very high - 1=low/marginal) 3.00 4.00 3.00 4.00 About 15 species of fishRIPARIAN & INSTREAM HABITATS (0-4) (0-4)Diversity of types (4=Very high - 1=marginal/low) 4.00 4.00 3.00 4.00 Pools and rifflesRefugia (4=Very high - 1=marginal/low) 4.00 3.00 3.00 3.00 Tigerfish
Sensitivity to flow changes (4=Very high - 1=marginal/low) 2.00 3.00 3.50 3.00 Increased because of high releases from Driekoppies
Sensitivity to flow related water quality changes (4=Very high - 1=marginal/low)2.00 3.00 3.00 3.00
Migration route/corridor (instream & riparian, range: 4=very high - 0 = none) 4.00 4.00 3.00 3.00 Eels, tigerfish, Labeo rossae
Importance of conservation & natural areas (range, 4=very high - 0=very low)not for natural not for natural 0.00 4.00
MEDIAN OF DETERMINANTS 4.00 3.00ECOLOGICAL IMPORTANCE AND SENSITIVITY CATEGORY (EISC) VERY HIGH HIGH
NATURAL PRESENT
CONFIDENCE CONFIDENCE
DWAF Report No. RDM X100-01-CON-COMPR2-0604 Komati River Catchment Ecological Water Requirements Study – Quantity Report
Page G - 5

AfriDev Consultants (Pty) Ltd 2005
RIVER: GladdespruitREACH/RU/IFR: Resource Unit G Site G1ECOLOGICAL IMPORTANCE AND SENSITIVITY CATEGORY (EISC)DETERMINANTS SCORE SCOREBIOTA (RIPARIAN & INSTREAM) (0-4) (0-4) COMMENTSRare & endangered (range: 4=very high - 0 = none) 4.00 4.00 0.00 4.00 Chiloglanis emerginatus - historica recordUnique (endemic, isolated, etc.) (range: 4=very high - 0 = none) 1.00 3.00 1.00 3.00
Intolerant (flow & flow related water quality) (range: 4=very high - 0 = none)3.00 4.00 3.00 4.00 Chiloglanis pretoriensis, Uranoscopus
Species/taxon richness (range: 4=very high - 1=low/marginal) 3.00 3.00 1.00 3.00 About 5spp of fishRIPARIAN & INSTREAM HABITATS (0-4) (0-4)Diversity of types (4=Very high - 1=marginal/low) 3.00 3.00 2.00 3.00 SedimentationRefugia (4=Very high - 1=marginal/low) 1.00 2.00 1.00 2.00Sensitivity to flow changes (4=Very high - 1=marginal/low) 3.00 3.00 3.00 2.00
Sensitivity to flow related water quality changes (4=Very high - 1=marginal/low)3.00 3.00 3.00 2.00
Migration route/corridor (instream & riparian, range: 4=very high - 0 = none)1.00 3.00 1.00 3.00
Importance of conservation & natural areas (range, 4=very high - 0=very low) not for natural not for natural 0.00 4.00
MEDIAN OF DETERMINANTS 3.00 1.00ECOLOGICAL IMPORTANCE AND SENSITIVITY CATEGORY (EISC) HIGH LOW
PRESENT
CONFIDENCE CONFIDENCE
NATURAL
RIVER: TeespruitREACH/RU/IFR: Resource Unit T Site T1ECOLOGICAL IMPORTANCE AND SENSITIVITY CATEGORY (EISC)DETERMINANTS SCORE SCOREBIOTA (RIPARIAN & INSTREAM) (0-4) (0-4) COMMENTSRare & endangered (range: 4=very high - 0 = none) 4.00 4.00 4.00 4.00 C. emarginatusUnique (endemic, isolated, etc.) (range: 4=very high - 0 = none) 2.00 3.00 2.00 1.00 Damselfly (Pseudagrion inopinatum )
Intolerant (flow & flow related water quality) (range: 4=very high - 0 = none) 4.00 4.00 4.00 4.00 Chiloglanis and Amphilius uranoscopus
Species/taxon richness (range: 4=very high - 1=low/marginal) 3.00 3.00 3.00 3.00
RIPARIAN & INSTREAM HABITATS (0-4) (0-4)Diversity of types (4=Very high - 1=marginal/low) 2.00 3.00 2.00 3.00 Bedrock dominated
Refugia (4=Very high - 1=marginal/low) 2.00 3.00 2.00 3.00Sensitivity to flow changes (4=Very high - 1=marginal/low) 3.00 3.00 3.00 3.00
Sensitivity to flow related water quality changes (4=Very high - 1=marginal/low)3.00 3.00 3.00 3.00
Migration route/corridor (instream & riparian, range: 4=very high - 0 = none)2.00 2.00 2.00 3.00 Eels
Importance of conservation & natural areas (range, 4=very high - 0=very low)not for natural not for natural 0.00 4.00
MEDIAN OF DETERMINANTS 3.00 2.50ECOLOGICAL IMPORTANCE AND SENSITIVITY CATEGORY (EISC) HIGH HIGH
NATURAL PRESENT
CONFIDENCE CONFIDENCE
DWAF Report No. RDM X100-01-CON-COMPR2-0604 Komati River Catchment Ecological Water Requirements Study – Quantity Report
Page G - 6

AfriDev Consultants (Pty) Ltd 2005
RIVER: SeekoeispruitREACH/RU/IFR: Resource Unit SECOLOGICAL IMPORTANCE AND SENSITIVITY CATEGORY (EISC)DETERMINANTS SCORE SCOREBIOTA (RIPARIAN & INSTREAM) (0-4) (0-4) COMMENTSRare & endangered (range: 4=very high - 0 = none) 4.00 2.00 0.00 4.00 C. emarginatus historically??
Unique (endemic, isolated, etc.) (range: 4=very high - 0 = none)3.00 2.00 2.00 3.00 Warmwater springs (Badplaas) with unique
fauna. Rare damselfly (Pseudagrion inopinatum)
Intolerant (flow & flow related water quality) (range: 4=very high - 0 = none)4.00 4.00 4.00 4.00 Chiloglanis and Amphilius uranoscopus
Species/taxon richness (range: 4=very high - 1=low/marginal) 2.00 3.00 2.00 3.00 Aboout 5 spp of fish RIPARIAN & INSTREAM HABITATS (0-4) (0-4)Diversity of types (4=Very high - 1=marginal/low) 2.00 4.00 2.00 4.00 Bedrock dominatedRefugia (4=Very high - 1=marginal/low) 1.00 2.00 1.00 2.00Sensitivity to flow changes (4=Very high - 1=marginal/low) 3.00 3.00 3.00 3.00Sensitivity to flow related water quality changes (4=Very high - 1=marginal/low) 3.00 2.00 3.00 3.00
Migration route/corridor (instream & riparian, range: 4=very high - 0 = none) 1.00 3.00 1.00 3.00 Eels
Importance of conservation & natural areas (range, 4=very high - 0=very low)not for natural not for natural 0.00 4.00
MEDIAN OF DETERMINANTS 3.00 2.00ECOLOGICAL IMPORTANCE AND SENSITIVITY CATEGORY (EISC) HIGH MODERATE
NATURAL PRESENT
CONFIDENCE CONFIDENCE
DWAF Report No. RDM X100-01-CON-COMPR2-0604 Komati River Catchment Ecological Water Requirements Study – Quantity Report
Page G - 7
AfriDev Consultants (Pty) Ltd 2005
Appendix H: Social and Cultural Importance
RW Palmer
Table of Contents ACKNOWLEDGEMENTS.................................................................................................................. 2
1. INTRODUCTION .......................................................................................................................... 3
2. METHODS .................................................................................................................................... 3
3. RESULTS AND DISCUSSION..................................................................................................... 4
3.1 RESOURCE UNIT A..........................................................................................................5 3.2 RESOURCE UNIT B .........................................................................................................5 3.3 RESOURCE UNIT C..........................................................................................................6 3.4 RESOURCE UNIT D..........................................................................................................6 3.5 RESOURCE UNIT E..........................................................................................................8 3.6 RESOURCE UNIT L ..........................................................................................................8 3.7 RESOURCE UNIT M .........................................................................................................8 3.8 RESOURCE UNIT G .........................................................................................................8 3.9 RESOURCE UNIT S..........................................................................................................8 3.10 RESOURCE UNIT T ..........................................................................................................9
4. REFERENCES ........................................................................................................................... 10
5. APPENDIX A – PHOTOGRAPHS.............................................................................................. 11
6. APPENDIX B – DETAILED RESULTS...................................................................................... 13
6.1 RESOURCE UNIT A........................................................................................................13 6.2 RESOURCE UNIT B........................................................................................................14 6.3 RESOURCE UNIT C........................................................................................................14 6.4 RESOURCE UNIT D........................................................................................................15 6.5 RESOURCE UNIT E........................................................................................................15 6.6 RESOURCE UNIT L ........................................................................................................16 6.7 RESOURCE UNIT M .......................................................................................................17 6.8 RESOURCE UNIT G .......................................................................................................17 6.9 RESOURCE UNIT S........................................................................................................18 6.10 RESOURCE UNIT T ........................................................................................................18
DWAF Report No. RDM X100-01-CON-COMPR2-0604 Komati River Catchment Ecological Water Requirements Study – Quantity Report
Page H - 1

AfriDev Consultants (Pty) Ltd 2005
Acknowledgements
The following are gratefully acknowledged for information presented in this report:
• Mr Fred Daniels Nkomazi Wilderness • Mr Francois Erasmus South African Heritage Resources Agency • Mr John King AfriDev Associates • Dr Johan Engelbrecht Mpumalanga Park Board
DWAF Report No. RDM X100-01-CON-COMPR2-0604 Komati River Catchment Ecological Water Requirements Study – Quantity Report
Page H - 2
AfriDev Consultants (Pty) Ltd 2005
1. INTRODUCTION Social and Cultural Importance refers to the value that communities are likely to assign to various aspects of a river and its associated resources. There are over 550,3001 people living in unserviced and semi-serviced rural and urban settlements in both the upper and lower Komati Catchments (excluding Swaziland). These settlements are focussed around the centers of Badplaas, Tjakastad, eLukwatini, Nhlazatje, Ekulindeni in the upper catchment, and Schoemansdal, Jeppes Reef, Driekoppies, Tonga, Vlakbult, Sibayeni, Kamaqhekeza and Sibange in the lower catchment. This report presents a desktop assessment of Social and Cultural Importance of each Resource Unit in the Komati Catchment. The assessment is used to help recommend an appropriate Ecological Category for future water resource planning and allocation within the catchment.
2. METHODS The method used for this assessment was a simple rule-based desktop model developed and described by Huggins (2003). The model is based on standard criteria which were scored from 0 (not important) to 4 (highly important). The median of the scores were tabulated and used to indicate the overall value and category, ranging from Very Important to Unimportant. The following criteria were included in the assessment:
• Direct dependence on river for water supply, • Direct dependence on riparian plants for building materials and medicinal
purposes, • Direct dependence on river as a food resource (mainly fishing), • Use of the river for recreation, • Use of the river for sacred or religious cultural events, • Presence of historical or archaeological sites, • aesthetic value, • special features, such as waterfalls, unusual geology etc, • sense of place for those living in close proximity to the river, • existing and potential ecotourism and recreation development.
In this study the method was applied at a desktop level, based on a general knowledge of the study area, liaison with people listed in the acknowledgments, plus information collected during the Maguga Dam Impact Assessment, which focused on social dependence on the river in the vicinity of the Maguga Dam IFR sites (King 1998). The 1 A more detailed assessment of population figures, using latest census figures, was not considered necessary for the purposes of this study.
DWAF Report No. RDM X100-01-CON-COMPR2-0604 Komati River Catchment Ecological Water Requirements Study – Quantity Report
Page H - 3
AfriDev Consultants (Pty) Ltd 2005
Maguga Dam study undertook key informant interviews and focus group discussions at three in Swaziland, and one in South Africa near Tonga. In this study no interviews were undertaken, so the results for most areas should be treated with caution.
3. RESULTS AND DISCUSSION Photographs showing examples of typical landuse within each Resource Unit are shown in Appendix A, and detailed results of the assessment are presented in Appendix B, while summary results are presented in Figure 3-1 and Table 3-1. The results show that the lower Komati River (RUs D and E) was considered to be the most important area in terms of social and cultural values, followed by the Barberton Mountainlands/Songimvelo and Nkomazi Wilderness areas (RUs C and L). Areas that were considered of low social and cultural importance were the Gladdespruit (RU G) and upstream of Nooitgedacht Dam (RU A). The main social and cultural uses of the river were identified as follows:
• supply of drinking water • use of the river for washing • harvesting of food (fish, fruit and wild vegetables and tubers) • harvesting of medicinal plants (for local consumption and export to Gauteng) • harvesting of building materials (sand, thatch, timber) • growing of subsistence vegetables in the riparian zone • grazing and watering of livestock • baptism • weddings • swimming (mainly children).
DWAF Report No. RDM X100-01-CON-COMPR2-0604 Komati River Catchment Ecological Water Requirements Study – Quantity Report
Page H - 4

AfriDev Consultants (Pty) Ltd 2005
0.00
1.00
2.00
3.00
4.00
MEAN 1.00 2.00 3.00 4.00 4.00 1.00 2.00 3.00 4.00 4.00 0 3.00 3.00 1.00 2.00 2.00
A B C D E L M G T S
Very High
High
Moderate
Marginal
SOCIAL AND CULTURAL IMPORTANCE PER RESOURCE UNIT
Main Komati Tributaries
Figure 3-1. Summary results of the Social and Cultural Importance for each Resource Unit in the Komati River Catchment (excluding Swaziland).
3.1 RESOURCE UNIT A Landuse is Resource Unit A is characterised by commercial dryland farming (mainly maize), and livestock grazing (mainly cattle). Population densities are very low. Direct dependence on river for water supply is likely to be very low, as most farmers and farm workers are likely to rely on boreholes for water supply. The natural riparian zone is grassland and therefore does not supply much in terms of building materials or other natural resources. There may be some harvesting of medicinal herbs and tubers, but the scale of this is low. The area offers little in terms of aesthetic features, but there are a few deep pools that provide habitat for yellowfish (Barbus polylepis), so there is some potential for yellowfish ecotourism development. The Groblers Bridge that crosses the Komati River is registered as Natural Heritage Site. The area contains a number of San archaeological sites. Overall, the area was considered of low Social and Cultural Importance.
3.2 RESOURCE UNIT B Landuse if Resource Unit B is characterised by commercial dryland agriculture, some irrigated agriculture, livestock grazing (mainly cattle), and localised ecotourism developments (fishing, walking, biking, birding etc). Population densities are very low. Direct dependence on river for water supply and other harvestable resources is probably low, although there is likely to be significant commercial harvesting of medicinal herbs and tubers for sale in Gauteng. The Komati Gorge is spectacular and largely undeveloped
DWAF Report No. RDM X100-01-CON-COMPR2-0604 Komati River Catchment Ecological Water Requirements Study – Quantity Report
Page H - 5
AfriDev Consultants (Pty) Ltd 2005
and offers significant potential for further ecotourism development. San and other archaeological sites are almost certainly abundant. Overall, the area was considered of moderate Social and Cultural Importance.
3.3 RESOURCE UNIT C Landuse in Resource Unit C is dominated by the Nkomazi Wilderness Area, the Songimvelo Nature Reserve, and former homeland areas of Tjakastad, Engonini and eKulindeni. The Nkomazi Wilderness Area is a proclaimed National Heritage area. Population densities vary from very low within the conserved areas, to moderately high in the former homeland areas. Direct dependence on the river and associated resources is similarly variable. Harvesting of riparian timber for fuelwood does occur, but in many instances the species harvested in wattle. Communities living alongside the river use the riparian zone for subsistence market gardening, and reliance on riverine resources is probably moderate. The main social and cultural significance of the area is that it contains among the oldest rock formations in the world, estimated at more than 3700 million years. The area also contains some of the oldest sea floor and oldest fossils known, and evidence of the oldest and largest meteorite impact on earth. This clearly makes this an area of international importance, and so there are initiatives underway to have the area declared a World Heritage Site. The area has a long history of occupation, starting with early stone-age handaxes, cleavers and other tools dating back to about 1.5 million to 250 000 years ago (BKS 1999). These artefacts are usually found in river gravels and on river terraces. The area also contains artefacts from the middle stone-age, dating back about 250 000 to 30 000 years ago. The artefacts are found mainly in rock shelters and open sites, and suggest that people had the ability to control fire (BKS 1999). Artefacts, including many rock paintings, of the later stone-age, dating back 30 000 to 1000 years ago, were made mainly by hunter-gathering San. There is also evidence of early and late iron-age occupation along the river banks, including ceramics, grain bins and cattle kraals, dating back to 250 to 1000 AD, and 1100 and 1800AD respectively. More recently the Nguni people of Chief Dlamini and the Ngwane people settled in the area in the 1750s, followed by the Swaziland Concession Gold Rush, and asbestos mining, now abandoned (BKS 1999). Overall, the area was considered of high Social and Cultural Importance.
3.4 RESOURCE UNIT D Landuse is Resource Unit D is characterised by commercial subsistence agriculture and irrigated sugarcane. Population densities are very high. Interviews with key informants and group discussions during the Maguga Dam IFR Study in Resource Unit D (at Tonga) found that the use of natural resources for generating income was a very important component to household economy, particularly among women, who weave baskets and
DWAF Report No. RDM X100-01-CON-COMPR2-0604 Komati River Catchment Ecological Water Requirements Study – Quantity Report
Page H - 6
AfriDev Consultants (Pty) Ltd 2005
sleeping mats, and collected wild vegetables and fruits. Certain sects, such as the Red Gown Zionists, use the river for Baptism and other rituals, including weddings. However, respondents stated that this is no longer possible because of the low level in the river, and the Red Gown now must to “wait for the rains”. The study found that people in the vicinity of Tonga were vociferous about the changes in the river and its environment since the weirs were built, and they look to Maguga and Driekoppies Dams to restore flow levels. The Tonga community is characterised by high numbers of refugees and victims of forced removals (King 1998). The original community fell under the rule of Chief Myomo Ntiwane whose subjects were removed from Emadadeni to make way for people removed from Tenbosch, near Komatipoort (King 1998). The close proximity to Mozambique has lead to large numbers of refugees settling in this area in search of a better life. The community is predominantly Swazi, but includes Shangaan, xiRonga, Chope and others from Mozambique. The study by King (1998) lists a total of 62 plant and animal species that were used by local residents in the vicinity of Tonga. Uses included food, construction, medicinal and income generation. The study found that most herbaceous plants were used for medicinal purposes, although a few play important dietary roles, while trees provided important resources for building, fencing, firewood and carving, and reeds were found to be important for thatching. Birds were mainly eaten, although subsidiary uses included feathers and other body parts for decoration and medicine. Reptiles and mammals were used mainly by traditional healers. Fish were eaten and sold when abundant, which respondents stated was when “the river was full” (King 1998). Other uses of the river included swimming (mainly by children), a place to wash (children and adults), and certain sects, such as the Red Gown Zionists, used the river for Baptism and other rituals, including weddings. However, respondents stated that this is no longer possible because of the low level in the river, and the Red Gown now must to “wait for the rains”. Most respondents stated that the river was much lower than it was in the past, and while some attributed this to the lack of rain, others attributed the low levels to the construction of dams and weirs. The study found that weirs are resented by most community members because access to the other side of the river is prevented. Older respondents noted a marked reduction in the number of mammals which they attributed to hunting and poaching by workers during the construction of the weirs. The study found that people in the vicinity of Tonga were vociferous about the changes in the river and its environment since the weirs were built, and they look to Maguga and Driekoppies Dams to restore flow levels. Good quality soils on the banks of the river are used intensively for dryland cultivation of various subsistence crops, including cassava and maize. These crops are highly
DWAF Report No. RDM X100-01-CON-COMPR2-0604 Komati River Catchment Ecological Water Requirements Study – Quantity Report
Page H - 7
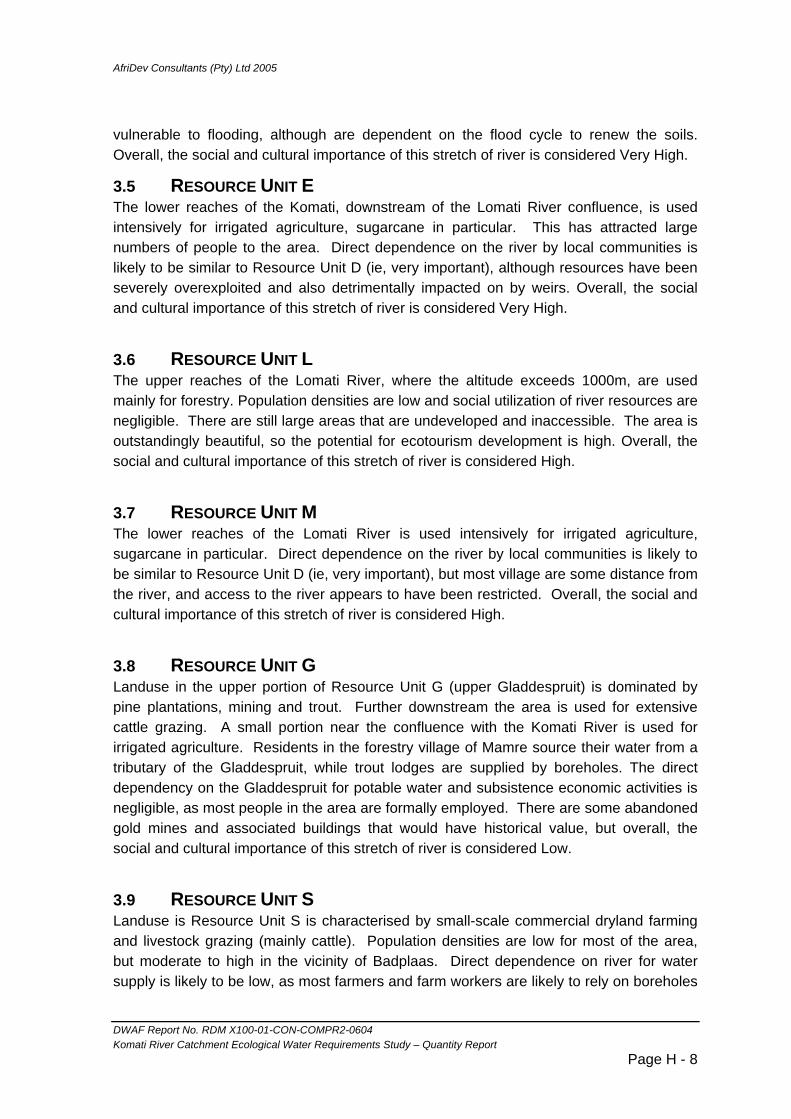
AfriDev Consultants (Pty) Ltd 2005
vulnerable to flooding, although are dependent on the flood cycle to renew the soils. Overall, the social and cultural importance of this stretch of river is considered Very High.
3.5 RESOURCE UNIT E The lower reaches of the Komati, downstream of the Lomati River confluence, is used intensively for irrigated agriculture, sugarcane in particular. This has attracted large numbers of people to the area. Direct dependence on the river by local communities is likely to be similar to Resource Unit D (ie, very important), although resources have been severely overexploited and also detrimentally impacted on by weirs. Overall, the social and cultural importance of this stretch of river is considered Very High.
3.6 RESOURCE UNIT L The upper reaches of the Lomati River, where the altitude exceeds 1000m, are used mainly for forestry. Population densities are low and social utilization of river resources are negligible. There are still large areas that are undeveloped and inaccessible. The area is outstandingly beautiful, so the potential for ecotourism development is high. Overall, the social and cultural importance of this stretch of river is considered High.
3.7 RESOURCE UNIT M The lower reaches of the Lomati River is used intensively for irrigated agriculture, sugarcane in particular. Direct dependence on the river by local communities is likely to be similar to Resource Unit D (ie, very important), but most village are some distance from the river, and access to the river appears to have been restricted. Overall, the social and cultural importance of this stretch of river is considered High.
3.8 RESOURCE UNIT G Landuse in the upper portion of Resource Unit G (upper Gladdespruit) is dominated by pine plantations, mining and trout. Further downstream the area is used for extensive cattle grazing. A small portion near the confluence with the Komati River is used for irrigated agriculture. Residents in the forestry village of Mamre source their water from a tributary of the Gladdespruit, while trout lodges are supplied by boreholes. The direct dependency on the Gladdespruit for potable water and subsistence economic activities is negligible, as most people in the area are formally employed. There are some abandoned gold mines and associated buildings that would have historical value, but overall, the social and cultural importance of this stretch of river is considered Low.
3.9 RESOURCE UNIT S Landuse is Resource Unit S is characterised by small-scale commercial dryland farming and livestock grazing (mainly cattle). Population densities are low for most of the area, but moderate to high in the vicinity of Badplaas. Direct dependence on river for water supply is likely to be low, as most farmers and farm workers are likely to rely on boreholes
DWAF Report No. RDM X100-01-CON-COMPR2-0604 Komati River Catchment Ecological Water Requirements Study – Quantity Report
Page H - 8

AfriDev Consultants (Pty) Ltd 2005
for water supply, while residents in the vicinity of Badplaas are serviced with reticulated water. There are moderate levels of natural resource harvesting, including fuelwood, and river sand for building. There are almost certainly moderate to high levels of harvesting of medicinal herbs and tubers. Badplaas is well-known for its hot springs, which have been developed into a major tourist attraction, and there is potential for further ecotourism development. The area contains a number of San archaeological sites. Overall, the area was considered of moderate Social and Cultural Importance.
3.10 RESOURCE UNIT T Landuse is Resource Unit T is characterised by small-scale commercial and subsistence dryland farming and livestock grazing (mainly cattle). There are also small patches of irrigated agriculture. Population densities are low for most of the area, and moderate in the lower reaches. Large areas were cultivated commercially in the past, but most of these areas have become fallow in the last 20 years on account of poor soils and withdrawal of farm subsidies. This has left large areas of degraded, unimproved grasslands, with associated problems of soil erosion and exotic vegetation encroachment. Direct dependence on river for water supply is likely to be fairly high, as houses are generally scattered. The helicopter survey undertaken in June 2003 showed that the river is important for washing of clothes, and it is likely that the river is also important for swimming. Moderate levels of natural resource harvesting are probable, including fuelwood, and river sand for building. There are almost certainly moderate to high levels of harvesting of medicinal herbs and tubers. .Overall, the area was considered of moderate Social and Cultural Importance.
DWAF Report No. RDM X100-01-CON-COMPR2-0604 Komati River Catchment Ecological Water Requirements Study – Quantity Report
Page H - 9

AfriDev Consultants (Pty) Ltd 2005
4. REFERENCES BKS, 1999. Mpumalanga water services business definition environmental status quo.
Region 5: Mlondozi/Mswati. Internal report prepared for the Departm,ent of Water Affairs and Forestry. March 1999. Report No. P753401.
Department of Water Affairs and Forestry, South Africa. 2000. Proposal for the establishment of a Catchment Management Agency for the Inkomati Basin. Prepared on behalf of the Inkomati Management Agency Reference Group by MBB Consulting Engineers, ACER (Africa) Environmental Management Consultants and AWARD, under the auspices of the Mpumalanga Regional Office of the Department of Water Affairs and Forestry, Nelspruit.
Huggins, G, 2003. Social and Cultural Importance. Ecological Reserve Category Report. Thukela Water Project Decision Support Phase Reserve Determination Model. Report prepared for the Republic of South Africa Department of Water Affairs and Forestry, Pretoria. Report No. PBV000-00-10303.
King, J. 1998. Social dependence on the river ecosystem. Annexure A. Maguga Dam Contract MDC-6 – Environmental Impact Assessment and Instream Flow Requirement CMP Supporting Report E. Report prepared for the Komati Basin Water Authority by AfriDev/Knight Piesold joint Venture and JTK Associates.
DWAF Report No. RDM X100-01-CON-COMPR2-0604 Komati River Catchment Ecological Water Requirements Study – Quantity Report
Page H - 10

AfriDev Consultants (Pty) Ltd 2005
5. APPENDIX A – PHOTOGRAPHS
RU A RU B
RU C RU D
DWAF Report No. RDM X100-01-CON-COMPR2-0604 Komati River Catchment Ecological Water Requirements Study – Quantity Report
Page H - 11

AfriDev Consultants (Pty) Ltd 2005
RU E RU L
RU M RU G
RU S RU T
DWAF Report No. RDM X100-01-CON-COMPR2-0604 Komati River Catchment Ecological Water Requirements Study – Quantity Report
Page H - 12
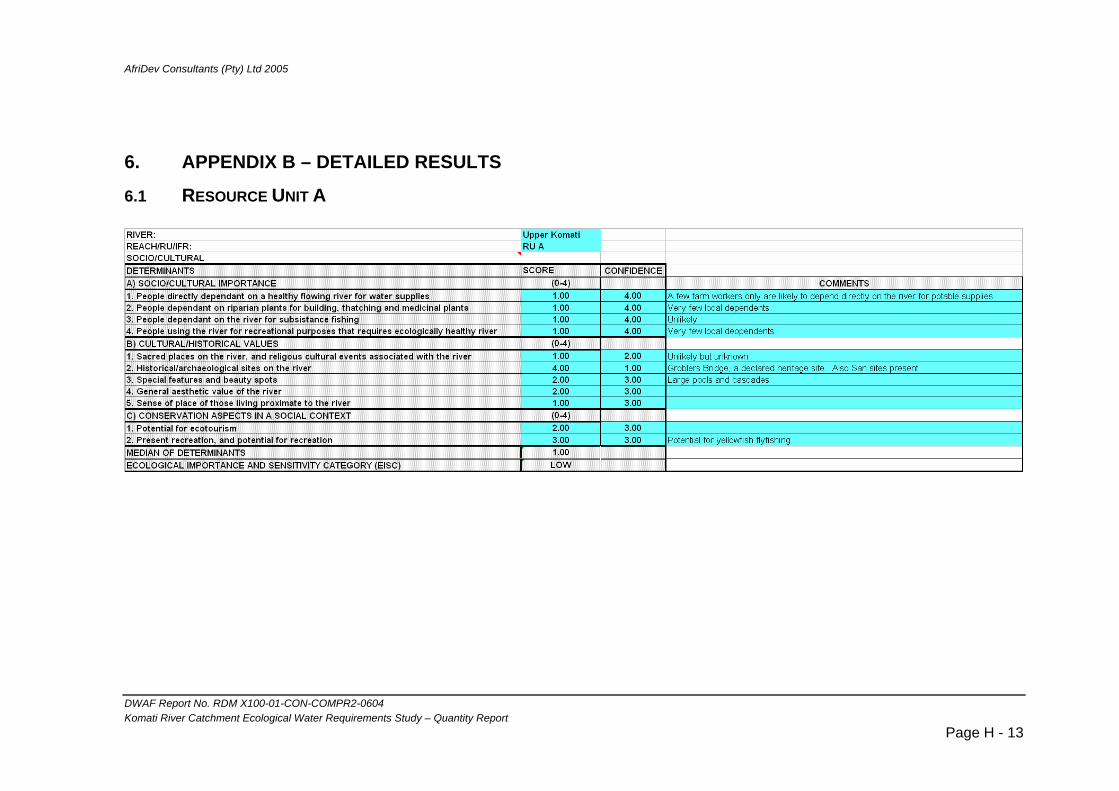
AfriDev Consultants (Pty) Ltd 2005
6. APPENDIX B – DETAILED RESULTS
6.1 RESOURCE UNIT A
DWAF Report No. RDM X100-01-CON-COMPR2-0604 Komati River Catchment Ecological Water Requirements Study – Quantity Report
Page H - 13
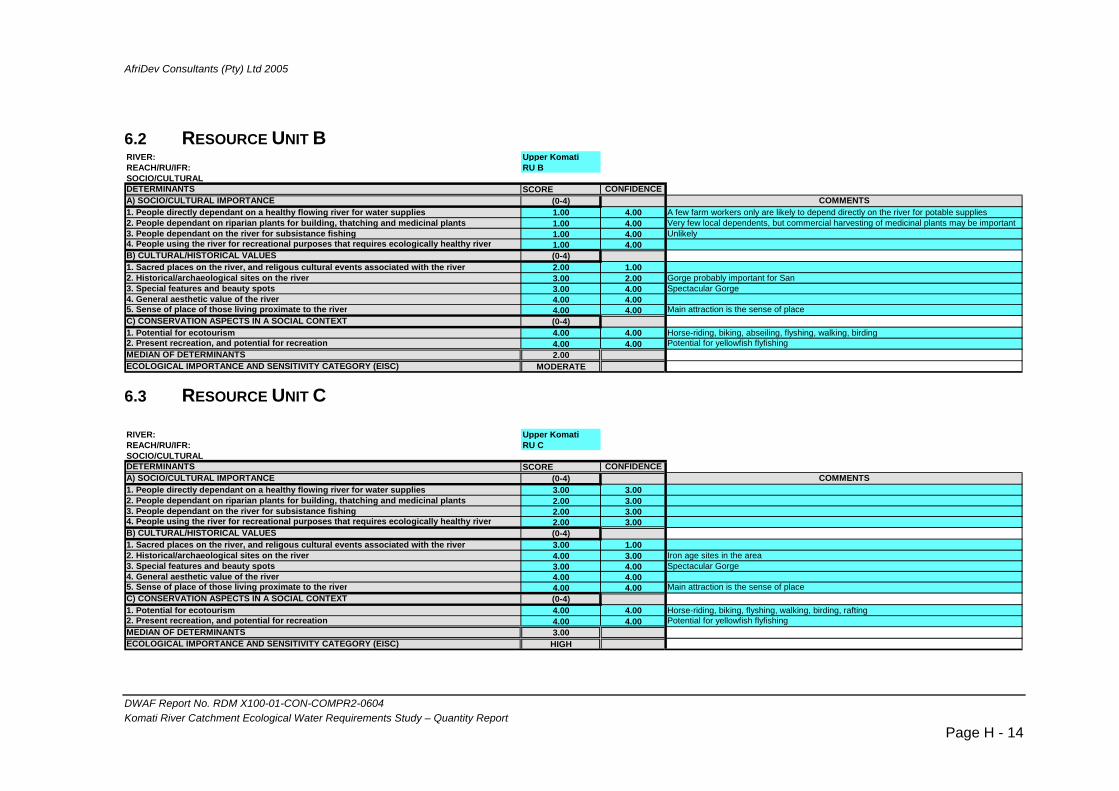
AfriDev Consultants (Pty) Ltd 2005
6.2 RESOURCE UNIT B RIVER: Upper KomatiREACH/RU/IFR: RU BSOCIO/CULTURAL DETERMINANTS SCORE CONFIDENCEA) SOCIO/CULTURAL IMPORTANCE (0-4) COMMENTS1. People directly dependant on a healthy flowing river for water supplies 1.00 4.00 A few farm workers only are likely to depend directly on the river for potable supplies2. People dependant on riparian plants for building, thatching and medicinal plants 1.00 4.00 Very few local dependents, but commercial harvesting of medicinal plants may be important3. People dependant on the river for subsistance fishing 1.00 4.00 Unlikely4. People using the river for recreational purposes that requires ecologically healthy river 1.00 4.00B) CULTURAL/HISTORICAL VALUES (0-4)1. Sacred places on the river, and religous cultural events associated with the river 2.00 1.00 2. Historical/archaeological sites on the river 3.00 2.00 Gorge probably important for San3. Special features and beauty spots 3.00 4.00 Spectacular Gorge4. General aesthetic value of the river 4.00 4.005. Sense of place of those living proximate to the river 4.00 4.00 Main attraction is the sense of placeC) CONSERVATION ASPECTS IN A SOCIAL CONTEXT (0-4)1. Potential for ecotourism 4.00 4.00 Horse-riding, biking, abseiling, flyshing, walking, birding2. Present recreation, and potential for recreation 4.00 4.00 Potential for yellowfish flyfishingMEDIAN OF DETERMINANTS 2.00ECOLOGICAL IMPORTANCE AND SENSITIVITY CATEGORY (EISC) MODERATE
6.3 RESOURCE UNIT C
RIVER: Upper KomatiREACH/RU/IFR: RU CSOCIO/CULTURAL DETERMINANTS SCORE CONFIDENCEA) SOCIO/CULTURAL IMPORTANCE (0-4) COMMENTS1. People directly dependant on a healthy flowing river for water supplies 3.00 3.00 2. People dependant on riparian plants for building, thatching and medicinal plants 2.00 3.00 3. People dependant on the river for subsistance fishing 2.00 3.00 4. People using the river for recreational purposes that requires ecologically healthy river 2.00 3.00B) CULTURAL/HISTORICAL VALUES (0-4)1. Sacred places on the river, and religous cultural events associated with the river 3.00 1.00 2. Historical/archaeological sites on the river 4.00 3.00 Iron age sites in the area3. Special features and beauty spots 3.00 4.00 Spectacular Gorge4. General aesthetic value of the river 4.00 4.005. Sense of place of those living proximate to the river 4.00 4.00 Main attraction is the sense of placeC) CONSERVATION ASPECTS IN A SOCIAL CONTEXT (0-4)1. Potential for ecotourism 4.00 4.00 Horse-riding, biking, flyshing, walking, birding, rafting2. Present recreation, and potential for recreation 4.00 4.00 Potential for yellowfish flyfishingMEDIAN OF DETERMINANTS 3.00ECOLOGICAL IMPORTANCE AND SENSITIVITY CATEGORY (EISC) HIGH
DWAF Report No. RDM X100-01-CON-COMPR2-0604 Komati River Catchment Ecological Water Requirements Study – Quantity Report
Page H - 14

AfriDev Consultants (Pty) Ltd 2005
6.4 RESOURCE UNIT D RIVER: Lower KomatiREACH/RU/IFR: RU DSOCIO/CULTURAL DETERMINANTS SCORE CONFIDENCEA) SOCIO/CULTURAL IMPORTANCE (0-4) COMMENTS1. People directly dependant on a healthy flowing river for water supplies 4.00 3.00 2. People dependant on riparian plants for building, thatching and medicinal plants 4.00 4.00 3. People dependant on the river for subsistance fishing 4.00 3.00 Oreochromis & Barbel4. People using the river for recreational purposes that requires ecologically healthy river 3.00 3.00 Swimming, picnicsB) CULTURAL/HISTORICAL VALUES (0-4)1. Sacred places on the river, and religous cultural events associated with the river 4.00 2.00 2. Historical/archaeological sites on the river 4.00 1.00 ?Stone age3. Special features and beauty spots 3.00 3.00 Anastomosed section of river with riparian forest4. General aesthetic value of the river 3.00 3.005. Sense of place of those living proximate to the river 3.00 2.00C) CONSERVATION ASPECTS IN A SOCIAL CONTEXT (0-4)1. Potential for ecotourism 2.00 3.00 Fishing - Oreochromis2. Present recreation, and potential for recreation 2.00 3.00 Birding & fishing & froggingMEDIAN OF DETERMINANTS 4.00ECOLOGICAL IMPORTANCE AND SENSITIVITY CATEGORY (EISC) VERY HIGH
6.5 RESOURCE UNIT E RIVER: Lower KomatiREACH/RU/IFR: RU ESOCIO/CULTURAL DETERMINANTS SCORE CONFIDENCEA) SOCIO/CULTURAL IMPORTANCE (0-4) COMMENTS1. People directly dependant on a healthy flowing river for water supplies 4.00 3.00 2. People dependant on riparian plants for building, thatching and medicinal plants 4.00 3.00 3. People dependant on the river for subsistance fishing 4.00 3.00 Oreochromis & Barbel4. People using the river for recreational purposes that requires ecologically healthy river 3.00 3.00 Swimming, picnicsB) CULTURAL/HISTORICAL VALUES (0-4)1. Sacred places on the river, and religous cultural events associated with the river 4.00 2.00 2. Historical/archaeological sites on the river 4.00 1.00 Low-level bridge at Komatipoort3. Special features and beauty spots 2.00 3.00 4. General aesthetic value of the river 2.00 3.005. Sense of place of those living proximate to the river 3.00 2.00C) CONSERVATION ASPECTS IN A SOCIAL CONTEXT (0-4)1. Potential for ecotourism 2.00 3.00 Fishing - Tigerfishing2. Present recreation, and potential for recreation 2.00 3.00 Birding & fishing & froggingMEDIAN OF DETERMINANTS 4.00ECOLOGICAL IMPORTANCE AND SENSITIVITY CATEGORY (EISC) VERY HIGH
DWAF Report No. RDM X100-01-CON-COMPR2-0604 Komati River Catchment Ecological Water Requirements Study – Quantity Report
Page H - 15

AfriDev Consultants (Pty) Ltd 2005
6.6 RESOURCE UNIT L RIVER: Upper LomatiREACH/RU/IFR: RU LSOCIO/CULTURAL DETERMINANTS SCORE CONFIDENCEA) SOCIO/CULTURAL IMPORTANCE (0-4) COMMENTS1. People directly dependant on a healthy flowing river for water supplies 0.00 3.00 2. People dependant on riparian plants for building, thatching and medicinal plants 0.00 3.00 3. People dependant on the river for subsistance fishing 0.00 4.00 4. People using the river for recreational purposes that requires ecologically healthy river 2.00 2.00B) CULTURAL/HISTORICAL VALUES (0-4)1. Sacred places on the river, and religous cultural events associated with the river 3.00 2.00 ?Shiyalungubo area2. Historical/archaeological sites on the river 3.00 2.00 Historical gold mining3. Special features and beauty spots 4.00 4.00 Spectacular waterfalls & gorge & riparian forests4. General aesthetic value of the river 4.00 4.005. Sense of place of those living proximate to the river 3.00 2.00C) CONSERVATION ASPECTS IN A SOCIAL CONTEXT (0-4)1. Potential for ecotourism 4.00 4.00 Walking & hiking, biodiversity2. Present recreation, and potential for recreation 4.00 4.00 Birding & botanyMEDIAN OF DETERMINANTS 3.00ECOLOGICAL IMPORTANCE AND SENSITIVITY CATEGORY (EISC) HIGH
DWAF Report No. RDM X100-01-CON-COMPR2-0604 Komati River Catchment Ecological Water Requirements Study – Quantity Report
Page H - 16
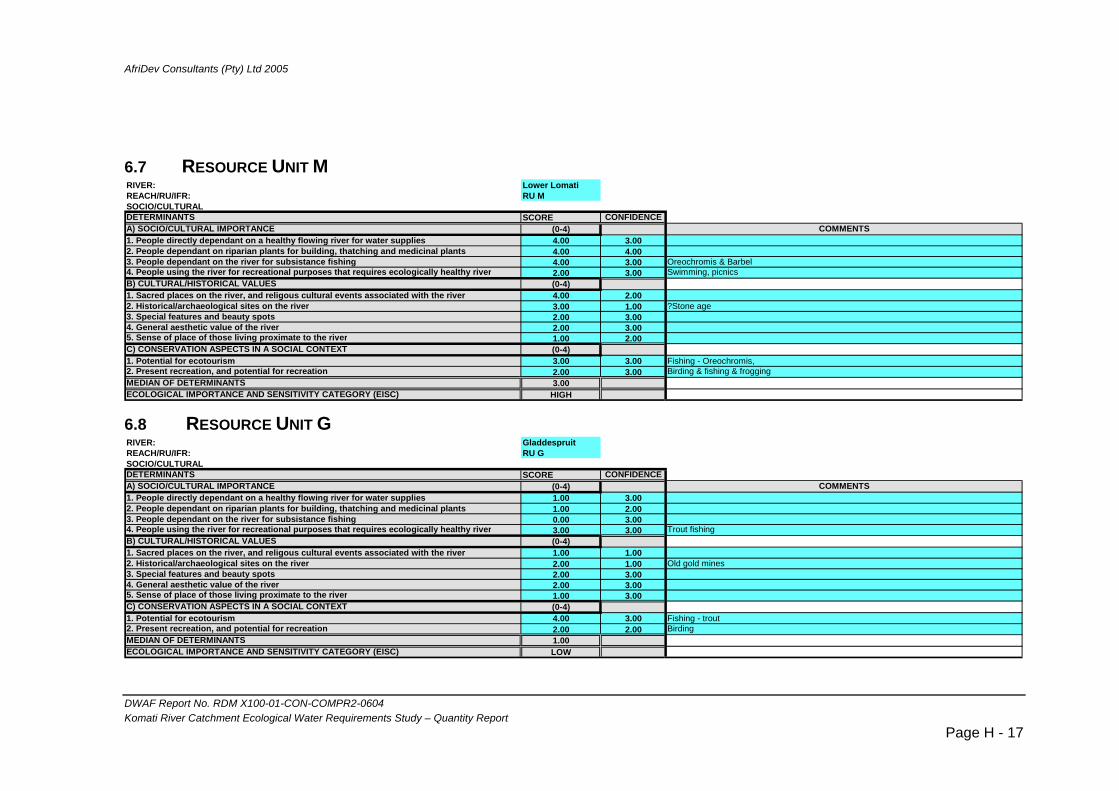
AfriDev Consultants (Pty) Ltd 2005
6.7 RESOURCE UNIT M RIVER: Lower LomatiREACH/RU/IFR: RU MSOCIO/CULTURAL DETERMINANTS SCORE CONFIDENCEA) SOCIO/CULTURAL IMPORTANCE (0-4) COMMENTS1. People directly dependant on a healthy flowing river for water supplies 4.00 3.00 2. People dependant on riparian plants for building, thatching and medicinal plants 4.00 4.00 3. People dependant on the river for subsistance fishing 4.00 3.00 Oreochromis & Barbel4. People using the river for recreational purposes that requires ecologically healthy river 2.00 3.00 Swimming, picnicsB) CULTURAL/HISTORICAL VALUES (0-4)1. Sacred places on the river, and religous cultural events associated with the river 4.00 2.00 2. Historical/archaeological sites on the river 3.00 1.00 ?Stone age3. Special features and beauty spots 2.00 3.00 4. General aesthetic value of the river 2.00 3.005. Sense of place of those living proximate to the river 1.00 2.00C) CONSERVATION ASPECTS IN A SOCIAL CONTEXT (0-4)1. Potential for ecotourism 3.00 3.00 Fishing - Oreochromis, 2. Present recreation, and potential for recreation 2.00 3.00 Birding & fishing & froggingMEDIAN OF DETERMINANTS 3.00ECOLOGICAL IMPORTANCE AND SENSITIVITY CATEGORY (EISC) HIGH
6.8 RESOURCE UNIT G RIVER: GladdespruitREACH/RU/IFR: RU GSOCIO/CULTURAL DETERMINANTS SCORE CONFIDENCEA) SOCIO/CULTURAL IMPORTANCE (0-4) COMMENTS1. People directly dependant on a healthy flowing river for water supplies 1.00 3.00 2. People dependant on riparian plants for building, thatching and medicinal plants 1.00 2.00 3. People dependant on the river for subsistance fishing 0.00 3.00 4. People using the river for recreational purposes that requires ecologically healthy river 3.00 3.00 Trout fishingB) CULTURAL/HISTORICAL VALUES (0-4)1. Sacred places on the river, and religous cultural events associated with the river 1.00 1.00 2. Historical/archaeological sites on the river 2.00 1.00 Old gold mines3. Special features and beauty spots 2.00 3.00 4. General aesthetic value of the river 2.00 3.005. Sense of place of those living proximate to the river 1.00 3.00C) CONSERVATION ASPECTS IN A SOCIAL CONTEXT (0-4)1. Potential for ecotourism 4.00 3.00 Fishing - trout2. Present recreation, and potential for recreation 2.00 2.00 BirdingMEDIAN OF DETERMINANTS 1.00ECOLOGICAL IMPORTANCE AND SENSITIVITY CATEGORY (EISC) LOW
DWAF Report No. RDM X100-01-CON-COMPR2-0604 Komati River Catchment Ecological Water Requirements Study – Quantity Report
Page H - 17
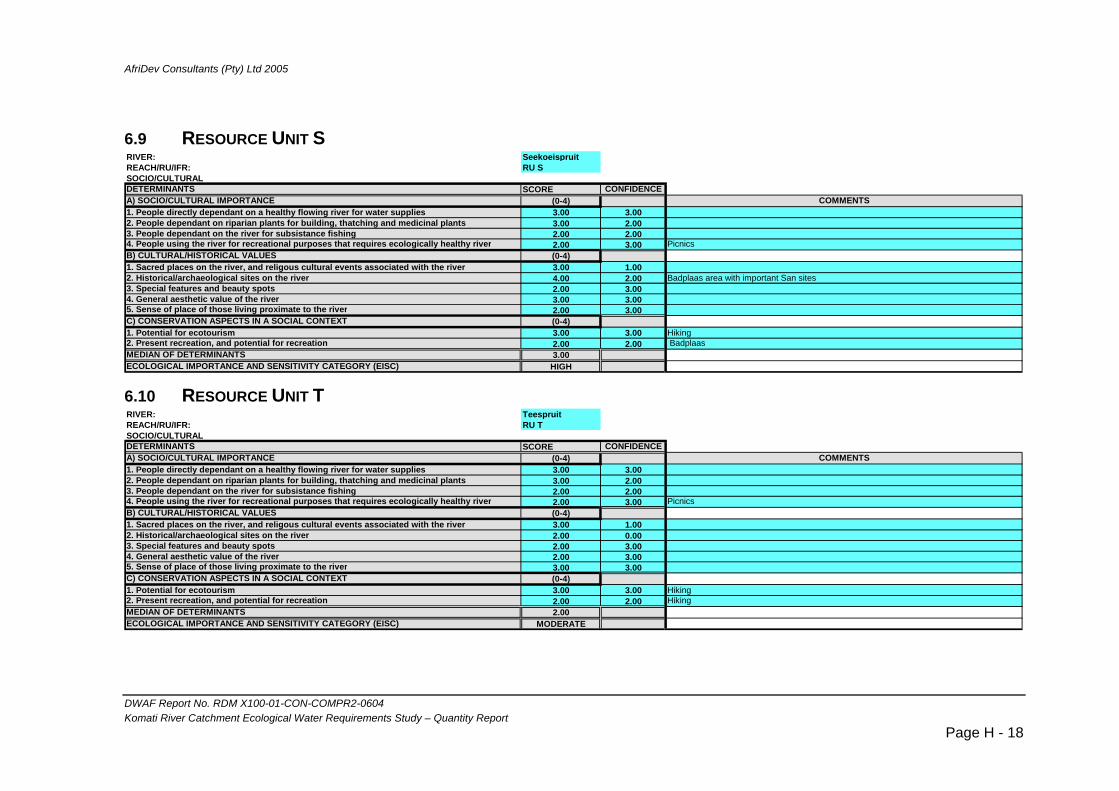
AfriDev Consultants (Pty) Ltd 2005
6.9 RESOURCE UNIT S RIVER: SeekoeispruitREACH/RU/IFR: RU SSOCIO/CULTURAL DETERMINANTS SCORE CONFIDENCEA) SOCIO/CULTURAL IMPORTANCE (0-4) COMMENTS1. People directly dependant on a healthy flowing river for water supplies 3.00 3.00 2. People dependant on riparian plants for building, thatching and medicinal plants 3.00 2.00 3. People dependant on the river for subsistance fishing 2.00 2.00 4. People using the river for recreational purposes that requires ecologically healthy river 2.00 3.00 PicnicsB) CULTURAL/HISTORICAL VALUES (0-4)1. Sacred places on the river, and religous cultural events associated with the river 3.00 1.00 2. Historical/archaeological sites on the river 4.00 2.00 Badplaas area with important San sites3. Special features and beauty spots 2.00 3.00 4. General aesthetic value of the river 3.00 3.005. Sense of place of those living proximate to the river 2.00 3.00C) CONSERVATION ASPECTS IN A SOCIAL CONTEXT (0-4)1. Potential for ecotourism 3.00 3.00 Hiking2. Present recreation, and potential for recreation 2.00 2.00 BadplaasMEDIAN OF DETERMINANTS 3.00ECOLOGICAL IMPORTANCE AND SENSITIVITY CATEGORY (EISC) HIGH
6.10 RESOURCE UNIT T RIVER: TeespruitREACH/RU/IFR: RU TSOCIO/CULTURAL DETERMINANTS SCORE CONFIDENCEA) SOCIO/CULTURAL IMPORTANCE (0-4) COMMENTS1. People directly dependant on a healthy flowing river for water supplies 3.00 3.00 2. People dependant on riparian plants for building, thatching and medicinal plants 3.00 2.00 3. People dependant on the river for subsistance fishing 2.00 2.00 4. People using the river for recreational purposes that requires ecologically healthy river 2.00 3.00 PicnicsB) CULTURAL/HISTORICAL VALUES (0-4)1. Sacred places on the river, and religous cultural events associated with the river 3.00 1.00 2. Historical/archaeological sites on the river 2.00 0.00 3. Special features and beauty spots 2.00 3.00 4. General aesthetic value of the river 2.00 3.005. Sense of place of those living proximate to the river 3.00 3.00C) CONSERVATION ASPECTS IN A SOCIAL CONTEXT (0-4)1. Potential for ecotourism 3.00 3.00 Hiking2. Present recreation, and potential for recreation 2.00 2.00 HikingMEDIAN OF DETERMINANTS 2.00ECOLOGICAL IMPORTANCE AND SENSITIVITY CATEGORY (EISC) MODERATE
DWAF Report No. RDM X100-01-CON-COMPR2-0604 Komati River Catchment Ecological Water Requirements Study – Quantity Report
Page H - 18
AfriDev Consultants (Pty) Ltd
Appendix I: Stress Indices
Table of Contents 1. SITE K1 – GEVONDEN................................................................................................................ 2
1.1 FISH ................................................................................................................................ 2 1.2 AQUATIC INVERTEBRATES................................................................................................. 3
2. SITE K2 – KROMDRAAI .............................................................................................................. 4
2.1 FISH ................................................................................................................................ 4 2.2 AQUATIC INVERTEBRATES................................................................................................. 5
3. SITE K3 – TONGA ....................................................................................................................... 7 3.1 FISH ................................................................................................................................ 7 3.2 AQUATIC INVERTEBRATES................................................................................................. 8
4. SITE G1: VAALKOP .................................................................................................................... 9 4.1 FISH ................................................................................................................................ 9 4.2 AQUATIC INVERTEBRATES............................................................................................... 10
5. SITE T1 - TEESPRUIT ............................................................................................................... 12
5.1 FISH .............................................................................................................................. 12 5.2 AQUATIC INVERTEBRATES............................................................................................... 12
6. SITE L1 - KLEINDORINGKOP................................................................................................... 14 6.1 FISH .............................................................................................................................. 14 AQUATIC INVERTEBRATES ............................................................................................................... 15
7. SITE M1 – SILINGANI................................................................................................................ 16 7.1 FISH .............................................................................................................................. 16 7.2 AQUATIC INVERTEBRATES............................................................................................... 17
DWAF Report No. RDM X100-01-CON-COMPR2-0604 Komati River Catchment Ecological Water Requirements Study – Quantity Report
Page I - 1

AfriDev Consultants (Pty) Ltd
1. SITE K1 – GEVONDEN
1.1 FISH Recommended EC: B/C Alternative EC: B Alternative EC: C/D
FLOW Species stress
INTEGRATED STRESS Dry Wet Dry Wet Dry Wet
1.00 0 0 0.8 1 2 0.75 2 3 0.65 3 4 30 25 50 0.61 3.6 4.8 0.18 4 5 10 30 10 20 0.06 4.8 6 30 0 0 50 0 0.05 5 7 10 10 100.04 6 8 0 0 0 0.03 7 9 0.02 8 10
0.015 9 0.01 10
DWAF Report No. RDM X100-01-CON-COMPR2-0604 Komati River Catchment Ecological Water Requirements Study – Quantity Report
Page I - 2
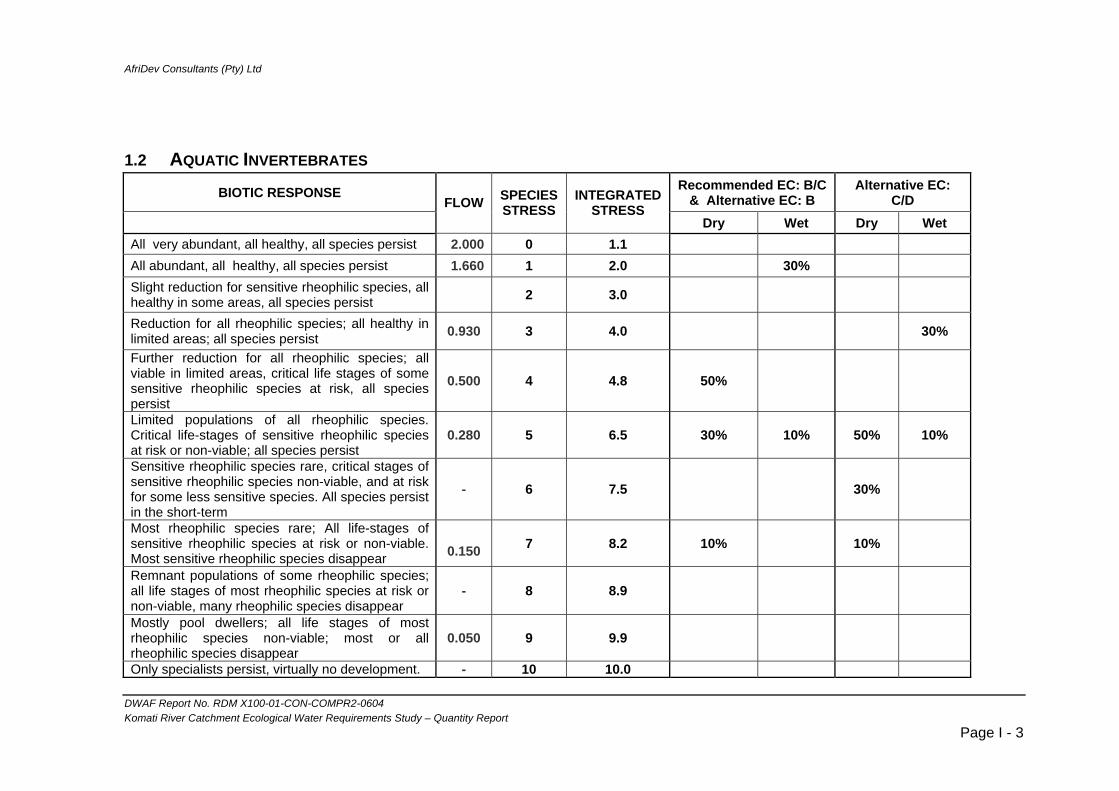
AfriDev Consultants (Pty) Ltd
1.2 AQUATIC INVERTEBRATES BIOTIC RESPONSE Recommended EC: B/C
& Alternative EC: B Alternative EC:
C/D
FLOW SPECIES STRESS
INTEGRATED STRESS
Dry Wet Dry WetAll very abundant, all healthy, all species persist 2.000 0 1.1 All abundant, all healthy, all species persist 1.660 1 2.0 30% Slight reduction for sensitive rheophilic species, all healthy in some areas, all species persist 2 3.0
Reduction for all rheophilic species; all healthy in limited areas; all species persist 0.930 3 4.0 30%
Further reduction for all rheophilic species; all viable in limited areas, critical life stages of some sensitive rheophilic species at risk, all species persist
0.500 4 4.8 50%
Limited populations of all rheophilic species. Critical life-stages of sensitive rheophilic species at risk or non-viable; all species persist
0.280 5 6.5 30% 10% 50% 10%
Sensitive rheophilic species rare, critical stages of sensitive rheophilic species non-viable, and at risk for some less sensitive species. All species persist in the short-term
- 6 7.5 30%
Most rheophilic species rare; All life-stages of sensitive rheophilic species at risk or non-viable. Most sensitive rheophilic species disappear
0.150 7 8.2 10% 10%
Remnant populations of some rheophilic species; all life stages of most rheophilic species at risk or non-viable, many rheophilic species disappear
- 8 8.9
Mostly pool dwellers; all life stages of most rheophilic species non-viable; most or all rheophilic species disappear
0.050 9 9.9
Only specialists persist, virtually no development. - 10 10.0
DWAF Report No. RDM X100-01-CON-COMPR2-0604 Komati River Catchment Ecological Water Requirements Study – Quantity Report
Page I - 3

AfriDev Consultants (Pty) Ltd
2. SITE K2 – KROMDRAAI
2.1 FISH
Recommended EC:C Alternative EC: B Alternative EC:D
FLOW Species stress
INTEGRATED STRESS Dry Wet Dry Wet Dry Wet
5.50 0 0 2.2 1 1.8
2 2 20 3 3 30 10
1.5 4 4 10 35 30 5 5 35 45 10 6 6 0 0 0
0.5 7 7 10 10 10 8 8 0 0 0
0.1 9 9 0 10 10
DWAF Report No. RDM X100-01-CON-COMPR2-0604 Komati River Catchment Ecological Water Requirements Study – Quantity Report
Page I - 4
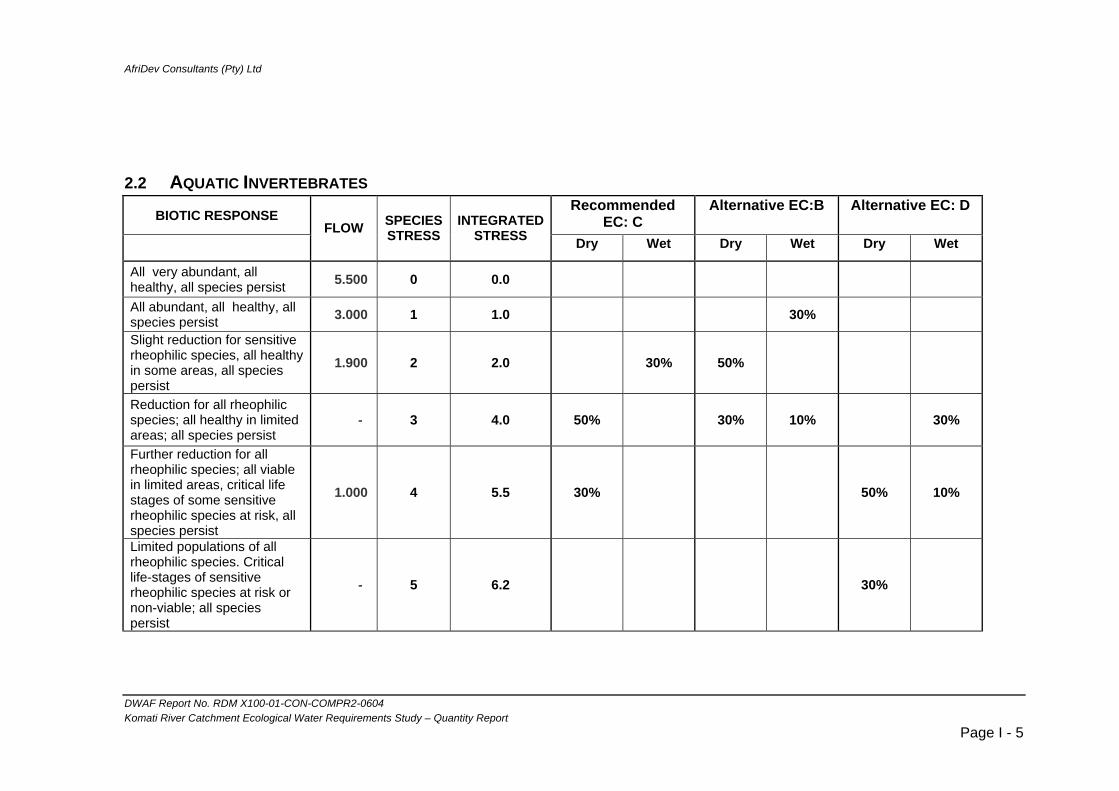
AfriDev Consultants (Pty) Ltd
2.2 AQUATIC INVERTEBRATES BIOTIC RESPONSE
Recommended EC: C
Alternative EC:B Alternative EC: D
FLOW SPECIES
STRESS INTEGRATED
STRESS Dry Wet Dry Wet Dry Wet
All very abundant, all healthy, all species persist 5.500 0 0.0
All abundant, all healthy, all species persist 3.000 1 1.0 30%
Slight reduction for sensitive rheophilic species, all healthy in some areas, all species persist
1.900 2 2.0 30% 50%
Reduction for all rheophilic species; all healthy in limited areas; all species persist
- 3 4.0 50% 30% 10% 30%
Further reduction for all rheophilic species; all viable in limited areas, critical life stages of some sensitive rheophilic species at risk, all species persist
1.000 4 5.5 30% 50% 10%
Limited populations of all rheophilic species. Critical life-stages of sensitive rheophilic species at risk or non-viable; all species persist
- 5 6.2 30%
DWAF Report No. RDM X100-01-CON-COMPR2-0604 Komati River Catchment Ecological Water Requirements Study – Quantity Report
Page I - 5
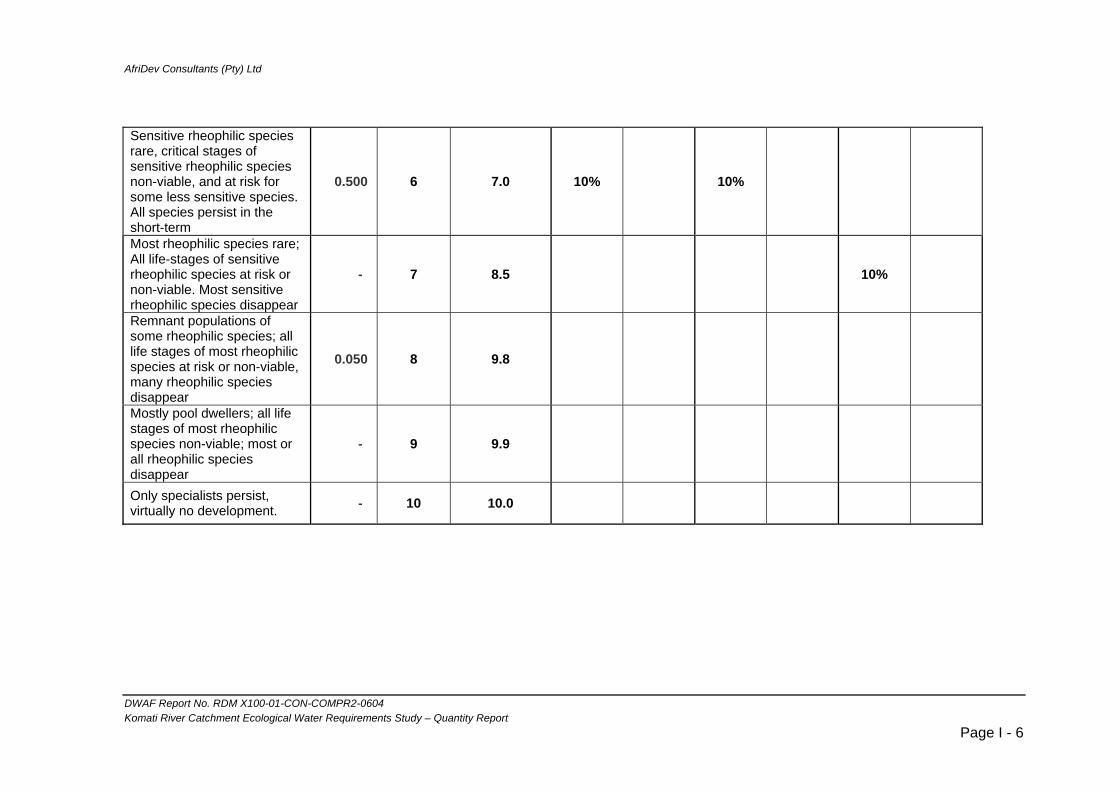
AfriDev Consultants (Pty) Ltd
Sensitive rheophilic species rare, critical stages of sensitive rheophilic species non-viable, and at risk for some less sensitive species. All species persist in the short-term
0.500 6 7.0 10% 10%
Most rheophilic species rare; All life-stages of sensitive rheophilic species at risk or non-viable. Most sensitive rheophilic species disappear
- 7 8.5 10%
Remnant populations of some rheophilic species; all life stages of most rheophilic species at risk or non-viable, many rheophilic species disappear
0.050 8 9.8
Mostly pool dwellers; all life stages of most rheophilic species non-viable; most or all rheophilic species disappear
- 9 9.9
Only specialists persist, virtually no development. - 10 10.0
DWAF Report No. RDM X100-01-CON-COMPR2-0604 Komati River Catchment Ecological Water Requirements Study – Quantity Report
Page I - 6
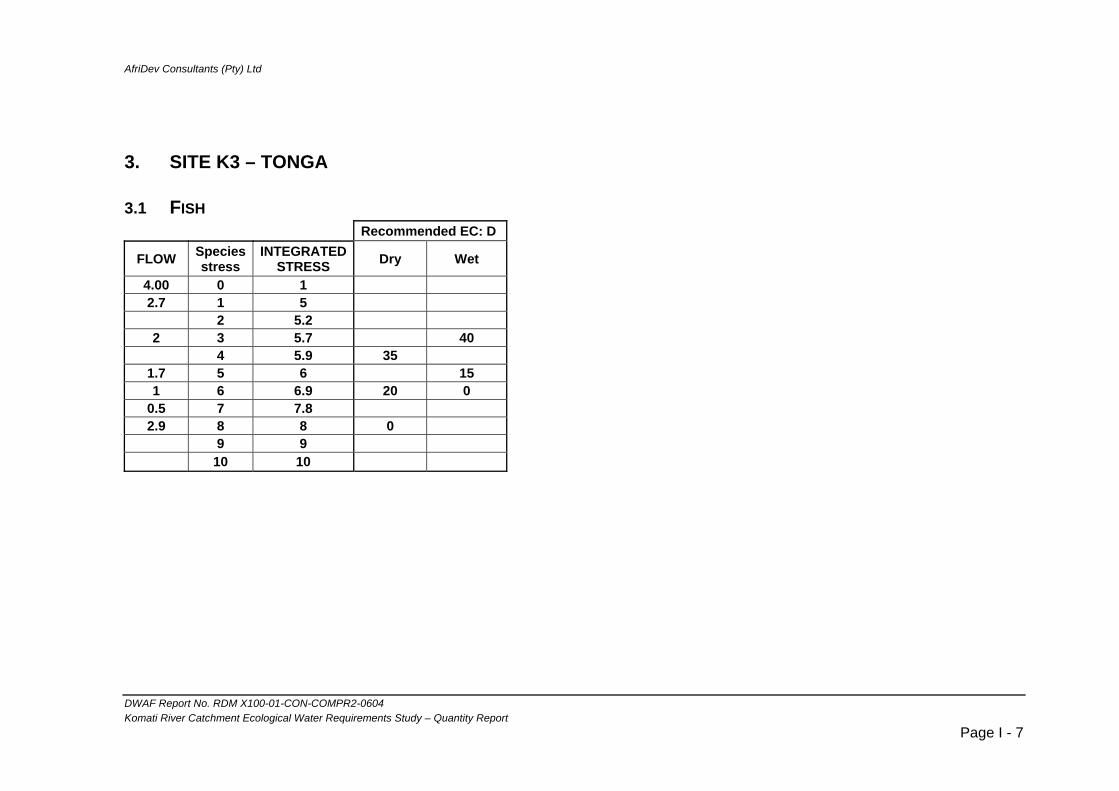
AfriDev Consultants (Pty) Ltd
3. SITE K3 – TONGA
3.1 FISH Recommended EC: D
FLOW Species stress
INTEGRATED STRESS Dry Wet
4.00 0 1 2.7 1 5
2 5.2 2 3 5.7 40 4 5.9 35
1.7 5 6 151 6 6.9 20 0
0.5 7 7.8 2.9 8 8 0
9 9 10 10
DWAF Report No. RDM X100-01-CON-COMPR2-0604 Komati River Catchment Ecological Water Requirements Study – Quantity Report
Page I - 7

AfriDev Consultants (Pty) Ltd
WAF Report No. RDM X100-01-CON-COMPR2-0604 DKomati River Catchment Ecological Water Requirements Study – Quantity Report
Page I - 8
3.2 AQUATIC INVERTEBRATES BIOTIC RESPONSE Recommended EC:
D
FLOW SPECIES STRESS
INTEGRATED STRESS Dry Wet
All very abundant, all healthy, all species persist 5.000 0 0 All abundant, all healthy, all species persist 4.000 1 1 30%Slight reduction for sensitive rheophilic species, all healthy in some areas, all species persist 3.600 2 2
Reduction for all rheophilic species; all healthy in limited areas; all species persist 3 3
Further reduction for all rheophilic species; all viable in limited areas, critical life stages of some sensitive rheophilic species at risk, all species persist
3.100 4 4 10%
Limited populations of all rheophilic species. Critical life-stages of sensitive rheophilic species at risk or non-viable; all species persist 2.700 5 5 30%
Sensitive rheophilic species rare, critical stages of sensitive rheophilic species non-viable, and at risk for some less sensitive species. All species persist in the short-term
1.700 6 6
Most rheophilic species rare; All life-stages of sensitive rheophilic species at risk or non-viable. Most sensitive rheophilic species disappear
- 7 7
Remnant populations of some rheophilic species; all life stages of most rheophilic species at risk or non-viable, many rheophilic species disappear
0.290 8 8 10% 0
Mostly pool dwellers; all life stages of most rheophilic species non-viable; most or all rheophilic species disappear
- 9 9
Only specialists persist, virtually no development. - 10 10
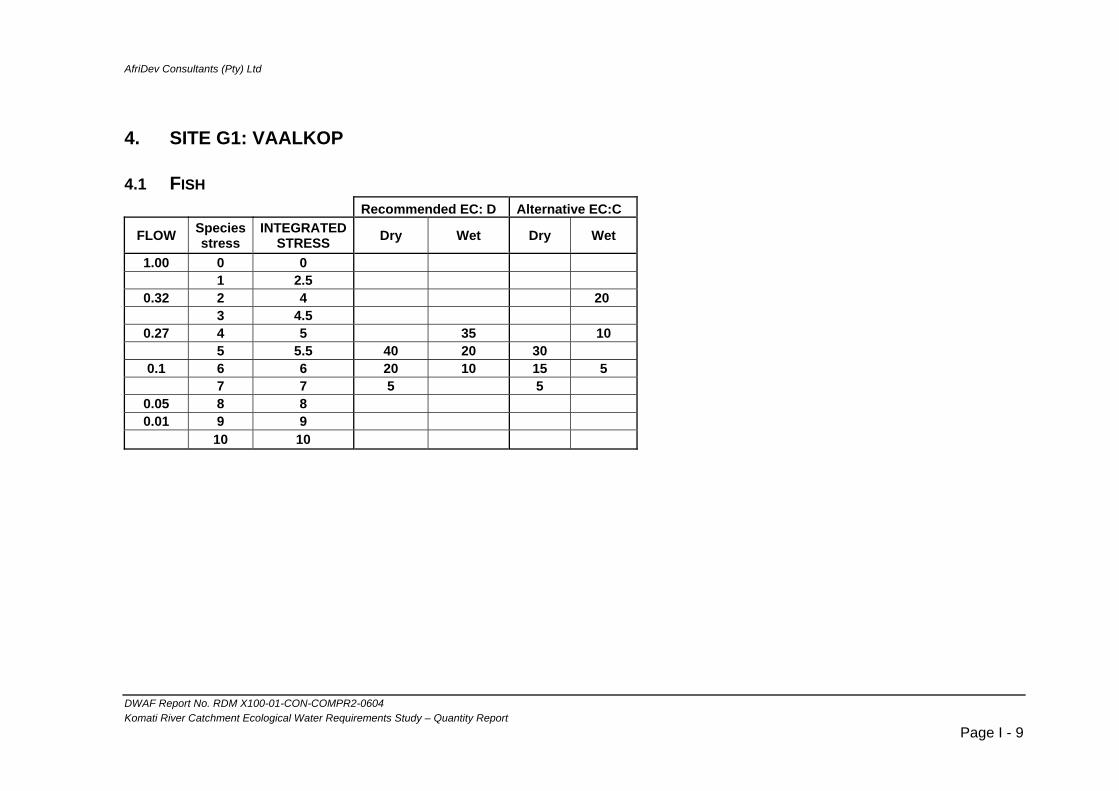
AfriDev Consultants (Pty) Ltd
4. SITE G1: VAALKOP
4.1 FISH Recommended EC: D Alternative EC:C
FLOW Species stress
INTEGRATED STRESS Dry Wet Dry Wet
1.00 0 0 1 2.5
0.32 2 4 20 3 4.5
0.27 4 5 35 10 5 5.5 40 20 30
0.1 6 6 20 10 15 5 7 7 5 5
0.05 8 8 0.01 9 9
10 10
DWAF Report No. RDM X100-01-CON-COMPR2-0604 Komati River Catchment Ecological Water Requirements Study – Quantity Report
Page I - 9
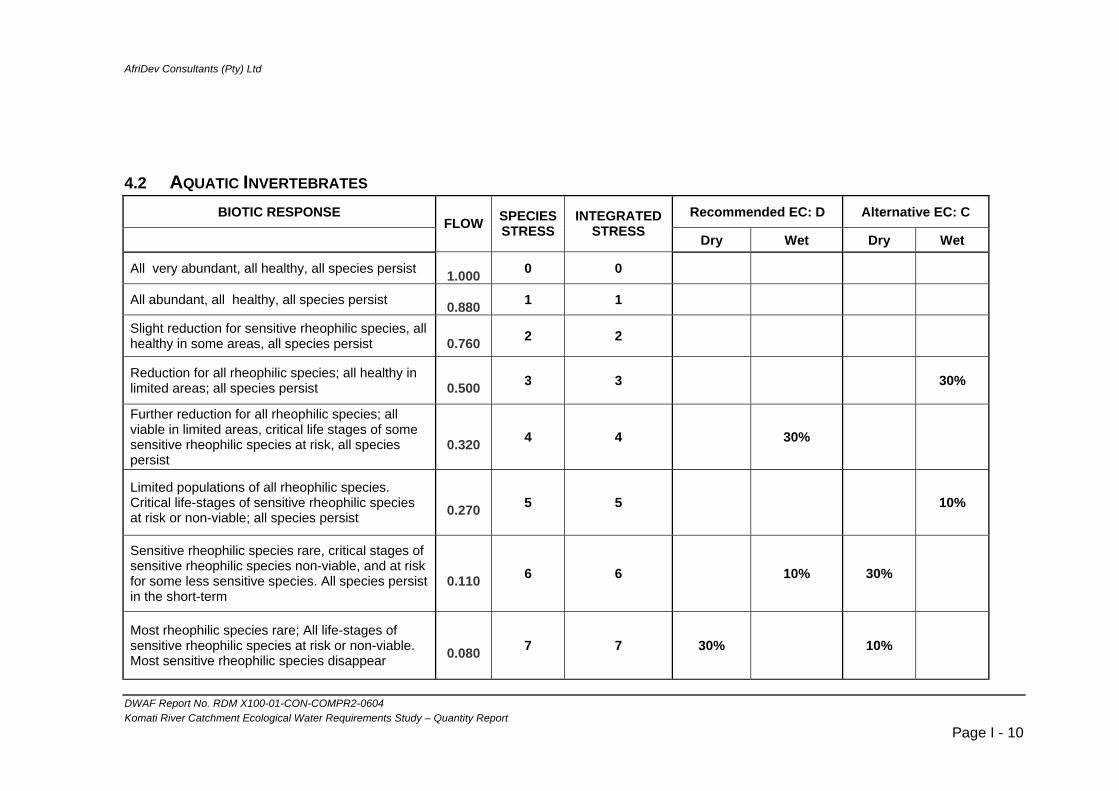
AfriDev Consultants (Pty) Ltd
4.2 AQUATIC INVERTEBRATES BIOTIC RESPONSE Recommended EC: D Alternative EC: C
FLOW SPECIES
STRESS INTEGRATED
STRESS Dry Wet Dry Wet
All very abundant, all healthy, all species persist 1.000 0 0
All abundant, all healthy, all species persist 0.880 1 1
Slight reduction for sensitive rheophilic species, all healthy in some areas, all species persist
0.760 2 2
Reduction for all rheophilic species; all healthy in limited areas; all species persist
0.500 3 3 30%
Further reduction for all rheophilic species; all viable in limited areas, critical life stages of some sensitive rheophilic species at risk, all species persist
0.320 4 4 30%
Limited populations of all rheophilic species. Critical life-stages of sensitive rheophilic species at risk or non-viable; all species persist
0.270 5 5 10%
Sensitive rheophilic species rare, critical stages of sensitive rheophilic species non-viable, and at risk for some less sensitive species. All species persist in the short-term
0.110 6 6 10% 30%
Most rheophilic species rare; All life-stages of sensitive rheophilic species at risk or non-viable. Most sensitive rheophilic species disappear
0.080 7 7 30% 10%
DWAF Report No. RDM X100-01-CON-COMPR2-0604 Komati River Catchment Ecological Water Requirements Study – Quantity Report
Page I - 10

AfriDev Consultants (Pty) Ltd
Remnant populations of some rheophilic species; all life stages of most rheophilic species at risk or non-viable, many rheophilic species disappear
0.050 8 8 10% 0
Mostly pool dwellers; all life stages of most rheophilic species non-viable; most or all rheophilic species disappear
0.004 9 9
Only specialists persist, virtually no development. - 10 10
DWAF Report No. RDM X100-01-CON-COMPR2-0604 Komati River Catchment Ecological Water Requirements Study – Quantity Report
Page I - 11
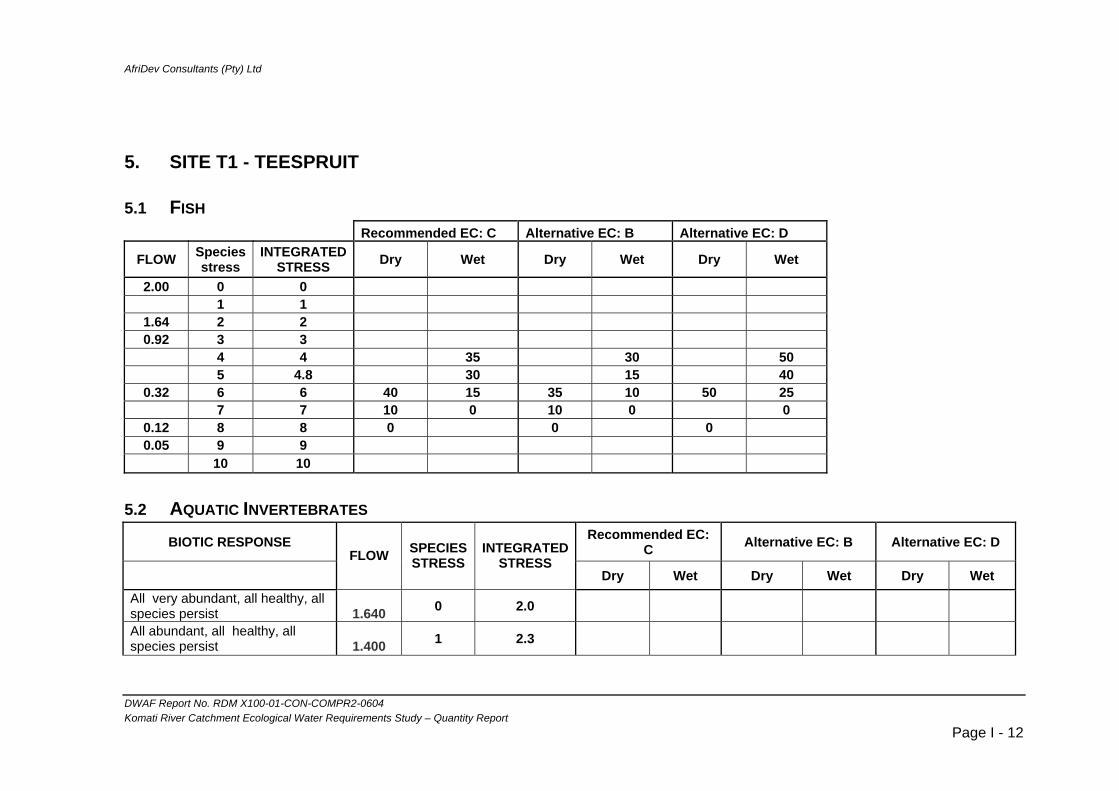
AfriDev Consultants (Pty) Ltd
5. SITE T1 - TEESPRUIT
5.1 FISH Recommended EC: C Alternative EC: B Alternative EC: D
FLOW Species stress
INTEGRATED STRESS Dry Wet Dry Wet Dry Wet
2.00 0 0 1 1
1.64 2 2 0.92 3 3
4 4 35 30 50 5 4.8 30 15 40
0.32 6 6 40 15 35 10 50 25 7 7 10 0 10 0 0
0.12 8 8 0 0 0 0.05 9 9
10 10
5.2 AQUATIC INVERTEBRATES BIOTIC RESPONSE Recommended EC:
C Alternative EC: B Alternative EC: D
FLOW SPECIES
STRESS INTEGRATED
STRESS Dry Wet Dry Wet Dry Wet
All very abundant, all healthy, all species persist
1.640 0 2.0
All abundant, all healthy, all species persist
1.400 1 2.3
DWAF Report No. RDM X100-01-CON-COMPR2-0604 Komati River Catchment Ecological Water Requirements Study – Quantity Report
Page I - 12
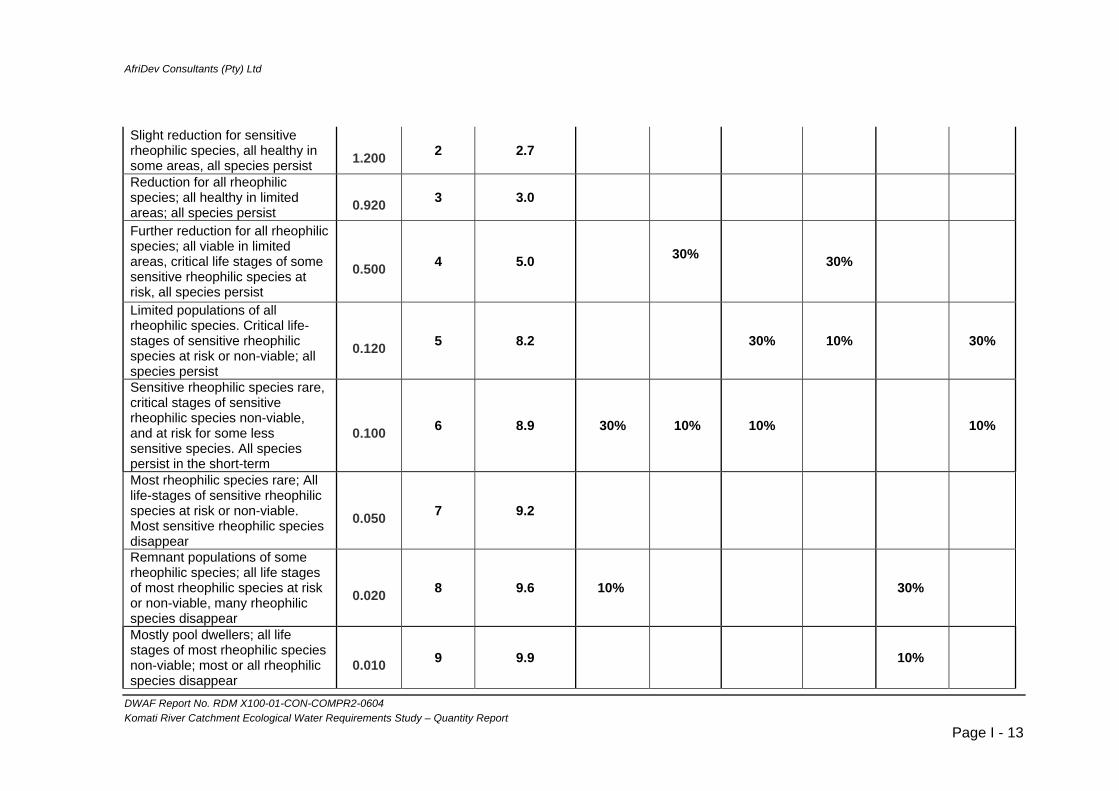
AfriDev Consultants (Pty) Ltd
Slight reduction for sensitive rheophilic species, all healthy in some areas, all species persist
1.200 2 2.7
Reduction for all rheophilic species; all healthy in limited areas; all species persist
0.920 3 3.0
Further reduction for all rheophilic species; all viable in limited areas, critical life stages of some sensitive rheophilic species at risk, all species persist
0.500 4 5.0 30%
30%
Limited populations of all rheophilic species. Critical life-stages of sensitive rheophilic species at risk or non-viable; all species persist
0.120 5 8.2 30% 10% 30%
Sensitive rheophilic species rare, critical stages of sensitive rheophilic species non-viable, and at risk for some less sensitive species. All species persist in the short-term
0.100 6 8.9 30% 10% 10% 10%
Most rheophilic species rare; All life-stages of sensitive rheophilic species at risk or non-viable. Most sensitive rheophilic species disappear
0.050 7 9.2
Remnant populations of some rheophilic species; all life stages of most rheophilic species at risk or non-viable, many rheophilic species disappear
0.020 8 9.6 10% 30%
Mostly pool dwellers; all life stages of most rheophilic species non-viable; most or all rheophilic species disappear
0.010 9 9.9 10%
DWAF Report No. RDM X100-01-CON-COMPR2-0604 Komati River Catchment Ecological Water Requirements Study – Quantity Report
Page I - 13

AfriDev Consultants (Pty) Ltd
Only specialists persist, virtually no development.
- 10 10.0
6. SITE L1 - KLEINDORINGKOP
6.1 FISH Recommended EC: C/D
FLOW Species stress
INTEGRATED STRESS Dry Wet
2.82 0 2 1.16 1 4
2 5 3 6.2 30
0.4 4 7.1 5 7.6 25 10
0.24 6 8 10 0 7 8.3 0 8 8.5
0.05 9 9 10 10
DWAF Report No. RDM X100-01-CON-COMPR2-0604 Komati River Catchment Ecological Water Requirements Study – Quantity Report
Page I - 14
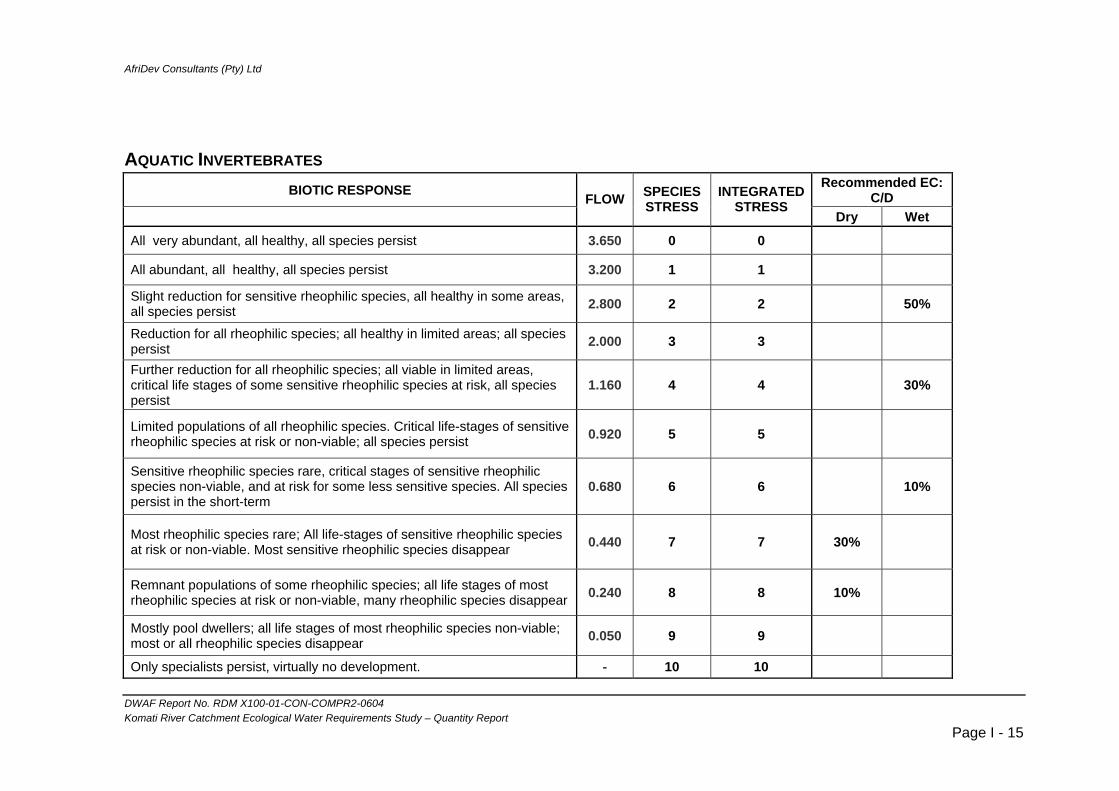
AfriDev Consultants (Pty) Ltd
AQUATIC INVERTEBRATES BIOTIC RESPONSE Recommended EC:
C/D
FLOW SPECIES STRESS
INTEGRATED STRESS
Dry Wet
All very abundant, all healthy, all species persist 3.650 0 0
All abundant, all healthy, all species persist 3.200 1 1
Slight reduction for sensitive rheophilic species, all healthy in some areas, all species persist 2.800 2 2 50%
Reduction for all rheophilic species; all healthy in limited areas; all species persist 2.000 3 3
Further reduction for all rheophilic species; all viable in limited areas, critical life stages of some sensitive rheophilic species at risk, all species persist
1.160 4 4 30%
Limited populations of all rheophilic species. Critical life-stages of sensitive rheophilic species at risk or non-viable; all species persist 0.920 5 5
Sensitive rheophilic species rare, critical stages of sensitive rheophilic species non-viable, and at risk for some less sensitive species. All species persist in the short-term
0.680 6 6 10%
Most rheophilic species rare; All life-stages of sensitive rheophilic species at risk or non-viable. Most sensitive rheophilic species disappear 0.440 7 7 30%
Remnant populations of some rheophilic species; all life stages of most rheophilic species at risk or non-viable, many rheophilic species disappear 0.240 8 8 10%
Mostly pool dwellers; all life stages of most rheophilic species non-viable; most or all rheophilic species disappear 0.050 9 9
Only specialists persist, virtually no development. - 10 10
DWAF Report No. RDM X100-01-CON-COMPR2-0604 Komati River Catchment Ecological Water Requirements Study – Quantity Report
Page I - 15
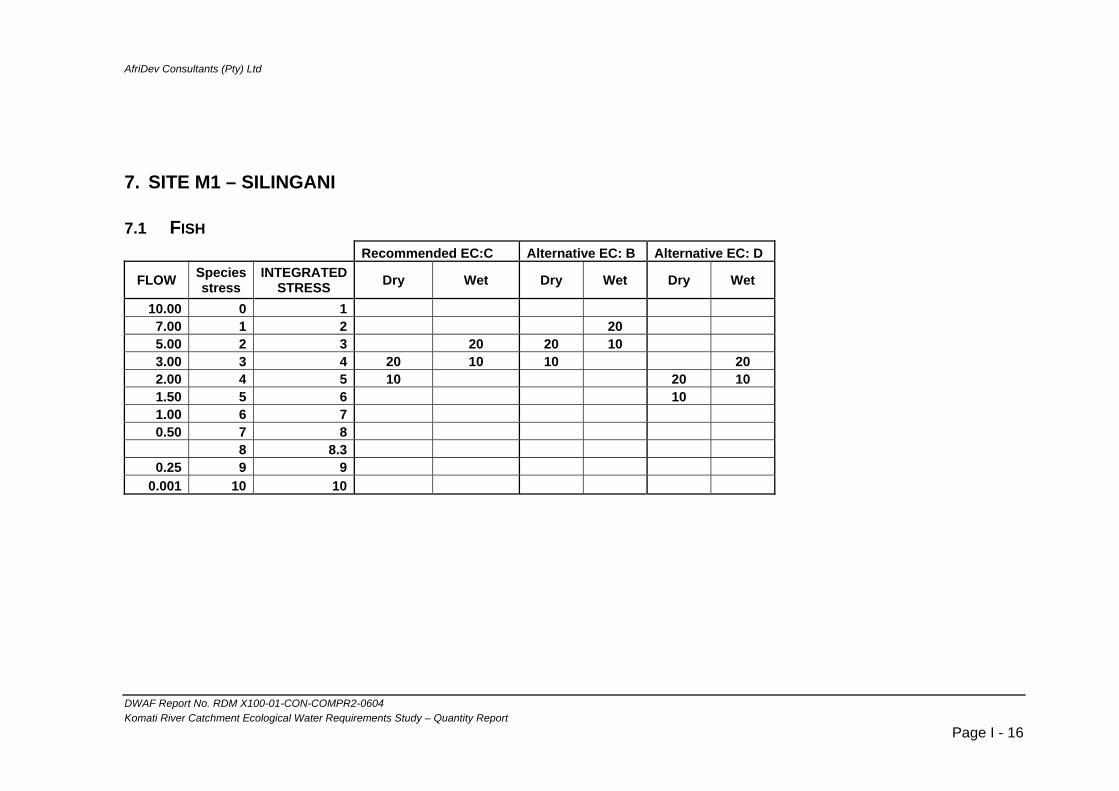
AfriDev Consultants (Pty) Ltd
7. SITE M1 – SILINGANI
7.1 FISH Recommended EC:C Alternative EC: B Alternative EC: D
FLOW Species stress
INTEGRATED STRESS Dry Wet Dry Wet Dry Wet
10.00 0 17.00 1 2 205.00 2 3 20 20 103.00 3 4 20 10 10 202.00 4 5 10 20 101.50 5 6 101.00 6 70.50 7 8
8 8.3 0.25 9 9
0.001 10 10
DWAF Report No. RDM X100-01-CON-COMPR2-0604 Komati River Catchment Ecological Water Requirements Study – Quantity Report
Page I - 16

AfriDev Consultants (Pty) Ltd
7.2 AQUATIC INVERTEBRATES BIOTIC RESPONSE Recommended EC:
C Alternative EC: B Alternative EC: D
FLOW SPECIES
STRESS INTEGRATED
STRESS Dry Wet Dry Wet Dry Wet
All very abundant, all healthy, all species persist 12 0 0
All abundant, all healthy, all species persist 10 1 1
1.5 1.5 30% Slight reduction for sensitive rheophilic species, all healthy in some areas, all species persist
7 2 2 30% 10%
2.5 2.5 10% 30% Reduction for all rheophilic species; all healthy in limited areas; all species persist
5 3 3
3.5 3.5 30% 10%
Further reduction for all rheophilic species; all viable in limited areas, critical life stages of some sensitive rheophilic species at risk, all species persist
3 4 4 30%
4.5 4.5 10%
DWAF Report No. RDM X100-01-CON-COMPR2-0604 Komati River Catchment Ecological Water Requirements Study – Quantity Report
Page I - 17
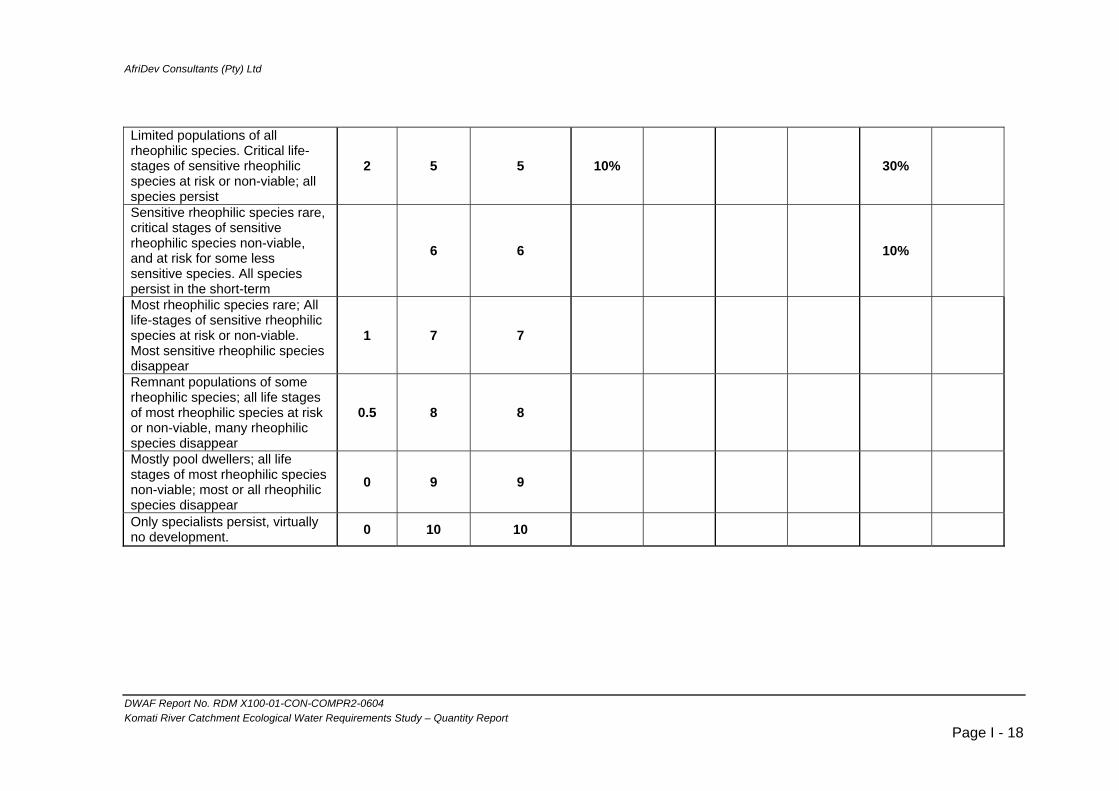
AfriDev Consultants (Pty) Ltd
Limited populations of all rheophilic species. Critical life-stages of sensitive rheophilic species at risk or non-viable; all species persist
2 5 5 10% 30%
Sensitive rheophilic species rare, critical stages of sensitive rheophilic species non-viable, and at risk for some less sensitive species. All species persist in the short-term
6 6 10%
Most rheophilic species rare; All life-stages of sensitive rheophilic species at risk or non-viable. Most sensitive rheophilic species disappear
1 7 7
Remnant populations of some rheophilic species; all life stages of most rheophilic species at risk or non-viable, many rheophilic species disappear
0.5 8 8
Mostly pool dwellers; all life stages of most rheophilic species non-viable; most or all rheophilic species disappear
0 9 9
Only specialists persist, virtually no development. 0 10 10
DWAF Report No. RDM X100-01-CON-COMPR2-0604 Komati River Catchment Ecological Water Requirements Study – Quantity Report
Page I - 18

AfriDev Consultants (Pty) Ltd
Appendix J: Flood Motivations
Table of Contents 1. SITE K1 - GEVONDEN................................................................................................................. 3
1.1 CLASS I ........................................................................................................................... 3 1.2 CLASS II .......................................................................................................................... 5 1.3 CLASS III ......................................................................................................................... 6 1.4 CLASS IV......................................................................................................................... 7 1.5 1:2 .................................................................................................................................. 9 1.6 1:5 ................................................................................................................................ 10
2. SITE K2 - KROMDRAAI............................................................................................................. 12
2.1 CLASS I ......................................................................................................................... 12 2.2 CLASS II ........................................................................................................................ 14 2.3 CLASS III ....................................................................................................................... 15 2.4 CLASS IV....................................................................................................................... 17
3. SITE K3 - TONGA ...................................................................................................................... 19
3.1 CLASS I ......................................................................................................................... 19 3.2 CLASS II ........................................................................................................................ 20 3.3 CLASS III ....................................................................................................................... 20 3.4 CLASS IV....................................................................................................................... 21 3.5 1:2 ................................................................................................................................ 21 3.6 1:10 .............................................................................................................................. 22
SITE G1: VAALKOP........................................................................................................................ 23
3.7 CLASS I ......................................................................................................................... 23 3.8 CLASS II ........................................................................................................................ 24 3.9 CLASS III ....................................................................................................................... 25 3.10 CLASS IV....................................................................................................................... 25 3.11 1:2 ................................................................................................................................ 26 3.12 1:5 ................................................................................................................................ 27
4. SITE T1 - TEESPRUIT ............................................................................................................... 28
4.1 CLASS I ......................................................................................................................... 28 4.2 CLASS II ........................................................................................................................ 30 4.3 CLASS III ....................................................................................................................... 31 4.4 CLASS IV....................................................................................................................... 32
DWAF Report No. RDM X100-01-CON-COMPR2-0604 Komati River Catchment Ecological Water Requirements Study – Quantity Report
Page J - 1
AfriDev Consultants (Pty) Ltd
DWAF Report No. RDM X100-01-CON-COMPR2-0604 Komati River Catchment Ecological Water Requirements Study – Quantity Report
Page J - 2
4.5 1:2 ................................................................................................................................ 34 4.6 1:5 ................................................................................................................................ 36
5. SITE L1 - KLEINDORINGKOP................................................................................................... 38
5.1 CLASS I ......................................................................................................................... 38 5.2 CLASS II ........................................................................................................................ 38 5.3 CLASS III ....................................................................................................................... 39 5.4 CLASS IV....................................................................................................................... 40 5.5 1:2 ................................................................................................................................ 41 5.6 1:5 ................................................................................................................................ 41
6. SITE M1 – SILINGANI................................................................................................................ 43
6.1 CLASS I ......................................................................................................................... 43 6.2 CLASS II ........................................................................................................................ 45 6.3 CLASS III ....................................................................................................................... 46 6.4 CLASS IV....................................................................................................................... 47 6.5 1:2 ................................................................................................................................ 48 6.6 1:5 ................................................................................................................................ 50 6.7 1:20 .............................................................................................................................. 51
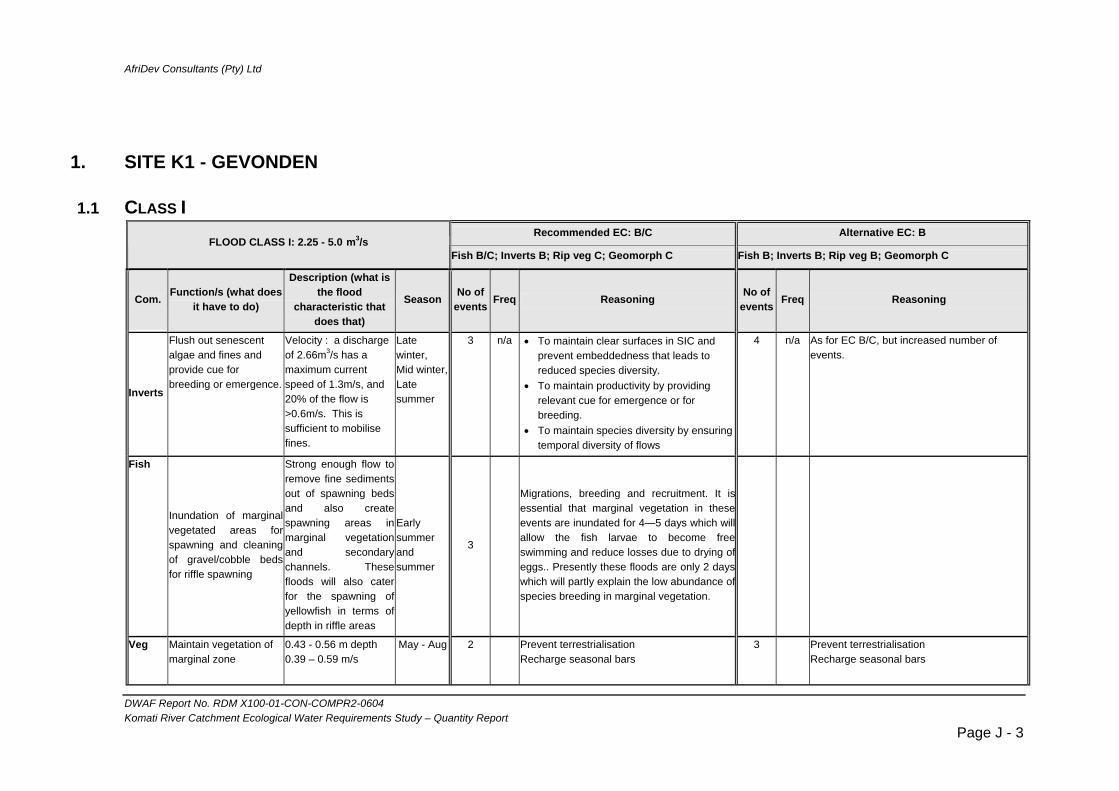
AfriDev Consultants (Pty) Ltd
1. SITE K1 - GEVONDEN
1.1 CLASS I Recommended EC: B/C Alternative EC: B
FLOOD CLASS I: 2.25 - 5.0 m3/s Fish B/C; Inverts B; Rip veg C; Geomorph C Fish B; Inverts B; Rip veg B; Geomorph C
Com. Function/s (what does it have to do)
Description (what is the flood
characteristic that does that)
Season No of events Freq Reasoning No of
events Freq Reasoning
Inverts
Flush out senescent algae and fines and provide cue for breeding or emergence.
Velocity : a discharge of 2.66m3/s has a maximum current speed of 1.3m/s, and 20% of the flow is >0.6m/s. This is sufficient to mobilise fines.
Late winter, Mid winter,Late summer
3 n/a • To maintain clear surfaces in SIC and prevent embeddedness that leads to reduced species diversity.
• To maintain productivity by providing relevant cue for emergence or for breeding.
• To maintain species diversity by ensuring temporal diversity of flows
4 n/a As for EC B/C, but increased number of events.
Fish
Inundation of marginalvegetated areas forspawning and cleaningof gravel/cobble bedsfor riffle spawning
Strong enough flow to remove fine sediments out of spawning beds and also create spawning areas inmarginal vegetationand secondarchannels. Thesefloods will also cater for the spawning of yellowfish in terms of depth in riffle areas
y
Early summer and summer
3
Migrations, breeding and recruitment. It isessential that marginal vegetation in theseevents are inundated for 4—5 days which willallow the fish larvae to become freeswimming and reduce losses due to drying ofeggs.. Presently these floods are only 2 dayswhich will partly explain the low abundance ofspecies breeding in marginal vegetation.
Veg Maintain vegetation of marginal zone
0.43 - 0.56 m depth 0.39 – 0.59 m/s
May - Aug 2 Prevent terrestrialisation Recharge seasonal bars
3 Prevent terrestrialisationRecharge seasonal bars
DWAF Report No. RDM X100-01-CON-COMPR2-0604 Komati River Catchment Ecological Water Requirements Study – Quantity Report
Page J - 3
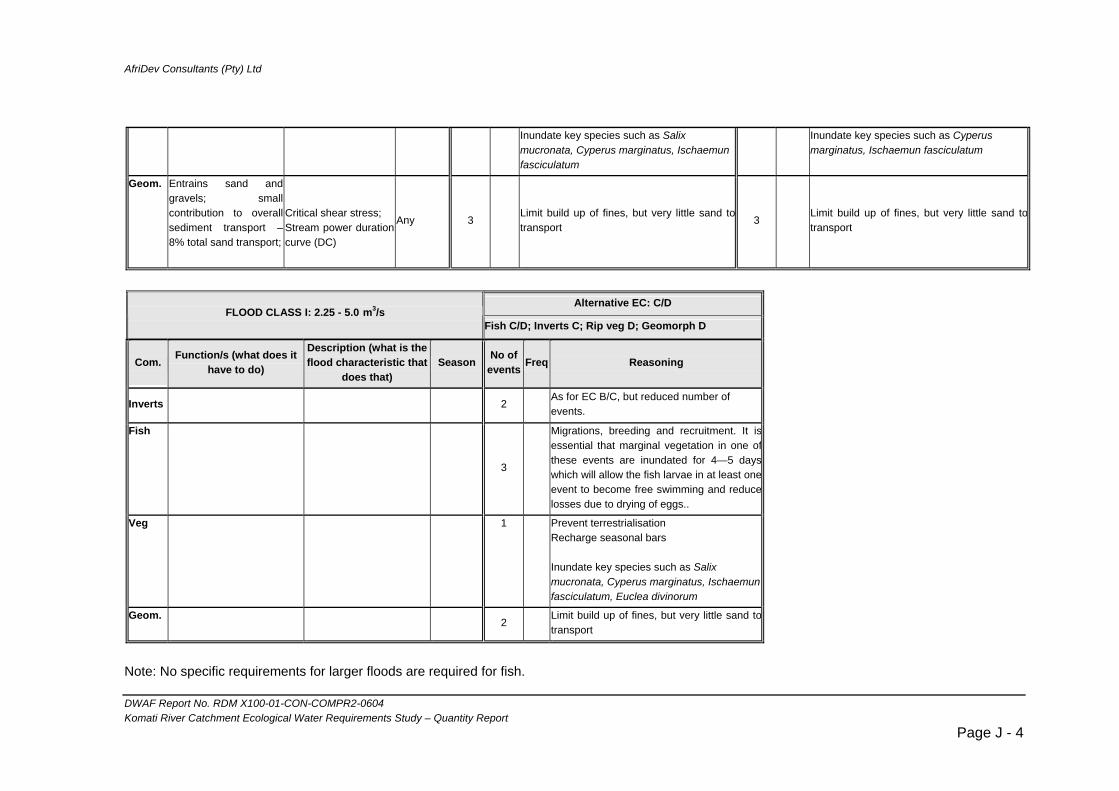
AfriDev Consultants (Pty) Ltd
Inundate key species such as Salix mucronata, Cyperus marginatus, Ischaemun fasciculatum
Inundate key species such as Cyperus marginatus, Ischaemun fasciculatum
Geom. Entrains sand and gravels; small contribution to overallsediment transport –8% total sand transport;
Critical shear stress; Stream power durationcurve (DC)
Any 3
Limit build up of fines, but very little sand totransport
3 Limit build up of fines, but very little sand totransport
Alternative EC: C/D
FLOOD CLASS I: 2.25 - 5.0 m3/s Fish C/D; Inverts C; Rip veg D; Geomorph D
Com. Function/s (what does it have to do)
Description (what is the flood characteristic that
does that) Season No of
events Freq Reasoning
Inverts 2 As for EC B/C, but reduced number of events.
Fish
3
Migrations, breeding and recruitment. It isessential that marginal vegetation in one ofthese events are inundated for 4—5 dayswhich will allow the fish larvae in at least oneevent to become free swimming and reducelosses due to drying of eggs..
Veg
1 Prevent terrestrialisationRecharge seasonal bars Inundate key species such as Salix mucronata, Cyperus marginatus, Ischaemun fasciculatum, Euclea divinorum
Geom. 2
Limit build up of fines, but very little sand totransport
Note: No specific requirements for larger floods are required for fish.
DWAF Report No. RDM X100-01-CON-COMPR2-0604 Komati River Catchment Ecological Water Requirements Study – Quantity Report
Page J - 4
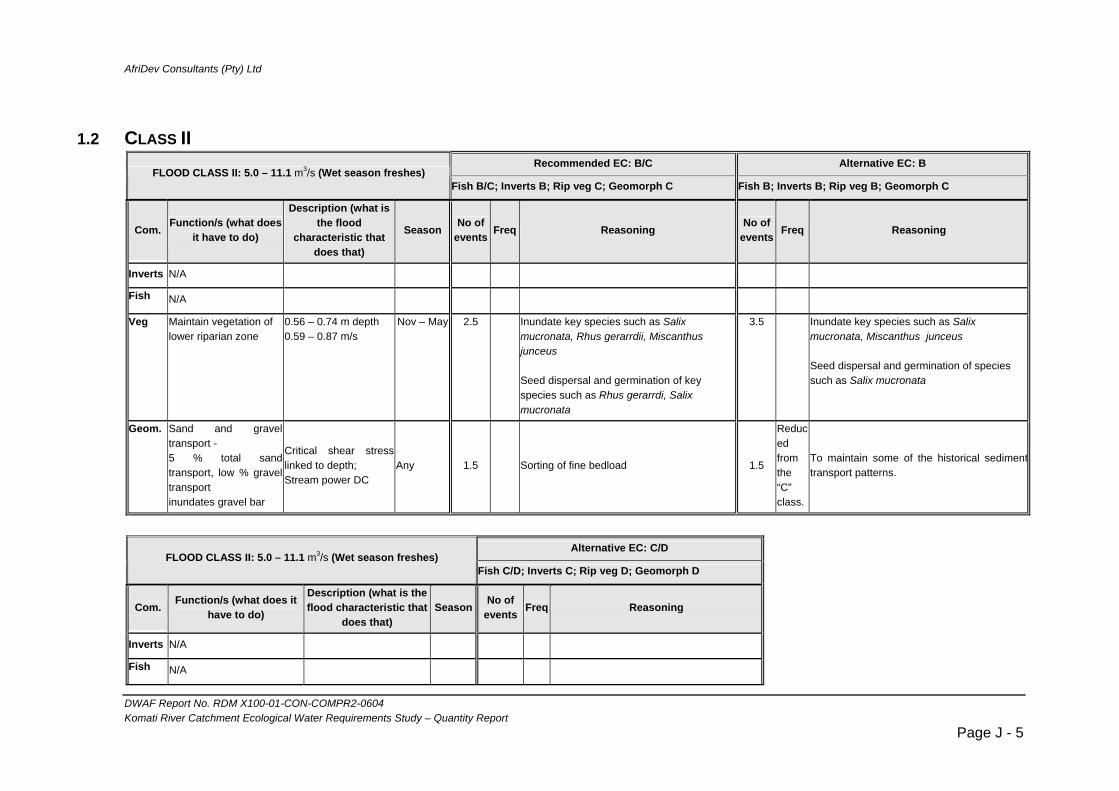
AfriDev Consultants (Pty) Ltd
1.2 CLASS II
Recommended EC: B/C Alternative EC: B FLOOD CLASS II: 5.0 – 11.1 m3/s (Wet season freshes)
Fish B/C; Inverts B; Rip veg C; Geomorph C Fish B; Inverts B; Rip veg B; Geomorph C
Com. Function/s (what does it have to do)
Description (what is the flood
characteristic that does that)
Season No of events Freq Reasoning No of
events Freq Reasoning
Inverts N/A
Fish N/A
Veg Maintain vegetation of lower riparian zone
0.56 – 0.74 m depth 0.59 – 0.87 m/s
Nov – May 2.5 Inundate key species such as Salix mucronata, Rhus gerarrdii, Miscanthus junceus Seed dispersal and germination of key species such as Rhus gerarrdi, Salix mucronata
3.5 Inundate key species such as Salix mucronata, Miscanthus junceus Seed dispersal and germination of species such as Salix mucronata
Geom. Sand and gravel transport - 5 % total sandtransport, low % graveltransport
Critical shear stress linked to depth;
inundates gravel bar
Stream power DC Any 1.5 Sorting of fine bedload 1.5
Reduced from the “C” class.
To maintain some of the historical sedimenttransport patterns.
Alternative EC: C/D
FLOOD CLASS II: 5.0 – 11.1 m3/s (Wet season freshes) Fish C/D; Inverts C; Rip veg D; Geomorph D
Com. Function/s (what does it have to do)
Description (what is the flood characteristic that
does that) Season No of
events Freq Reasoning
Inverts N/A
Fish N/A
DWAF Report No. RDM X100-01-CON-COMPR2-0604 Komati River Catchment Ecological Water Requirements Study – Quantity Report
Page J - 5
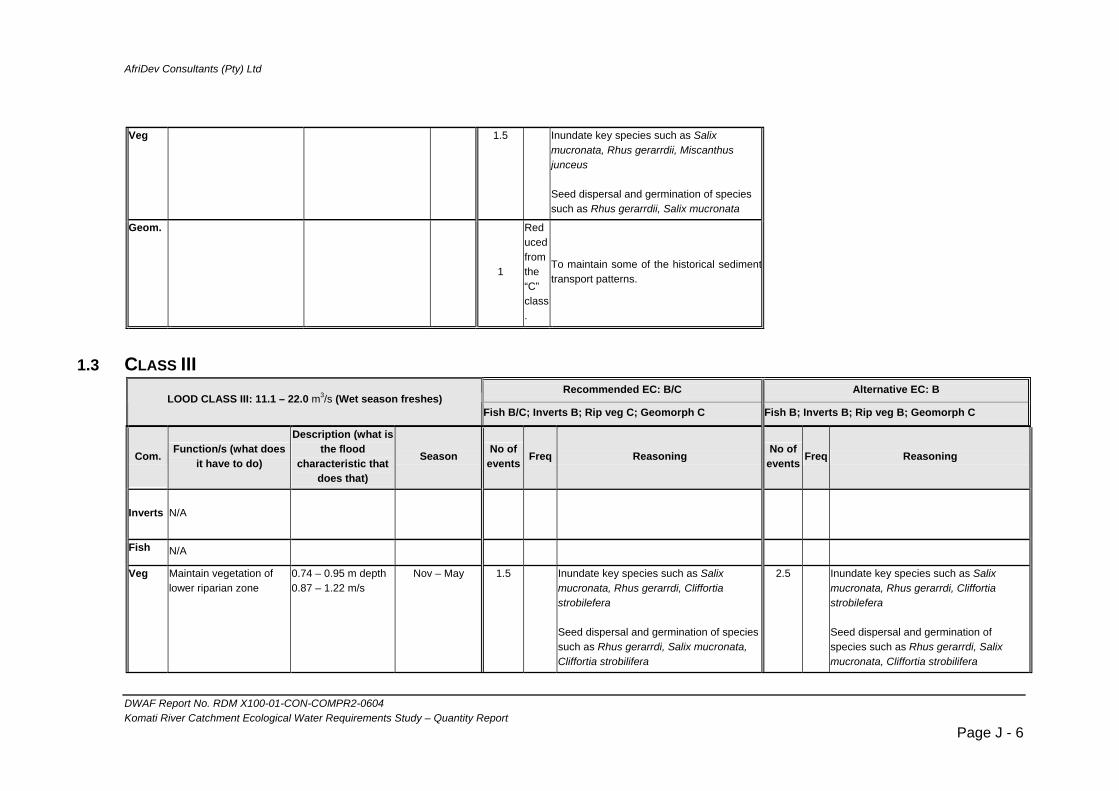
AfriDev Consultants (Pty) Ltd
Veg
1.5 Inundate key species such as Salix mucronata, Rhus gerarrdii, Miscanthus junceus Seed dispersal and germination of species such as Rhus gerarrdii, Salix mucronata
Geom.
1 To maintain some of the historical sedimen
Reduced from the “C” class.
ttransport patterns.
1.3 CLASS III Recommended EC: B/C Alternative EC: B
LOOD CLASS III: 11.1 – 22.0 m3/s (Wet season freshes) Fish B/C; Inverts B; Rip veg C; Geomorph C Fish B; Inverts B; Rip veg B; Geomorph C
Com. Function/s (what does it have to do)
Description (what is the flood
characteristic that does that)
Season No of events Freq Reasoning No of
events Freq Reasoning
Inverts N/A
Fish N/A
Veg Maintain vegetation of lower riparian zone
0.74 – 0.95 m depth 0.87 – 1.22 m/s
Nov – May 1.5 Inundate key species such as Salix mucronata, Rhus gerarrdi, Cliffortia strobilefera Seed dispersal and germination of species such as Rhus gerarrdi, Salix mucronata, Cliffortia strobilifera
2.5 Inundate key species such as Salix mucronata, Rhus gerarrdi, Cliffortia strobilefera Seed dispersal and germination of species such as Rhus gerarrdi, Salix mucronata, Cliffortia strobilifera
DWAF Report No. RDM X100-01-CON-COMPR2-0604 Komati River Catchment Ecological Water Requirements Study – Quantity Report
Page J - 6
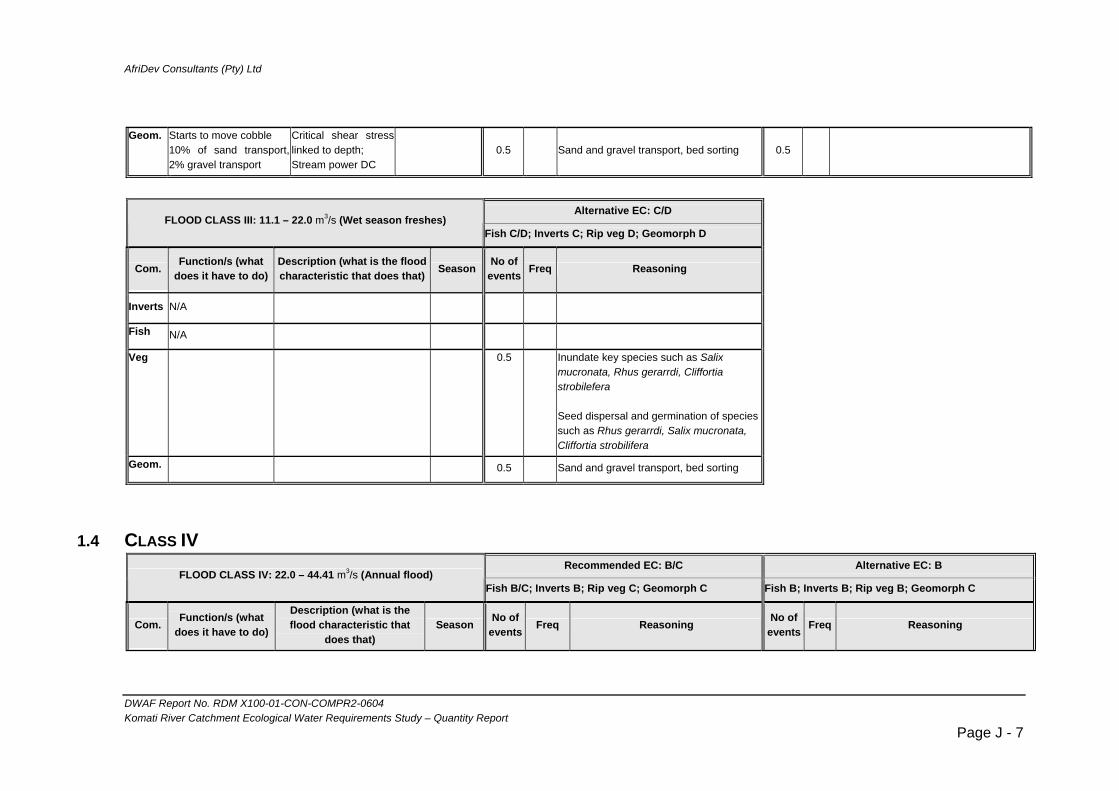
AfriDev Consultants (Pty) Ltd
Geom. Starts to move cobble
10% of sand transport,2% gravel transport
Critical shear stress linked to depth; Stream power DC
0.5 Sand and gravel transport, bed sorting 0.5
Alternative EC: C/D
FLOOD CLASS III: 11.1 – 22.0 m3/s (Wet season freshes) Fish C/D; Inverts C; Rip veg D; Geomorph D
Com. Function/s (what does it have to do)
Description (what is the flood characteristic that does that) Season No of
events Freq Reasoning
Inverts N/A
Fish N/A
Veg
0.5 Inundate key species such as Salix mucronata, Rhus gerarrdi, Cliffortia strobilefera Seed dispersal and germination of species such as Rhus gerarrdi, Salix mucronata, Cliffortia strobilifera
Geom. 0.5 Sand and gravel transport, bed sorting
1.4 CLASS IV Recommended EC: B/C Alternative EC: B
FLOOD CLASS IV: 22.0 – 44.41 m3/s (Annual flood) Fish B/C; Inverts B; Rip veg C; Geomorph C Fish B; Inverts B; Rip veg B; Geomorph C
Com. Function/s (what does it have to do)
Description (what is the flood characteristic that
does that) Season No of
events Freq Reasoning No of events Freq Reasoning
DWAF Report No. RDM X100-01-CON-COMPR2-0604 Komati River Catchment Ecological Water Requirements Study – Quantity Report
Page J - 7
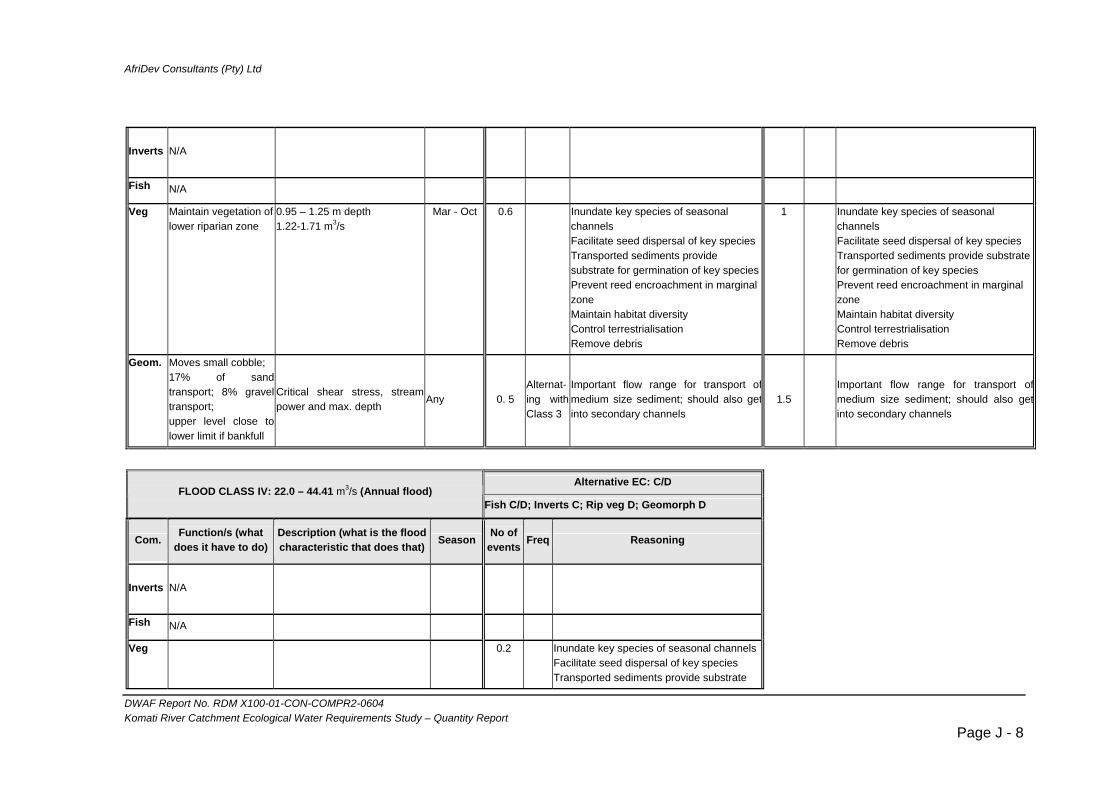
AfriDev Consultants (Pty) Ltd
Inverts N/A
Fish N/A
Veg Maintain vegetation of lower riparian zone
0.95 – 1.25 m depth 1.22-1.71 m3/s
Mar - Oct 0.6 Inundate key species of seasonal channels Facilitate seed dispersal of key species Transported sediments provide substrate for germination of key speciesPrevent reed encroachment in marginal zone Maintain habitat diversity Control terrestrialisation Remove debris
1 Inundate key species of seasonal channels Facilitate seed dispersal of key species Transported sediments provide substrate for germination of key species Prevent reed encroachment in marginal zone Maintain habitat diversity Control terrestrialisation Remove debris
Geom. Moves small cobble; 17% of sand transport; 8% graveltransport;
Critical shear stress, stream power and max. depth
upper level close to lower limit if bankfull
Any 0. 5 Alternat-ing withClass 3
Important flow range for transport ofmedium size sediment; should also getinto secondary channels
1.5 Important flow range for transport ofmedium size sediment; should also getinto secondary channels
Alternative EC: C/D
FLOOD CLASS IV: 22.0 – 44.41 m3/s (Annual flood) Fish C/D; Inverts C; Rip veg D; Geomorph D
Com. Function/s (what does it have to do)
Description (what is the flood characteristic that does that) Season No of
events Freq Reasoning
Inverts N/A
Fish N/A
Veg
0.2 Inundate key species of seasonal channelsFacilitate seed dispersal of key species Transported sediments provide substrate
DWAF Report No. RDM X100-01-CON-COMPR2-0604 Komati River Catchment Ecological Water Requirements Study – Quantity Report
Page J - 8

AfriDev Consultants (Pty) Ltd
for germination of key species Prevent reed encroachment in marginal zone Maintain habitat diversity Control terrestrialisation Remove debris
Geom. 0.5
To maintain some of the historical sedimenttransport potential.
1.5 1:2 Recommended EC: B/C Alternative EC: B
1:2 FLOOD CLASS: 49.3 m3/s Fish B/C; Inverts B; Rip veg C; Geomorph C Fish B; Inverts B; Rip veg B; Geomorph C
Com. Function/s (what does it have to do)
Description (what is the flood characteristic that
does that) Season No of
events Freq Reasoning No of events Freq Reasoning
Inverts N/A
Fish N/A
Veg N/A
Geom. Moves small cobble; 59% sand transport; 25 %gravel transport;
Critical shear stress, stream power and max.depth
= bankfull Q
Any 1 1:2
Effective discharge for sediment transport,bed sorting and preventing vegetationencroachment
1 AnnualEffective discharge for sedimenttransport and preventing vegetationencroachment
Alternative EC: C/D
1:2 FLOOD CLASS: 49.3 m3/ Fish C/D; Inverts C; Rip veg D; Geomorph D
Com. Function/s (what does it have to do)
Description (what is the flood characteristic that
does that) Season No of
events Freq Reasoning
DWAF Report No. RDM X100-01-CON-COMPR2-0604 Komati River Catchment Ecological Water Requirements Study – Quantity Report
Page J - 9

AfriDev Consultants (Pty) Ltd
Inverts N/A
Fish N/A
Veg N/A
Geom. 1
Effective discharge for sediment transport,bed sorting and preventing vegetationencroachment
1:3
1.6 1:5 Recommended EC: B/C Alternative EC: B
1:5 FLOOD CLASS: 81.88 m3/ Fish B/C; Inverts B; Rip veg C; Geomorph C Fish B; Inverts B; Rip veg B; Geomorph C
Com. Function/s (what does it have to do)
Description (what is the flood characteristic that
does that) Season
No of event
s Freq Reasoning No of
events Freq Reasoning
Inverts N/A
Fish N/A
Veg N/A
Geom. Overtops banks, Upper limit of effectivestream power; some cobblemovement.
Critical shear stress, stream power and max.depth
Any
1:5 year return interval
Active entrainment of cobble, bed sorting,inhibits vegetation encroachment,especially in secondary channels.
1:2 year return interval
Open up secondary channels
DWAF Report No. RDM X100-01-CON-COMPR2-0604 Komati River Catchment Ecological Water Requirements Study – Quantity Report
Page J - 10
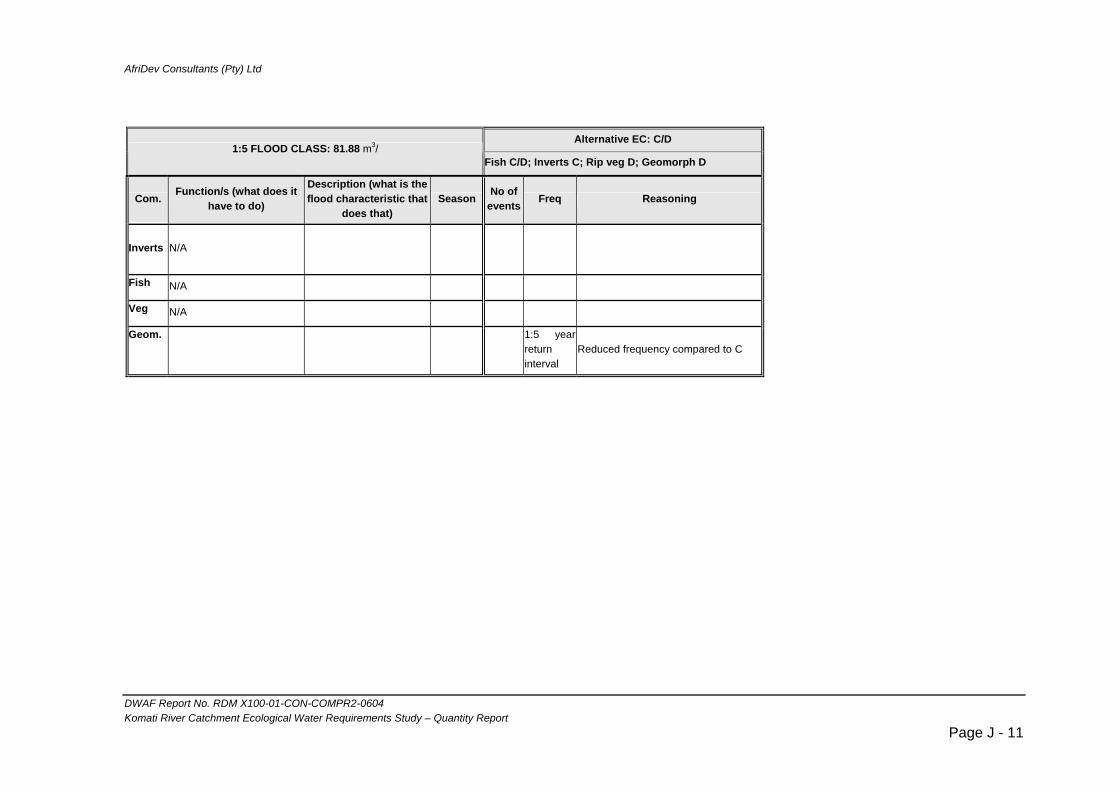
AfriDev Consultants (Pty) Ltd
Alternative EC: C/D
1:5 FLOOD CLASS: 81.88 m3/ Fish C/D; Inverts C; Rip veg D; Geomorph D
Com. Function/s (what does it have to do)
Description (what is the flood characteristic that
does that) Season No of
events Freq Reasoning
Inverts N/A
Fish N/A
Veg N/A
Geom.
1:5 year return interval
Reduced frequency compared to C
DWAF Report No. RDM X100-01-CON-COMPR2-0604 Komati River Catchment Ecological Water Requirements Study – Quantity Report
Page J - 11

AfriDev Consultants (Pty) Ltd
2. SITE K2 - KROMDRAAI
2.1 CLASS I Recommended EC: C Alternative EC: B
FLOOD CLASS I: 4.8 – 9.71 m3/s Fish B/C; Inverts C; Rip veg C; Geomorph C/D Fish B; Inverts B; Rip veg B; Geomorph B/ C
Com. Function/s (what does it have to do)
Description (what is the flood characteristic that
does that) Season No of
events Freq Reasoning No of events Freq Reasoning
Inverts
Flush out senescent algae and fines and provide cue for breeding or emergence. Provide sufficient current speed to discourage bilharzias snail populations. To maintain clear surfaces in SIC and prevent embeddedness that leads to reduced species diversity. To maintain productivity by providing relevant cue for emergence or for breeding. To maintain species diversity by ensuring temporal diversity of flows
Velocity: a discharge of 5.5m3/s has a maximum current speed of 1.4m/s, and 36% of the flow is >0.6m/s. This is sufficient to mobilise fines and discourage bilharzias snails.
Late winter, Mid winter, Late summer
3 n/a • There are presently three Class 1 floods passing and the PES for invertebrates is Category C
4 n/a As for EC C, but increased number of events.
Fish Inundation of marginal vegetated areas for spawning and cleaning of gravel/cobble beds for riffle spawning
Strong enough flow to remove fine sediments out of spawning beds and also create spawning areas in marginal vegetation and secondary channels. These floods will also cater for the spawning of
Early summer and summer
3 Important for migrations, breeding and recruitment. It is essential that marginal vegetation in these events are inundated for 4—5 days which will allow the fish larvae to become free swimming and reduce losses due to drying of eggs.. Most of the fish are serial spawners and this will provide
3 Important for migrations, breeding and recruitment. It is essential that marginal vegetation in these events are inundated for 4—5 days which will allow the fish larvae to become free swimming and reduce losses due to drying of eggs.. Most of the fish are serial spawners and need more than
DWAF Report No. RDM X100-01-CON-COMPR2-0604 Komati River Catchment Ecological Water Requirements Study – Quantity Report
Page J - 12
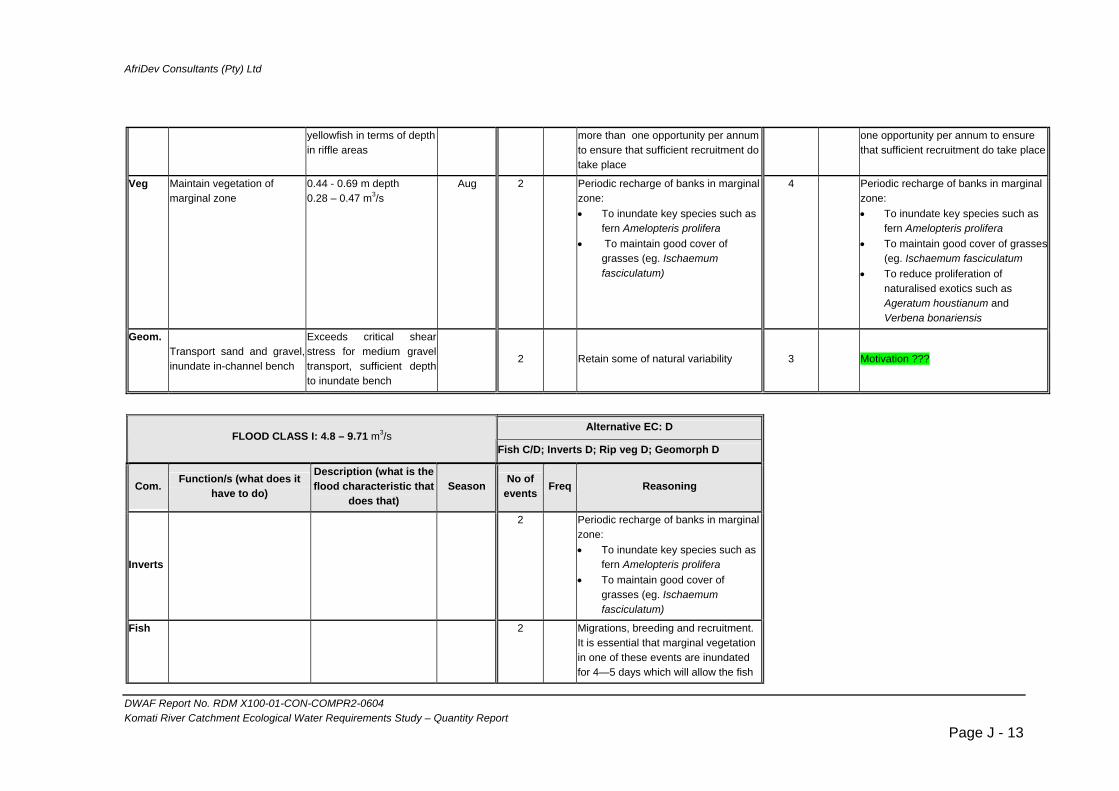
AfriDev Consultants (Pty) Ltd
yellowfish in terms of depth in riffle areas
more than one opportunity per annum to ensure that sufficient recruitment do take place
one opportunity per annum to ensure that sufficient recruitment do take place
Veg Maintain vegetation of marginal zone
0.44 - 0.69 m depth 0.28 – 0.47 m3/s
Aug 2 Periodic recharge of banks in marginal zone: • To inundate key species such as
fern Amelopteris prolifera • To maintain good cover of
grasses (eg. Ischaemum fasciculatum)
4 Periodic recharge of banks in marginal zone: • To inundate key species such as
fern Amelopteris prolifera • To maintain good cover of grasses
(eg. Ischaemum fasciculatum • To reduce proliferation of
naturalised exotics such as Ageratum houstianum and Verbena bonariensis
Geom. Transport sand and gravel,inundate in-channel bench
Exceeds critical shear stress for medium gravel transport, sufficient depthto inundate bench
2 Retain some of natural variability 3 Motivation ???
Alternative EC: D
FLOOD CLASS I: 4.8 – 9.71 m3/s Fish C/D; Inverts D; Rip veg D; Geomorph D
Com. Function/s (what does it have to do)
Description (what is the flood characteristic that
does that) Season No of
events Freq Reasoning
Inverts
2 Periodic recharge of banks in marginal zone: • To inundate key species such as
fern Amelopteris prolifera • To maintain good cover of
grasses (eg. Ischaemum fasciculatum)
Fish
2
Migrations, breeding and recruitment. It is essential that marginal vegetation in one of these events are inundated for 4—5 days which will allow the fish
DWAF Report No. RDM X100-01-CON-COMPR2-0604 Komati River Catchment Ecological Water Requirements Study – Quantity Report
Page J - 13

AfriDev Consultants (Pty) Ltd
larvae in at least one event to become free swimming and reduce losses due to drying of eggs. Most of the fish are serial spawners this will provide at least one opportunity per annum to ensure that some recruitment do take place.
Veg
0 Species such as fern Amelopteris prolifera may no longer be available forinundation
Geom. 1 Reduced variability
2.2 CLASS II Recommended EC: C Alternative EC: B
FLOOD CLASS II: 9.71 – 19.42 m3/s Fish B/C; Inverts C; Rip veg C; Geomorph C/D Fish B; Inverts B; Rip veg B; Geomorph B/ C
Com. Function/s (what does it have to do)
Description (what is the flood characteristic
that does that) Season No of
events Freq Reasoning No of events Freq Reasoning
Inverts N/A •
Fish N/A
Veg Maintain vegetation of lower riparian zone
0.69 – 1.16 m depth 0.47 - 0.81 m/s
Nov - May 2 Periodic recharge of lower riparian slopes: • To inundate key species such as Salix
mucronata and Cyperus marginatus • To saturate rooting zone of species
such as Ficus sycomorus and Combretum erythrophyllum
• To inundate key species of seasonal channels
• To prevent reed encroachment in marginal zone.
3 Periodic recharge of lower riparian slopes: • To inundate key species such as Salix
mucronata and Cyperus marginatus • To saturate rooting zone of species such
as Ficus sycomorus and Combretum erythrophyllum
• To inundate key species of seasonal channels
• To prevent reed encroachment in marginal zone
• To reduce proliferation of naturalised
DWAF Report No. RDM X100-01-CON-COMPR2-0604 Komati River Catchment Ecological Water Requirements Study – Quantity Report
Page J - 14

AfriDev Consultants (Pty) Ltd
exotic grass Paspalum dilatatum
Geom. Intermediate to Classes Iand III
Exceeds critical shear stress for range of gravels
any 1 Retain variability of flows
Alternative EC: D
FLOOD CLASS II: 9.71 – 19.42 m3/s Fish C/D; Inverts D; Rip veg D; Geomorph D
Com. Function/s (what does it have to do)
Description (what is the flood characteristic that
does that) Season No of
events Freq Reasoning
Inverts N/A
Fish N/A
Veg
1 • Reeds already severely encroached into marginal zone
• Salix mucronata already displaced
Geom. N/A
2.3 CLASS III Recommended EC: C Alternative EC: B
FLOOD CLASS III: 19.42 – 38.84 m3/s Fish B/C; Inverts C; Rip veg C; Geomorph C/D Fish B; Inverts B; Rip veg B; Geomorph B/ C
Com. Function/s (what does it have to do)
Description (what is the flood
characteristic that does that)
Season No of events Freq Reasoning No of
events Freq Reasoning
Inverts N/A
Fish N/A
DWAF Report No. RDM X100-01-CON-COMPR2-0604 Komati River Catchment Ecological Water Requirements Study – Quantity Report
Page J - 15

AfriDev Consultants (Pty) Ltd
Veg Maintain vegetation of
lower riparian zone 1.16 – 1.58 m depth 0.81 - 0.99 m/s
Nov - Apr 2 Periodic recharge of lower riparian slopes: • To saturate rooting zone of species such
as Ficus sycomorus and Combretum erythrophyllum
• To inundate key species of seasonal channels
• To prevent reed encroachment in marginal zone
3 Periodic recharge of lower riparian slopes: • To saturate rooting zone of species such
as Ficus sycomorus and Combretum erythrophyllum
• To inundate key species of seasonal channels
• To prevent reed encroachment in marginal zone
• To reduce proliferation of naturalised exotic grass Paspalum dilatatum
Geom. Transport sand andgravel, inundate in-channel bench
Exceeds critical shear stress for medium gravel transport, sufficient depth to inundate bench
2 Retain some of natural variability
Alternative EC: D
FLOOD CLASS III: 19.42 – 38.84 m3/s Fish C/D; Inverts D; Rip veg D; Geomorph D
Com. Function/s (what does it have to do)
Description (what is the flood
characteristic that does that)
Season No of events Freq Reasoning
Inverts N/A
Fish N/A
Veg
0.5 • Reeds already severely encroached into marginal zone
• Seasonal channels silted up.
Geom. 2
Maintain frequency to compensate loss ofclass IV flows
DWAF Report No. RDM X100-01-CON-COMPR2-0604 Komati River Catchment Ecological Water Requirements Study – Quantity Report
Page J - 16

AfriDev Consultants (Pty) Ltd
2.4 CLASS IV
Recommended EC: C Alternative EC: B FLOOD CLASS IV: 38.84 – 77.86 m3/s (annual flood)
Fish B/C; Inverts C; Rip veg C; Geomorph C/D Fish B; Inverts B; Rip veg B; Geomorph B/ C
Com. Function/s (what does it have to do)
Description (what is the flood
characteristic that does that)
Season
No of
events
Freq Reasoning No of events Freq Reasoning
Inverts N/A
Fish N/A
Veg Maintain vegetation of upper riparian zone
1.58 – 2.06 m depth 0.99 – 1.17 m/s
Dec, Jan or Feb
1 • Facilitate seed dispersal of key species of lower riparian zone (eg. Combretum erythrophyllum and Ficus sycomorus)
• Transported sediments provide substrate for germination of key species.
• Maintain habitat diversity. • Control terrestrialisation of lower riparian
zone. • Remove debris and scour seasonal
channels.
2 • Facilitate seed dispersal of key species of lower riparian zone (eg. Combretum erythrophyllum and Ficus sycomorus)
• Transported sediments provide substrate for germination of key species.
• Increase habitat diversity. • Control terrestrialisation. • Remove debris and scour seasonal
channels.
Geom.
Maintain present channel geometry and bedsorting -
Inundate flood plain and secondary channels, effective discharge for sediment transport –coarse gravels & limited cobble movement
any 1 annual Retention of intermediate floods
DWAF Report No. RDM X100-01-CON-COMPR2-0604 Komati River Catchment Ecological Water Requirements Study – Quantity Report
Page J - 17
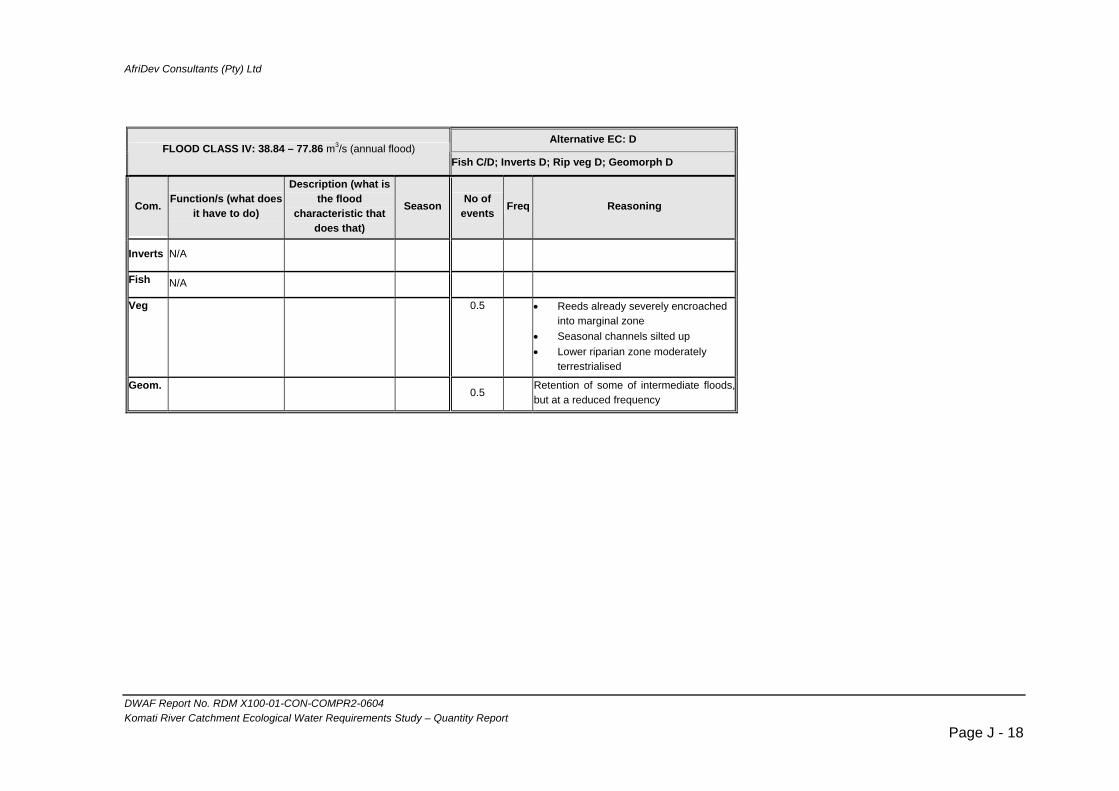
AfriDev Consultants (Pty) Ltd
Alternative EC: D
FLOOD CLASS IV: 38.84 – 77.86 m3/s (annual flood) Fish C/D; Inverts D; Rip veg D; Geomorph D
Com. Function/s (what does it have to do)
Description (what is the flood
characteristic that does that)
Season No of events Freq Reasoning
Inverts N/A
Fish N/A
Veg
0.5 • Reeds already severely encroached into marginal zone
• Seasonal channels silted up • Lower riparian zone moderately
terrestrialised
Geom. 0.5
Retention of some of intermediate floods,but at a reduced frequency
DWAF Report No. RDM X100-01-CON-COMPR2-0604 Komati River Catchment Ecological Water Requirements Study – Quantity Report
Page J - 18

AfriDev Consultants (Pty) Ltd
3. SITE K3 - TONGA
3.1 CLASS I Recommended EC: D
FLOOD CLASS I: 8 – 16 m3/s (Dry season freshes) Fish D; Inverts D; Rip veg D; Geomorph D
Com. Function/s (what does it have to do) Description (what is the flood characteristic that does that) Season No of
events Freq Reasoning
Inverts
Flush out benthic algae and fines and provide cue for breeding or emergence. Provide sufficient current speed to discourage bilharzia and Thiaridae snail populations. To maintain clear surfaces in SIC and prevent embeddedness that leads to reduced species diversity. To maintain productivity by providing relevant cue for emergence or for breeding and upstream migration of freshwater prawns (Macrobrachium spp.) To maintain species diversity by ensuring temporal diversity of flows.
Velocity: a discharge of 8m3/s has an average current speed of 0.4m/s. This is sufficient to mobilise fines and discourage bilharzias snails.
Autumn, Winter Spring Early summer
2 n/a • There are presently about two Class 1 floods passing this site. Although the PES for invertebrates is Category E, this is attributed to zero and low flows rather than an absence of freshets. The observed flow records at X1H003 indicate that freshets are still passing the system, despite the presence of Maguga Dam. This indicates that the present day freshets are entering the system downstream of Maguga Dam
Fish Mainly for the Inundation of marginal vegetated areas for spawning. There is also a requirement for cleaning of the remaining sections of gravel/cobble beds for riffle spawning
This flow are mainly to create spawning areas for tropical species in backwaters, secondary channels and in marginal vegetation. These floods will also cater for the gravel spawners and for limited available spawning sites for yellowfish in terms of depth in riffles
Early summer and summer
3 Important for local migrations, breeding and recruitment. It is important for more than one event to activate backwaters (nursery areas) and create opportunities for fish fry enter the mainstream and reduce losses due to drying of backwaters before fry can re-enter.. Most of the fish are serial spawners and need more than one opportunity per annum to ensure that sufficient recruitment do take place
Veg Maintain vegetation of marginal zone 0.81 – 1.14 m depth
Sept 2 Maintenance of Geomorphology as Class D will cater for vegetation
DWAF Report No. RDM X100-01-CON-COMPR2-0604 Komati River Catchment Ecological Water Requirements Study – Quantity Report
Page J - 19
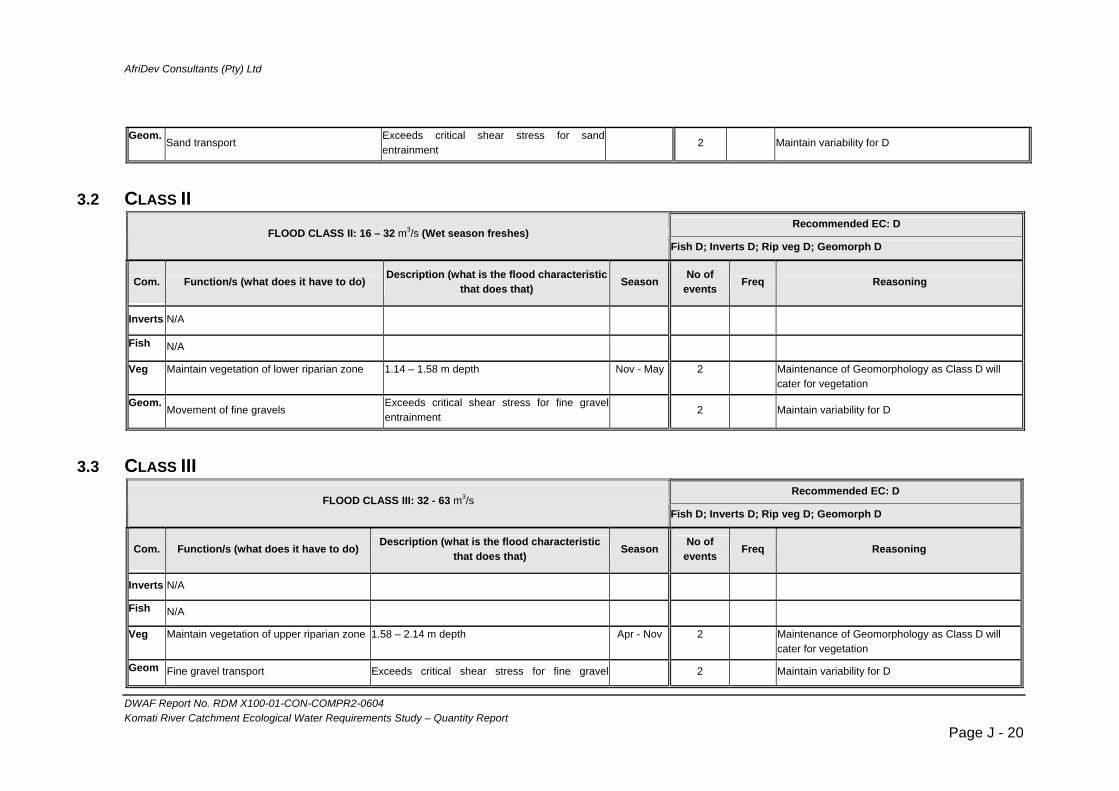
AfriDev Consultants (Pty) Ltd
Geom.
Sand transport Exceeds critical shear stress for sand entrainment
2 Maintain variability for D
3.2 CLASS II Recommended EC: D
FLOOD CLASS II: 16 – 32 m3/s (Wet season freshes) Fish D; Inverts D; Rip veg D; Geomorph D
Com. Function/s (what does it have to do) Description (what is the flood characteristic that does that) Season No of
events Freq Reasoning
Inverts N/A
Fish N/A
Veg Maintain vegetation of lower riparian zone 1.14 – 1.58 m depth
Nov - May 2 Maintenance of Geomorphology as Class D will cater for vegetation
Geom. Movement of fine gravels
Exceeds critical shear stress for fine gravel entrainment
2 Maintain variability for D
3.3 CLASS III Recommended EC: D
FLOOD CLASS III: 32 - 63 m3/s Fish D; Inverts D; Rip veg D; Geomorph D
Com. Function/s (what does it have to do) Description (what is the flood characteristic that does that) Season No of
events Freq Reasoning
Inverts N/A
Fish N/A
Veg Maintain vegetation of upper riparian zone 1.58 – 2.14 m depth
Apr - Nov 2 Maintenance of Geomorphology as Class D will cater for vegetation
Geom Fine gravel transport Exceeds critical shear stress for fine gravel 2 Maintain variability for D
DWAF Report No. RDM X100-01-CON-COMPR2-0604 Komati River Catchment Ecological Water Requirements Study – Quantity Report
Page J - 20

AfriDev Consultants (Pty) Ltd
entrainment
3.4 CLASS IV Recommended EC: D
FLOOD CLASS IV: 63 - 126 m3/s Fish D; Inverts D; Rip veg D; Geomorph D
Com. Function/s (what does it have to do) Description (what is the flood characteristic that does that) Season No of
events Freq Reasoning
Inverts N/A
Fish N/A
Veg Maintain vegetation of upper riparian zone 2.14 – 2.88 m depth
Dec, Jan, Feb or Mar
1 Maintenance of Geomorphology as Class D will cater for vegetation
Geom. Medium gravel transport
Exceeds critical shear stress for medium gravel entrainment
1 Maintain variability for D
3.5 1:2 Recommended EC: D
FLOOD CLASS V 140 m3/s Fish D; Inverts D; Rip veg D; Geomorph D
Com. Function/s (what does it have to do) Description (what is the flood characteristic that does that) Season No of
events Freq Reasoning
Inverts N/A
Fish *N/A
Veg N/A
Geom. Maintain channel geometry and Bed sorting.
Effective Q for gravel transport. 0.5 1:2 Key discharge for geomorphological processes.
DWAF Report No. RDM X100-01-CON-COMPR2-0604 Komati River Catchment Ecological Water Requirements Study – Quantity Report
Page J - 21

AfriDev Consultants (Pty) Ltd
3.6 1:10
Recommended EC: D FLOOD CLASS V 457 m3/s
Fish D; Inverts D; Rip veg D; Geomorph D
Com. Function/s (what does it have to do) Description (what is the flood characteristic that does that) Season No of
events Freq Reasoning
Inverts N/A
Fish *see below
Veg N/A
Geom. Move cobble Present 1:10 Maintain variability for D
FISH: *There is a 1:5 (307 m3/s) to 1:10 (457 m3/s) year requirement for a large flood to inundate floodplains in Mozambique which will allow huge numbers of fish, especially tropical species such as Labeo spp, Barbus spp., tigerfish (Hydrocynus, Micralestes and Brycinus) and Mesobola to re-enter the river and trigger massive upstream recolonization migrations. These migrations are essential to replenish fish stocks in Komati River and for maintaining genetic diversity in the system.
DWAF Report No. RDM X100-01-CON-COMPR2-0604 Komati River Catchment Ecological Water Requirements Study – Quantity Report
Page J - 22
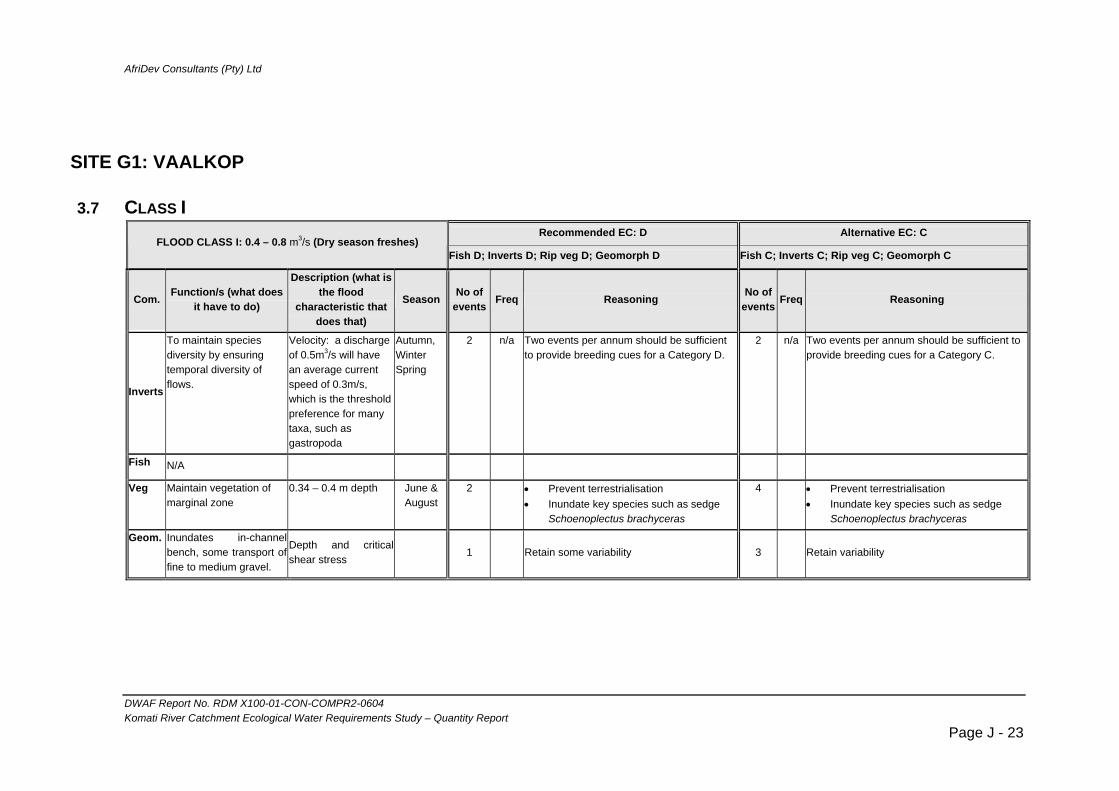
AfriDev Consultants (Pty) Ltd
SITE G1: VAALKOP
3.7 CLASS I Recommended EC: D Alternative EC: C
FLOOD CLASS I: 0.4 – 0.8 m3/s (Dry season freshes) Fish D; Inverts D; Rip veg D; Geomorph D Fish C; Inverts C; Rip veg C; Geomorph C
Com. Function/s (what does it have to do)
Description (what is the flood
characteristic that does that)
Season No of events Freq Reasoning No of
events Freq Reasoning
Inverts
To maintain species diversity by ensuring temporal diversity of flows.
Velocity: a discharge of 0.5m3/s will have an average current speed of 0.3m/s, which is the threshold preference for many taxa, such as gastropoda
Autumn, Winter Spring
2 n/a Two events per annum should be sufficient to provide breeding cues for a Category D.
2 n/a Two events per annum should be sufficient to provide breeding cues for a Category C.
Fish N/A
Veg Maintain vegetation of marginal zone
0.34 – 0.4 m depth
June & August
2
• Prevent terrestrialisation • Inundate key species such as sedge
Schoenoplectus brachyceras
4
• Prevent terrestrialisation • Inundate key species such as sedge
Schoenoplectus brachyceras
Geom. Inundates in-channel bench, some transport offine to medium gravel.
Depth and critical shear stress
1 Retain some variability 3 Retain variability
DWAF Report No. RDM X100-01-CON-COMPR2-0604 Komati River Catchment Ecological Water Requirements Study – Quantity Report
Page J - 23

AfriDev Consultants (Pty) Ltd
3.8 CLASS II Recommended EC: D Alternative EC: C
FLOOD CLASS II: 0.8 – 1.6 m3/s (Wet season freshes) Fish D; Inverts D; Rip veg D; Geomorph D Fish C; Inverts C; Rip veg C; Geomorph C
Com. Function/s (what does it have to do)
Description (what is the flood
characteristic that does that)
Season No of events Freq Reasoning No of
events Freq Reasoning
Inverts
Provide cue for breeding or emergence.
Inundation of marginal riparian zone.
Summer Autumn
2 n/a Two events per annum should be sufficient to provide breeding cues for a Category D
2 n/a Two events per annum should be sufficient to provide breeding cues for a Category C.
Fish Mainly for the Inundation of marginal vegetated areas for spawning. There is also a requirement for cleaning of of gravel/cobble beds for riffle spawning
This flow is mainly to cater for the gravel spawners and to create spawning areas in backwaters, secondary channels and in marginal vegetation.
Early summer and summer
1 Important for local migrations, breeding and recruitment. It is important for more than one event to activate backwaters marginal vegetated and nursery areas. It is essential that marginal vegetation and or backwaters in this event is inundated for 4—5 days which will allow the fish larvae to become free swimming and reduce losses due to drying of eggs and fry and ensure some annual recruitment.
2 Important for local migrations, breeding and recruitment. It is important for more than one event to activate backwaters marginal vegetated and nursery areas. It is essential that marginal vegetation and or backwaters in these events are inundated for 4—5 days which will allow the fish larvae to become free swimming and reduce losses due to drying of eggs and fry. Most of the fish are serial spawners and need more than one opportunity per annum to ensure that sufficient recruitment do take place
Veg Maintain vegetation of marginal zone
0.4 – 0.47 m depth
May - Nov 2 Monthly
• Prevent terrestrialisation • Inundate key species such as sedge
Schoenoplectus brachyceras
3 • Prevent terrestrialisation • Inundate key species such as sedge
Schoenoplectus brachyceras • Promote spread of indigenous grasses
such as Leersia hexandra and Panicum hymeniochilum
Geom. Bed material transport Critical shear stress 2 Retain variability 2 Retain variability
DWAF Report No. RDM X100-01-CON-COMPR2-0604 Komati River Catchment Ecological Water Requirements Study – Quantity Report
Page J - 24
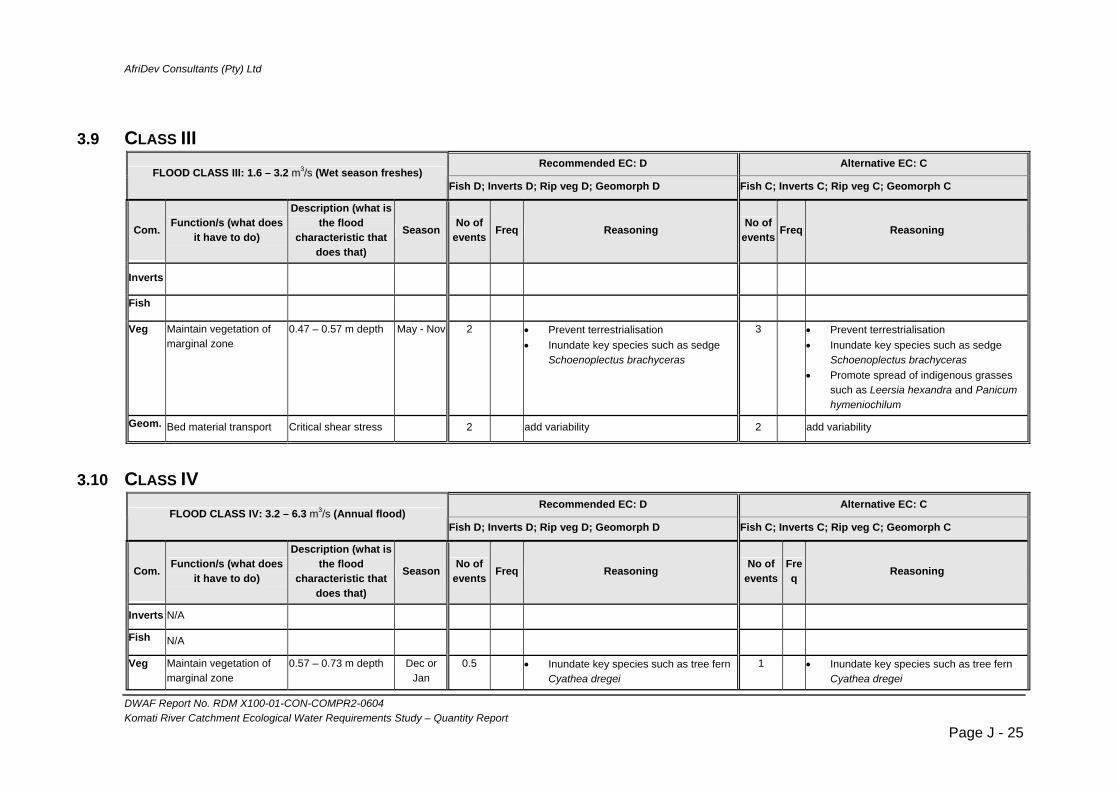
AfriDev Consultants (Pty) Ltd
3.9 CLASS III
Recommended EC: D Alternative EC: C FLOOD CLASS III: 1.6 – 3.2 m3/s (Wet season freshes)
Fish D; Inverts D; Rip veg D; Geomorph D Fish C; Inverts C; Rip veg C; Geomorph C
Com. Function/s (what does it have to do)
Description (what is the flood
characteristic that does that)
Season No of events Freq Reasoning No of
events Freq Reasoning
Inverts
Fish
Veg Maintain vegetation of marginal zone
0.47 – 0.57 m depth
May - Nov 2 • Prevent terrestrialisation • Inundate key species such as sedge
Schoenoplectus brachyceras
3 • Prevent terrestrialisation • Inundate key species such as sedge
Schoenoplectus brachyceras • Promote spread of indigenous grasses
such as Leersia hexandra and Panicum hymeniochilum
Geom. Bed material transport Critical shear stress 2 add variability 2 add variability
3.10 CLASS IV Recommended EC: D Alternative EC: C
FLOOD CLASS IV: 3.2 – 6.3 m3/s (Annual flood) Fish D; Inverts D; Rip veg D; Geomorph D Fish C; Inverts C; Rip veg C; Geomorph C
Com. Function/s (what does it have to do)
Description (what is the flood
characteristic that does that)
Season No of events Freq Reasoning No of
eventsFreq Reasoning
Inverts N/A
Fish N/A
Veg Maintain vegetation of marginal zone
0.57 – 0.73 m depth
Dec or Jan
0.5 • Inundate key species such as tree fern Cyathea dregei
1 • Inundate key species such as tree fern Cyathea dregei
DWAF Report No. RDM X100-01-CON-COMPR2-0604 Komati River Catchment Ecological Water Requirements Study – Quantity Report
Page J - 25

AfriDev Consultants (Pty) Ltd
• Facilitate seed dispersal of key species
such as • Cyathea dregei, Senecio inaequidens. • Transported sediments provide
substrate for germination of key species• Control terrestrialisation • Saturate rooting zone of tree species
such as Combretum erythrophyllum in lower riparian zone
• Facilitate seed dispersal of key species such as
• Cyathea dregei, Senecio inaequidens. • Transported sediments provide substrate
for germination of key species • Control terrestrialisation • Saturate rooting zone of tree species
such as Combretum erythrophyllum, Buddleja salviifolia, Leucosidea sericea and Dais cotinifolia in lower riparian zone
Geom. Channel maintenance flood for channelgeometry and sedimenttransport
Depth and critical shear stress for gravel transport
0.5 Normally approximates to annual flood undernatural conditions
1 Normally approximates to annual flood undernatural conditions
3.11 1:2 Recommended EC: D Alternative EC: C
1:2 FLOOD CLASS: 7 m3/s Fish D; Inverts D; Rip veg D; Geomorph D Fish C; Inverts C; Rip veg C; Geomorph C
Com. Function/s (what does it have to do)
Description (what is the flood
characteristic that does that)
Season No of events Freq Reasoning No of
events Freq Reasoning
Inverts N/A
Fish N/A
Veg Maintain vegetation of marginal and lower riparian zones
0.76 m depth
Dec or Jan
0.5
• Inundate key species such as tree fern Cyathea dregei
• Facilitate seed dispersal of key species such as
• Cyathea dregei, Senecio inaequidens. • Transported sediments provide
substrate for germination of key species• Control terrestrialisation
1 • Inundate key species such as tree fern Cyathea dregei
• Facilitate seed dispersal of key species such as
• Cyathea dregei, Senecio inaequidens. • Transported sediments provide substrate
for germination of key species • Control terrestrialisation
DWAF Report No. RDM X100-01-CON-COMPR2-0604 Komati River Catchment Ecological Water Requirements Study – Quantity Report
Page J - 26
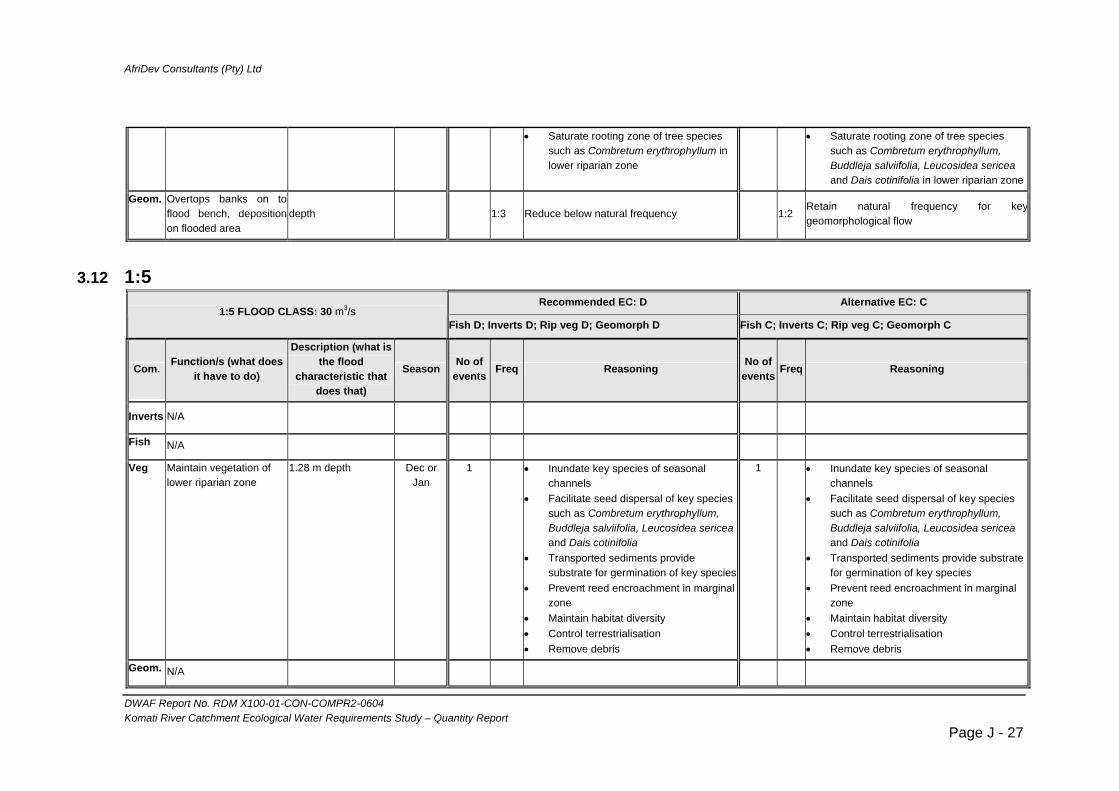
AfriDev Consultants (Pty) Ltd
• Saturate rooting zone of tree species
such as Combretum erythrophyllum in lower riparian zone
• Saturate rooting zone of tree species such as Combretum erythrophyllum, Buddleja salviifolia, Leucosidea sericea and Dais cotinifolia in lower riparian zone
Geom. Overtops banks on to flood bench, depositionon flooded area
depth 1:3 Reduce below natural frequency 1:2 Retain natural frequency for keygeomorphological flow
3.12 1:5 Recommended EC: D Alternative EC: C
1:5 FLOOD CLASS: 30 m3/s Fish D; Inverts D; Rip veg D; Geomorph D Fish C; Inverts C; Rip veg C; Geomorph C
Com. Function/s (what does it have to do)
Description (what is the flood
characteristic that does that)
Season No of events Freq Reasoning No of
events Freq Reasoning
Inverts N/A
Fish N/A
Veg Maintain vegetation of lower riparian zone
1.28 m depth
Dec or Jan
1
• Inundate key species of seasonal channels
• Facilitate seed dispersal of key species such as Combretum erythrophyllum, Buddleja salviifolia, Leucosidea sericea and Dais cotinifolia
• Transported sediments provide substrate for germination of key species
• Prevent reed encroachment in marginal zone
• Maintain habitat diversity • Control terrestrialisation • Remove debris
1 • Inundate key species of seasonal channels
• Facilitate seed dispersal of key species such as Combretum erythrophyllum, Buddleja salviifolia, Leucosidea sericea and Dais cotinifolia
• Transported sediments provide substrate for germination of key species
• Prevent reed encroachment in marginal zone
• Maintain habitat diversity • Control terrestrialisation • Remove debris
Geom. N/A
DWAF Report No. RDM X100-01-CON-COMPR2-0604 Komati River Catchment Ecological Water Requirements Study – Quantity Report
Page J - 27
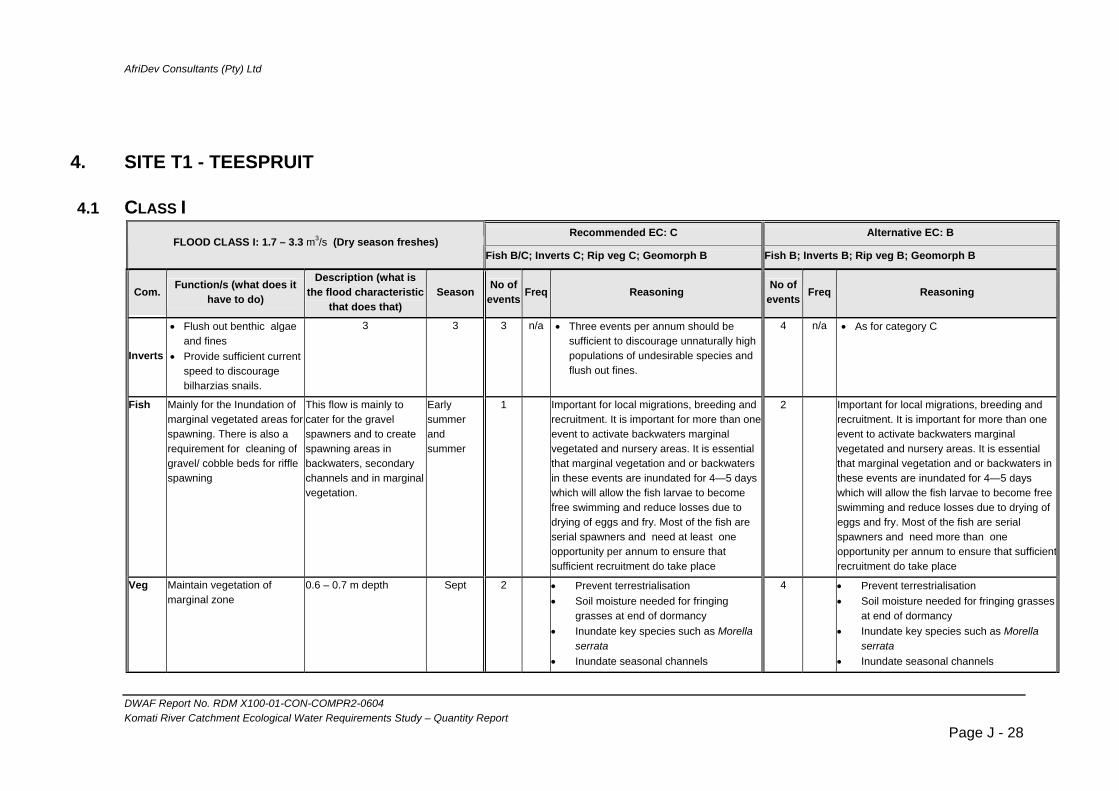
AfriDev Consultants (Pty) Ltd
4. SITE T1 - TEESPRUIT
4.1 CLASS I Recommended EC: C Alternative EC: B
FLOOD CLASS I: 1.7 – 3.3 m3/s (Dry season freshes) Fish B/C; Inverts C; Rip veg C; Geomorph B Fish B; Inverts B; Rip veg B; Geomorph B
Com. Function/s (what does it have to do)
Description (what is the flood characteristic
that does that) Season No of
events Freq Reasoning No of events Freq Reasoning
Inverts
• Flush out benthic algae and fines
• Provide sufficient current speed to discourage bilharzias snails.
3 3 3 n/a • Three events per annum should be sufficient to discourage unnaturally high populations of undesirable species and flush out fines.
4 n/a • As for category C
Fish Mainly for the Inundation of marginal vegetated areas for spawning. There is also a requirement for cleaning of gravel/ cobble beds for riffle spawning
This flow is mainly to cater for the gravel spawners and to create spawning areas in backwaters, secondary channels and in marginal vegetation.
Early summer and summer
1
Important for local migrations, breeding and recruitment. It is important for more than one event to activate backwaters marginal vegetated and nursery areas. It is essential that marginal vegetation and or backwaters in these events are inundated for 4—5 days which will allow the fish larvae to become free swimming and reduce losses due to drying of eggs and fry. Most of the fish are serial spawners and need at least one opportunity per annum to ensure that sufficient recruitment do take place
2
Important for local migrations, breeding and recruitment. It is important for more than one event to activate backwaters marginal vegetated and nursery areas. It is essential that marginal vegetation and or backwaters in these events are inundated for 4—5 days which will allow the fish larvae to become free swimming and reduce losses due to drying of eggs and fry. Most of the fish are serial spawners and need more than one opportunity per annum to ensure that sufficientrecruitment do take place
Veg Maintain vegetation of marginal zone
0.6 – 0.7 m depth
Sept 2 • Prevent terrestrialisation • Soil moisture needed for fringing
grasses at end of dormancy • Inundate key species such as Morella
serrata • Inundate seasonal channels
4 • Prevent terrestrialisation • Soil moisture needed for fringing grasses
at end of dormancy • Inundate key species such as Morella
serrata • Inundate seasonal channels
DWAF Report No. RDM X100-01-CON-COMPR2-0604 Komati River Catchment Ecological Water Requirements Study – Quantity Report
Page J - 28
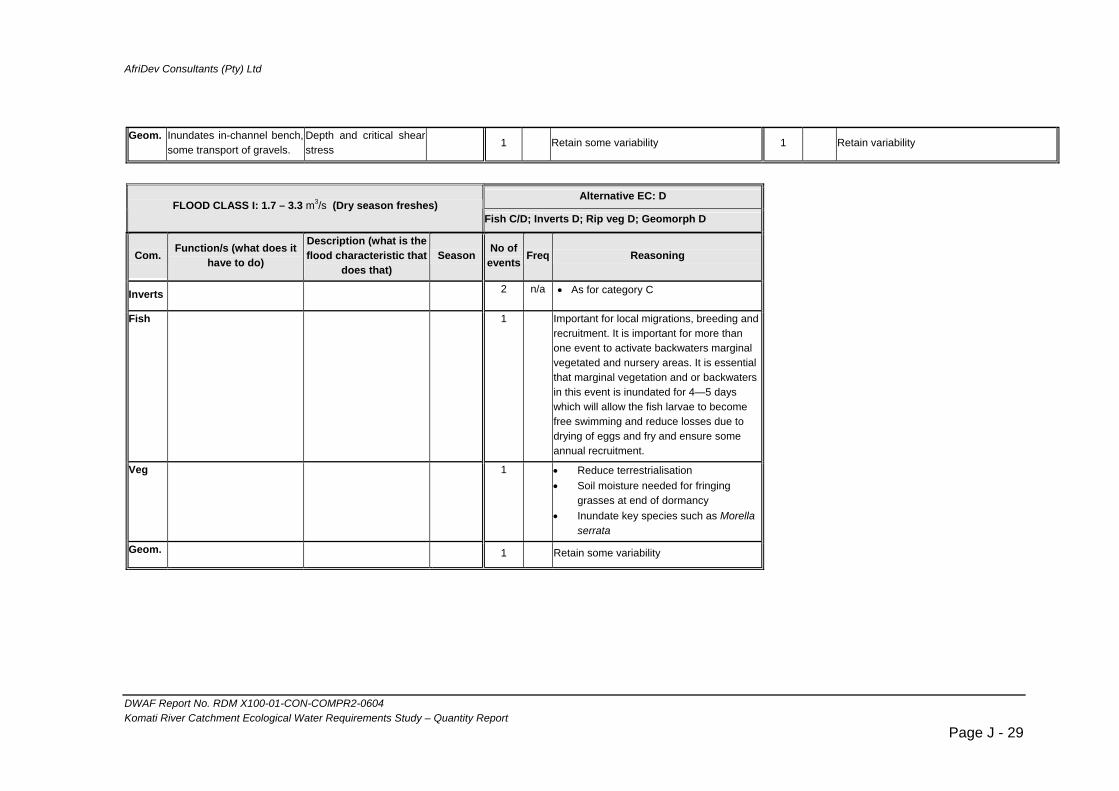
AfriDev Consultants (Pty) Ltd
Geom. Inundates in-channel bench,
some transport of gravels. Depth and critical shear stress
1 Retain some variability 1 Retain variability
Alternative EC: D
FLOOD CLASS I: 1.7 – 3.3 m3/s (Dry season freshes) Fish C/D; Inverts D; Rip veg D; Geomorph D
Com. Function/s (what does it have to do)
Description (what is the flood characteristic that
does that) Season No of
events Freq Reasoning
Inverts 2 n/a • As for category C
Fish
1
Important for local migrations, breeding and recruitment. It is important for more than one event to activate backwaters marginal vegetated and nursery areas. It is essential that marginal vegetation and or backwaters in this event is inundated for 4—5 days which will allow the fish larvae to become free swimming and reduce losses due to drying of eggs and fry and ensure some annual recruitment.
Veg
1 • Reduce terrestrialisation • Soil moisture needed for fringing
grasses at end of dormancy • Inundate key species such as Morella
serrata
Geom. 1 Retain some variability
DWAF Report No. RDM X100-01-CON-COMPR2-0604 Komati River Catchment Ecological Water Requirements Study – Quantity Report
Page J - 29

AfriDev Consultants (Pty) Ltd
4.2 CLASS II Recommended EC: C Alternative EC: B
FLOOD CLASS II: 3.3 – 6.5 m3/s (Wet season freshes) Fish B/C; Inverts C; Rip veg C; Geomorph B Fish B; Inverts B; Rip veg B; Geomorph B
Com. Function/s (what does it have to do)
Description (what is the flood characteristic
that does that) Season No of
events Freq Reasoning No of events Freq Reasoning
Inverts N/A
Fish N/A
Veg Maintain vegetation of marginal and lower riparian zone
0.7 – 0.88 m depth
Nov – May 2 • Prevent terrestrialisation and encroachment by Prtagmites mauritianus reeds
• Inundate key species such as Morella serrata
• Saturate rooting zone of trees such as Salix mucronata, Combretum erythrophyllum and Catha edulis in lower riparian zone
• Inundate seasonal channels
4 • Prevent terrestrialisation and encroachment by Phragmites mauritianus reeds
• Inundate key species such as Morella serrata
• Saturate rooting zone of trees such as Salix mucronata, Combretum erythrophyllum and Catha edulis in lower riparian zone
• Inundate seasonal channels
Geom. Bed material transport and sorting -
Critical shear stress 2 Retain variability 3 Retain variability
Alternative EC: D
FLOOD CLASS II: 3.3 – 6.5 m3/s (Wet season freshes) Fish C/D; Inverts D; Rip veg D; Geomorph D
Com. Function/s (what does it have to do)
Description (what is the flood characteristic that
does that) Season No of
events Freq Reasoning
Inverts N/A
Fish N/A
DWAF Report No. RDM X100-01-CON-COMPR2-0604 Komati River Catchment Ecological Water Requirements Study – Quantity Report
Page J - 30

AfriDev Consultants (Pty) Ltd
Veg
1 • Reduce terrestrialisation and encroachment by Phragmites mauritianus reeds
• Inundate key species such as Morella serrata
• Saturate rooting zone of trees such as Combretum erythrophyllum, Salix mucronataand Catha edulis in lower riparian zone
• Inundate seasonal channels
Geom. 2 Retain some variability
4.3 CLASS III Recommended EC: C Alternative EC: B
FLOOD CLASS III: 6.5 – 13 m3/s (Wet season freshes) Fish B/C; Inverts C; Rip veg C; Geomorph B Fish B; Inverts B; Rip veg B; Geomorph B
Com. Function/s (what does it have to do)
Description (what is the flood characteristic
that does that) Season No of
events Freq Reasoning No of events Freq Reasoning
Inverts N/A •
Fish N/A
Veg Maintain vegetation of marginal and lower riparian zone
0.88 – 1.13 m depth
Nov - May 2 • Prevent terrestrialisation and encroachment by Phragmites mauritianus reeds
• Inundate key species such as Morella serrata, Salix mucronata and Sesbania sesban
• Saturate rooting zone of trees such as Combretum erythrophyllum, Salix mucronata and Catha edulis in lower riparian zone
• Inundate flood bench of marginal zone to maintain good grass cover
4 • Prevent terrestrialisation and encroachment by Phragmites mauritianus reeds
• Inundate key species such as Morella serrata, Salix mucronata and Sesbania sesban
• Saturate rooting zone of trees such as Combretum erythrophyllum, Salix mucronata and Catha edulis in lower riparian zone
• Inundate flood bench of marginal zone to maintain good grass cover
DWAF Report No. RDM X100-01-CON-COMPR2-0604 Komati River Catchment Ecological Water Requirements Study – Quantity Report
Page J - 31
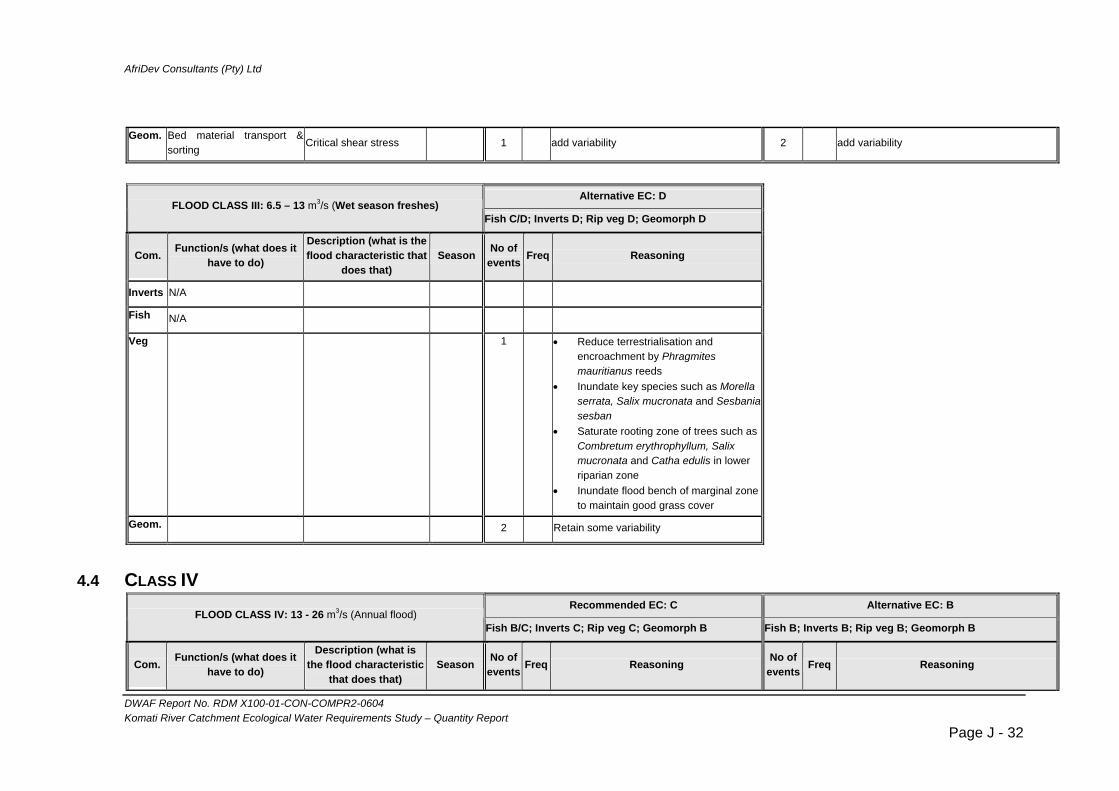
AfriDev Consultants (Pty) Ltd
Geom. Bed material transport &
sorting Critical shear stress 1 add variability 2 add variability
Alternative EC: D
FLOOD CLASS III: 6.5 – 13 m3/s (Wet season freshes) Fish C/D; Inverts D; Rip veg D; Geomorph D
Com. Function/s (what does it have to do)
Description (what is the flood characteristic that
does that) Season No of
events Freq Reasoning
Inverts N/A
Fish N/A
Veg
1 • Reduce terrestrialisation and encroachment by Phragmites mauritianus reeds
• Inundate key species such as Morella serrata, Salix mucronata and Sesbania sesban
• Saturate rooting zone of trees such as Combretum erythrophyllum, Salix mucronata and Catha edulis in lower riparian zone
• Inundate flood bench of marginal zone to maintain good grass cover
Geom. 2 Retain some variability
4.4 CLASS IV Recommended EC: C Alternative EC: B
FLOOD CLASS IV: 13 - 26 m3/s (Annual flood) Fish B/C; Inverts C; Rip veg C; Geomorph B Fish B; Inverts B; Rip veg B; Geomorph B
Com. Function/s (what does it have to do)
Description (what is the flood characteristic
that does that) Season No of
events Freq Reasoning No of events Freq Reasoning
DWAF Report No. RDM X100-01-CON-COMPR2-0604 Komati River Catchment Ecological Water Requirements Study – Quantity Report
Page J - 32

AfriDev Consultants (Pty) Ltd
Inverts N/A •
Fish N/A
Veg Maintain vegetation of marginal and lower riparian zones
1.13 – 1.43 m depth
Dec or Jan 0.5 • Prevent terrestrialisation and encroachment by Phragmites mauritianus reeds
• Inundate key species such as Morella serrata, Salix mucronata and Sesbania sesban
• Inundate flood bench of marginal zone to maintain good grass cover and facilitate seed dispersal of key species
• Transported sediments provide substrate for germination of key species
• Maintain habitat diversity on flood bench of marginal zone
1 • Prevent terrestrialisation and encroachment by Phragmites mauritianus reeds
• Inundate key species such as Morella serrata, Salix mucronata and Sesbania sesban
• Inundate flood bench of marginal zone to maintain good grass cover and facilitate seed dispersal of key species
• Transported sediments provide substrate for germination of key species
• Maintain habitat diversity on flood bench of marginal zone
Geom. Channel maintenance floodfor channel geometry andsediment transport
Depth and critical shear stress for gravel transport
0.72/3 years
Normally approximates to annual floodunder natural conditions, alternate with 1:3flood
1Normally approximates to annual flood undernatural conitions
Alternative EC: D
FLOOD CLASS IV: 13 - 26 m3/s (Annual flood) Fish C/D; Inverts D; Rip veg D; Geomorph D
Com. Function/s (what does it have to do)
Description (what is the flood characteristic that
does that) Season No of
events Freq Reasoning
Inverts N/A
Fish N/A
Veg
0.5 • Reduce terrestrialisation and encroachment by Phragmites mauritianus reeds
• Inundate key species such as Morella serrata, Salix mucronata and Sesbania
DWAF Report No. RDM X100-01-CON-COMPR2-0604 Komati River Catchment Ecological Water Requirements Study – Quantity Report
Page J - 33
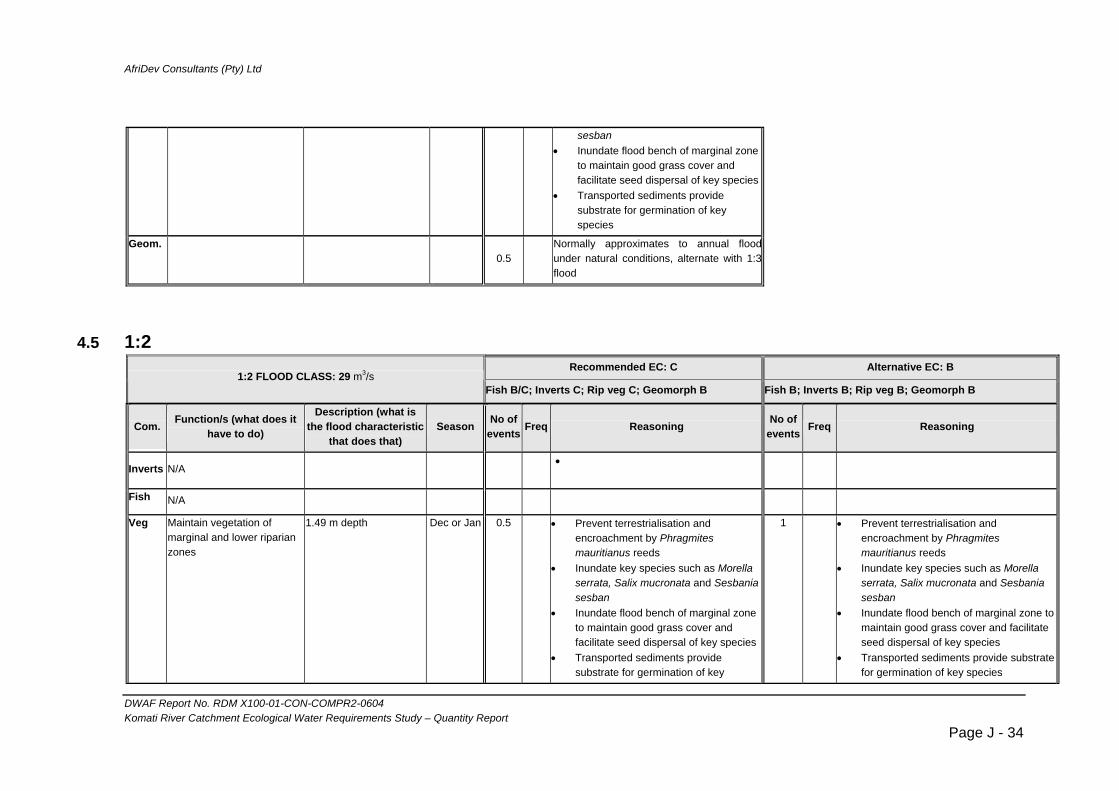
AfriDev Consultants (Pty) Ltd
sesban
• Inundate flood bench of marginal zone to maintain good grass cover and facilitate seed dispersal of key species
• Transported sediments provide substrate for germination of key species
Geom. 0.5
Normally approximates to annual floodunder natural conditions, alternate with 1:3flood
4.5 1:2 Recommended EC: C Alternative EC: B
1:2 FLOOD CLASS: 29 m3/s Fish B/C; Inverts C; Rip veg C; Geomorph B Fish B; Inverts B; Rip veg B; Geomorph B
Com. Function/s (what does it have to do)
Description (what is the flood characteristic
that does that) Season No of
events Freq Reasoning No of events Freq Reasoning
Inverts N/A •
Fish N/A
Veg Maintain vegetation of marginal and lower riparian zones
1.49 m depth
Dec or Jan 0.5
• Prevent terrestrialisation and encroachment by Phragmites mauritianus reeds
• Inundate key species such as Morella serrata, Salix mucronata and Sesbania sesban
• Inundate flood bench of marginal zone to maintain good grass cover and facilitate seed dispersal of key species
• Transported sediments provide substrate for germination of key
1 • Prevent terrestrialisation and encroachment by Phragmites mauritianus reeds
• Inundate key species such as Morella serrata, Salix mucronata and Sesbania sesban
• Inundate flood bench of marginal zone to maintain good grass cover and facilitate seed dispersal of key species
• Transported sediments provide substrate for germination of key species
DWAF Report No. RDM X100-01-CON-COMPR2-0604 Komati River Catchment Ecological Water Requirements Study – Quantity Report
Page J - 34
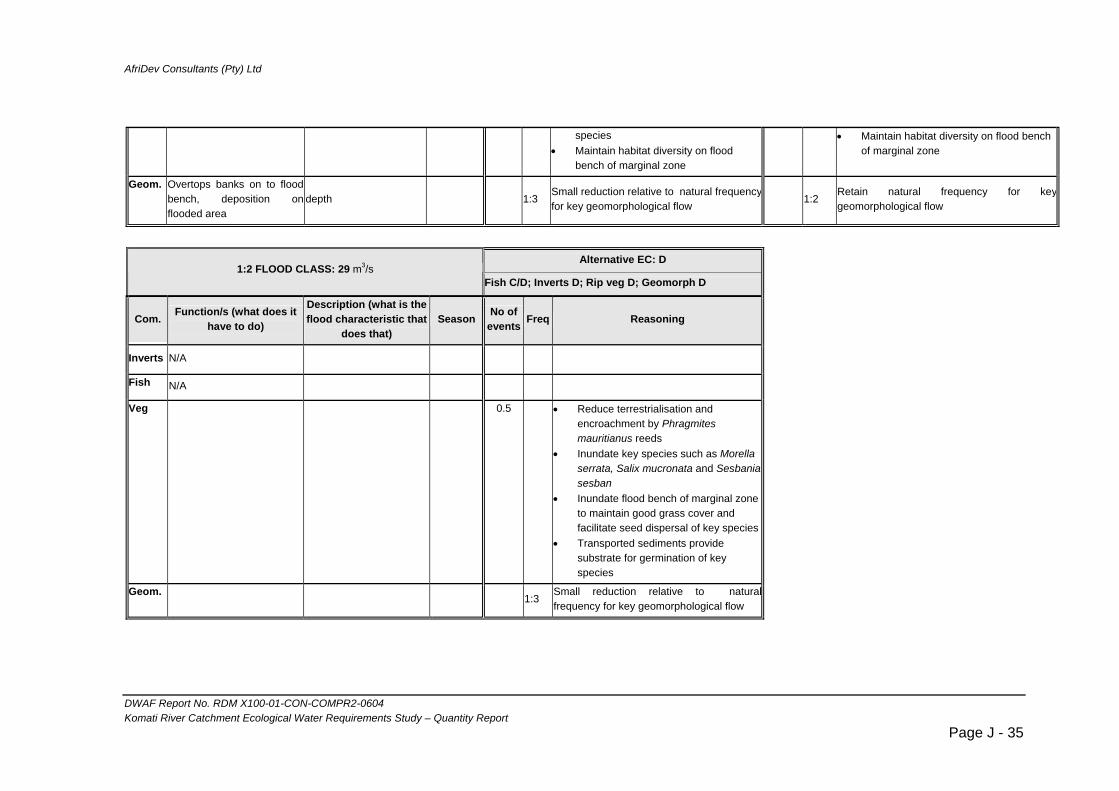
AfriDev Consultants (Pty) Ltd
species
• Maintain habitat diversity on flood bench of marginal zone
• Maintain habitat diversity on flood bench of marginal zone
Geom. Overtops banks on to flood bench, deposition onflooded area
depth Small reduction relative to natural frequenc
1:3y
for key geomorphological flow 1:2
Retain natural frequency for keygeomorphological flow
Alternative EC: D
1:2 FLOOD CLASS: 29 m3/s Fish C/D; Inverts D; Rip veg D; Geomorph D
Com. Function/s (what does it have to do)
Description (what is the flood characteristic that
does that) Season No of
events Freq Reasoning
Inverts N/A
Fish N/A
Veg
0.5 • Reduce terrestrialisation and encroachment by Phragmites mauritianus reeds
• Inundate key species such as Morella serrata, Salix mucronata and Sesbania sesban
• Inundate flood bench of marginal zone to maintain good grass cover and facilitate seed dispersal of key species
• Transported sediments provide substrate for germination of key species
Geom.
Small reduction relative to naturalfrequency for key geomorphological flow
1:3
DWAF Report No. RDM X100-01-CON-COMPR2-0604 Komati River Catchment Ecological Water Requirements Study – Quantity Report
Page J - 35
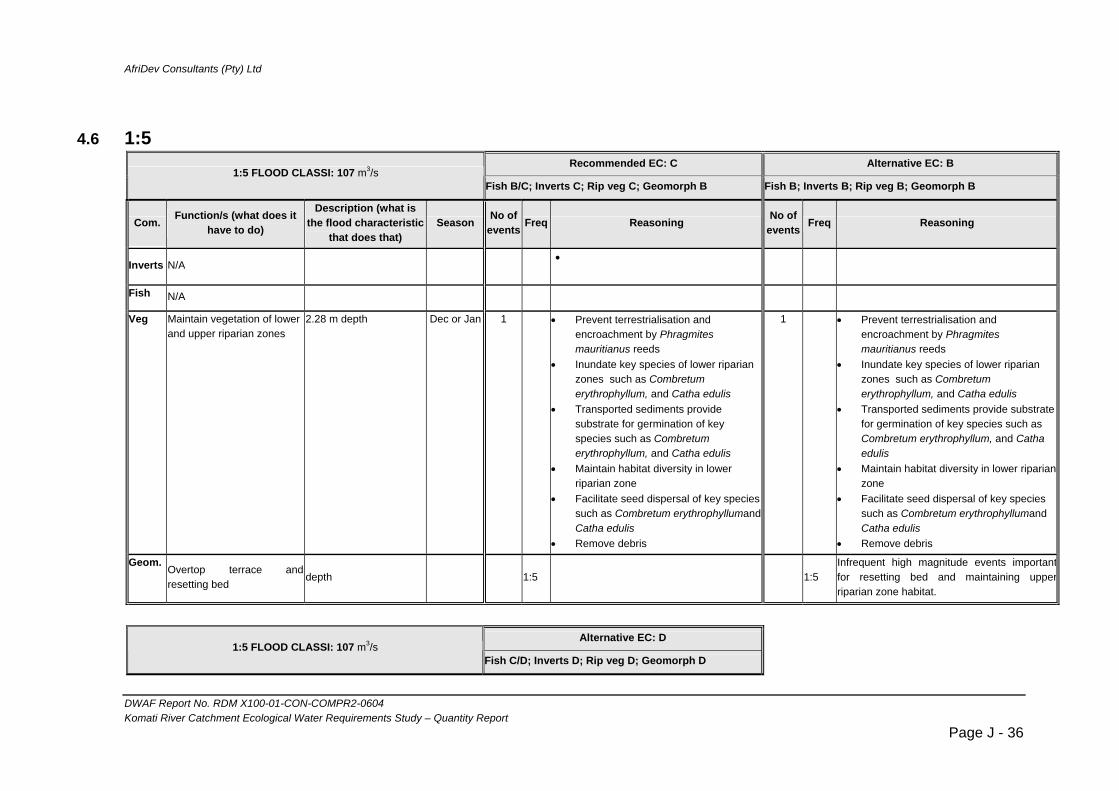
AfriDev Consultants (Pty) Ltd
4.6 1:5
Recommended EC: C Alternative EC: B 1:5 FLOOD CLASSI: 107 m3/s
Fish B/C; Inverts C; Rip veg C; Geomorph B Fish B; Inverts B; Rip veg B; Geomorph B
Com. Function/s (what does it have to do)
Description (what is the flood characteristic
that does that) Season No of
events Freq Reasoning No of events Freq Reasoning
Inverts N/A •
Fish N/A
Veg Maintain vegetation of lower and upper riparian zones
2.28 m depth
Dec or Jan 1
• Prevent terrestrialisation and encroachment by Phragmites mauritianus reeds
• Inundate key species of lower riparian zones such as Combretum erythrophyllum, and Catha edulis
• Transported sediments provide substrate for germination of key species such as Combretum erythrophyllum, and Catha edulis
• Maintain habitat diversity in lower riparian zone
• Facilitate seed dispersal of key species such as Combretum erythrophyllumand Catha edulis
• Remove debris
1 • Prevent terrestrialisation and encroachment by Phragmites mauritianus reeds
• Inundate key species of lower riparian zones such as Combretum erythrophyllum, and Catha edulis
• Transported sediments provide substrate for germination of key species such as Combretum erythrophyllum, and Catha edulis
• Maintain habitat diversity in lower riparian zone
• Facilitate seed dispersal of key species such as Combretum erythrophyllumand Catha edulis
• Remove debris
Geom. Overtop terrace and resetting bed
depth 1:5 1:5 Infrequent high magnitude events importantfor resetting bed and maintaining upperriparian zone habitat.
Alternative EC: D
1:5 FLOOD CLASSI: 107 m3/s Fish C/D; Inverts D; Rip veg D; Geomorph D
DWAF Report No. RDM X100-01-CON-COMPR2-0604 Komati River Catchment Ecological Water Requirements Study – Quantity Report
Page J - 36
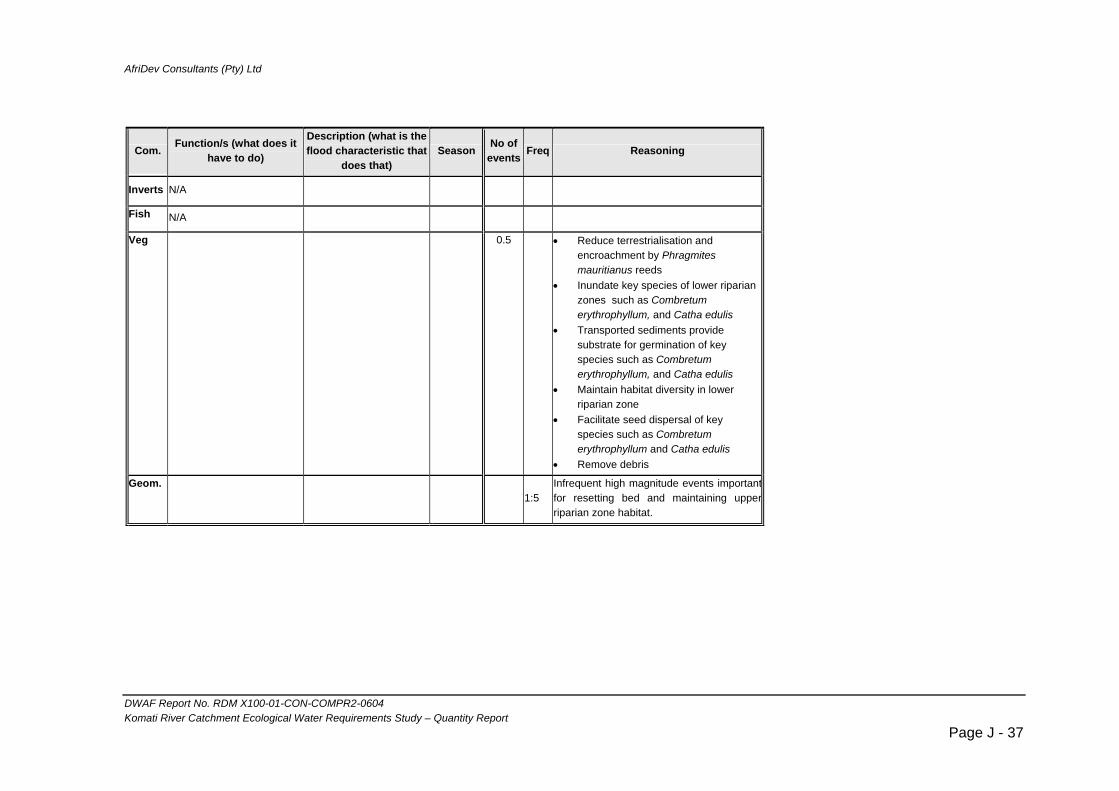
AfriDev Consultants (Pty) Ltd
Com. Function/s (what does it have to do)
Description (what is the flood characteristic that
does that) Season No of
events Freq Reasoning
Inverts N/A
Fish N/A
Veg
0.5 • Reduce terrestrialisation and encroachment by Phragmites mauritianus reeds
• Inundate key species of lower riparian zones such as Combretum erythrophyllum, and Catha edulis
• Transported sediments provide substrate for germination of key species such as Combretum erythrophyllum, and Catha edulis
• Maintain habitat diversity in lower riparian zone
• Facilitate seed dispersal of key species such as Combretum erythrophyllum and Catha edulis
• Remove debris
Geom.
Infrequent high magnitude events importan1:5
tfor resetting bed and maintaining upperriparian zone habitat.
DWAF Report No. RDM X100-01-CON-COMPR2-0604 Komati River Catchment Ecological Water Requirements Study – Quantity Report
Page J - 37

AfriDev Consultants (Pty) Ltd
5. SITE L1 - KLEINDORINGKOP
5.1 CLASS I Recommended EC: D
FLOOD CLASS I: 1.75 – 3.5 m3/s (Dry season freshes) Fish D; Inverts C; Rip veg C; Geomorph D
Com. Function/s (what does it have to do) Description (what is the flood characteristic that does that) Season No of
events Freq Reasoning
Inverts
• Flush out benthic algae and fines • Provide sufficient current speed to
discourage bilharzia and Thiaridae snail populations.
Velocity: a discharge of 2.82m3/s has an maximum current speed of 1.3m/s, and 26% greater than 0.6m/s. This is sufficient to mobilise fines and discourage bilharzias snails.
Autumn, Winter Spring
3 n/a • Three events per annum should be sufficient to discourage unnaturally high populations of undesirable species, and flush out fines.
Fish The class I floods is probably too small to inundate marginal vegetated areas and clean spawning beds in riffle areas maynot provide sufficient depth for the spawning of yellowfish.
Veg Maintain vegetation of marginal zone 0.59 – 0.66 m depth
Sept 2 Inundate grasses and sedges of fringing vegetation
Geom. N/A
Not a requirement because of limited fine material insystem
5.2 CLASS II Recommended EC: D
FLOOD CLASS II: 3.5 – 6.75 m3/s (Wet season freshes) Fish D; Inverts C; Rip veg C; Geomorph D
Com. Function/s (what does it have to do) Description (what is the flood characteristic that does that) Season No of
events Freq Reasoning
DWAF Report No. RDM X100-01-CON-COMPR2-0604 Komati River Catchment Ecological Water Requirements Study – Quantity Report
Page J - 38

AfriDev Consultants (Pty) Ltd
Inverts
• Provide cue for breeding or emergence.
• To maintain species diversity by ensuring temporal diversity of flows.
Inundation of marginal riparian zone (mainly Phragmites reeds)
Autumn, Spring
2 n/a • Two events per annum in which marginal vegetation is inundated should be sufficient to provide necessary breeding cues
Fish Mainly for the Inundation of marginal vegetated areas for spawning. There is also a requirement for cleaning of the remaining sections of gravel/cobble beds for riffle spawning
This flow will mainly create spawning areas in backwaters, secondary channels and in marginal vegetation. These floods will also cater for the gravel spawners and for moderately good available spawning sites for yellowfish in terms of depth in riffles
Early summer and summer
3 Important for local migrations, breeding and recruitment. It is important for more than one event to activate backwaters marinal vegetated and nursery areas. It is essential that marginal vegetation and or backwaters in these events are inundated for 4—5 days which will allow the fish larvae to become free swimming and reduce losses due to drying of eggs and fry.. Most of the fish are serial spawners and need more than one opportunity per annum to ensure that sufficient recruitment do take place
Veg Maintain vegetation of marginal zone 0.66 – 0.78 m depth
Nov – Apr 2 monthly Inundate grasses and sedges of fringing vegetation Saturate rooting zone of trees such as Breonadia salicina and Syzygium species.
Geom. N/A
Not a requirement because of limited fine material insystem
5.3 CLASS III Recommended EC: D
FLOOD CLASS III: 6.75 – 13.5 m3/s (Wet season freshes) Fish D; Inverts C; Rip veg C; Geomorph D
Com. Function/s (what does it have to do) Description (what is the flood characteristic that does that) Season No of
events Freq Reasoning
Inverts N/A
Fish N/A
Veg Maintain vegetation of marginal zone 0.78 – 0.96 m depth
Nov - Apr 2 • Inundate grasses and sedges of fringing vegetation
DWAF Report No. RDM X100-01-CON-COMPR2-0604 Komati River Catchment Ecological Water Requirements Study – Quantity Report
Page J - 39
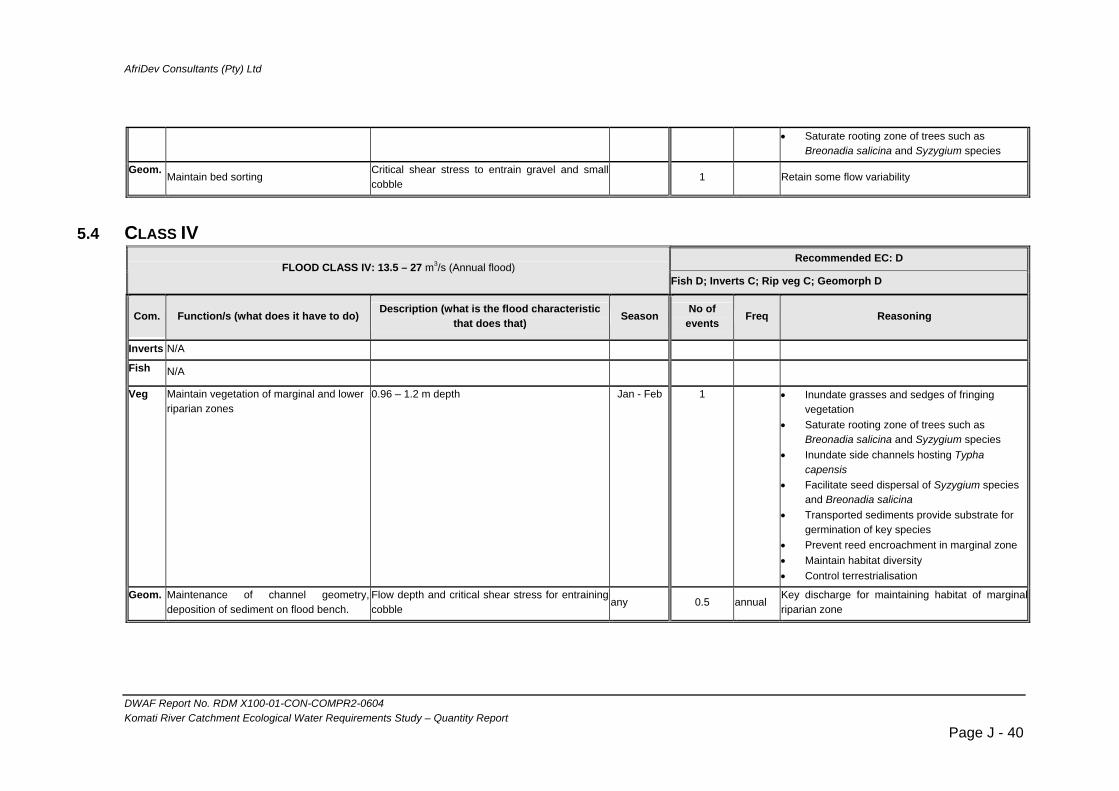
AfriDev Consultants (Pty) Ltd
• Saturate rooting zone of trees such as
Breonadia salicina and Syzygium species
Geom. Maintain bed sorting
Critical shear stress to entrain gravel and small cobble
1 Retain some flow variability
5.4 CLASS IV Recommended EC: D
FLOOD CLASS IV: 13.5 – 27 m3/s (Annual flood) Fish D; Inverts C; Rip veg C; Geomorph D
Com. Function/s (what does it have to do) Description (what is the flood characteristic that does that) Season No of
events Freq Reasoning
Inverts N/A
Fish N/A
Veg Maintain vegetation of marginal and lower riparian zones
0.96 – 1.2 m depth
Jan - Feb 1 • Inundate grasses and sedges of fringing vegetation
• Saturate rooting zone of trees such as Breonadia salicina and Syzygium species
• Inundate side channels hosting Typha capensis
• Facilitate seed dispersal of Syzygium species and Breonadia salicina
• Transported sediments provide substrate for germination of key species
• Prevent reed encroachment in marginal zone • Maintain habitat diversity • Control terrestrialisation
Geom. Maintenance of channel geometry,deposition of sediment on flood bench.
Flow depth and critical shear stress for entraining cobble
any 0.5 annual Key discharge for maintaining habitat of marginalriparian zone
DWAF Report No. RDM X100-01-CON-COMPR2-0604 Komati River Catchment Ecological Water Requirements Study – Quantity Report
Page J - 40
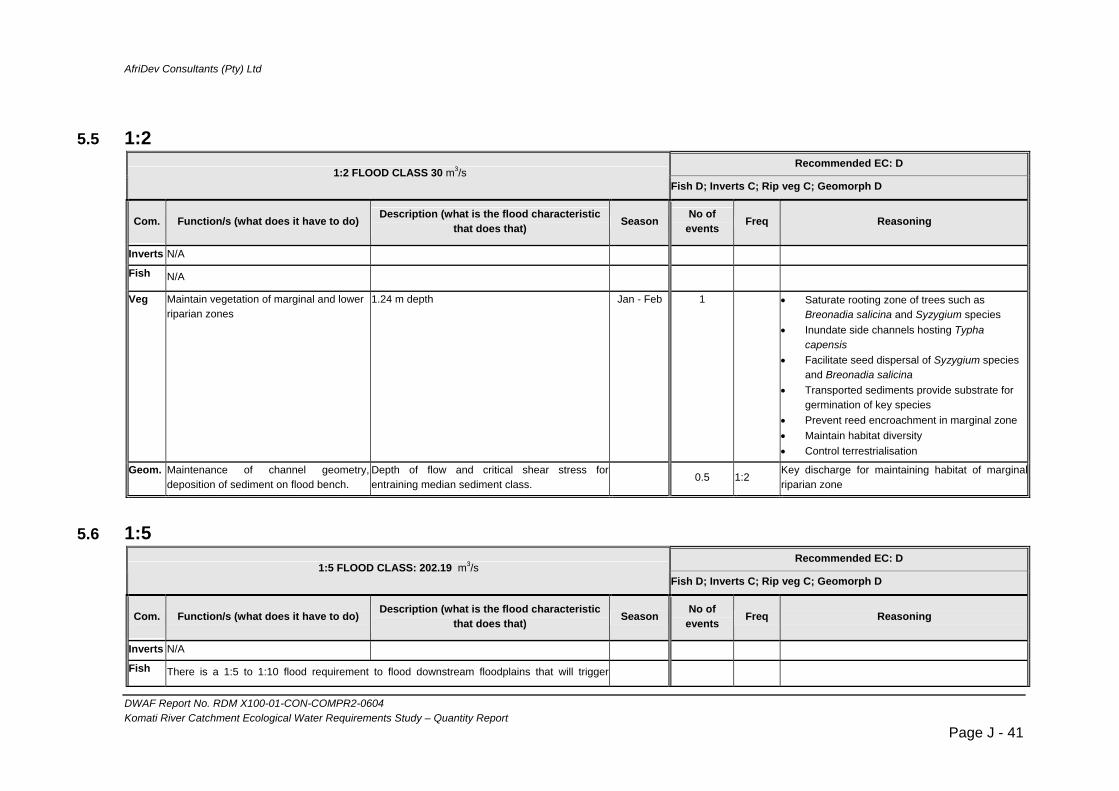
AfriDev Consultants (Pty) Ltd
5.5 1:2
Recommended EC: D 1:2 FLOOD CLASS 30 m3/s
Fish D; Inverts C; Rip veg C; Geomorph D
Com. Function/s (what does it have to do) Description (what is the flood characteristic that does that) Season No of
events Freq Reasoning
Inverts N/A
Fish N/A
Veg Maintain vegetation of marginal and lower riparian zones
1.24 m depth
Jan - Feb 1 • Saturate rooting zone of trees such as Breonadia salicina and Syzygium species
• Inundate side channels hosting Typha capensis
• Facilitate seed dispersal of Syzygium species and Breonadia salicina
• Transported sediments provide substrate for germination of key species
• Prevent reed encroachment in marginal zone • Maintain habitat diversity • Control terrestrialisation
Geom. Maintenance of channel geometry,deposition of sediment on flood bench.
Depth of flow and critical shear stress for entraining median sediment class.
0.5 1:2 Key discharge for maintaining habitat of marginalriparian zone
5.6 1:5 Recommended EC: D
1:5 FLOOD CLASS: 202.19 m3/s Fish D; Inverts C; Rip veg C; Geomorph D
Com. Function/s (what does it have to do) Description (what is the flood characteristic that does that) Season No of
events Freq Reasoning
Inverts N/A
Fish There is a 1:5 to 1:10 flood requirement to flood downstream floodplains that will trigger
DWAF Report No. RDM X100-01-CON-COMPR2-0604 Komati River Catchment Ecological Water Requirements Study – Quantity Report
Page J - 41
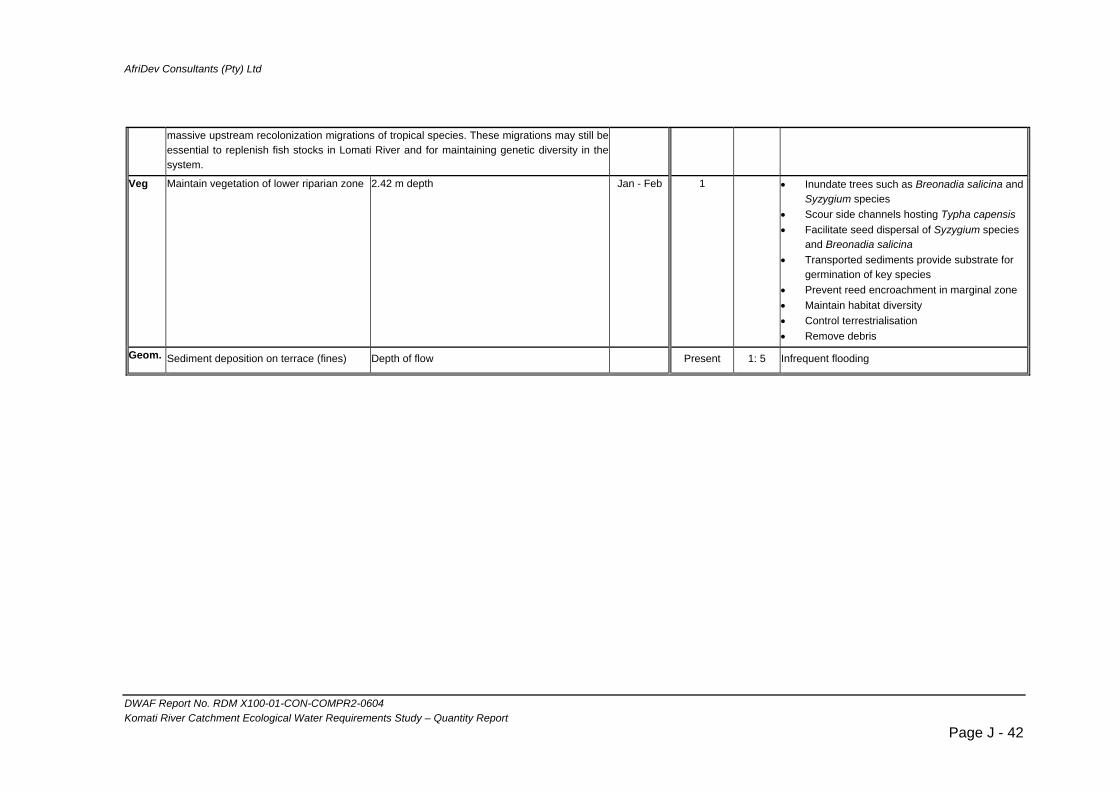
AfriDev Consultants (Pty) Ltd
massive upstream recolonization migrations of tropical species. These migrations may still be essential to replenish fish stocks in Lomati River and for maintaining genetic diversity in the system.
Veg Maintain vegetation of lower riparian zone 2.42 m depth
Jan - Feb 1 • Inundate trees such as Breonadia salicina and Syzygium species
• Scour side channels hosting Typha capensis • Facilitate seed dispersal of Syzygium species
and Breonadia salicina • Transported sediments provide substrate for
germination of key species • Prevent reed encroachment in marginal zone • Maintain habitat diversity • Control terrestrialisation • Remove debris
Geom. Sediment deposition on terrace (fines) Depth of flow Present 1: 5 Infrequent flooding
DWAF Report No. RDM X100-01-CON-COMPR2-0604 Komati River Catchment Ecological Water Requirements Study – Quantity Report
Page J - 42

AfriDev Consultants (Pty) Ltd
6. SITE M1 – SILINGANI
6.1 CLASS I Recommended EC: C Alternative EC: B
FLOOD CLASS I: 14 – 27 m3/s Fish B/C; Inverts B; Rip veg D; Geomorph C Fish B; Inverts B; Rip veg C; Geomorph C
Com. Function/s (what does it have to do)
Description (what is the flood characteristic
that does that) Season No of
events Freq Reasoning No of events Freq Reasoning
Inverts
• Provide cues for breeding or emergence.
• Provide sufficient current speed to discourage bilharzia snail populations.
• Maintain species diversity by ensuring temporal diversity of flows.
Velocity: a discharge of 14 to 27m3/s has an average current speed of 0.75 to 1m/s. This is sufficient to discourage bilharzia snails.
Late winter, Mid winter,Late summer
3 n/a • Maintain productivity by providing relevant cue for emergence or breeding
• Marginal vegetation should be inundated periodically
4 n/a As for EC C, but increased number of events.
Fish Mainly for the Inundation ofmarginal vegetated areas forspawning. There is also arequirement for cleaning ofthe remaining sections ofgravel/cobble beds for rifflespawning
These flows are mainlyto inundate and createspawning areas for bothtemperate and tropicalspecies in backwaters, secondary channels and in marginal vegetation. These floods will also cater for the gravel spawners and for creating good clean spawning sites for yellowfish
Early summer and summer
3 Important for local migrations, breeding andrecruitment. It is important for at least twoevents to activate backwaters (nurseryareas) and create opportunities for fish fryre-enter the mainstream and reduce lossesdue to drying of backwaters before fry canre-enter.. Most of the fish are serialspawners and this will create at least twoopportunities per annum to ensure thatsome recruitment do take place
4 Important for local migrations, breeding andrecruitment. It is important for more than oneevent to activate backwaters (nursery areas)and create opportunities for fish fry re-enterthe mainstream and reduce losses due todrying of backwaters before fry can re-enter.Most of the fish are serial spawners and needmore than two opportunity per annum toensure that sufficient recruitment do takeplace
DWAF Report No. RDM X100-01-CON-COMPR2-0604 Komati River Catchment Ecological Water Requirements Study – Quantity Report
Page J - 43

AfriDev Consultants (Pty) Ltd
Veg Maintain vegetation of
marginal zone Active channel 0.91 – 1.1 m depth 14 – 27 m3/s Seasonal channel 0.33 – 0.5 m depth
Sept , Oct, April
3 • Prevent terrestrialisation of main channel
• Reduce moisture stress for large trees • Inundate key waterside species (eg.
Sagitarius graminea and sedges) • Partially saturate seasonal bars to
maintain grass cover
4 • Prevent terrestrialisation of main channel • Reduce moisture stress for large trees • Inundate key species (eg. Sagitarius
graminea and sedges) • Keep secondary channel active • Saturate seasonal bars to maintain grass
cover
Geom. transport of sand and gravels in low-flow channel;reconstruction of lateral bars through deposition of sandand gravels on lateral bar.
Over top lateral bar; Depth of flow 1.5 to 1.6 m;
any 5 Maintain sorting of bed in low flow channel;reconstruct lateral bars after major floodevents
Alternative EC: D
FLOOD CLASS I: 14 – 27 m3/s Fish C; Inverts C; Rip veg D; Geomorph D
Com. Function/s (what does it have to do)
Description (what is the flood characteristic that
does that) Season No of
events Freq Reasoning
Inverts 2 n/a As for EC C, but decreased number of
events.
Fish
2
Important for local migrations, breeding andrecruitment. It is important for at least tw
o
events to activate backwaters (nurseryareas) and create opportunities for fish fryre-enter the mainstream and reduce lossesdue to drying of backwaters before fry canre-enter. Most of the fish are serialspawners and this will create at least oneopportunity per annum to ensure that somerecruitment do take place
Veg As above (Rip veg D)
Geom.
Fewer events will increase embeddednessof cobbles in main channel
DWAF Report No. RDM X100-01-CON-COMPR2-0604 Komati River Catchment Ecological Water Requirements Study – Quantity Report
Page J - 44
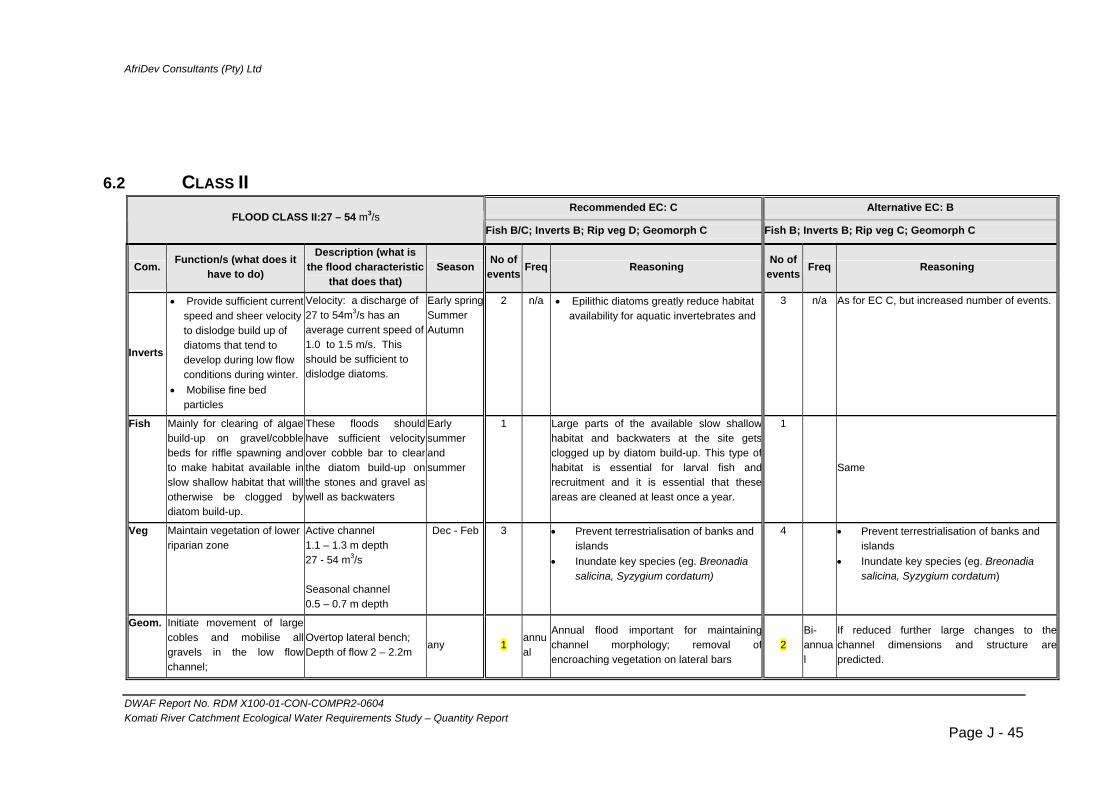
AfriDev Consultants (Pty) Ltd
6.2 CLASS II Recommended EC: C Alternative EC: B
FLOOD CLASS II:27 – 54 m3/s Fish B/C; Inverts B; Rip veg D; Geomorph C Fish B; Inverts B; Rip veg C; Geomorph C
Com. Function/s (what does it have to do)
Description (what is the flood characteristic
that does that) Season No of
events Freq Reasoning No of events Freq Reasoning
Inverts
• Provide sufficient current speed and sheer velocity to dislodge build up of diatoms that tend to develop during low flow conditions during winter.
• Mobilise fine bed particles
Velocity: a discharge of 27 to 54m3/s has an average current speed of 1.0 to 1.5 m/s. This should be sufficient to dislodge diatoms.
Early springSummer Autumn
2 n/a • Epilithic diatoms greatly reduce habitat availability for aquatic invertebrates and
3 n/a As for EC C, but increased number of events.
Fish Mainly for clearing of algaebuild-up on gravel/cobblebeds for riffle spawning andto make habitat available inslow shallow habitat that will otherwise be clogged bydiatom build-up.
These floods shouldhave sufficient velocityover cobble bar to clearthe diatom build-up onthe stones and gravel as well as backwaters
Early summer and summer
1 Large parts of the available slow shallowhabitat and backwaters at the site getsclogged up by diatom build-up. This type ofhabitat is essential for larval fish andrecruitment and it is essential that theseareas are cleaned at least once a year.
1
Same
Veg Maintain vegetation of lower riparian zone
Active channel 1.1 – 1.3 m depth 27 - 54 m3/s Seasonal channel 0.5 – 0.7 m depth
Dec - Feb 3 • Prevent terrestrialisation of banks and islands
• Inundate key species (eg. Breonadia salicina, Syzygium cordatum)
4 • Prevent terrestrialisation of banks and islands
• Inundate key species (eg. Breonadia salicina, Syzygium cordatum)
Geom. Initiate movement of large cobles and mobilise allgravels in the low flowchannel;
Overtop lateral bench; Depth of flow 2 – 2.2m
any 1 annual
Annual flood important for maintainingchannel morphology; removal ofencroaching vegetation on lateral bars
2 Bi-annual
If reduced further large changes to thechannel dimensions and structure arepredicted.
DWAF Report No. RDM X100-01-CON-COMPR2-0604 Komati River Catchment Ecological Water Requirements Study – Quantity Report
Page J - 45

AfriDev Consultants (Pty) Ltd
Mobilise gravels on lateral bars allowing resorting of material; Activate secondary channels
Alternative EC: D
FLOOD CLASS II:27 – 54 m3/s Fish C; Inverts C; Rip veg D; Geomorph D
Com. Function/s (what does it have to do)
Description (what is the flood characteristic that
does that) Season No of
events Freq Reasoning
Inverts 1 n/a As for EC C, but decreased number of
events.
Fish 1 Same
Veg As above (Rip veg D)
Geom. N/A
6.3 CLASS III Recommended EC: C Alternative EC: B
FLOOD CLASS III: 54 – 109 m3/s Fish B/C; Inverts B; Rip veg D; Geomorph C Fish B; Inverts B; Rip veg C; Geomorph C
Com. Function/s (what does it have to do)
Description (what is the flood characteristic
that does that) Season No of
events Freq Reasoning No of events Freq Reasoning
Inverts N/A
Fish N/A
Veg Maintain vegetation of lower riparian zone
Active channel 1.3 – 1.6 m depth
Nov - Mar 3 Prevent terrestrialisation of banks and islands. Inundate key species (eg.
4 • Prevent terrestrialisation of banks and islands
DWAF Report No. RDM X100-01-CON-COMPR2-0604 Komati River Catchment Ecological Water Requirements Study – Quantity Report
Page J - 46

AfriDev Consultants (Pty) Ltd
54 – 109 m3/s Seasonal channel 0.7 – 1.0 m depth
Breonadia salicina, Syzygium cordatum, Ficus sur). Facilitate seed dispersal and germinant establishment of key species. Remove debris
• Inundate key species (eg. Breonadia salicina, Syzygium cordatum, Ficus sur)
• Facilitate seed dispersal and germinant establishment of key species
• Remove debris
Geom. N/A
Alternative EC: D
FLOOD CLASS III: 54 – 109 m3/s Fish C; Inverts C; Rip veg D; Geomorph D
Com. Function/s (what does it have to do)
Description (what is the flood characteristic that
does that) Season No of
events Freq Reasoning
Inverts N/A
Fish N/A
Veg As above
Geom. N/A
6.4 CLASS IV Recommended EC: C Alternative EC: B
FLOOD CLASS IV: 109 – 217 m3/s (annual flood) Fish B/C; Inverts B; Rip veg D; Geomorph C Fish B; Inverts B; Rip veg C; Geomorph C
Com. Function/s (what does it have to do)
Description (what is the flood characteristic
that does that) Season No of
events Freq Reasoning No of events Freq Reasoning
Inverts N/A
Fish N/A
DWAF Report No. RDM X100-01-CON-COMPR2-0604 Komati River Catchment Ecological Water Requirements Study – Quantity Report
Page J - 47
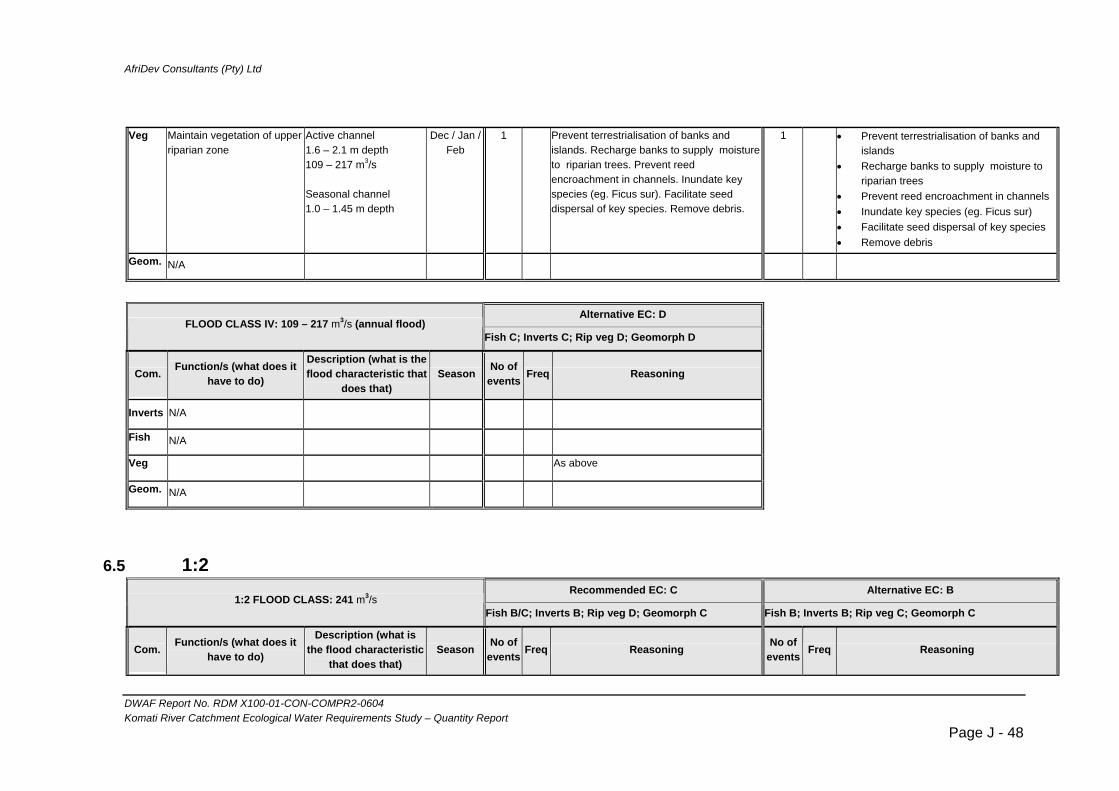
AfriDev Consultants (Pty) Ltd
Veg Maintain vegetation of upper
riparian zone Active channel 1.6 – 2.1 m depth 109 – 217 m3/s Seasonal channel 1.0 – 1.45 m depth
Dec / Jan / Feb
1 Prevent terrestrialisation of banks and islands. Recharge banks to supply moisture to riparian trees. Prevent reed encroachment in channels. Inundate key species (eg. Ficus sur). Facilitate seed dispersal of key species. Remove debris.
1 • Prevent terrestrialisation of banks and islands
• Recharge banks to supply moisture to riparian trees
• Prevent reed encroachment in channels • Inundate key species (eg. Ficus sur) • Facilitate seed dispersal of key species • Remove debris
Geom. N/A
Alternative EC: D
FLOOD CLASS IV: 109 – 217 m3/s (annual flood) Fish C; Inverts C; Rip veg D; Geomorph D
Com. Function/s (what does it have to do)
Description (what is the flood characteristic that
does that) Season No of
events Freq Reasoning
Inverts N/A
Fish N/A
Veg As above
Geom. N/A
6.5 1:2 Recommended EC: C Alternative EC: B
1:2 FLOOD CLASS: 241 m3/s Fish B/C; Inverts B; Rip veg D; Geomorph C Fish B; Inverts B; Rip veg C; Geomorph C
Com. Function/s (what does it have to do)
Description (what is the flood characteristic
that does that) Season No of
events Freq Reasoning No of events Freq Reasoning
DWAF Report No. RDM X100-01-CON-COMPR2-0604 Komati River Catchment Ecological Water Requirements Study – Quantity Report
Page J - 48
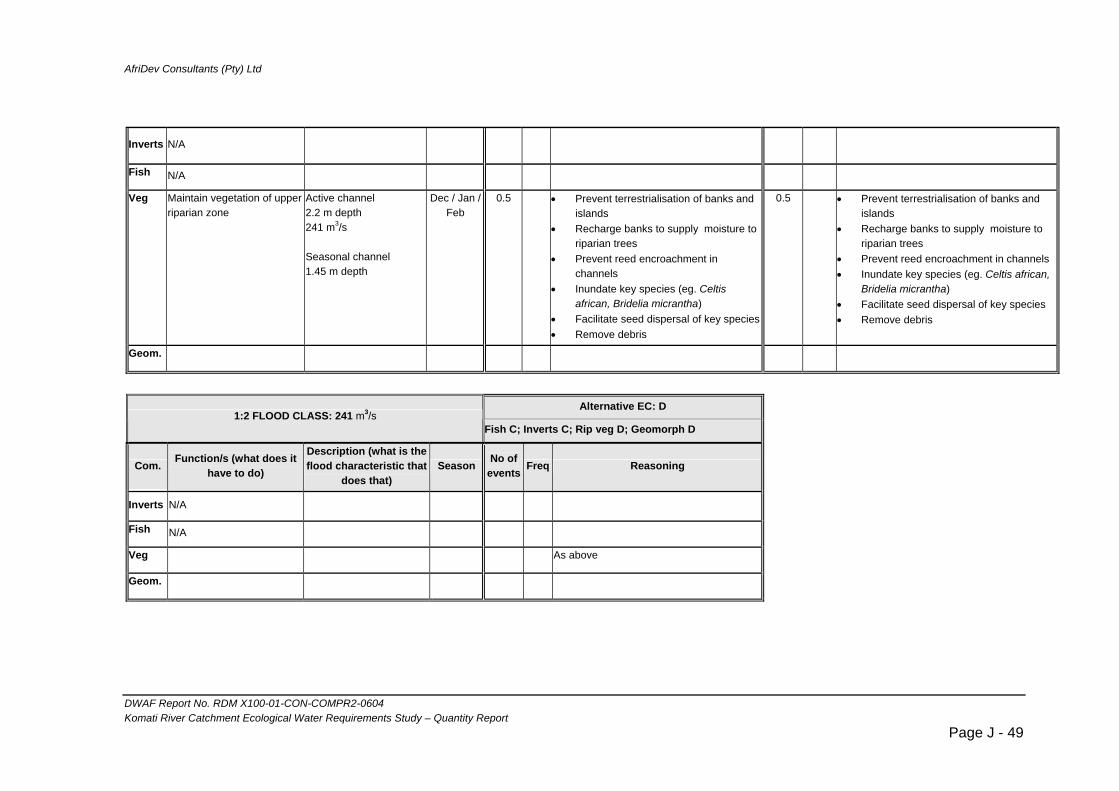
AfriDev Consultants (Pty) Ltd
Inverts N/A
Fish N/A
Veg Maintain vegetation of upper riparian zone
Active channel 2.2 m depth 241 m3/s Seasonal channel 1.45 m depth
Dec / Jan / Feb
0.5 • Prevent terrestrialisation of banks and islands
• Recharge banks to supply moisture to riparian trees
• Prevent reed encroachment in channels
• Inundate key species (eg. Celtis african, Bridelia micrantha)
• Facilitate seed dispersal of key species• Remove debris
0.5 • Prevent terrestrialisation of banks and islands
• Recharge banks to supply moisture to riparian trees
• Prevent reed encroachment in channels • Inundate key species (eg. Celtis african,
Bridelia micrantha) • Facilitate seed dispersal of key species • Remove debris
Geom.
Alternative EC: D
1:2 FLOOD CLASS: 241 m3/s Fish C; Inverts C; Rip veg D; Geomorph D
Com. Function/s (what does it have to do)
Description (what is the flood characteristic that
does that) Season No of
events Freq Reasoning
Inverts N/A
Fish N/A
Veg As above
Geom.
DWAF Report No. RDM X100-01-CON-COMPR2-0604 Komati River Catchment Ecological Water Requirements Study – Quantity Report
Page J - 49

AfriDev Consultants (Pty) Ltd
6.6 1:5
Recommended EC: C Alternative EC: B 1: 5 FLOOD CLASS: 692 m3/s
Fish B/C; Inverts B; Rip veg D; Geomorph C Fish B; Inverts B; Rip veg C; Geomorph C
Com. Function/s (what does it have to do)
Description (what is the flood characteristic
that does that) Season No of
events Freq Reasoning No of events Freq Reasoning
Inverts N/A
Fish N/A
Veg Maintain vegetation of upper riparian zone
Active channel 3.5 m depth 692 m3/s Seasonal channel 2.7 m depth
Dec / Jan / Feb
1 • Prevent terrestrialisation of banks and islands
• Recharge banks to supply moisture to riparian trees
• Prevent reed encroachment in channels
• Inundate key species (eg. Celtis africana, Syzygium cordatum)
• Facilitate seed dispersal of key species• Remove debris
1 • Prevent terrestrialisation of banks and islands
• Recharge banks to supply moisture to riparian trees
• Prevent reed encroachment in channels • Inundate key species (eg. Celtis africana,
Syzygium cordatum) • Facilitate seed dispersal of key species • Remove debris
Geom. Large floods of a depth of 4m that overtop the island and fill the macro-channel are important events for resetting channel morphology through overturning large cobble and small boulders and taking out established vegetation on lateral bars. These floodswould naturally occur with a frequency of between 1 in 5 to 1 in 10 years.
Alternative EC: D
1: 5 FLOOD CLASS: 692 m3/s Fish C; Inverts C; Rip veg D; Geomorph D
DWAF Report No. RDM X100-01-CON-COMPR2-0604 Komati River Catchment Ecological Water Requirements Study – Quantity Report
Page J - 50

AfriDev Consultants (Pty) Ltd
Com. Function/s (what does it have to do)
Description (what is the flood characteristic that
does that) Season No of
events Freq Reasoning
Inverts N/A
Fish N/A
Veg As above
Geom. *As above
6.7 1:20 Recommended EC: C Alternative EC: B
1: 20 FLOOD CLASS: 1637 m3/s Fish B/C; Inverts B; Rip veg D; Geomorph C Fish B; Inverts B; Rip veg C; Geomorph C
Com. Function/s (what does it have to do)
Description (what is the flood characteristic
that does that) Season No of
events Freq Reasoning No of events Freq Reasoning
Inverts N/A
Fish N/A
Veg Maintain vegetation of upper riparian zone
Active channel 5.2 m depth 1637 m3/s Seasonal channel 4.2 m depth
Dec / Jan / Feb
1 • Prevent terrestrialisation of banks and islands
• Prevent reed encroachment in channels
• Facilitate seed dispersal of key species• Remove debris and invader species
1 • Prevent terrestrialisation of banks and islands
• Prevent reed encroachment in channels • Facilitate seed dispersal of key species • Remove debris and invader species
Geom.
Alternative EC: D
1: 20 FLOOD CLASS: 1637 m3/s Fish C; Inverts C; Rip veg D; Geomorph D
DWAF Report No. RDM X100-01-CON-COMPR2-0604 Komati River Catchment Ecological Water Requirements Study – Quantity Report
Page J - 51

AfriDev Consultants (Pty) Ltd
Com. Function/s (what does it have to do)
Description (what is the flood characteristic that
does that) Season No of
events Freq Reasoning
Inverts N/A
Fish N/A
Veg As above
Geom. N/A
DWAF Report No. RDM X100-01-CON-COMPR2-0604 Komati River Catchment Ecological Water Requirements Study – Quantity Report
Page J - 52

AfriDev Consultants (Pty) Ltd 2005
Appendix K: Detailed EWR Results presented as
EWR Tables
Table of Contents 1. SITE K1 – GEVONDEN................................................................................................................ 2
1.1 RECOMMENDED EC: B/C....................................................................................................... 2 1.2 ALTERNATIVE EC:B............................................................................................................... 2 1.3 ALTERNATIVE EC: C/D.......................................................................................................... 3
2. SITE K2 – KROMDRAAI .............................................................................................................. 4
2.1 RECOMMENDED EC: C .......................................................................................................... 4 2.2 ALTERNATIVE EC: B.............................................................................................................. 4 2.3 ALTERNATIVE EC: D.............................................................................................................. 5
3. SITE K3 – TONGA ....................................................................................................................... 6 3.1 RECOMMENDED EC: D .......................................................................................................... 6
4. SITE G1: VAALKOP .................................................................................................................... 6 4.1 RECOMMENDED EC: D .......................................................................................................... 6 4.2 ALTERNATIVE EC: C.............................................................................................................. 7
5. SITE T1 - TEESPRUIT ................................................................................................................. 8 5.1 RECOMMENDED EC: C .......................................................................................................... 8 5.2 ALTERNATIVE EC: B.............................................................................................................. 8 5.3 ALTERNATIVE EC: D.............................................................................................................. 9
6. SITE L1 – KLEINDORINGKOP.................................................................................................... 9 6.1 RECOMMENDED EC: C/D ...................................................................................................... 9
7. SITE M1 – SILINGANI................................................................................................................ 10
7.1 RECOMMENDED EC: C ........................................................................................................ 10 7.2 ALTERNATIVE EC:B............................................................................................................. 11 7.3 ALTERNATIVE EC:D ............................................................................................................ 11
DWAF Report No. RDM X100-01-CON-COMPR2-0604 Komati River Catchment Ecological Water Requirements Study – Quantity Report
Page K - 1

AfriDev Consultants (Pty) Ltd 2005
1. SITE K1 – GEVONDEN
1.1
1.2
RECOMMENDED EC: B/C Desktop Version 2, Printed on 31/01/2005 Summary of IFR estimate for: EWR K1 Monthly Nat EWR K1 Determination based on defined BBM Table with site specific assurance rules. Annual Flows (Mill. cu. m or index values): MAR = 181.171 S.Dev. = 107.076 CV = 0.591 Q75 = 4.080 Q75/MMF = 0.270 BFI Index = 0.402 CV(JJA+JFM) Index = 1.527 REC = B/C Total IFR = 36.133 (19.94 %MAR) Maint. Lowflow = 36.133 (19.94 %MAR) Drought Lowflow = 13.685 ( 7.55 %MAR) Maint. Highflow = 0.000 ( 0.00 %MAR) Monthly Distributions (cu.m./s) Distribution Type : E.Escarp Month Natural Flows Modified Flows (IFR) Low flows High Flows Total Flows Mean SD CV Maint. Drought Maint. Maint. Oct 2.300 2.828 0.459 0.687 0.275 0.000 0.687 Nov 6.484 8.082 0.481 0.981 0.378 0.000 0.981 Dec 9.886 9.279 0.350 1.249 0.469 0.000 1.249 Jan 12.837 12.024 0.350 1.561 0.577 0.000 1.561 Feb 14.741 17.780 0.499 1.945 0.713 0.000 1.945 Mar 8.502 10.146 0.446 1.608 0.593 0.000 1.608 Apr 5.040 3.729 0.285 1.442 0.537 0.000 1.442 May 3.331 2.771 0.311 1.206 0.454 0.000 1.206 Jun 2.205 0.879 0.154 1.024 0.392 0.000 1.024 Jul 1.576 0.639 0.151 0.784 0.308 0.000 0.784 Aug 1.316 0.581 0.165 0.675 0.270 0.000 0.675 Sep 1.335 0.914 0.264 0.649 0.263 0.000 0.649
ALTERNATIVE EC:B Desktop Version 2, Printed on 31/01/2005 Summary of IFR estimate for: EWR K1 Monthly Nat EWR K1 Determination based on defined BBM Table with site specific assurance rules. Annual Flows (Mill. cu. m or index values): MAR = 181.171 S.Dev. = 107.076 CV = 0.591 Q75 = 4.080 Q75/MMF = 0.270 BFI Index = 0.402 CV(JJA+JFM) Index = 1.527 EC = B Total IFR = 45.050 (24.87 %MAR) Maint. Lowflow = 45.050 (24.87 %MAR) Drought Lowflow = 13.685 ( 7.55 %MAR) Maint. Highflow = 0.000 ( 0.00 %MAR) Monthly Distributions (cu.m./s) Distribution Type : E.Escarp
DWAF Report No. RDM X100-01-CON-COMPR2-0604 Komati River Catchment Ecological Water Requirements Study – Quantity Report
Page K - 2
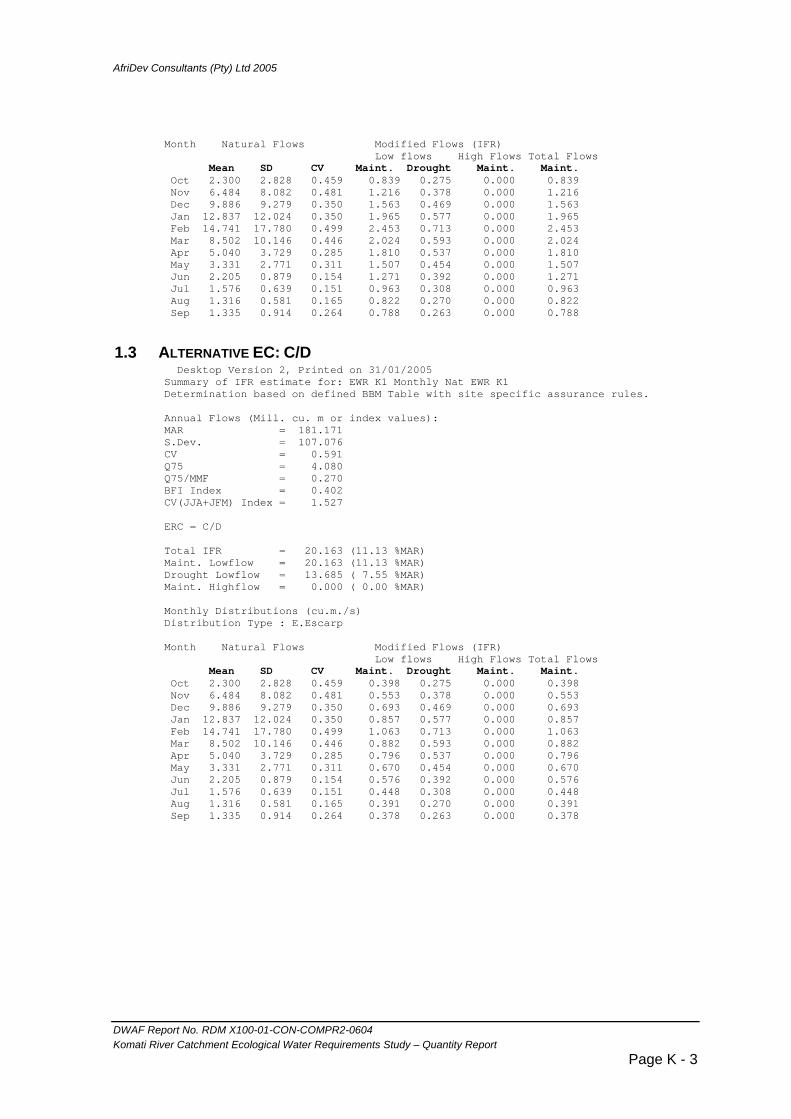
AfriDev Consultants (Pty) Ltd 2005
Month Natural Flows Modified Flows (IFR) Low flows High Flows Total Flows Mean SD CV Maint. Drought Maint. Maint. Oct 2.300 2.828 0.459 0.839 0.275 0.000 0.839 Nov 6.484 8.082 0.481 1.216 0.378 0.000 1.216 Dec 9.886 9.279 0.350 1.563 0.469 0.000 1.563 Jan 12.837 12.024 0.350 1.965 0.577 0.000 1.965 Feb 14.741 17.780 0.499 2.453 0.713 0.000 2.453 Mar 8.502 10.146 0.446 2.024 0.593 0.000 2.024 Apr 5.040 3.729 0.285 1.810 0.537 0.000 1.810 May 3.331 2.771 0.311 1.507 0.454 0.000 1.507 Jun 2.205 0.879 0.154 1.271 0.392 0.000 1.271 Jul 1.576 0.639 0.151 0.963 0.308 0.000 0.963 Aug 1.316 0.581 0.165 0.822 0.270 0.000 0.822 Sep 1.335 0.914 0.264 0.788 0.263 0.000 0.788
1.3 ALTERNATIVE EC: C/D Desktop Version 2, Printed on 31/01/2005 Summary of IFR estimate for: EWR K1 Monthly Nat EWR K1 Determination based on defined BBM Table with site specific assurance rules. Annual Flows (Mill. cu. m or index values): MAR = 181.171 S.Dev. = 107.076 CV = 0.591 Q75 = 4.080 Q75/MMF = 0.270 BFI Index = 0.402 CV(JJA+JFM) Index = 1.527 ERC = C/D Total IFR = 20.163 (11.13 %MAR) Maint. Lowflow = 20.163 (11.13 %MAR) Drought Lowflow = 13.685 ( 7.55 %MAR) Maint. Highflow = 0.000 ( 0.00 %MAR) Monthly Distributions (cu.m./s) Distribution Type : E.Escarp Month Natural Flows Modified Flows (IFR) Low flows High Flows Total Flows Mean SD CV Maint. Drought Maint. Maint. Oct 2.300 2.828 0.459 0.398 0.275 0.000 0.398 Nov 6.484 8.082 0.481 0.553 0.378 0.000 0.553 Dec 9.886 9.279 0.350 0.693 0.469 0.000 0.693 Jan 12.837 12.024 0.350 0.857 0.577 0.000 0.857 Feb 14.741 17.780 0.499 1.063 0.713 0.000 1.063 Mar 8.502 10.146 0.446 0.882 0.593 0.000 0.882 Apr 5.040 3.729 0.285 0.796 0.537 0.000 0.796 May 3.331 2.771 0.311 0.670 0.454 0.000 0.670 Jun 2.205 0.879 0.154 0.576 0.392 0.000 0.576 Jul 1.576 0.639 0.151 0.448 0.308 0.000 0.448 Aug 1.316 0.581 0.165 0.391 0.270 0.000 0.391 Sep 1.335 0.914 0.264 0.378 0.263 0.000 0.378
DWAF Report No. RDM X100-01-CON-COMPR2-0604 Komati River Catchment Ecological Water Requirements Study – Quantity Report
Page K - 3
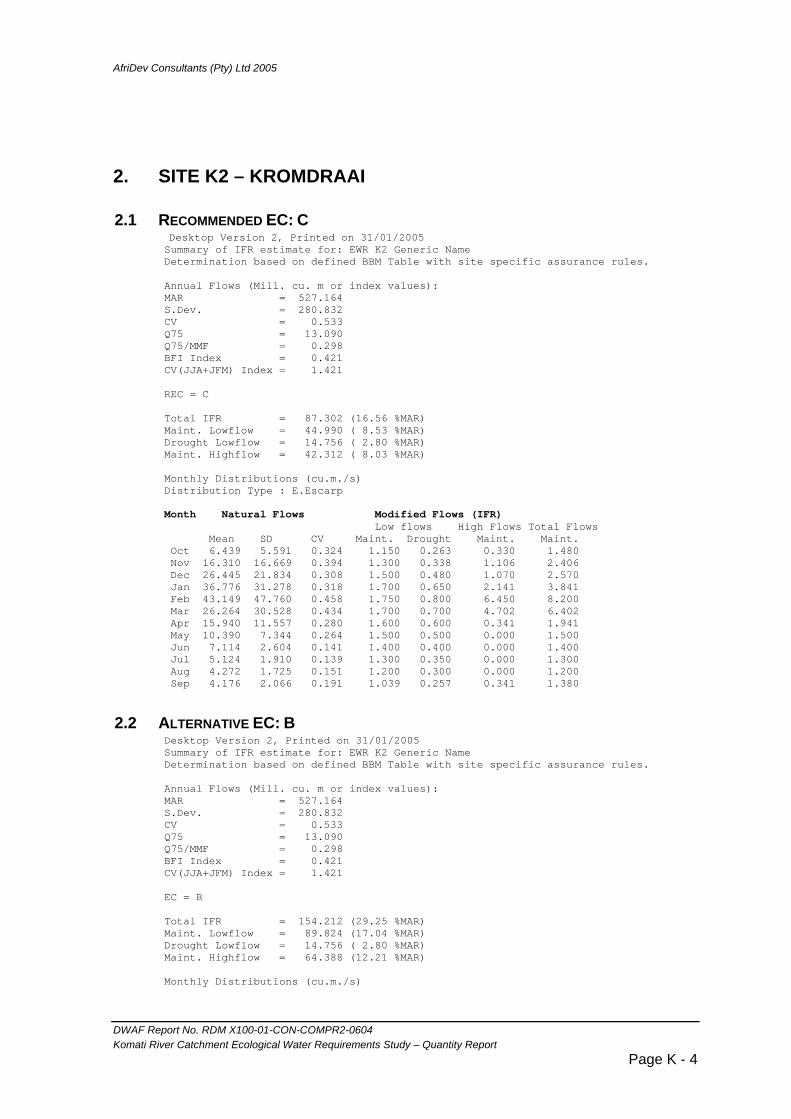
AfriDev Consultants (Pty) Ltd 2005
2. SITE K2 – KROMDRAAI
2.1
2.2
RECOMMENDED EC: C Desktop Version 2, Printed on 31/01/2005 Summary of IFR estimate for: EWR K2 Generic Name Determination based on defined BBM Table with site specific assurance rules. Annual Flows (Mill. cu. m or index values): MAR = 527.164 S.Dev. = 280.832 CV = 0.533 Q75 = 13.090 Q75/MMF = 0.298 BFI Index = 0.421 CV(JJA+JFM) Index = 1.421 REC = C Total IFR = 87.302 (16.56 %MAR) Maint. Lowflow = 44.990 ( 8.53 %MAR) Drought Lowflow = 14.756 ( 2.80 %MAR) Maint. Highflow = 42.312 ( 8.03 %MAR) Monthly Distributions (cu.m./s) Distribution Type : E.Escarp Month Natural Flows Modified Flows (IFR)
Low flows High Flows Total Flows Mean SD CV Maint. Drought Maint. Maint. Oct 6.439 5.591 0.324 1.150 0.263 0.330 1.480 Nov 16.310 16.669 0.394 1.300 0.338 1.106 2.406 Dec 26.445 21.834 0.308 1.500 0.480 1.070 2.570 Jan 36.776 31.278 0.318 1.700 0.650 2.141 3.841 Feb 43.149 47.760 0.458 1.750 0.800 6.450 8.200 Mar 26.264 30.528 0.434 1.700 0.700 4.702 6.402 Apr 15.940 11.557 0.280 1.600 0.600 0.341 1.941 May 10.390 7.344 0.264 1.500 0.500 0.000 1.500 Jun 7.114 2.604 0.141 1.400 0.400 0.000 1.400 Jul 5.124 1.910 0.139 1.300 0.350 0.000 1.300 Aug 4.272 1.725 0.151 1.200 0.300 0.000 1.200 Sep 4.176 2.066 0.191 1.039 0.257 0.341 1.380
ALTERNATIVE EC: B Desktop Version 2, Printed on 31/01/2005 Summary of IFR estimate for: EWR K2 Generic Name Determination based on defined BBM Table with site specific assurance rules. Annual Flows (Mill. cu. m or index values): MAR = 527.164 S.Dev. = 280.832 CV = 0.533 Q75 = 13.090 Q75/MMF = 0.298 BFI Index = 0.421 CV(JJA+JFM) Index = 1.421 EC = B Total IFR = 154.212 (29.25 %MAR) Maint. Lowflow = 89.824 (17.04 %MAR) Drought Lowflow = 14.756 ( 2.80 %MAR) Maint. Highflow = 64.388 (12.21 %MAR) Monthly Distributions (cu.m./s)
DWAF Report No. RDM X100-01-CON-COMPR2-0604 Komati River Catchment Ecological Water Requirements Study – Quantity Report
Page K - 4

AfriDev Consultants (Pty) Ltd 2005
Distribution Type : E.Escarp Month Natural Flows Modified Flows (IFR) Low flows High Flows Total Flows Mean SD CV Maint. Drought Maint. Maint. Oct 6.439 5.591 0.324 1.800 0.263 0.330 2.130 Nov 16.310 16.669 0.394 2.400 0.338 1.106 3.506 Dec 26.445 21.834 0.308 3.100 0.480 3.211 6.311 Jan 36.776 31.278 0.318 3.700 0.650 3.211 6.911 Feb 43.149 47.760 0.458 4.200 0.800 11.655 15.855 Mar 26.264 30.528 0.434 3.900 0.700 4.702 8.602 Apr 15.940 11.557 0.280 3.650 0.600 0.341 3.991 May 10.390 7.344 0.264 3.200 0.500 0.330 3.530 Jun 7.114 2.604 0.141 2.700 0.400 0.000 2.700 Jul 5.124 1.910 0.139 2.100 0.350 0.000 2.100 Aug 4.272 1.725 0.151 1.800 0.300 0.000 1.800 Sep 4.176 2.066 0.191 1.731 0.257 0.341 2.072
2.3 ALTERNATIVE EC: D Desktop Version 2, Printed on 31/01/2005 Summary of IFR estimate for: EWR K2 Generic Name Determination based on defined BBM Table with site specific assurance rules. Annual Flows (Mill. cu. m or index values): MAR = 527.164 S.Dev. = 280.832 CV = 0.533 Q75 = 13.090 Q75/MMF = 0.298 BFI Index = 0.421 CV(JJA+JFM) Index = 1.421 EC = D Total IFR = 46.587 ( 8.84 %MAR) Maint. Lowflow = 20.368 ( 3.86 %MAR) Drought Lowflow = 14.756 ( 2.80 %MAR) Maint. Highflow = 26.220 ( 4.97 %MAR) Monthly Distributions (cu.m./s) Distribution Type : E.Escarp Month Natural Flows Modified Flows (IFR) Low flows High Flows Total Flows Mean SD CV Maint. Drought Maint. Maint. Oct 6.439 5.591 0.324 0.505 0.263 0.330 0.835 Nov 16.310 16.669 0.394 0.600 0.338 0.000 0.600 Dec 26.445 21.834 0.308 0.720 0.480 1.070 1.790 Jan 36.776 31.278 0.318 0.800 0.650 2.141 2.941 Feb 43.149 47.760 0.458 0.830 0.800 3.998 4.828 Mar 26.264 30.528 0.434 0.800 0.700 2.308 3.108 Apr 15.940 11.557 0.280 0.700 0.600 0.341 1.041 May 10.390 7.344 0.264 0.650 0.500 0.000 0.650 Jun 7.114 2.604 0.141 0.600 0.400 0.000 0.600 Jul 5.124 1.910 0.139 0.550 0.350 0.000 0.550 Aug 4.272 1.725 0.151 0.510 0.300 0.000 0.510 Sep 4.176 2.066 0.191 0.497 0.257 0.000 0.497
DWAF Report No. RDM X100-01-CON-COMPR2-0604 Komati River Catchment Ecological Water Requirements Study – Quantity Report
Page K - 5

AfriDev Consultants (Pty) Ltd 2005
3. SITE K3 – TONGA
3.1
4.1
RECOMMENDED EC: D Desktop Version 2, Printed on 28/11/2004
Summary of IFR estimate for: EWR K3 Monthly Nat EWR K3 Determination based on defined BBM Table with site specific assurance rules. Annual Flows (Mill. cu. m or index values): MAR = 1016.482 S.Dev. = 561.277 CV = 0.552 Q75 = 29.380 Q75/MMF = 0.347 BFI Index = 0.458 CV(JJA+JFM) Index = 1.334 ERC = D Total IFR = 147.839 (14.54 %MAR) Maint. Lowflow = 71.650 ( 7.05 %MAR) Drought Lowflow = 15.927 ( 1.57 %MAR) Maint. Highflow = 76.188 ( 7.50 %MAR) Monthly Distributions (cu.m./s) Distribution Type : E.Escarp Month Natural Flows Modified Flows (IFR)
Low flows High Flows Total Flows Mean SD CV Maint. Drought Maint. Maint. Oct 12.626 8.162 0.241 1.818 0.344 0.537 2.355 Nov 27.697 21.393 0.298 1.900 0.450 1.904 3.804 Dec 44.721 31.030 0.259 2.100 0.550 1.842 3.942 Jan 64.528 53.190 0.308 2.600 0.598 3.966 6.566 Feb 81.707 85.593 0.433 3.000 0.700 4.391 7.391 Mar 56.340 62.054 0.411 2.900 0.664 15.215 18.115 Apr 34.788 34.223 0.380 2.700 0.624 0.555 3.255 May 20.981 11.869 0.211 2.450 0.540 0.000 2.450 Jun 15.524 5.185 0.129 2.200 0.490 0.000 2.200 Jul 11.801 4.028 0.127 1.950 0.408 0.000 1.950 Aug 9.940 3.523 0.132 1.870 0.361 0.000 1.870 Sep 9.590 4.115 0.166 1.832 0.347 0.555 2.387
4. SITE G1: VAALKOP
RECOMMENDED EC: D Desktop Version 2, Printed on 31/01/2005 Summary of IFR estimate for: EWR G1 Generic Name Determination based on defined BBM Table with site specific assurance rules. Annual Flows (Mill. cu. m or index values): MAR = 37.730 S.Dev. = 20.311 CV = 0.538 Q75 = 0.970 Q75/MMF = 0.309 BFI Index = 0.426 CV(JJA+JFM) Index = 1.412 REC = D
DWAF Report No. RDM X100-01-CON-COMPR2-0604 Komati River Catchment Ecological Water Requirements Study – Quantity Report
Page K - 6

AfriDev Consultants (Pty) Ltd 2005
Total IFR = 6.599 (17.49 %MAR) Maint. Lowflow = 4.681 (12.41 %MAR) Drought Lowflow = 2.328 ( 6.17 %MAR) Maint. Highflow = 1.918 ( 5.08 %MAR) Monthly Distributions (cu.m./s) Distribution Type : E.Escarp Month Natural Flows Modified Flows (IFR) Low flows High Flows Total Flows Mean SD CV Maint. Drought Maint. Maint. Oct 0.440 0.339 0.287 0.109 0.063 0.000 0.109 Nov 1.066 1.025 0.371 0.125 0.068 0.040 0.165 Dec 1.855 1.527 0.307 0.150 0.075 0.039 0.189 Jan 2.670 2.248 0.314 0.180 0.085 0.108 0.288 Feb 3.072 3.347 0.450 0.210 0.090 0.544 0.754 Mar 1.917 2.229 0.434 0.190 0.085 0.000 0.190 Apr 1.193 0.923 0.298 0.180 0.080 0.020 0.200 May 0.753 0.502 0.249 0.160 0.075 0.000 0.160 Jun 0.523 0.189 0.139 0.143 0.070 0.000 0.143 Jul 0.378 0.141 0.139 0.120 0.068 0.000 0.120 Aug 0.315 0.128 0.152 0.110 0.065 0.000 0.110 Sep 0.302 0.138 0.176 0.109 0.063 0.020 0.129
4.2 ALTERNATIVE EC: C Desktop Version 2, Printed on 12/11/2004
Summary of IFR estimate for: EWR G1 Generic Name Determination based on defined BBM Table with site specific assurance rules. Annual Flows (Mill. cu. m or index values): MAR = 37.730 S.Dev. = 20.311 CV = 0.538 Q75 = 0.970 Q75/MMF = 0.309 BFI Index = 0.426 CV(JJA+JFM) Index = 1.412 EC = C Total IFR = 11.395 (30.20 %MAR) Maint. Lowflow = 8.907 (23.61 %MAR) Drought Lowflow = 2.328 ( 6.17 %MAR) Maint. Highflow = 2.488 ( 6.60 %MAR) Monthly Distributions (cu.m./s) Distribution Type : E.Escarp Month Natural Flows Modified Flows (IFR) Low flows High Flows Total Flows Mean SD CV Maint. Drought Maint. Maint. Oct 0.440 0.339 0.287 0.170 0.063 0.000 0.170 Nov 1.066 1.025 0.371 0.215 0.068 0.040 0.255 Dec 1.855 1.527 0.307 0.270 0.075 0.039 0.309 Jan 2.670 2.248 0.314 0.400 0.085 0.147 0.547 Feb 3.072 3.347 0.450 0.530 0.090 0.737 1.267 Mar 1.917 2.229 0.434 0.420 0.085 0.000 0.420 Apr 1.193 0.923 0.298 0.340 0.080 0.020 0.360 May 0.753 0.502 0.249 0.280 0.075 0.000 0.280 Jun 0.523 0.189 0.139 0.250 0.070 0.000 0.250 Jul 0.378 0.141 0.139 0.200 0.068 0.000 0.200 Aug 0.315 0.128 0.152 0.170 0.065 0.000 0.170 Sep 0.302 0.138 0.176 0.163 0.063 0.020 0.183
DWAF Report No. RDM X100-01-CON-COMPR2-0604 Komati River Catchment Ecological Water Requirements Study – Quantity Report
Page K - 7
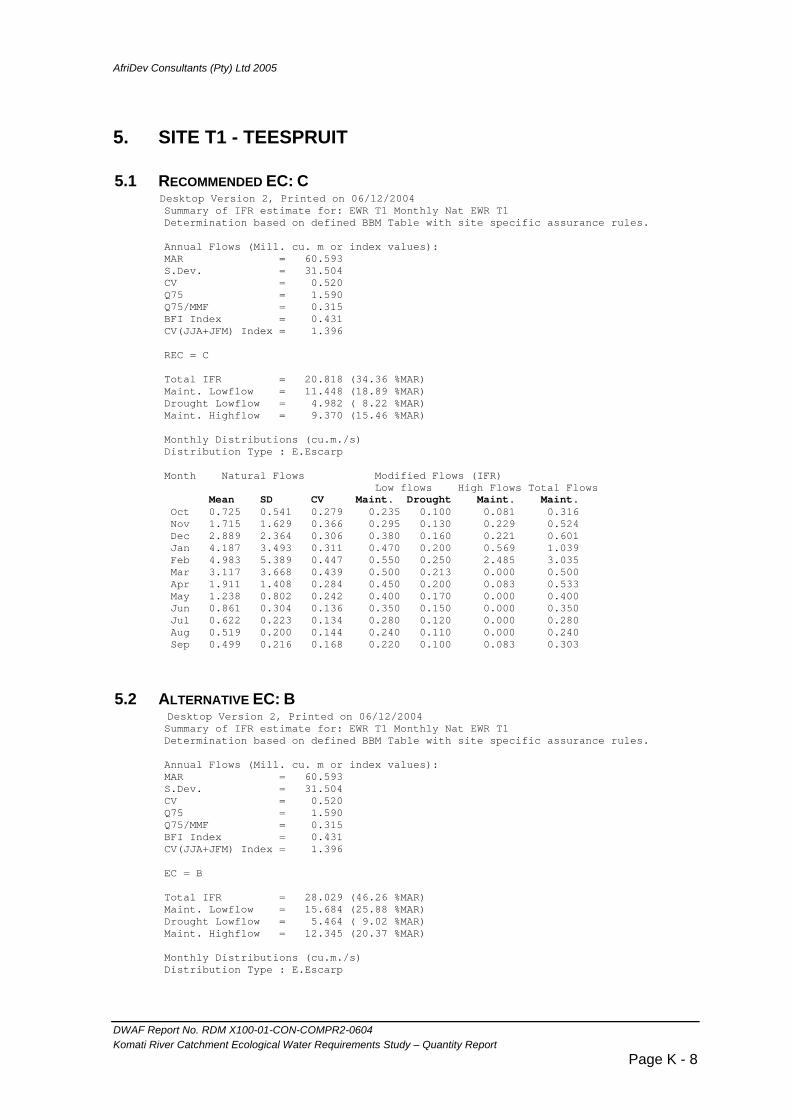
AfriDev Consultants (Pty) Ltd 2005
5. SITE T1 - TEESPRUIT
5.1
5.2
RECOMMENDED EC: C Desktop Version 2, Printed on 06/12/2004
Summary of IFR estimate for: EWR T1 Monthly Nat EWR T1 Determination based on defined BBM Table with site specific assurance rules. Annual Flows (Mill. cu. m or index values): MAR = 60.593 S.Dev. = 31.504 CV = 0.520 Q75 = 1.590 Q75/MMF = 0.315 BFI Index = 0.431 CV(JJA+JFM) Index = 1.396 REC = C Total IFR = 20.818 (34.36 %MAR) Maint. Lowflow = 11.448 (18.89 %MAR) Drought Lowflow = 4.982 ( 8.22 %MAR) Maint. Highflow = 9.370 (15.46 %MAR) Monthly Distributions (cu.m./s) Distribution Type : E.Escarp Month Natural Flows Modified Flows (IFR) Low flows High Flows Total Flows Mean SD CV Maint. Drought Maint. Maint. Oct 0.725 0.541 0.279 0.235 0.100 0.081 0.316 Nov 1.715 1.629 0.366 0.295 0.130 0.229 0.524 Dec 2.889 2.364 0.306 0.380 0.160 0.221 0.601 Jan 4.187 3.493 0.311 0.470 0.200 0.569 1.039 Feb 4.983 5.389 0.447 0.550 0.250 2.485 3.035 Mar 3.117 3.668 0.439 0.500 0.213 0.000 0.500 Apr 1.911 1.408 0.284 0.450 0.200 0.083 0.533 May 1.238 0.802 0.242 0.400 0.170 0.000 0.400 Jun 0.861 0.304 0.136 0.350 0.150 0.000 0.350 Jul 0.622 0.223 0.134 0.280 0.120 0.000 0.280 Aug 0.519 0.200 0.144 0.240 0.110 0.000 0.240 Sep 0.499 0.216 0.168 0.220 0.100 0.083 0.303
ALTERNATIVE EC: B Desktop Version 2, Printed on 06/12/2004
Summary of IFR estimate for: EWR T1 Monthly Nat EWR T1 Determination based on defined BBM Table with site specific assurance rules. Annual Flows (Mill. cu. m or index values): MAR = 60.593 S.Dev. = 31.504 CV = 0.520 Q75 = 1.590 Q75/MMF = 0.315 BFI Index = 0.431 CV(JJA+JFM) Index = 1.396 EC = B Total IFR = 28.029 (46.26 %MAR) Maint. Lowflow = 15.684 (25.88 %MAR) Drought Lowflow = 5.464 ( 9.02 %MAR) Maint. Highflow = 12.345 (20.37 %MAR) Monthly Distributions (cu.m./s) Distribution Type : E.Escarp
DWAF Report No. RDM X100-01-CON-COMPR2-0604 Komati River Catchment Ecological Water Requirements Study – Quantity Report
Page K - 8

AfriDev Consultants (Pty) Ltd 2005
Month Natural Flows Modified Flows (IFR) Low flows High Flows Total Flows Mean SD CV Maint. Drought Maint. Maint. Oct 0.725 0.541 0.279 0.340 0.136 0.081 0.421 Nov 1.715 1.629 0.366 0.400 0.150 0.229 0.629 Dec 2.889 2.364 0.306 0.500 0.170 0.806 1.306 Jan 4.187 3.493 0.311 0.600 0.200 0.806 1.406 Feb 4.983 5.389 0.447 0.750 0.250 1.462 2.212 Mar 3.117 3.668 0.439 0.680 0.220 1.213 1.893 Apr 1.911 1.408 0.284 0.610 0.200 0.083 0.693 May 1.238 0.802 0.242 0.550 0.180 0.000 0.550 Jun 0.861 0.304 0.136 0.470 0.160 0.000 0.470 Jul 0.622 0.223 0.134 0.400 0.145 0.000 0.400 Aug 0.519 0.200 0.144 0.353 0.138 0.000 0.353 Sep 0.499 0.216 0.168 0.334 0.136 0.083 0.417
5.3
6.1
ALTERNATIVE EC: D Desktop Version 2, Printed on 06/12/2004
Summary of IFR estimate for: EWR T1 Monthly Nat EWR T1 Determination based on defined BBM Table with site specific assurance rules. Annual Flows (Mill. cu. m or index values): MAR = 60.593 S.Dev. = 31.504 CV = 0.520 Q75 = 1.590 Q75/MMF = 0.315 BFI Index = 0.431 CV(JJA+JFM) Index = 1.396 EC = D Total IFR = 13.429 (22.16 %MAR) Maint. Lowflow = 4.982 ( 8.22 %MAR) Drought Lowflow = 4.982 ( 8.22 %MAR) Maint. Highflow = 8.446 (13.94 %MAR) Monthly Distributions (cu.m./s) Distribution Type : E.Escarp Month Natural Flows Modified Flows (IFR) Low flows High Flows Total Flows Mean SD CV Maint. Drought Maint. Maint. Oct 0.725 0.541 0.279 0.104 0.100 0.000 0.104 Nov 1.715 1.629 0.366 0.130 0.130 0.229 0.359 Dec 2.889 2.364 0.306 0.158 0.160 0.221 0.379 Jan 4.187 3.493 0.311 0.198 0.200 0.569 0.767 Feb 4.983 5.389 0.447 0.248 0.250 2.193 2.441 Mar 3.117 3.668 0.439 0.213 0.213 0.000 0.213 Apr 1.911 1.408 0.284 0.198 0.200 0.083 0.281 May 1.238 0.802 0.242 0.170 0.170 0.000 0.170 Jun 0.861 0.304 0.136 0.152 0.150 0.000 0.152 Jul 0.622 0.223 0.134 0.122 0.120 0.000 0.122 Aug 0.519 0.200 0.144 0.107 0.110 0.000 0.107 Sep 0.499 0.216 0.168 0.103 0.100 0.083 0.186
6. SITE L1 – KLEINDORINGKOP
RECOMMENDED EC: C/D Desktop Version 2, Printed on 31/01/2005 Summary of IFR estimate for: EWR L1 Monthly Nat EWR L1 Determination based on defined BBM Table with site specific assurance rules. Annual Flows (Mill. cu. m or index values):
DWAF Report No. RDM X100-01-CON-COMPR2-0604 Komati River Catchment Ecological Water Requirements Study – Quantity Report
Page K - 9

AfriDev Consultants (Pty) Ltd 2005
MAR = 321.652 S.Dev. = 203.673 CV = 0.633 Q75 = 10.060 Q75/MMF = 0.375 BFI Index = 0.484 CV(JJA+JFM) Index = 1.355 REC = C/D Total IFR = 30.399 ( 9.45 %MAR) Maint. Lowflow = 20.877 ( 6.49 %MAR) Drought Lowflow = 9.153 ( 2.85 %MAR) Maint. Highflow = 9.522 ( 2.96 %MAR) Monthly Distributions (cu.m./s) Distribution Type : E.Escarp Month Natural Flows Modified Flows (IFR) Low flows High Flows Total Flows Mean SD CV Maint. Drought Maint. Maint. Oct 3.978 2.032 0.191 0.330 0.200 0.000 0.330 Nov 7.619 4.872 0.247 0.450 0.240 0.238 0.688 Dec 12.801 9.341 0.272 0.600 0.300 0.230 0.830 Jan 18.330 15.795 0.322 0.750 0.320 0.586 1.336 Feb 24.676 27.937 0.468 1.160 0.403 0.649 1.809 Mar 19.684 22.880 0.434 1.060 0.375 1.838 2.898 Apr 12.492 14.619 0.451 0.950 0.362 0.000 0.950 May 7.076 3.275 0.173 0.800 0.314 0.000 0.800 Jun 5.471 1.720 0.121 0.680 0.292 0.000 0.680 Jul 4.275 1.285 0.112 0.500 0.251 0.000 0.500 Aug 3.600 1.055 0.109 0.363 0.224 0.000 0.363 Sep 3.411 1.212 0.137 0.342 0.211 0.087 0.429
7. SITE M1 – SILINGANI
7.1 RECOMMENDED EC: C Desktop Version 2, Printed on 01/02/2005
Summary of IFR estimate for: EWR M1 Generic Name Determination based on defined BBM Table with site specific assurance rules. Annual Flows (Mill. cu. m or index values): MAR = 857.099 S.Dev. = 451.293 CV = 0.527 Q75 = 25.230 Q75/MMF = 0.353 BFI Index = 0.461 CV(JJA+JFM) Index = 1.300 REC = C Total IFR = 222.432 (25.95 %MAR) Maint. Lowflow = 169.500 (19.78 %MAR) Drought Lowflow = 73.699 ( 8.60 %MAR) Maint. Highflow = 52.933 ( 6.18 %MAR) Monthly Distributions (cu.m./s) Distribution Type : E.Escarp Month Natural Flows Modified Flows (IFR) Low flows High Flows Total Flows Mean SD CV Maint. Drought Maint. Maint. Oct 10.835 7.194 0.248 3.700 1.300 0.323 4.023 Nov 23.863 19.381 0.313 4.500 2.000 3.450 7.950 Dec 38.290 27.221 0.265 5.300 2.600 2.371 7.671
DWAF Report No. RDM X100-01-CON-COMPR2-0604 Komati River Catchment Ecological Water Requirements Study – Quantity Report
Page K - 10

AfriDev Consultants (Pty) Ltd 2005
Jan 54.626 43.622 0.298 6.500 3.000 2.371 8.871 Feb 68.406 71.049 0.429 8.000 3.750 9.237 17.237 Mar 46.387 49.519 0.399 7.000 3.300 2.371 9.371 Apr 28.794 24.474 0.328 6.500 3.000 0.333 6.833 May 17.971 10.116 0.210 5.800 2.500 0.000 5.800 Jun 13.242 4.218 0.123 5.200 2.200 0.000 5.200 Jul 10.023 3.299 0.123 4.500 1.800 0.000 4.500 Aug 8.445 2.929 0.130 4.000 1.500 0.000 4.000 Sep 8.131 3.413 0.162 3.700 1.200 0.333 4.033
7.2
7.3
ALTERNATIVE EC:B Desktop Version 2, Printed on 01/02/2005 Summary of IFR estimate for: EWR M1 Generic Name Determination based on defined BBM Table with site specific assurance rules. Annual Flows (Mill. cu. m or index values): MAR = 857.099 S.Dev. = 451.293 CV = 0.527 Q75 = 25.230 Q75/MMF = 0.353 BFI Index = 0.461 CV(JJA+JFM) Index = 1.300 EC = B Total IFR = 382.134 (44.58 %MAR) Maint. Lowflow = 321.425 (37.50 %MAR) Drought Lowflow = 73.699 ( 8.60 %MAR) Maint. Highflow = 60.709 ( 7.08 %MAR) Monthly Distributions (cu.m./s) Distribution Type : E.Escarp Month Natural Flows Modified Flows (IFR) Low flows High Flows Total Flows Mean SD CV Maint. Drought Maint. Maint. Oct 10.835 7.194 0.248 8.000 1.300 1.548 9.548 Nov 23.863 19.381 0.313 8.400 2.000 3.450 11.850 Dec 38.290 27.221 0.265 9.500 2.600 2.371 11.871 Jan 54.626 43.622 0.298 11.400 3.000 2.371 13.771 Feb 68.406 71.049 0.429 14.000 3.750 9.237 23.237 Mar 46.387 49.519 0.399 13.000 3.300 3.726 16.726 Apr 28.794 24.474 0.328 12.000 3.000 0.333 12.333 May 17.971 10.116 0.210 10.800 2.500 0.000 10.800 Jun 13.242 4.218 0.123 10.000 2.200 0.000 10.000 Jul 10.023 3.299 0.123 9.000 1.800 0.000 9.000 Aug 8.445 2.929 0.130 8.500 1.500 0.000 8.500 Sep 8.131 3.413 0.162 8.000 1.200 0.667 8.667
ALTERNATIVE EC:D Desktop Version 2, Printed on 01/02/2005 Summary of IFR estimate for: EWR M1 Generic Name Determination based on defined BBM Table with site specific assurance rules. Annual Flows (Mill. cu. m or index values): MAR = 857.099 S.Dev. = 451.293 CV = 0.527 Q75 = 25.230 Q75/MMF = 0.353 BFI Index = 0.461 CV(JJA+JFM) Index = 1.300 EC = D
DWAF Report No. RDM X100-01-CON-COMPR2-0604 Komati River Catchment Ecological Water Requirements Study – Quantity Report
Page K - 11

AfriDev Consultants (Pty) Ltd 2005
Total IFR = 108.687 (12.68 %MAR) Maint. Lowflow = 76.611 ( 8.94 %MAR) Drought Lowflow = 73.699 ( 8.60 %MAR) Maint. Highflow = 32.076 ( 3.74 %MAR) Monthly Distributions (cu.m./s) Distribution Type : E.Escarp Month Natural Flows Modified Flows (IFR) Low flows High Flows Total Flows Mean SD CV Maint. Drought Maint. Maint. Oct 10.835 7.194 0.248 1.500 1.300 0.323 1.823 Nov 23.863 19.381 0.313 2.000 2.000 0.933 2.933 Dec 38.290 27.221 0.265 2.700 2.600 2.371 5.071 Jan 54.626 43.622 0.298 3.000 3.000 2.371 5.371 Feb 68.406 71.049 0.429 3.750 3.750 3.313 7.062 Mar 46.387 49.519 0.399 3.300 3.300 2.371 5.671 Apr 28.794 24.474 0.328 3.000 3.000 0.333 3.333 May 17.971 10.116 0.210 2.600 2.500 0.000 2.600 Jun 13.242 4.218 0.123 2.300 2.200 0.000 2.300 Jul 10.023 3.299 0.123 2.000 1.800 0.000 2.000 Aug 8.445 2.929 0.130 1.600 1.500 0.000 1.600 Sep 8.131 3.413 0.162 1.500 1.200 0.333 1.833
DWAF Report No. RDM X100-01-CON-COMPR2-0604 Komati River Catchment Ecological Water Requirements Study – Quantity Report
Page K - 12