Modellering av næringsstoff-transport i Morsa vassdraget ... · concentrations in Morsa catchment...
20
Map source: A. Engebretsen Modellering av næringsstoff-transport i Morsa vassdraget: Kobling av modellers usikkerhet ved bruk av Bayesianske nettverk Modelling of nutrient transport in the Morsa catchment: integrating model uncertainty using Bayesian networks Alexander Engebretsen(UiO), Koji Tominaga(UiO), David N. Barton(NINA), Tom Andersen(UiO), Jostein Starrfelt(NIVA), Øyvind Kaste(NIVA) og Rolf D. Vogt(UiO) MILJØ2015 Parallel session 8 - Thursday 7 February 2013 Management measures Nutrient run-off Lake water quality MyLake SWAT
-
Upload
nguyenhuong -
Category
Documents
-
view
215 -
download
0
Transcript of Modellering av næringsstoff-transport i Morsa vassdraget ... · concentrations in Morsa catchment...

Map source: A. Engebretsen
Modellering av næringsstoff-transport i Morsa vassdraget: Kobling av modellers usikkerhet ved bruk av Bayesianske nettverk
Modelling of nutrient transport in the Morsa catchment: integrating model uncertainty using Bayesian networks
Alexander Engebretsen(UiO), Koji Tominaga(UiO), David N. Barton(NINA), Tom Andersen(UiO), Jostein Starrfelt(NIVA), Øyvind Kaste(NIVA) og Rolf D. Vogt(UiO) MILJØ2015 Parallel session 8 - Thursday 7 February 2013
Management measures
Nutrient run-off
Lake water quality
MyLake
SWAT
Presentation overview
Management context Catchment runoff modeling using SWAT Water quality modeling using MyLake Transdisciplinary communication using Bayesian network model Conclusions
Overview
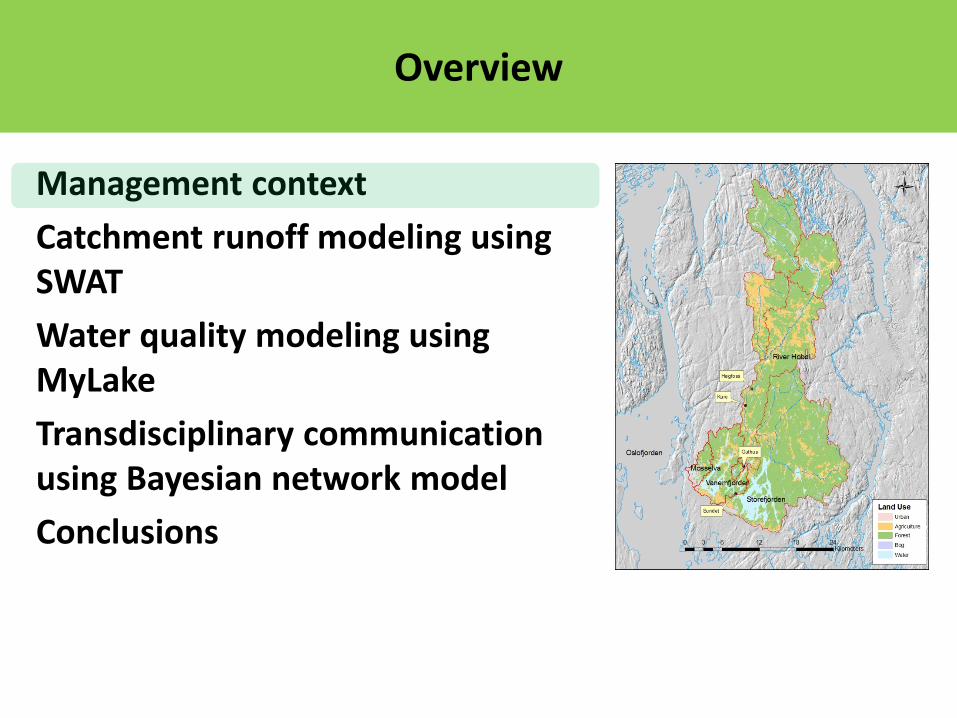
Management challenge • ca. 1 billion NOK spent on measures for reducing total PO4 concentrations in Morsa catchment
• need to comply with WFD «good ecological status» • need to identify effectiveness of measures by modeling also confounding background trends and fluxes
Skarbøvik et al., 2011
To
tal f
osfa
t µg/
L

Vestre Vansjø
60% forest 14% agriculture

Presentation overview
Management context Catchment runoff modeling using SWAT Water quality modeling using MyLake Transdisciplinary communication using Bayesian network model Conclusions
Overview

Soil and Water Assessment Tool (SWAT) (Neitsch, Arnold et al. 2009)
•Process based •Dynamic •Runs on a daily time scale
•Distributed in space •Simulates changes in loading of pollutants to water based on farmer management practices

Integrating different spatial variation in nutrient pressure>state>impact
Hydrological responce unit (HRU) (land cover & soil type & slope)
Map source: A. Engebretsen
Sub-basin 438 in Huggenes creek
MYLAKE water quality model
SWAT run-off model
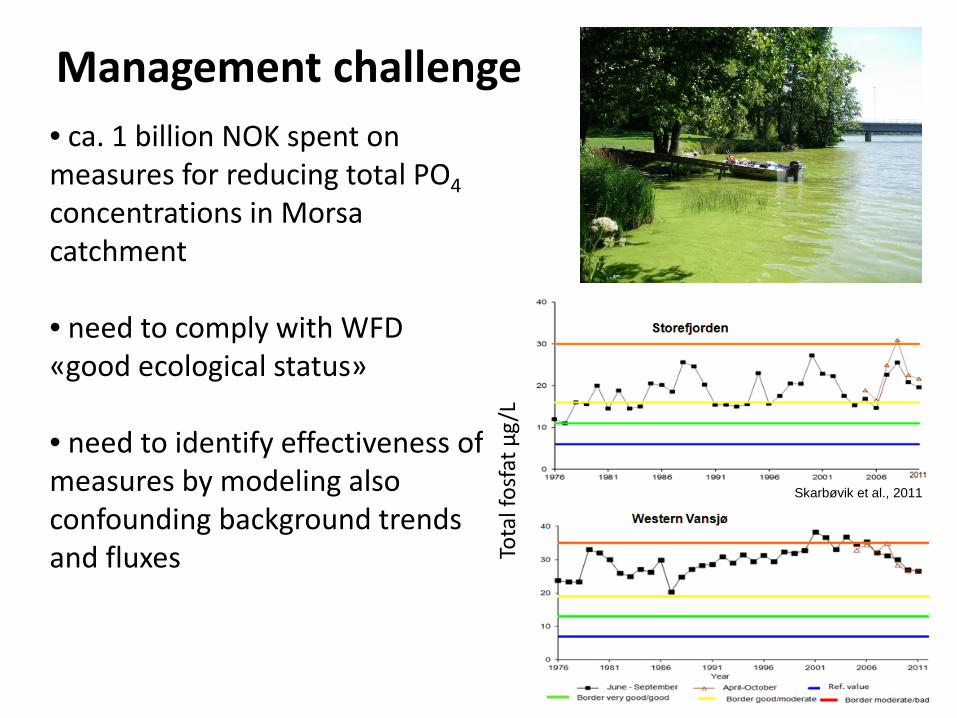
1. Calibrate discharge
2. Calibrate sediment loading
3. Calibrate Phosphorus loading
4. Run scenarios
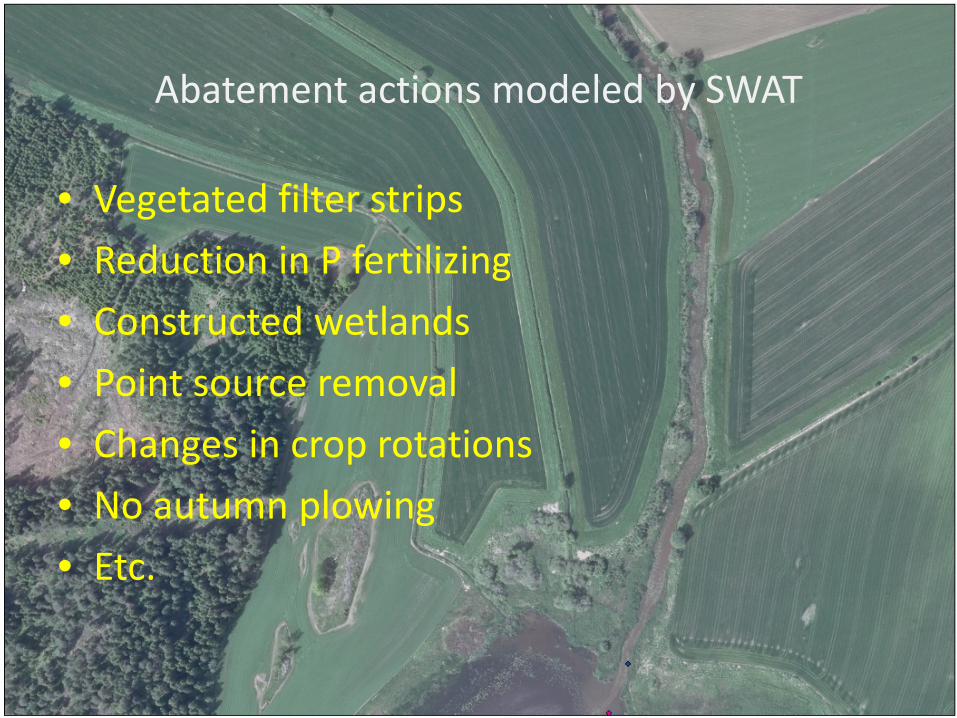
Abatement actions modeled by SWAT
• Vegetated filter strips • Reduction in P fertilizing • Constructed wetlands • Point source removal • Changes in crop rotations • No autumn plowing • Etc.

Presentation overview
Management context Catchment runoff modeling using SWAT Water quality modeling using MyLake Transdisciplinary communication using Bayesian network model Conclusions
Overview

• MyLake Model – handles freezing – 1-dimensional (by depth) – physically based with simple
biology (algae growth)
• Empirical Model for WFD indicators
Lake modelling domain
Runoff
Lake physics & chemistry
Lake algae status

Model calibration is about fitting to the field observation
After calibration make simulations Consider all possible tunings for both SWAT and MyLake
Proper model connections, better simulation

Tota
l P (µ
g/L)
Ch
l a (µ
g/L)
The ‘naïve’ scenario with model parameter uncertainty (shown summer concentrations)
VFS effectiveness with all par. uncertainties

Presentation overview
Management context Catchment runoff modeling using SWAT Water quality modeling using MyLake Transdisciplinary communication using Bayesian network model Conclusions
Overview

Graphical synthesis of SWAT-MyLake simulation for «buffer strip» effectiveness: conditional
probability distributions
Mean summer total P (µg L-1)

Example 1: using Bayesian belief networks for deductive scenario analysis of «buffer strip» effectiveness
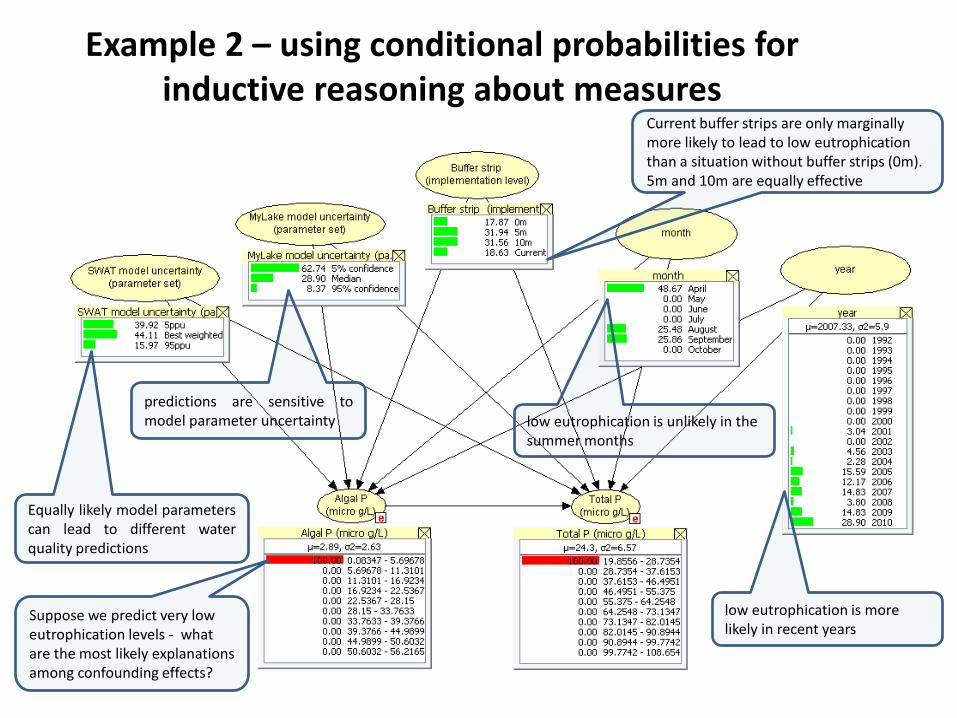
Example 2 – using conditional probabilities for inductive reasoning about measures
Current buffer strips are only marginally more likely to lead to low eutrophication than a situation without buffer strips (0m). 5m and 10m are equally effective
low eutrophication is unlikely in the summer months
low eutrophication is more likely in recent years
predictions are sensitive to model parameter uncertainty
Equally likely model parameters can lead to different water quality predictions
Suppose we predict very low eutrophication levels - what are the most likely explanations among confounding effects?

Presentation overview
Management context Catchment runoff modeling using SWAT Water quality modeling using MyLake Transdisciplinary communication using Bayesian network model Conclusions
Overview


SWAT MyLake TP, SS, Q
Best way to represent SWAT’s variation? - according to TP? - according to SS? Our strategy: find SWAT parameter sets that give MyLake extreme response: - total P loading total P in lake - SS loading total P in lake
Work in progress