June 2000 SALES TAXES - U.S. Government Accountability Office (U.S
72
SALES TAXES Electronic Commerce Growth Presents Challenges; Revenue Losses Are Uncertain United States General Accounting Office GAO Report to Congressional Requesters June 2000 GAO/GGD/OCE-00-165
Transcript of June 2000 SALES TAXES - U.S. Government Accountability Office (U.S

SALES TAXES
Electronic CommerceGrowth PresentsChallenges; RevenueLosses Are Uncertain
United States General Accounting Office
GAO Report to Congressional Requesters
June 2000
GAO/GGD/OCE-00-165

United States General Accounting Office General Government Division
Washington, D.C. 20548
Page 1 GAO/GGD/OCE-00-165 Sales Taxes on e-Commerce
B-284955
June 30, 2000
The Honorable George V. Voinovich, ChairmanSubcommittee on Oversight of Government Management, Restructuring, and the District of ColumbiaCommittee on Governmental AffairsUnited States Senate
The Honorable Bob GrahamUnited States Senate
The rapid growth of electronic commerce (e-commerce), especially thesale of goods and services over the Internet, has fueled a debate about thetaxation of such commerce. On the one hand, there are concerns about theimpact of e-commerce growth on state and local government sales taxcollections. These concerns arise because, while states can impose a taxon residents’ purchases from out-of-state vendors, they cannot impose anobligation on those vendors to collect the tax unless the vendor has asubstantial presence, or nexus, in the state.1 Without collection by sellers,and absent intrusive and costly collection actions aimed at purchasers,portions of sales and use taxes can be avoided.2
On the other hand, there are concerns that the taxation of Internet salescould slow innovation and growth in the economy. E-commerce and theInternet are viewed as part of a productivity-enhancing “informationtechnology revolution.” Taxation of e-commerce, it is feared, coulddiscourage such innovation.
Congress has recognized the need for more information about theimplications of taxing e-commerce. For example, in 1998, Congress passedthe Internet Tax Freedom Act,3 which, among other actions, establishedthe Advisory Commission on Electronic Commerce to study the taxtreatment of Internet transactions.4 The act also temporarily banned the 1Based on case law, out-of-state remote sellers generally meet the nexus standards if they have anoffice or place of business, agent, or significant property in the taxing state.
2A use tax, generally imposed on the purchaser when a sales tax has not been paid, is imposed on theprivilege of ownership, possession, or use of a taxable good or service.
3P.L. 105-277, Div. C, Title XI.
4The Commission reported in April 2000. The Background section of our report contains more detailsabout the Commission’s report.
B-284955
Page 2 GAO/GGD/OCE-00-165 Sales Taxes on e-Commerce
imposition of certain types of taxes on e-commerce, but not the collectionof existing taxes, such as sales and use taxes.
Given your interest in the taxation of e-commerce, and particularly theimpact of e-commerce growth on state and local government sales taxcollections, you asked us for information specific to sales and use taxcollections for Internet sales as well as for all remote sales. In response toyour request, this report addresses the following questions:
1. How do the taxes associated with the sale of goods and services overthe Internet differ from taxes associated with sales by other remotesellers and in-store sellers?
2. To what extent does each state rely on sales and use tax revenues tofund the services they provide?
3. How much revenue are state and local governments losing this year bynot being able to collect sales and use taxes on sales made by allremote sellers and, particularly, by Internet sellers?
4. How much revenue would state and local governments likely lose in2003 under various growth scenarios for all remote and Internet sales?
In light of the considerable uncertainty surrounding the volume of Internetand all remote sales and any resulting tax losses, we agreed with youroffice to model different possible scenarios.5 The scenarios are based ondifferent assumptions about the volume of Internet and remote sales, theproportion of sales that are taxable, the proportion in different taxingjurisdictions, the proportion of taxes actually collected, and other factorsthat affect tax revenue. We developed lower and higher scenarios todemonstrate an overall range of uncertainty and the potential effects onrevenue loss. We also performed a sensitivity analysis to show the revenueloss effects due to uncertainty about specific assumptions. Because of theuncertainty surrounding the assumptions, the scenarios are not estimatesbut, rather, are illustrations of the importance of the various assumptions.The data and specific assumptions that we used in developing ourscenarios are described further in the methodology section of this letterand in appendix I.
5Revenue loss is calculated as the amount of tax liability minus the amount already being paid.
B-284955
Page 3 GAO/GGD/OCE-00-165 Sales Taxes on e-Commerce
In-store, Internet, and other remote sales are generally taxed at the samerate by a state or local government. However, compliance rates differsignificantly depending on nexus. In-store and remote sellers (includingInternet sellers) with a substantial presence, or nexus, with the state arelegally required to collect and remit the tax. For sales without nexus,purchasers are themselves legally required to remit the tax, but purchasercompliance is generally much lower than seller compliance. The continuedgrowth of e-commerce is likely to magnify existing compliance problemsand, as new types of digital goods and transactions are developed, createnew ones, such as identifying the location of a sale. Such compliancechallenges have led some observers to question the long-term viability ofsales and use taxes.
States’ reliance on general sales taxes—whether measured as a percentageof tax revenues, own-source revenues, or total general revenues—variesconsiderably across states.6 For example, in Delaware, Montana, NewHampshire, and Oregon, neither state nor local governments collect suchtaxes. In contrast, state governments in Florida, Nevada, South Dakota,Tennessee, Texas, and Washington and local governments in Louisianaobtain over 50 percent of their tax revenues from general sales taxes. In1999, state and local governments collected $203 billion in general salestax revenues. On average, general sales taxes account for 33 percent ofstate and 11 percent of local tax revenues.
Little empirical data exist on the key factors needed to calculate theamount of sales and use tax revenues that state and local governmentslose on Internet and other remote sales. What information does exist isoften of unknown accuracy. Consequently, we constructed scenariosrepresenting different assumptions about the important determinants ofthe loss. Under all of our scenarios, the size of the tax loss from Internetsales for 2000 is less than 2 percent of aggregate general sales taxrevenues. Under all of our scenarios, the size of the loss from all remotesales is less than 5 percent of aggregate sales tax revenues.
The rapid change in the Internet economy makes projections of revenuelosses from Internet and total remote sales for future years even moreuncertain than they are for 2000. Under the scenarios we constructed for 6General revenues include all revenues except the non-tax revenues generated by government-ownedliquor stores or utilities and insurance trust fund revenues (contributions to and investment earnings ofpublic employee retirement and social insurance systems). In addition to tax revenues, own-sourcegeneral revenues include charges for specific general government services, such as tuition at stateuniversities, and miscellaneous general revenues, such as interest earnings and proceeds from the saleof property. Total general revenues equal own-source revenues plus transfers from other levels ofgovernment.
Results in Brief
B-284955
Page 4 GAO/GGD/OCE-00-165 Sales Taxes on e-Commerce
2003, the size of the tax loss from Internet sales ranged from less than 1percent to about 5 percent of projected sales tax revenues (see p. 21). Forall remote sales, the corresponding loss ranged from about 1 percent toabout 8 percent.
The results of our scenarios highlight the importance of developing betterdata about Internet tax losses and understanding the limits of such data.Some of our scenarios show tax losses that by 2003 could presentsignificant revenue challenges for state and local government officials,while other scenarios produce smaller revenue losses. Better data, fromefforts such as one by the Bureau of the Census, could reduce theuncertainty. However, even with better data, the rapid and fundamentalnature of innovations in e-commerce means that policymaking regardingthe tax treatment of Internet sales will be done in an environment ofsignificant uncertainty.
Sales and use taxes are imposed on specific sales transactions. Generally,states require that in-state sellers collect sales tax on the goods andservices they sell at the time of sale, based on the price or value of thegoods or services sold. States require that out-of-state remote sellerscollect a use tax on the sale of goods and services if the sellers have asubstantial presence, or nexus, with the state.7 The use tax, whichcomplements the sales tax, is imposed on the purchaser for the privilege ofuse, ownership, or possession of taxable goods or services. If the out-of-state remote seller does not collect the use tax, the purchaser is requiredto remit the tax.
Based on case law interpreting the constitutional requirements, out-of-state remote sellers generally meet the nexus standards if they have anoffice or place of business, agent, or property in the taxing state. Nexus isnot established if the seller’s property is insignificant. The Supreme Courthas ruled that contact with in-state purchasers by mail or common carrier,only, does not constitute nexus.8 Although a business can establish dualentity operations to minimize tax liabilities, the extent to which Internetand in-store operations may interact and retain their distinction has notbeen resolved.
7A “remote seller” can be located in the same state as the purchaser; we use the term “out-of-stateremote seller” when the remote seller is not located in the same state as the purchaser.
8See appendix II for discussion of National Bellas Hess Inc. v. Department of Revenue of Illinois, 386U.S. 753 (1967) (addresses Due Process and Commerce Clause nexus standards for mail-order sellers);Quill Corp. v. North Dakota, 504 U.S. 298 (1992) (draws distinction between Due Process Clause andCommerce Clause requirements);and other precedent-setting decisions.
Background
B-284955
Page 5 GAO/GGD/OCE-00-165 Sales Taxes on e-Commerce
Forty-five states and the District of Columbia have general sales taxprograms under which they administer the sales and use tax provisions.9
About 7,600 local jurisdictions have general sales tax programs authorizedby 34 states. Generally, state governments administer the state and localsales taxes.10
In 1999, the combined state and local general sales and use tax ratesranged from about 5 to 8 percent in most states. State general sales taxrates were about 4 or 5 percent in most states. Local general sales tax ratesvaried more and ranged from 0.5 percent to about 4 percent in somejurisdictions.
A number of prior studies have made nationwide estimates of the amountof sales and use tax revenues that state and local governments lose onInternet and other remote sales.11 The Advisory Commission onIntergovernmental Relations (ACIR) published a series of studies from1986 through 1994 estimating revenue losses from mail-order sales. ACIRestimated that in 1994, before the recent growth in Internet use, the stateand local revenue loss was about $3.3 billion.12 In more recent years, therehave been efforts to estimate the lost tax revenue from Internet sales. Astudy by Ernst & Young for the eCommerce Coalition13 concluded that thesales and use taxes not collected from the increase in remote sales due theInternet was less than $170 million in 1998. The authors of that study didnot estimate losses on business-to-business Internet sales, but theysuggested that these losses would be very small. Researchers, Goolsbeeand Zittrain,14 assumed zero revenue losses from business-to-businessInternet sales when they estimated that tax losses from Internet sales in1998 ranged from $210 million to $430 million and that losses would beabout $3.5 billion in 2003.
9Alaska, Delaware, Montana, New Hampshire, and Oregon do not have general sales tax programs.Delaware does, however, impose a gross receipts tax.
10Local jurisdictions in some states, such as Alabama, Colorado, and Alaska, administer local sales taxprograms.
11Appendix I identifies specific assumptions and data sources used in these past studies.
12U.S. Advisory Commission on Intergovernmental Relations, Taxation of Interstate Mail Order Sales:1994 Revenue Estimates (1994).
13Robert J. Cline and Thomas S. Neubig, The Sky Is Not Falling: Why State and Local Revenues WereNot Significantly Impacted by the Internet in 1998, Ernst & Young, Economics Consulting andQuantitative Analysis (June 18, 1999).
14Austan Goolsbee and Jonathan Zittrain, “Evaluating the Costs and Benefits of Taxing InternetCommerce,” National Tax Journal, 52(3), Sept. 1999, pp. 413-28.
B-284955
Page 6 GAO/GGD/OCE-00-165 Sales Taxes on e-Commerce
In contrast, a recent study by researchers, Bruce and Fox,15 producedmuch larger revenue loss estimates because the authors assumed thatmore than half of business-to-business Internet sales are taxable and thatcompliance on the part of purchasers is well below 100 percent. Bruce andFox estimated that the revenue loss from Internet sales will grow from$1.23 billion in 1999 to $10.8 billion in 2003. Finally, a study by ForresterResearch, Inc.,16 which focused only on business-to-consumer sales,estimated that sales tax revenue losses from those sales were $525 millionin 1999. The authors of most of these studies acknowledged that there is alimited empirical basis for many of the assumptions that need to be madewhen making such estimates.
The Internet Tax Freedom Act established the Advisory Commission onElectronic Commerce to study “Federal, State and local, and internationaltaxation and tariff treatment of transactions using the Internet and Internetaccess and other comparable intrastate, interstate or international salesactivities.”17 The majority of the Commission issued its report to Congressin April 2000. The Commission voted in favor of a policy proposal relatingto state and local government taxation of Internet sales that, among otherthings, would:
• extend the current moratorium on multiple and discriminatory taxation ofe-commerce;
• encourage state and local governments to make their sales and use taxesmore uniform;
• prohibit taxation of sales of digitized goods and their nondigitizedequivalents; and
• modify the definition of nexus in order to allow out-of-state vendors toconduct additional operations in a state, such as allowing for the return ofmerchandise or for repairs, without subjecting the vendor to therequirement of remitting sales taxes to the state.
Those voting for the proposal argued that the it would foster innovationand growth of the Internet and e-commerce while recognizing the role ofstate and local governments to continue providing needed services to theircitizens. Those who voted against or abstained were particularlyconcerned that it would result in large revenue losses for state and local 15Donald Bruce and William F. Fox, “E-Commerce in the Context of Declining State Sales Tax Bases,”mimeo, University of Tennessee Center for Business and Economic Research (Apr. 2000).
16James L. McQuivey, with Gillian DeMoulin, States Lose Half A Billion In Taxes To Web Retail, ATechnographics Brief, Forrester (Cambridge, MA, Feb. 24, 2000).
17P.L. 105-277, Div C, Title XI, Oct. 21, 1998.
B-284955
Page 7 GAO/GGD/OCE-00-165 Sales Taxes on e-Commerce
governments, impairing their ability to provide needed services to theircitizens. Since these proposals did not receive the two-thirds vote requiredby the Internet Tax Freedom Act, they were not given the status of formalfindings or recommendations of the Commission.
To determine how taxes associated with the sale of goods and services byInternet sellers, other remote sellers, and in-store sellers differ, wereviewed information relating to (1) the federal, state, and local taxes thatapply to sales goods and services and to the businesses that sell them and(2) the conditions under which sellers are required to collect state andlocal sales and use taxes. We reviewed published tax guides, conductedlegal research of precedent-setting court cases, and interviewed officialsfrom state tax agencies, the Department of the Treasury, and nationalorganizations representing sellers and state and local governments. Wealso attended numerous conferences addressing tax issues and theInternet, including the meetings of the Advisory Commission on ElectronicCommerce.
To determine the extent that state and local governments rely on sales anduse tax revenues, we analyzed data from the Census Bureau relating toU.S. totals for those revenues in calendar year 1999. We also analyzedCensus data on state government revenues for fiscal year 1998 and localgovernment revenues for fiscal year 1996, the latest years for which state-by-state data were available.
To model different scenarios for the state and local government sales anduse tax revenue losses, we obtained estimates of the total amount of salesthat will be transacted remotely in 2000 and subjected them to a series ofcomputations that reflect (1) details of state sales tax systems and (2)assumptions relating to the various factors that determine the size of therevenue losses. In addition to the revenue loss associated with all remotesales, we modeled different scenarios for the loss that was attributable toInternet sales alone. Figure 1 summarizes the steps in our revenue losscomputations.
To approximate the amount of remote sales that will be taxable, weapportioned the sales data among individual states and then subtractedstate-specific exemptions for particular types of products, services,purchasers, and uses. We then multiplied the taxable sales in each state bythe appropriate tax rate to obtain an approximation of the sales or use taxowed to each state. To compute the amount of revenue that each stategovernment is unable to collect, we made assumptions regarding theamount of the tax owed on remote sales that would be paid to each state
Scope andMethodology

B-284955
Page 8 GAO/GGD/OCE-00-165 Sales Taxes on e-Commerce
by either sellers or purchasers. We then subtracted that amount from theamount owed to the state to obtain the state-level revenue loss.
Source: GAO methodology.
We report high and low estimates for all remote and Internet only sales forthe years 2000 and 2003. To calculate the potential sales and use tax lossesfor the higher scenario, we use the endpoint of the range for each of ourassumptions that leads to a higher revenue loss. For example, we use thehigh estimate of sales, a low estimate of nexus for sellers, a low rate ofpurchaser compliance, and a low rate of product and purchaserexemptions. We use the other endpoints of our estimated ranges tocalculate the sales tax losses for our low tax loss scenario. Combiningassumptions in this way increases the likelihood that the actual tax lossesfall between the high tax and low tax scenario results.
We obtained the local government revenue loss in each state bymultiplying the state government loss by the ratio of local sales taxcollections to state sales tax collections in each state.18 We also modeledthe amounts of revenue that state and local governments would potentiallylose on Internet and other remote sales in 2003 under alternative scenariosfor the growth of those sales.
There were few reliable data sources on which to base the calculationsand adjustments summarized above. The growth of on-line sales has been 18In the case of Alaska, where local governments collect general sales taxes but the state governmentdoes not, we assumed that the state’s share of the nationwide local government revenue loss wasproportionate to its share of nationwide local government sales tax collections.
Figure 1: Steps Involved in ComputingRevenue Losses
B-284955
Page 9 GAO/GGD/OCE-00-165 Sales Taxes on e-Commerce
so rapid that the economic data available from federal and stategovernments have not been modified to provide this kind of information,and those that are collected are not well suited for this purpose. Most ofthe sales estimates that are available are from private-sector sources, andsome of these providers view their data sources and details as proprietary.Finally, projections of sales are particularly difficult to make given therapidly changing environment and the importance of decisions yet to bemade by consumers, businesses, and policymakers that will determine theultimate level of those sales. We were not able to assess the accuracy ofany of the available estimates and projections of sales.
In addition to the uncertainty regarding the magnitude of remote sales,there is considerable uncertainty about the amount of tax that state andlocal governments are already collecting from these remote sales and theextent to which Internet sales replace other forms of remote sales. Littleempirical data exist to reduce these uncertainties. To ensure that we didnot overlook any important data, we reviewed the existing literature andspoke with numerous experts in academia, the private sector, and ingovernment, including officials from 17 states.19 In certain cases, wecollected our own data on important parameters where we believed wehad an opportunity to improve upon the information that prior analystshad used. For example, we gathered information from 150 large remoteretailers regarding the specific states for which they were alreadycollecting sales taxes. We also used Department of Commerce data as abasis for our assumptions relating to the proportions of business-to-business remote sales that are sold to various types of tax-exemptpurchasers. We also performed a sensitivity analysis to show the revenueloss effects due to uncertainty about specific assumptions.
We also subjected our work to peer review by noted experts in the field oftax policy. These experts agreed with the general approach that wefollowed in making our estimates, but they provided different estimatesabout specific factors that determine the size of the revenue loss, such asthe extent to which purchasers are currently complying with their use taxobligations. The experts confirmed that uncertainty surrounds many ofthese factors incorporated into the model. Our approach reflects theirsuggestions and comments, particularly the use of ranges of estimates forkey determinants of the revenue loss.
19We selected the states to contact on the basis of referrals from national organizations, including theMultistate Tax Commission and the Federation of Tax Administrators, which indicated that thesestates were conducting studies on the issue of remote sales or had cutting-edge compliance programs.
B-284955
Page 10 GAO/GGD/OCE-00-165 Sales Taxes on e-Commerce
The definition of revenue loss that we use in our scenarios is the amountof sales or use tax owed on remote sales, minus any amount already beingpaid by sellers or purchasers. There are two reasons why this amount islikely to be higher than the amount that state and local governments wouldreceive if all remote retailers were required to collect and remit taxes ontheir sales. First, even if all remote sellers were required to collect thetaxes due on their sales, compliance is not likely to be 100 percent.Second, the total volume of taxable sales may decline in response to ahigher rate of tax collection on these sales. In computing the revenue lossattributable solely to the advent of Internet sales, we excluded lossesassociated with the portion of Internet sales that would have beentransacted by other remote means, such as mail order, in the absence ofthe Internet.
Detailed information about our methodology, including the data sourcesthat we used, are provided in appendix I. We conducted our work fromJune 1999 to May 2000 in accordance with generally accepted governmentauditing standards.
For a particular good or service and taxing jurisdiction, remote sales,Internet sales, and in-store sales are generally subject to the same rate ofsales or use tax. However, tax compliance differs by type of sale, withnexus being an important influence. For example, remote sellers withnexus are required to collect the tax but sellers without nexus are not. E-commerce presents compliance challenges for sales and use taxadministration beyond those created by other remote sales.
After reviewing published information and talking to state tax officials,officials from several national organizations representing stategovernments, and private-sector representatives, we were unable toidentify significant differences in the tax rates on in-store sales, Internetsales, and other remote sales. Although states vary in which goods andservices they tax and in their tax rates for a given good or service in aparticular location, the rate does not depend on whether the sale is in-store, Internet, or other remote.20
20We asked officials from state revenue departments and national associations, such as the MultistateTax Commission, National Governors’ Association, and National Retail Federation, to identify specificexamples of different tax requirements for in-store and out-of-state remote sales. None identified anysignificant different sales, excise, or income tax requirements, but several referred to Connecticut’s taxon the on-line sale of a newspaper that purchasers could buy untaxed at the newsstand. A Connecticutofficial advised that the state taxes paid-for digital services that include newspapers sold on-line.Connecticut expects to phase out its on-line newspaper tax by 2002.
Tax Liabilities forInternet and OtherSales Are Generally theSame, but ComplianceCan Differ
Tax Liabilities for Internet,Other Remote, and In-storeSales Are Generally theSame
B-284955
Page 11 GAO/GGD/OCE-00-165 Sales Taxes on e-Commerce
The type of goods and services included in the sales and use tax base varyby taxing jurisdiction. In states with sales and use taxes, retail goods aretaxed unless exempted. The list of exempt goods varies by state. Forexample, most but not all states exempt groceries. Unlike goods, servicesare generally untaxed, although there are exceptions. Tables III.1 and III.2in appendix III provide more detailed information about the tax treatmentof goods and services by state.
Sales and use tax rates also vary by taxing jurisdiction. Five states do notimpose a state-level general sales or use tax. The 1999 combined state,county, and city tax rates for selected jurisdictions ranged from 4 to 9percent. Table III.3 in appendix III provides more details on 1999 generalsales tax rates for each state and selected local jurisdictions.
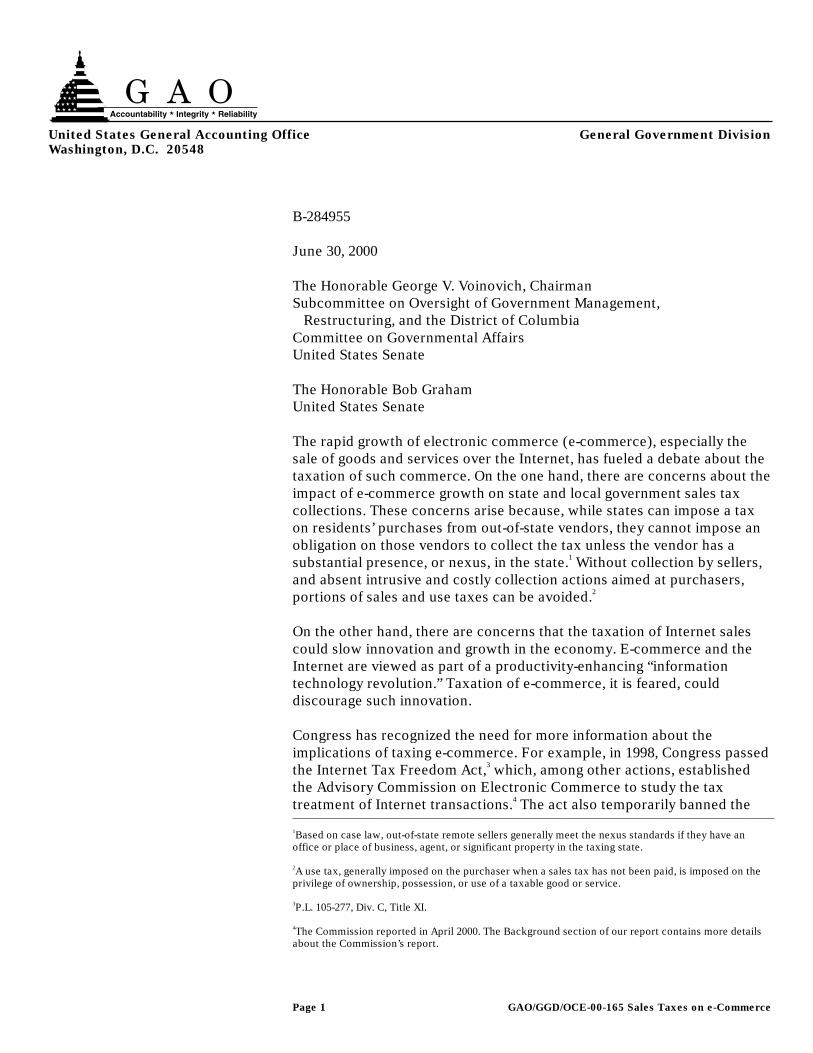
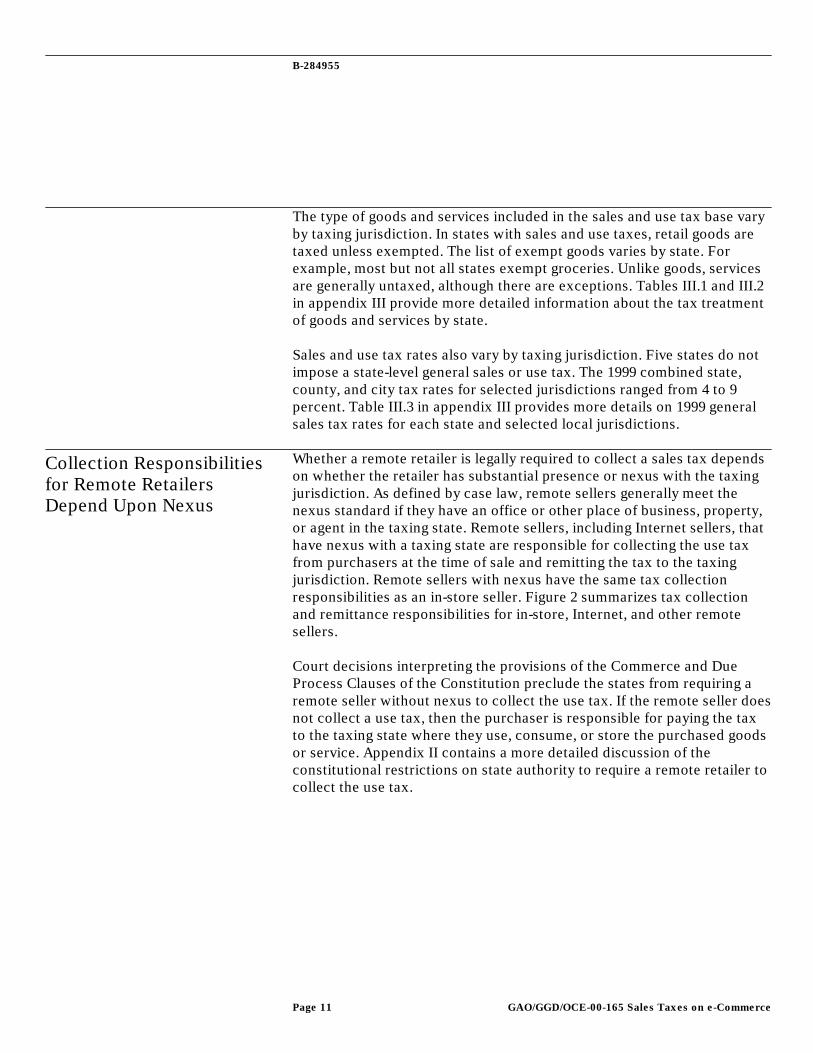
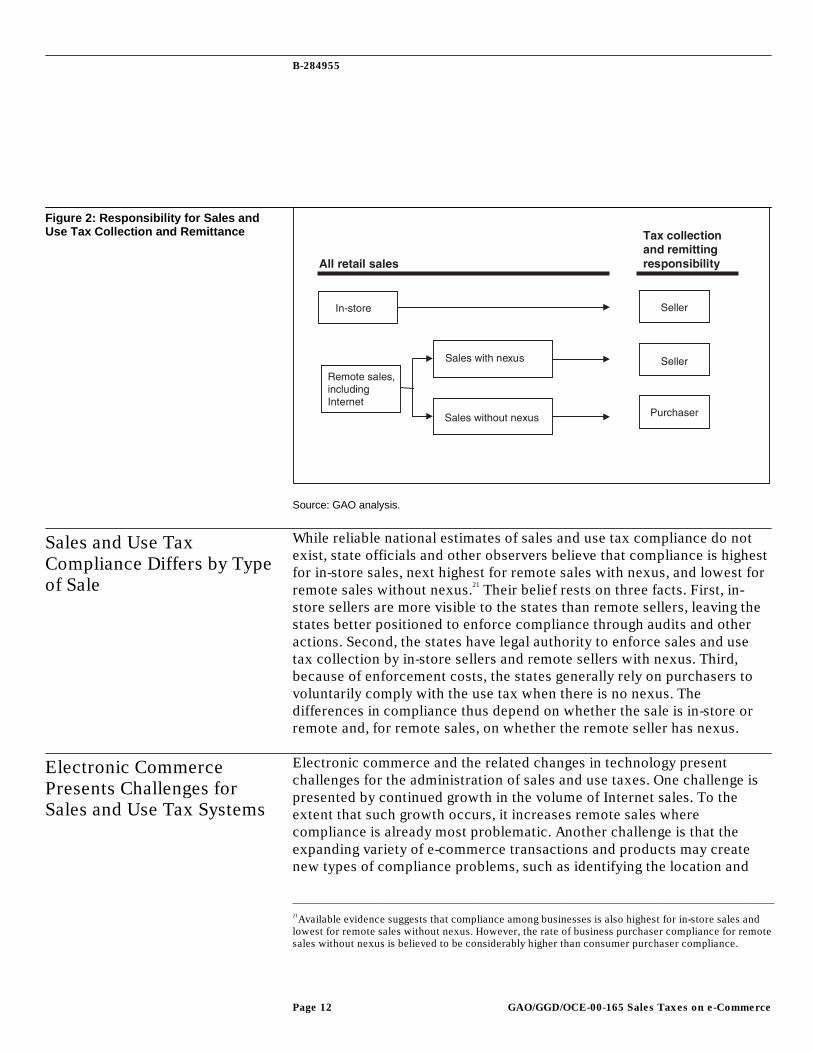
Whether a remote retailer is legally required to collect a sales tax dependson whether the retailer has substantial presence or nexus with the taxingjurisdiction. As defined by case law, remote sellers generally meet thenexus standard if they have an office or other place of business, property,or agent in the taxing state. Remote sellers, including Internet sellers, thathave nexus with a taxing state are responsible for collecting the use taxfrom purchasers at the time of sale and remitting the tax to the taxingjurisdiction. Remote sellers with nexus have the same tax collectionresponsibilities as an in-store seller. Figure 2 summarizes tax collectionand remittance responsibilities for in-store, Internet, and other remotesellers.
Court decisions interpreting the provisions of the Commerce and DueProcess Clauses of the Constitution preclude the states from requiring aremote seller without nexus to collect the use tax. If the remote seller doesnot collect a use tax, then the purchaser is responsible for paying the taxto the taxing state where they use, consume, or store the purchased goodsor service. Appendix II contains a more detailed discussion of theconstitutional restrictions on state authority to require a remote retailer tocollect the use tax.
Collection Responsibilitiesfor Remote RetailersDepend Upon Nexus
B-284955
Page 12 GAO/GGD/OCE-00-165 Sales Taxes on e-Commerce
Source: GAO analysis.
While reliable national estimates of sales and use tax compliance do notexist, state officials and other observers believe that compliance is highestfor in-store sales, next highest for remote sales with nexus, and lowest forremote sales without nexus.21 Their belief rests on three facts. First, in-store sellers are more visible to the states than remote sellers, leaving thestates better positioned to enforce compliance through audits and otheractions. Second, the states have legal authority to enforce sales and usetax collection by in-store sellers and remote sellers with nexus. Third,because of enforcement costs, the states generally rely on purchasers tovoluntarily comply with the use tax when there is no nexus. Thedifferences in compliance thus depend on whether the sale is in-store orremote and, for remote sales, on whether the remote seller has nexus.
Electronic commerce and the related changes in technology presentchallenges for the administration of sales and use taxes. One challenge ispresented by continued growth in the volume of Internet sales. To theextent that such growth occurs, it increases remote sales wherecompliance is already most problematic. Another challenge is that theexpanding variety of e-commerce transactions and products may createnew types of compliance problems, such as identifying the location and
21Available evidence suggests that compliance among businesses is also highest for in-store sales andlowest for remote sales without nexus. However, the rate of business purchaser compliance for remotesales without nexus is believed to be considerably higher than consumer purchaser compliance.
Figure 2: Responsibility for Sales andUse Tax Collection and Remittance
Sales and Use TaxCompliance Differs by Typeof Sale
Electronic CommercePresents Challenges forSales and Use Tax Systems
B-284955
Page 13 GAO/GGD/OCE-00-165 Sales Taxes on e-Commerce
nature of a sale. Such challenges have led some observers to question thelong-term viability of the sales and use tax system.
Although the future growth rate of Internet sales is not known, certaincharacteristics favor the rapid growth of Internet sales. For example,Commerce has reported that e-commerce not only reduces the cost andtime of doing business but also provides alternative shopping sites,expands existing markets, and creates new markets. E-commerce alsofrees some sellers from the “geographic confines and the costs of runningactual stores.” These characteristics have the potential to increase thenumber of remote sellers and purchasers as well as increase the volume ofremote sales. To the extent that such sales growth occurs, it will magnifythe existing sales and use tax compliance problems associated withremote sales, such as the difficulty of enforcing compliance by purchasersin the case of remote sales without nexus.
The expanding variety of electronic transactions may also create newcompliance challenges. Shifts from traditional forms of sales to Internetsales can make it more difficult to identify the location of the buyer andthe seller, the status (business, individual, other) of the buyer or seller, andthe nature of the product itself. In terms of the location, both sellers andpurchasers may have multiple locations, and the Internet makes it easierfor these firms to conduct their transactions from the location that offersthe greatest tax advantages. Businesses may also choose to establish apresence in certain jurisdictions in order to maximize these advantages. Asa result, determining the location of buyers and the sellers’ activities fornexus purposes, which is important for the collection of sales and usetaxes, is more difficult in an environment with Internet sales.
A related challenge for the collection of sales and use taxes is determiningthe status of the buyer and seller in Internet transactions. The status of theseller, for example, is relevant since certain sales by individuals are notsubject to sales and use taxes. However, the development of new markets,such as Internet auctions, has created a new opportunity for businesses aswell as individuals to avoid sales and use taxes. To the extent thatbusinesses are using these new markets to make sales, it would benecessary for tax authorities to be able to identify those sellers asbusinesses rather than as individuals in order to assess the appropriatetaxes.
The increasing variety of digital products also creates challenges for salesand use taxes. Currently, purchasers can buy many digital products, suchas books, music, software, and videos, that were only available as tangible
B-284955
Page 14 GAO/GGD/OCE-00-165 Sales Taxes on e-Commerce
products a few years ago. The sale of digital products often makes it moredifficult for states to determine if there was a sale, the point of sale, andthe cost or value of the products sold. Further complicating state taxrequirements and compliance efforts is the taxability of digital productsand services, which can be questionable. Case law defining the conditionsthat must exist before a state can require a remote seller to collect a usetax refers to the taxed goods as “tangible personal property.” States maynot be able to require the remote sellers to collect the use tax on the saleof intangible digital products unless they categorize these products asintangible services.
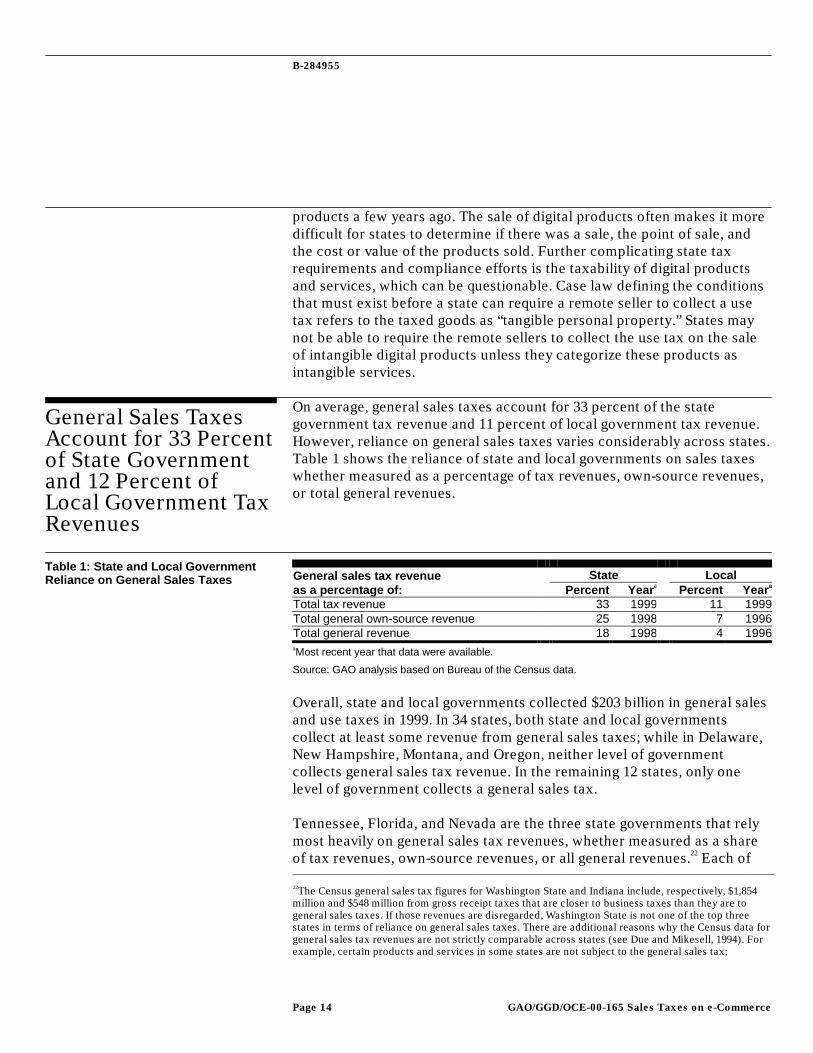
On average, general sales taxes account for 33 percent of the stategovernment tax revenue and 11 percent of local government tax revenue.However, reliance on general sales taxes varies considerably across states.Table 1 shows the reliance of state and local governments on sales taxeswhether measured as a percentage of tax revenues, own-source revenues,or total general revenues.
State LocalGeneral sales tax revenueas a percentage of: Percent Yeara Percent Yeara
Total tax revenue 33 1999 11 1999Total general own-source revenue 25 1998 7 1996Total general revenue 18 1998 4 1996aMost recent year that data were available.
Source: GAO analysis based on Bureau of the Census data.
Overall, state and local governments collected $203 billion in general salesand use taxes in 1999. In 34 states, both state and local governmentscollect at least some revenue from general sales taxes; while in Delaware,New Hampshire, Montana, and Oregon, neither level of governmentcollects general sales tax revenue. In the remaining 12 states, only onelevel of government collects a general sales tax.
Tennessee, Florida, and Nevada are the three state governments that relymost heavily on general sales tax revenues, whether measured as a shareof tax revenues, own-source revenues, or all general revenues.22 Each of 22The Census general sales tax figures for Washington State and Indiana include, respectively, $1,854million and $548 million from gross receipt taxes that are closer to business taxes than they are togeneral sales taxes. If those revenues are disregarded, Washington State is not one of the top threestates in terms of reliance on general sales taxes. There are additional reasons why the Census data forgeneral sales tax revenues are not strictly comparable across states (see Due and Mikesell, 1994). Forexample, certain products and services in some states are not subject to the general sales tax;
General Sales TaxesAccount for 33 Percentof State Governmentand 12 Percent ofLocal Government TaxRevenues
Table 1: State and Local GovernmentReliance on General Sales Taxes

B-284955
Page 15 GAO/GGD/OCE-00-165 Sales Taxes on e-Commerce
these states obtains at least 53 percent of their tax revenues, 44 percent oftheir own-source general revenues, and 28 percent of all their generalgovernment revenues from general sales taxes. Local governments inLouisiana, Oklahoma, and Alabama rely on general sales taxes for greatershares of their tax revenues (at least 40 percent each) and own-sourcerevenues (at least 19 percent each) than do local governments in otherstates. Local governments in Louisiana, Oklahoma and Colorado rely ongeneral sales taxes for the greatest shares of total general revenues (atleast 12 percent each). (See app. IV for state and local revenueinformation.)
The amount of sales and use tax revenues that state and local governmentsmay lose by not being able to collect those taxes on Internet and otherremote sales is difficult to model because considerable uncertaintysurrounds the factors that determine the loss. However, under ourscenarios representing different assumptions about the importantdeterminants of the loss, the size of the loss from Internet sales for 2000 isless than 2 percent of aggregate sales and use tax revenues. The size of theloss from all remote sales is less than 5 percent of aggregate sales and usetax revenues.
Important factors that determine the tax loss on Internet and remote salesare the volume of Internet and other remote sales, the portion of the salessubject to tax, the extent of compliance by sellers or purchasers, and theextent to which Internet sales displace other types of remote sales.However, as discussed below, little data exist on these factors and theaccuracy of the information that exists is often unknown.
No statistical agency compiles data on the total value or composition ofInternet or other remote sales. Although the Census Bureau has collecteddata on mail-order sales, their figures do not include the mail-order sales ofany firms whose primary business is not mail order. As a result, theirfigures significantly understate total mail-order sales. The Bureau hasplans to produce comprehensive data on Internet sales based on its annualsurveys of firms in the manufacturing, wholesale, retail, and other sectors,but much of these data will not be available until 2001. A number ofprivate-sector consulting firms make estimates and projections of Internetand other remote sales. It is difficult to assess the accuracy of any of theirestimates. Given the uncertainty surrounding available projections of totalremote and Internet sales for 2000 and 2003, we use a broad range of
however, they are subject to equivalent special sales taxes. Those special taxes are not included in theCensus general sales tax figures, but they are covered in our revenue loss computations.
State and LocalRevenue Losses FromInternet and OtherRemote Sales AreSmall Under MostScenarios for 2000
Considerable UncertaintySurrounds the Determinantsof State and Local RevenueLosses
The Volume of Remote Sales
B-284955
Page 16 GAO/GGD/OCE-00-165 Sales Taxes on e-Commerce
projections in the scenarios that we present below. Appendix 1 describesthe projections that we use.
The rate at which a remote sale is taxed can vary depending on the state ofresidence of the purchaser, the nature of the product or service being sold,the nature of the purchaser, and the use that the purchaser makes of theproduct or service. For example, a computer purchased by a state agencyor by a business that uses it in a manufacturing process may not be taxedin a particular state, even though a computer purchased by a law firm inthat same state would be taxed.23 We were able to obtain some estimates ofInternet and total remote sales that were disaggregated by broadcategories of purchasers (businesses versus individuals) and by broadcategories of products and services, but we could not determine theaccuracy of these estimated disaggregations. We were unable to identifyany estimates of sales by taxable versus tax-exempt purchaser or bytaxable versus tax-exempt use.
When remote sellers have nexus in states in which they make sales, theyare required to collect any sales taxes that apply to those sales. In addition,some remote sellers collect taxes voluntarily, even when they do not havenexus. The proportion of tax already being collected by sellers (which wecall the “seller collection rate”) varies by type of product. For example, avery high proportion of the taxes due on cable television services andutilities are likely to be collected because a large proportion of thoseservices are provided by businesses with in-state physical infrastructure.In contrast, a relatively low proportion of the taxes due on remote sales ofcomputers are likely to be collected from sellers because a largeproportion of these sales are made by sellers who have nexus in only a fewstates.
As a result of this variation across products and services, the overall sellercollection rate will change over time as the composition of remote saleschanges. The collection rate within particular product categories will alsochange as the market shares, physical locations, and organizational formof particular businesses change. Such change is particularly rapid in theInternet economy. Policy changes that affect the determination of nexuscould also have substantial impacts on seller collection rates.
23The success that a state has in collecting the tax due on a sale also can vary by type of purchaser.Business purchasers are more likely than individual purchasers to comply with their use taxobligations because they face a much higher probability of being audited by state tax agencies.
The Taxability of Remote Sales
The Extent to Which RemoteSellers Already Collect Tax
B-284955
Page 17 GAO/GGD/OCE-00-165 Sales Taxes on e-Commerce
We found two studies containing empirical estimates of the sellercollection rate, but they were either dated or limited in scope. Otheranalysts who have estimated the revenue losses associated with Internetand other remote sales have used a variety of assumptions regarding theproportion of tax already being paid. We based our own assumptions oninformation we obtained from businesses that account for largeproportions of Internet and other remote sales as well as on discussionswith state tax officials (see app. I).
No comprehensive data are available relating to the rate of use taxcompliance on the part of purchasers. Only 2 of the 17 states we contactedprovided empirically based estimates of use tax compliance on the part ofbusiness purchasers, and those estimates date from the early 1990s—before the widespread use of the Internet. The two states, Washington andWisconsin, used the results of state use tax audits to estimate thatapproximately 80 percent of the use tax owed by business purchasers intheir states was paid voluntarily. An official from the Michigan Departmentof Treasury believed that nearly all businesses in the state comply with theuse tax because it is covered in single business tax audits. That officialnoted that compliance rates are likely to vary from state to state,depending on enforcement efforts. An official from Connecticut’sDepartment of Revenue Services believed that businesses pay about 65percent of their use tax liabilities, while an official from Ohio’s Departmentof Taxation believed that businesses’ rate of compliance is 75 percent.Other states were unable to provide estimates but some experts believethe rate could be as low as 50 percent for non-motor-vehicle purchases.24
Our scenarios reflect the broad range of opinions that state officials andother analysts have regarding this compliance rate.
In contrast to the wide range of opinion on the compliance of businesspurchasers was a wide consensus among the state officials and otherexperts who provided estimates that use tax compliance by individualpurchasers was extremely low—on the order of 0 to 5 percent. However,there was also a wide consensus that compliance with the use tax onmotor vehicles is close to 100 percent because the taxes must be paidbefore those vehicles can be registered.
A portion of total Internet sales displaces sales that would have beentransacted in stores; another portion displaces sales that would have beentransacted through other remote channels, such as mail orders; and a finalportion represents sales that would not have occurred in the absence of 24Some authors noted that use tax compliance was low even before the advent of e-commerce.
The Extent to Which PurchasersAlready Pay Tax
The Extent to Which InternetSales Displace Other Types ofSales
B-284955
Page 18 GAO/GGD/OCE-00-165 Sales Taxes on e-Commerce
the Internet. In the results that we present below, we exclude the revenuelosses on Internet sales that displace other remote sales. We found noempirical evidence indicating what proportion of Internet sales replaceother forms of remote sales. Few researchers or other experts that wecontacted offered estimates of this proportion, and none of those wereempirically based. Given this high degree of uncertainty, we use a broadrange of assumptions in our scenarios.
The distinction between Internet and other remote sales has become lessmeaningful as more businesses offer both Internet and other remotetransaction options. Some purchasers may order and pay for products bymail after obtaining the necessary information over the Internet; otherpurchasers may place orders over the Internet after obtaining informationfrom a mail-order catalogue. The tax treatment of the product purchaseddoes not differ between orders placed by mail and orders placed over theInternet.
We developed two basic scenarios to illustrate the uncertainty surroundingthe revenue loss on Internet and other remote sales in 2000. Each scenarioconsists of a set of assumptions about the factors that determine the sizeof that loss. We identified a range of plausible assumptions for each factor,based on available data, estimates, and expert opinion. In our lowerscenario, the assumptions that we selected for each factor were those thattended to reduce the revenue loss. In our higher scenario, we usedassumptions that tended to increase the revenue loss.25 However, althoughthe results from our higher scenario are based on a combination ofassumptions that tend to increase the revenue loss, we cannot be certainthat those results represent an upper bound to the revenue loss. We alsoexamined how the results of each scenario changed when individualassumptions were altered. Table 2 presents the results of the twoscenarios.26
The assumptions used in the lower scenario result in a revenue loss on allremote sales of $1.6 billion. The loss attributable to Internet sales that didnot simply replace other remote sales is $0.3 billion. In contrast, theassumptions used in the higher scenario yield a revenue loss of $9.1 billionon all remote sales—less than 5 percent of state and local general sales taxrevenues.27 The loss attributable to Internet sales is $3.8 billion—less than 25The assumptions that we used for each scenario are provided in appendix I.
26Appendix V provides results for each state.
27These percentages were computed using the assumption that the annual rate of growth in collectionsfrom 1999 to 2003 would be the same as the annual rate of growth from 1990 through 1999.
Under Our Scenarios, theCurrent Loss on All RemoteSales Is Less Than 5 Percentof Sales Tax Revenue andthe Loss on Internet Sales IsLess Than 2 Percent
B-284955
Page 19 GAO/GGD/OCE-00-165 Sales Taxes on e-Commerce
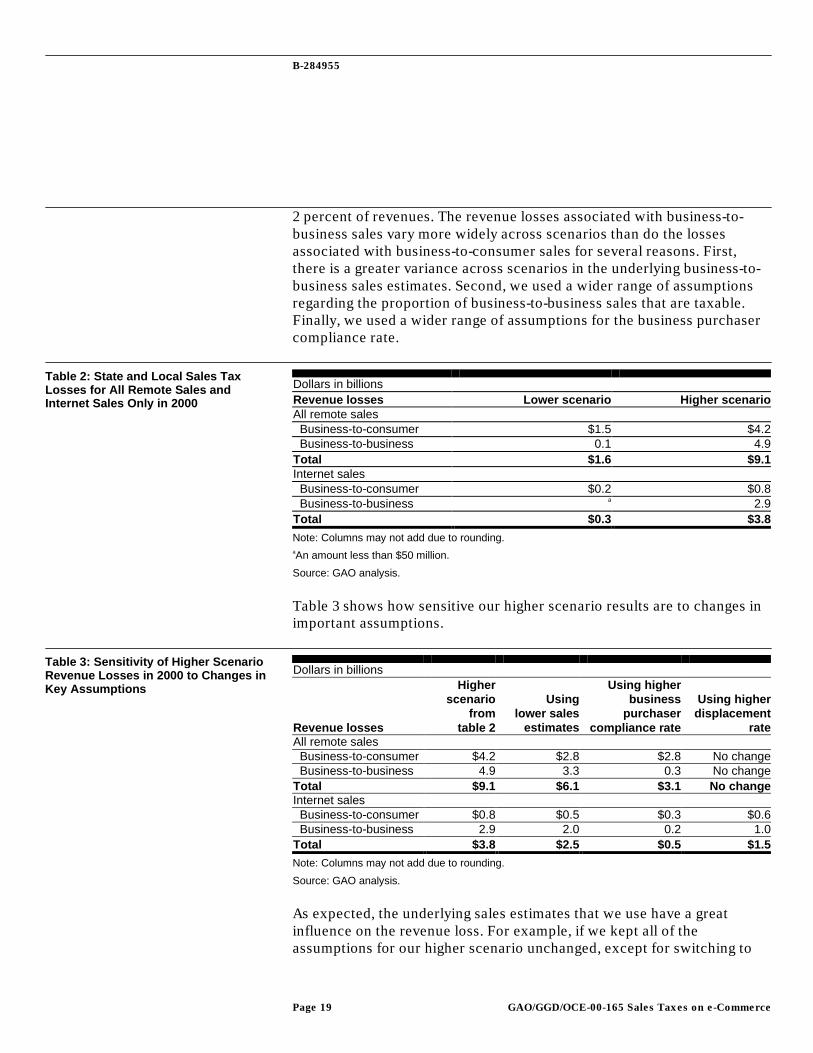
2 percent of revenues. The revenue losses associated with business-to-business sales vary more widely across scenarios than do the lossesassociated with business-to-consumer sales for several reasons. First,there is a greater variance across scenarios in the underlying business-to-business sales estimates. Second, we used a wider range of assumptionsregarding the proportion of business-to-business sales that are taxable.Finally, we used a wider range of assumptions for the business purchasercompliance rate.
Dollars in billionsRevenue losses Lower scenario Higher scenarioAll remote sales Business-to-consumer $1.5 $4.2 Business-to-business 0.1 4.9Total $1.6 $9.1Internet sales Business-to-consumer $0.2 $0.8 Business-to-business a 2.9Total $0.3 $3.8
Note: Columns may not add due to rounding.aAn amount less than $50 million.
Source: GAO analysis.
Table 3 shows how sensitive our higher scenario results are to changes inimportant assumptions.
Dollars in billions
Revenue losses
Higherscenario
from table 2
Using lower sales
estimates
Using higherbusiness
purchasercompliance rate
Using higherdisplacement
rateAll remote sales Business-to-consumer $4.2 $2.8 $2.8 No change Business-to-business 4.9 3.3 0.3 No changeTotal $9.1 $6.1 $3.1 No changeInternet sales Business-to-consumer $0.8 $0.5 $0.3 $0.6 Business-to-business 2.9 2.0 0.2 1.0Total $3.8 $2.5 $0.5 $1.5
Note: Columns may not add due to rounding.
Source: GAO analysis.
As expected, the underlying sales estimates that we use have a greatinfluence on the revenue loss. For example, if we kept all of theassumptions for our higher scenario unchanged, except for switching to
Table 2: State and Local Sales TaxLosses for All Remote Sales andInternet Sales Only in 2000
Table 3: Sensitivity of Higher ScenarioRevenue Losses in 2000 to Changes inKey Assumptions
B-284955
Page 20 GAO/GGD/OCE-00-165 Sales Taxes on e-Commerce
the lower sales estimates, the revenue loss on all remote sales for 2000would fall from $9.1 billion to $6.1 billion. However, even for a given salesfigure, we obtained a considerable range of revenue estimates by varyingassumptions for other factors. For example, if we changed the assumedrate of business purchaser compliance in the higher scenario from 50percent to 95 percent and left everything else the same, the revenue losson all remote sales would fall to $3.1 billion.
The assumptions that we made about the proportion of Internet sales thatdisplace other remote sales do not affect the revenue loss on all remotesales; however, they do have a significant effect on the loss attributed toInternet sales. For example, if we kept all of the assumptions for ourhigher scenario unchanged, except for changing the displacementproportion from 25 percent to 50 percent for sales to consumers and from40 percent to 80 percent for sales to businesses, the revenue loss onInternet sales would fall from $3.8 billion to $1.5 billion. Appendix Ipresents variations of our two basic scenarios that show the sensitivity ofour results to other changes in assumptions.
Each state’s share of the revenue loss is primarily a function of its share oftotal sales, the scope of its sales tax exemptions, its rate of tax, and theextent to which remote sellers have a substantial connection with it. State-by-state revenue losses under our two scenarios are presented in appendixV. These state-by-state results are more sensitive than our national resultsare to some of our assumptions (e.g., how aggregate sales are distributedacross states).
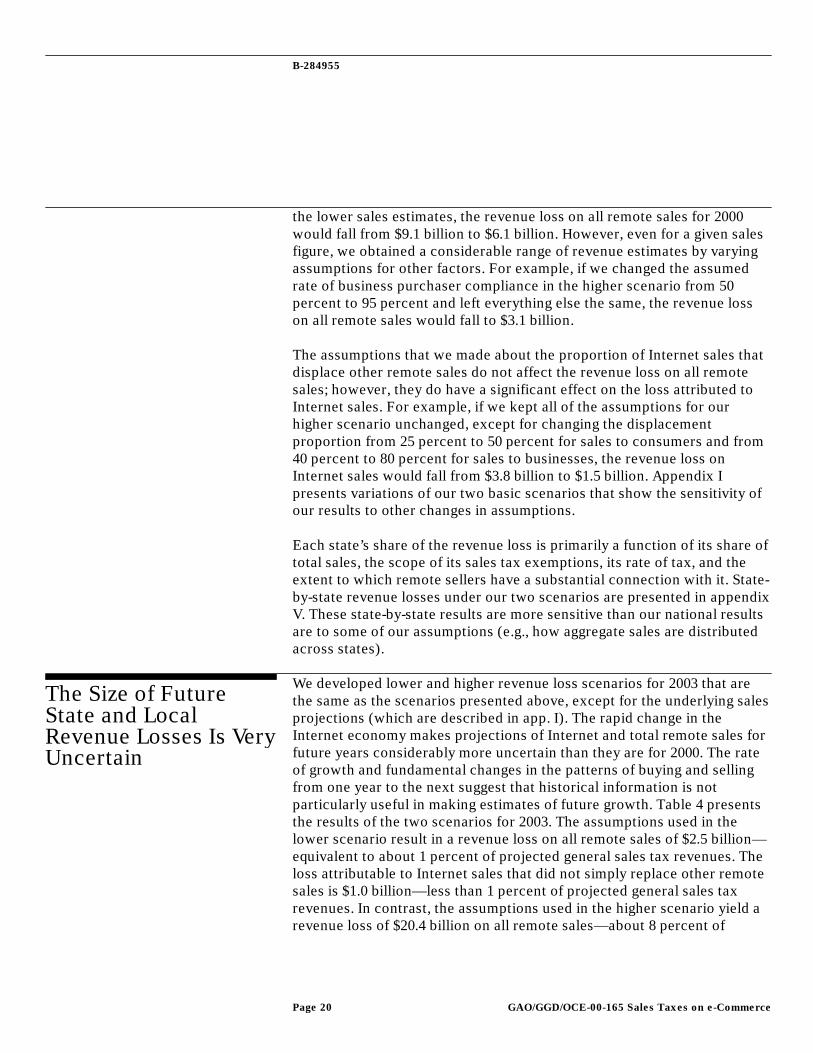
We developed lower and higher revenue loss scenarios for 2003 that arethe same as the scenarios presented above, except for the underlying salesprojections (which are described in app. I). The rapid change in theInternet economy makes projections of Internet and total remote sales forfuture years considerably more uncertain than they are for 2000. The rateof growth and fundamental changes in the patterns of buying and sellingfrom one year to the next suggest that historical information is notparticularly useful in making estimates of future growth. Table 4 presentsthe results of the two scenarios for 2003. The assumptions used in thelower scenario result in a revenue loss on all remote sales of $2.5 billion—equivalent to about 1 percent of projected general sales tax revenues. Theloss attributable to Internet sales that did not simply replace other remotesales is $1.0 billion—less than 1 percent of projected general sales taxrevenues. In contrast, the assumptions used in the higher scenario yield arevenue loss of $20.4 billion on all remote sales—about 8 percent of
The Size of FutureState and LocalRevenue Losses Is VeryUncertain
B-284955
Page 21 GAO/GGD/OCE-00-165 Sales Taxes on e-Commerce
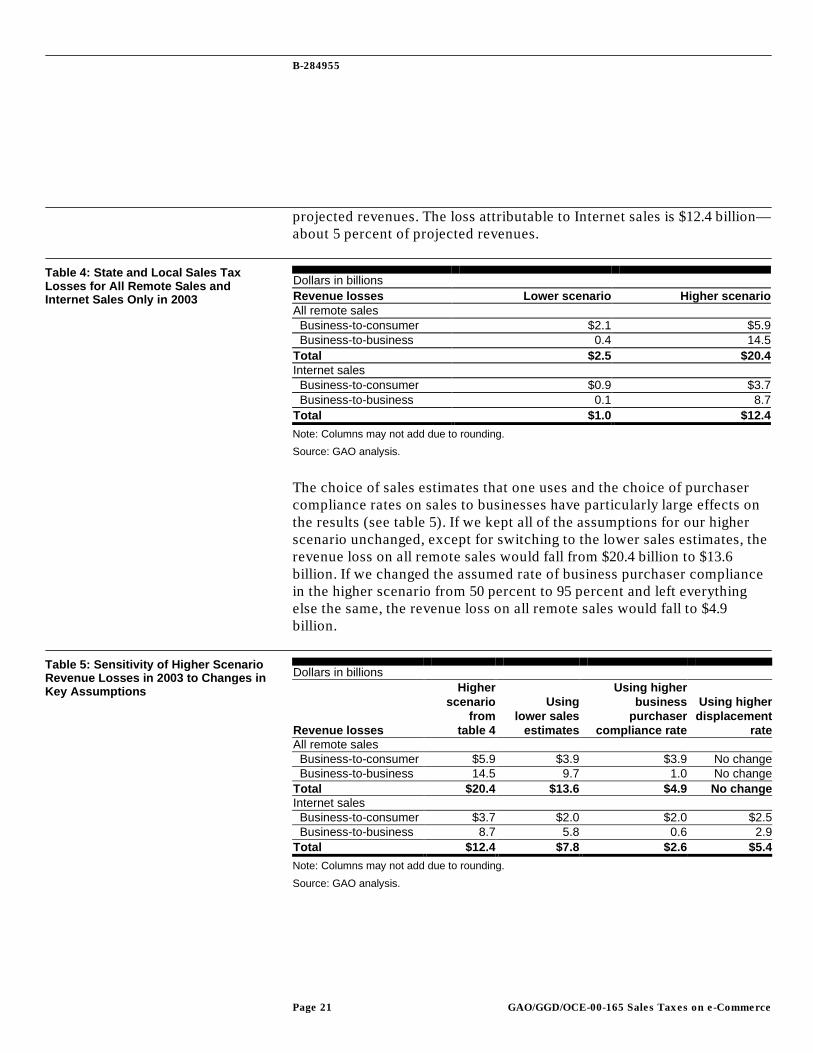
projected revenues. The loss attributable to Internet sales is $12.4 billion—about 5 percent of projected revenues.
Dollars in billionsRevenue losses Lower scenario Higher scenarioAll remote sales Business-to-consumer $2.1 $5.9 Business-to-business 0.4 14.5Total $2.5 $20.4Internet sales Business-to-consumer $0.9 $3.7 Business-to-business 0.1 8.7Total $1.0 $12.4
Note: Columns may not add due to rounding.
Source: GAO analysis.
The choice of sales estimates that one uses and the choice of purchasercompliance rates on sales to businesses have particularly large effects onthe results (see table 5). If we kept all of the assumptions for our higherscenario unchanged, except for switching to the lower sales estimates, therevenue loss on all remote sales would fall from $20.4 billion to $13.6billion. If we changed the assumed rate of business purchaser compliancein the higher scenario from 50 percent to 95 percent and left everythingelse the same, the revenue loss on all remote sales would fall to $4.9billion.
Dollars in billions
Revenue losses
Higherscenario
from table 4
Using lower sales
estimates
Using higherbusiness
purchasercompliance rate
Using higherdisplacement
rateAll remote sales Business-to-consumer $5.9 $3.9 $3.9 No change Business-to-business 14.5 9.7 1.0 No changeTotal $20.4 $13.6 $4.9 No changeInternet sales Business-to-consumer $3.7 $2.0 $2.0 $2.5 Business-to-business 8.7 5.8 0.6 2.9Total $12.4 $7.8 $2.6 $5.4
Note: Columns may not add due to rounding.
Source: GAO analysis.
Table 4: State and Local Sales TaxLosses for All Remote Sales andInternet Sales Only in 2003
Table 5: Sensitivity of Higher ScenarioRevenue Losses in 2003 to Changes inKey Assumptions

B-284955
Page 22 GAO/GGD/OCE-00-165 Sales Taxes on e-Commerce
There are three themes that run through this report. One is that undermost of our scenarios, the tax loss associated with Internet sales is smallfor 2000, but under some scenarios, could be much larger by 2003. Anotheris that continued growth in Internet sales is likely to present majorcompliance challenges for sales and use tax administrators—to the extentthat some have questioned the long-term viability of such taxes. Finally,there is tremendous uncertainty about all of the major determinants of thetax loss.
When combined, these three themes highlight the importance of efforts toget better data about the determinants of the tax loss, such as the CensusBureau’s program to measure Internet sales. Current economic data arenot well suited to tracking rapidly evolving Internet activity. With betterdata, policymakers would be better positioned to confront the challengespresented by e-commerce to sales and use tax administration. One benefitof such data would be more accurate estimates of sales and use tax lossesto state and local governments. Perhaps more importantly, such data couldprovide more of a basis for evaluating alternative policy choices.
Understanding the limits of data, however, in an environment as dynamicas the Internet is important. Innovations in Internet sales—with new typesof goods, services, and transactions—are rapid and unpredictable. Further,many of the key decisions by consumers, businesses, and policymakersthat will determine the extent of Internet tax losses in the near future havenot yet been made and will not be reflected in data that are necessarilyhistorical. As a consequence, even with improved data, policymakingregarding Internet sales will be done in an environment of significantuncertainty.
As agreed, unless you announce the contents of this report earlier, we planno further distribution until 14 days from the date of this letter. At thattime, we will send copies of this report to Senator Richard J. Durbin,Ranking Minority Member of the Subcommittee; the Honorable LawrenceH. Summers, Secretary of the Treasury; the Honorable William M. Daley,Secretary of Commerce; the Honorable Charles O. Rossotti, Commissionerof Internal Revenue and other interested congressional parties. We willalso make copies available to others on request.
ConcludingObservations

B-284955
Page 23 GAO/GGD/OCE-00-165 Sales Taxes on e-Commerce
Please contact me or James A. Wozny at (202) 512-9110 if you have anyquestions. Key contributors to this report are acknowledged in appendixVII.
Sincerely yours,
James R. WhiteDirector, Tax Policy and Administration Issues
Page 24 GAO/GGD/OCE-00-165 Sales Taxes on e-Commerce
Contents
1Letter
28The Volume and Composition of Internet and Other
Remote Sales28
The Taxability of Remote Sales 30The Extent to Which Remote Sellers Already Collect Tax 32The Extent to Which Purchasers Already Pay Tax 34Auction Sales 35Behavioral Response 35Sensitivity Analysis 36
Appendix IMethodology for theRevenue LossScenarios
37Commerce and Due Process Clauses 37Dual Entity Arrangements 42
Appendix IIConstitutionalRestrictions on StateAuthority to ImposeSales and Use Taxes
44Appendix IIIGeneral Sales TaxProvisions
56Appendix IVState and LocalGovernment Relianceon Sales Tax Revenue
59Appendix VState and LocalGovernment Sales andUse Tax Losses
62Private Sector Research Groups 62
Appendix VIList of Contacts National Organizations Representing the Public Sector 62

Contents
Page 25 GAO/GGD/OCE-00-165 Sales Taxes on e-Commerce
Industry Representatives 62Department of Commerce 62Department of the Treasury 62States 62Academics and Others 63
64Appendix VIIGAO Contacts andStaffAcknowledgments
Table 1: State and Local Government Reliance on GeneralSales Taxes
14
Table 2: State and Local Sales Tax Losses for All RemoteSales and Internet Sales Only in 2000
19
Table 3: Sensitivity of Higher Scenario Revenue Losses in2000 to Changes in Key Assumptions
19
Table 4: State and Local Sales Tax Losses for All RemoteSales and Internet Sales Only in 2003
21
Table 5: Sensitivity of Higher Scenario Revenue Losses in2003 to Changes in Key Assumptions
21
Table I.1: Choices of Sales Estimates Used in theScenarios
30
Table I.2: Seller Collection Rate Estimates for SelectedCategories of All Business-to-Consumer Remote Sales
33
Table I.3: Seller Collection Rate Estimates for SelectedCategories of Business-to-Consumer Internet Sales
33
Table I.4: State and Local Sales Tax Losses for AllRemote Sales and Internet Sales Alone in 2000
36
Table I.5: State and Local Sales Tax Losses for AllRemote Sales and Internet Sales Alone in 2003
36
Table III.2: General Sales and Use Tax Treatment forSelected Services That Can be Sold by Remote Sellers,1996
48
Table III.2: (cont.) 49Table III.2: (cont.) 50Table III.2: (cont.) 51Table III.3: State and Local General Sales Tax Rates and
Combined Rates for Selected Cities, March 199953
Tables
Table IV.1: State Government Reliance on Sales TaxRevenue, 1998
56
Contents
Page 26 GAO/GGD/OCE-00-165 Sales Taxes on e-Commerce
Table IV.2: Local Government Reliance on Sales TaxRevenue, 1995-96
57
Table V.1: State and Local Sales and Use Tax Losses forAll Remote Sales and Internet Sales Alone in 2000
59
Table V.2: State and Local Sales and Use Tax Losses forAll Remote Sales and Internet Sales Alone in 2003
60
Figure 1: Steps Involved in Computing Revenue Losses 8Figure 2: Responsibility for Sales and Use Tax Collection
and Remittance12
Figure III.1: Sales and Use Tax Treatment of SelectedGoods That Can Be Sold by Remote Sellers, 1999
44
Figures

Page 27 GAO/GGD/OCE-00-165 Sales Taxes on e-Commerce
Appendix I
Methodology for the Revenue Loss Scenarios
Page 28 GAO/GGD/OCE-00-165 Sales Taxes on e-Commerce
This appendix provides further details on the methodology we used tocompute the various revenue loss scenarios presented in the letter intables 2 through 5. It also provides additional analyses of the sensitivity ofour results to changes in specific assumptions.
To obtain sales estimates, we reviewed academic, government, andprivate-sector studies, including those published on the Internet. We alsocontacted the authors and other experts in this field to identify otherpotential sources of sales estimates. There were many estimates availablefor business-to-consumer Internet sales but only a limited number forbusiness-to-business Internet sales and all remote sales. We were not ableto assess the accuracy of any of the available estimates. However, giventhe difficulty of making such estimates, particularly for future years, webelieve that they all have substantial margins of error. In our revenue lossscenarios, we try to represent the broad range of estimates for business-to-consumer Internet sales that have been made for 2000 and 2003. For othercategories of sales, where we had to rely on a single source of estimates,we applied a margin of error of 20 percent to acknowledge the fact thatthere is considerable uncertainty around the estimates.
For business-to-consumer Internet sales, the range of estimates that weidentified is similar to the list reported in eMarketer’s “The eCommerce:B2C Report,” April 2000.1 We chose our range of estimates from a subset ofsources (all private research firms) that used the same definition ofInternet sales—transactions placed and paid for over the Internet. Fromamong that group, Forrester Research, Inc., represented the higher end ofthe range, with sales estimates of $39 billion for 2000 and $143 billion for2003.2 Jupiter Communications represented the lower end of the range,with sales estimates of $23 billion for 2000 and $78 billion for 2003. BothForrester and Jupiter base their estimates on surveys of consumers andsurveys and interviews of businesses. Bruce and Fox, and Goolsbee andZittrain both used business-to-consumer sales estimates by Forrester intheir studies. Cline and Neubig used a sales estimate that they said was onthe high end of available estimates at the time of their analysis. Whenmaking its own state revenue loss estimate, Forrester relied on two
1“The eCommerce: B2C Report,” eMarketer (New York, Apr. 2000), p. 30.
2The business-to-consumer sales estimate for 2000 contained in the April 2000 shop.org/BostonConsulting Group study was higher than the Forrester estimate, but after removing non-U.S. sales,financial services, and nonsales revenues contained in the Boston Consulting Group estimate, theForrester estimate was higher.
The Volume andComposition ofInternet and OtherRemote Sales
Business-to-ConsumerInternet Sales
Appendix I
Methodology for the Revenue Loss Scenarios
Page 29 GAO/GGD/OCE-00-165 Sales Taxes on e-Commerce
surveys of consumers, one of which asked buyers how often they paidtaxes when shopping on-line.3
Forrester Research’s estimates of business-to-business Internet sales arethe only ones that we found that were made within the last year. 4 We usedForrester’s estimates with a 20-percent margin of error for our scenarios,giving us lower end estimates of $325 billion for 2000 and $1,459 billion for2003, and higher bound estimates of $487 billion for 2000 and $2,188 billionfor 2003. Forrester made separate estimates of business-to-business salesfor service industries, which we also incorporated into our scenarios with20-percent error bounds. The lower sales estimates for these services are$35 billion for 2000 and $176 billion for 2003. The higher estimates are $52billion for 2000 and $264 billion for 2003. In their study, Bruce and Foxused an earlier set of Forrester business-to-business sales estimates.
We decided that the best available estimates of total remote business-to-consumer sales for our analysis were those produced by MarketingLogistics Inc., a research firm that has produced such estimates for 18years.5 Its estimates are disaggregated by detailed product and servicecategories.
Marketing Logistics measures orders that are placed by mail, phone, orelectronically and that do not require the purchaser to visit the seller’spremises, or vice versa. Its estimates are based on “micro” and “macro”techniques. The micro technique involves identifying the mail orderbusinesses in an industry and estimating the remote sales for eachbusiness. Marketing Logistics has a proprietary database that containsinformation on over 10,000 companies. The macro technique usesestimates of aggregate remote sales for certain sales segments. TheAdvisory Commission on Intergovernmental Relations (ACIR) used theMarketing Logistics data as the basis for making its past estimates ofrevenue losses on remote sales. 3Forrester’s general approach differed from those of the other prior studies (which were broadlysimilar to our approach). Among the significant differences are that Forrester did not attempt todistinguish between taxable and nontaxable sales (except for travel) and did not make an adjustmentfor Internet sales that displace other remote sales.
4Forrester’s primary report on business-to-business Internet sales, “eMarketplaces Boost B2B Trade,” isdates February 2000; its separate report on business-to-business services, “Business Services On theNet,” is dated January 1999. Forrester based both of these studies on interviews with officials fromlarge firms. For the first study, it also relied on discussions with industry experts, strategy consultants,technology vendors, and eMarketplaces.
5Direct Marketing Association estimates a category of sale—“direct order sales”—that is roughlyequivalent to total remote sales; however, we believe the estimating techniques and the amount ofdetail were preferable in the Marketing Logistics data.
Business-to-BusinessInternet Sales
Total Business-to-ConsumerRemote Sales
Appendix I
Methodology for the Revenue Loss Scenarios
Page 30 GAO/GGD/OCE-00-165 Sales Taxes on e-Commerce
After applying a 20-percent margin of error to the Marketing Logisticsestimates, the higher and lower estimates that we used for business-to-consumer sales in 2000 were $278 billion and $186 billion. The higher andlower estimates for 2003 were $391 and $261 billion.
Marketing Logistics’ estimates of total business-to-consumer remote saleswere significantly higher than the highest estimates that we used forbusiness-to-consumer Internet sales. However, its estimates of totalbusiness-to-business remote sales were much lower than the Forresterestimates of business-to-business Internet sales (even after we reduced thelatter by 20 percent). We decided to use the adjusted Forrester estimatesas the estimates for both Internet business-to-business sales and totalbusiness-to-business remote sales because the Forrester estimates wereconsiderably more recent than the Marketing Logistics estimates andbecause the e-commerce environment is changing so rapidly. This decisionprevents a logical inconsistency between the Internet and the total remotesales estimates that we use. However, the fact that the inconsistency existsbetween the original estimates is further evidence that these estimatesshould be used with caution.
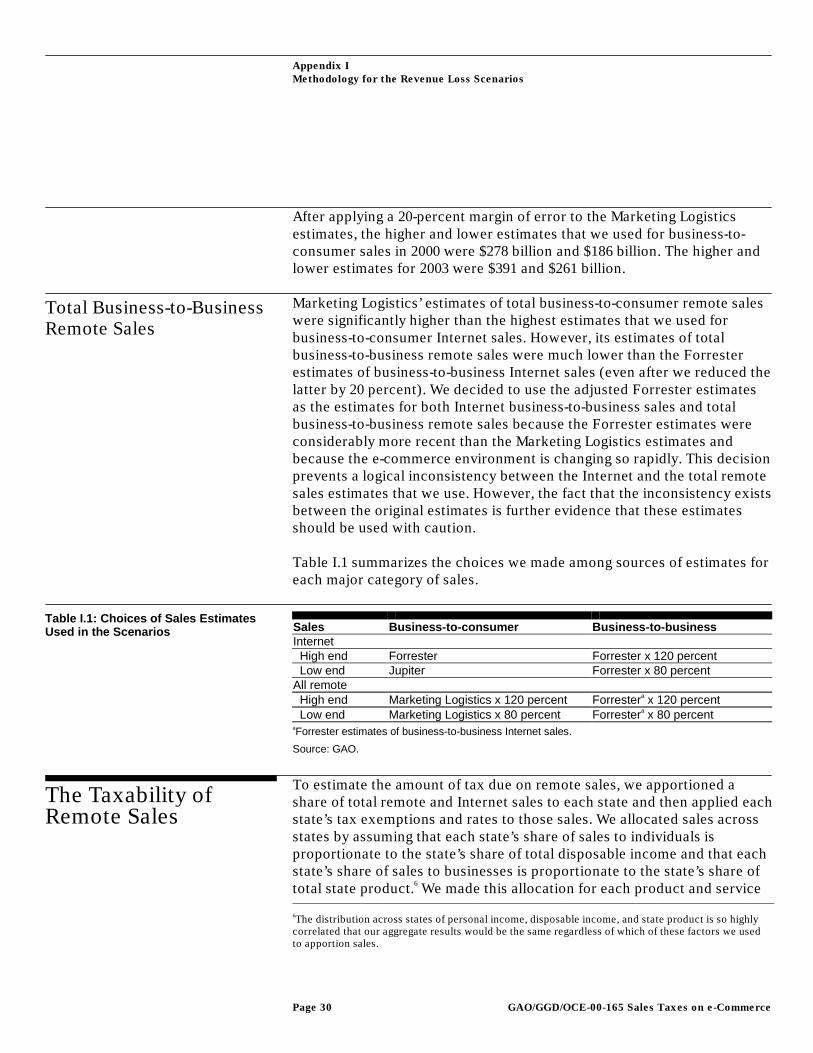
Table I.1 summarizes the choices we made among sources of estimates foreach major category of sales.
Sales Business-to-consumer Business-to-businessInternet High end Forrester Forrester x 120 percent Low end Jupiter Forrester x 80 percentAll remote High end Marketing Logistics x 120 percent Forrestera x 120 percent Low end Marketing Logistics x 80 percent Forrestera x 80 percentaForrester estimates of business-to-business Internet sales.
Source: GAO.
To estimate the amount of tax due on remote sales, we apportioned ashare of total remote and Internet sales to each state and then applied eachstate’s tax exemptions and rates to those sales. We allocated sales acrossstates by assuming that each state’s share of sales to individuals isproportionate to the state’s share of total disposable income and that eachstate’s share of sales to businesses is proportionate to the state’s share oftotal state product.6 We made this allocation for each product and service 6The distribution across states of personal income, disposable income, and state product is so highlycorrelated that our aggregate results would be the same regardless of which of these factors we usedto apportion sales.
Total Business-to-BusinessRemote Sales
Table I.1: Choices of Sales EstimatesUsed in the Scenarios
The Taxability ofRemote Sales

Appendix I
Methodology for the Revenue Loss Scenarios
Page 31 GAO/GGD/OCE-00-165 Sales Taxes on e-Commerce
category. We then determined which categories of products and servicesare taxed by each state. Our main sources for state exemptions wereCCH’s 1999 US Master Sales and Use Tax Guide for goods, the Federationof Tax Administrators’ 1996 Update for the Sales Taxation of Services forservices, and the Research Institute of America’s 1999 All States TaxHandbook. We supplemented these sources with information obtainedfrom individual state revenue departments.
We made additional adjustments to reflect the fact that some sales areexempted on the basis of the type of purchaser or the type of use. Thesepurchaser and use exemptions are important for estimating whatproportion of business-to-business remote sales are taxable. Our sourcesof sales estimates did not disaggregate them by type of purchaser or typesof use. In order to estimate the percentage of business-to-business salesthat were exempt, we used the input-output tables compiled by the U.S.Department of Commerce.7 The Use Table shows the interindustrytransactions of the U.S. economy for 1996 and provides detailedinformation on the composition of inputs and the distribution of outputs ofall major U.S. industries. We used parts of the “Intermediate Use” columnof this table to estimate the share of inputs for key industries that areexempted as raw materials, or inputs that are exempted because they areincorporated into the final product. We used parts of the “Gross PrivateFixed Investment” column to estimate the share of industry inputs that arepurchases of machinery and other equipment that are also exempted fromsales and use taxes by many states. The input-output tables also providedetailed information on the percentage of each industry’s output that areexported, sold to federal and state governments, and sold for consumption.We used these data to estimate the share of each major industry’s outputthat should be included in calculations of business-to-business sales thatare relevant for sales and use tax purposes.
On the basis of our analysis of the input-output data, we used the followingranges of assumptions in our scenarios for each product category in theForrester business-to-business Internet sales estimates. The numbers inparentheses indicate the percent of sales assumed to be not taxed.Purchases by tax-exempt entities, such as governments and charitableorganizations, are reflected in the percentages.
• Computing and electronics (35-55 percent not taxed)• Motor vehicles (70-80 percent not taxed)• Paper and office products (50-65 percent not taxed)
7Table 2, Survey of Current Business (Jan. 2000), pp. 56-65.
Appendix I
Methodology for the Revenue Loss Scenarios
Page 32 GAO/GGD/OCE-00-165 Sales Taxes on e-Commerce
• Industrial equipment (65-85 percent not taxed in states that exemptmachinery used for manufacturing; 50-70 percent not taxed in theremaining states)
• Petrochemicals, shipping and warehousing, pharmaceutical and medicalproducts, construction, and heavy industries (90-100 percent not taxed)
• Food and agriculture and consumer goods (95-100 percent not taxed)• Aerospace and defense (85-100 percent not taxed)• Utilities (100 percent not taxed in the states that completely exempt
utilities; 60-90 percent not taxed in the states that exempt only utilitiespurchased by manufacturers; 40-60 percent not taxed in states that do notexempt utilities at all).
In addition we assumed that between zero and 6 percent of business-to-consumer sales were to tax-exempt entities. These assumptions are basedon our analysis of the Commerce Department data and opinions obtainedfrom state revenue officials.
To estimate seller collection rates for selected categories of Internet andother remote sales, we followed an approach similar to that used in earlierstudies by ACIR and the Pennsylvania Department of Revenue. We madeseparate estimates for all remote sales and for Internet sellers because asomewhat different population of firms dominates in each case. To makeour estimate for all remote sales, we obtained information from 96 of thelargest remote sellers from Marketing Logistics’ 1998 list of leading sellersto determine the states in which they collect sales taxes. We grouped thecompanies that responded by product category and distributed their salesacross states. We were then able to estimate what percent of sales in eachproduct category in each state was made by taxpaying sellers. We used theratios of the respondents’ sales to Marketing Logistics’ estimates of totalremote sales in each product category to determine how reliable ourestimates were. For the five categories in which the respondents’ salesrepresented at least 40 percent of total sales, we used our specificcollection rate estimate in our model. We grouped the remainingcategories into a separate “other consumer goods” category and estimatedone rate for that category. In order to reflect the significant margin of erroraround our estimates, in our lower scenario we used collection rates thatwere 25 percent below our estimates; in the higher scenario we assumedrates that were 25 percent above our estimates. Table I.2 shows the nexusassumptions we used for selected categories of all remote sales.
The Extent to WhichRemote Sellers AlreadyCollect Tax

Appendix I
Methodology for the Revenue Loss Scenarios
Page 33 GAO/GGD/OCE-00-165 Sales Taxes on e-Commerce
Seller collection rate forCategory Higher scenario Lower scenarioApparel 29% 48%Auto service clubs 73 100Department stores and broad range catalogues 59 98Computer hardware 14 24Computer software 11 19Other consumer goods 35 58
Source: GAO estimates.
For other categories of sales, where we could not obtain sufficient datafrom companies, but where discussions with tax officials led us to believethat collection rates would be high, we assigned collection rates.Specifically, for the following categories, we assumed a 100-percent sellercollection rate in our lower scenario and a 75-percent collection rate in ourhigher scenario: cable television, direct broadcasting satellite services, andinsurance.
We followed a similar approach for estimating seller collection rates forbusiness-to-consumer Internet sales. We obtained information from 86 ofthe companies on Stores.org’s 1999 list of the top 100 Internet retailers. Weused Forrester’s estimates of business-to-consumer Internet sales in 1999to estimate the product category shares represented by our respondents.Table I.3 shows the seller collection rate assumptions for our scenariosthat were based on our empirical estimates.
Seller collection rate forCategory Higher scenario Lower scenarioApparel 34% 57%Books/videos/music 13 22Computer software 28 46Computer hardware 14 23Other consumer goods 22 36
Source: GAO estimates.
We could not find appropriate data to estimate collection rates for thebusiness-to-business Internet sales categories used by Forrester. Weassumed the following ranges of seller collection rates for each of theForrester industrial categories (after examining the more detailedsubcategories contained in each):
Table I.2: Seller Collection RateEstimates for Selected Categories of AllBusiness-to-Consumer Remote Sales
Table I.3: Seller Collection RateEstimates for Selected Categories ofBusiness-to-Consumer Internet Sales
Appendix I
Methodology for the Revenue Loss Scenarios
Page 34 GAO/GGD/OCE-00-165 Sales Taxes on e-Commerce
• Computing and electronics, consumer goods, food and agriculture,industrial equipment, paper and office products, and pharmaceuticals (25-50 percent);
• Aerospace and defense, construction, and heavy industries (70-90 percent);• Petrochemicals, shipping and warehousing, and utilities (75-95 percent);• Motor vehicles (85-100 percent).
Other analysts who have estimated the revenue losses associated withInternet and other remote sales have used a variety of assumptionsregarding the proportion of tax already being paid. However, they have notalways specified what portion sellers pay and what portion purchaserspay. Bruce and Fox assumed that 100 percent of the tax due on theInternet sales of automobiles to businesses and consumers are beingcollected. They assume that 50 percent of the tax due on all other Internetsales to businesses and 10 percent of the tax due on all other Internet salesto individual consumers are being collected either from the sellers or fromthe purchasers. Cline and Neubig assumed that no significant amount oftax is going uncollected on Internet sales to businesses, while nearly 11percent of the tax due on Internet sales to consumers is being collectedfrom either sellers or purchasers. Goolsbee and Zittrain also assumed thatno significant losses result from business-to-business Internet sales, butthey assumed that no tax is collected on sales to consumers. None of theseauthors cited empirical evidence for these assumptions, though authors ofthe first two studies referred to discussions with private sector taxexperts.
There is a wide range of opinion regarding the compliance rate of businesspurchasers. One state official we contacted believes the rate is close to 100percent; another believes it to be around 65 percent. The range ofassumptions used in previous studies is similarly wide. As noted above,Cline and Neubig, and Goolsbee and Zittrain have assumed that almost alltaxes owed on business-to-business sales are being paid. In contrast, Bruceand Fox assume that only 50 percent is being paid on most purchases,while 100 percent is being paid on purchases of motor vehicles. Neither thePennsylvania Department of Revenue nor the ACIR estimated the rate ofcompliance on the part of purchasers, although both acknowledged thatthere would be some compliance on the part of business purchasers.
In contrast to the wide range of opinion that exists with respect to thecompliance of business purchasers, there was a wide consensus amongprevious studies and the state officials, who provided us estimates that usetax compliance by individual purchasers was extremely low. However,there was also a wide consensus that compliance with the use tax on
The Extent to WhichPurchasers AlreadyPay Tax
Appendix I
Methodology for the Revenue Loss Scenarios
Page 35 GAO/GGD/OCE-00-165 Sales Taxes on e-Commerce
motor vehicles was close to 100 percent because the taxes must be paidbefore those vehicles can be registered. 8
For our scenarios, we used assumptions for the business purchasercompliance rate that range from 50 to 95 percent on all products, with thepreviously stated exception for motor vehicles, where the range is from 85to 100 percent. We used assumptions for the consumer purchasercompliance rate that range from zero to 5 percent. The business-to-consumer estimates that we used for Internet and all remote sales did notshow motor vehicle sales separately.
The Forrester Internet sales estimates that we use in our scenarios includesales that businesses make through auction sites, but they exclude person-to-person auction sales. We exclude those sales under the assumption thatstate tax authorities would not have any more success collecting fromindividuals who sell over the Internet than they do from individuals whopurchase over the Internet. The latter already have an responsibility to payany tax that is owed on auction purchases. Boston Consulting Groupestimates that person-to-person auction sales of collectibles will total $6billion in 2000. If all of these sales were taxable, the total state and localsales tax owed on them would be about $0.4 billion. However, almost allstates exempt “occasional” sales (other than motor vehicles, vessels, andaircraft) made by persons not engaged in business.
Our estimates are based on the assumption that the same volume ofInternet and remote sales would have occurred even if taxes werecollected on all of those sales. This assumption ignores consumer’sresponse to the reduction in taxes paid when purchases shift to theInternet, and leads to an upward bias in our estimates of revenue loss. Inaddition, there are several ways in which the existence of and growth inthe Internet has changed the behavior of consumers and businesses. First,given the added convenience and lower prices associated with purchasingcertain goods over the Internet, it is likely that the volume of those saleshas increased over what would have occurred in the absence of Internetand other remote outlets. In addition, the rapid growth of the Internet hasalso changed the geographic pattern if not the overall level of retail activityin the United States. To the extent that these effects have increased retailsales over what would have occurred in the absence of the Internet, thiswould lead to an upward bias in our results. We were unable to findsufficient evidence to allow us to adjust for these different changes.
8The reason why we assume less than 100-percent compliance in our higher scenario is that the motorvehicles category in the Forrester data includes some sales of automotive parts.
Auction Sales
Behavioral Response
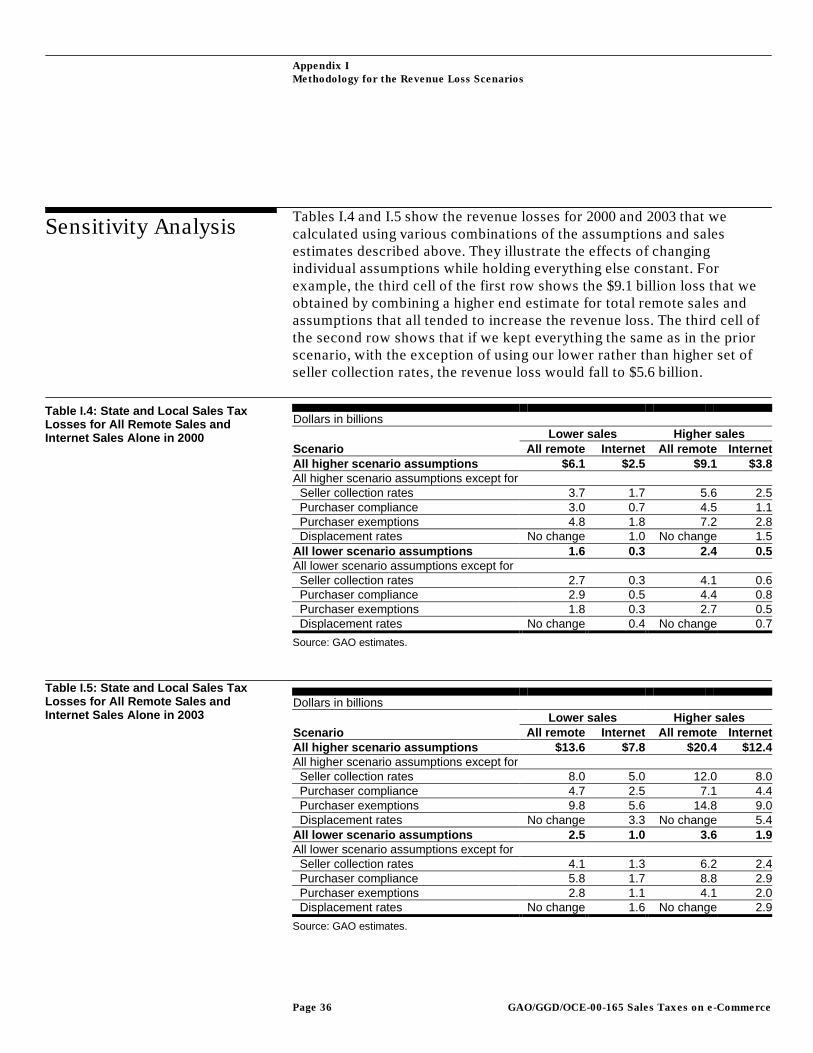
Appendix I
Methodology for the Revenue Loss Scenarios
Page 36 GAO/GGD/OCE-00-165 Sales Taxes on e-Commerce
Tables I.4 and I.5 show the revenue losses for 2000 and 2003 that wecalculated using various combinations of the assumptions and salesestimates described above. They illustrate the effects of changingindividual assumptions while holding everything else constant. Forexample, the third cell of the first row shows the $9.1 billion loss that weobtained by combining a higher end estimate for total remote sales andassumptions that all tended to increase the revenue loss. The third cell ofthe second row shows that if we kept everything the same as in the priorscenario, with the exception of using our lower rather than higher set ofseller collection rates, the revenue loss would fall to $5.6 billion.
Dollars in billionsLower sales Higher sales
Scenario All remote Internet All remote InternetAll higher scenario assumptions $6.1 $2.5 $9.1 $3.8All higher scenario assumptions except for Seller collection rates 3.7 1.7 5.6 2.5 Purchaser compliance 3.0 0.7 4.5 1.1 Purchaser exemptions 4.8 1.8 7.2 2.8 Displacement rates No change 1.0 No change 1.5All lower scenario assumptions 1.6 0.3 2.4 0.5All lower scenario assumptions except for Seller collection rates 2.7 0.3 4.1 0.6 Purchaser compliance 2.9 0.5 4.4 0.8 Purchaser exemptions 1.8 0.3 2.7 0.5 Displacement rates No change 0.4 No change 0.7
Source: GAO estimates.
Dollars in billionsLower sales Higher sales
Scenario All remote Internet All remote InternetAll higher scenario assumptions $13.6 $7.8 $20.4 $12.4All higher scenario assumptions except for Seller collection rates 8.0 5.0 12.0 8.0 Purchaser compliance 4.7 2.5 7.1 4.4 Purchaser exemptions 9.8 5.6 14.8 9.0 Displacement rates No change 3.3 No change 5.4All lower scenario assumptions 2.5 1.0 3.6 1.9All lower scenario assumptions except for Seller collection rates 4.1 1.3 6.2 2.4 Purchaser compliance 5.8 1.7 8.8 2.9 Purchaser exemptions 2.8 1.1 4.1 2.0 Displacement rates No change 1.6 No change 2.9
Source: GAO estimates.
Sensitivity Analysis
Table I.4: State and Local Sales TaxLosses for All Remote Sales andInternet Sales Alone in 2000
Table I.5: State and Local Sales TaxLosses for All Remote Sales andInternet Sales Alone in 2003

Appendix II
Constitutional Restrictions on State Authorityto Impose Sales and Use Taxes
Page 37 GAO/GGD/OCE-00-165 Sales Taxes on e-Commerce
The authority of the states to impose sales and use taxes is limited by theU. S. Constitution. The Commerce Clause of Article I and the Due ProcessClause of the 14th Amendment are the principal constitutional challengesto these taxes.1 These two provisions directly impact the ability of thestates to tax nonresidents and interstate commerce. Both provisionsrequire a sufficient connection between the state and the taxpayer it seeksto tax or the seller on which the state seeks to impose a responsibility tocollect a use tax in order for the tax to be upheld.
Under the Commerce Clause, Congress has sole authority to regulatecommerce with foreign nations, among the states, and with the Indiantribes. Accordingly, the Commerce Clause prevents the states frominterfering with or unduly burdening interstate commerce through the useof its taxing authority. The Supreme Court’s interpretation of thisrestriction (the Complete Auto test) provides that a state tax does notunduly burden interstate commerce if it is applied to an activity with asubstantial connection or “nexus” with the taxing state, is fairlyapportioned, does not discriminate against interstate commerce, and isfairly related to services provided by the state.2
Under the Due Process Clause, states may not deprive any person of life,liberty, or property without due process of law. This restriction limits theterritorial reach of the states’ taxing authority to persons, property, andbusiness transactions within their jurisdictions. The Supreme Court’sinterpretation of this restriction requires some definite link, someminimum connection or “nexus,” between a state and the person, property,or transaction it seeks to tax.3
Considerable case law has evolved addressing the differing constitutionalrequirements. Two Supreme Court cases are particularly relevant to thediscussion of the Commerce Clause and Due Process Clause challenges tostate imposition of use tax collection the responsibility on out-of-statesellers. These two cases, National Bellas Hess v. Department of Revenue of
1Commerce Clause, Sec. 8, Cl. 3, Art. I and Due Process Clause, Sec. 1, amend. XIV. Additionalconstitutional restraints on state taxation include the Import-Export Clause that prevents states fromimposing duties on imports or exports without congressional consent; the Privileges and ImmunitiesClause that prevents states from imposing greater burdens on nonresidents than on residents; theSupremacy Clause that prevents state taxing statutes from contravening federal laws, regulations, ortreaties; the First Amendment that prevents states from discriminating against free speech or freedomof religion; and the Equal Protection Clause of the 14th Amendment that prevents states from makingunfair classifications.
2Complete Auto Transit Inc. v. Brady, 430 U.S. 274 (1977).
3Miller Brothers Co. v. Maryland, 347 U.S. 347 (1954).
Commerce and DueProcess Clauses
Appendix II
Constitutional Restrictions on State Authority to Impose Sales and Use Taxes
Page 38 GAO/GGD/OCE-00-165 Sales Taxes on e-Commerce
Illinois , 386 U.S. 753 (1967), and, more recently, Quill Corp. v. NorthDakota, 504 U.S. 298 (1992), address the “nexus” requirements for taxationof interstate transactions.
The National Bellas Hess company was a mail-order house with itsprincipal place of business in Missouri. It had neither outlets (nor anytangible property, real or personal) in Illinois nor sales representativesphysically located there to sell or take orders. Twice-a-year catalogs weremailed to the company’s customers throughout the United States,including Illinois. Customers mailed orders for the goods to the NationalBellas Hess plant in Missouri. The ordered goods were then sent to thecustomers either by mail or common carrier.
The State of Illinois obtained a judgment from its highest court requiringNational Bellas Hess to collect and pay to the state a use tax imposed uponits consumers who purchased goods for use within Illinois. National BellasHess argued that imposition of the responsibility to collect a use taxcollection violated the Due Process Clause and created an unconstitutionalburden upon interstate commerce.
The Supreme Court reversed the ruling of Illinois’ highest court, noting,first, that National Bellas Hess’ two constitutional challenges were closelyrelated. According to the Court, the test for whether a particular state taxinvades the exclusive authority of Congress to regulate commerce amongthe states and the test for a state’s compliance with the requirements ofdue process in this area are similar. The Court pointed to its previousholding that state taxation falling on interstate commerce can only bejustified to bear a fair share of the cost of the local government whoseprotection it enjoys.
In determining whether a state tax falls within the confines of the DueProcess Clause, the Court noted its previous holding that the controllingquestion is whether the state has given anything for which it can ask areturn. According to the Court, the same principles had been heldapplicable in determining the power of a state to impose the burdens ofcollecting use taxes upon interstate sales. There, too, the Court noted, theConstitution requires some definite link, some minimum connection,between a state and the person, property, or transaction it seeks to tax.4
4There was no question of the connection or link between the State and the person it sought to tax, i.e.Illinois residents who used the goods purchased from National Bellas Hess. Although National BellasHess was not the person being directly taxed (but rather it was asked to collect the tax from the user),
National Bellas HessAddresses Nexus Standardsfor Mail-order Sellers
Appendix II
Constitutional Restrictions on State Authority to Impose Sales and Use Taxes
Page 39 GAO/GGD/OCE-00-165 Sales Taxes on e-Commerce
The Court then noted that in applying these principles it had upheld thepower of a state to impose liability upon an out-of-state seller to collect alocal use tax in many circumstances, but it had never upheld the power toimpose this duty upon a seller whose only connection with customers inthe state was by common carrier or the U.S. mail. The Court refused torepudiate here the distinction it had previously drawn between mail ordersellers with retail outlets, solicitors, or property within a state and thosesellers who do no more than communicate with customers in the state bymail or common carrier. Accordingly, the Court concluded that impositionon National Bellas Hess of the responsibility for use tax collecting a usetax, in fact, unconstitutional on both grounds.
In Quill v. North Dakota, the Court reviewed its earlier decision in NationalBellas Hess. The Court used this opportunity to draw a clearer distinctionbetween the Due Process Clause and Commerce Clause nexusrequirements.
The Quill Corporation was a mail order house with offices and warehousein Illinois, California, and Georgia. It had neither outlets nor tangibleproperty in North Dakota, nor did any of its employees work or residethere. Quill sold office equipment and supplies through catalogs and flyers,advertisements in national periodicals, and telephone calls. Its annualnational sales exceeded $200 million of which almost $1 million was madefrom about 3,000 customers in North Dakota. Quill delivered all of itsmerchandise to its North Dakota customers by mail or by common carrierfrom its out-of-state locations.
Quill took the position that North Dakota did not have the power tocompel it to collect a use tax from its North Dakota customers. A NorthDakota trial court agreed with Quill finding the case indistinguishable fromthe Supreme Court’s decision in National Bellas Hess.
North Dakota’s highest court reversed the trial court, concluding thatwholesale changes in both the economy and the law made it inappropriateto follow the National Bellas Hess decision. The principal economicchange noted by the court was the remarkable growth of the mail-orderbusiness from a relatively inconsequential market in 1967 to a “goliath”with annual sales that reached $183.3 billion in 1989. Equally important inthe court’s view were changes it perceived in the legal landscape. Thecourt maintained that the Supreme Court’s subsequent four-part
it was, however, made directly liable for the payment of the tax whether collected or not. Ill. Rev. Stat.C. 120, sec. 439.8 (1965).
Quill Draws DistinctionBetween Due ProcessClause and CommerceClause Requirements
Appendix II
Constitutional Restrictions on State Authority to Impose Sales and Use Taxes
Page 40 GAO/GGD/OCE-00-165 Sales Taxes on e-Commerce
Commerce Clause analysis (the Complete Auto test) indicated that theCommerce Clause no longer mandated the sort of physical presence nexussuggested in National Bellas Hess. The North Dakota court furtherconcluded that the Due Process requirement of a minimum connection toestablish nexus was no longer a separate requirement but wasencompassed within the Complete Auto test. According to the court, therelevant inquiry was whether the state had provided some protection,opportunities, or benefit from which it could expect a return. With regardto the case at hand, the court emphasized that North Dakota had createdan economic climate that fostered demand for Quill’s products, maintaineda legal infrastructure that protected that market, and disposed of 24 tons ofcatalogs and flyers mailed by Quill each year into the state.
The U.S. Supreme Court reversed the ruling of North Dakota’s highestcourt. The Court agreed with the North Dakota court’s conclusion that theDue Process Clause did not bar enforcement of that state’s use tax againstQuill. The Court concluded, however, that the state’s enforcement of theuse tax against Quill placed an unconstitutional burden on interstatecommerce. The Court noted that although it had not always been precisein distinguishing between the two, the Due Process Clause and CommerceClause reflect different constitutional concerns and are analyticallydistinct.
The Supreme Court agreed with the North Dakota court that nexus is notsynonymous with physical presence for due process purposes andoverruled its previous holdings to that effect. The Court noted that its dueprocess jurisprudence had evolved substantially in the 25 years sinceNational Bellas Hess and that the relevant inquiry was whether a defendanthad minimum contacts with a jurisdiction such that maintenance of thesuit did not offend traditional notions of fair play and substantial justice.The Court concluded that Quill’s widespread and continuous solicitation inNorth Dakota made the magnitude of its contacts more than sufficient fordue process purposes.
In contrast, the Court upheld its previous holding in National Bellas Hessto the extent that it required physical presence in the Commerce Clausecontext. The Court first concluded that its decision in National Bellas Hessis not inconsistent with Complete Auto and other recent cases. The Courtnoted that under Complete Auto’s four-part test, a tax will be sustainedagainst a Commerce Clause challenge so long as the tax is applied to anactivity with a substantial nexus with the taxing state, is fairly apportioned,does not discriminate against interstate commerce, and is fairly related tothe services provided by the state. According to the Court, National Bellas
Appendix II
Constitutional Restrictions on State Authority to Impose Sales and Use Taxes
Page 41 GAO/GGD/OCE-00-165 Sales Taxes on e-Commerce
Hess concerns the first of these tests and stands for the proposition that avendor whose only contacts with the taxing state are by mail or commoncarrier lacks the “substantial nexus” required by the Commerce Clause.Using this bright-line, physical presence, rule the Court then concludedthat the imposition of the responsibility to collect the use on Quill placedan unconstitutional burden on interstate commerce.
After concluding its decision on the case, the Supreme Court noted in Quillthat Congress may not only be better qualified to resolve the underlyingissue in the case, but also is the one with the ultimate power to do so. TheCourt stated that no matter how it evaluated the burdens that use taxesimpose on interstate commerce, Congress remains free to disagree. TheCourt further noted that in recent years, Congress had in fact consideredlegislation that would legislatively overrule the National Bellas Hessdecision. The Court surmised that Congress’ decision not to take action inthat direction may have been dictated by its holding in National BellasHess that the Due Process Clause prohibits states from imposing such usetax collection responsibilities.5 The Court noted that since the Quilldecision overruled that aspect of National Bellas Hess, Congress, with thesole authority to regulate commerce among the states, could freely decidewhether, when, and to what extent the states could burden interstate mail-order concerns with a duty to collect use taxes.
The Supreme Court, in ruling on the National Geographic Society case,held that the activity or physical presence that established a company’snexus did not have to be related to the taxed activity.6 National GeographicSociety’s mail-order office that made merchandise sales to customers inCalifornia was separate from the Society’s magazine sales and advertisingoffice that maintained offices in the state. The Court held that themaintenance of the two magazine sales offices in California withadvertising copy in the range of $1 million annually adequately establisheda relationship of nexus between the Society and the State of California.This connection was sufficient for California to require NationalGeographic to collect the California use tax. In so holding, the Courtrejected the Society’s argument that there must be a relationship betweenthe taxed activity and the seller’s activity within the state.
5While Congress has plenary power to regulate commerce among the states and thus may authorizestate actions that burden interstate commerce, it does not similarly have the power to authorizeviolations of the Due Process Clause.
6National Geographic Society v. State Board of Equalization, 430 U.S. 551 (1977).
National Geographic HoldsThat Nexus Need NotRelate to Taxed Activity
Appendix II
Constitutional Restrictions on State Authority to Impose Sales and Use Taxes
Page 42 GAO/GGD/OCE-00-165 Sales Taxes on e-Commerce
While National Geographic held that the activity that established thecompany’s nexus did not have to relate to the taxed activity, a state courthas ruled on circumstances that do not constitute sufficient nexus. Forexample, the Connecticut Supreme Court ruled that insignificant propertyin a state does not necessarily establish nexus. Cally Curtis, a Californiafirm, rented film to customers in Connecticut for a 3-day preview periodbefore purchase. The court ruled that the presence of film for the previewperiod was de minimis contact and insufficient to support a nexusrelationship between Cally Curtis and Connecticut.7 The U.S. SupremeCourt declined review of this case.8
Several cases have examined the use of dual entity arrangements andwhether nexus can be imputed to a vendor that does not appear to havesufficient nexus to support a state sales and use tax collectionresponsibility because of its affiliation, through a parent-subsidiary orbrother-sister relationship, with another vendor that does have nexus withthe state. The issue has generally turned on whether the two affiliatedcompanies are separate and distinct entities and whether the affiliatedcompany that has sufficient nexus with the state has acted as an agent forthe company that does not have nexus. Two case examples follow.
In SFA Folio Collections, Inc. v. Bannon, 217 Conn. 220 (1991), Saks andCompany, a New York Corporation, owned both Folio, a New YorkCorporation whose mail-order business sold to Connecticut customers buthad no physical presence in that state, and Saks-Stamford, a separatecorporation operating a retail store in Connecticut. The ConnecticutSupreme Court rejected the argument of Connecticut’s RevenueCommission that because these separate entities were linked by theircommon parent, Saks and Company, their separate existence should bedisregarded and that they should be treated as one enterprise for thepurpose of establishing nexus. The Connecticut court noted that thecommissioner’s argument demonstrated a misunderstanding of afundamental principle underlying our system of taxation, which is thattaxpayers may arrange their affairs to minimize their tax liabilities.According to the court, this included careful planning of both transactionsand corporate structure. The Supreme Court declined review of this case.9
7Cally Curtis Co. v. Groppo, 214 Conn 292 (1990).
8Writ of certiorari denied, Commissioner of Revenue Services v. Cally Curtis Co., 498 U.S. 824 (1990).
9Writ of certiorari denied, Commissioner of Revenue Services v.SFA Folio Collections, 501 U.S. 1223(1991).
State Court HoldsDeminimis ContactInsufficient to EstablishNexus
Dual EntityArrangements
Appendix II
Constitutional Restrictions on State Authority to Impose Sales and Use Taxes
Page 43 GAO/GGD/OCE-00-165 Sales Taxes on e-Commerce
Similarly, in Bloomingdale’s v. Department of Revenue, 527 Pa. 347 (1991),the Pennsylvania Court found that there was not sufficient nexus betweenan out-of-state mail-order company, Bloomingdale’s By Mail, which didmail-order business in the state but had no physical presence there, eventhough its parent company, Bloomingdale’s, did own and operate retailstores in the state. In that case, the Department of Revenue argued thatBloomingdale’s By Mail’s separate corporate existence fromBloomingdale’s department stores was a mere legal formality. The courtpointed to previous court holdings of a parent/subsidiary relationship withnothing more would not justify disregarding the separate corporateidentity. According to the court, the issue turned on whether theBloomingdale’s department stores had acted as an agent or representativefor Bloomingdale’s By Mail.10 The Pennsylvania court concluded thoughthat the revenue department had not established the existence of anagency relationship between Bloomingdale’s department stores andBloomingdale’s By Mail. The Supreme Court declined review of this case.11
10In response to the Department of Revenue’s argument that catalog purchasers had been allowed toreturn merchandise directly to the local department store, the court found that such returns appearedto be “an aberration from normal practice,” so it did not reach a conclusion as to whether nexus couldhave been established if such returns had been a regular practice.
11Writ of certiorari denied, Pennsylvania Department of Revenue v. Bloomingdale’s By Mail, 504 U.S.955 (1992).

Appendix III
General Sales Tax Provisions
Page 44 GAO/GGD/OCE-00-165 Sales Taxes on e-Commerce
Figure III.1: Sales and Use Tax Treatment of Selected Goods That Can Be Sold by Remote Sellers, 1999
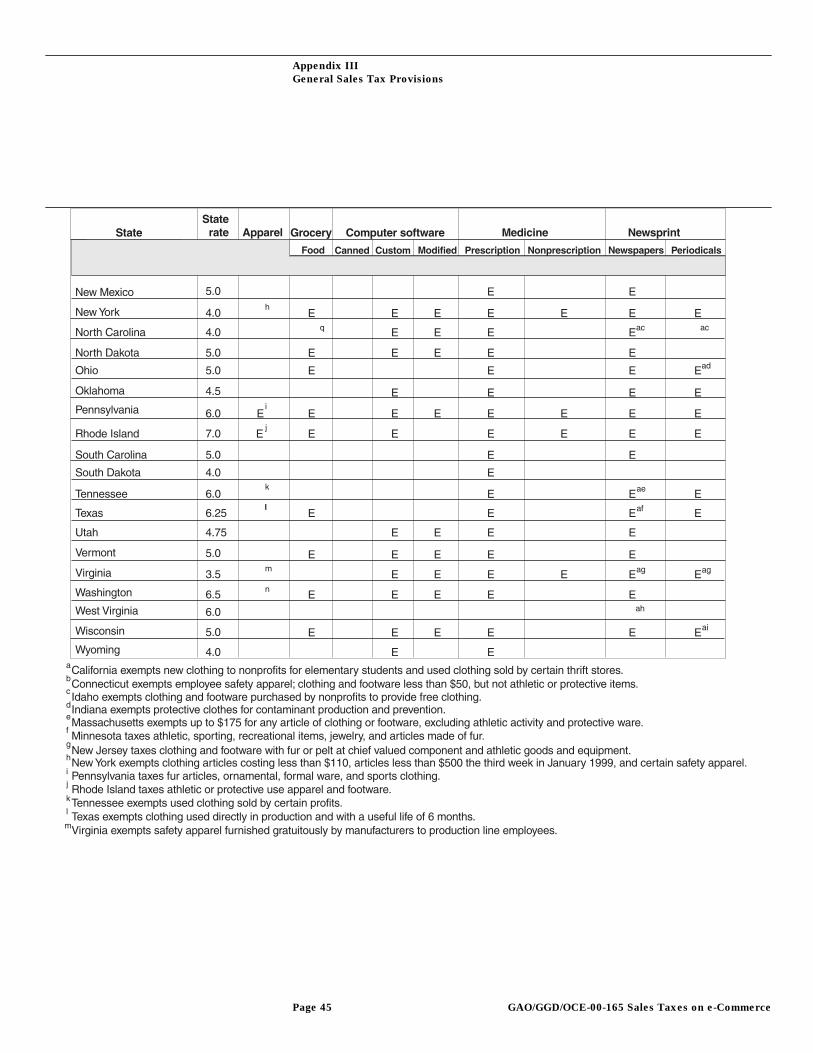
Appendix III
General Sales Tax Provisions
Page 45 GAO/GGD/OCE-00-165 Sales Taxes on e-Commerce
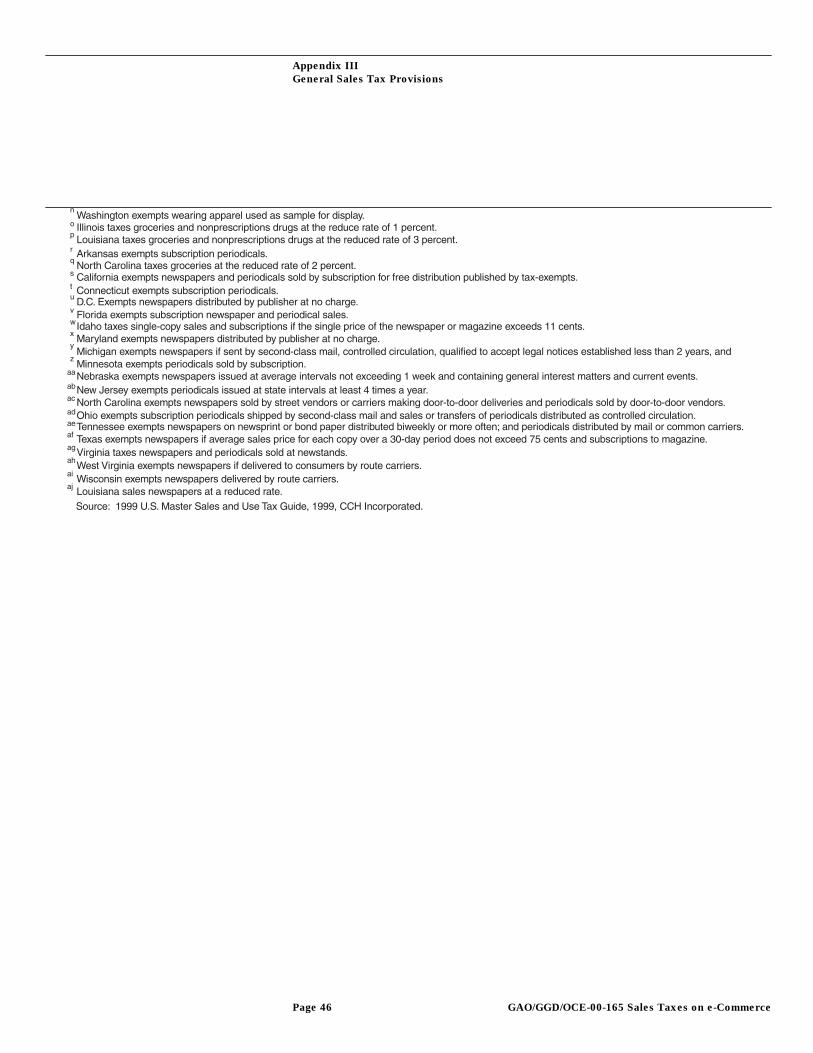
Appendix III
General Sales Tax Provisions
Page 46 GAO/GGD/OCE-00-165 Sales Taxes on e-Commerce
Appendix III
General Sales Tax Provisions
Page 47 GAO/GGD/OCE-00-165 Sales Taxes on e-Commerce
Sales tax programs vary state-by-state in the treatment of goods andservices sold to customers in their jurisdictions. Generally, state and localgovernments tax the sale of goods unless the state specifically exempts thesale. On the other hand, sales of services are generally untaxed unless thestate specifically includes these sales in its tax base. Tables III.1 and III.2show the variance in tax treatment for some goods and services that canbe sold by remote sellers. The general sales tax rates also vary by stateand by local jurisdiction. The combined state and local sales tax rate canvary for certain jurisdictions within the same state. Table III.3 shows thestate general sales tax rate for states with sales tax programs and the ratesfor some of the larger cities in these states. Four states—Delaware,Oregon, New Hampshire, and Montana—do not have general sales taxprogram. Alaska has no state sales tax program, but local jurisdictions mayimpose sales and use taxes.
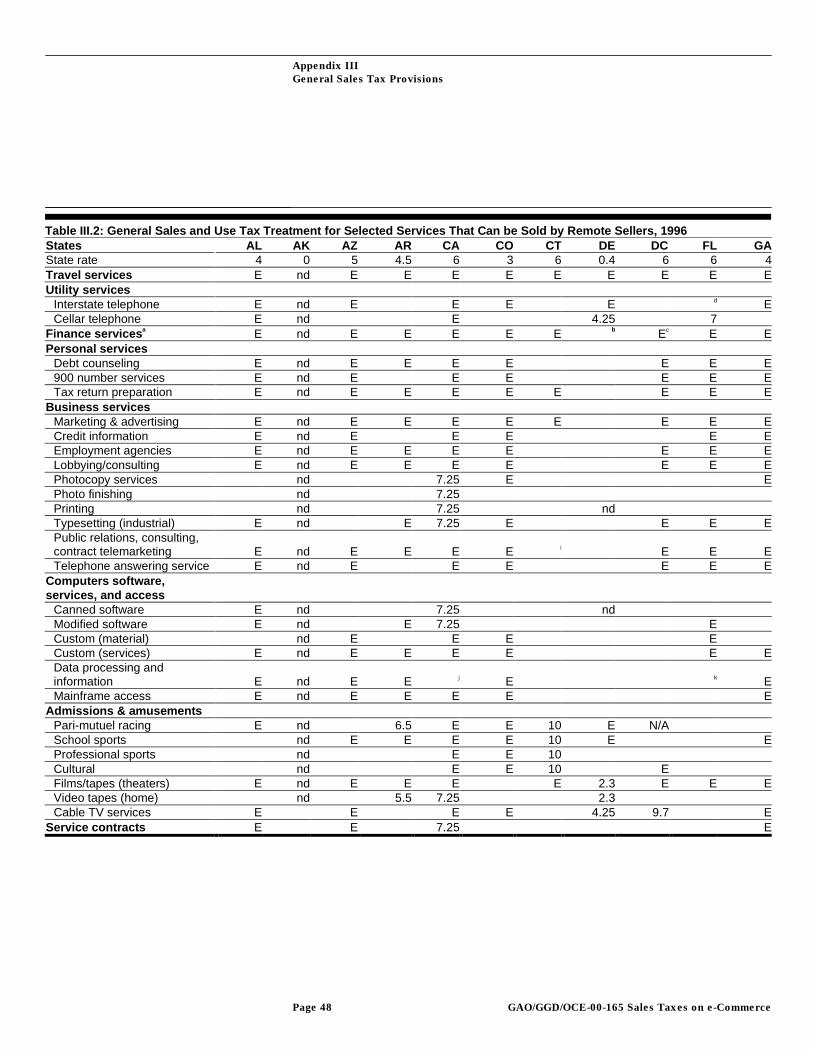
Appendix III
General Sales Tax Provisions
Page 48 GAO/GGD/OCE-00-165 Sales Taxes on e-Commerce
States AL AK AZ AR CA CO CT DE DC FL GAState rate 4 0 5 4.5 6 3 6 0.4 6 6 4Travel services E nd E E E E E E E E EUtility services
Interstate telephone E nd E E E E d ECellar telephone E nd E 4.25 7
Finance services a E nd E E E E E b Ec E EPersonal services
Debt counseling E nd E E E E E E E900 number services E nd E E E E E ETax return preparation E nd E E E E E E E E
Business servicesMarketing & advertising E nd E E E E E E E ECredit information E nd E E E E EEmployment agencies E nd E E E E E E ELobbying/consulting E nd E E E E E E EPhotocopy services nd 7.25 E EPhoto finishing nd 7.25Printing nd 7.25 ndTypesetting (industrial) E nd E 7.25 E E E EPublic relations, consulting,contract telemarketing E nd E E E E i E E ETelephone answering service E nd E E E E E E
Computers software,services, and access
Canned software E nd 7.25 ndModified software E nd E 7.25 ECustom (material) nd E E E ECustom (services) E nd E E E E E EData processing andinformation E nd E E j E k EMainframe access E nd E E E E E
Admissions & amusementsPari-mutuel racing E nd 6.5 E E 10 E N/ASchool sports nd E E E E 10 E EProfessional sports nd E E 10Cultural nd E E 10 EFilms/tapes (theaters) E nd E E E E 2.3 E E EVideo tapes (home) nd 5.5 7.25 2.3Cable TV services E E E E 4.25 9.7 E
Service contracts E E 7.25 E
Table III.2: General Sales and Use Tax Treatment for Selected Services That Can be Sold by Remote Sellers, 1996
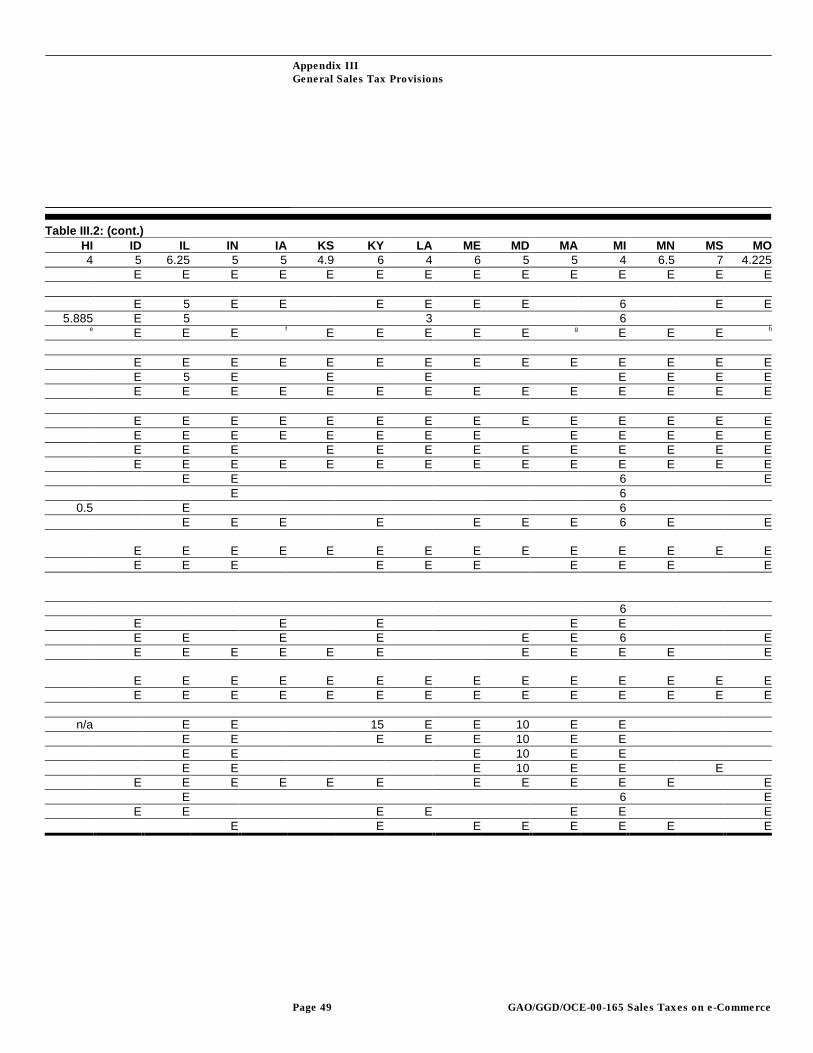
Appendix III
General Sales Tax Provisions
Page 49 GAO/GGD/OCE-00-165 Sales Taxes on e-Commerce
HI ID IL IN IA KS KY LA ME MD MA MI MN MS MO4 5 6.25 5 5 4.9 6 4 6 5 5 4 6.5 7 4.225
E E E E E E E E E E E E E E
E 5 E E E E E E 6 E E5.885 E 5 3 6
e E E E f E E E E E g E E E h
E E E E E E E E E E E E E EE 5 E E E E E E EE E E E E E E E E E E E E E
E E E E E E E E E E E E E EE E E E E E E E E E E E EE E E E E E E E E E E E EE E E E E E E E E E E E E E
E E 6 EE 6
0.5 E 6E E E E E E E 6 E E
E E E E E E E E E E E E E EE E E E E E E E E E
6E E E E EE E E E E E 6 EE E E E E E E E E E E
E E E E E E E E E E E E E EE E E E E E E E E E E E E E
n/a E E 15 E E 10 E EE E E E E 10 E EE E E 10 E EE E E 10 E E E
E E E E E E E E E E E EE 6 E
E E E E E E EE E E E E E E E
Table III.2: (cont.)

Appendix III
General Sales Tax Provisions
Page 50 GAO/GGD/OCE-00-165 Sales Taxes on e-Commerce
States MT NE NV NH NJ NM NY NC ND OH OKState rate 0 5 6.5 0 6 5 4 4 5 5 4.5Travel services nd E E nd E E E E E E EUtility services
Interstate telephone E E E 6 4.25 E ECellar telephone 1.8 E 6 3 nd
Finance services a E E nd E m E E E E EPersonal services
Debt counseling nd E E nd E E E E E E900 number services nd E 6 E ETax return preparation nd E E nd E E E E E E
Business servicesMarketing & advertising nd E E nd E n E E E E ECredit information nd E E nd E E E E EEmployment agencies nd E E nd E E E E ELobbying/consulting nd E E nd E E E E E EPhotocopy services nd ndPhoto finishing nd ndPrinting nd ndTypesetting (industrial) nd E nd E E E E E EPublic relations, consulting,contract telemarketing nd E E nd E E E E E ETelephone answering service nd E E nd E E E E
Computers software, services,and access
Canned software nd ndModified software nd E nd E ECustom (material) nd E nd E E E ECustom (services) nd E nd E E E E E EData processing andinformation nd E E nd E E EMainframe access nd E E nd E E nd E E E
Admissions & amusementsPari-mutuel racing 1 E nd E E 3 E 14.5School sports nd E nd 3 E EProfessional sports 5 E nd 3 ECultural nd E nd E 3 EFilms/tapes (theaters) E E E nd E E E E E EVideo tapes (home) E ndCable TV services nd E nd E E E E E E
Service contracts nd E nd E E E
Table III.2: (cont.)

Appendix III
General Sales Tax Provisions
Page 51 GAO/GGD/OCE-00-165 Sales Taxes on e-Commerce
OR PA RI SC SD TN TX UT VT VA WA WV WI WY0 6 7 5 4 6 6.25 5 5 4.5 6.5 6 5 4
na E E E E E E E E E 0.287 E Enana E E E E E E Ena o p E E E Ena E E E q E r E E E s Et E Enana E E E E E E E E 2 E Ena 10 E E E 2 E Ena E E E E E E E E 2 E Enana E E E u E E E E E 2 E E Ena E E E E E E Ena E E E E E E E 1.829 E Ena E E E E E E E 2 E E Ena 4.875na E 4.875 Ena 4.875na E E E E 2 E
na E E E E E E E E v E Ena E E E E 1.829 E E
nana 4.875na E E Ena E E Ena E E E E 2 E E E
na E w E E E E 2 Ex E Ena E E E E E 2 E E Enana E E 4.875 E 1.829na E E E E 4.875 E E 2na E E E 4.875 E 2na E E 4.875 Ena E E E E E E E E 2 E E Ena 4.875 4.5na E E E 1.829 Ena E 4.875 E E
Note 1: The space is blank if the jurisdiction taxes the sale at the general rate.
Note 2: Exempt indicated by “E.”
No data available indicated by “nd.”
Not applicable indicated by “na.”aFinancial services include service charges of banking institutions, insurance services, investmentcounseling, loan broker fees, and ticker tape financial reporting.
Table III.2: (cont.)
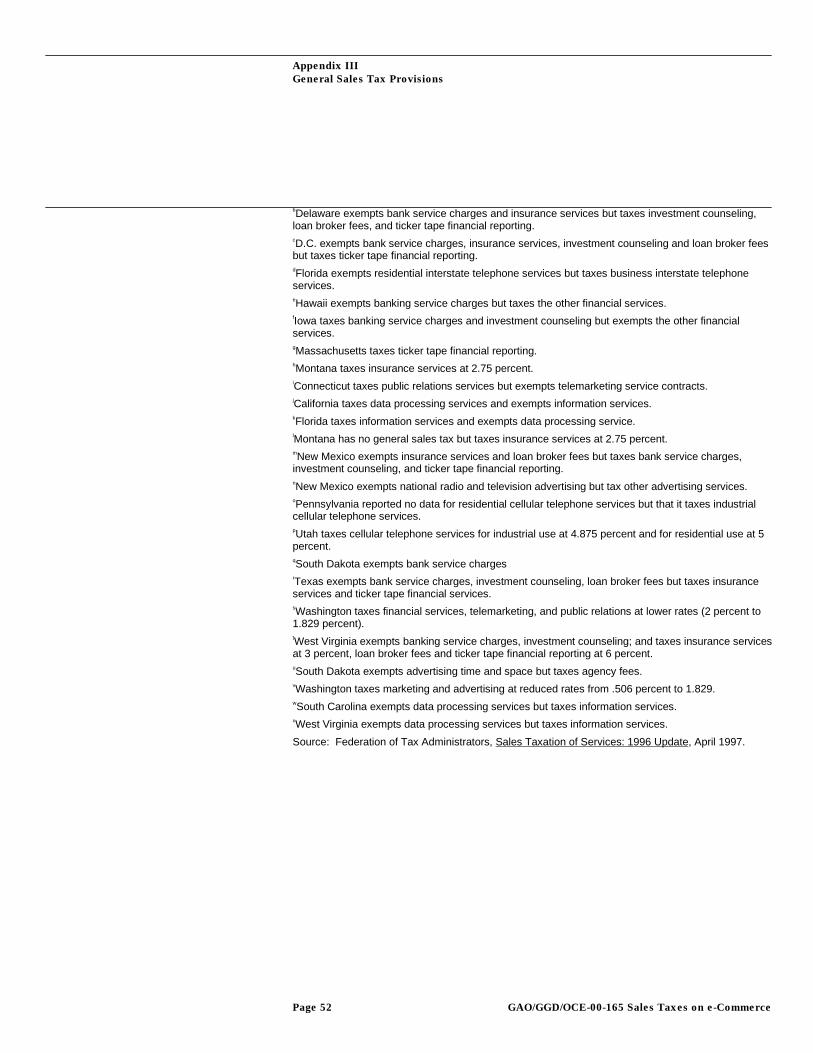
Appendix III
General Sales Tax Provisions
Page 52 GAO/GGD/OCE-00-165 Sales Taxes on e-Commerce
bDelaware exempts bank service charges and insurance services but taxes investment counseling,loan broker fees, and ticker tape financial reporting.cD.C. exempts bank service charges, insurance services, investment counseling and loan broker feesbut taxes ticker tape financial reporting.dFlorida exempts residential interstate telephone services but taxes business interstate telephoneservices.eHawaii exempts banking service charges but taxes the other financial services.fIowa taxes banking service charges and investment counseling but exempts the other financialservices.gMassachusetts taxes ticker tape financial reporting.hMontana taxes insurance services at 2.75 percent.iConnecticut taxes public relations services but exempts telemarketing service contracts.jCalifornia taxes data processing services and exempts information services.kFlorida taxes information services and exempts data processing service.lMontana has no general sales tax but taxes insurance services at 2.75 percent.mNew Mexico exempts insurance services and loan broker fees but taxes bank service charges,investment counseling, and ticker tape financial reporting.nNew Mexico exempts national radio and television advertising but tax other advertising services.oPennsylvania reported no data for residential cellular telephone services but that it taxes industrialcellular telephone services.pUtah taxes cellular telephone services for industrial use at 4.875 percent and for residential use at 5percent.qSouth Dakota exempts bank service chargesrTexas exempts bank service charges, investment counseling, loan broker fees but taxes insuranceservices and ticker tape financial services.sWashington taxes financial services, telemarketing, and public relations at lower rates (2 percent to1.829 percent).tWest Virginia exempts banking service charges, investment counseling; and taxes insurance servicesat 3 percent, loan broker fees and ticker tape financial reporting at 6 percent.uSouth Dakota exempts advertising time and space but taxes agency fees.vWashington taxes marketing and advertising at reduced rates from .506 percent to 1.829.wSouth Carolina exempts data processing services but taxes information services.xWest Virginia exempts data processing services but taxes information services.
Source: Federation of Tax Administrators, Sales Taxation of Services: 1996 Update, April 1997.
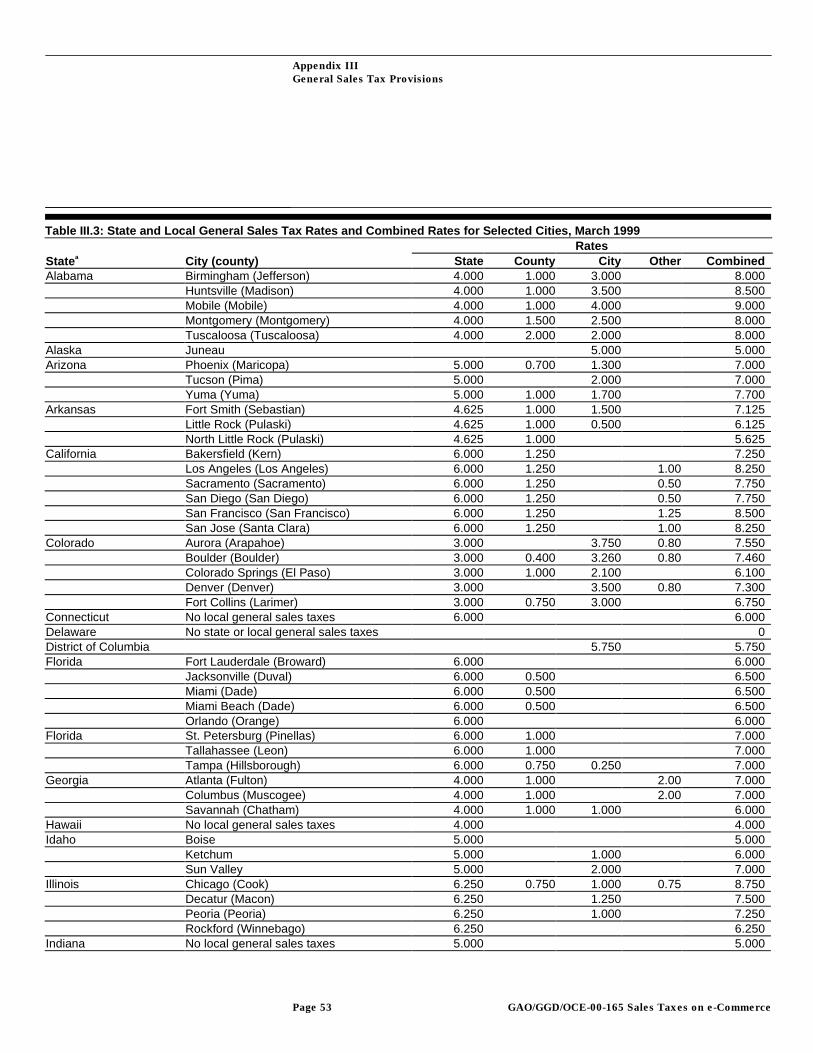
Appendix III
General Sales Tax Provisions
Page 53 GAO/GGD/OCE-00-165 Sales Taxes on e-Commerce
RatesState a City (county) State County City Other CombinedAlabama Birmingham (Jefferson) 4.000 1.000 3.000 8.000
Huntsville (Madison) 4.000 1.000 3.500 8.500Mobile (Mobile) 4.000 1.000 4.000 9.000Montgomery (Montgomery) 4.000 1.500 2.500 8.000Tuscaloosa (Tuscaloosa) 4.000 2.000 2.000 8.000
Alaska Juneau 5.000 5.000Arizona Phoenix (Maricopa) 5.000 0.700 1.300 7.000
Tucson (Pima) 5.000 2.000 7.000Yuma (Yuma) 5.000 1.000 1.700 7.700
Arkansas Fort Smith (Sebastian) 4.625 1.000 1.500 7.125Little Rock (Pulaski) 4.625 1.000 0.500 6.125North Little Rock (Pulaski) 4.625 1.000 5.625
California Bakersfield (Kern) 6.000 1.250 7.250Los Angeles (Los Angeles) 6.000 1.250 1.00 8.250Sacramento (Sacramento) 6.000 1.250 0.50 7.750San Diego (San Diego) 6.000 1.250 0.50 7.750San Francisco (San Francisco) 6.000 1.250 1.25 8.500San Jose (Santa Clara) 6.000 1.250 1.00 8.250
Colorado Aurora (Arapahoe) 3.000 3.750 0.80 7.550Boulder (Boulder) 3.000 0.400 3.260 0.80 7.460Colorado Springs (El Paso) 3.000 1.000 2.100 6.100Denver (Denver) 3.000 3.500 0.80 7.300Fort Collins (Larimer) 3.000 0.750 3.000 6.750
Connecticut No local general sales taxes 6.000 6.000Delaware No state or local general sales taxes 0District of Columbia 5.750 5.750Florida Fort Lauderdale (Broward) 6.000 6.000
Jacksonville (Duval) 6.000 0.500 6.500Miami (Dade) 6.000 0.500 6.500Miami Beach (Dade) 6.000 0.500 6.500Orlando (Orange) 6.000 6.000
Florida St. Petersburg (Pinellas) 6.000 1.000 7.000Tallahassee (Leon) 6.000 1.000 7.000Tampa (Hillsborough) 6.000 0.750 0.250 7.000
Georgia Atlanta (Fulton) 4.000 1.000 2.00 7.000Columbus (Muscogee) 4.000 1.000 2.00 7.000Savannah (Chatham) 4.000 1.000 1.000 6.000
Hawaii No local general sales taxes 4.000 4.000Idaho Boise 5.000 5.000
Ketchum 5.000 1.000 6.000Sun Valley 5.000 2.000 7.000
Illinois Chicago (Cook) 6.250 0.750 1.000 0.75 8.750Decatur (Macon) 6.250 1.250 7.500Peoria (Peoria) 6.250 1.000 7.250Rockford (Winnebago) 6.250 6.250
Indiana No local general sales taxes 5.000 5.000
Table III.3: State and Local General Sales Tax Rates and Combined Rates for Selected Cities, March 1999

Appendix III
General Sales Tax Provisions
Page 54 GAO/GGD/OCE-00-165 Sales Taxes on e-Commerce
RatesState a City (county) State County City Other CombinedIowa Cedar Rapids (Linn) 5.000 5.000
Davenport (Scott) 5.000 1.000 6.000Des Moines (Polk) 5.000 5.000Dubuque (Dubuque) 5.000 1.000 6.000
Kansas Kansas City (Wyandotte) 4.900 1.000 1.000 6.900Topeka (Shawnee) 4.900 0.250 1.000 6.150Wichita (Sedgwick) 4.900 1.000 5.900
Kentucky No local general sales taxes 6.000 6.000Louisiana Baton Rouge (East Baton Rouge) 4.000 4.940 8.940
Monroe (Ouachita) 4.000 4.500 8.500New Orleans (Orleans) 4.000 5.000 9.000Shreveport (Caddo) 4.000 4.250 8.250
Maine No local general sales taxes 5.500 5.500Maryland No local general sales taxes 5.000 5.000Massachusetts No local general sales taxes 5.000 5.000Michigan No local general sales taxes 6.000 6.000Minnesota Duluth (St. Louis) 6.500 1.000 7.500
Minneapolis (Hennepin) 6.500 0.500 7.000Rochester (Olmsted) 6.500 0.500 7.000St. Paul (Ramsey) 6.500 0.500 7.000
Mississippi No local general sales taxes 7.000 7.000Missouri Independence (Jackson) 4.225 0.875 1.000 6.100
Kansas City (Jackson) 4.225 0.875 1.500 0.50 7.100St. Louis 4.225 1.875 0.75 6.850Springfield (Greene) 4.225 0.875 1.250 0.125 6.475
Montana No state or local general sales taxes 0Nebraska Lincoln (Lancaster) 5.000 1.500 6.500
Omaha (Douglas) 5.000 1.500 6.500Nevada Las Vegas (Clark) 6.500 0.500 7.000
Reno (Washoe) 6.500 0.500 7.000New Hampshire No state or local general sales taxes 0New Jersey No local general sales taxes 6.000 6.000New Mexico Albuquerque (Bernalillo) 5.000 0.250 0.813 5.563New Mexico Santa Fe (Santa Fe) 5.000 0.375 1.438 6.313New York Albany (Albany) 4.000 4.000 8.000
Buffalo (Erie) 4.000 4.000 8.000New York 4.000 4.000 0.25 8.250Rochester (Monroe) 4.000 4.000 8.000Syracuse (Onondaga) 4.000 3.000 7.000Yonkers (Westchester) 4.000 1.500 2.500 0.25 8.250
North Carolina Charlotte (Mecklenburg) 4.000 2.000 6.000Durham (Durham) 4.000 2.000 6.000Raleigh (Wake) 4.000 2.000 6.000Winston-Salem (Forsyth) 4.000 2.000 6.000
North Dakota Fargo (Cass) 5.000 5.000Ohio Akron (Summit) 5.000 0.750 5.750
Cincinnati (Hamilton) 5.000 1.000 6.000Cleveland (Cuyahoga) 5.000 2.000 7.000
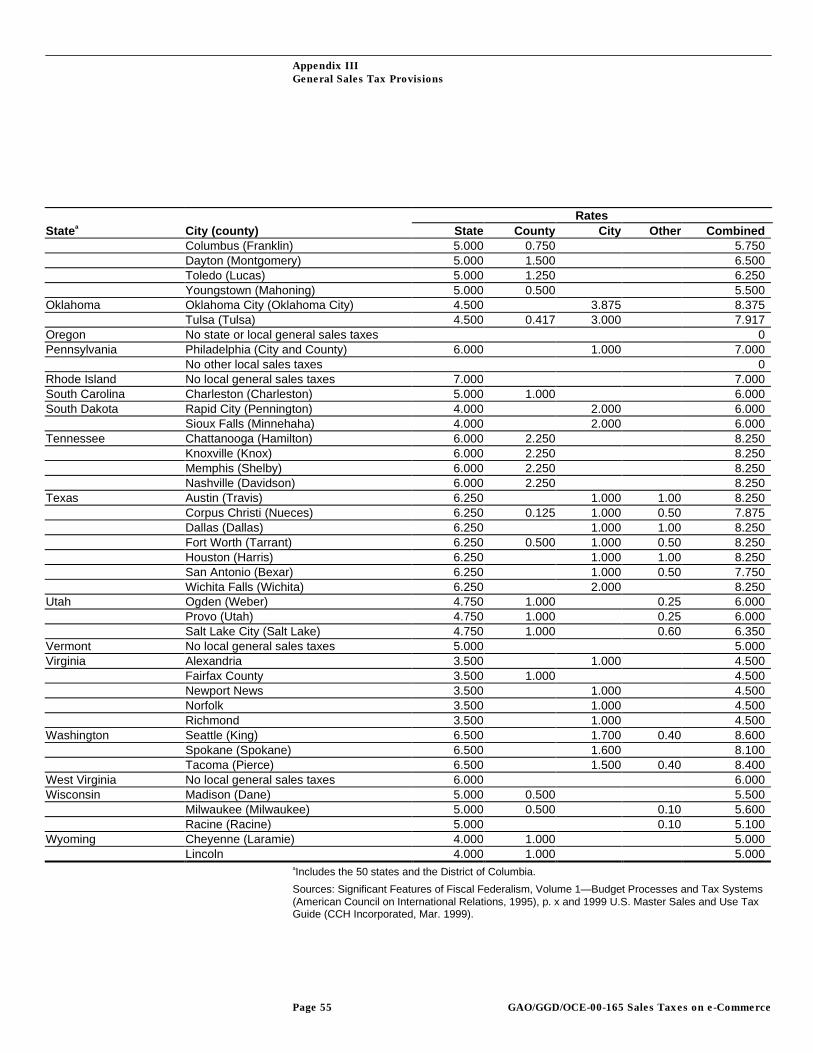
Appendix III
General Sales Tax Provisions
Page 55 GAO/GGD/OCE-00-165 Sales Taxes on e-Commerce
RatesState a City (county) State County City Other Combined
Columbus (Franklin) 5.000 0.750 5.750Dayton (Montgomery) 5.000 1.500 6.500Toledo (Lucas) 5.000 1.250 6.250Youngstown (Mahoning) 5.000 0.500 5.500
Oklahoma Oklahoma City (Oklahoma City) 4.500 3.875 8.375Tulsa (Tulsa) 4.500 0.417 3.000 7.917
Oregon No state or local general sales taxes 0Pennsylvania Philadelphia (City and County) 6.000 1.000 7.000
No other local sales taxes 0Rhode Island No local general sales taxes 7.000 7.000South Carolina Charleston (Charleston) 5.000 1.000 6.000South Dakota Rapid City (Pennington) 4.000 2.000 6.000
Sioux Falls (Minnehaha) 4.000 2.000 6.000Tennessee Chattanooga (Hamilton) 6.000 2.250 8.250
Knoxville (Knox) 6.000 2.250 8.250Memphis (Shelby) 6.000 2.250 8.250Nashville (Davidson) 6.000 2.250 8.250
Texas Austin (Travis) 6.250 1.000 1.00 8.250Corpus Christi (Nueces) 6.250 0.125 1.000 0.50 7.875Dallas (Dallas) 6.250 1.000 1.00 8.250Fort Worth (Tarrant) 6.250 0.500 1.000 0.50 8.250Houston (Harris) 6.250 1.000 1.00 8.250San Antonio (Bexar) 6.250 1.000 0.50 7.750Wichita Falls (Wichita) 6.250 2.000 8.250
Utah Ogden (Weber) 4.750 1.000 0.25 6.000Provo (Utah) 4.750 1.000 0.25 6.000Salt Lake City (Salt Lake) 4.750 1.000 0.60 6.350
Vermont No local general sales taxes 5.000 5.000Virginia Alexandria 3.500 1.000 4.500
Fairfax County 3.500 1.000 4.500Newport News 3.500 1.000 4.500Norfolk 3.500 1.000 4.500Richmond 3.500 1.000 4.500
Washington Seattle (King) 6.500 1.700 0.40 8.600Spokane (Spokane) 6.500 1.600 8.100Tacoma (Pierce) 6.500 1.500 0.40 8.400
West Virginia No local general sales taxes 6.000 6.000Wisconsin Madison (Dane) 5.000 0.500 5.500
Milwaukee (Milwaukee) 5.000 0.500 0.10 5.600Racine (Racine) 5.000 0.10 5.100
Wyoming Cheyenne (Laramie) 4.000 1.000 5.000Lincoln 4.000 1.000 5.000
aIncludes the 50 states and the District of Columbia.
Sources: Significant Features of Fiscal Federalism, Volume 1—Budget Processes and Tax Systems(American Council on International Relations, 1995), p. x and 1999 U.S. Master Sales and Use TaxGuide (CCH Incorporated, Mar. 1999).
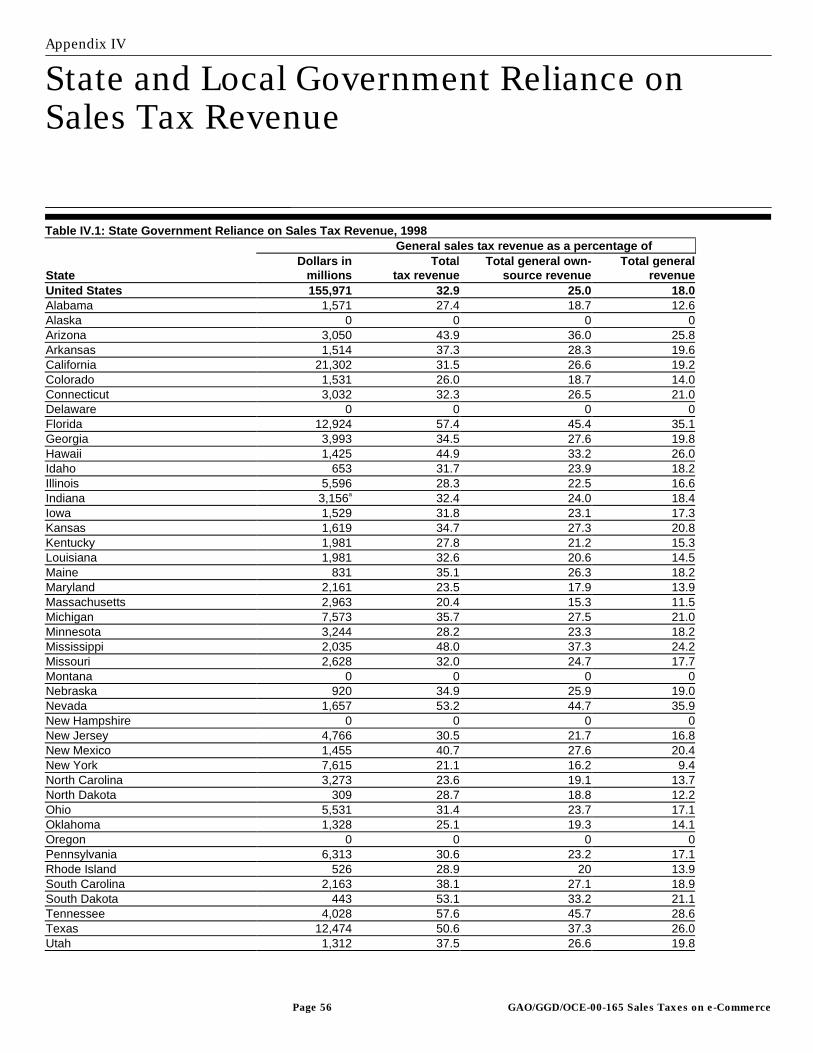
Appendix IV
State and Local Government Reliance onSales Tax Revenue
Page 56 GAO/GGD/OCE-00-165 Sales Taxes on e-Commerce
General sales tax revenue as a percentage of
StateDollars in
millionsTotal
tax revenueTotal general own-
source revenueTotal general
revenueUnited States 155,971 32.9 25.0 18.0Alabama 1,571 27.4 18.7 12.6Alaska 0 0 0 0Arizona 3,050 43.9 36.0 25.8Arkansas 1,514 37.3 28.3 19.6California 21,302 31.5 26.6 19.2Colorado 1,531 26.0 18.7 14.0Connecticut 3,032 32.3 26.5 21.0Delaware 0 0 0 0Florida 12,924 57.4 45.4 35.1Georgia 3,993 34.5 27.6 19.8Hawaii 1,425 44.9 33.2 26.0Idaho 653 31.7 23.9 18.2Illinois 5,596 28.3 22.5 16.6Indiana 3,156a 32.4 24.0 18.4Iowa 1,529 31.8 23.1 17.3Kansas 1,619 34.7 27.3 20.8Kentucky 1,981 27.8 21.2 15.3Louisiana 1,981 32.6 20.6 14.5Maine 831 35.1 26.3 18.2Maryland 2,161 23.5 17.9 13.9Massachusetts 2,963 20.4 15.3 11.5Michigan 7,573 35.7 27.5 21.0Minnesota 3,244 28.2 23.3 18.2Mississippi 2,035 48.0 37.3 24.2Missouri 2,628 32.0 24.7 17.7Montana 0 0 0 0Nebraska 920 34.9 25.9 19.0Nevada 1,657 53.2 44.7 35.9New Hampshire 0 0 0 0New Jersey 4,766 30.5 21.7 16.8New Mexico 1,455 40.7 27.6 20.4New York 7,615 21.1 16.2 9.4North Carolina 3,273 23.6 19.1 13.7North Dakota 309 28.7 18.8 12.2Ohio 5,531 31.4 23.7 17.1Oklahoma 1,328 25.1 19.3 14.1Oregon 0 0 0 0Pennsylvania 6,313 30.6 23.2 17.1Rhode Island 526 28.9 20 13.9South Carolina 2,163 38.1 27.1 18.9South Dakota 443 53.1 33.2 21.1Tennessee 4,028 57.6 45.7 28.6Texas 12,474 50.6 37.3 26.0Utah 1,312 37.5 26.6 19.8
Table IV.1: State Government Reliance on Sales Tax Revenue, 1998
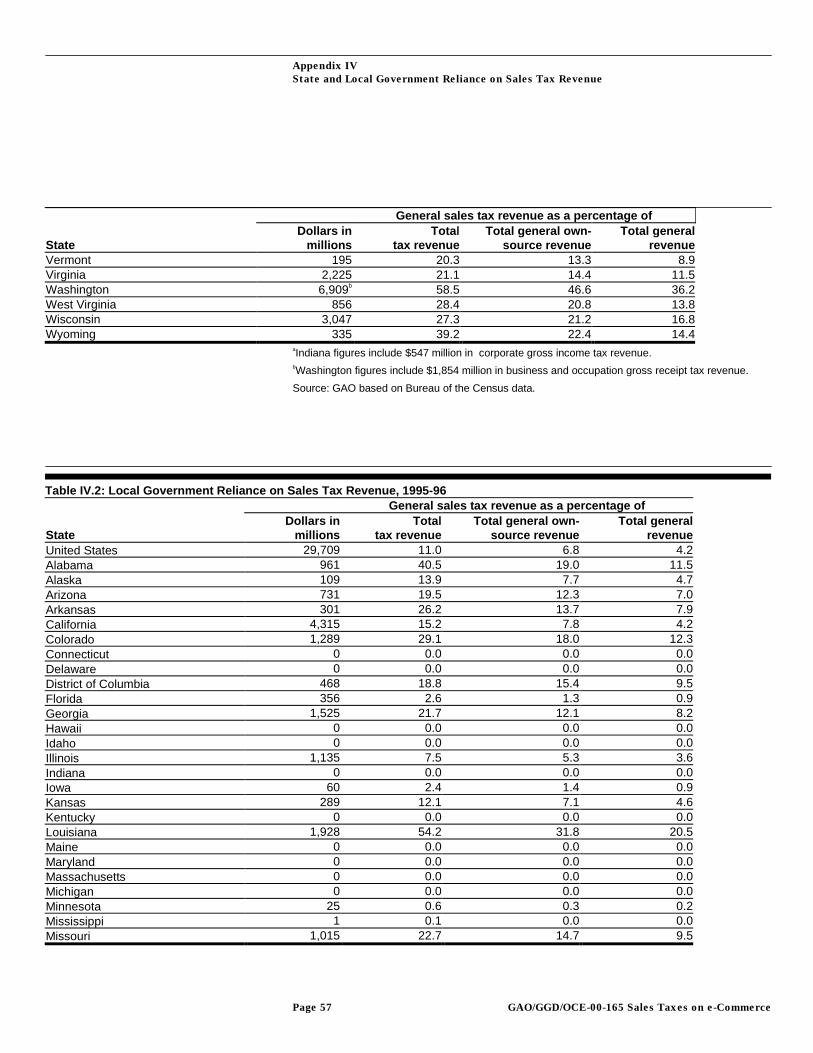
Appendix IV
State and Local Government Reliance on Sales Tax Revenue
Page 57 GAO/GGD/OCE-00-165 Sales Taxes on e-Commerce
General sales tax revenue as a percentage of
StateDollars in
millionsTotal
tax revenueTotal general own-
source revenueTotal general
revenueVermont 195 20.3 13.3 8.9Virginia 2,225 21.1 14.4 11.5Washington 6,909b 58.5 46.6 36.2West Virginia 856 28.4 20.8 13.8Wisconsin 3,047 27.3 21.2 16.8Wyoming 335 39.2 22.4 14.4
aIndiana figures include $547 million in corporate gross income tax revenue.bWashington figures include $1,854 million in business and occupation gross receipt tax revenue.
Source: GAO based on Bureau of the Census data.
General sales tax revenue as a percentage of
StateDollars in
millionsTotal
tax revenueTotal general own-
source revenueTotal general
revenueUnited States 29,709 11.0 6.8 4.2Alabama 961 40.5 19.0 11.5Alaska 109 13.9 7.7 4.7Arizona 731 19.5 12.3 7.0Arkansas 301 26.2 13.7 7.9California 4,315 15.2 7.8 4.2Colorado 1,289 29.1 18.0 12.3Connecticut 0 0.0 0.0 0.0Delaware 0 0.0 0.0 0.0District of Columbia 468 18.8 15.4 9.5Florida 356 2.6 1.3 0.9Georgia 1,525 21.7 12.1 8.2Hawaii 0 0.0 0.0 0.0Idaho 0 0.0 0.0 0.0Illinois 1,135 7.5 5.3 3.6Indiana 0 0.0 0.0 0.0Iowa 60 2.4 1.4 0.9Kansas 289 12.1 7.1 4.6Kentucky 0 0.0 0.0 0.0Louisiana 1,928 54.2 31.8 20.5Maine 0 0.0 0.0 0.0Maryland 0 0.0 0.0 0.0Massachusetts 0 0.0 0.0 0.0Michigan 0 0.0 0.0 0.0Minnesota 25 0.6 0.3 0.2Mississippi 1 0.1 0.0 0.0Missouri 1,015 22.7 14.7 9.5
Table IV.2: Local Government Reliance on Sales Tax Revenue, 1995-96
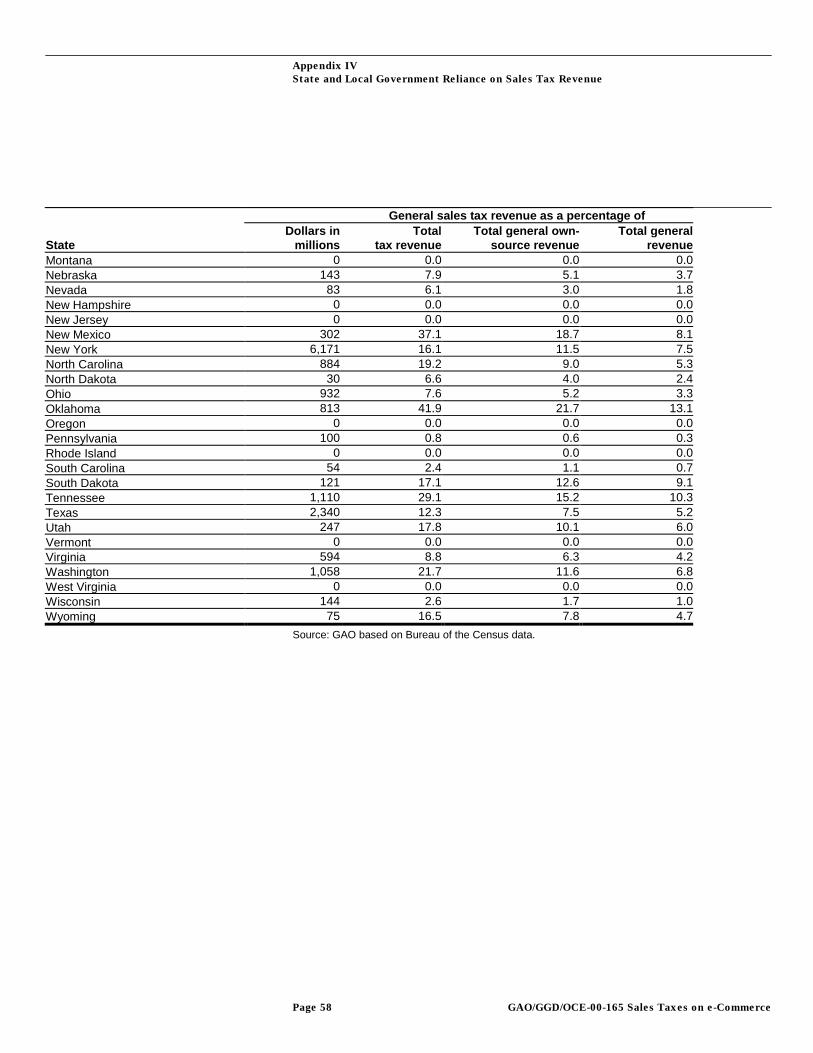
Appendix IV
State and Local Government Reliance on Sales Tax Revenue
Page 58 GAO/GGD/OCE-00-165 Sales Taxes on e-Commerce
General sales tax revenue as a percentage of
StateDollars in
millionsTotal
tax revenueTotal general own-
source revenueTotal general
revenueMontana 0 0.0 0.0 0.0Nebraska 143 7.9 5.1 3.7Nevada 83 6.1 3.0 1.8New Hampshire 0 0.0 0.0 0.0New Jersey 0 0.0 0.0 0.0New Mexico 302 37.1 18.7 8.1New York 6,171 16.1 11.5 7.5North Carolina 884 19.2 9.0 5.3North Dakota 30 6.6 4.0 2.4Ohio 932 7.6 5.2 3.3Oklahoma 813 41.9 21.7 13.1Oregon 0 0.0 0.0 0.0Pennsylvania 100 0.8 0.6 0.3Rhode Island 0 0.0 0.0 0.0South Carolina 54 2.4 1.1 0.7South Dakota 121 17.1 12.6 9.1Tennessee 1,110 29.1 15.2 10.3Texas 2,340 12.3 7.5 5.2Utah 247 17.8 10.1 6.0Vermont 0 0.0 0.0 0.0Virginia 594 8.8 6.3 4.2Washington 1,058 21.7 11.6 6.8West Virginia 0 0.0 0.0 0.0Wisconsin 144 2.6 1.7 1.0Wyoming 75 16.5 7.8 4.7
Source: GAO based on Bureau of the Census data.
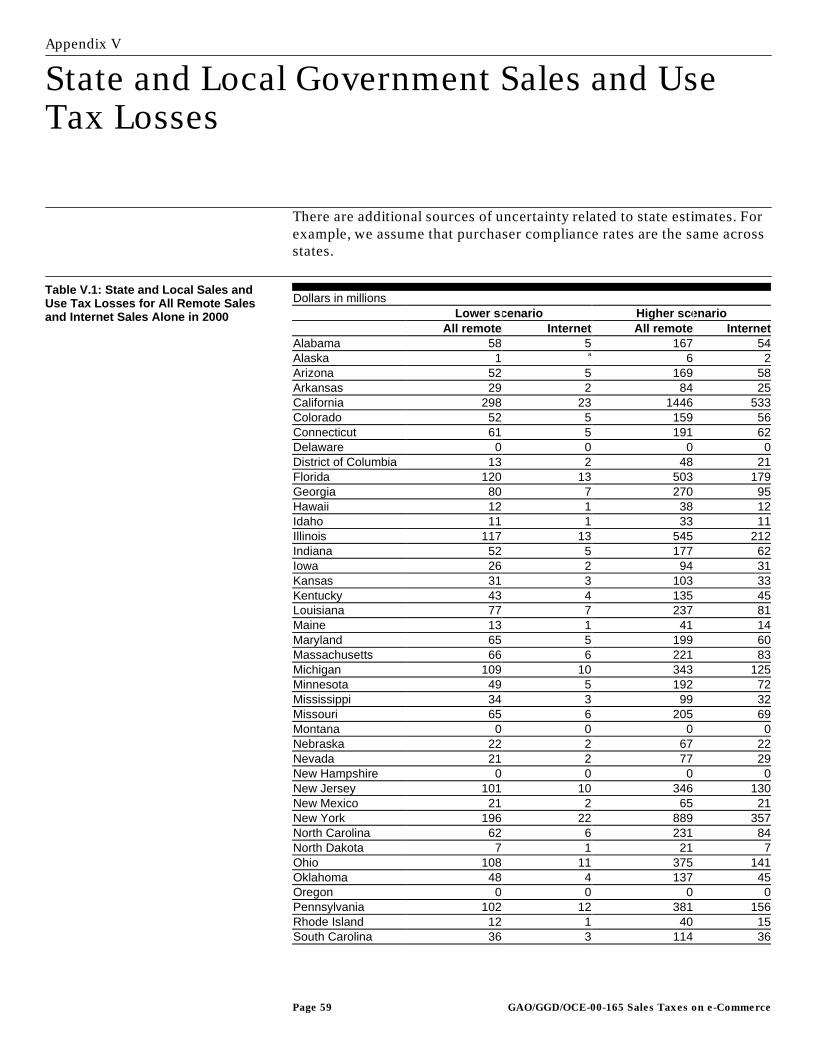
Appendix V
State and Local Government Sales and UseTax Losses
Page 59 GAO/GGD/OCE-00-165 Sales Taxes on e-Commerce
There are additional sources of uncertainty related to state estimates. Forexample, we assume that purchaser compliance rates are the same acrossstates.
Dollars in millionsLower scenario Higher scenario
All remote Internet All remote InternetAlabama 58 5 167 54Alaska 1 a 6 2Arizona 52 5 169 58Arkansas 29 2 84 25California 298 23 1446 533Colorado 52 5 159 56Connecticut 61 5 191 62Delaware 0 0 0 0District of Columbia 13 2 48 21Florida 120 13 503 179Georgia 80 7 270 95Hawaii 12 1 38 12Idaho 11 1 33 11Illinois 117 13 545 212Indiana 52 5 177 62Iowa 26 2 94 31Kansas 31 3 103 33Kentucky 43 4 135 45Louisiana 77 7 237 81Maine 13 1 41 14Maryland 65 5 199 60Massachusetts 66 6 221 83Michigan 109 10 343 125Minnesota 49 5 192 72Mississippi 34 3 99 32Missouri 65 6 205 69Montana 0 0 0 0Nebraska 22 2 67 22Nevada 21 2 77 29New Hampshire 0 0 0 0New Jersey 101 10 346 130New Mexico 21 2 65 21New York 196 22 889 357North Carolina 62 6 231 84North Dakota 7 1 21 7Ohio 108 11 375 141Oklahoma 48 4 137 45Oregon 0 0 0 0Pennsylvania 102 12 381 156Rhode Island 12 1 40 15South Carolina 36 3 114 36
Table V.1: State and Local Sales andUse Tax Losses for All Remote Salesand Internet Sales Alone in 2000
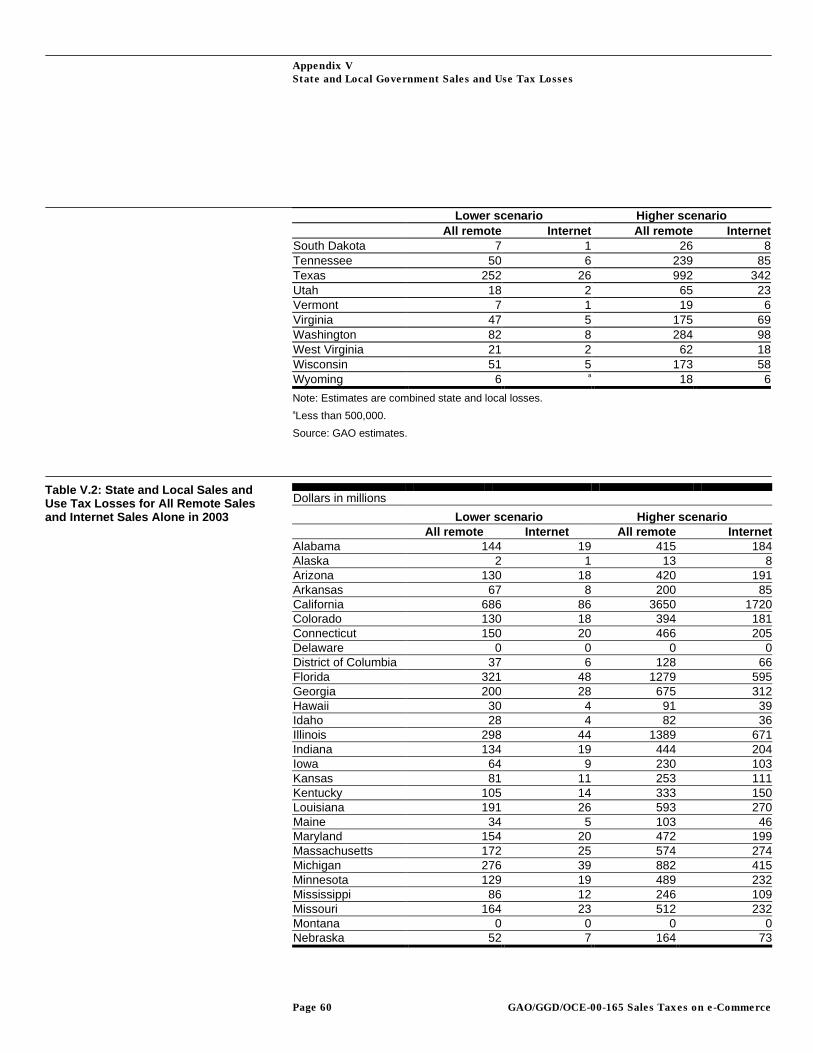
Appendix V
State and Local Government Sales and Use Tax Losses
Page 60 GAO/GGD/OCE-00-165 Sales Taxes on e-Commerce
Lower scenario Higher scenarioAll remote Internet All remote Internet
South Dakota 7 1 26 8Tennessee 50 6 239 85Texas 252 26 992 342Utah 18 2 65 23Vermont 7 1 19 6Virginia 47 5 175 69Washington 82 8 284 98West Virginia 21 2 62 18Wisconsin 51 5 173 58Wyoming 6 a 18 6
Note: Estimates are combined state and local losses.aLess than 500,000.
Source: GAO estimates.
Dollars in millions
Lower scenario Higher scenarioAll remote Internet All remote Internet
Alabama 144 19 415 184Alaska 2 1 13 8Arizona 130 18 420 191Arkansas 67 8 200 85California 686 86 3650 1720Colorado 130 18 394 181Connecticut 150 20 466 205Delaware 0 0 0 0District of Columbia 37 6 128 66Florida 321 48 1279 595Georgia 200 28 675 312Hawaii 30 4 91 39Idaho 28 4 82 36Illinois 298 44 1389 671Indiana 134 19 444 204Iowa 64 9 230 103Kansas 81 11 253 111Kentucky 105 14 333 150Louisiana 191 26 593 270Maine 34 5 103 46Maryland 154 20 472 199Massachusetts 172 25 574 274Michigan 276 39 882 415Minnesota 129 19 489 232Mississippi 86 12 246 109Missouri 164 23 512 232Montana 0 0 0 0Nebraska 52 7 164 73
Table V.2: State and Local Sales andUse Tax Losses for All Remote Salesand Internet Sales Alone in 2003

Appendix V
State and Local Government Sales and Use Tax Losses
Page 61 GAO/GGD/OCE-00-165 Sales Taxes on e-Commerce
Lower scenario Higher scenarioAll remote Internet All remote Internet
Nevada 57 8 199 95New Hampshire 0 0 0 0New Jersey 256 37 879 419New Mexico 51 7 158 70New York 521 81 2339 1,155North Carolina 166 25 593 279North Dakota 17 2 50 22Ohio 286 43 955 454Oklahoma 121 16 343 154Oregon 0 0 0 0Pennsylvania 281 45 1,012 505Rhode Island 30 5 101 48South Carolina 93 13 276 120South Dakota 19 3 62 27Tennessee 139 22 606 282Texas 655 96 2466 1125Utah 47 7 162 75Vermont 16 2 46 20Virginia 123 18 458 224Washington 213 30 712 326West Virginia 52 7 147 62Wisconsin 126 17 424 190Wyoming 14 2 45 21
Note: Estimates are combined state and local losses.
Source: GAO estimates.
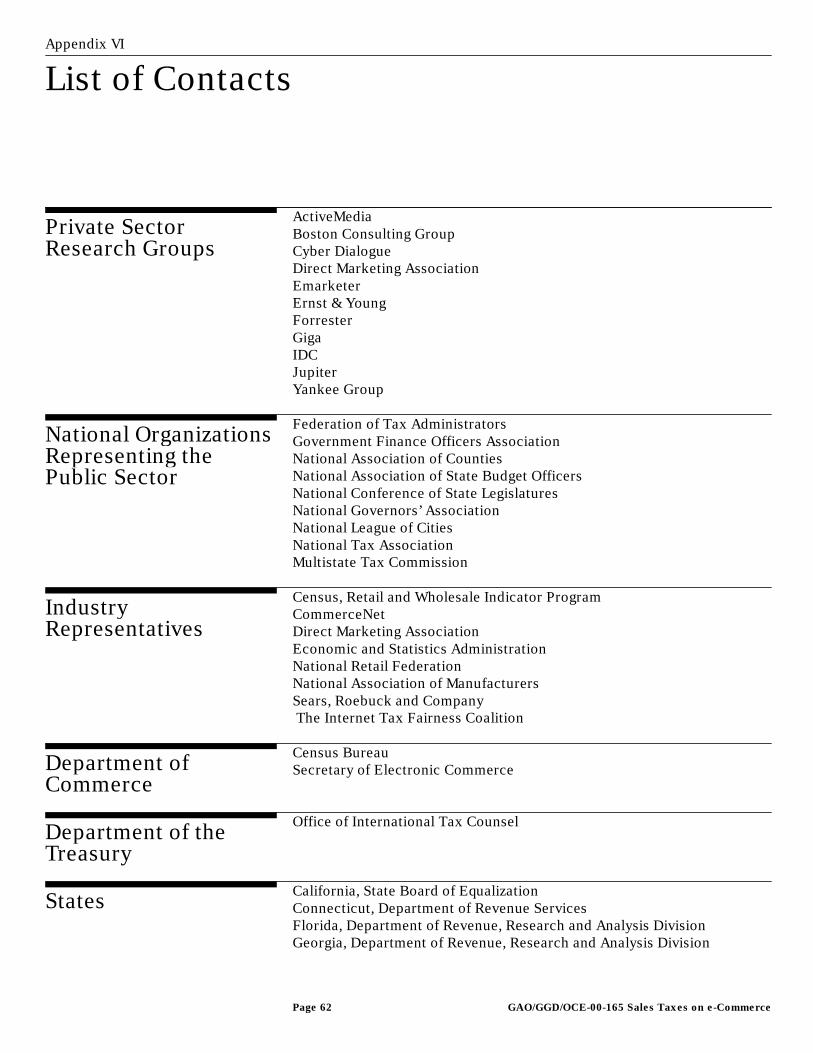
Appendix VI
List of Contacts
Page 62 GAO/GGD/OCE-00-165 Sales Taxes on e-Commerce
ActiveMediaBoston Consulting GroupCyber DialogueDirect Marketing AssociationEmarketerErnst & YoungForresterGigaIDCJupiterYankee Group
Federation of Tax AdministratorsGovernment Finance Officers AssociationNational Association of CountiesNational Association of State Budget OfficersNational Conference of State LegislaturesNational Governors’ AssociationNational League of CitiesNational Tax AssociationMultistate Tax Commission
Census, Retail and Wholesale Indicator ProgramCommerceNetDirect Marketing AssociationEconomic and Statistics AdministrationNational Retail FederationNational Association of ManufacturersSears, Roebuck and Company The Internet Tax Fairness Coalition
Census BureauSecretary of Electronic Commerce
Office of International Tax Counsel
California, State Board of EqualizationConnecticut, Department of Revenue ServicesFlorida, Department of Revenue, Research and Analysis DivisionGeorgia, Department of Revenue, Research and Analysis Division
Private SectorResearch Groups
National OrganizationsRepresenting thePublic Sector
IndustryRepresentatives
Department ofCommerce
Department of theTreasury
States
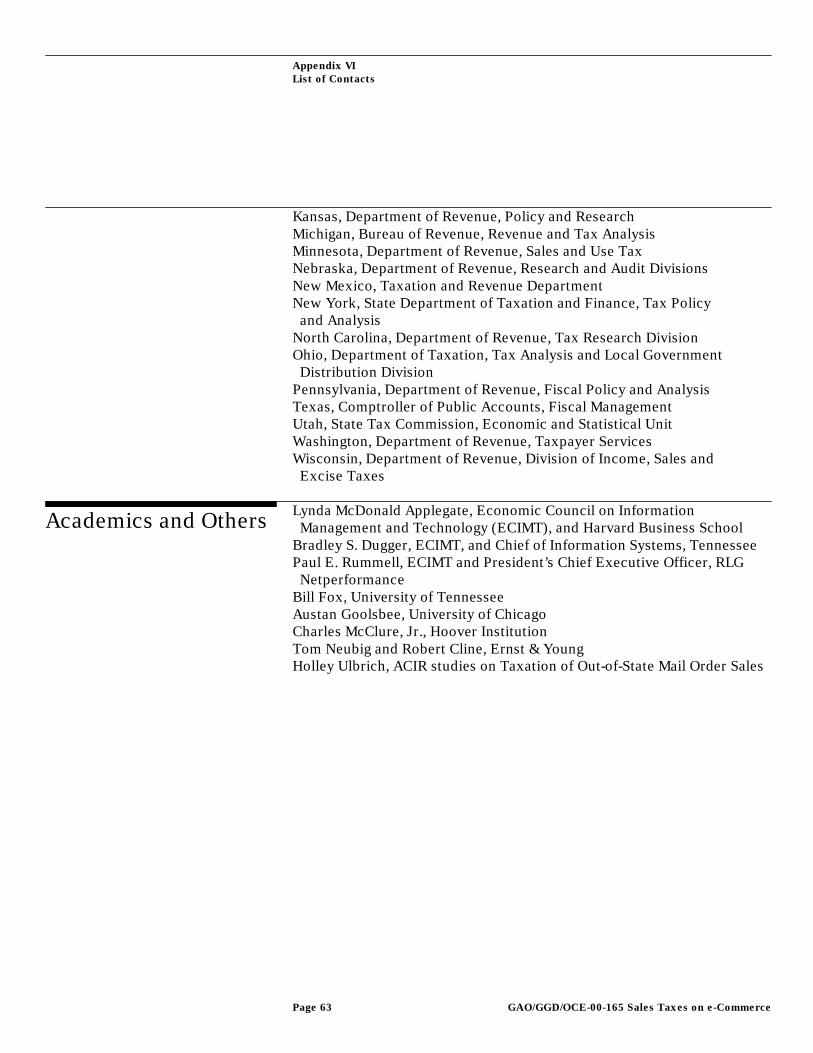
Appendix VI
List of Contacts
Page 63 GAO/GGD/OCE-00-165 Sales Taxes on e-Commerce
Kansas, Department of Revenue, Policy and ResearchMichigan, Bureau of Revenue, Revenue and Tax AnalysisMinnesota, Department of Revenue, Sales and Use TaxNebraska, Department of Revenue, Research and Audit DivisionsNew Mexico, Taxation and Revenue DepartmentNew York, State Department of Taxation and Finance, Tax Policy and AnalysisNorth Carolina, Department of Revenue, Tax Research DivisionOhio, Department of Taxation, Tax Analysis and Local Government Distribution DivisionPennsylvania, Department of Revenue, Fiscal Policy and AnalysisTexas, Comptroller of Public Accounts, Fiscal ManagementUtah, State Tax Commission, Economic and Statistical UnitWashington, Department of Revenue, Taxpayer ServicesWisconsin, Department of Revenue, Division of Income, Sales and Excise Taxes
Lynda McDonald Applegate, Economic Council on Information Management and Technology (ECIMT), and Harvard Business SchoolBradley S. Dugger, ECIMT, and Chief of Information Systems, TennesseePaul E. Rummell, ECIMT and President’s Chief Executive Officer, RLG NetperformanceBill Fox, University of TennesseeAustan Goolsbee, University of ChicagoCharles McClure, Jr., Hoover InstitutionTom Neubig and Robert Cline, Ernst & YoungHolley Ulbrich, ACIR studies on Taxation of Out-of-State Mail Order Sales
Academics and Others
Appendix VII
GAO Contacts and Staff Acknowledgments
Page 64 GAO/GGD/OCE-00-165 Sales Taxes on e-Commerce
James R. White, (202) 512-9110James A. Wozny, (202) 512-9110
In addition to those named above, Helen Fauntleroy-Branch, Tara Carter,Daniel E. Coates, Shirley A. Jones, Kirsten Landeryou, MacDonald R.Phillips, Loren Yager, Jena Sinkfield, Jennifer Trombley, KatherineWheeler Raheb made key contributions to this report.
GAO Contacts
Acknowledgments

Page 65 GAO/GGD/OCE-00-165 Sales Taxes on e-Commerce

Page 66 GAO/GGD/OCE-00-165 Sales Taxes on e-Commerce

Page 67 GAO/GGD/OCE-00-165 Sales Taxes on e-Commerce
Ordering Copies of GAO Reports
The first copy of each GAO report and testimony is free.
Additional copies are $2 each. Orders should be sent to the
following address, accompanied by a check or money order made
out to the Superintendent of Documents, when necessary. VISA
and MasterCard credit cards are accepted, also. Orders for 100 or
more copies to be mailed to a single address are discounted 25
percent.
Order by mail:
U.S. General Accounting Office
P.O. Box 37050
Washington, DC 20013
or visit:
Room 1100
700 4th St. NW (corner of 4
th and G Sts. NW)
U.S. General Accounting Office
Washington, DC
Orders may also be placed by calling (202) 512-6000 or by using
fax number (202) 512-6061, or TDD (202) 512-2537.
Each day, GAO issues a list of newly available reports and
testimony. To receive facsimile copies of the daily list or any list
from the past 30 days, please call (202) 512-6000 using a touch-
tone phone. A recorded menu will provide information on how to
obtain these lists.
Viewing GAO Reports on the Internet
For information on how to access GAO reports on the INTERNET,
send e-mail message with “info” in the body to:
or visit GAO’s World Wide Web Home Page at:
http://www.gao.gov
Reporting Fraud, Waste, and Abuse in Federal Programs
To contact GAO FraudNET use:
Web site: http://www.gao.gov/fraudnet/fraudnet.htm
E-Mail: [email protected]
Telephone: 1-800-424-5454 (automated answering system)

United StatesGeneral Accounting OfficeWashington, D.C. 20548-0001
Official BusinessPenalty for Private Use $300
Address Correction Requested
Bulk RatePostage & Fees Paid
GAOPermit No. G100
(268892)