
J_EOR_ppt
40
Fundamentals of Enhanced Oil Recovery Larry W. Lake The University of Texas at Austin The University of Texas at Austin (512) 471-8233 k@ il d Larry_Lake@mail.utexas.edu
description
EOR - Enhanced Oil RecoverySeveral methods used to obtain tertiary recovery from an oil/gas well are clubbed under EOR. An effective method to extract additional recovery from an old field.
Transcript of J_EOR_ppt
Fundamentals of Enhanced Oil Recovery
Larry W. LakeThe University of Texas at AustinThe University of Texas at Austin
(512) 471-8233k @ il [email protected]
Chapter 1- Defining EORp g
•OverviewOverview•Current status•Why EOR•Why EOR•Incremental oil recovery•Comparative performances
Enhanced Oil Reco er (EOR) isEnhanced Oil Recovery (EOR) is…
• Oil recovery by injection of fluids not normally• Oil recovery by injection of fluids not normally present in reservoir
• Excludes pressure maintenance or waterflooding• Excludes pressure maintenance or waterflooding• Not necessarily tertiary recovery
Improved Oil Recovery (IOR) is…• EOR l dditi l t h l i d li ith d illi• EOR plus additional technologies dealing with drilling,
production, operations, and reservoir characterization• An attempt to avoid negative connotation of EOR• An attempt to avoid negative connotation of EOR
Enhanced Oil Reco er (EOR) isEnhanced Oil Recovery (EOR) is…
• End of the Road• End of the Road• "If you intend to select reservoir engineering as a
'career' then you should steer clear of the morecareer , then you should steer clear of the more esoteric subjects such as EOR flooding or the recovery of highly viscous crude oils."y g y
• "While EOR may present the more satisfying intellectual challenge, there is also the risk that it may lead prematurely to the dole queue."
L. P. Dake, 1994
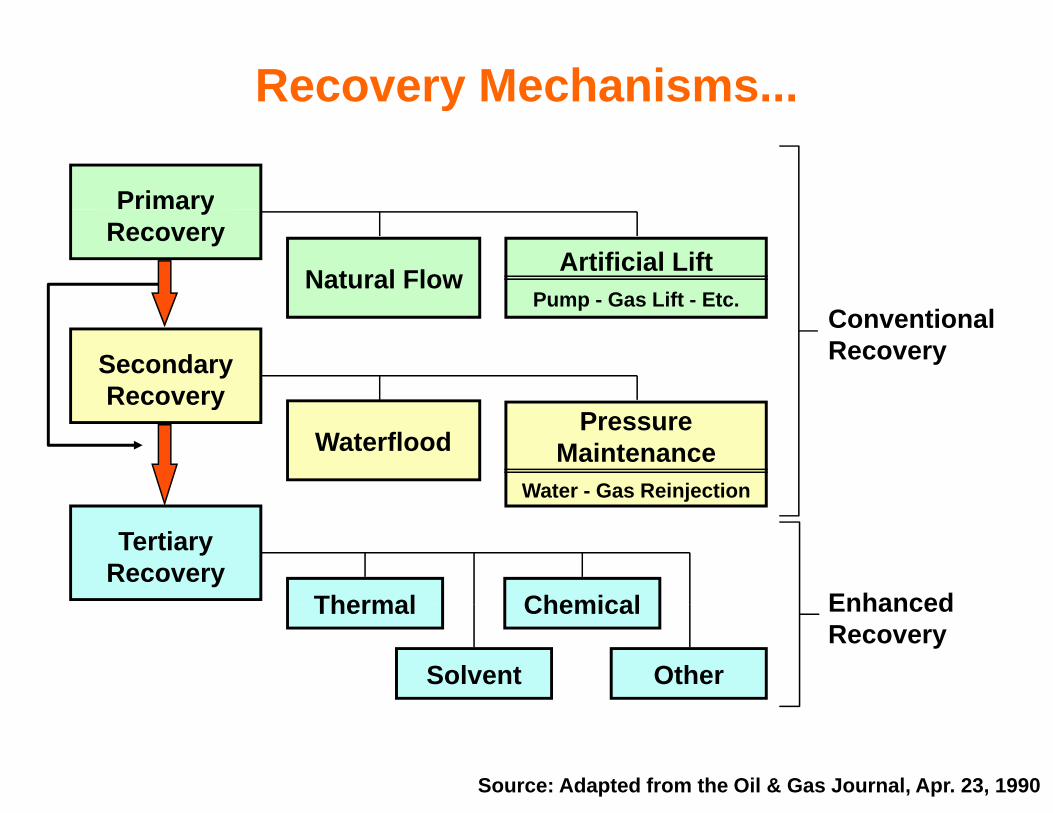
Recovery Mechanisms...y
Primary
Artificial LiftPump - Gas Lift - Etc.
Natural Flow
a yRecovery
ConventionalRecoverySecondary
Recovery
p
PressureMaintenance
Water - Gas Reinjection
y
Waterflood
Enhanced
TertiaryRecovery
ChemicalThermal EnhancedRecovery
Other
Chemical
Solvent
Thermal
Source: Adapted from the Oil & Gas Journal, Apr. 23, 1990
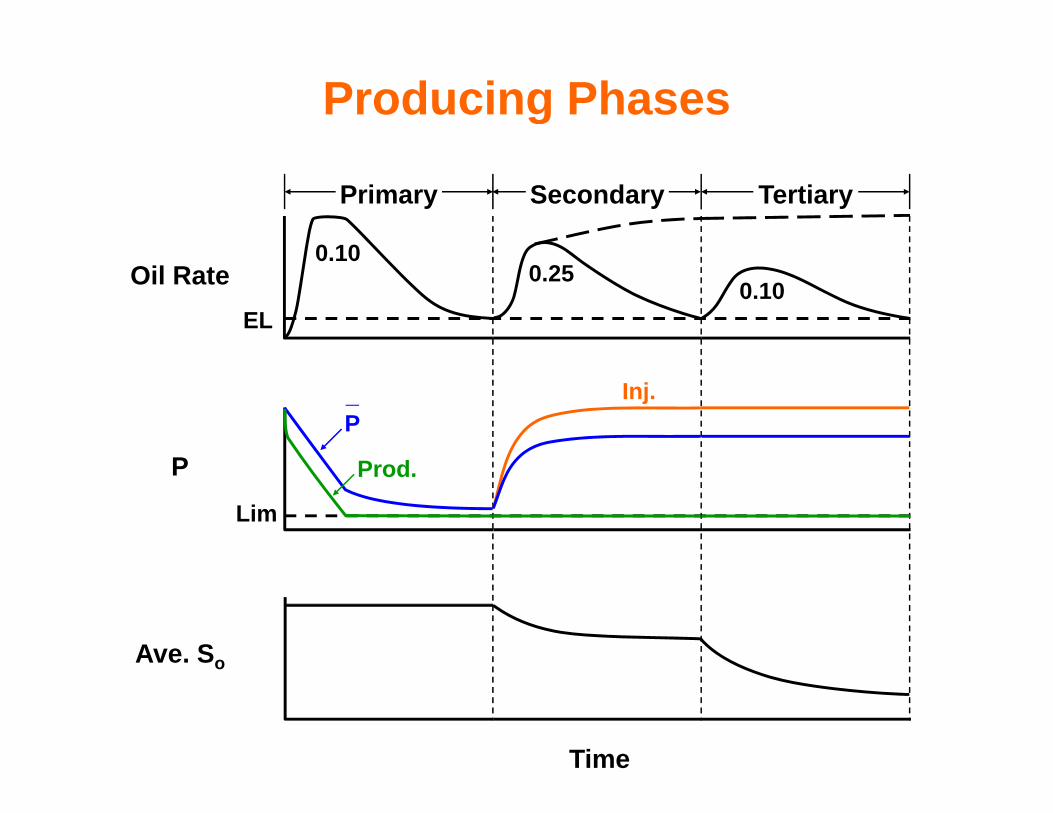
Producing Phases
Primary Secondary Tertiary
Producing Phases
Oil Rate0.10
0.250.10
EL
_ Inj.
P
Li
P_
Prod.
Lim
Ave. So
Time
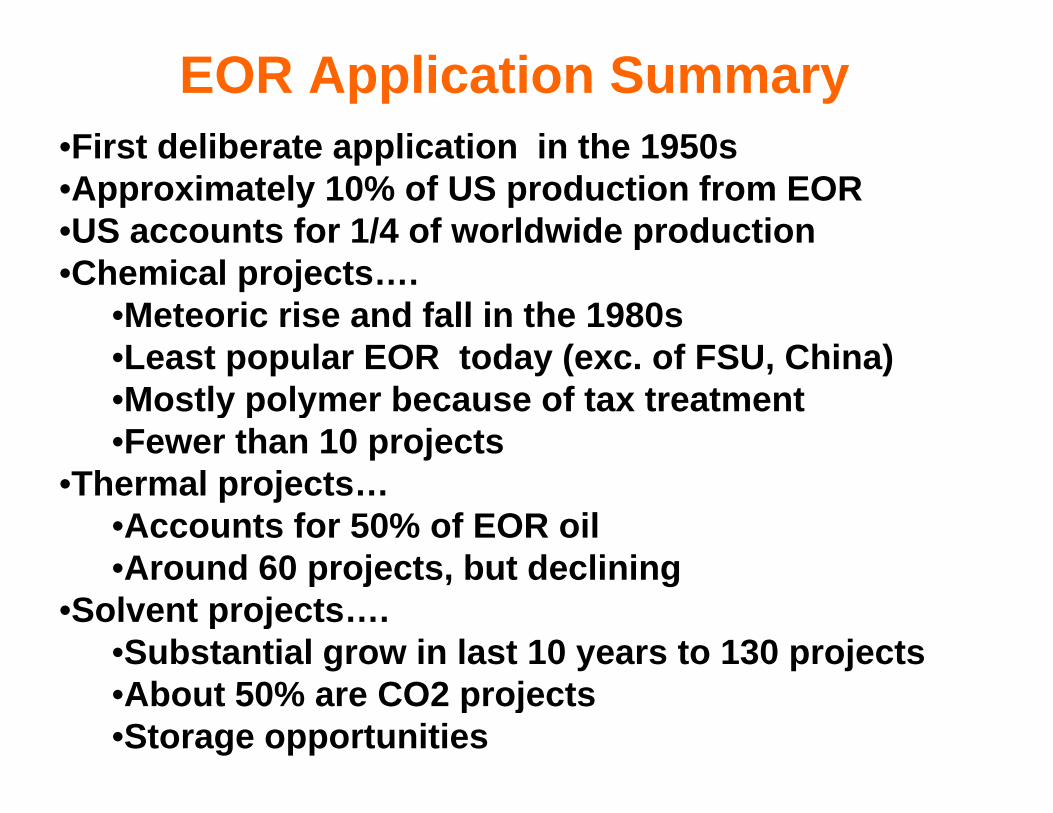
EOR Application Summary•First deliberate application in the 1950s•Approximately 10% of US production from EOR•US accounts for 1/4 of worldwide production•Chemical projects….
M t i i d f ll i th 1980•Meteoric rise and fall in the 1980s•Least popular EOR today (exc. of FSU, China)•Mostly polymer because of tax treatmentMostly polymer because of tax treatment•Fewer than 10 projects
•Thermal projects…•Accounts for 50% of EOR oil•Around 60 projects, but declining
Solvent projects•Solvent projects….•Substantial grow in last 10 years to 130 projects•About 50% are CO2 projectsAbout 50% are CO2 projects•Storage opportunities
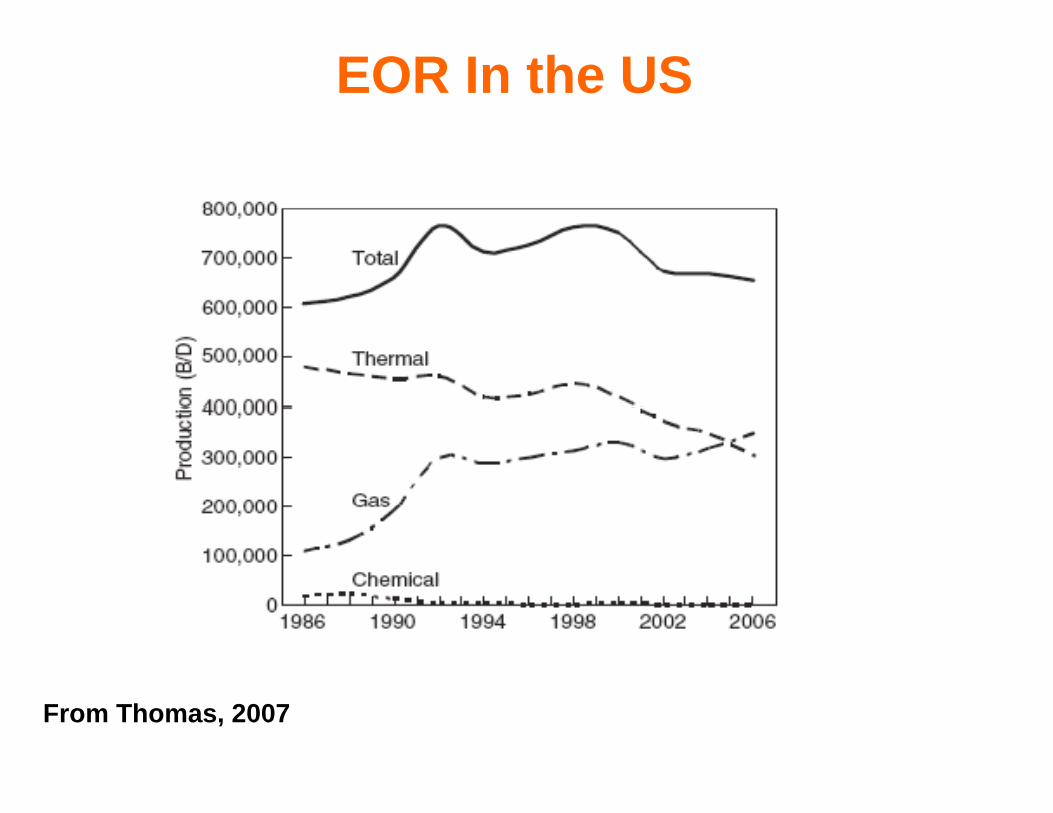
EOR In the US
From Thomas, 2007
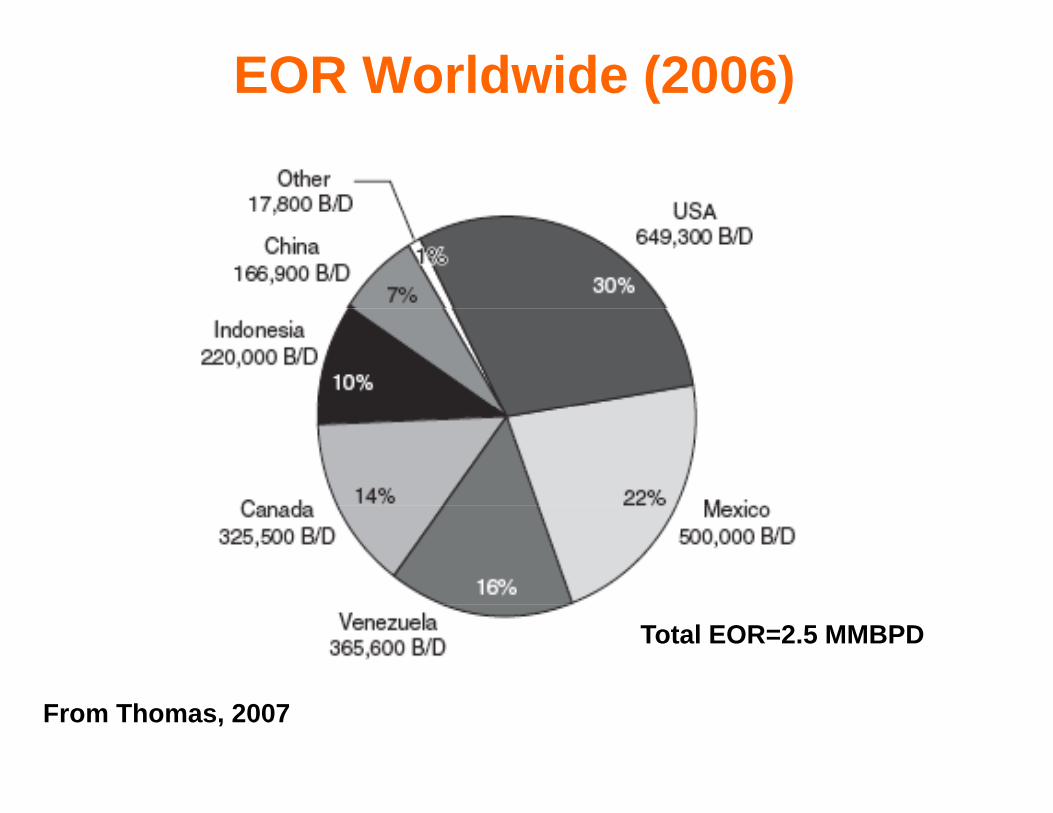
EOR Worldwide (2006)
Total EOR=2.5 MMBPD
From Thomas, 2007
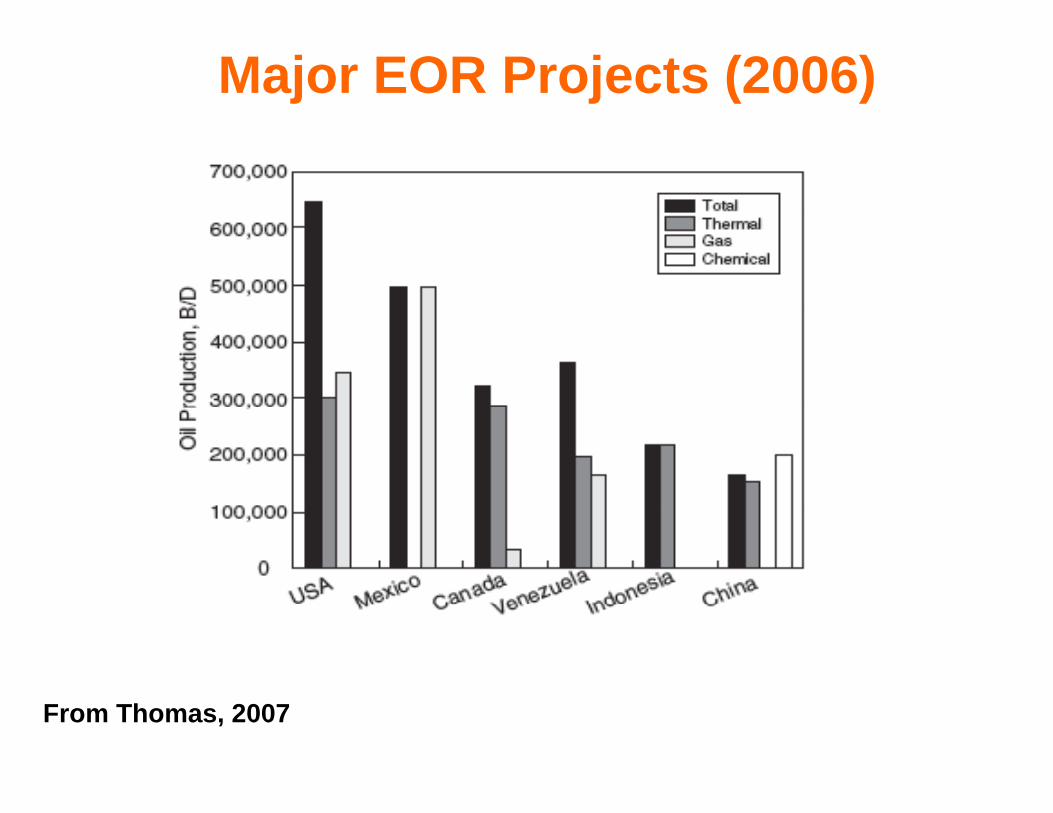
Major EOR Projects (2006)
From Thomas, 2007
Chapter 1- Defining EORp g
•OverviewOverview•Current status•Why EOR•Why EOR
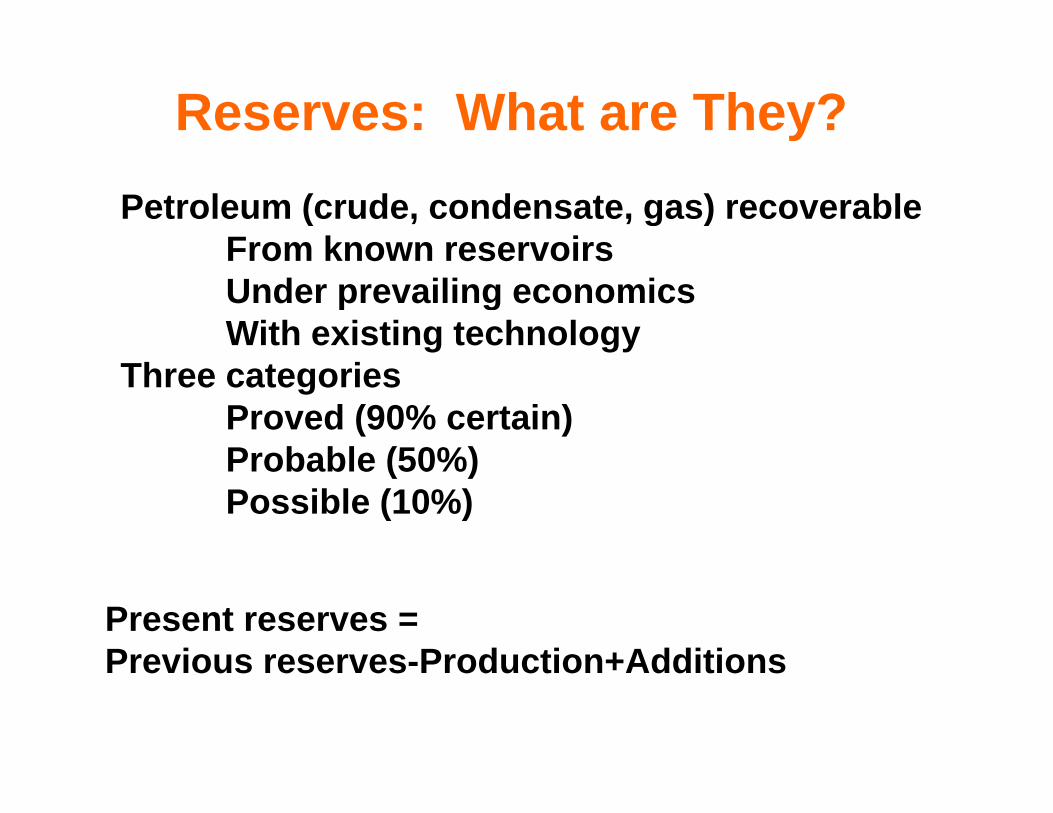
Reserves: What are They?Reserves: What are They?Petroleum (crude condensate gas) recoverablePetroleum (crude, condensate, gas) recoverable
From known reservoirsUnder prevailing economicsp gWith existing technology
Three categoriesP d (90% t i )Proved (90% certain)Probable (50%)Possible (10%)Possible (10%)
Present reserves =Previous reserves-Production+Additions
Reserves AdditionsReserves Additions
Di f fi ld•Discovery of new fields•Discovery of new reservoirs inDiscovery of new reservoirs in known fieldsE t i f k fi ld•Extensions of known fields
•Redefinition of reserves because ofEconomicsExtraction technologyExtraction technology
The Argument for EORg• Worldwide consumption increase at a boring rate (2%/yr)•Reserves not generally replacedReserves not generally replaced
•Requires discovery of “giant” fi ld (100 MM bbl i l )fields (100 MM bbls in place)
•Drilling alone g•Requires large capital investment•Drilling rate inversely correlated•Drilling rate inversely correlated with finding rate
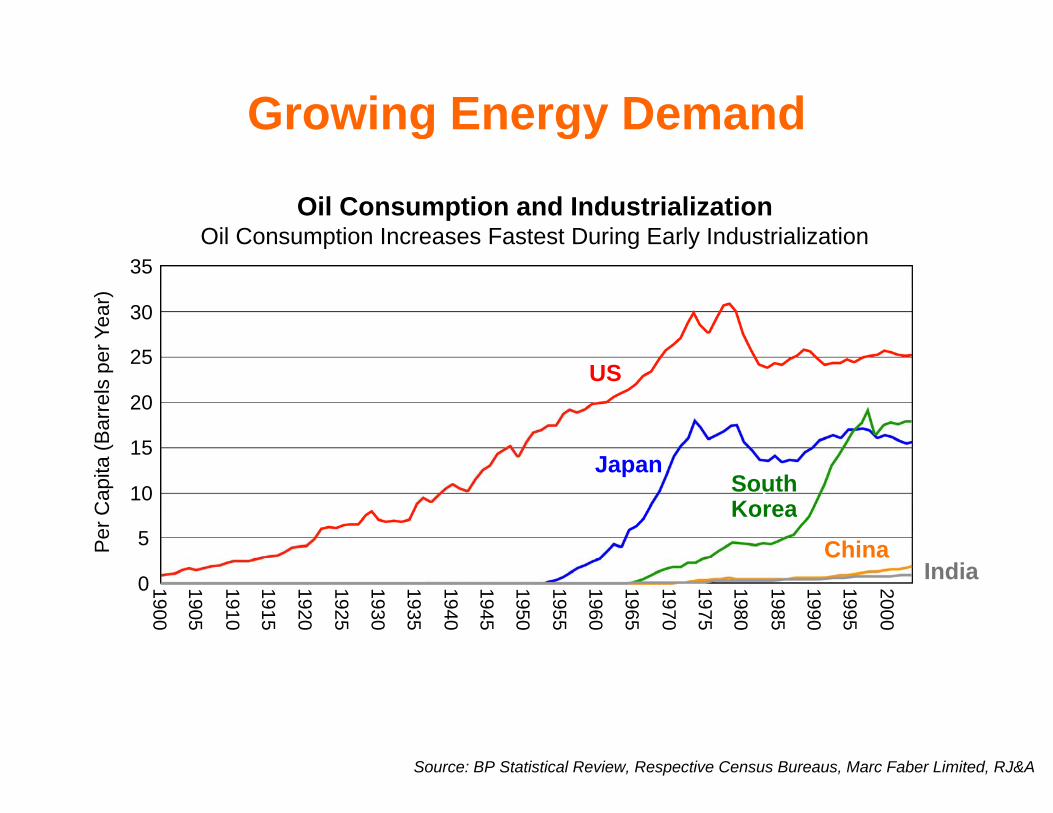
Growing Energy Demand
Oil Consumption and Industrialization
Growing Energy Demand
Oil Consumption and IndustrializationOil Consumption Increases Fastest During Early Industrialization
30
35
ar)
US20
25
30
rels
per
Yea
Japan10
15
20
Cap
ita (B
arr
SouthKorea
ChinaIndia0
5
19 19 19 19 19 19 19 19 19 19 19 19 19 19 19 19 19 19 19 19 20
Per
C Korea
900
905
910
915
920
925
930
935
940
945
950
955
960
965
970
975
980
985
990
995
000
Source: BP Statistical Review, Respective Census Bureaus, Marc Faber Limited, RJ&A
The Argument for EOR (cont.)g ( )
• EOR applies to known reservoirspp•No need to find them•Some infrastructure in place•Some infrastructure in place•Markets available
•Technology is mature and cost effectiveeffective•65% of oil remains after secondary recovery
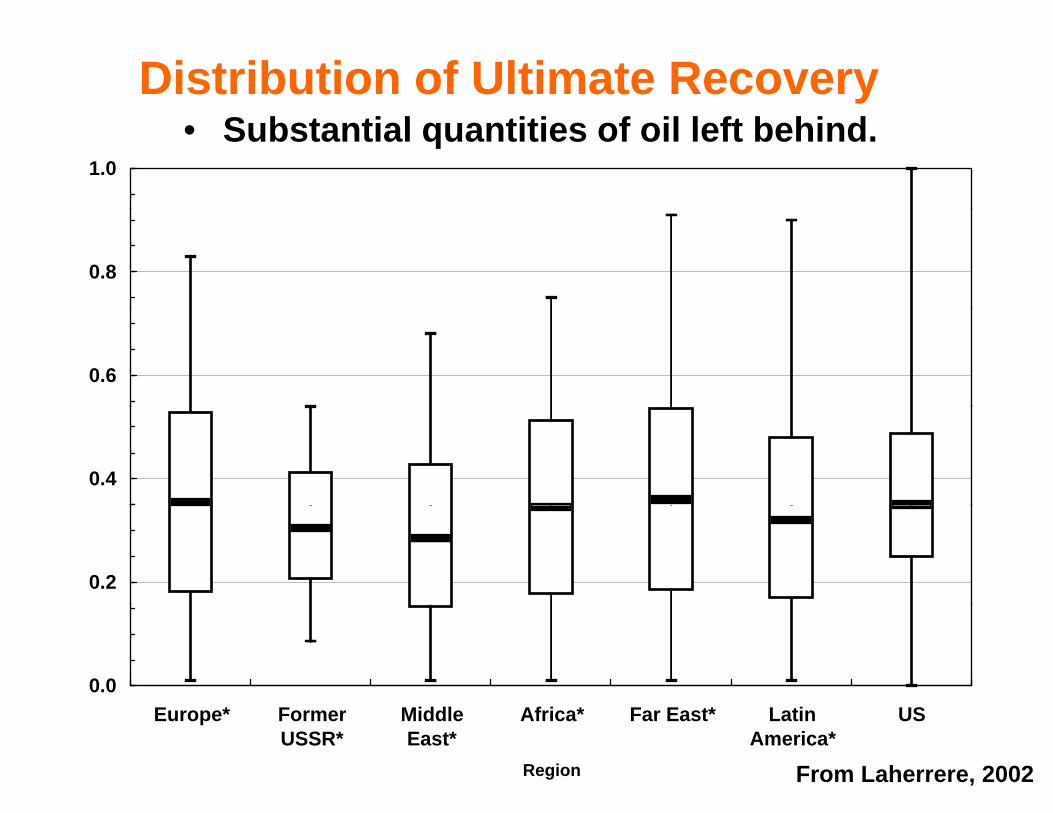
Distribution of Ultimate Recovery1.0
• Substantial quantities of oil left behind.
0.8
0.6
0.4
0.2
0.0
From Laherrere, 2002
Europe* FormerUSSR*
MiddleEast*
Africa* Far East* LatinAmerica*
US
Region
Chapter 1- Defining EORp g
•OverviewOverview•Current status•Why EOR•Why EOR•Incremental oil recovery
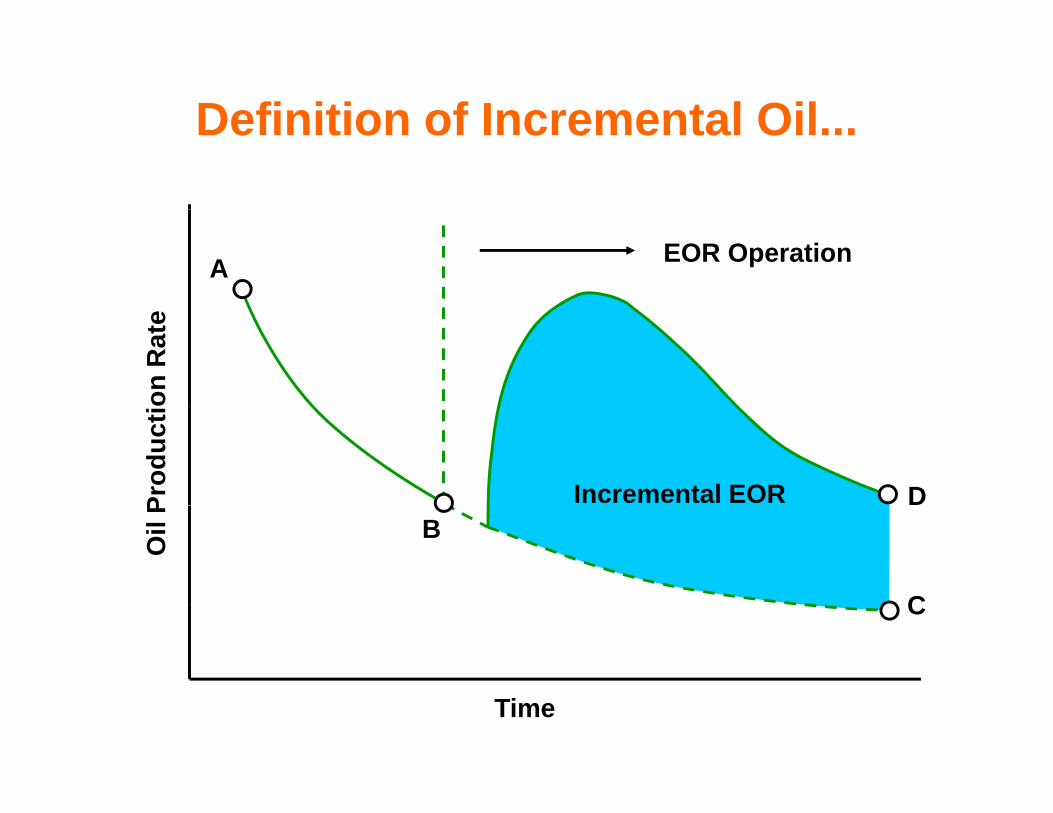
Definition of Incremental OilDefinition of Incremental Oil...
EOR OperationA
on R
ate
Prod
ucti
DIncremental EOR
Oil
P
B
C
Ti
C
Time
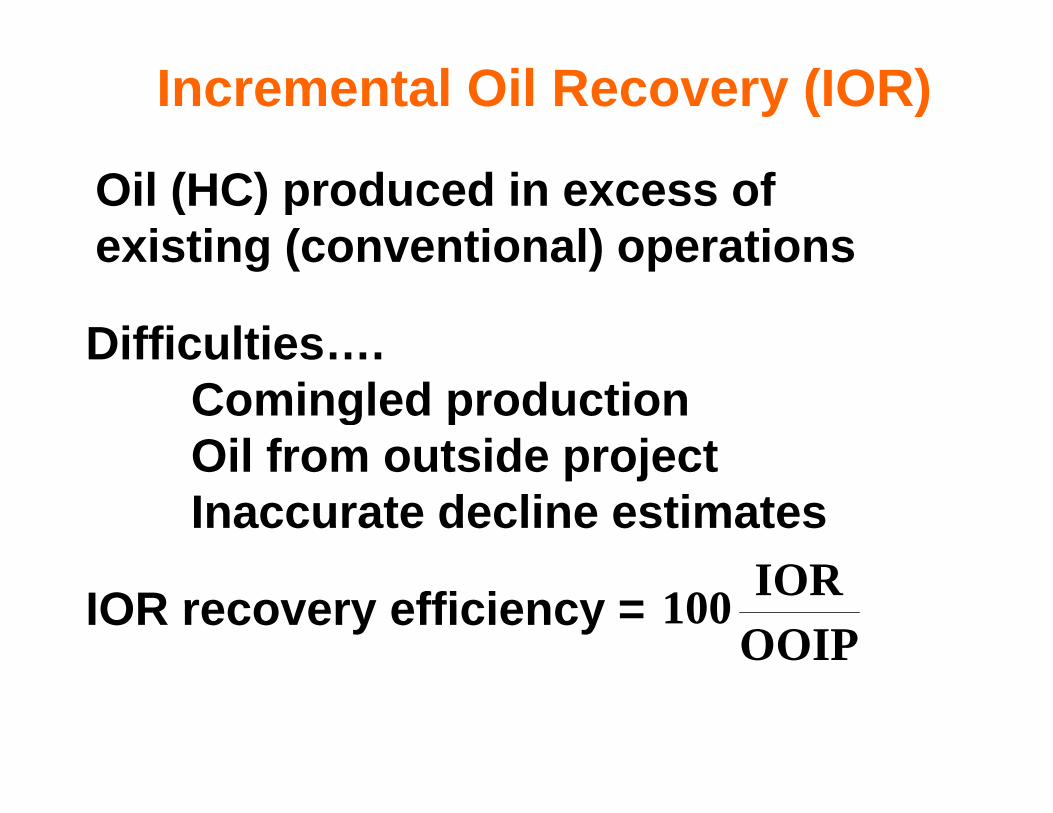
Incremental Oil Recovery (IOR)y ( )
Oil (HC) produced in excess of ( ) pexisting (conventional) operations
Difficulties….Comingled productionComingled productionOil from outside projectInaccurate decline estimatesInaccurate decline estimates
IOR recovery efficiency = 100 IORIOR recovery efficiency = 100
OOIP
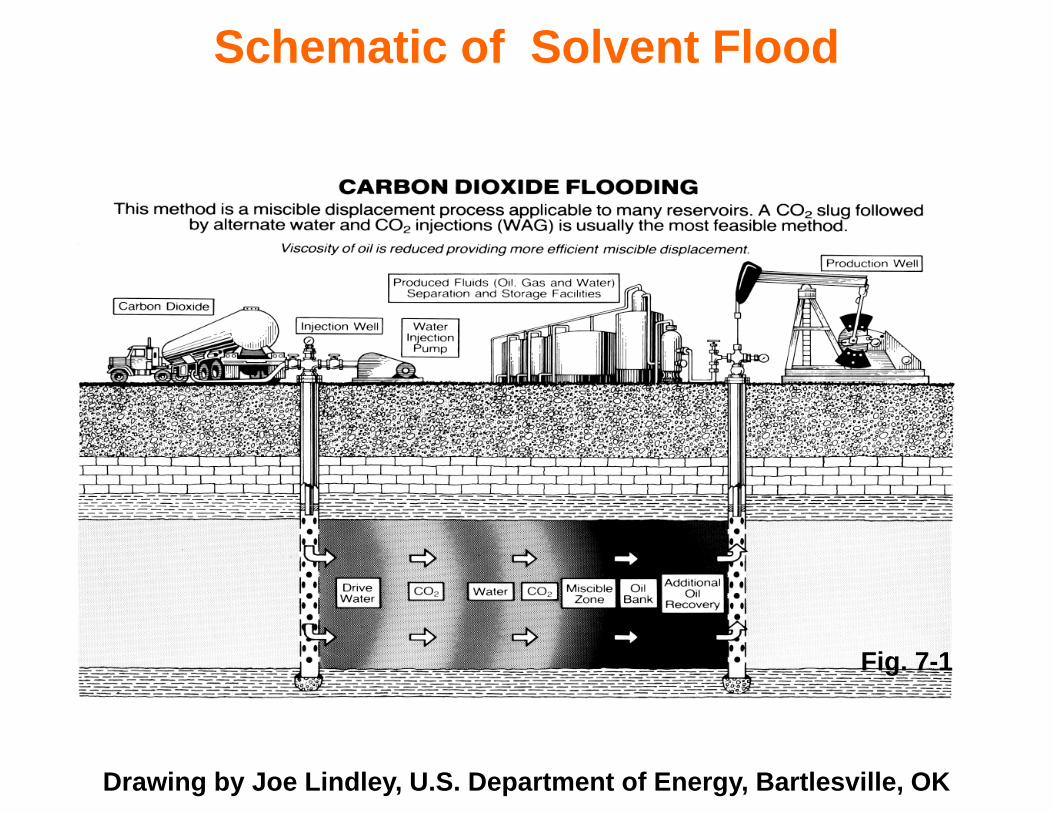
Schematic of Solvent Flood
Fig. 7-1
Drawing by Joe Lindley, U.S. Department of Energy, Bartlesville, OK
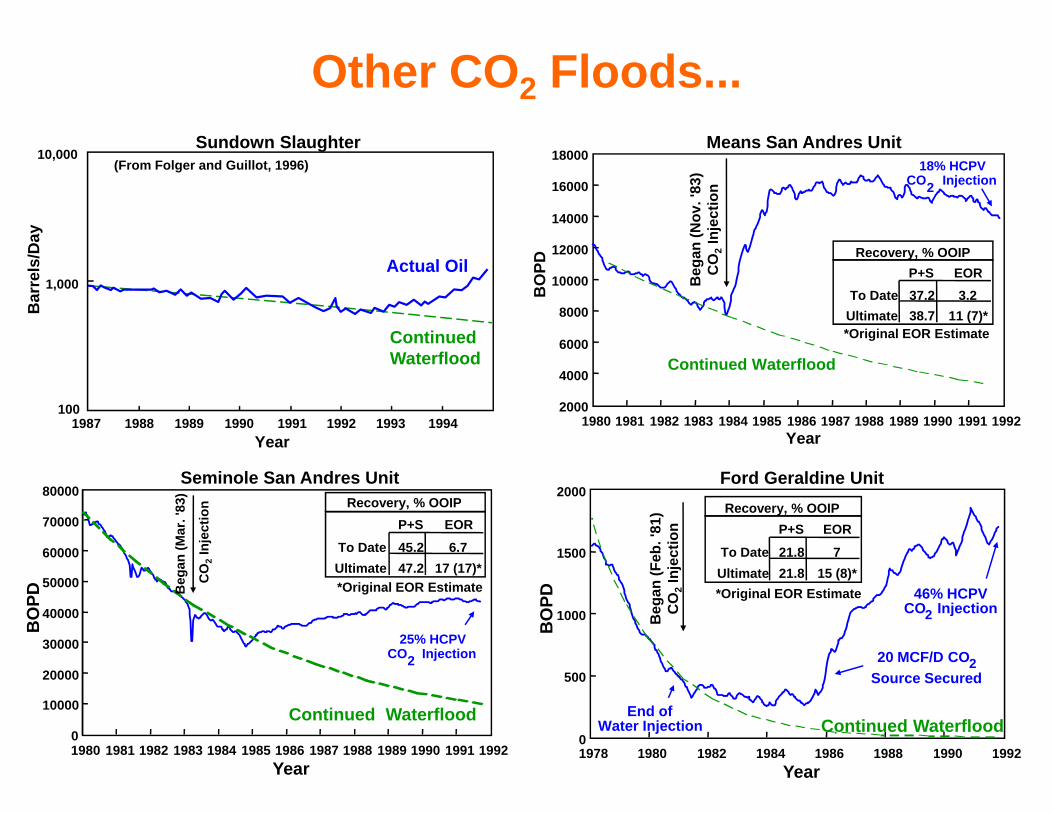
Other CO2 Floods...Means San Andres Unit
16000
18000
v. '8
3)tio
n
18% HCPVCO2 Injection
10,000(From Folger and Guillot, 1996)
Sundown Slaughter
8000
10000
12000
14000
BO
PD
Beg
an (N
ovC
O2
Inje
ct
37.2 3.2To DateP+S EOR
Recovery, % OOIP
1,000Actual Oil
Bar
rels
/Day
2000
4000
6000
8000
Continued Waterflood
38.7 11 (7)*Ultimate*Original EOR Estimate
100
ContinuedWaterflood
B
20001980 1981 1982 1983 1984 1985 1986 1987 1988 1989 1990 1991 1992
Year
Seminole San Andres Unit80000
Recovery, % OOIPn3)
Ford Geraldine Unit2000
R % OOIP
1001987 1988 1989 1990 1991 1992 1993 1994
Year
50000
60000
70000
PD
Recovery, % OOIP
*Original EOR Estimate
45.247.2
6.717 (17)*
To DateUltimate
P+S EOR
CO
2In
ject
ion
Beg
an (M
ar. '
8
1500PD ga
n (F
eb. '
81)
O2
Inje
ctio
n
21.821.8
715 (8)*
To DateUltimate
P+S EORRecovery, % OOIP
*Original EOR Estimate 46% HCPVCO I j ti
10000
20000
30000
40000
BO
P
25% HCPVCO2 Injection
500
1000
BO
P
Beg C CO2 Injection
20 MCF/D CO2Source Secured
0
10000
1980 1981 1982 1983 1984 1985 1986 1987 1988 1989 1990 1991 1992Year
Continued Waterflood01978 1980 1982 1984 1986 1988 1990 1992
Year
End ofWater Injection Continued Waterflood
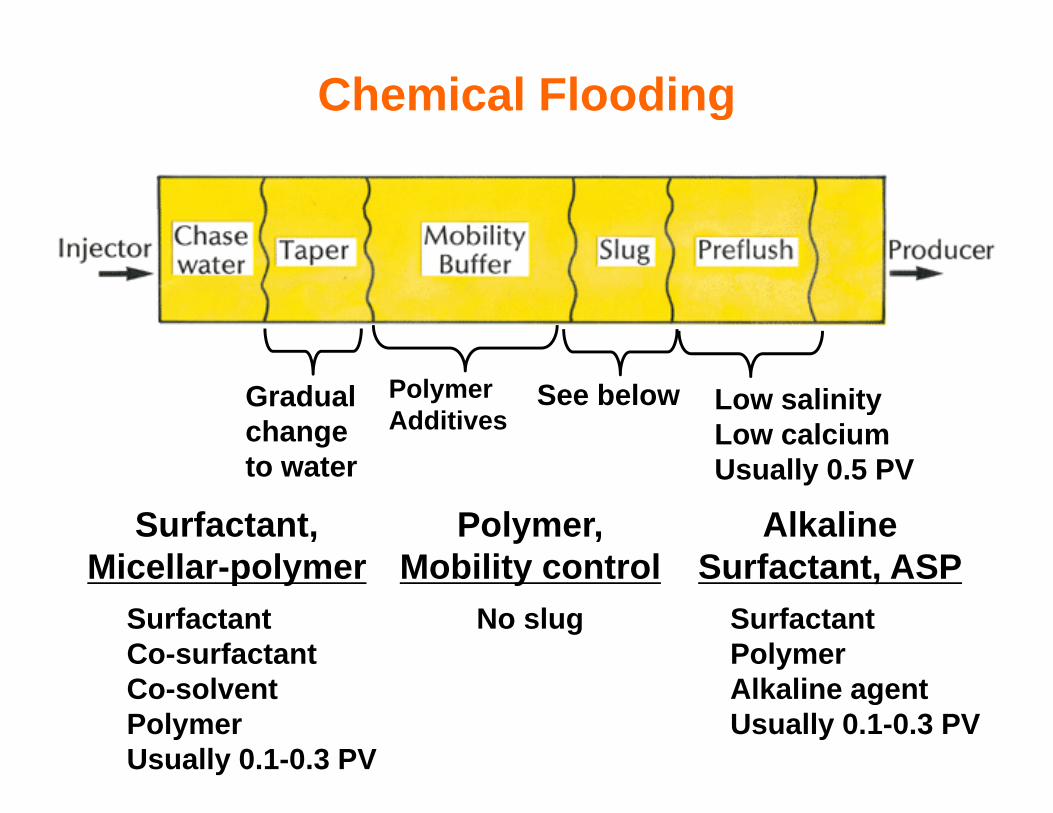
Chemical FloodingC e ca ood g
Low salinitySee belowPolymerGradual Low salinityLow calciumUsually 0.5 PV
Additiveschange to water
Surfactant,Micellar-polymer
Polymer,Mobility control
Alkaline Surfactant, ASP
SurfactantCo-surfactantCo-solvent
No slug SurfactantPolymerAlkaline agent
PolymerUsually 0.1-0.3 PV
gUsually 0.1-0.3 PV
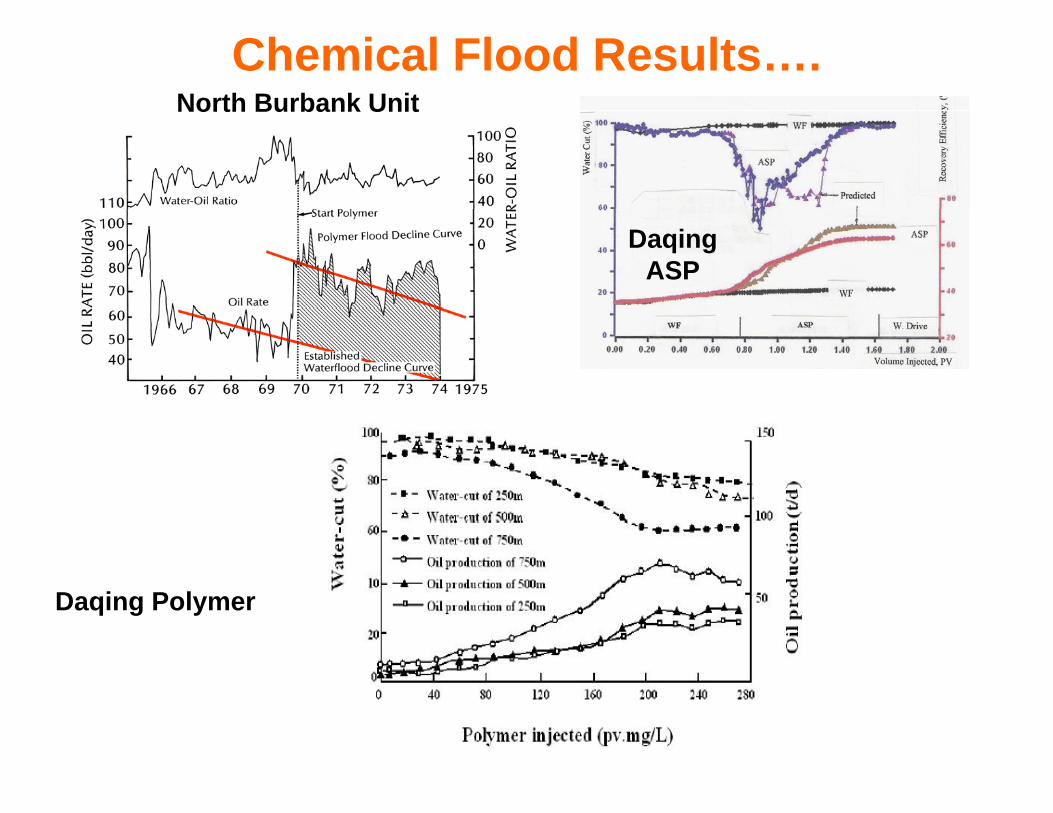
North Burbank UnitChemical Flood Results….
North Burbank Unit
Daqing ASP
Daqing PolymerDaqing Polymer
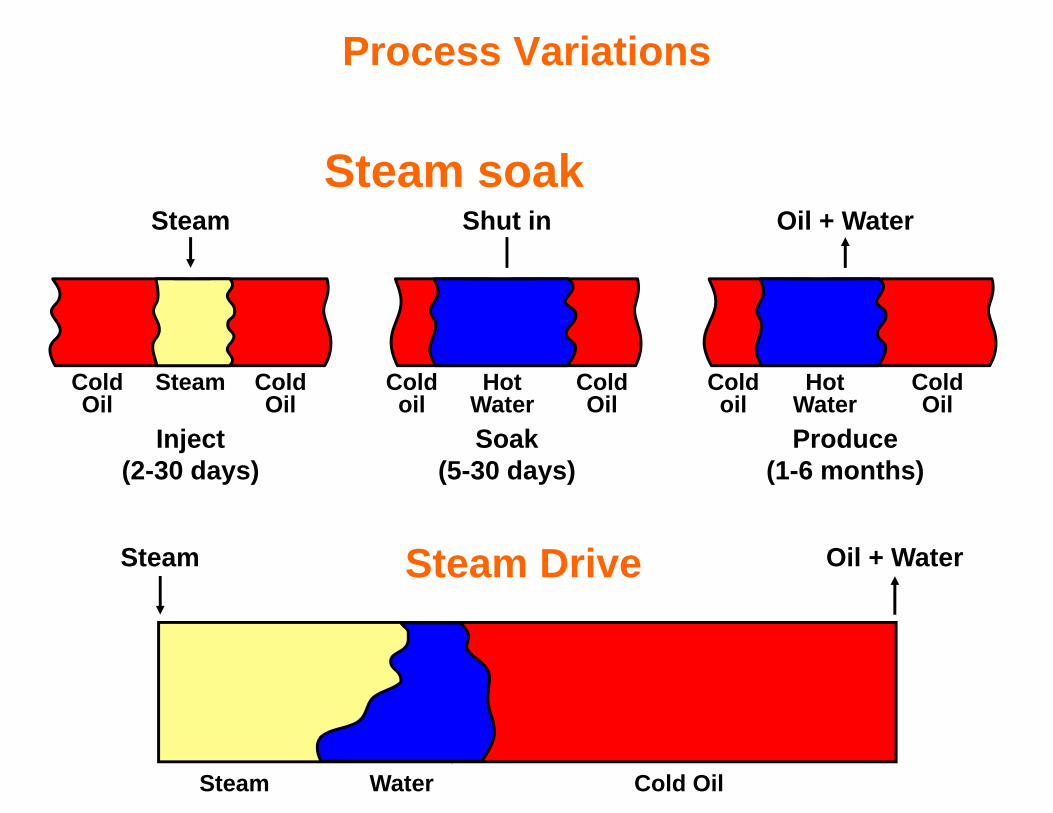
Process Variations
Steam soakSteam Shut in Oil + Water
ColdOil
ColdOil
Steam Coldoil
ColdOil
HotWater
Coldoil
ColdOil
HotWaterOil Oil
Inject(2-30 days)
oil OilWaterSoak
(5-30 days)
oil OilWaterProduce
(1-6 months)
Steam DriveSteam Oil + Water
Steam Water Cold Oil
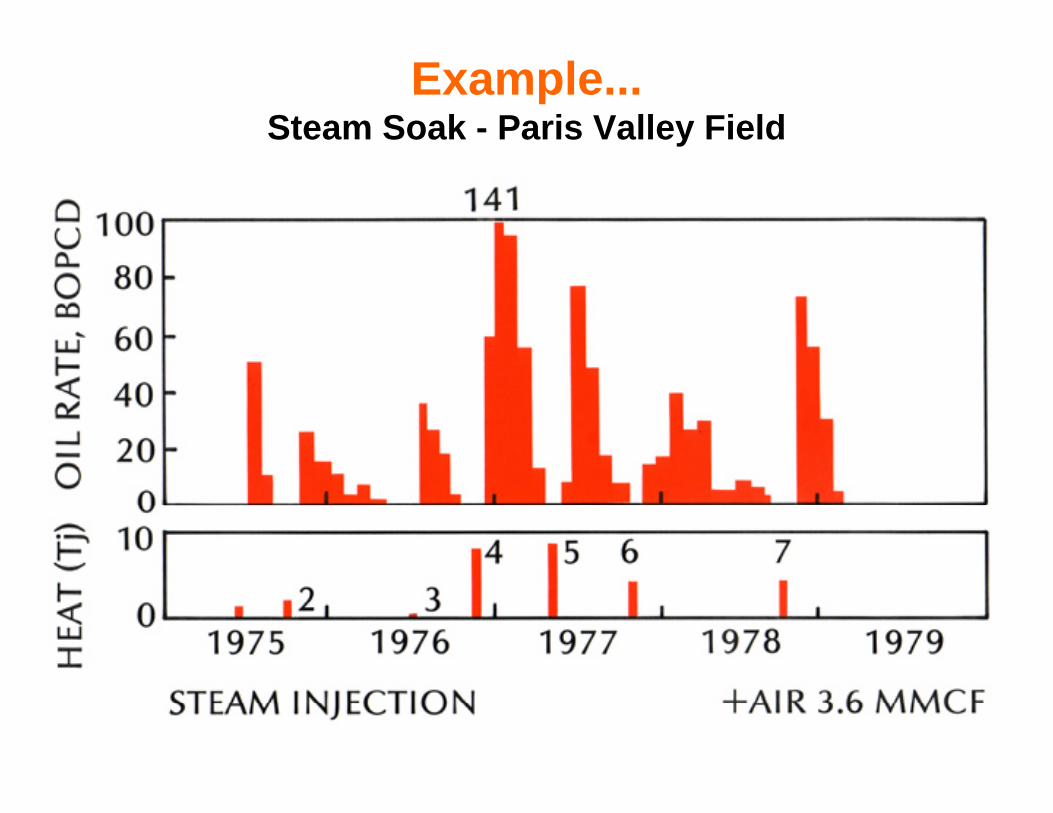
Example...Steam Soak - Paris Valley Field
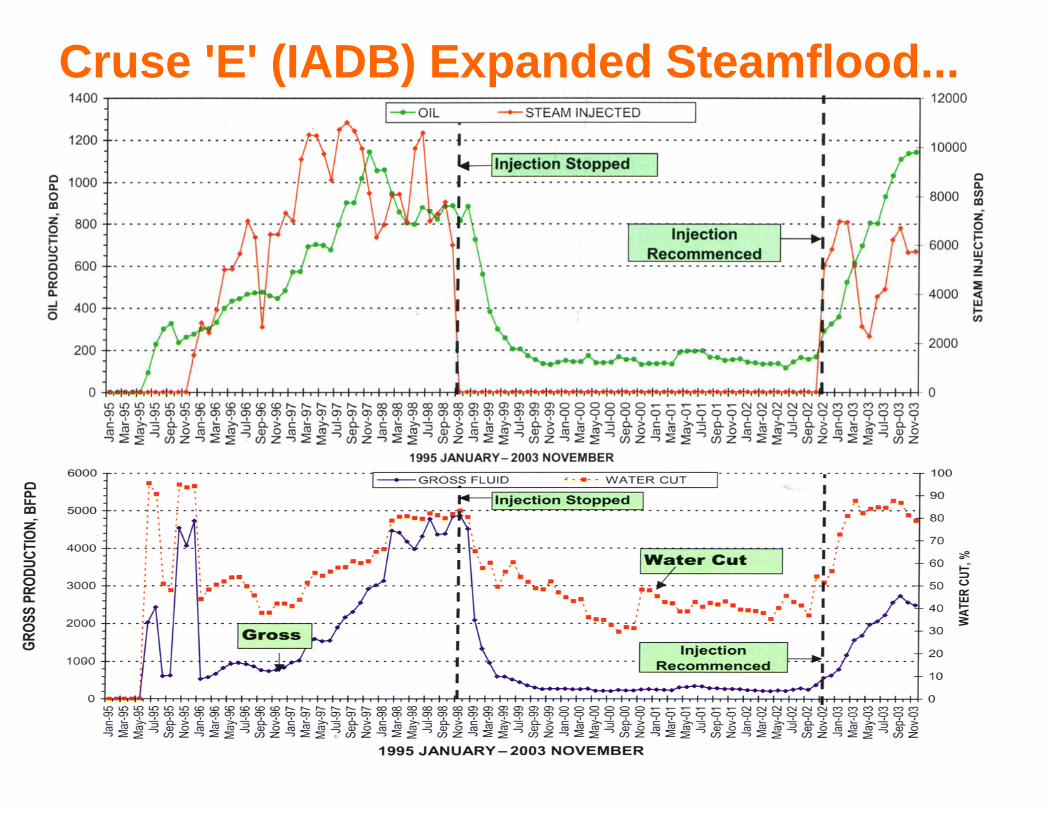
Cruse 'E' (IADB) Expanded Steamflood...
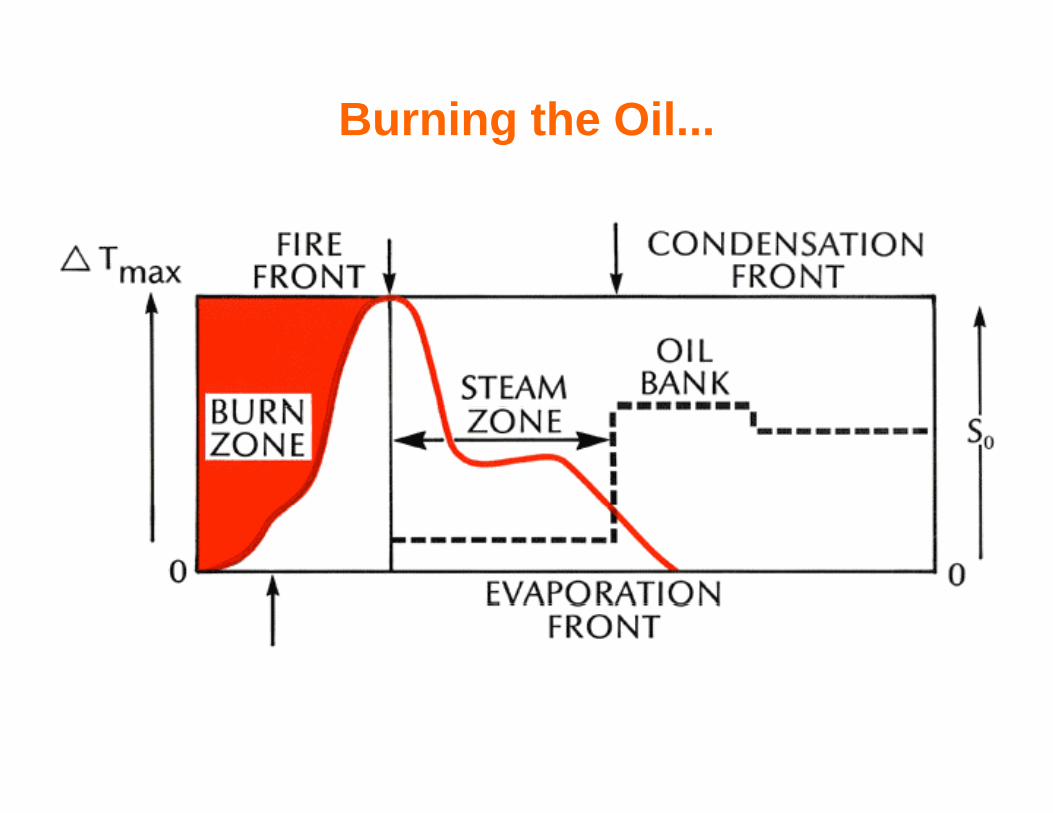
B rning the OilBurning the Oil...
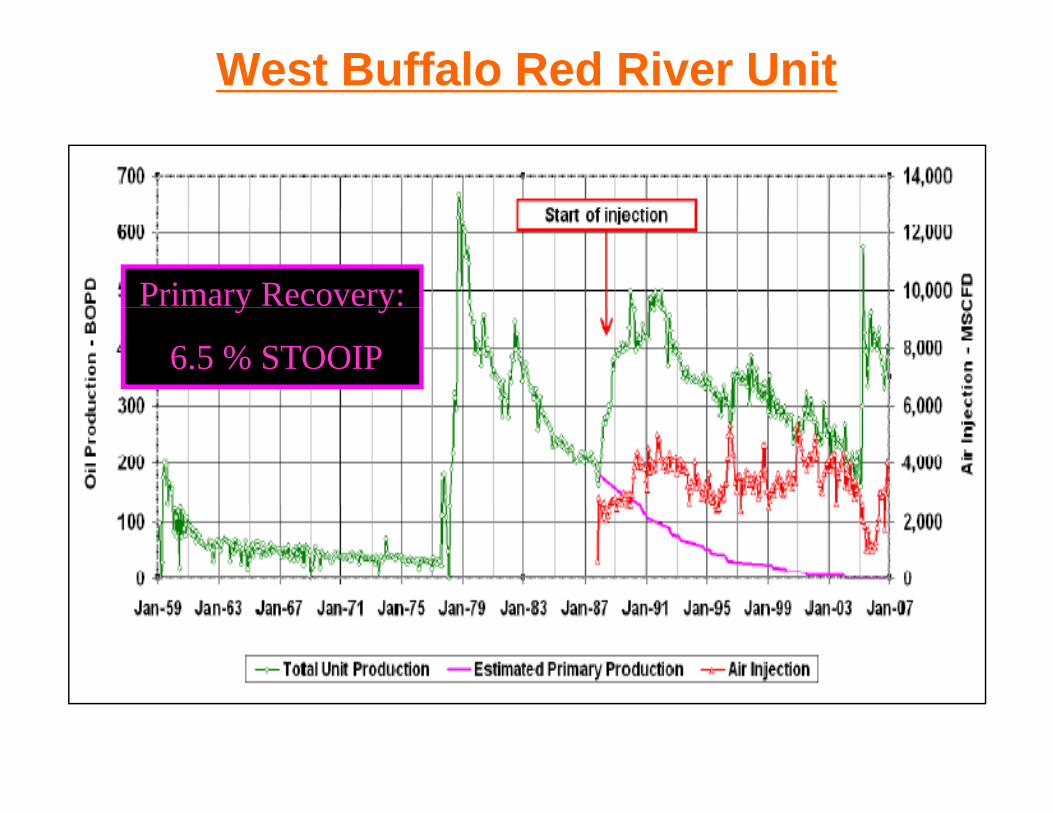
West Buffalo Red River Unit
Primary Recovery:y y
6.5 % STOOIP
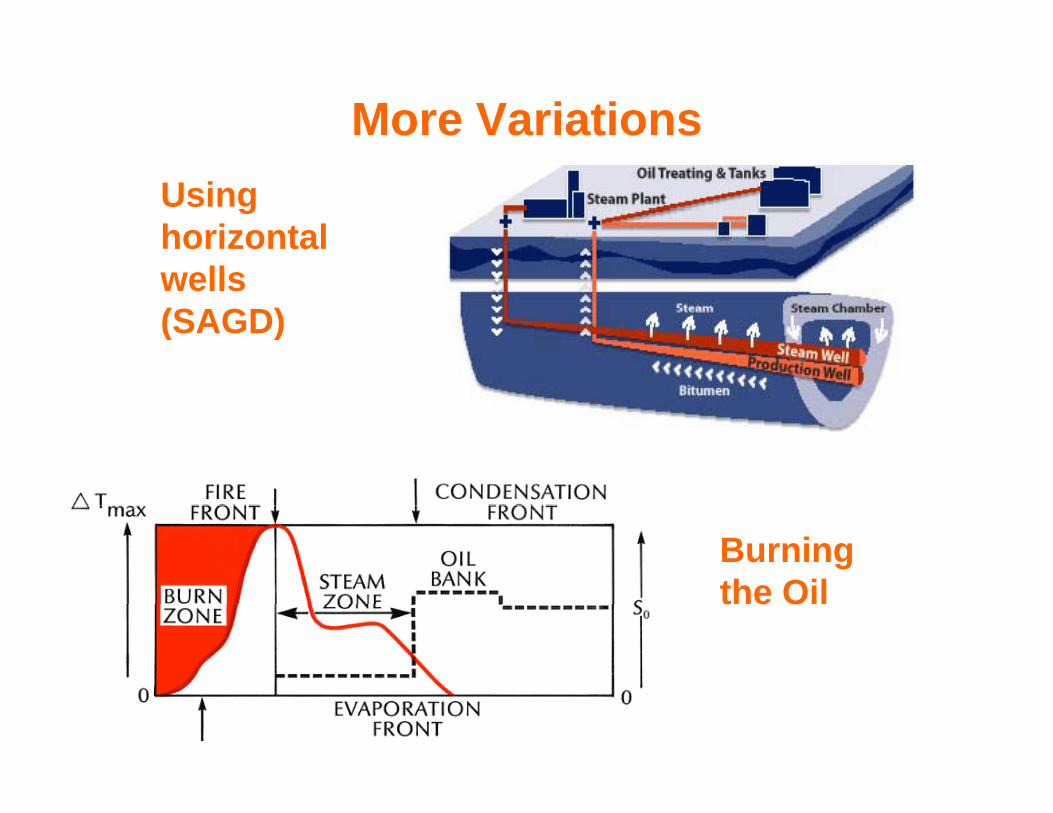
More VariationsMore VariationsUsing ghorizontal wells (SAGD)(SAGD)
Burning the Oilt e O
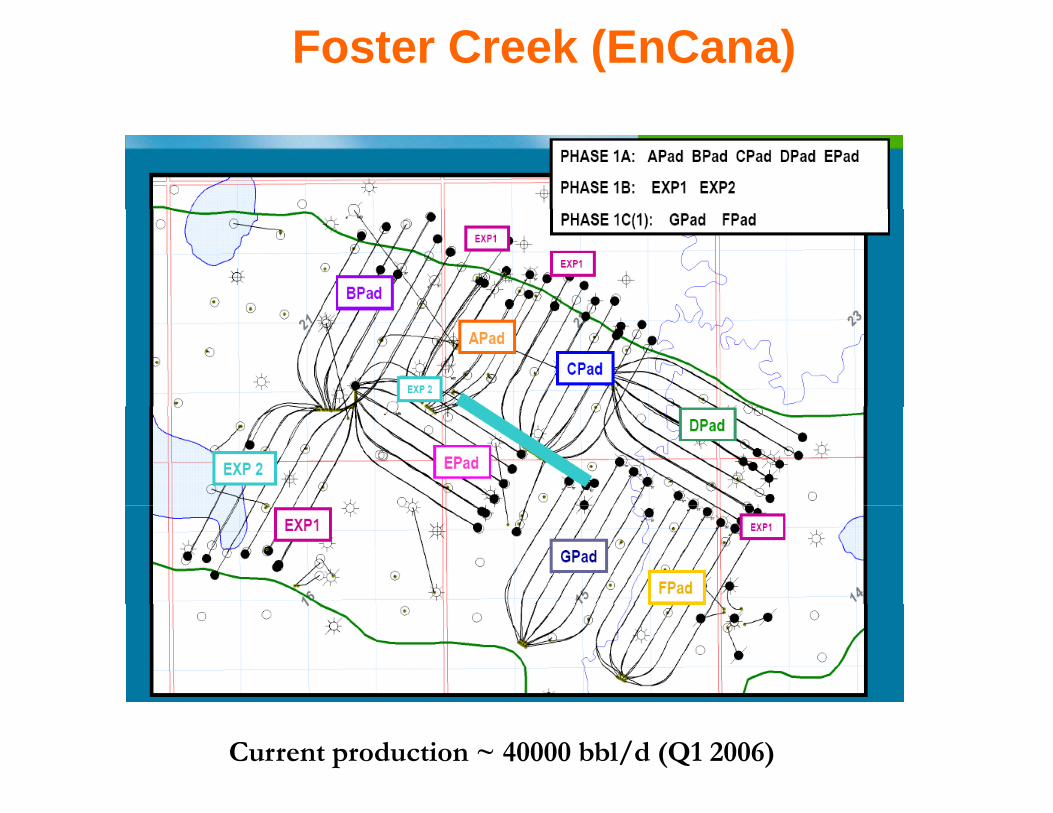
Foster Creek (EnCana)
Current production ~ 40000 bbl/d (Q1 2006)
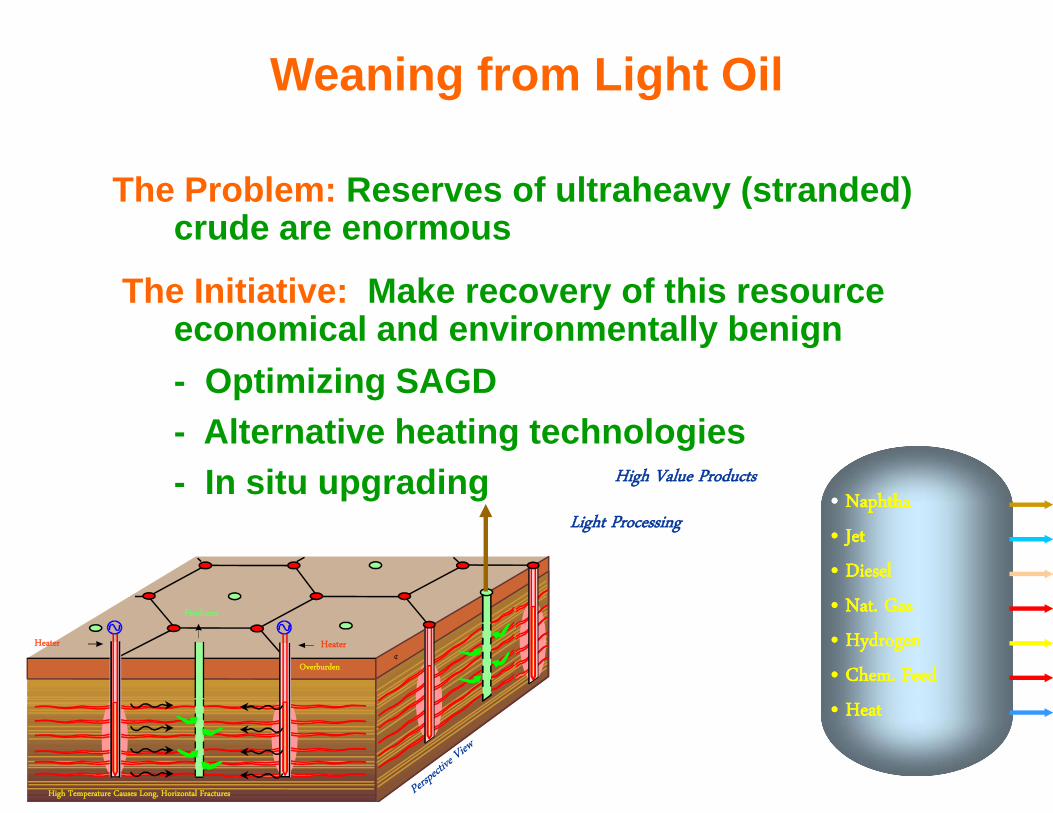
Weaning from Light Oil
The Problem: Reserves of ultraheavy (stranded) crude are enormous
The Initiative: Make recovery of this resource yeconomical and environmentally benign- Optimizing SAGD- Alternative heating technologies- In situ upgrading
•• NaphthaNaphthaHigh Value Products
NaphthaNaphtha
•• JetJet
•• DieselDiesel
•• Nat GasNat Gas
Light Processing
¢
Producer
HeaterHeater
Overburden
•• Nat. GasNat. Gas
•• HydrogenHydrogen
•• Chem. FeedChem. Feed
High Temperature Causes Long, Horizontal Fractures
•• HeatHeat
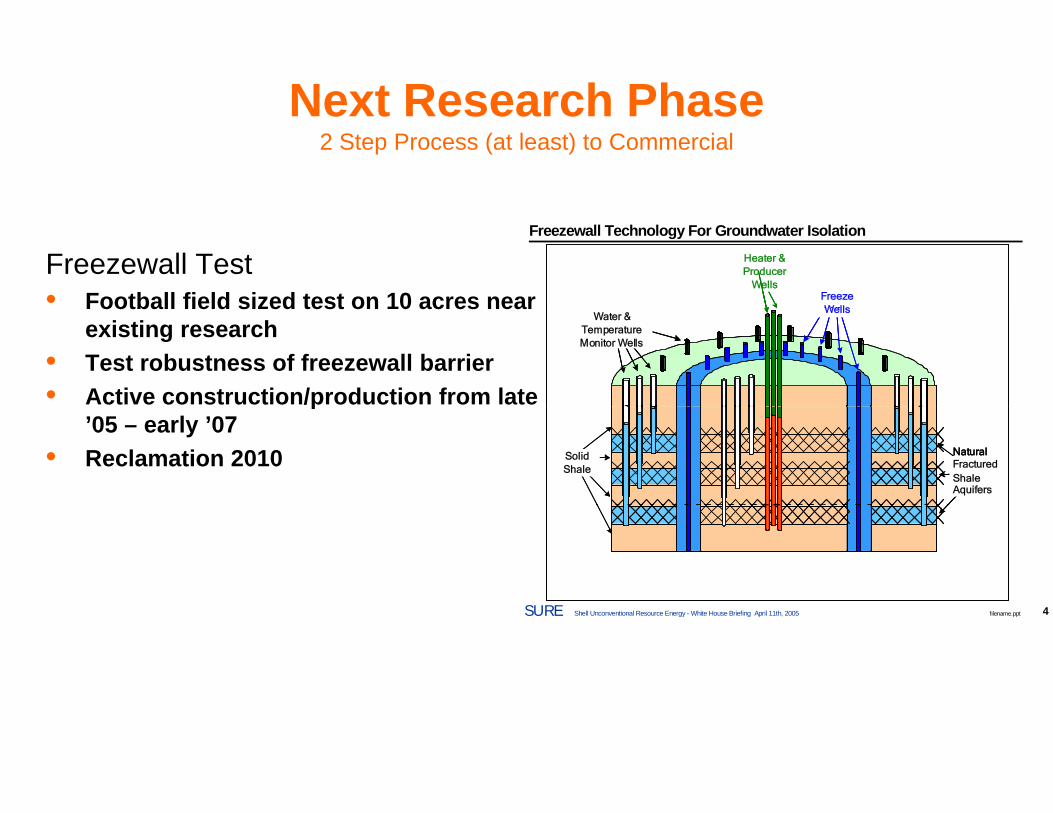
Next Research PhaseNext Research Phase2 Step Process (at least) to Commercial
Freezewall Technology For Groundwater Isolation
FreezeWells
Heater &Producer
WellsFreezeWells
Heater &Producer
WellsFreezeWells
Heater &Producer
WellsFreezewall Test• Football field sized test on 10 acres near
Water &TemperatureMonitor Wells
WellsWater &
TemperatureMonitor Wells
WellsWater &
TemperatureMonitor Wells
WellsFootball field sized test on 10 acres near existing research
• Test robustness of freezewall barrier• Active construction/production from late
NaturalFracturedShaleAquifers
SolidShale
NaturalFracturedShaleAquifers
SolidShale
p’05 – early ’07
• Reclamation 2010
4Shell Unconventional Resource Energy - White House Briefing April 11th, 2005 filename.pptSURE
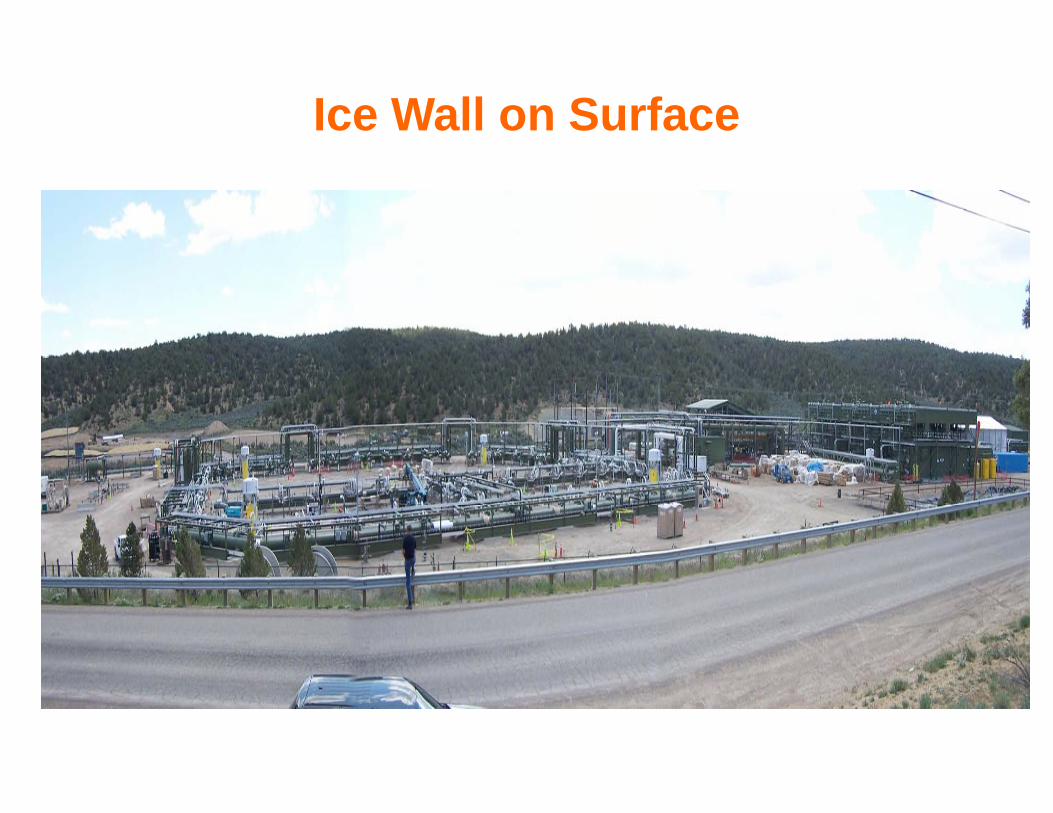
Ice Wall on SurfaceIce Wall on Surface
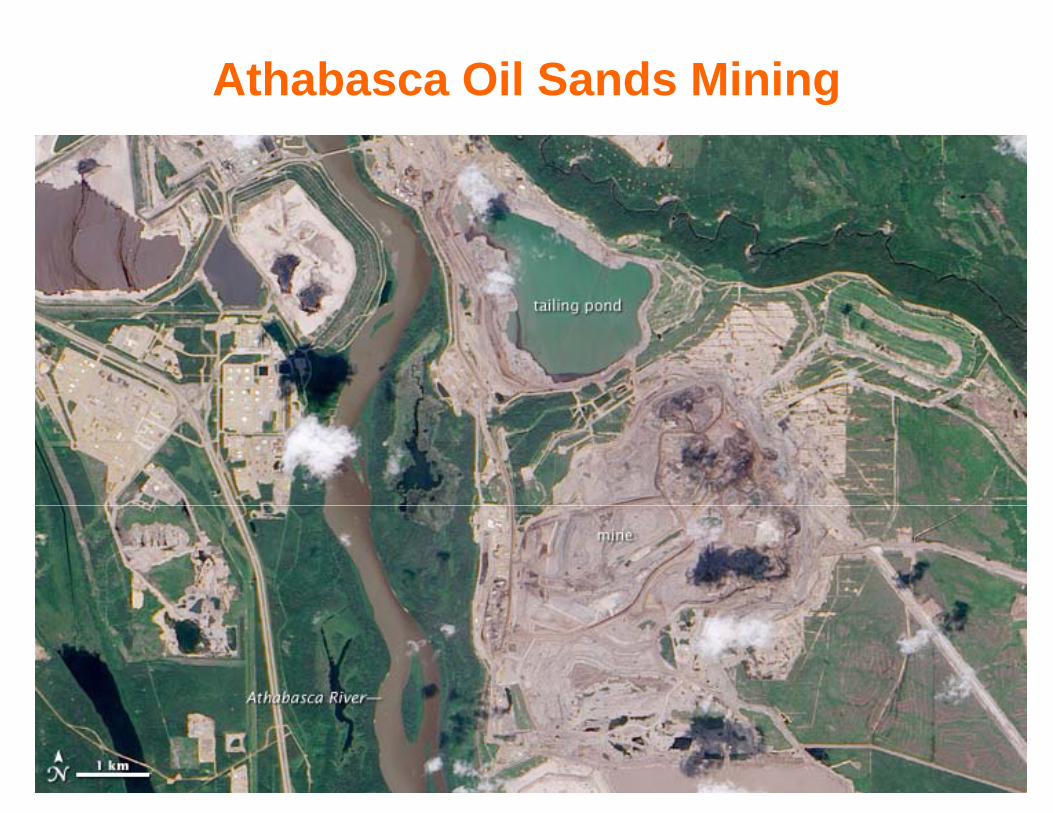
Athabasca Oil Sands Mining
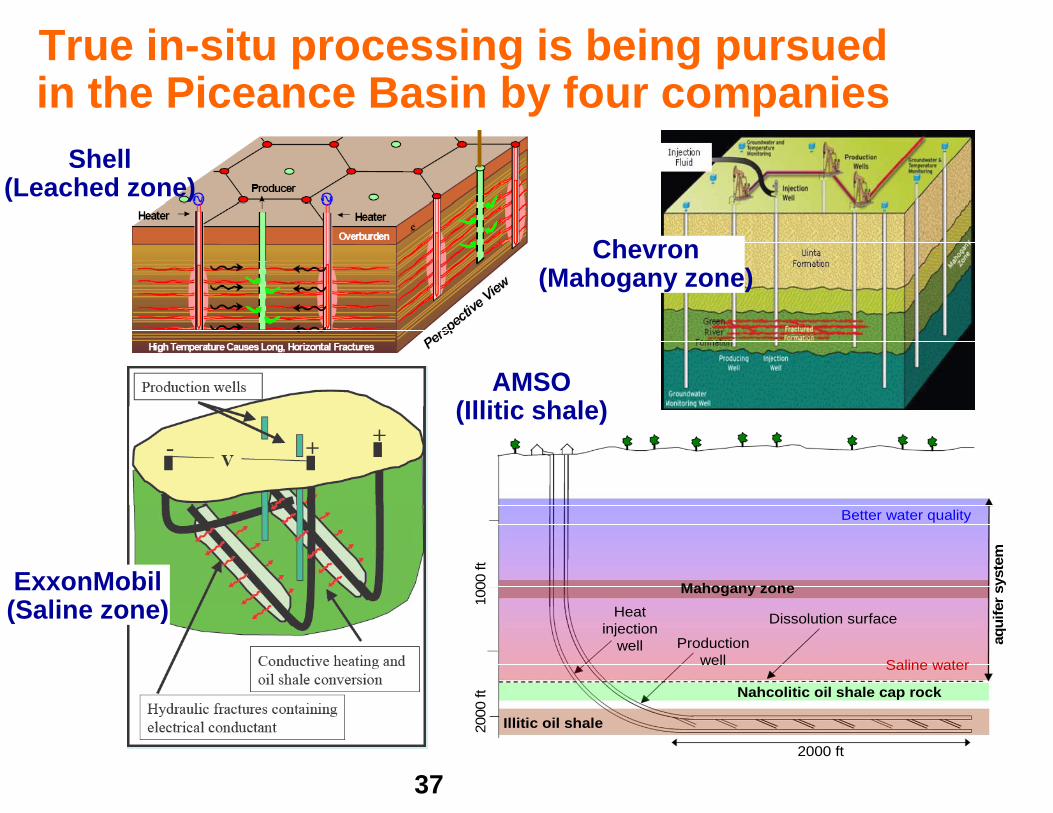
True in-situ processing is being pursued in the Piceance Basin by four companiesy p
Shell(Leached zone)
Chevron(Mahogany zone)
AMSO(Illitic shale)(Illitic shale)
ExxonMobil(S li )
Mahogany zone
Better water quality
1000
ft
er s
yste
m
(Saline zone)
Nahcolitic oil shale cap rock
Saline water
Dissolution surface
0 ft
aqui
feHeat injection
well Production well
372000 ft
Illitic oil shale2000
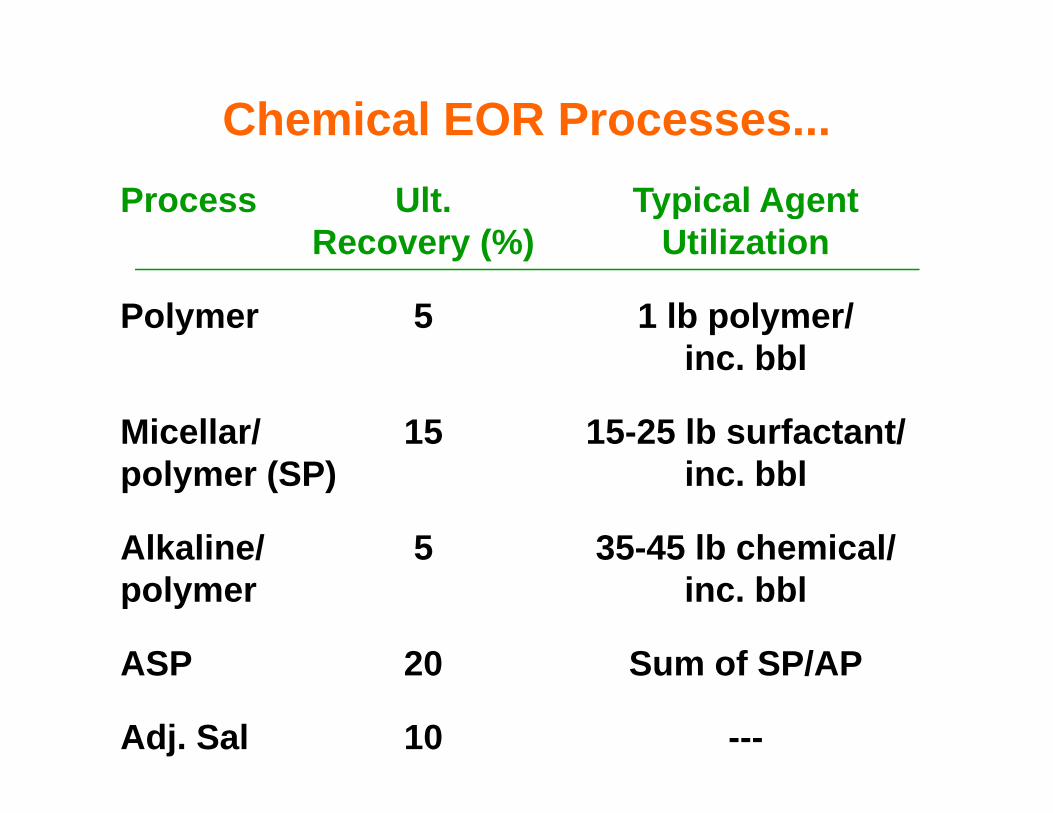
Chemical EOR ProcessesChemical EOR Processes...Process Ult. Typical AgentProcess Ult. Typical Agent
Recovery (%) Utilization
P l 5 1 lb l /Polymer 5 1 lb polymer/inc. bbl
Micellar/ 15 15-25 lb surfactant/polymer (SP) inc. bbl
Alkaline/ 5 35-45 lb chemical/polymer inc. bblp y
ASP 20 Sum of SP/AP
Adj. Sal 10 ---
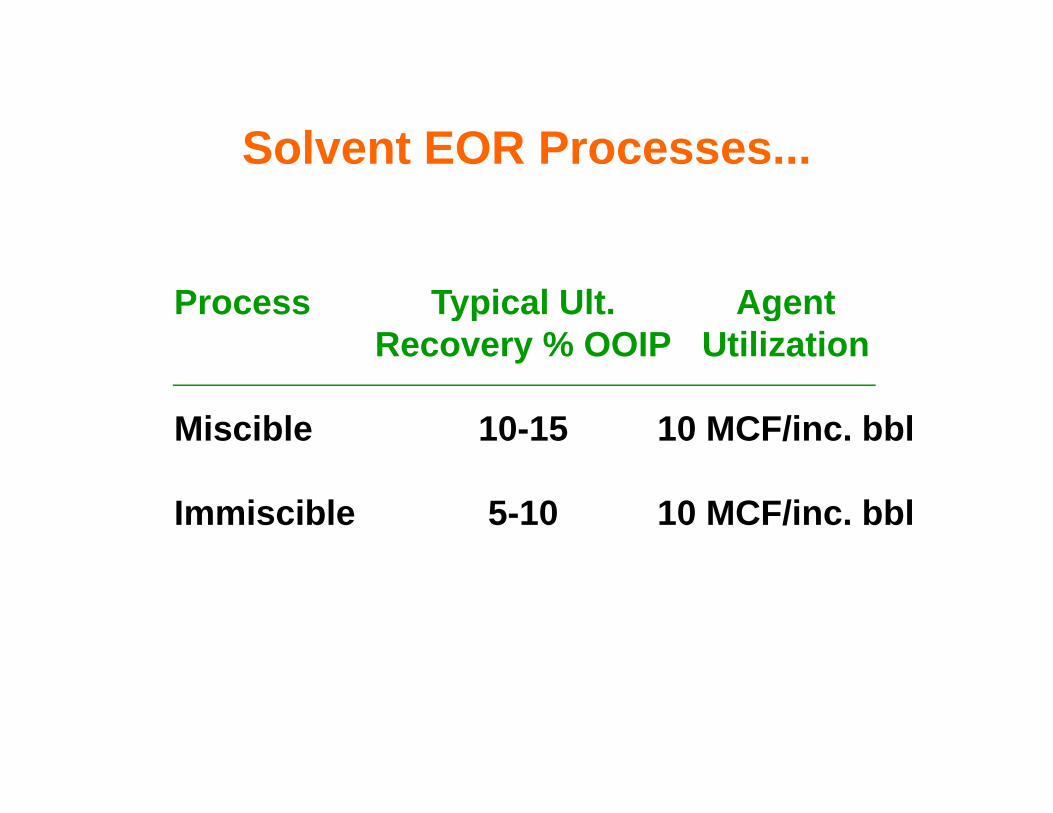
Solvent EOR Processes...
Process Typical Ult AgentProcess Typical Ult. AgentRecovery % OOIP Utilization
Miscible 10-15 10 MCF/inc. bbl
I i ibl 5 10 10 MCF/i bblImmiscible 5-10 10 MCF/inc. bbl
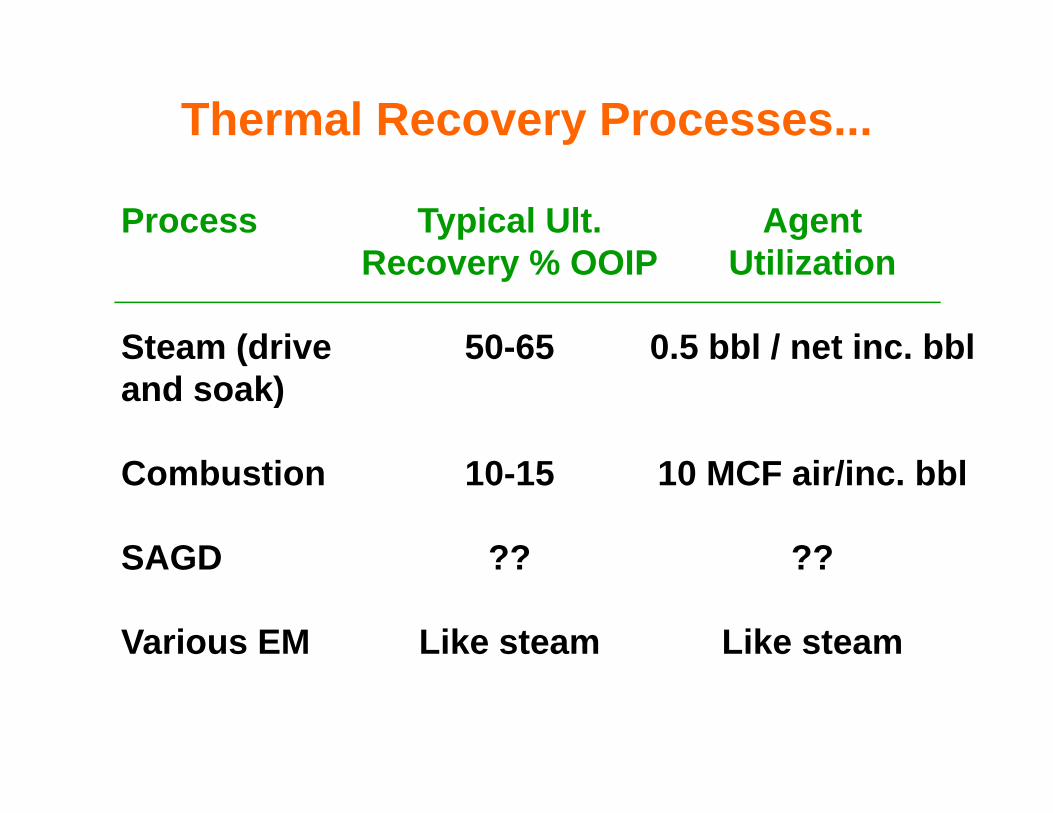
Thermal Reco er ProcessesThermal Recovery Processes...
P T i l Ult A tProcess Typical Ult. AgentRecovery % OOIP Utilization
Steam (drive 50-65 0.5 bbl / net inc. bbland soak))
Combustion 10-15 10 MCF air/inc. bbl
SAGD ?? ??
Various EM Like steam Like steam


