Is it even - Sport for Lifesportforlife.ca/wp-content/uploads/2017/06/A4.1-Injury... · Gatineau,...
9
17-02-15 1 Injury Surveillance: What Gets Measured, Gets Managed Canadian Sport for Life Summit Gatineau, QC | January 2017 Is it even possible to prevent sport injuries? “The aetiology, risk factors and exact mechanisms of injuries need to be identified before initiating a measure or programme for preventing sports injuries, and measurement of the outcome (injury) must include a standardised definition of the injury and its severity, as well as a systematic method of collecting the information.” Parkkari J, Kujala UM, Kannus P. (2001). Is it possible to prevent sports injuries? Review of controlled clinical trials and recommendations for future work. Sports Med. 31(14):985-95.
Transcript of Is it even - Sport for Lifesportforlife.ca/wp-content/uploads/2017/06/A4.1-Injury... · Gatineau,...

17-02-15
1
Injury Surveillance: What Gets Measured, Gets Managed
Canadian Sport for Life Summit Gatineau, QC | January 2017
Is it even possible to
prevent sport injuries?
“The aetiology, risk factors and exact mechanisms of injuries need to be identified before initiating a
measure or programme for preventing sports injuries, and measurement of the outcome (injury) must include a standardised definition of the injury and its severity, as well as a systematic method of
collecting the information.”
Parkkari J, Kujala UM, Kannus P. (2001). Is it possible to prevent sports injuries? Review of controlled clinical trials and recommendations for future work. Sports Med. 31(14):985-95.
17-02-15
2
Frameworks for prevention
Sequenceofpreven3oninfoursteps,adaptedfromVanMechelenetal.
Frameworks for prevention
Finch, C. (2006). A new framework for research leading to sports injury prevention. Journal of Science and Medicine in Sport / Sports Medicine Australia, 9(1-2), 3–9; discussion 10.
In both models, the first step is
the same
Towards a national strategy…
• Build on the strength of our networks
• Leverage the expertise of our networks
• Drive the opportunity to lead in sport safety
• Support the relationship between safety and overall healthy outcomes
Reliable injury data
Injury prevention
policies Funding policies
Sport Safety

17-02-15
3
Reliable injury data
Injury prevention
policies Funding policies
Sport Safety
Reliable injury data
• Standardized data collection
• Web-enabled
• Accessible
• Multi-lingual
• Secure and compliant with PHIPA, PIPEDA
Reliable injury data
Injury prevention
policies Funding policies
Sport Safety
Injury prevention policies
• Comprehensive policies
• Moving away from micro-policy approach
• Alignment with international best-practices
Reliable injury data
Injury prevention
policies Funding policies
Sport Safety
Funding & governance policies linked to safety practices
• Measure and reward organizational safety efforts: – Recorded injuries (type/severity/location)
– Policy implementation
– Education efforts – Evaluation of changes over period of time (+/-)
– Capacity building (investing in safety)
17-02-15
4
Reliable injury data
Injury prevention
policies Funding policies
Sport Safety
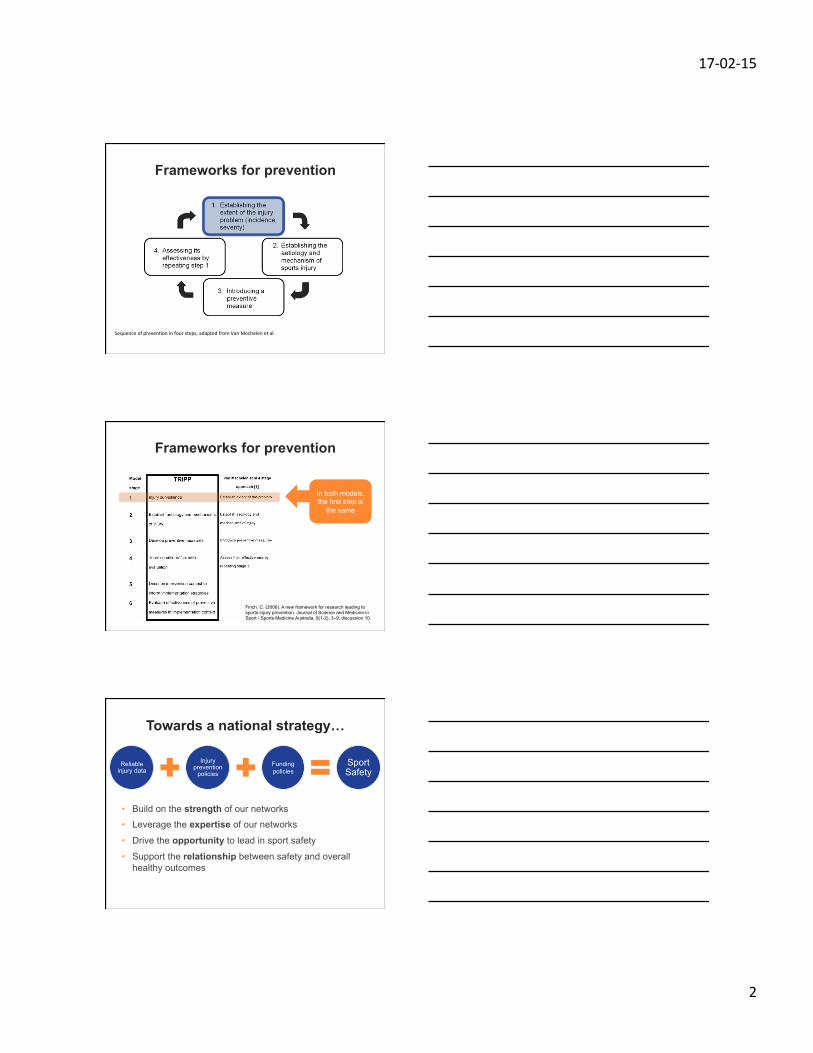
Safety outcomes
• Short-term: – Lower rates of injury – Lower severity of injury – Participant retention
• Long-term: – Physically literate population – Lifelong participation in physical activity – Reduced risk for chronic disease and injury
Sport safety starts with
injury surveillance
Play Safe Injury Tracker
1. Free for organizations to use
2. Adopts internationally recognized methodology
3. Built on a robust web-enabled platform using cloud technology
4. Collected data is stored on secure servers in Canada in compliance with all privacy legislation
5. Data collected by an organization is owned wholly by the organization

17-02-15
5
Try it now!
13
hBps://playsafe.fluidsurveys.com/s/_demo/
Reports:
• View real-time reports • Access individual reports • Access raw data, download to Excel
or statistics packages
hBps://playsafe.fluidsurveys.com/share/461212b4a09e6002c0c3/
Sex of injured person:

17-02-15
6
Type of activity at time of injury:
Reason for presentation:
Type of injury:
Response Chart Percentage CountAbrasion/graze/blister 30.2% 42
Amputa8on 36.0% 50
Bruise/contusion 49.6% 69
Concussion 33.1% 46
Cut/openwound/lacera8on 56.8% 79
Crushinjury 33.8% 47
Dentalinjury/brokentooth 30.9% 43
Disloca8on/subluxa8on 41.7% 58
Fracture(includingsuspected) 44.6% 62
Musclecrampsorspasm 59.0% 82
Nerveinjury/spinalcordinjury 100.0% 139
Overuseinjurytomuscleortendon 46.0% 64
Sprain(e.g.ligamenttear) 27.3% 38
Strain(e.g.muscletear) 54.7% 76
Swelling/inflamma8on 51.1% 71
TotalResponses 139
17-02-15
7
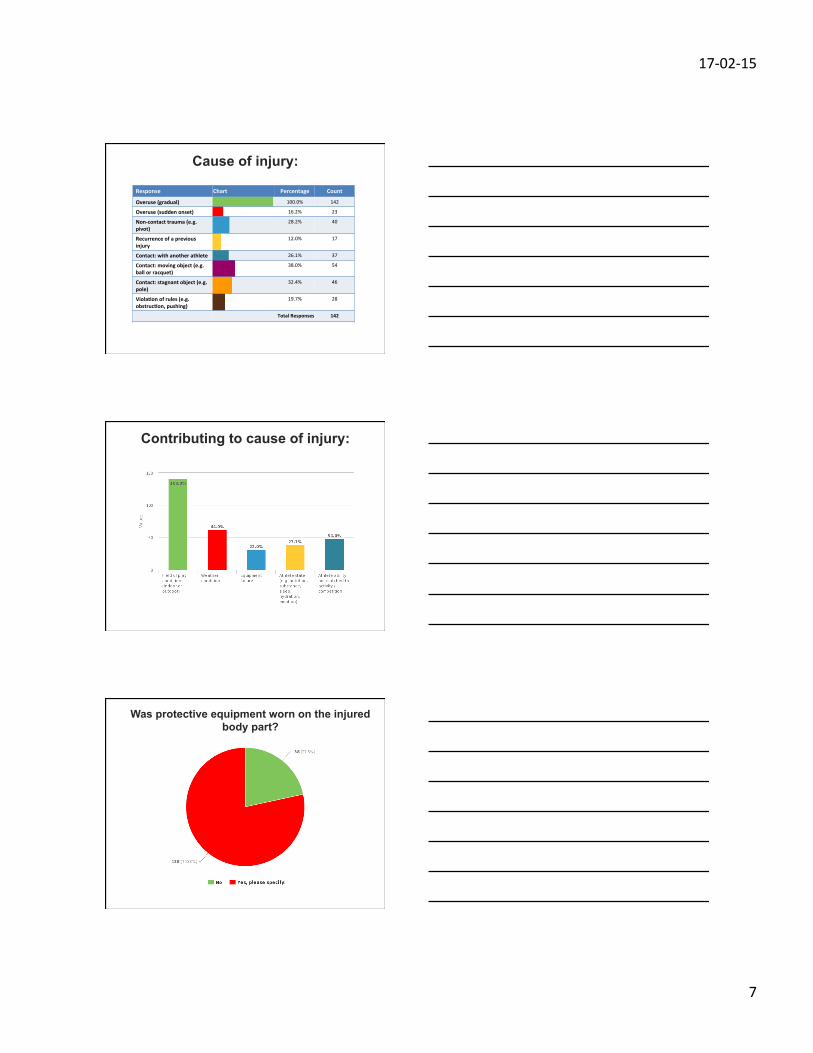
Cause of injury:
Response Chart Percentage Count
Overuse(gradual) 100.0% 142
Overuse(suddenonset) 16.2% 23
Non-contacttrauma(e.g.pivot)
28.2% 40
Recurrenceofapreviousinjury
12.0% 17
Contact:withanotherathlete 26.1% 37
Contact:movingobject(e.g.ballorracquet)
38.0% 54
Contact:stagnantobject(e.g.pole)
32.4% 46
Viola8onofrules(e.g.obstruc8on,pushing)
19.7% 28
TotalResponses 142
Contributing to cause of injury:
Was protective equipment worn on the injured body part?

17-02-15
8
Initial treatment provided:
Response Chart Percentage Count
Nonegiven(notrequired) 26.8% 37
RICER(Rest,Ice,Compression,Eleva8on,Referral)
33.3% 46
Sling/splint 100.0% 138
Dressing/bandage 17.4% 24
Crutches 42.0% 58
CPR 46.4% 64
Stretch/exercises 20.3% 28
Tapingonly 22.5% 31
Nonegiven-referredelsewhere
38.4% 53
TotalResponses 138
Immediate advice given:
Thank you
Susan Forbes, PhD Adjunct Professor University of Ontario Institute of Technology Faculty of Health Sciences [email protected]
Brandy Tanenbaum, MPH, CRM Program Coordinator Sunnybrook Health Sciences Centre Office for Injury Prevention [email protected] @_playsafe

17-02-15
9
Play Safe - Objectives
• Provide a platform for organizations to collaborate. Connect
• Develop and sustain this community with research, education and resources. Capacity
• Shift the injury paradigm from “accidental” to preventable. Change
Play Safe - Key Assumptions
• Organizations vary based on human, financial and cultural factors.
One size does not fit
all
• Participation occurs concurrently in different "spheres" yet the participant remains constant
Participant- centred efforts
• Preventing the first injury is more manageable and cost-effective than RTP and RTADL.
It’s better to prevent first