Ireland’s results and science - ERC
95
Rachel Perkins and Aidan Clerkin Ireland’s results in mathematics and science Educational Research Centre 2020 TIMSS 2019
Transcript of Ireland’s results and science - ERC

Rachel Perkinsand Aidan Clerkin
Ireland’s resultsin mathematics
and science
Educational ResearchCentre 2020
TIMSS2019

Rachel Perkinsand Aidan Clerkin
Ireland’s resultsin mathematics
and science
Educational ResearchCentre 2020
TIMSS2019
Copyright © 2020, Educational Research Centrewww.erc.ie/timss
Cataloguing-in-publication data:Perkins, RachelTIMSS 2019: Ireland’s results in mathematics and science / Rachel Perkins and Aidan Clerkin.Dublin: Educational Research Centre.
viii, 85 p. : illustrations, tables, graphs ; 30cmIncludes bibliography.
ISBN10: 0-900440-92-9 (print)ISBN13: 978-0-900440-92-2 (print)EAN: 9780900440922
ISBN10: 0-900440-93-7 (PDF)ISBN13: 978-0-900440-93-9 (PDF)EAN: 9780900440939
1. Education, Primary – Ireland 2. Education, Secondary – Ireland 3. Mathematics 4. Science 5. Trends in International Mathematics and Science Study (TIMSS)
2020I Title. II Perkins, Rachel III Clerkin, Aidan371.26209417--dc23
How to cite this report:Perkins, R. & Clerkin, A. (2020). TIMSS 2019: Ireland’s results in mathematics and science. Dublin: Educational Research Centre.
Design: Cheryl Flood Designs.Printed in the Republic of Ireland by Naas Printing Ltd.

Contents
Preface v
Acknowledgements vi
Acronyms and Abbreviations vii
Chapter 1: Introduction 1
Chapter 2: TIMSS in Ireland 9
Chapter 3: Mathematics and science: Main results 13
Chapter 4: Distribution of achievement 22
Chapter 5: Performance at International Benchmarks 28
Chapter 6: Performance in content and cognitive domains: Mathematics 41
Chapter 7: Performance in content and cognitive domains: Science 48
Chapter 8: Curriculum coverage in TIMSS 55
Chapter 9: Summary 65
References 73
Appendix A: National Advisory Committees 74
Appendix B: Percentiles of achievement 75
Appendix C: Standard errors for mean scores on content and cognitive subscales 77
Appendix D: Teacher reports of topic coverage 81
iiiTIMSS 2019 Ireland’s results in mathematics and science

TIMSS 2019 Ireland’s results in mathematics and scienceiv

PrefaceTIMSS (Trends in International Mathematics and Science Study) is one of the world’s largest studies in education. The study, which is a project of the International Association for the Evaluation of Educational Achievement (IEA), began in 1995 and takes place every four years. It assesses the mathematical and scientific skills of students at Fourth and Eighth grades (Fourth Class and Second Year in Ireland). In 2019, 64 countries and eight benchmarking participants (i.e., subnational entities) took part in TIMSS 2019 at one or both grade levels. Ireland has taken part in four cycles of TIMSS: in 1995, 2015 and 2019 at both primary and post-primary levels and at primary level only in 2011. TIMSS 2019 was the first cycle of the study to offer the assessment on a digital platform. Half of countries that took part in TIMSS 2019 opted to deliver the assessment digitally while the other half, including Ireland, administered the paper-based version of the assessment.
In Ireland, 150 primary and 149 post-primary schools took part in the study in March and April 2019. In total, over 8,500 students took part in TIMSS 2019 in Ireland. As well as completing tests of mathematics and science, students were asked to fill out a questionnaire which asked them about their home background as well as their experience of school and their attitudes towards learning mathematics and science. Teachers were also asked to complete questionnaires about the students’ mathematics and science lessons, while the principal of each participating school was asked about the school environment and resources. At Fourth Class, the parents of participating students were asked to complete a questionnaire about the home environment, which included questions about homework, early learning activities and parents’ beliefs about their child’s schooling.
This report presents the initial findings for Ireland from TIMSS 2019. The main achievement findings for students in Fourth Class and Second Year are described in comparison to their peers in other countries, as well as to the performance of Irish students in previous cycles of the study. To facilitate a clear presentation of findings, international comparisons are limited in some chapters to a small number of countries that are of particular interest. The full international results can be found in TIMSS 2019 International Results in Mathematics and Science (Mullis, Martin, Foy, Kelly & Fishbein, 2020).
Chapter 1 provides a general introduction to TIMSS 2019, while Chapter 2 focuses specifically on the implementation of TIMSS 2019 in Ireland. The main mathematics and science results for both grades are presented in Chapter 3, including comparisons between girls and boys, and comparisons over time from 1995 to 2019. Chapter 4 describes the performance of the ‘highest-’ and ‘lowest-achieving’ students on the assessment. Chapter 5 presents student achievement with reference to four internationally-defined Benchmarks of achievement, each of which describes the types of mathematical or scientific skills that students reaching that level can typically demonstrate. Chapter 6 presents performance across the content and cognitive domains for mathematics, highlighting relative strengths and weaknesses within countries. Chapter 7 presents similar information for science, based on the scientific content and cognitive subscales. Chapter 8 describes a Test-Curriculum Matching Analysis which compares the curricula in each country against the TIMSS assessment frameworks, and describes how performance across countries may differ if students were only presented with items that were covered on their relevant curricula. Finally, Chapter 9 provides a summary of the main findings.
In 2021, the Educational Research Centre will publish two follow-up reports, one for each grade level, which will examine the results for Ireland in more detail using contextual information provided by students, parents, principals and teachers. More information on TIMSS in Ireland, including access to national reports for previous cycles, is available at www.erc.ie/timss.
vTIMSS 2019 Ireland’s results in mathematics and science

Acknowledgements
The authors would like to acknowledge the contributions of the members of the National Advisory Committees, at both primary and post-primary levels, who provided ongoing guidance and feedback during the implementation of TIMSS 2019 in Ireland. The membership of both committees is given in full in Appendix A.
Thanks are also due to staff at the Educational Research Centre, including Jude Cosgrove (current CEO) and Peter Archer (former CEO) for their guidance and support throughout the study and to Eemer Eivers who was a Research Fellow on TIMSS at the early stages of the study. Thanks also to Anne Comey, Patricia Gaffney and Imelda Pluck, who provided administrative support. We would also like to extend our appreciation to Fionnuala Shortt, Emma Chubb, Sarah McAteer, Mary Delaney, John Coyle, Rachel Cunningham and Theresa Walsh who worked on various aspects of the study. We thank the Inspectorate of the Department of Education for their coordination of a National Quality Control Monitoring programme to ensure that the administration of TIMSS in Ireland met with international standards.
Finally, we especially thank the many students, school principals, school coordinators, teachers, and parents who participated in TIMSS 2019 in Ireland. Without their willingness to participate and their continued support throughout the administration, this study and the findings arising from it would not be possible.
TIMSS 2019 Ireland’s results in mathematics and sciencevi

Acronyms and Abbreviations
DEIS Delivering Equality of Opportunity in SchoolsDE Department of EducationERC Educational Research CentreeTIMSS electronic Trends in International Mathematics and Science StudyGDPR General Data Protection RegulationICT Information and Communication TechnologyIEA International Association for the Evaluation of Educational AchievementISCED International Standard Classification of EducationNCCA National Council for Curriculum and AssessmentPISA Programme for International Student AssessmentPSI Problem Solving and InquirySD Standard DeviationSE Standard ErrorTCMA Test-Curriculum Matching AnalysisTIMSS Trends in International Mathematics and Science Study
viiTIMSS 2019 Ireland’s results in mathematics and science

TIMSS 2019 Ireland’s results in mathematics and scienceviii

Chapter 1: Introduction
1TIMSS 2019 Ireland’s results in mathematics and science
Chapter 1: Introduction Trends in International Mathematics and Science Study (TIMSS) assesses the mathematics and science skills of students in Fourth grade (Fourth Class) and Eighth grade (Second Year). Ireland was one of 64 countries to participate in TIMSS in 2019.
In this report, we use Fourth grade and Eighth grade to refer to the two internationally-defined grade levels that are assessed by TIMSS in all countries.
In Ireland, these grade levels are known as Fourth Class and Second Year. We use these terms when referring specifically to the results for Ireland.
Overview of TIMSS 2019
TIMSS 2019 is the seventh cycle of TIMSS to be completed. The study has been conducted every four years since 1995. It is overseen by the International Association for the Evaluation of Educational Achievement (IEA). The study is coordinated internationally by the International Study Centre at Boston College (USA), with support on sampling from Statistics Canada (Canada) and IEA-Hamburg (Germany), operational support and quality control from IEA-Amsterdam (Netherlands), and data processing and software support from IEA-Hamburg. Each participating country also nominates a national centre and national research coordinator to be responsible for implementing TIMSS locally.
Ireland has participated in the study on four occasions: in 1995, 2011 (at Fourth grade only), 2015, and 2019. TIMSS is one of the studies used by the Department of Education to inform and evaluate the outcomes of the National Strategy: Literacy and Numeracy for Learning and Life 2011-2020 (Department of Education and Skills, 2011; 2017). In Ireland, the Educational Research Centre implements TIMSS on behalf of the Department of Education.
The primary purpose of TIMSS is to gather high-quality data on students’ levels of achievement in two key domains of study – mathematics and science – at both primary (Fourth grade) and post-primary (Eighth grade) levels. Supporting this purpose are several additional aims, which include (a) reliably monitoring trends and changes over time; (b) assessing levels of achievement among both lower- and higher-performing students; (c) gathering contextual information from students, parents, teachers, and school principals in order to better understand the factors associated with learning; and (d) gathering information on national curricula and policies, which provide localised information on the context within which student achievement in each jurisdiction can be interpreted.
Who took part in TIMSS 2019?
As shown in Table 1.1, 64 countries and 8 benchmarking participants (72 participants in total) took part in TIMSS 2019. Benchmarking participants are sub-national regions or cities that follow the same sampling and administrative procedures as countries in order to attain robust information at that level. For example, students in Madrid are part of the overall Spanish national sample, but a separate sample of students in Madrid was also drawn to participate separately to produce scores for Madrid as a benchmarking entity. For brevity, this report will generally refer to country-level results unless there is reason to draw attention to benchmarking participants.

Chapter 1: Introduction
TIMSS 2019 Ireland’s results in mathematics and science2
Countries could elect to take part in TIMSS at Fourth grade (students approximately aged 10 years old and in the fourth year of formal education1), Eighth grade (students aged approximately 14 years old and in the eighth year of formal education), or at both levels. In the 2019 assessment, 33 countries (including Ireland) and five benchmarking participants administered TIMSS at both grade levels. Twenty-five countries and one benchmarking participant took part only at Fourth grade, while six countries and two benchmarking participants took part only at Eighth grade. This means that, in total, 58 countries took part in TIMSS 2019 at Fourth grade and 39 countries took part at Eighth grade.
TIMSS 2019 is the first cycle to offer the TIMSS assessment via computer or tablet. Countries could choose between a paper-based or an electronic version of the assessment, known as eTIMSS. Equal numbers of countries assessed their students in each format (Table 1.1). Thirty-two countries administered the assessment electronically, while 32 countries (including Ireland) administered the assessment on paper. Of the eight benchmarking participants, six administered eTIMSS and two used the paper-based format.
eTIMSS included the same items used in the paper-based TIMSS mathematics and science assessments as well as additional interactive Problem Solving and Inquiry tasks (PSIs). Countries that administered eTIMSS also administered items in paper format in a smaller additional ‘bridge’ sample in order to assess any differences in item difficulty between the two formats. International reporting on the PSIs is forthcoming in 2021. The current report presents data based on the items common to TIMSS in both paper and online formats, which were placed on the same reporting scale and linked to previous TIMSS assessments for both sets of countries (see Martin, von Davier & Mullis [2020] for more information on the methods and procedures used to link paper TIMSS and eTIMSS assessments).
Internationally, approximately 672,000 students took part in TIMSS 2019 (384,000 in Fourth grade and 288,000 in Eighth grade), as well as their parents, teachers, and principals.
1 ‘Formaleducation’countingfromthefirstyearofISCEDLevel1(Mullis&Martin,2017).InIreland,thiscorrespondstoFirstClass.

Chapter 1: Introduction
3TIMSS 2019 Ireland’s results in mathematics and science
Table 1.1: Participating countries and benchmarking participants in TIMSS 2019
Fourth grade and Eighth grade Fourth grade only Eighth grade onlyAustralia Russian Federation Albania EgyptBahrain Saudi Arabia Armenia IsraelChile Singapore Austria JordanChinese Taipei South Africa (G5 and G9) Azerbaijan LebanonCyprus Sweden Belgium (Flemish) MalaysiaEngland Turkey (G5) Bosnia and Herzegovina RomaniaFinland United Arab Emirates (UAE) BulgariaFrance United States CanadaGeorgia CroatiaHong Kong SAR Czech RepublicHungary DenmarkIran, Islamic Rep. of GermanyIreland KosovoItaly LatviaJapan MaltaKazakhstan MontenegroKorea, Rep. of NetherlandsKuwait North MacedoniaLithuania Northern IrelandMorocco PakistanNew Zealand PhilippinesNorway (G5 and G9) PolandOman SerbiaPortugal Slovak RepublicQatar Spain
Benchmarking participants
Ontario (Canada) Abu Dhabi (UAE) Madrid (Spain) Gauteng (South Africa) (G9)
Quebec (Canada) Dubai (UAE) Western Cape (South Africa) (G9)Moscow (Russian Federation)
Note: Countries in bold participated in the eTIMSS assessment. G5 = Grade 5. G9 = Grade 9.
What does TIMSS assess?
TIMSS examines student performance in the two domains of mathematics and science, following the assessment frameworks described by Mullis and Martin (2017). The final Fourth grade assessment includes 171 mathematics items (questions) and 169 science items. The Eighth grade assessment includes 206 mathematics items and 211 items assessing science.
In both domains, each item is classified in the assessment framework under one content domain (i.e., a subdomain of mathematics or science) and one cognitive domain (i.e., the type of thinking needed to answer the question correctly). For both science and mathematics, at both levels, there are three cognitive domains – Knowing, Applying, and Reasoning – which are assessed in varying proportions

Chapter 1: Introduction
TIMSS 2019 Ireland’s results in mathematics and science4
at each grade level (Table 1.2 and Table 1.3). Items assessing Knowing are relatively more common at Fourth grade, and items assessing Reasoning at Eighth grade.
The proportion of the assessment allocated to covering each content domain differs for Fourth grade and Eighth grade, although the content areas at both grades are related (Table 1.2 and Table 1.3). For example, the assessment framework specifies that 50% of the mathematics assessment at Fourth grade is devoted to items assessing Number, whereas the equivalent percentage at Eighth grade is 30%. Algebra is allocated 30% of the Eighth grade assessment but does not appear as a separate content area at Fourth grade (where some pre-algebra items are included under the Number content domain). Data (and Probability) items comprise 20% of the assessment at both grade levels, with the remainder devoted to (Measurement and) Geometry (30% at Fourth grade and 20% at Eighth grade).
Life Science makes up almost half (45%) of the Fourth grade science assessment. Biology, the corresponding content domain at Eighth grade, makes up about one-third (35%) of that assessment. Earth Science makes up 20% of the assessment at both grades. Earth Science includes topics such as climate, erosion, and the solar system, some of which would generally be covered in geography (rather than science) lessons in Ireland. Finally, Physical Science is allocated 35% of the assessment at Fourth grade. The corresponding areas, Physics and Chemistry, are presented separately at Eighth grade and are allocated 25% and 20%, respectively, of the item coverage.
The distribution of items included in the final TIMSS 2019 assessment was very close to the desired distributions specified in the assessment frameworks (Table 1.2 and Table 1.3). The final pool included new items written and piloted for TIMSS 2019, in addition to trend items carried forward from previous cycles.
Table 1.2: TIMSS 2019 assessment frameworks by target and final achieved percentage devoted to each content and cognitive domain – Fourth grade
Content Target %
Final %
Cognitive Target %
Final %
MathematicsNumber 50 47 Knowing 40 33
Measurement and Geometry 30 31 Applying 40 43Data 20 23 Reasoning 20 24
ScienceLife Science 45 46 Knowing 40 43
Physical Science 35 35 Applying 40 36Earth Science 20 19 Reasoning 20 21
Source: Mullis and Martin (2017) and Martin, von Davier and Mullis (2020).

Chapter 1: Introduction
5TIMSS 2019 Ireland’s results in mathematics and science
Table 1.3: TIMSS 2019 assessment frameworks by target and final achieved percentage devoted to each content and cognitive domain – Eighth grade
Content Target %
Final %
Cognitive Target %
Final %
Mathematics
Number 30 30 Knowing 35 30Algebra 30 29 Applying 40 45
Geometry 20 21 Reasoning 25 25Data and Probability 20 20
Science
Biology 35 35 Knowing 35 36Chemistry 20 20 Applying 35 37
Physics 25 25 Reasoning 30 26Earth Science 20 20
Source: Mullis and Martin (2017) and Martin, von Davier and Mullis (2020).
Each item was assigned to one of 14 ‘blocks’ per domain per grade level. These blocks were combined into 14 test booklets in a rotated overlapping design. This means that some of the content of Booklet 1 was shared with Booklet 2, some of Booklet 2 was shared with Booklet 3, and so on. This enables direct linkages to be made across all the items covering the assessment framework, even though any individual student received only a subset of the items. All 14 test booklets contained two blocks of mathematics items and two blocks of science items.
Items were presented to students in either multiple-choice or constructed-response format. Multiple-choice items ask students to select the correct answer from several possibilities. This often required selecting one of four response options, although some items allowed students to select multiple options from several provided. Constructed-response items require students to generate their own response to a question. Depending on the domain (mathematics or science) and the particular item, these responses can range from a single number to a full paragraph, or from a simple line or dot (in the correct location) to a more complex drawing.
For mathematics, at both grade levels, approximately equal numbers of multiple-choice and constructed-response items were included in the final assessment (Martin, von Davier & Mullis, 2020). For science, at both grades, multiple-choice items comprised about 60% of the assessment, with the remainder composed of constructed-response items.
As part of the eTIMSS assessment, students were also presented with a number of PSI (Problem-Solving Inquiry) tasks which included a wider choice of digital features and aimed to improve measurement of higher-order skills in mathematics and science. These tasks are not included in the TIMSS scores presented in this report. The results of the eTIMSS PSIs will be presented in a separate international report to be published in 2021.
Further, some countries with a majority of children still developing fundamental mathematics skills at Fourth grade participated in a ‘less difficult’ mathematics assessment as part of TIMSS 2019. These countries administered the same Fourth grade science assessment as in other countries, but administered a mathematics assessment that, while equivalent in scope, involved less complex numbers and situations (Martin, von Davier & Mullis, 2020). The regular and less difficult mathematics assessments at Fourth grade were placed on the same scale, allowing comparison of mathematics performance among these countries.

Chapter 1: Introduction
TIMSS 2019 Ireland’s results in mathematics and science6
Contextual information
TIMSS collects a variety of contextual information in addition to estimates of achievement in science and mathematics (Table 1.4). The contexts for which data are gathered range from the national- or system-level (Curriculum Questionnaire, TIMSS Encyclopaedia, Test-Curriculum Matching Analysis) to the school level (School Questionnaire) to the class-level (Teacher Questionnaire) and the student-level (Student Questionnaire, Home Questionnaire). At the school, class, and student levels, questionnaire data can be linked directly to students’ achievement.
Table 1.4: Summary of data gathered and data sources for TIMSS 2019
Type of data Source Instrument
Mathematics achievement Student Test (eTIMSS and paper)
Science achievement Student Test (eTIMSS and paper)
Problem Solving and Inquiry tasks (PSIs) Student Test (eTIMSS only)
Personal characteristics (e.g., attitudes) Student Student Questionnaire
Home background (Fourth Class only) Parents Early Learning Survey (Home Questionnaire)
Classroom environment and teaching practices Teachers Teacher Questionnaire
School environment and resources Principals School Questionnaire
Overlap between national curriculum and TIMSS assessment Subject experts Test-Curriculum Matching
Analysis
Structure and policies of the national education system DE / NCCA / ERC Curriculum Questionnaire and
Encyclopaedia country chapter
The TIMSS Encyclopaedia, which contains a chapter describing the educational system in each country (including Ireland) and a set of exhibits comparing national policies in key areas, can be viewed at https://timssandpirls.bc.edu/timss2019. The Irish national questionnaire data from school principals, teachers, students, and parents will be presented in follow-on reports, currently scheduled for publication by the Educational Research Centre in late 2021.
Although this initial report primarily focuses on the achievement outcomes at Fourth Class and Second Year, the findings of the Test-Curriculum Matching Analysis and a selected set of items from the teacher questionnaire related to curriculum coverage are presented in Chapter 8. This additional information is intended to provide useful curricular context to the results.

Chapter 1: Introduction
7TIMSS 2019 Ireland’s results in mathematics and science
How to interpret the analyses in this report
The following notes can be used to interpret the results reported in the following chapters:
• Scale scores: Student achievement is reported on a scale that was set to a centrepoint of 500 in 1995 (see below) and a standard deviation (SD) of 100. This means that in 1995 68% of students’ scores fell between 400 and 600 on the scale (i.e., 500 ± 1 SD), and 95% of scores fell between 300 and 700 (i.e., 500 ± 2 SD). The scales for both domains were set to the centrepoint of 500 in the same way, but they are constructed independently and should be considered separate. It would not be correct to say that a student who achieves a mathematics score of 520 and a science score of 520 is equally proficient at mathematics and science. Performance is relative to other students within a domain, but not across domains.
• Centrepoint: Performance in TIMSS is reported with reference to a scale that was set to have a centrepoint of 500. This represents the mean (average) international performance from the first TIMSS assessment, in 1995. Subsequent iterations of the study have retained this marker as the scale centrepoint (i.e., as a constant point of reference between assessments). This means that, although it is no longer an international average, countries that take part in multiple cycles can monitor how their national performance changes over time with reference to this constant.
• Subscales (content and cognitive domains): As well as the overall mathematics and science results, subscales are calculated for each cognitive and content domain (Number, Earth Science, Reasoning, etc.). These subscales are created independently of the main scales by using only the subset of items that belong to that content or cognitive domain, and are also set to a centrepoint of 500.
• Scale scores and uncertainty: The tables in the following chapters report both mean scores (average performance) and standard errors (SE; a measure of uncertainty around the mean). TIMSS assesses a sample of students in each country, rather than all students, and each student only attempts a subset of test items. Therefore, estimates of achievement are prone to uncertainty arising from this sampling and measurement error. The reported mean scores that are based on the sample’s performance should be regarded as estimates of the true population score that might be expected if all students had taken the test. A smaller standard error represents a better estimate, while a larger standard error represents more uncertainty (e.g., if there are relatively few students in a particular subgroup).
• Confidence intervals: A 95% confidence interval can be constructed for any mean score by multiplying the SE by 1.96 and then adding/subtracting the result to/from the mean score. For a quick approximation, the SE can be multiplied by 2. For example, the confidence interval around a mean score of 520 (SE = 3) is roughly 514-526. This means that, if we repeated the survey on many occasions under the same conditions, we would expect the true population score to fall within this range 95% of the time. Smaller SEs indicate a smaller confidence interval and an estimated mean more likely to be close to the true score.
• Statistical significance: We describe a difference in performance as statistically significant if the difference is large enough and reliable enough that we can be confident that the difference reported is unlikely to have occurred by chance. Statistical significance tests are reported at the 95% confidence level and measurement and sampling error are accounted for in the statistical comparisons. In general, if the confidence intervals around two means do not overlap (e.g., 514-525 vs 527-531), the difference between them is statistically significant. Where reference is made

Chapter 1: Introduction
TIMSS 2019 Ireland’s results in mathematics and science8
to a significant difference (i.e., significantly lower or higher) in this report, a test of statistical significance has been conducted. Readers should note that statistical significance refers to the probability of an observed difference occurring by chance if no true difference exists. It does not necessarily imply that a difference is substantive or meaningful in terms of its implications for policy or practice: statistically significant differences can sometimes be very small in practical terms. Informed judgement should therefore be used in interpreting the results of the statistical tests presented here.
• Median: The median is a measure of central tendency. It refers to the midpoint in a distribution of values ordered from highest to lowest. Where a TIMSS median value is referred to in this report it means that half of countries had a value above this figure and half of countries had a value below it.
A note on measuring trends
A concurrent calibration methodology is used by the International Study Centre in order to estimate changes in national achievement scores between assessment cycles – for example, between TIMSS 2015 and TIMSS 2019. In simplified terms, concurrent calibration makes use of items common to the previous and current assessments and information on those items (i.e., students’ responses) from countries involved in both assessments. This allows more accurate estimates of scale scores and, importantly, minimises error in trend measurement. The calibration is done on a rolling basis across cycles so that, for example, the 1995 assessment is linked directly to the 1999 assessment, 1999 is linked directly to 2003, and so on, up to the current (2019) assessment. In this way, long-term trends can be established between 1995 and 2019 even though all individual items in the 1995 assessment had been replaced by the time of the 2019 assessment.
The scaling of the TIMSS 2019 data involved, firstly, combining paper-based data from TIMSS 2015 and TIMSS 2019 from trend countries that administered the assessment in paper in 2019 and from specially-collected ‘Bridge’ data from eTIMSS countries. Next, the (digital) eTIMSS data and the (paper-based) Bridge data from the eTIMSS countries were scaled jointly. In this way, the paper-TIMSS and eTIMSS data could be linked and placed on the TIMSS 2015 scale.

Chapter 2: TIMSS in Ireland
9TIMSS 2019 Ireland’s results in mathematics and science
Chapter 2: TIMSS in Ireland In Ireland, Fourth Class and Second Year students took part in the TIMSS main study in March and April 2019. The study was preceded by a field trial in Spring 2018, in which the study materials and procedures were trialled in a smaller number of schools. The implementation of TIMSS in Ireland was assisted by a National Advisory Committee at each grade level (see Appendix A).
Who took part in TIMSS 2019 in Ireland?
The Fourth Class and Second Year samples for TIMSS 2019 were drawn by Statistics Canada and the IEA, in consultation with the Educational Research Centre. The sampling at each grade level took place in two stages. First, 150 primary2 and 152 post-primary3 schools were selected from lists of all primary and post-primary schools in Ireland. To ensure representative samples, all schools were stratified by various characteristics and then randomly selected from each stratum. At primary level, schools were stratified by DEIS status (urban band 1, urban band 2, rural and non-DEIS), language of instruction and gender mix (all girls, all boys and mixed). Post-primary schools were stratified by school sector (secondary, vocational and community/comprehensive), gender mix (all girls, all boys and mixed) and socioeconomic status based on the percentage of students in a school eligible for the Junior Certificate fee waiver (low, medium and high SES). The samples for both grade levels were drawn in such a way as to minimise overlap with schools that participated in the TIMSS field trial in 2018 and also (at post-primary level) schools that had been selected to take part in the PISA autumn testing study.4
The next stage of sampling involved selecting classes within schools. Participating primary schools were asked to indicate the number of Fourth Class groups in their school. Where a school had one or two Fourth Class groups, all Fourth Class pupils were selected to take part in the assessment. Where a school had three or more Fourth Class groups, two of them were selected at random by the ERC using specialised sampling software. Post-primary schools provided the number of Second Year base class groups (i.e., the class groups that students are in for lessons such as P.E. or religion) in their school and depending on the size of the school either one (in schools with 150 students or fewer) or two class groups (in schools with more than 150 students) were selected at random. All selected classes at both Fourth Class and Second Year took part, giving weighted class response rates of 100% at both grade levels.
All students in selected classes were encouraged to participate and special accommodations were made where necessary and if possible. However, a small number of students were excluded from the assessment due to functional or intellectual disabilities or limited English proficiency at both grade levels (Table 2.1).
2 151primaryschoolsweresampled,butonehadclosedpermanentlybeforetheTIMSSadministrationbegan.Therefore,theweighted schoolresponserateforFourthgradeinIrelandis100%.
3 152post-primaryschoolsweresampled.Threeschoolswereunabletoparticipateandtwoofthesewerereplaced.Twoschoolsthat participatedinTIMSSatSecondYearwerenotincludedinthefinaldatasetduetolowresponserates(i.e.,<50%).Therefore,149 post-primaryschoolsareincludedinthefinaldatasetgivingaweightedschoolresponserateof98.2%.
4 ThePISA(ProgrammeforInternationalStudentAssessment)autumntestingstudyisastudythattookplaceinIrelandin2018to compareanautumnadministrationofPISAtoaspringadministration.

Chapter 2: TIMSS in Ireland
TIMSS 2019 Ireland’s results in mathematics and science10
Table 2.1: Percentages of students excluded from TIMSS at Fourth Class and Second Year
Fourth Class(Total sampled=5104)
Second Year(Total sampled=4722)
N % N %Functional disabilities 2 <0.1 3 <0.1Intellectual disabilities 32 0.6 29 0.6Limited English proficiency 9 0.4 12 0.3
After exclusions, 5051 Fourth Class pupils and 4678 Second Year5 students were eligible to participate in the assessments. Of these, parental permission to take part in the study was denied for 233 pupils (4.6%) at Fourth Class and 82 (1.8%) students at Second Year. 6 This marks a large increase from the 11 parental withdrawals at Fourth Class (0.2%) and 41 students (0.8%) at Second Year observed in the previous TIMSS cycle (Clerkin, Perkins & Cunningham, 2016). Parents’ comments provided with some of the withdrawal forms, and anecdotal observations from ERC staff and teachers, indicated that some parents were unwilling to share information and that this was a key factor in the increased withdrawal rate. The TIMSS 2019 implementation took place amid much public discussion of data privacy in the context of the introduction of the European Union’s General Data Protection Regulation (GDPR) legislation in 2018.
In addition, 237 Fourth Class pupils were absent on the day of testing. At Second Year, 478 students were absent on the test day.
Table 2.2 presents the final (weighted) response rates to the tests and questionnaires, after accounting for student absences and parental withdrawals. In total, 4582 Fourth Class pupils (91% after weighting) completed at least part of one of the test booklets.7 Almost equal proportions of boys (50.3%) and girls (49.7%) took part.
Table 2.2: Weighted response rates to tests and questionnaires at Fourth Class in Ireland (Total eligible after exclusions = 5051)
N Weighted %TIMSS test 4582 91.0Pupil questionnaire* 4580 99.7Home questionnaire (Early Learning Survey)* 4325 90.7Teacher questionnaire* 4541 99.3School questionnaire* 4582 100.0
*Response rates are presented in terms of the number of pupils who completed a test and whose teachers, principals or parents completed questionnaires.
5 FiveSecondYearstudentswhowereexcludedfromtheTIMSSassessmentwerealsoincorrectlyclassifiedasnolongerbeinginthe school/classroomandthereforenotincludedintheexclusionratesreportedinAppendixB.9intheTIMSS2019InternationalReport. AppendixB.9(Mullisetal.,2020)statesthat39studentswereexcludedatEighthgradeinIrelandand46studentswerenolongerin theschool/classroom.Instead,44studentswereexcluded(aspresentedinTable2.1above)and41werenolongerintheschool/ classroom.ThiserrorhasonlyamarginaleffectonIreland’sexclusionrateanddoesnotaffectthecognitiveorcontextualdatafor IrelandinTIMSS2019.
6 AtFourthClass,parentalwithdrawalformswerealsoreturnedfor13pupilswhohadalreadybeenexcludedbytheirteachersand commentsontheparentalwithdrawalformindicatedconcernthattheirchildwouldnotbeabletoparticipateintheassessment withoutdistress.AtSecondYear,fiveparentalwithdrawalformswerealsoreceivedforstudentswhohadalreadybeenassignedan exclusioncodebytheirteacher.These13FourthClasspupilsandfiveSecondYearstudentsareincludedinthefigurespresentedin Table2.1.
7 NineteenoftheseFourthClasspupilsparticipatedwithaspecialaccommodation(e.g.,amagnifiedbooklettoaccommodatevisual impairment).

Chapter 2: TIMSS in Ireland
11TIMSS 2019 Ireland’s results in mathematics and science
Of the 4582 pupils who participated in the assessment, almost all (99.7%) returned a Pupil Questionnaire. The return rate for the Home Questionnaires was also high, albeit lower than the pupils’ return rate, at 90.7%. Again, anecdotal evidence suggests that reluctance to provide personal details was a factor in some parents choosing not to return a questionnaire. The principals of all participating schools (100%) and the teachers of almost all pupils (99.3%) in the assessment at Fourth Class also returned their respective questionnaires.
Table 2.3 presents the weighted response rates for the tests and questionnaires at Second Year. After accounting for absences and parental withdrawals, 41188 Second Year students completed the tests, with almost equal proportions of boys (51.2%) and girls (48.8%). This gives a weighted student participation rate of 88%.9
Of the students who completed a test 4066 (98.7%) also completed a Student Questionnaire and the principals of 3981 students returned a School Questionnaire (96.8%). Students’ mathematics and science teachers were also asked to complete questionnaires about their lessons with the TIMSS students.10 Of the TIMSS students who studied science, 95.6% had teachers who returned a science teacher questionnaire, while mathematics teacher questionnaires were returned for 93.5% of students.11
Table 2.3: Weighted response rates to tests and questionnaires at Second Year in Ireland (Total eligible after exclusions = 4678)
N Weighted %
TIMSS test 4118 88.0Student questionnaire* 4066 98.7Mathematics teacher questionnaire*# 3853 93.5Science teacher questionnaire*^ 3742 95.6School questionnaire* 3981 96.8
*Response rates are presented in terms of the number of students who completed a test # 4117 students had at least one mathematics teacher who received a questionnaire.^ 3935 students had at least one science teacher who received a questionnaire.
How was testing conducted?
Schools were asked to complete the TIMSS assessment in March and April 2019. The assessment was administered by teachers in participating schools. Students at Fourth grade were allowed 72 minutes to complete the test, while 90 minutes were allocated to testing at Eighth grade. A short break was given in the middle of the tests at both grade levels. After the test, and generally on the same day, students were asked to complete a 30-minute questionnaire that asked about their home background as well as their experience of and attitudes towards school and learning mathematics and science.
TIMSS uses a rotated booklet design which means that each student only received a subset of the entire pool of items. There were 14 test booklets in total and each student completed just one booklet. As described in Chapter 1, items are repeated across booklets so that students’ performance across
8 Ofthe4118SecondYearstudentswhocompletedatest,11didsowithaspecialaccommodation(e.g.,insomecasesalarger versionofthetestbookletwasprovidedtoastudent).
9 TheoverallweightedresponserateatSecondYear,takingintoconsiderationtheschool(98.2%),class(100%)andstudent(88.0%) responserates,is86.4%
10 OftheSecondYearstudentswhocompletedatleastpartofaTIMSStest,95.6%studiedscience.
11 SomeSecondYearstudentsinIrelanddidnothaveascienceand/ormathematicsteacher.Further,somestudentshadmorethanone scienceand/ormathematicsteacher.Theresponseratespresentedhererefertotheweightedpercentageofstudentswhoseteachers returnedaquestionnaire.

Chapter 2: TIMSS in Ireland
TIMSS 2019 Ireland’s results in mathematics and science12
booklets can be linked. Each booklet was made up of both mathematics and science items, with an equal amount of testing time allowed for each subject.
At primary level, 18 participating schools taught through Irish (Gaelscoileanna and schools in Gaeltacht areas). Teachers could choose to administer the tests to their Fourth Class pupils, as a whole class, in either Irish or English. Two schools requested the test materials only in Irish, two schools requested the tests only in English, and the remaining 14 schools received both Irish and English versions for teachers to select one version. In total, 6.3% of Fourth Class pupils completed the assessment in Irish.
At post-primary level, six of the sampled schools taught all or some students completely through the medium of Irish and across these six schools, nine classes were selected to participate. Both English and Irish materials were requested for six of the nine class groups and students in these classes had the option to complete the assessment in either language. Ninety-six (2.6%) Second Year students completed the test in Irish.
Quality monitoring
Quality monitoring is carried out in each participating country to ensure that the same testing procedures are applied within and across countries. International quality control monitors, employed by the IEA, visited at least 10% of selected schools on their testing day. In Ireland, 15 schools were visited by international quality monitors at both primary and post-primary levels. A further 15 schools (10%) at each grade level in Ireland were visited by national quality monitors who were members of the Department of Education Inspectorate.
The role of quality monitors, both national and international, was to observe testing sessions and to interview school coordinators to ensure that international testing standards were adhered to as well as to seek schools’ feedback about their experience of administering the study (e.g., communication from the ERC; quality of manuals and information provided). The feedback received from these quality monitors indicated that the administration of TIMSS in Ireland met all required standards.
In addition, during testing, students were asked to provide self-generated written responses to some test questions. These responses were scored, using an international scoring guide, by trained coders at the ERC. Approximately 25% of these items were scored independently by two coders to assess the level of agreement across coders. Similarly, coders in all countries were required to score a common set of English-language responses (from the TIMSS 2015 assessment) to assess cross-country scoring reliability. Finally, the reliability of scoring across cycles of the study was also assessed. Countries that had participated in TIMSS 2015, including Ireland, were required to score a number of responses that had been collected in their country in 2015 in order to ensure that student responses were being scored in a consistent manner in both cycles.

Chapter 3: Mathematics and science: Main results
13TIMSS 2019 Ireland’s results in mathematics and science
Chapter 3: Mathematics and science: Main results This chapter presents the overall performance on the mathematics and science tests for students in each country and benchmarking entity that took part in TIMSS 2019. The performance of students in Ireland is compared to performance in previous cycles of TIMSS, and differences between boys and girls in terms of their average mathematics and science scores are also presented.
As noted in Chapter 1, student performance is reported on a separate scale for each domain and at each grade level. Each scale was set to have a centrepoint of 500 and a standard deviation of 100 when the first cycle of TIMSS took place in 1995. This centrepoint represents the mean score across all countries that took part at each grade level in 1995 and can be used as a fixed point of reference against which the scale of changes in performance in subsequent cycles can be measured. As the number of countries that take part in TIMSS changes from cycle to cycle, the international averages for each cycle cannot be compared in a meaningful way.
Mathematics and science performance at Fourth Class
Table 3.1 presents the mean mathematics and science scores of Fourth Class pupils in Ireland and the corresponding mean scores for pupils in other countries. Table 3.2 presents the mean scores for Fourth grade students in the six benchmarking participants.
Pupils in Ireland achieved a mean score of 548 in mathematics, which was significantly above the TIMSS scale centrepoint (500). This score was significantly lower than the average scores achieved in seven other countries – Singapore (at 625, the highest-scoring country), Hong Kong, the Republic of Korea, Chinese Taipei, Japan, the Russian Federation, and Northern Ireland. Pupils in four countries (England, Latvia, Norway, and Lithuania) achieved similar – not statistically different – mean scores to pupils in Ireland. Finally, 46 countries (including United States, Finland, Sweden, Germany, Australia, New Zealand and France) achieved significantly lower mean mathematics scores than Ireland. Of the 22 EU countries that participated at Fourth grade, two (Latvia and Lithuania) had similar mathematics performance to Ireland while 19 performed significantly less well than Ireland. No EU country had a higher mean mathematics score than Ireland at Fourth grade.
In science, Fourth Class pupils achieved a mean score of 528, which was significantly above the scale centrepoint (500). This was significantly below the mean scores achieved in 12 countries (Singapore, the Republic of Korea, the Russian Federation, Japan, Chinese Taipei, Finland, Latvia, Norway, the United States, Lithuania, Sweden, and England), and similar to the mean scores achieved in another 12 countries (including Australia, Hong Kong, Poland, Canada and Denmark). In 33 countries (including Northern Ireland, Netherlands, Germany, and New Zealand), performance on the science assessment was significantly lower than in Ireland. Four EU countries (Finland, Latvia, Lithuania and Sweden) had significantly higher mean science scores than Ireland, while the science performance of eight EU countries was similar to Ireland’s science performance and nine EU countries performed significantly less well than Ireland.
TIMSS is designed to facilitate reliable comparisons of within-country trends over time. In both domains, the Irish performance in 2019 was very similar to that seen in TIMSS 2015. The mean mathematics score in 2019 (548) is one point higher than in 2015 (547), while the 2019 mean science score (528) is one

Chapter 3: Mathematics and science: Main results
TIMSS 2019 Ireland’s results in mathematics and science14
point lower than in 2015 (529). Neither of these differences are statistically significant or substantively meaningful. This indicates that, on average, there has been no change in Fourth Class pupils’ proficiency in either mathematics or science over the last four years. Mean achievement in both domains remains significantly higher than was found in 2011 (mathematics: 527; science: 516) and 1995 (mathematics: 523; science: 515).
For comparison, of the 45 countries that participated at Fourth grade in TIMSS in both 2015 and 2019, 14 countries showed improvements in mean mathematics performance and eight showed deteriorating mean performance over that period. In science, ten countries recorded significant improvements over the last four years, and ten countries showed significant declines.
Five countries – Singapore, the Republic of Korea, Chinese Taipei, Japan, and the Russian Federation – achieved significantly higher mean scores than Ireland in both domains. Of the two other countries that outperformed Ireland in mathematics, Hong Kong achieved a similar score to Ireland in science, while pupils in Northern Ireland achieved a significantly lower science score.

Chapter 3: Mathematics and science: Main results
15TIMSS 2019 Ireland’s results in mathematics and science
Table 3.1: Mean country scores and standard errors for the TIMSS 2019 Fourth grade assessments, with significant differences relative to Ireland’s mean score
Mathematics ScienceCountry Mean (SE) Country Mean (SE)
Singapore 625 (3.9) Singapore 595 (3.4)Hong Kong SAR 602 (3.3) Korea, Rep. of 588 (2.1)Korea, Rep. of 600 (2.2) Russian Federation 567 (3.0)Chinese Taipei 599 (1.9) Japan 562 (1.8)Japan 593 (1.8) Chinese Taipei 558 (1.8)Russian Federation 567 (3.3) Finland 555 (2.6)Northern Ireland 566 (2.7) Latvia 542 (2.4)England 556 (3.0) Norway (5) 539 (2.2)Ireland 548 (2.5) United States 539 (2.7)Latvia 546 (2.6) Lithuania 538 (2.5)Norway (5) 543 (2.2) Sweden 537 (3.3)Lithuania 542 (2.8) England 537 (2.7)Austria 539 (2.0) Czech Republic 534 (2.6)Netherlands 538 (2.2) Australia 533 (2.4)United States 535 (2.5) Hong Kong SAR 531 (3.3)Czech Republic 533 (2.5) Poland 531 (2.6)Belgium (Flemish) 532 (1.9) Hungary 529 (2.7)Cyprus 532 (2.9) Ireland 528 (3.2)Finland 532 (2.3) Turkey (5) 526 (4.2)Portugal 525 (2.6) Croatia 524 (2.2)Denmark 525 (1.9) Canada 523 (1.9)Hungary 523 (2.6) Denmark 522 (2.4)Turkey (5) 523 (4.4) Austria 522 (2.6)Sweden 521 (2.8) Bulgaria 521 (4.9)Germany 521 (2.3) Slovak Republic 521 (3.7)Poland 520 (2.7) Northern Ireland 518 (2.3)Australia 516 (2.8) Netherlands 518 (2.9)Azerbaijan 515 (2.7) Germany 518 (2.2)Bulgaria 515 (4.3) Serbia 517 (3.5)Italy 515 (2.4) Cyprus 511 (3.0)Kazakhstan 512 (2.5) Spain 511 (2.0)Canada 512 (1.9) Italy 510 (3.0)Slovak Republic 510 (3.5) Portugal 504 (2.6)Croatia 509 (2.2) New Zealand 503 (2.3)Malta 509 (1.4) Belgium (Flemish) 501 (2.1)Serbia 508 (3.2) Malta 496 (1.3)Spain 502 (2.1) Kazakhstan 494 (3.1)Armenia 498 (2.5) Bahrain 493 (3.4)Albania 494 (3.4) Albania 489 (3.5)New Zealand 487 (2.6) France 488 (3.0)France 485 (3.0) United Arab Emirates 473 (2.1)Georgia 482 (3.7) Chile 469 (2.6)United Arab Emirates 481 (1.7) Armenia 466 (3.4)Bahrain 480 (2.6) Bosnia and Herzegovina 459 (2.9)North Macedonia 472 (5.3) Georgia 454 (3.9)Montenegro 453 (2.0) Montenegro 453 (2.5)Bosnia and Herzegovina 452 (2.4) Qatar 449 (3.9)Qatar 449 (3.4) Iran, Islamic Rep. of 441 (4.1)Kosovo 444 (3.0) Oman 435 (4.1)Iran, Islamic Rep. of 443 (3.9) Azerbaijan 427 (3.3)Chile 441 (2.7) North Macedonia 426 (6.2)Oman 431 (3.7) Kosovo 413 (3.7)Saudi Arabia 398 (3.6) Saudi Arabia 402 (4.1)Morocco 383 (4.3) Kuwait 392 (6.1)Kuwait 383 (4.7) Morocco 374 (5.8)South Africa (5) 374 (3.6) South Africa (5) 324 (4.9)Pakistan 328 (12.0) Pakistan 290 (13.4)Philippines 297 (6.4) Philippines 249 (7.5)
Average achievement significantly higher than Ireland
Average achievement significantly lower than Ireland
Note: Norway, Turkey, and South Africa assessed students at Grade 5 rather than Grade 4.

Chapter 3: Mathematics and science: Main results
TIMSS 2019 Ireland’s results in mathematics and science16
Table 3.2: Mean scores and standard errors of benchmarking participants on the TIMSS 2019 Fourth grade assessments, with significant differences relative to Ireland’s mean score
Mathematics ScienceRegion Mean (SE) Region Mean (SE)
Moscow City, Russian Fed. 593 (2.2) Moscow City, Russian Fed. 595 (2.2)Dubai, UAE 544 (1.6) Dubai, UAE 545 (1.7)Quebec, Canada 532 (2.3) Ontario, Canada 524 (3.2)Madrid, Spain 518 (2.2) Madrid, Spain 523 (2.0)Ontario, Canada 512 (3.3) Quebec, Canada 522 (2.5)Abu Dhabi, UAE 441 (2.2) Abu Dhabi, UAE 418 (2.8)
Average achievement significantly higher than Ireland
Average achievement significantly lower than Ireland
Figure 3.1 shows gender differences in mean mathematics achievement at Fourth Class in TIMSS 2019 and in previous cycles. Although boys (552) achieved a higher average score than girls (545), this difference was not statistically significant.
Internationally, gender differences were small, with girls scoring 499 on average across all TIMSS countries and boys scoring an average of 503. Ireland was one of 27 countries where no statistically significant gender difference was observed in mean mathematics performance. Another 27 countries (including Canada, France, Spain, the United States, Singapore, and Denmark) recorded a significant advantage for boys, ranging in magnitude from five to 19 points. In nine of these countries, significant gender differences have appeared since 2015. There were four countries – Philippines, Saudi Arabia, South Africa, and Oman – where girls achieved a significantly higher mean score than boys, ranging from 14 to 35 points.
Figure 3.1: Mean scores on the TIMSS 1995, 2011, 2015, and 2019 Fourth Class mathematics assessment, among boys and girls in Ireland
In science (Figure 3.2), the difference between boys (530) and girls (526) in Ireland was not statistically significant. Both boys and girls achieved almost identical mean scores to those recorded in 2015.
Internationally, the average gender difference was small, with girls scoring an average of 493 across all TIMSS countries and boys scoring an average of 489. In 33 countries, a majority, no gender differences in science achievement were found. There were seven countries (including the Republic of Korea, the Czech Republic, Singapore, and the United States) where, on average, boys outperformed girls in

Chapter 3: Mathematics and science: Main results
17TIMSS 2019 Ireland’s results in mathematics and science
science by a small margin, ranging from five to nine points. On the other hand, in 18 countries (including Saudi Arabia, Pakistan, South Africa, Kosovo, and Japan) girls achieved significantly higher average scores than boys, ranging from six to 60 points.
Figure 3.2: Mean scores on the TIMSS 1995, 2011, 2015, and 2019 Fourth Class science assessment, among boys and girls in Ireland
Mathematics and science performance at Second Year
The mean mathematics and science scores of Second Year students in Ireland, as well as those of their peers in other countries, are presented in Table 3.3. The corresponding mean scores for the seven benchmarking participants that took part at Eighth grade are shown in Table 3.4. The highest mean scores in both mathematics (616) and science (608) were achieved by students in Singapore. For both subject areas, the four highest performing countries were Singapore, Chinese Taipei, the Republic of Korea and Japan.
Students in Ireland achieved a mean score of 524 in mathematics, which was significantly above the TIMSS scale centrepoint (500). Six countries (Singapore, Chinese Taipei, the Republic of Korea, Japan, Hong Kong and the Russian Federation) achieved mean mathematics scores that were significantly higher than Ireland’s score. The mean scores of a further six countries (Lithuania, Israel, Australia, Hungary, the United States and England) did not differ significantly from Ireland’s mean score, while students in Ireland significantly outperformed students in 26 countries (including Finland, Norway, Sweden, France and New Zealand). There has been no significant change in Ireland’s mean mathematics performance since 2015 (523) or 1995 (519). Of the ten EU countries that participated at Eighth grade, two (Lithuania and Hungary) had similar mean mathematics scores to Ireland, while seven performed significantly less well than Ireland. No EU country had higher mean mathematics achievement than Ireland at Eighth grade.
The mean science score achieved by students in Ireland was 523, which was significantly above the TIMSS centrepoint (500). Seven countries (Singapore, Chinese Taipei, Japan, the Republic of Korea, the Russian Federation, Finland and Lithuania) had significantly higher mean science scores than Ireland, while eight countries (including Australia, the United States and England) achieved mean science scores which were not significantly different from Ireland’s score. Students in Ireland significantly outperformed students in 23 countries, including New Zealand, Norway and France. Although not statistically significant, the mean science score for Ireland has lowered by seven points since 2015. While Ireland saw a significant increase of 12 points in mean science performance between 1995 and 2015, a drop of seven points since 2015, although not statistically significant, means that Ireland’s

Chapter 3: Mathematics and science: Main results
TIMSS 2019 Ireland’s results in mathematics and science18
performance in 2019 does not differ significantly from that in either 2015 or 1995. Two EU countries (Finland and Lithuania) significantly outperformed Ireland in science, while three EU countries (Hungary, Sweden and Portugal) achieved similar mean science scores to Ireland. Four EU countries (Italy, France, Cyprus and Romania) performed significantly less well than Ireland in science.
Of the 33 countries that took part in 2015 and 2019 at Eighth grade, 13 saw significant improvements in their mean mathematics scores since 2015 while mean mathematics performance dropped significantly in four countries. For science, 11 countries experienced a significant increase in their mean science score between 2015 and 2019, while science performance declined significantly in five countries.
Of the six countries that significantly outperformed Ireland in mathematics, five also had significantly higher mean science scores than Ireland. In addition, five of the six countries that had similar mean mathematics scores to Ireland’s also performed similarly to Ireland in science. On the other hand, Hong Kong had a significantly higher mean mathematics score but a significantly lower mean science score compared to Ireland, while Finland performed significantly less well than Ireland in mathematics but significantly better in science.

Chapter 3: Mathematics and science: Main results
19TIMSS 2019 Ireland’s results in mathematics and science
Table 3.3: Mean country scores and standard errors for the TIMSS 2019 Eighth grade assessments, with significant differences relative to Ireland’s mean score
Mathematics ScienceCountry Mean (SE) Country Mean (SE)
Singapore 616 (4.0) Singapore 608 (3.9)Chinese Taipei 612 (2.7) Chinese Taipei 574 (1.9)Korea, Rep. of 607 (2.8) Japan 570 (2.1)Japan 594 (2.7) Korea, Rep. of 561 (2.1)Hong Kong SAR 578 (4.1) Russian Federation 543 (4.2)Russian Federation 543 (4.5) Finland 543 (3.1)Ireland 524 (2.6) Lithuania 534 (3.0)Lithuania 520 (2.9) Hungary 530 (2.6)Israel 519 (4.3) Australia 528 (3.2)Australia 517 (3.8) Ireland 523 (2.9)Hungary 517 (2.9) United States 522 (4.7)United States 515 (4.8) Sweden 521 (3.2)England 515 (5.3) Portugal 519 (2.9)Finland 509 (2.6) England 517 (4.8)Norway (G9) 503 (2.4) Turkey 515 (3.7)Sweden 503 (2.5) Israel 513 (4.2)Cyprus 501 (1.6) Hong Kong SAR 504 (5.2)Portugal 500 (3.2) Italy 500 (2.6)Italy 497 (2.7) New Zealand 499 (3.5)Turkey 496 (4.3) Norway (G9) 495 (3.1)Kazakhstan 488 (3.3) France 489 (2.7)France 483 (2.5) Bahrain 486 (1.9)New Zealand 482 (3.4) Cyprus 484 (1.9)Bahrain 481 (1.7) Kazakhstan 478 (3.1)Romania 479 (4.3) Qatar 475 (4.4)United Arab Emirates 473 (1.9) United Arab Emirates 473 (2.2)Georgia 461 (4.3) Romania 470 (4.2)Malaysia 461 (3.2) Chile 462 (2.9)Iran, Islamic Rep. of 446 (3.7) Malaysia 460 (3.5)Qatar 443 (4.0) Oman 457 (2.9)Chile 441 (2.8) Jordan 452 (4.7)Lebanon 429 (2.9) Iran, Islamic Rep. of 449 (3.6)Jordan 420 (4.3) Georgia 447 (3.9)Egypt 413 (5.2) Kuwait 444 (5.7)Oman 411 (2.8) Saudi Arabia 431 (2.6)Kuwait 403 (5.0) Morocco 394 (2.7)
Saudi Arabia 394 (2.5) Egypt 389 (5.4)
South Africa (G9) 389 (2.3) Lebanon 377 (4.6)
Morocco 388 (2.3) South Africa (G9) 370 (3.1)
Average achievement significantly higher than Ireland
Average achievement significantly lower than Ireland

Chapter 3: Mathematics and science: Main results
TIMSS 2019 Ireland’s results in mathematics and science20
Table 3.4: Mean scores and standard errors of benchmarking participants on the TIMSS 2019 Eight grade assessments, with significant differences relative to Ireland’s mean score
Mathematics Science
Region Mean (SE) Region Mean (SE)Moscow City, Russian Fed. 575 (4.2) Moscow City, Russian Fed. 567 (2.9)Quebec, Canada 543 (3.7) Dubai, UAE 548 (2.0)Dubai, UAE 537 (2.0) Quebec, Canada 537 (3.6)Ontario, Canada 530 (4.3) Ontario, Canada 522 (3.0)Western Cape, SA (G9) 441 (4.4) Western Cape, SA (G9) 439 (5.1)Abu Dhabi, UAE 436 (2.9) Gauteng, SA (G9) 422 (3.9)Gauteng, SA (G9) 421 (3.0) Abu Dhabi, UAE 420 (3.6)
Average achievement significantly higher than Ireland
Average achievement significantly lower than Ireland
Note: Western Cape and Gauteng assessed students at Grade 9 rather than Grade 8.
The average mathematics performance of girls and boys was very similar in Ireland, with girls scoring, on average, just one point higher than boys (Figure 3.3). The performance of boys in Ireland in mathematics has remained relatively stable since 1995; the mean mathematics score for boys in 2019 was 523 compared to 526 in 2015 and 525 in 1995. On the other hand, the mean mathematics performance of girls increased from 512 to 524 between 1995 and 2019.
On average across all TIMSS countries, girls achieved a slightly higher mean mathematics score (491) than boys (488). In most countries, differences between boys and girls in mean mathematics performance were not significant, including Ireland. On average, girls significantly outperformed boys in mathematics in seven countries (South Africa, Malaysia, Romania, Saudi Arabia, Bahrain, Jordan and Oman) with differences ranging from six to 41 points. On the other hand, the average mathematics score for boys was significantly higher than that of girls in six countries (Morocco, France, Portugal, Israel, Italy and Hungary) with differences ranging from five to 14 points.
Figure 3.3: Mean scores on the TIMSS 1995, 2015, and 2019 Second Year mathematics assessment, among boys and girls in Ireland

Chapter 3: Mathematics and science: Main results
21TIMSS 2019 Ireland’s results in mathematics and science
Girls in Ireland scored, on average, five points higher than boys in science, although this difference was not statistically significant (Figure 3.4). The science performance of boys in Ireland remained stable between 1995 and 2015 (527 and 529, respectively) while there was a large increase, from 510 to 531, in the mean science scores for girls between 1995 and 2015. Between 2015 and 2019, the average science score for Ireland dropped by almost five points for girls, to 526, and eight points for boys, to 521.
At the international average, girls achieved a mean science score that was 10 points higher than that of boys (495 and 485, respectively). Differences in mean science performance between boys and girls were not significant in many countries. However, girls achieved significantly higher mean science scores than boys in 15 countries (including Oman, Jordan, Bahrain, Finland and Sweden) while boys significantly outperformed girls in six countries (Hungary, Chile, the Republic of Korea, Japan, Italy and Portugal).
Figure 3.4: Mean scores on the TIMSS 1995, 2015, and 2019 Second Year science assessment, among boys and girls in Ireland

Chapter 4: Distribution of achievement
TIMSS 2019 Ireland’s results in mathematics and science22
Chapter 4: Distribution of achievementAs well as describing students’ overall achievement in mathematics and science, performance in TIMSS can be examined in terms of the distribution of achievement (i.e., the difference in performance between the lowest- and highest-achieving students). This chapter presents the mathematics and science scores for students in Ireland at various percentile points and compares them to the corresponding scores in a subset of countries that were selected on the basis of high performance on TIMSS 2019 or due to their cultural and/or linguistic similarities to Ireland. The selected comparison countries are Australia, Chinese Taipei, England,12 Finland, Japan, New Zealand,13 the Republic of Korea, Singapore14 and the United States15 for both Fourth grade and Eighth grade, as well as Northern Ireland16 which participated at Fourth Grade only. Countries are presented in descending order based on their overall mean score in each domain and at each grade level.
The distributions of performance for each domain and grade level are presented graphically (see Figure 4.1). The black band in the centre of each distribution represents the confidence interval around the mean score for a country (i.e., the mean ±2 standard errors) which takes account of sampling and measurement error. The dark grey bands at either end of the distribution represent students in the ‘below-average’ range of achievement (i.e., between the 5th and 25th percentile) and the ‘above-average’ range of achievement (i.e., between the 75th and 95th percentile). All other students (i.e., those closer to the mean) are represented by the light grey bands. In this chapter, students scoring at the 5th percentile are referred to as the lowest-achieving/performing students, while those at the 95th percentile are referred to as the highest-achieving/performing. The specific mathematics and science scores of students at various percentile points are presented for Ireland and our selected comparison countries in Appendix B.
5th 25th 75th 95th
95% Confidence Interval for Average (+2SE)Figure 4.1: Percentiles of performance (adapted from international reports)
The countries presented in the figures in this chapter are categorised according to whether their mean achievement is significantly higher than, similar to, or lower than Ireland’s mean achievement scores (see Table 4.1).
12 ThenationaldefinedpopulationatFourthgradeinEnglandcovers90%to95%ofthenationaltargetpopulation.
13 ThenationaldefinedpopulationatFourthgradeinNewZealandcovers90%to95%ofthenationaltargetpopulation.AtEighthgrade theguidelinesforsampleparticipationweremetonlyafterreplacementschoolswereincluded.
14 ThenationaldefinedpopulationatFourthgradeinSingaporecovers77%to90%ofthenationaltargetpopulation.AtEighthgrade, thenationaldefinedpopulationcovers90%-95%ofthenationaltargetpopulation.
15 ThenationaldefinedpopulationatFourthgradeintheUnitedStatescovers90%-95%ofthenationaltargetpopulation.Atboth grades,theguidelinesforsampleparticipationratesweremetonlyafterreplacementschoolswereincluded.
16 NorthernIrelandmettheguidelinesforsampleparticipationratesonlyafterreplacementschoolswereincluded.

Chapter 4: Distribution of achievement
23TIMSS 2019 Ireland’s results in mathematics and science
Table 4.1: Achievement levels relative to Ireland’s mean performance
Colour Achievement level
Fourth grade Eighth grade
Average achievement significantly higher than IrelandAverage achievement does not differ significantly from IrelandAverage achievement significantly lower than Ireland
Distribution of achievement – Fourth Class, mathematics
Figure 4.2 shows the distribution of pupil achievement in mathematics at Fourth grade for Ireland and selected comparison countries. The general pattern, as might be expected, is that performance at the 95th and 5th percentiles tends to be higher in countries with a higher average score. However, there are nuances within that general pattern.
For example, pupil achievement at the 5th percentile was very slightly lower in Northern Ireland (410) and in England (411) compared to Ireland (414), but the highest-achieving students (95th percentile) in both jurisdictions achieved substantially higher scores (699 and 693, respectively) than the highest-achieving pupils in Ireland (665). Therefore, although the average mathematics score was similar in England and Ireland, the distribution of achievement was narrower in Ireland, particularly at the upper end. The opposite pattern can be seen in the United States, where the performance of the highest-achieving pupils (as indicated by the 95th percentile score, 663) was similar to those in Ireland, but the lowest-achieving pupils in the United States (as indicated by the 5th percentile, 383) achieved a substantially lower score than in Ireland.
The mean score in Ireland (548) was similar to the score among pupils at the 75th percentile in New Zealand (549). At the same time, the mean score in the Republic of Korea (600) and Chinese Taipei (599) was similar to the 75th percentile in Ireland (601).
Figure 4.2: Distribution of mathematics achievement, Ireland and comparison countries – Fourth grade
The distribution of mathematics achievement in Fourth Class was very similar in 2019 to that observed in 2015 (Figure 4.3). The mean score and the scores at the 25th and 75th percentile overlap almost completely in both cycles. However, pupils at the 5th percentile achieved a slightly lower, although not significantly different, score in 2019 (414) than in 2015 (420), and pupils at the 95th percentile achieved a slightly higher score (665 compared to 658), although this was also not statistically significant. This means that the distribution has widened to a small degree at both ends since 2015.
Chapter 4: Distribution of achievement
TIMSS 2019 Ireland’s results in mathematics and science24
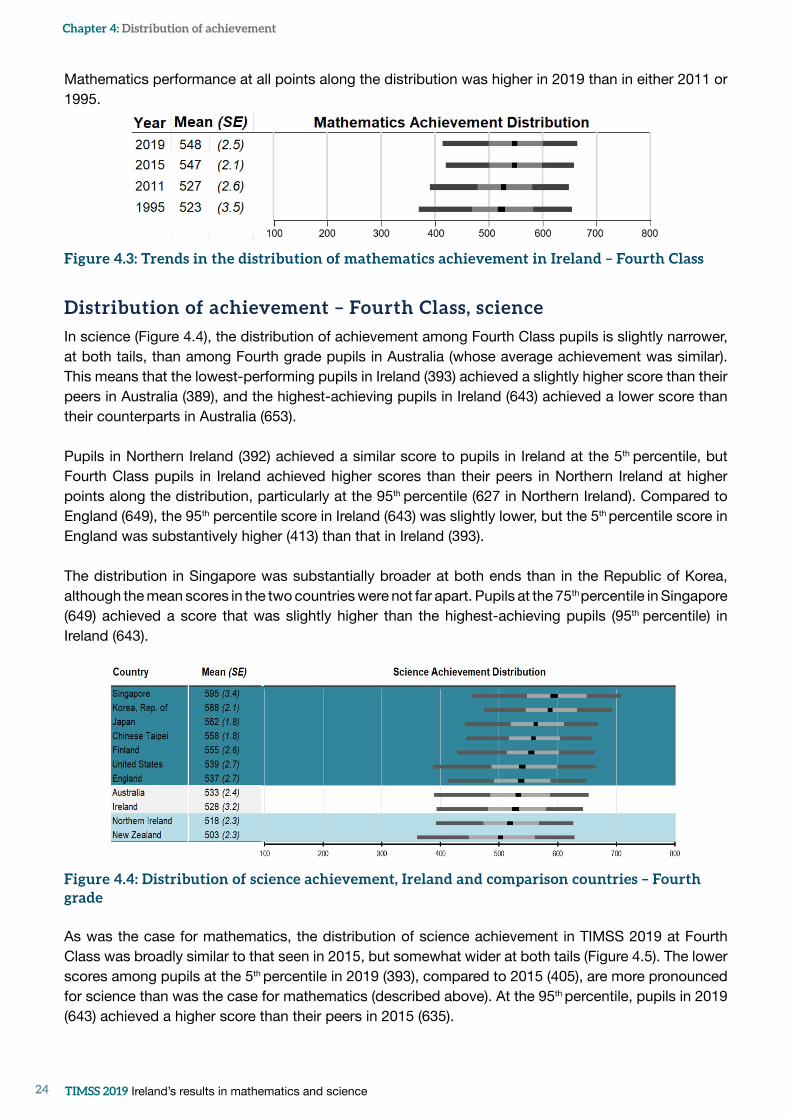
Mathematics performance at all points along the distribution was higher in 2019 than in either 2011 or 1995.
Figure 4.3: Trends in the distribution of mathematics achievement in Ireland – Fourth Class
Distribution of achievement – Fourth Class, science
In science (Figure 4.4), the distribution of achievement among Fourth Class pupils is slightly narrower, at both tails, than among Fourth grade pupils in Australia (whose average achievement was similar). This means that the lowest-performing pupils in Ireland (393) achieved a slightly higher score than their peers in Australia (389), and the highest-achieving pupils in Ireland (643) achieved a lower score than their counterparts in Australia (653).
Pupils in Northern Ireland (392) achieved a similar score to pupils in Ireland at the 5th percentile, but Fourth Class pupils in Ireland achieved higher scores than their peers in Northern Ireland at higher points along the distribution, particularly at the 95th percentile (627 in Northern Ireland). Compared to England (649), the 95th percentile score in Ireland (643) was slightly lower, but the 5th percentile score in England was substantively higher (413) than that in Ireland (393).
The distribution in Singapore was substantially broader at both ends than in the Republic of Korea, although the mean scores in the two countries were not far apart. Pupils at the 75th percentile in Singapore (649) achieved a score that was slightly higher than the highest-achieving pupils (95th percentile) in Ireland (643).
Figure 4.4: Distribution of science achievement, Ireland and comparison countries – Fourth grade
As was the case for mathematics, the distribution of science achievement in TIMSS 2019 at Fourth Class was broadly similar to that seen in 2015, but somewhat wider at both tails (Figure 4.5). The lower scores among pupils at the 5th percentile in 2019 (393), compared to 2015 (405), are more pronounced for science than was the case for mathematics (described above). At the 95th percentile, pupils in 2019 (643) achieved a higher score than their peers in 2015 (635).

Chapter 4: Distribution of achievement
25TIMSS 2019 Ireland’s results in mathematics and science
Compared to earlier cycles in 2011 and 1995, pupils in 2019 achieved higher scores at all points along the distribution, with the exception of pupils at the 95th percentile in 1995, who achieved a very similar score (644).
Figure 4.5: Trends in the distribution of science achievement in Ireland – Fourth Class
Distribution of achievement – Second Year, mathematics
The distribution of mathematics achievement among Eighth grade students is narrower in Ireland than in many of our comparison countries (Figure 4.6). The mathematics performance of students in Ireland at the 5th percentile (395) is about 50 points lower than the corresponding score in Singapore (445), the highest performing country. However, at the other end of the distribution (i.e., the 95th percentile), students in Ireland score over 100 points lower than their counterparts in Singapore (636 compared to 740). In fact, the mathematics score of students in Ireland at the 95th percentile is below the scores of students at the 75th percentile in Singapore, Chinese Taipei, the Republic of Korea and Japan.
Despite having a similar mean mathematics score to students in Australia, the United States and England, the performance of students at the 5th percentile in Ireland (395) is considerably higher than in these countries (369, 348 and 363, respectively). Conversely, Ireland’s highest-achieving students (636) are performing less well relative to their peers in these countries (666 in Australia, 671 in the United States and 660 in England). Indeed, the mathematics score of students at the 95th percentile in Ireland is closer to the corresponding students in Finland (624) and New Zealand (629), countries with significantly lower mean mathematics performance than Ireland. Ireland’s performance at the 75th percentile (574) is very similar to the corresponding score in Australia (578) and England (575), indicating that Ireland’s underperformance at the higher end of the mathematics achievement distribution relative to these countries is among the very highest-performing students.
Figure 4.6: Distribution of mathematics achievement, Ireland and comparison countries – Eighth grade

Chapter 4: Distribution of achievement
TIMSS 2019 Ireland’s results in mathematics and science26
Figure 4.7 presents the distribution of mathematics achievement for Second Year students in 1995, 2015 and 2019. There has been a marked improvement of about 25 points at the 5th percentile since 1995 and most of this improvement (about 21 points) occurred between 1995 and 2015. At the other end of the distribution, the 95th percentile score has remained stable between 2015 and 2019 (634 and 636, respectively), although the 95th percentile score is about seven points lower in 2019 than in 1995 (643).
Figure 4.7: Trends in the distribution of mathematics achievement in Ireland – Second Year
Distribution of achievement – Second Year, science
The science performance of the lowest-achieving students in Ireland (as indicated by the score at the 5th percentile, 376) is substantially lower than the corresponding students in Singapore (439), the highest-performing country. The difference is even greater among the highest-achieving students, with those at the 95th percentile in Ireland (649) achieving a score that is 82 points lower than that of their peers in Singapore (731) (Figure 4.8).
When compared to the scores of students in our comparison countries with similar overall science performance, the score of the lowest-achieving students in Ireland (indicated by the 5th percentile score) is either very similar (in the case of Australia, with a corresponding score of 373) or considerably higher (in the cases of the United States and England, whose scores are at least 20 points lower). On the other hand, the score of students at the 95th percentile is somewhat lower in Ireland than in these countries, by 10 points in the case of England, and 21 points in the case of the United States.
Figure 4.8: Distribution of science achievement, Ireland and comparison countries – Eighth grade

Chapter 4: Distribution of achievement
27TIMSS 2019 Ireland’s results in mathematics and science
There were large improvements of over 20 points in the science performance of students at the 5th and 25th percentiles in Ireland between 1995 and 2015 (Figure 4.9). However, between 2015 and 2019 the science scores of students at these percentiles decreased by about 12 points, and significantly so at the 25th percentile. At the other end of the science achievement distribution, performance has remained stable between 2015 and 2019. The scores at the 95th percentiles in both these years (650 and 649, respectively) are almost eight points lower than in 1995 (657).
Figure 4.9: Trends in the distribution of science achievement in Ireland – Second Year

Chapter 5: Performance at International Benchmarks
TIMSS 2019 Ireland’s results in mathematics and science28
Chapter 5: Performance at International BenchmarksWhile previous chapters have presented student achievement results in a continuous (scale) format, it can also be useful to describe the types of skills and knowledge that students at different levels of achievement can demonstrate. In this chapter, achievement data are presented with reference to four International Benchmarks. Each TIMSS Benchmark represents a set of skills and knowledge that students who reach that Benchmark can demonstrate consistently.
International Benchmarks
The International Benchmarks are designed to provide an intuitive method of interpreting country-level performance on the mathematics and science assessments. The Benchmarks describe student achievement with reference to the specific skills and knowledge that students at a particular level of performance are typically able to demonstrate.
Each participating student is categorised, based on their performance on the test, as reaching one of four Benchmark levels of achievement. The Benchmarks are defined relative to specified cutpoints (or thresholds) on the continuous achievement scale (see Figure 5.1). For example, a student achieving 460 points on the mathematics test can be said to have reached the Low Benchmark of mathematics performance. Another student scoring 549 points will have reached the Intermediate Benchmark. A student scoring below 400 (i.e., more than one standard deviation below the scale centrepoint of 500) is described as ‘not reaching the Low Benchmark.’ The skills and knowledge of students below the Low Benchmark cannot be reliably assessed by the items in the TIMSS assessments.17
The thresholds that are used to differentiate one Benchmark from the next were determined by international subject experts for mathematics and for science, by drawing on detailed analyses of students’ performance and particular items that are used to ‘anchor’ each benchmark. Anchoring items are those that can consistently be completed successfully by students reaching a given Benchmark, but not by students reaching lower Benchmarks. The particular characteristics of these anchoring items – the required content and cognitive demands – therefore define the types of skills that students at the higher Benchmark can consistently demonstrate. As a result of this design, students’ categorisation at the International Benchmarks is cumulative. That is, a student who reaches the High Benchmark can, by definition, demonstrate the skills expected at the Low and Intermediate Benchmarks as well as the additional skills that are specific to the High Benchmark.
Further technical details on the construction of the International Benchmarks, anchoring items, and the specified cutpoints, is provided in Martin, von Davier and Mullis (2020).
The following sections describe the mathematical and scientific knowledge and skills that are associated with each Benchmark. The percentage of students reaching each Benchmark in Ireland, in our comparison countries, and at the TIMSS median are also presented. The Benchmarks for mathematics and science at Fourth grade are described first, followed by their equivalents at Eighth grade.
17 Countrieswithlargeproportionsofstudentsinthiscategorycanopttoparticipatein‘lessdifficult’TIMSS,whichislinkedtothesame scalebuthasitemsatalowerlevelofdifficultytoenableinformationaboutwhichitemsareansweredcorrectlytobegathered.

Chapter 5: Performance at International Benchmarks
29TIMSS 2019 Ireland’s results in mathematics and science
Low(400)
Intermediate(475)
High(550)
Advanced(625)
Figure 5.1: Benchmarks reached by students scoring at or above each scale score cutpoint
Benchmark performance – Fourth Class, mathematics
The International Benchmarks for mathematics at Fourth Grade are described in Table 5.1.18 As shown, pupils reaching the Low Benchmark can consistently demonstrate some basic mathematical skills (e.g., reading simple bar graphs and tables; multiplying and dividing one- and two-digit whole numbers). There is increasing evidence of mathematical proficiency among pupils at the Intermediate Benchmark. At the High Benchmark and, in particular, the Advanced Benchmark, pupils are engaging in more complex operations, such as interpreting data presented in tables or graphs to engage in problem-solving.
Table 5.1: International Benchmarks – Fourth grade mathematics
Benchmark Scoring at least Pupils typically can:
AdvancedPupils can apply their understanding and knowledge in a variety of relatively complex situations, and explain their reasoning.
625
Solve multi-step word problems involving whole numbers.Show an understanding of fractions and decimals.Apply knowledge of two- and three- dimensional shapes
in a variety of situations.Interpret and represent data to solve multi-step problems.
HighPupils can apply conceptual understanding to solve problems.
550
Apply conceptual understanding of whole numbers to solve two-step word problems.
Show understanding of the number line, multiples, factors, and rounding numbers.
Show understanding of operations with fractions and decimals.
Solve simple measurement problems.Demonstrate understanding of geometric properties of
shapes and angles.Interpret and use data in tables and a variety of graphs to
solve problems.
IntermediatePupils can apply basic mathematical knowledge in simple situations
475
Compute with three- and four-digit whole numbers in a variety of situations.
Identify and draw shapes with simple properties.Read, label, and interpret information in graphs and
tables.
LowPupils have some basic mathematical knowledge.
400
Add, subtract, multiply, and divide one- and two- digit whole numbers.
Solve simple word problems.Have some knowledge of unit fractions and common
geometric shapes.Read and complete simple bar graphs and tables.
Adapted from Mullis, Martin, Foy, Kelly, & Fishbein (2020).
18 ThepercentageofpupilsreachingeachbenchmarkispresentedhereincumulativeformatonthebasisthateachBenchmark representsacumulativedemonstrationofincreasingknowledgeandskill,inaccordancewiththepresentationprovidedinthe internationalTIMSSreport(Mullis,Martin,Foy,Kelly&Fishbein,2020).Alternatively,eachBenchmarkcanbetreatedasadiscrete category,showingthepercentageofpupilswithineachBenchmark.ThepercentagesofstudentswithineachBenchmarkinIrelandare presentedinfootnotesaccompanyingthecorrespondingcumulativedata.

Chapter 5: Performance at International Benchmarks
TIMSS 2019 Ireland’s results in mathematics and science30
The percentage of Fourth Class pupils who reached each Benchmark was higher in Ireland than was found internationally at the TIMSS median (Table 5.2). The vast majority of pupils in Ireland (97%) reached at least the Low Benchmark, with most (84%) achieving at least an Intermediate level of proficiency. More than half of Fourth Class pupils (52%) were classified as reaching the High Benchmark for mathematics. A smaller proportion – about one in seven pupils (15%) – reached the Advanced mathematical Benchmark.
In several of our comparison countries (Singapore, Republic of Korea, Chinese Taipei, Japan), achievement of the Low and Intermediate Benchmarks was almost universal. More than half of Singaporean pupils reached the Advanced Benchmark, as did at least one-third of pupils in Republic of Korea, Chinese Taipei, and Japan. In Northern Ireland and England, the percentage of pupils reaching the Low, Intermediate, and (in England) High Benchmarks was similar to Ireland’s. However, both jurisdictions had higher percentages of pupils reaching the most advanced level (26% in Northern Ireland and 21% in England, compared to 15% in Ireland). Benchmark performance in the United States, Finland, Australia, and New Zealand was lower than in Ireland.
Table 5.2: Percentages (SE) of pupils reaching each International Benchmark, Ireland and comparison countries – Fourth grade mathematics19
Mean score
Percent of pupils (cumulative) (SE)Low Intermediate High Advanced
Singapore 625 99 (0.3) 96 (0.7) 84 (1.5) 54 (2.2)Korea, Rep. of 600 99 (0.2) 95 (0.5) 77 (1.2) 37 (1.4)Chinese Taipei 599 100 (0.2) 96 (0.5) 78 (1.1) 37 (1.3)Japan 593 99 (0.2) 95 (0.4) 74 (0.9) 33 (1.3)Northern Ireland 566 96 (0.6) 85 (1.1) 60 (1.4) 26 (1.4)England 556 96 (0.5) 83 (1.2) 53 (1.5) 21 (1.4)Ireland 548 97 (0.5) 84 (1.0) 52 (1.4) 15 (1.0)United States 535 93 (0.6) 77 (1.1) 46 (1.3) 14 (0.8)Finland 532 95 (0.6) 78 (1.2) 42 (1.3) 11 (0.8)Australia 516 90 (1.0) 70 (1.3) 36 (1.2) 10 (0.9)New Zealand 487 83 (0.9) 56 (1.3) 25 (1.2) 6 (0.5)TIMSS (median) - 92 (-) 71 (-) 34 (-) 7 (-)
Average achievement significantly higher than Ireland
Average achievement significantly lower than Ireland
There were no statistically significant differences between the percentages of pupils reaching the various Benchmarks in Ireland between TIMSS 2015 and TIMSS 2019 (Table 5.3). However, as was the case in 2015, Irish achievement in TIMSS 2019 was significantly higher than in 1995 or 2011 at all levels.
19 ThepercentagesofFourthClasspupilswithineachmathematicsBenchmark(i.e.,discretecategories)inIrelandare: 3.4%(BelowLow);13.0%(Low);31.9%(Intermediate);36.4%(High);15.3%(Advanced).

Chapter 5: Performance at International Benchmarks
31TIMSS 2019 Ireland’s results in mathematics and science
Table 5.3: Overall mean score, and percentage of Fourth Class pupils reaching the mathematics International Benchmarks in TIMSS 2019 and previous cycles
Mean Low (400)
Intermediate (475)
High (550)
Advanced (625)
Ireland: 2019 548 97 84 52 15Ireland: 2015 547 97 84 51 14Ireland: 2011 527 94 77 41 9Ireland: 1995 523 91 73 40 10
Percentages in bold are significantly lower than the equivalent in 2019.
In Ireland, similar percentages of boys and girls reached the Low and Intermediate mathematics Benchmarks (Table 5.4), and a slightly higher percentage of boys reached the High and Advanced Benchmarks. However, the differences in the percentages of boys and girls reaching each Benchmark were not statistically significant.
Table 5.4: Percentages (SE) of boys and girls reaching each Benchmark – Fourth Class mathematics
Mean Low (400)
Intermediate (475)
High (550)
Advanced (625)
Boys 552 97 (0.6) 84 (1.4) 53 (1.8) 17 (1.4)Girls 545 96 (0.6) 83 (1.3) 50 (1.9) 14 (1.4)
Percentages in bold indicate a significant difference between boys and girls.
Benchmark performance – Fourth Class, science
Table 5.5 presents the International Benchmarks for science at the Fourth grade. Pupils reaching the Low Benchmark can demonstrate some limited knowledge of scientific facts, while pupils at the Intermediate Benchmark can show some understanding of the physical characteristics of Earth and knowledge of several aspects of the physical and life sciences. At the High and Advanced Benchmarks, pupils can demonstrate more complex understanding and apply their knowledge, as well as showing increasing ability to communicate their understanding of scientific facts and processes.

Chapter 5: Performance at International Benchmarks
TIMSS 2019 Ireland’s results in mathematics and science32
Table 5.5: International Benchmarks – Fourth grade science
Benchmark Scoring at least Pupils typically can:
AdvancedPupils communicate understanding of life, physical, and Earth sciences, and demonstrate some knowledge of the process of scientific inquiry.
625
Demonstrate knowledge of characteristics and life processes of a variety of organisms.
Communicate understanding of relationships in ecosystems and interactions between organisms and their environment.
Communicate understanding of properties and states of matter and physical and chemical changes.
Communicate understanding of Earth’s physical characteristics, processes, and history, and show knowledge of earth’s revolution and rotation.
HighPupils communicate and apply knowledge of life, physical, and Earth sciences.
550
Communicate knowledge of characteristics of plants, animals, and their life cycles.
Apply knowledge of ecosystems and of humans’ and organisms’ interactions with their environment.
Demonstrate knowledge of states and properties of matter, and of energy transfer in practical contexts, and show some understanding of forces and motion.
Know various facts about the Earth’s physical characteristics and show basic understanding of the Earth-Moon-Sun system.
IntermediatePupils show knowledge and understanding of some aspects of science.
475
Demonstrate some basic knowledge of plants and animals.
Demonstrate knowledge about some properties of matter and about some facts related to electricity.
Apply elementary knowledge of forces and motion.Show some understanding of Earth’s physical
characteristics.LowPupils show limited knowledge of science facts
400 Limited knowledge demonstrated consistently.
Adapted from Mullis, Martin, Foy, Kelly, & Fishbein (2020).
In Ireland, most Fourth Class pupils could reach the Low (94%) and Intermediate (77%) Benchmarks (Table 5.6). About two-in-five pupils (41%) reached the High Benchmark for science, and about one-in-ten (9%) were classified at the Advanced Benchmark. Comparison to the TIMSS median indicates that performance on the science Benchmarks in Ireland was higher than was found internationally, although only slightly so at the Low and Advanced Benchmarks. Among our comparison countries, only Northern Ireland (at the Intermediate, High, and Advanced levels) and New Zealand had lower percentages of students reaching each Benchmark. In Singapore and the Republic of Korea, substantial minorities of students (38% and 29%) successfully reached the Advanced Benchmark.

Chapter 5: Performance at International Benchmarks
33TIMSS 2019 Ireland’s results in mathematics and science
Table 5.6: Percentages (SE) of pupils reaching each International Benchmark, Ireland and comparison countries – Fourth grade science20
Mean score
Percent of pupils (cumulative) (SE)Low Intermediate High Advanced
Singapore 595 98 (0.4) 93 (0.9) 74 (1.7) 38 (1.9)Korea, Rep. of 588 99 (0.2) 95 (0.6) 73 (1.3) 29 (1.2)Japan 562 98 (0.4) 90 (0.7) 59 (1.2) 17 (0.8)Chinese Taipei 558 99 (0.3) 89 (0.9) 57 (1.1) 15 (0.9)Finland 555 97 (0.5) 87 (1.0) 56 (1.4) 15 (1.1)United States 539 94 (0.6) 79 (1.1) 48 (1.3) 15 (0.8)England 537 94 (0.6) 81 (1.2) 44 (1.7) 10 (1.1)Australia 533 94 (0.7) 78 (1.2) 44 (1.5) 11 (0.9)Ireland 528 94 (0.8) 77 (1.7) 41 (1.6) 9 (0.6)Northern Ireland 518 94 (0.7) 74 (1.5) 35 (1.4) 5 (0.7)New Zealand 503 88 (0.8) 64 (1.2) 30 (1.3) 6 (0.5)TIMSS (median) - 92 (-) 71 (-) 32 (-) 6 (-)
Average achievement significantly higher than Ireland
Average achievement significantly lower than Ireland
In Ireland, there were no significant changes in science achievement, as measured by the Benchmarks, between 2015 and 2019 (Table 5.7). A significantly greater percentage of Fourth Class pupils in 2019 reached the Intermediate and High Benchmarks than in either 1995 or 2011. In addition, a significantly higher percentage reached at least the Low Benchmark in 2019 than in 1995. However, there has been no substantive change in the proportion of pupils reaching the most Advanced level in science across any of the cycles of TIMSS in which Ireland has participated since 1995.
Table 5.7: Overall mean score, and percentage of Fourth Class pupils reaching the science International Benchmarks in TIMSS 2019 and previous cycles
Mean Low (400)
Intermediate (475)
High (550)
Advanced (625)
Ireland: 2019 528 94 77 41 9Ireland: 2015 529 96 79 40 7Ireland: 2011 516 92 72 35 7Ireland: 1995 515 91 70 36 8
Percentages in bold are significantly lower than the equivalent in 2019.
Similar percentages of boys and girls reached each of the four Benchmarks in Ireland, although slightly more boys reached the High Benchmark (Table 5.8). There were no significant differences in the percentage of boys or girls reaching any of the Benchmarks.
20 ThepercentagesofFourthClasspupilswithineachscienceBenchmark(i.e.,discretecategories)inIrelandare: 5.8%(BelowLow);16.8%(Low);36.5%(Intermediate);32.3%(High);8.6%(Advanced).

Chapter 5: Performance at International Benchmarks
TIMSS 2019 Ireland’s results in mathematics and science34
Table 5.8: Percentages (SE) of boys and girls reaching each Benchmark – Fourth Class science
Mean Low (400)
Intermediate (475)
High (550)
Advanced (625)
Boys 530 94 (1.0) 78 (1.6) 42 (1.7) 9 (0.9)Girls 526 94 (0.9) 77 (2.3) 40 (2.1) 8 (0.8)
Percentages in bold indicate a significant difference between boys and girls.
Benchmark performance – Second Year, mathematics
The mathematics skills and knowledge associated with each of the International Benchmarks at Eighth grade are outlined in Table 5.9. Students achieving at the Low Benchmark can display some knowledge of whole numbers and basic graphs and are able to match tables to bar graphs and pictographs, while those at the Intermediate Benchmark are able to apply basic mathematical knowledge in different situations. At the High Benchmark, students can apply their mathematical knowledge in a range of complex situations, while students reaching the Advanced Benchmark demonstrate a greater understanding of mathematical concepts, such as knowledge of geometric figures and how changing data points can affect the mean, and they can apply and reason in a variety of problem situations.

Chapter 5: Performance at International Benchmarks
35TIMSS 2019 Ireland’s results in mathematics and science
Table 5.9: International Benchmarks – Eighth grade mathematics
Benchmark Scoring at least Pupils typically can:
AdvancedStudents can apply and reason in a variety of problem situations, solve linear equations and make generalisations.
625
Solve a variety of fraction, proportion, and percent problems and can justify their conclusions.
Understand linear functions and algebraic expressions.Use their knowledge of geometric figures to solve a wide
range of problems involving angles, area and surface area.
Calculate means and medians and understand how changing data points can affect the mean.
Interpret a wide variety of data displays to draw and justify conclusions and solve multi-step problems.
Solve problems involving expected values.
HighStudents can apply their understanding and knowledge in a variety of relatively complex situations.
550
Solve problems with fractions, decimals, ratios and proportions.
Show basic procedural knowledge related to algebraic expressions and equations.
Solve a variety of problems with angles including those involving triangles, parallel lines, rectangles, and congruent and similar figures.
Interpret data in a variety of graphs and solve simple problems involving outcomes and probabilities.
IntermediateStudents can apply basic mathematical knowledge in a variety of situations.
475
Solve problems involving whole numbers, negative numbers, fractions, decimals, and ratios.
Show some basic knowledge about properties of two-dimensional shapes.
Read and interpret data in graphs.Show some basic knowledge of probability.
LowStudents have some knowledge of whole numbers and basic graphs.
400 Match tables to bar graphs and pictographs.
Adapted from Mullis, Martin, Foy, Kelly, & Fishbein (2020).
The percentage of students in Ireland and selected comparison countries reaching each of the four mathematics Benchmarks are presented in Table 5.10. In Ireland, 94% of Second Year students reached at least the Low Benchmark, while 76% achieved at least the Intermediate Benchmark, 38% reached at least the High Benchmark and 7% obtained a score at the Advanced Benchmark. The corresponding international median percentages for the Low Benchmark (87%), Intermediate (56%) and High (25%) Benchmarks were well below those achieved in Ireland, while at the Advanced Benchmark, the international median percentage (5%) was just slightly below Ireland’s percentage.
The percentage of students reaching the Low Benchmark in Ireland is slightly below the corresponding percentages in the highest-achieving countries (i.e., 98% in Singapore and Chinese Taipei) and slightly above Australia and England (both 90%), countries with similar overall performance to Ireland’s. While Finland’s mean mathematics score is significantly lower than Ireland’s, the percentage of students reaching the Low Benchmark is very similar in the two countries (94% in Ireland and 93% in Finland). On the other hand, about half of students in Singapore and Chinese Taipei achieved the Advanced Benchmark, while the corresponding percentages in Australia and England were slightly above the percentage in Ireland.

Chapter 5: Performance at International Benchmarks
TIMSS 2019 Ireland’s results in mathematics and science36
Table 5.10: Percentages (SE) of students reaching each International Benchmark, Ireland and comparison countries – Eighth grade mathematics21
Mean score
Percent of pupils (cumulative) (SE)
Low Intermediate High AdvancedSingapore 616 98 (0.4) 92 (1.1) 79 (2.0) 51 (2.2)Chinese Taipei 612 98 (0.3) 90 (0.6) 75 (0.9) 49 (1.3)Korea, Rep. of 607 97 (0.4) 90 (0.8) 74 (0.9) 45 (1.3)
Japan 594 99 (0.2) 92 (0.6) 71 (1.1) 37 (1.4)
Ireland 524 94 (0.8) 76 (1.3) 38 (1.6) 7 (0.8)Australia 517 90 (0.8) 68 (1.5) 36 (1.8) 11 (1.4)United States 515 87 (1.4) 66 (1.9) 38 (1.9) 14 (1.2)England 515 90 (1.6) 69 (2.2) 35 (2.3) 11 (1.5)Finland 509 93 (0.9) 69 (1.4) 29 (1.2) 5 (0.5)New Zealand 482 82 (1.4) 53 (1.6) 22 (1.1) 6 (0.5)TIMSS (median) - 87 (-) 56 (-) 25 (-) 5 (-)
Average achievement significantly higher than Ireland
Average achievement significantly lower than Ireland
Although not statistically significant, there were slight increases in the percentages reaching the Low and Intermediate Benchmarks in Ireland between 1995 and 2015 (from 91% to 94% at the Low Benchmark and from 73% to 76% at the Intermediate Benchmark). However, there were no changes in the percentages reaching these Benchmarks between 2015 and 2019. The percentages reaching the High and Advanced Benchmarks have remained stable since 1995 with no statistically significant changes in the percentages at these Benchmarks across the three cycles (Table 5.11).
Table 5.11: Overall mean score, and percentage of Second Year students reaching the mathematics International Benchmarks in TIMSS 2019 and previous cycles
Mean Low (400)
Intermediate (475)
High (550)
Advanced (625)
Ireland: 2019 524 94 76 38 7Ireland: 2015 523 94 76 38 7Ireland: 1995 519 91 73 37 8
Percentages in bold are significantly different to the equivalent in 2019.
In Ireland, a significantly higher percentage of girls than boys reached the Intermediate Benchmark in mathematics, while there were no significant differences between the percentages of Second Year girls and boys reaching any of the other mathematics Benchmark in 2019 (Table 5.12).
21 ThepercentagesofSecondYearstudentswithineachmathematicsBenchmark(i.e.,discretecategories)inIrelandare: 5.6%(BelowLow);18.9%(Low);37.6%(Intermediate);30.7%(High);7.3%(Advanced).

Chapter 5: Performance at International Benchmarks
37TIMSS 2019 Ireland’s results in mathematics and science
Table 5.12: Percentages (SE) of boys and girls reaching at each Benchmark – Second Year mathematics
Mean Low (400)
Intermediate (475)
High (550)
Advanced (625)
Boys 523 94 (1.0) 74 (1.8) 39 (2.0) 8 (1.1)Girls 524 95 (0.8) 77 (1.4) 37 (2.0) 6 (0.9)
Percentages in bold indicate a significant difference between boys and girls.
Benchmark performance – Second Year, science
Science performance is also categorised into four International Benchmarks, each of which describe increasing levels of scientific knowledge and understanding (Table 5.13). Students who achieve at the Low Benchmark have a basic understanding of scientific principles and concepts and a limited knowledge of science facts. Students at the Intermediate Benchmark can demonstrate and apply some knowledge of biology (such as characteristics of animals) and physical science (such as properties of matter and chemical changes) while those at the High Benchmark can understand and apply concepts from biology, chemistry, physics and Earth science. Students reaching the Advanced Benchmark can communicate their understanding of more complex scientific concepts in a variety of contexts, such as recognising the interdependence of populations of organisms in an ecosystem; demonstrating knowledge of the composition of matter and the periodic table of element; recognising evidence that a chemical change has occurred; and communicating understanding of Earth’s structure, physical features and processes.

Chapter 5: Performance at International Benchmarks
TIMSS 2019 Ireland’s results in mathematics and science38
Table 5.13: International Benchmarks – Second Year science
Benchmark Scoring at least Pupils typically can:
AdvancedStudents communicate understanding of concepts related to biology, chemistry, physics and Earth science in a variety of contexts.
625
Classify animals into taxonomic groups.Apply knowledge of cells and their functions. Show some understanding of diversity, adaptation and
natural selection.Recognise the interdependence of populations of
organisms in an ecosystem. Demonstrate knowledge of the composition of matter
and the periodic table of elements.Use physical properties of matter to sort, classify and
compare substances and materials.Recognise evidence that a chemical change has
occurred.Communicate understanding of particle spacing and
motion in different physical states. Apply knowledge of energy transfer and electrical
circuits, relate the properties of light and sound to common phenomena, and demonstrate understanding of forces in everyday contexts.
Communicate understanding of Earth’s structure, physical features and processes.
Demonstrate knowledge of the Earth’s resources and their conservation.
HighStudents apply understanding of concepts from biology, chemistry, physics and Earth science.
550
Apply knowledge of the characteristics of groups of animals, life processes in humans, cells and their function, genetic inheritance, ecosystems, and nutrition.
Show some knowledge and understanding of the composition and properties of matter and chemical reactions.
Apply basic knowledge of energy transformation and transfer, electrical circuits, properties of magnets, light, sound and forces.
Apply knowledge of Earth’s physical features, processes, cycles, and history, and show some understanding of Earth’s resources and their use.
IntermediateStudents show and apply some knowledge of biology and physical science.
475
Demonstrate some knowledge of characteristics of animals.
Apply knowledge of ecosystems. Show some knowledge of the properties of matter,
chemical changes, and a few physics concepts.
LowStudents show limited understanding of scientific principles and concepts and limited knowledge of science facts.
400
Read a food web.Identify some materials that are attracted to magnets.Know that salt must be removed from clean ocean water
to make it safe to drink.
Adapted from Mullis, Martin, Foy, Kelly, & Fishbein (2020).
Table 5.14 presents the percentages of students reaching each Benchmark in Ireland and selected comparison countries. The majority of students in Ireland (92%) reached at least the Low Benchmark in science, while 73% reached at least the Intermediate Benchmark, 40% reached at least the High benchmark and 10% achieved the Advanced Benchmark. The percentages reaching each Benchmark

Chapter 5: Performance at International Benchmarks
39TIMSS 2019 Ireland’s results in mathematics and science
were higher in Ireland than the corresponding international median percentages, although just slightly so at the Advanced Benchmark (7% compared to 10% in Ireland).
The percentage of students reaching the Low Benchmark is somewhat lower in Ireland than in Singapore, the highest achieving country, where 98% of students reached this Benchmark. The gap in performance between Ireland and Singapore widens at the higher Benchmarks, with almost five times as many as students reaching the Advanced Benchmark in Singapore compared to Ireland (48% versus 10%). Of the selected comparison countries with similar overall science performance to Ireland, Australia had a similar percentage reaching the Low Benchmark as Ireland, while the United States and England had slightly fewer students reaching this Benchmark. On the other hand, these three countries had slightly more students reaching the Advanced Benchmark, although only just so in England.
Table 5.14: Percentages (SE) of students reaching each International Benchmark, Ireland and comparison countries – Second Year science22
Mean score
Percent of students (cumulative) (SE)
Low Intermediate High AdvancedSingapore 608 98 (0.5) 91 (1.2) 77 (2.0) 48 (1.9)Chinese Taipei 574 97 (0.3) 88 (0.7) 64 (1.0) 29 (1.0)Japan 570 99 (0.3) 90 (0.6) 63 (1.1) 22 (1.4)
Korea, Rep. of 561 96 (0.4) 86 (0.8) 56 (1.1) 22 (0.9)
Finland 543 94 (0.7) 80 (1.4) 50 (1.5) 16 (1.0)
Australia 528 92 (0.7) 74 (1.2) 43 (1.6) 13 (1.2)Ireland 523 92 (0.9) 73 (1.5) 40 (1.4) 10 (0.8)United States 522 88 (1.4) 70 (1.8) 43 (1.8) 15 (1.1)England 517 89 (1.4) 69 (2.1) 38 (2.1) 11 (1.3)New Zealand 499 85 (1.2) 63 (1.6) 30 (1.4) 8 (0.6)TIMSS (median) - 85 (-) 61 (-) 29 (-) 7 (-)
Average achievement significantly higher than Ireland
Average achievement significantly lower than Ireland
In Ireland, the percentages reaching the Low, Intermediate and High Benchmarks increased somewhat between 1995 and 2015 but have decreased between 2015 and 2019, significantly so at the Intermediate Benchmark. On the other hand, the percentage reaching the Advanced Benchmark has remained stable since 1995.
Table 5.15: Overall mean score, and percentage of Second Year students reaching the science International Benchmarks in TIMSS 2019 and previous cycles
Mean Low (400)
Intermediate (475)
High (550)
Advanced (625)
Ireland: 2019 523 92 73 40 10Ireland: 2015 530 94 77 43 10Ireland: 1995 518 90 70 38 11
Percentages in bold are significantly higher than the equivalent in 2019.
22 ThepercentagesofSecondYearstudentswithineachscienceBenchmark(i.e.,discretecategories)inIrelandare: 8.0%(BelowLow);18.7%(Low);33.7%(Intermediate);29.8%(High);9.8%(Advanced).

Chapter 5: Performance at International Benchmarks
TIMSS 2019 Ireland’s results in mathematics and science40
In Ireland, significantly more girls than boys reached at least the Low Benchmark in science, while there were no significant differences in the percentages of girls and boys reaching the Intermediate, High or Advanced Benchmarks (Table 5.16).
Table 5.16: Percentages (SE) of boys and girls reaching each Benchmark – Second Year science
Mean Low (400)
Intermediate (475)
High (550)
Advanced (625)
Boys 521 91 (1.3) 71 (1.9) 39 (1.9) 10 (0.9)Girls 526 94 (0.8) 75 (1.5) 40 (1.9) 9 (1.1)
Percentages in bold indicate a significant difference between boys and girls.

Chapter 6: Performance in content and cognitive domains: Mathematics
41TIMSS 2019 Ireland’s results in mathematics and science
Chapter 6: Performance in content and cognitive domains: Mathematics The design and content of the TIMSS mathematics assessment is informed by the TIMSS 2019 mathematics framework (Mullis & Martin, 2017), which is broadly similar to the assessment framework used in 2015 but includes minor updates to some topics to better reflect the curricula of participating countries. In addition, with the transition to eTIMSS in 2019, the framework was updated to reflect both paper and digital assessment formats.
The 2019 mathematics framework is organised around a number of domains that assess different areas or subject matter (content domains) and different thinking processes (cognitive domains). Each item in the assessment is classified according to the main content area that underlies the problem and the main cognitive process that is required to solve the problem.
At Fourth grade, three content domains were included in the assessment:
• Number (includes whole numbers; expressions, simple equations and relationships; and fractions and decimals);
• Measurement & Geometry (includes solving problems involving length, mass, volume, time, perimeters of polygons, area of triangles and partial squares; lines and angles; and two- and three-dimensional shapes); and
• Data (includes reading, interpreting and representing data; and using data to solve problems).
At Eighth grade, four content domains were assessed:
• Number (includes integers; fractions and decimals; ratio, proportion and percent);• Algebra (includes expressions, operations and equations; and relationships and functions);• Geometry (includes angles and lines, solving problems using the Cartesian plane; calculating
perimeter, circumference and area; using the Pythagorean Theorem; recognising geometric transformations, and using the geometric properties of three-dimensional shapes to solve problems); and
• Data & Probability (includes reading and interpreting data; calculating, using and interpreting statistics; and theoretical and empirical probability).
As noted in Chapter 1, the relative emphasis placed on each content domain differs across the two grade levels, reflecting the mathematics that is generally taught at each grade.
Three cognitive domains were also assessed at both Fourth grade and Eighth grade and each of the content domains included items that addressed each of the three cognitive domains. The three cognitive domains were:
• Knowing (refers to the facts, concepts, and procedures students need to know);• Applying (covers students’ ability to apply knowledge and conceptual understanding to solve
problems or answer questions); and • Reasoning (involves solving problems in unfamiliar situations, complex contexts, and includes
multistep problems).
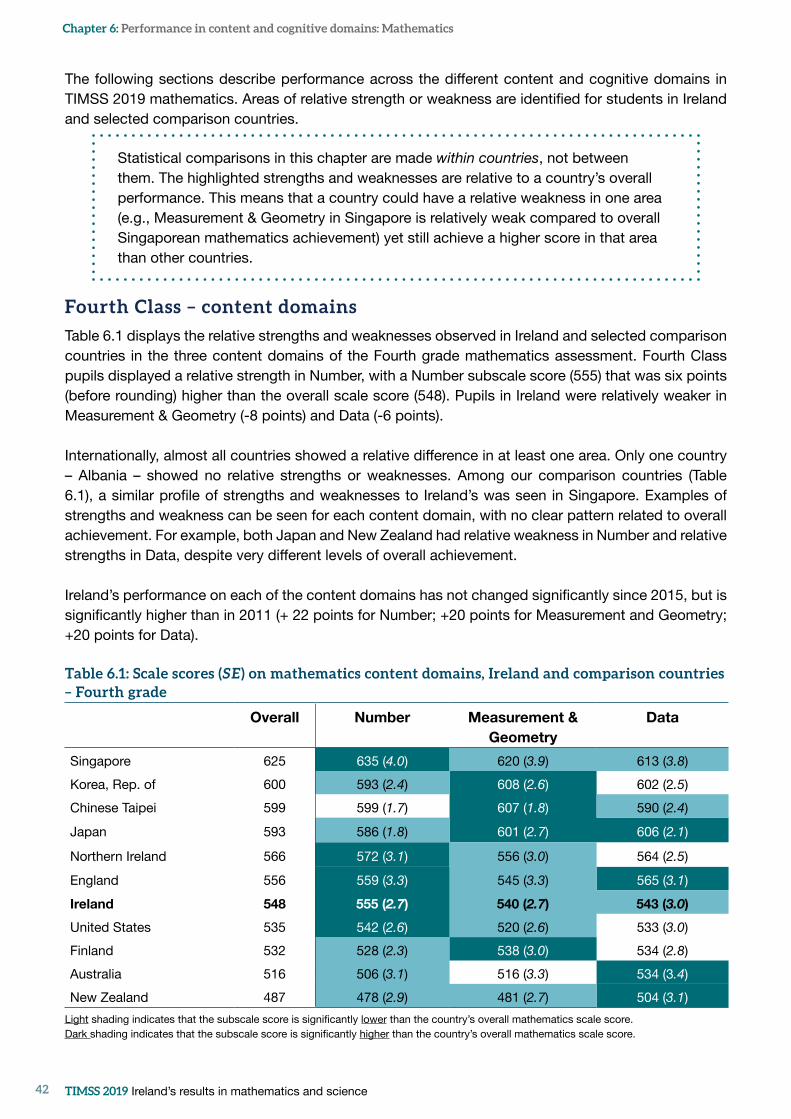
Chapter 6: Performance in content and cognitive domains: Mathematics
TIMSS 2019 Ireland’s results in mathematics and science42
The following sections describe performance across the different content and cognitive domains in TIMSS 2019 mathematics. Areas of relative strength or weakness are identified for students in Ireland and selected comparison countries.
Statistical comparisons in this chapter are made within countries, not between them. The highlighted strengths and weaknesses are relative to a country’s overall performance. This means that a country could have a relative weakness in one area (e.g., Measurement & Geometry in Singapore is relatively weak compared to overall Singaporean mathematics achievement) yet still achieve a higher score in that area than other countries.
Fourth Class – content domains
Table 6.1 displays the relative strengths and weaknesses observed in Ireland and selected comparison countries in the three content domains of the Fourth grade mathematics assessment. Fourth Class pupils displayed a relative strength in Number, with a Number subscale score (555) that was six points (before rounding) higher than the overall scale score (548). Pupils in Ireland were relatively weaker in Measurement & Geometry (-8 points) and Data (-6 points).
Internationally, almost all countries showed a relative difference in at least one area. Only one country – Albania – showed no relative strengths or weaknesses. Among our comparison countries (Table 6.1), a similar profile of strengths and weaknesses to Ireland’s was seen in Singapore. Examples of strengths and weakness can be seen for each content domain, with no clear pattern related to overall achievement. For example, both Japan and New Zealand had relative weakness in Number and relative strengths in Data, despite very different levels of overall achievement.
Ireland’s performance on each of the content domains has not changed significantly since 2015, but is significantly higher than in 2011 (+ 22 points for Number; +20 points for Measurement and Geometry; +20 points for Data).
Table 6.1: Scale scores (SE) on mathematics content domains, Ireland and comparison countries – Fourth grade
Overall Number Measurement & Geometry
Data
Singapore 625 635 (4.0) 620 (3.9) 613 (3.8)Korea, Rep. of 600 593 (2.4) 608 (2.6) 602 (2.5)Chinese Taipei 599 599 (1.7) 607 (1.8) 590 (2.4)
Japan 593 586 (1.8) 601 (2.7) 606 (2.1)
Northern Ireland 566 572 (3.1) 556 (3.0) 564 (2.5)
England 556 559 (3.3) 545 (3.3) 565 (3.1)Ireland 548 555 (2.7) 540 (2.7) 543 (3.0)United States 535 542 (2.6) 520 (2.6) 533 (3.0)Finland 532 528 (2.3) 538 (3.0) 534 (2.8)Australia 516 506 (3.1) 516 (3.3) 534 (3.4)New Zealand 487 478 (2.9) 481 (2.7) 504 (3.1)
Light shading indicates that the subscale score is significantly lower than the country’s overall mathematics scale score. Dark shading indicates that the subscale score is significantly higher than the country’s overall mathematics scale score.

Chapter 6: Performance in content and cognitive domains: Mathematics
43TIMSS 2019 Ireland’s results in mathematics and science
There were no significant gender differences in any of the content subscales in Ireland (Table 6.2), meaning that boys and girls in Fourth Class performed at a similar level in each area. A similar pattern was observed in Chinese Taipei, Northern Ireland, and Finland. Boys achieved a higher score than girls in four of our comparison countries on Number, in five countries on Measurement & Geometry, and in one country on Data. In Japan, girls significantly outperformed boys on Data. In the United States boys scored higher than girls on each content domain.
Table 6.2: Mean scores of girls and boys on mathematics content domains, Ireland and comparison countries – Fourth grade
Number Measurement & Geometry
Data
Girls Boys Girls Boys Girls BoysSingapore 631 639 615 625 611 616Korea, Rep. of 589 597 605 610 605 600Chinese Taipei 597 602 606 609 588 592Japan 585 587 602 601 608 603
Northern Ireland 571 574 551 560 564 564
England 556 562 540 550 561 568Ireland 551 558 538 543 540 545United States 537 547 513 526 527 539Finland 525 530 537 540 534 534Australia 501 511 509 523 531 537New Zealand 476 481 476 486 503 504
Shading indicates that the subscale score is significantly higher than for the other gender on that subscale. Standard errors for the data in this table can be found in Table C1 in Appendix C.
Fourth Class – cognitive domains
In Ireland, Fourth Class pupils showed a relative strength in the Applying cognitive domain (+3 points) and a relative weakness in Reasoning (-7 points) (Table 6.3). This marks a change from TIMSS 2015, when Knowing (but not Applying) emerged as a relative strength (Clerkin et al., 2016), although Ireland’s performance on each of the cognitive domains has not changed significantly since 2015. However, scores on each domain were significantly higher in 2019 than in 2011 (+11 points for Knowing; +23 points for Applying; +32 points for Reasoning).
Most of our comparison countries, including all of the highest-scoring countries, had a relative strength in Knowing and a relative weakness in Reasoning. Australia and New Zealand recorded the opposite pattern, with strengths in Reasoning and weakness in Knowing. Ireland was one of two countries in Table 6.3 with a relative strength in Applying (the other being the United States) or no relative difference in Knowing (the other being Finland). Among all TIMSS countries, only three (Hungary, Croatia and Malta) showed no relative differences in any cognitive domain.

Chapter 6: Performance in content and cognitive domains: Mathematics
TIMSS 2019 Ireland’s results in mathematics and science44
Table 6.3: Scale scores (SE) on mathematics cognitive domains, Ireland and comparison countries – Fourth grade
Overall Knowing Applying ReasoningSingapore 625 640 (3.9) 626 (3.9) 614 (4.0)Korea, Rep. of 600 612 (3.6) 594 (2.5) 596 (2.9)Chinese Taipei 599 622 (1.9) 600 (1.5) 576 (1.8)Japan 593 597 (2.0) 593 (2.0) 589 (2.2)Northern Ireland 566 574 (3.3) 565 (2.8) 558 (2.9)England 556 563 (3.3) 553 (3.3) 554 (3.4)Ireland 548 550 (3.0) 551 (2.7) 542 (2.5)United States 535 536 (2.6) 537 (2.6) 524 (2.5)Finland 532 531 (2.4) 531 (2.4) 535 (2.5)Australia 516 509 (3.3) 516 (2.9) 522 (3.0)New Zealand 487 476 (2.7) 487 (2.4) 501 (2.7)
Light shading indicates that the subscale score is significantly lower than the country’s overall mathematics scale score. Dark shading indicates that the subscale score is significantly higher than the country’s overall mathematics scale score.
There were no gender differences in the cognitive domains in Ireland (Table 6.4). This was also the case in Japan, Northern Ireland, and Finland. Boys showed a relative advantage compared to girls in Knowing in five of the comparison countries; in one country for the Applying domain, and in five countries on the Reasoning domain. Boys had significantly higher mean scores in each cognitive domain in the United States.
Table 6.4: Mean scores of girls and boys on mathematics cognitive domains, Ireland and comparison countries – Fourth grade
Knowing Applying Reasoning
Girls Boys Girls Boys Girls BoysSingapore 634 646 623 628 609 619Korea, Rep. of 608 616 594 595 591 601
Chinese Taipei 619 624 599 601 570 581
Japan 597 598 594 591 588 590
Northern Ireland 570 579 565 564 556 561
England 555 570 552 555 550 558Ireland 546 554 548 554 538 546United States 528 544 534 541 516 531Finland 528 534 532 530 533 538 Australia 499 519 513 519 517 528New Zealand 469 482 487 488 499 503
Shading indicates that the subscale score is significantly higher than for the other gender on that subscale. Standard errors for the data in this table can be found in Table C2 in Appendix C.

Chapter 6: Performance in content and cognitive domains: Mathematics
45TIMSS 2019 Ireland’s results in mathematics and science
Second Year – content domains
Relative strengths among the mathematical content areas within Ireland and selected comparison countries are presented in Table 6.5. When compared to their overall mathematics performance, Second Year students in Ireland showed relative strengths in the Number (+17 points) and Data & Probability (+17 points) content areas, and relative weaknesses on the Algebra (-18 points) and Geometry (-18 points) content areas. Similar patterns were also observed in Australia and England, countries whose overall mathematics performance does not differ significantly from Ireland’s. Singapore, the highest-achieving country, showed relative strengths in three of the four content domains (Algebra, Geometry and Data & Probability) and a relative weakness on Number. Each of the four highest-performing countries showed relative strengths in Algebra and Geometry.
The average performance of Second Year students in Ireland on each of the mathematics content domains has not changed significantly between 2015 and 2019.
Table 6.5: Scale scores (SE) on mathematics content domains, Ireland and comparison countries – Eighth grade
Overall Number Algebra Geometry Data & Probability
Singapore 616 611 (4.1) 619 (4.6) 619 (3.9) 620 (4.9)
Chinese Taipei 612 613 (2.7) 618 (2.6) 623 (2.7) 593 (2.5)Korea, Rep. of 607 605 (2.6) 609 (3.5) 617 (2.9) 598 (2.6)Japan 594 578 (3.5) 602 (3.2) 610 (3.4) 594 (2.5)
Ireland 524 541 (3.0) 505 (2.8) 506 (2.8) 541 (3.4)Australia 517 522 (3.9) 501 (4.1) 513 (4.0) 533 (3.9)United States 515 520 (4.5) 520 (5.4) 499 (4.8) 509 (5.4)England 515 519 (5.4) 504 (5.8) 509 (5.3) 523 (6.2)Finland 509 515 (2.6) 489 (2.9) 511 (3.2) 514 (3.6)New Zealand 482 483 (3.6) 464 (3.5) 477 (3.4) 496 (3.7)
Light shading indicates that the subscale score is significantly lower than the country’s overall mathematics scale score. Dark shading indicates that the subscale score is significantly higher than the country’s overall mathematics scale score.
In Ireland, girls significantly outperformed boys on the Algebra content domain, while no significant differences between boys and girls were observed on the other content domains (Table 6.6). Among our comparison countries, there were no significant differences between boys and girls on the Data & Probability content domain and few significant differences between boys and girls across the other content domains. Girls significantly outperformed boys on the Algebra content domain in Chinese Taipei, the United States and Finland, while boys significantly outperformed girls on the Number content domain in Japan, Australia and New Zealand. Of our comparison countries, Finland was the only country with a significant difference between boys and girls on Geometry, with girls significantly outperforming boys.

Chapter 6: Performance in content and cognitive domains: Mathematics
TIMSS 2019 Ireland’s results in mathematics and science46
Table 6.6: Mean scores of girls and boys on mathematics content domains, Ireland and comparison countries – Eighth grade
Number Algebra Geometry Data & Probability
Girls Boys Girls Boys Girls Boys Girls BoysSingapore 611 611 623 615 620 618 623 618Chinese Taipei 612 614 623 613 623 623 593 594Korea, Rep. of 602 608 611 608 613 621 594 601Japan 573 583 605 600 609 611 592 597
Ireland 538 544 510 501 504 508 541 540
Australia 515 528 502 501 510 517 532 534United States 518 522 528 512 500 499 510 509England 513 526 507 500 510 507 523 523Finland 512 517 495 483 517 504 517 511New Zealand 477 489 464 464 474 479 492 499
Shading indicates that the subscale score is significantly higher than for the other gender on that subscale. Standard errors for the data in this table can be found in Table C3 in Appendix C.
Second Year – cognitive domains
In Ireland, Second Year students demonstrated relative strengths in the Knowing (+7 points) and Applying (+3 points) cognitive domains and a relative weakness on the higher-order Reasoning (-16 points) cognitive domain, when compared to their overall mathematics performance (Table 6.7). Other countries that showed a relative strength in the Knowing cognitive domain include Chinese Taipei, the Republic of Korea and the United States, while Australia, England and New Zealand displayed relative strengths in the Applying cognitive domain. Singapore, Japan and New Zealand had relative strengths in the Reasoning cognitive domain, while Australia and the United States, countries with similar overall performance to Ireland, displayed relative weaknesses in this domain.
The average score of students in Ireland on the Reasoning mathematics cognitive domain is significantly lower (by 13 points) in 2019 compared to 2015, while the average scores on the Knowing and Applying domains have not changed significantly.

Chapter 6: Performance in content and cognitive domains: Mathematics
47TIMSS 2019 Ireland’s results in mathematics and science
Table 6.7: Scale scores (SE) on mathematics cognitive domains, Ireland and comparison countries – Eighth grade
Overall Knowing Applying ReasoningSingapore 616 614 (4.3) 614 (3.8) 620 (4.5)Chinese Taipei 612 616 (3.0) 610 (2.6) 616 (2.7)Korea, Rep. of 607 614 (3.2) 604 (2.7) 609 (3.0)Japan 594 589 (3.1) 596 (2.8) 599 (3.2)
Ireland 524 530 (2.8) 526 (2.7) 508 (3.4)Australia 517 511 (4.0) 521 (3.8) 515 (3.9)United States 515 522 (5.2) 515 (4.9) 507 (4.6)England 515 510 (5.5) 518 (5.3) 512 (5.7)Finland 509 505 (2.5) 510 (2.7) 506 (2.9)New Zealand 482 468 (3.5) 486 (3.1) 486 (3.4)
Light shading indicates that the subscale score is significantly lower than the country’s overall mathematics scale score. Dark shading indicates that the subscale score is significantly higher than the country’s overall mathematics scale score.
There were no significant differences between boys and girls across the cognitive domains among Second Year students in Ireland, or among students in any of our comparison countries (Table 6.8).
Table 6.8: Mean scores of girls and boys on mathematics cognitive domains, Ireland and comparison countries – Eighth grade
Knowing Applying Reasoning
Girls Boys Girls Boys Girls BoysSingapore 618 611 616 613 622 619Chinese Taipei 619 613 611 609 616 616Korea, Rep. of 612 616 602 606 606 612Japan 589 589 594 598 598 600
Ireland 533 528 527 526 507 509
Australia 509 513 519 524 512 517United States 525 519 517 513 508 507England 507 514 519 517 512 512Finland 506 504 513 508 509 504New Zealand 462 473 483 489 483 489
Shading indicates that the subscale score is significantly higher than for the other gender on that subscale. Standard errors for the data in this table can be found in Table C4 in Appendix C.

Chapter 7: Performance in content and cognitive domains: Science
TIMSS 2019 Ireland’s results in mathematics and science48
Chapter 7: Performance in content and cognitive domains: ScienceThis chapter presents the performance of students according to the particular science content areas and cognitive processes (i.e., thinking processes) outlined in the TIMSS 2019 science framework (Mullis & Martin, 2017). As is the case for mathematics, the science framework is broadly similar to the assessment framework used in 2015 but has been updated slightly to better reflect the science curricula of participating countries and to take account of both paper and digital assessment formats, with the transition to eTIMSS.
Each item in the science assessment is classified according to the main subject area (i.e., content domain) covered as well as the main cognitive process that is required to answer the question. Three content domains were included in the assessment at Fourth grade:
• Life Science (includes the characteristics and life processes of organisms; life cycles, reproduction and heredity; organisms, environment and their interactions; ecosystems; human health);
• Physical Science (includes the classification and properties of matter and changes in matter; forms of energy and energy transfer; forces and motion); and
• Earth Science (includes Earth’s physical characteristics, resources and history; Earth’s weather and climates; and Earth in the solar system). The Earth Science domain includes many topics that are covered in the geography curriculum in Ireland.
At Eighth grade, four content areas were assessed. These were:
• Biology (includes the characteristics and life processes of organisms; cells and their functions; life cycles, reproduction, and heredity; diversity, adaptation, and natural selection; ecosystems; and human health);
• Physics (includes topics such as physical states and changes in matter; energy transformation and transfer; light and sound; electricity and magnetism; motion and forces);
• Chemistry (includes the composition of matter; properties of matter; and chemical change); and• Earth Science (Earth’s structure and physical features; Earth’s processes, cycles, and history;
Earth’s resources, their use, and conservation; Earth in the solar system and the universe). As at Fourth grade, some topics assessed as part of the Earth Science domain in TIMSS are considered to be part of the geography curriculum in Ireland.
As can be seen from Tables 1.2 and 1.3 in Chapter 1, the coverage of each content domain differs across the two grade levels, reflecting the nature and difficulty of the science taught at each grade. Three cognitive domains were assessed at both Fourth and Eighth grades:
• Knowing (covers the facts, relationships, processes, concepts and equipment that students need to know);
• Applying (refers to students’ ability to apply their knowledge of facts, relationships, processes, concepts, equipment, and methods in familiar contexts); and
• Reasoning (involves students analysing data and other information, drawing conclusions, and extend their understanding to unfamiliar situations).

Chapter 7: Performance in content and cognitive domains: Science
49TIMSS 2019 Ireland’s results in mathematics and science
The performance of students across the different science content and cognitive areas is described in the remainder of this chapter. Areas of relative strength and weakness within Ireland and our comparison countries are identified.
As with Chapter 6, statistical comparisons in this chapter are made within countries, not between them. The highlighted strengths and weaknesses are relative to a country’s overall performance. This means that a country could have a relative weakness in one area (e.g., Earth Science in Singapore is relatively weak compared to overall Singaporean science achievement) yet still achieve a higher score in that area than other countries.
Fourth Class – content domains
Fourth Class pupils displayed a relative strength in Earth Science (+8 points) – the content area that includes aspects of what is taught as geography in Ireland – and a relative weakness in Physical Science (-5 points). Performance in Life Science was in line with Ireland’s overall science score (Table 7.1). A similar pattern was also seen in Northern Ireland.
Across all TIMSS countries, only one (Austria) had no relative differences between science content domains. There was substantial variation among our comparison countries, although Physical Science is seen to be a relative strength in the four high-achieving East Asian countries.
The performance of Fourth Class pupils in Ireland on each of the content domains has not changed significantly between 2015 and 2019. However, Ireland’s mean scores on the Life Science and Earth Science domains in 2019 are significantly higher than in 2011 (by 15 and 16 points, respectively).
Table 7.1: Scale scores (SE) on science content domains, Ireland and comparison countries – Fourth grade
Overall Life Science Physical Science Earth ScienceSingapore 595 603 (3.6) 613 (3.7) 557 (3.9)Korea, Rep. of 588 574 (2.5) 607 (2.7) 587 (2.9)Japan 562 550 (2.0) 579 (1.9) 559 (1.9)Chinese Taipei 558 540 (2.0) 573 (1.9) 568 (1.8)
Finland 555 558 (2.9) 544 (3.2) 563 (3.5)United States 539 546 (2.5) 527 (2.8) 539 (3.2)England 537 537 (2.6) 537 (3.2) 533 (2.9)Australia 533 539 (2.8) 526 (2.7) 527 (2.8)Ireland 528 528 (3.5) 523 (3.2) 536 (3.8)Northern Ireland 518 520 (2.8) 511 (2.2) 525 (2.6)New Zealand 503 510 (2.3) 492 (2.1) 503 (3.1)
Light shading indicates that the subscale score is significantly lower than the country’s overall science scale score. Dark shading indicates that the subscale score is significantly higher than the country’s overall science scale score.
There were no significant gender differences in Ireland on either Life Science or Physical Science (Table 7.2). However, boys significantly outperformed girls on items assessing Earth Science. This pattern was also seen in the United States. In Singapore and the Republic of Korea, boys outperformed girls on Earth Science and Physical Science. In Life Science, girls achieved a higher score than boys in four countries (Japan, Finland, Australia, and New Zealand).

Chapter 7: Performance in content and cognitive domains: Science
TIMSS 2019 Ireland’s results in mathematics and science50
Table 7.2: Mean scores of girls and boys on science content domains, Ireland and comparison countries – Fourth grade
Life Science Physical Science Earth Science
Girls Boys Girls Boys Girls BoysSingapore 601 605 607 619 548 565Korea, Rep. of 572 576 600 613 579 594Japan 554 547 580 577 558 560 Chinese Taipei 542 539 570 576 565 571
Finland 565 552 544 544 564 562
United States 547 546 523 531 533 543England 540 535 534 540 532 534Australia 543 535 524 528 524 530 Ireland 530 526 520 526 529 543Northern Ireland 523 517 510 512 521 548New Zealand 516 504 493 492 501 505
Shading indicates that the subscale score is significantly higher than for the other gender on that subscale. Standard errors for the data in this table can be found in Table C5 in Appendix C.
Fourth Class – cognitive domains
On the cognitive domains for science, Fourth Class pupils displayed a relative strength in Knowing (+4 points) (Table 7.3). Pupils were able to Apply knowledge and Reason at a level on par with the overall national science score. This is a slight change from TIMSS 2015, when no relative strengths or weaknesses were observed in Ireland.
Internationally, five countries (Croatia, Germany, Malta, Portugal, and Montenegro) showed no relative strengths or weaknesses. Among our comparison countries, Knowing was a relative strength for four and a relative weakness for two. Reasoning was an area of relative strength in five countries and an area of relative weakness in two. In contrast, Applying was a relative weakness for six countries, including Northern Ireland, and a strength for three.
Ireland’s performance on each of the science cognitive domains has not changed significantly since 2015, but is significantly higher on Knowing (+14 points) and Reasoning (+16 points) in 2019 compared to 2011.

Chapter 7: Performance in content and cognitive domains: Science
51TIMSS 2019 Ireland’s results in mathematics and science
Table 7.3: Scale scores (SE) on science cognitive domains, Ireland and comparison countries – Fourth grade
Overall Knowing Applying ReasoningSingapore 595 588 (3.7) 595 (3.7) 604 (3.5)Korea, Rep. of 588 584 (2.5) 596 (2.6) 581 (2.4)Japan 562 535 (2.6) 576 (2.2) 580 (2.4)
Chinese Taipei 558 560 (1.9) 561 (2.0) 552 (2.7)
Finland 555 553 (2.5) 551 (2.5) 563 (2.4)United States 539 542 (2.7) 535 (3.1) 538 (2.7)England 537 544 (3.3) 526 (3.0) 544 (3.7)Australia 533 538 (3.0) 524 (3.2) 538 (3.0)Ireland 528 532 (3.4) 525 (3.0) 525 (3.8)Northern Ireland 518 523 (2.9) 514 (2.3) 519 (3.2)New Zealand 503 505 (2.7) 497 (2.6) 505 (2.6)
Light shading indicates that the subscale score is significantly lower than the country’s overall science scale score. Dark shading indicates that the subscale score is significantly higher than the country’s overall science scale score.
No gender differences were found in Ireland on any of the science cognitive domains (Table 7.4). Boys and girls in Fourth Class performed at a similar level regardless of the cognitive process being tested.
Ireland was the only one of the countries selected in Table 7.4 where no gender differences were found; in most countries, one domain showed a difference. Boys outperformed girls in Knowing in four countries (Singapore, the Republic of Korea, Chinese Taipei, and the United States). Boys outperformed girls in Applying in Singapore, while girls outperformed boys on the same process in Japan. Finally, girls performed relatively better than boys on Reasoning in five countries (Finland, England, Australia, Northern Ireland, and New Zealand).
Table 7.4: Mean scores of girls and boys on science cognitive domains, Ireland and comparison countries – Fourth grade
Knowing Applying Reasoning
Girls Boys Girls Boys Girls BoysSingapore 580 595 591 599 605 603Korea, Rep. of 573 595 594 598 580 583Japan 533 537 581 572 585 574Chinese Taipei 556 565 559 562 556 548
Finland 553 553 554 548 568 557
United States 537 547 534 536 538 539England 542 545 526 525 548 539Australia 535 540 526 521 541 534Ireland 528 535 524 527 527 524Northern Ireland 521 525 514 514 525 514 New Zealand 504 505 500 495 512 498
Shading indicates that the subscale score is significantly higher than for the other gender on that subscale. Standard errors for the data in this table can be found in Table C6 in Appendix C.

Chapter 7: Performance in content and cognitive domains: Science
TIMSS 2019 Ireland’s results in mathematics and science52
Second Year – content domains
Second Year students in Ireland displayed a relative strength in the Earth Science content domain (+13 points) and relative weaknesses on the Chemistry (-11 points) and Physics (-4 points) content domains (Table 7.5). Performance on the Biology content domain was similar to students’ overall science performance. Chemistry was an area of relative weakness for many of our comparison countries, while most displayed a relative strength in the Earth Science content domain. Students in Singapore demonstrated a relative strength in Biology, Chemistry and Physics but a relative weakness in Earth Science.
The average score of students in Ireland on the Biology content domain has decreased significantly, by 13 points, since 2015, while performance on the other content domains has not changed significantly.
Table 7.5: Scale scores (SE) on science content domains, Ireland and comparison countries – Eighth grade
Overall Biology Chemistry Physics Earth ScienceSingapore 608 622 (4.2) 616 (5.0) 619 (4.1) 562 (4.1)Chinese Taipei 574 576 (2.2) 594 (2.4) 555 (2.7) 579 (2.5)Japan 570 574 (2.3) 560 (2.7) 570 (2.5) 572 (3.2)Korea, Rep. of 561 560 (2.2) 551 (2.5) 569 (2.7) 562 (3.2)
Finland 543 534 (3.3) 545 (3.8) 539 (3.9) 558 (3.5)Australia 528 531 (3.3) 515 (3.8) 529 (3.6) 533 (3.3)Ireland 523 521 (3.2) 512 (3.9) 519 (3.8) 536 (3.8)United States 522 530 (4.8) 509 (5.2) 515 (5.0) 530 (5.1)England 517 516 (5.2) 512 (6.0) 516 (5.1) 517 (5.5)New Zealand 499 498 (3.7) 482 (3.8) 502 (3.8) 510 (3.7)
Light shading indicates that the subscale score is significantly lower than the country’s overall science scale score. Dark shading indicates that the subscale score is significantly higher than the country’s overall science scale score.
Table 7.6 presents the mean scores of girls and boys on each of the science content domains, for Ireland and comparison countries. No significant differences were observed between boys and girls in Ireland on the Biology, Physics or Earth Science content domains, but girls significantly outperformed boys in Chemistry. Among our comparison countries, where differences between boys and girls exist, they favour boys in Physics and Earth Science, and girls in Chemistry. In Biology, boys significantly outperformed girls in Japan and the Republic of Korea, while girls had significantly higher mean scores than boys in Finland and the United States.

Chapter 7: Performance in content and cognitive domains: Science
53TIMSS 2019 Ireland’s results in mathematics and science
Table 7.6: Mean scores of girls and boys on science content domains, Ireland and comparison countries – Eighth grade
Biology Chemistry Physics Earth Science
Girls Boys Girls Boys Girls Boys Girls BoysSingapore 621 623 617 614 614 624 551 572Chinese Taipei 577 575 598 591 550 560 572 586Japan 571 577 560 560 563 578 563 581Korea, Rep. of 554 565 553 549 563 575 549 574
Finland 549 520 561 530 542 537 562 555
Australia 533 529 519 510 524 533 531 536Ireland 523 520 525 500 517 520 536 536United States 536 524 515 503 514 515 527 532England 518 513 521 502 517 515 513 523New Zealand 500 496 483 481 496 507 502 517
Shading indicates that the subscale score is significantly higher than for the other gender on that subscale. Standard errors for the data in this table can be found in Table C7 in Appendix C.
Second Year – cognitive domains
The mean scores of students in Ireland, and of those in our comparison countries, on the science cognitive domains are presented in Table 7.7. The performance of students in Ireland on the Applying cognitive domain is in line with their overall science performance, while they demonstrated a relative weakness on the Knowing cognitive domain and a relative strength on the Reasoning domain. Many of our comparison countries (the Republic of Korea, Finland, Australia, the United States and New Zealand) also showed relative strengths in the Reasoning cognitive domain, while four countries (Japan, Australia, the United States and New Zealand) also demonstrated relative weaknesses on the Knowing domain.
Since 2015, Ireland’s average performance has decreased significantly on the Knowing (-10 points) and Applying (-12 points) cognitive domains, while performance on the Reasoning cognitive domain has remained stable.

Chapter 7: Performance in content and cognitive domains: Science
TIMSS 2019 Ireland’s results in mathematics and science54
Table 7.7: Scale scores (SE) on science cognitive domains, Ireland and comparison countries –Eighth grade
Overall Knowing Applying ReasoningSingapore 608 621 (4.2) 608 (4.1) 595 (4.0)Chinese Taipei 574 600 (2.4) 567 (2.1) 559 (2.1)Japan 570 563 (2.4) 576 (2.3) 570 (2.5)
Korea, Rep. of 561 558 (2.6) 560 (2.4) 564 (2.3)
Finland 543 545 (3.2) 537 (3.3) 548 (3.4)Australia 528 515 (3.5) 532 (3.4) 536 (3.1)Ireland 523 513 (3.0) 521 (3.4) 534 (3.4)United States 522 515 (4.6) 523 (4.8) 528 (4.7)England 517 520 (5.0) 515 (5.1) 513 (5.0)New Zealand 499 480 (3.6) 503 (3.8) 510 (3.5)
Light shading indicates that the subscale score is significantly lower than the country’s overall science scale score. Dark shading indicates that the subscale score is significantly higher than the country’s overall science scale score.
Boys and girls in Ireland did not differ significantly from each other in terms of their performance on the science cognitive domains (Table 7.8). Similar patterns were also observed in Singapore, Australia, the United States, England and New Zealand. In Finland, girls significantly outperformed boys on each of the cognitive domains. Boys significantly outperformed girls on the Knowing domain in Chinese Taipei, while in the Republic of Korea and Japan boys had significantly higher mean scores than girls on the Knowing and Applying domains.
Table 7.8: Mean scores of girls and boys on science cognitive domains, Ireland and comparison countries – Eighth grade
Knowing Applying Reasoning
Girls Boys Girls Boys Girls BoysSingapore 617 624 604 613 591 598Korea, Rep. of 592 608 567 567 560 558Japan 555 572 571 581 569 571Chinese Taipei 549 567 554 566 562 566
Finland 553 537 547 527 559 537
Australia 511 518 534 530 538 533Ireland 512 514 525 518 538 531United States 515 514 525 521 530 526England 519 521 517 512 516 510New Zealand 475 484 500 505 510 509
Shading indicates that the subscale score is significantly higher than for the other gender on that subscale. Standard errors for the data in this table can be found in Table C8 in Appendix C.

Chapter 8: Curriculum coverage in TIMSS
55TIMSS 2019 Ireland’s results in mathematics and science
Chapter 8: Curriculum coverage in TIMSSThe TIMSS assessments are designed to ensure the widest possible coverage of mathematics and science curricula in each participating country. Given the variation in these curricular areas across countries, it is inevitable that the assessments will not be able to reflect the relevant curriculum in each participating country perfectly. For this reason, a Test-Curriculum Matching Analysis (TCMA) is included as part of the study. This analysis gives an indication of the extent to which the TIMSS assessments match the national curricula of participating countries. It also provides an opportunity to compare a country’s performance on all items (i.e., their mean scores presented in Chapter 3) to what their performance would be if students had only been presented with items that were included on their curriculum. It is also possible to examine how other countries would have performed on a particular subset of items (i.e., what would Singapore’s performance be if these students had only been presented with the items on the Irish curriculum). In addition, students’ teachers were asked to indicate which topics they had covered in their mathematics or science lessons by the time of the TIMSS assessment.23
This chapter presents the results of the TCMA for each domain at Fourth and Eighth grade, followed by teachers’ report of TIMSS topic coverage.
The Test-Curriculum Matching Analysis in Ireland
The TCMA in Ireland was conducted by subject experts at primary and post-primary level, who provided judgements (i.e., yes or no) as to whether the topic of each item in the TIMSS assessments was likely to have been covered in the lessons of most students in the relevant grade level. At primary level, the mathematics and science curricula for Third and Fourth Classes were used as a reference point. As the Junior Cycle curriculum covers First to Third Years at post-primary level, there is no specific Second Year curriculum that subject experts could draw on. Instead, subject experts provided their professional opinion as to whether or not the topics in the TIMSS Eighth grade assessment would have been covered by most students in Ireland by the end of Second Year.
Some of the items included in the Earth Science content area are not covered in the science curriculum in Ireland but are instead covered in geography. For this reason, curriculum experts were also asked to classify the Fourth and Eighth grade Earth Science items based on whether or not most students would be familiar with the content, whether taught through the science or geography curriculum.
Fourth grade items – mathematics and scienceThe outcomes of the TCMA for Fourth Class mathematics – showing subject experts’ judgement of which items on the TIMSS assessment could be expected to be familiar to a Fourth Class pupil – are shown in Table 8.1. There was judged to be a high degree of overlap between the TIMSS assessment and the mathematics curriculum in Ireland, with all but a handful of items considered to be included
23 ItmaybeworthnotingthattheapproachtocurriculumunderpinningTIMSSisdifferenttothatusedinPISA,anotherlarge-scale internationalassessment.InPISA,studentsaged15(acrossseveralgradelevelsinbothjuniorandseniorcycle)completean assessmentthatisnotdirectlylinkedtonationalcurricula.WhereasTIMSSaimstoassesshowwellstudentscandemonstratethe skillsandknowledgeexpectedofthembasedonthecurricularelevanttotheirstageofeducation(FourthgradeorEighthgrade) (https://timssandpirls.bc.edu/timss2019),PISAaimstoassessstudents’abilitytoapplyknowledgeinspecified‘reallife’scenarios (https://www.oecd.org/pisa/aboutpisa.htm).ArecentpaperintheIEA’sCompass Briefs in Educationseries,publishedinSeptember 2020,offersausefuldiscussionofthesimilaritiesanddifferencesbetweenTIMSS,PISA,andotherlarge-scaleassessments: https://www.iea.nl/publications/series-journals/iea-compass-briefs-education-series/september-2020-international-large

Chapter 8: Curriculum coverage in TIMSS
TIMSS 2019 Ireland’s results in mathematics and science56
in the curriculum. Overlap ranged from 96% (Measurement & Geometry24) to 100% (Number25) across the three content domains26, with an overall coverage of 98%. The handful of items that were judged to be excluded came from the following topics: Geometry (Measurement & Geometry) and Using Data to Solve Problems (Data).
Table 8.1: TCMA overall and by content domain – Fourth grade mathematics items
Number of items
Number of items included in curriculum
% included in curriculum
Number 84 84 100
Measurement & Geometry 51 49 96
Data 38 37 97
Overall 173 170 98
There was also quite a high overlap for science, albeit somewhat lower than for mathematics (Table 8.2). Just over four-fifths (81%) of science items were judged to be covered by the Irish curriculum. Physical Science27 (94%) had the most overlap, followed by Life Science28 (81%). Most of the items that were excluded came from the Classification and Properties of Matter and Changes in Matter (Physical Science) and Human Health and Characteristics and Life Processes of Organisms (Life Science) topic areas.
The inclusion rate for Earth Science was substantially lower, with 57% of Earth Science29 items considered to be covered by the Irish curriculum. Items that addressed topics on the Irish geography curriculum were included if they were expected to be familiar to a Fourth Class pupil. In most cases, items were excluded on the basis that they would not be expected to be covered until Fifth or Sixth Class. Most of the Earth Science items judged to be excluded were in the topic areas Earth in the Solar System and Earth’s Physical Characteristics, Resources, and History.
Table 8.2: TCMA overall and by content domain – Fourth grade science items
Number of items
Number of items included in curriculum
% included in curriculum
Life Science 75 61 81
Physical Science 62 58 94
Earth Science 35 20 57
Overall 172 139 81
24 Measurement&Geometrycoveredtwotopicareas:Geometry;andMeasurement.
25 Numbercoveredthreetopicareas:WholeNumbers;FractionsandDecimals;andExpressions,SimpleEquations,andRelationships.
26 Datacoveredtwotopics:Reading,Interpreting,andRepresenting;andUsingDatatoSolveProblems.
27 PhysicalSciencecoveredthreetopics:ClassificationandPropertiesofMatterandChangesinMatter;ForcesandMotion;andForms ofEnergyandEnergyTransfer.
28 LifeSciencecoveredfivetopicareas:LifeCycles,Reproduction,andHeredity;HumanHealth;Organisms,Environment,andtheir Interactions;CharacteristicsandLifeProcessesofOrganisms;andEcosystems.
29 EarthSciencecoveredthreetopics:Earth’sPhysicalCharacteristics,Resources,andHistory;EarthintheSolarSystem;Earth’s WeatherandClimate.

Chapter 8: Curriculum coverage in TIMSS
57TIMSS 2019 Ireland’s results in mathematics and science
Eighth grade items – mathematics and science
Table 8.3 presents the results of the TCMA for Eighth grade mathematics in Ireland. Overall, about 97% of mathematics items on the TIMSS tests were considered to be taught to most students by the end of Second Year. All of the Number30 and Data and Probability31 items in the TIMSS tests were identified as being covered by most students by the end of Second Year, while this was the case for 93% of Geometry32 items and 95% of Algebra33 items in the TIMSS tests. The small number of Algebra items not considered to have been taught by the end of Second Year were in the Expressions, Operations and Equations topic.
Table 8.3: TCMA overall and by content domain – Eighth grade mathematics items
Number of items
Number of items included in curriculum
% included in curriculum
Number 64 64 100
Algebra 62 59 95
Geometry 43 40 93
Data & Probability 42 42 100
Overall 211 205 97
On other hand, for science, 69% of all items in the TIMSS tests were classified as being covered by most students by the end of Second Year. Chemistry34 (82%) was the content domain with the highest percentage of items judged to be covered by most students by the Second Year. Of the Chemistry items that were not considered to be covered by the end of Second Year, most of these were in the area of Properties of Matter. About 80% of Earth Science items were judged to be taught by the end of Second Year and those that were not covered were spread across the four topic areas.35 Just 60% of the items in the Physics content domain were considered to be have been taught to most students by the end of Second Year, while 64% of items in the Biology content domain were classified in this way. The Physics36 items that were not considered to be taught to most students by the end of Second Year mostly covered the topics of Electricity and Magnetism and Light and Sound. For Biology, 37 the items not covered were spread across five of the six topic areas assessed.
30 ThreetopicareaswerecoveredinNumber:FractionsandDecimals;Integers;Ratio,ProportionandPercent.
31 DataandProbabilitywerecoveredasseparatetopicsintheData&Probabilitycontentdomain.
32 TheGeometrycontentdomainwasnotdividedintosubtopics,i.e.,allitemsinthisdomainwereclassifiedasGeometryitems.33 ThetwotopicsinAlgebrawere:Expressions,OperationsandEquations;andRelationshipsandFunctions.34 ThreetopicswereassessedinChemistry:ChemicalChange;CompositionofMatter;andPropertiesofMatter.
35 FourtopicswereassessedinEarthScience:EarthintheSolarSystemandtheUniverse;Earth’sProcesses,CyclesandHistory; Earth’sResources,TheirUseandConservation;andEarth’sStructureandPhysicalFeatures.
36 FivetopicareaswereassessedinPhysics:ElectricityandMagnetism;LightandSound;EnergyTransformationandTransfer;Motions andForces;PhysicalStatesandChangesinMatter.
37 ThesixtopicareasforBiologywere:CellsandTheirFunctions;CharacteristicsandLifeProcessesofOrganisms;Diversity,Adaption andNaturalSelection;Ecosystems,HumanHealth;andLifeCycles,ReproductionandHeredity.AllitemsinHumanHealthwere judgedtobetaughtbytheendofSecondYear.

Chapter 8: Curriculum coverage in TIMSS
TIMSS 2019 Ireland’s results in mathematics and science58
Table 8.4: TCMA overall and by content domain – Eighth grade science items
Number of items
Number of items included in curriculum
% included in curriculum
Biology 77 49 64
Chemistry 44 36 82
Physics 52 31 60
Earth Science 43 34 79
Overall 216 150 69
Comparing performance according to the Test-Curriculum Matching Analysis
The next set of tables address a hypothetical scenario: “what score would have been achieved if Irish students had only been asked to answer items that are covered by the Irish curriculum?” The same scenario can be constructed for every other country that took part in TIMSS. Table 8.5 to Table 8.8 show the results of this exercise for Ireland and our comparison countries.
In each table, the first column shows the mean score achieved by each country on the full assessment. Each subsequent column presents the mean score achieved by each other comparison country based on the TCMA judgements of one country – for example, looking at the ‘Singapore’ column in Table 8.5, students in Chinese Taipei would have achieved a score of 601 if the TIMSS assessment had consisted only of items included in Singapore’s TCMA (i.e., judged to have been taught to most students in Singapore by the end of Fourth grade), and Japanese students would have scored 591 on Singapore’s TCMA. Conversely, each row presents the score achieved by one country based on the TCMA judgments of every other country – for example in Table 8.5, Singapore would have achieved a score of 626 based on the TCMA judgement of Chinese Taipei, and 624 on Japan’s TCMA. The diagonal (bolded) cells show each country’s hypothetical score according to their own TCMA.
The shaded row for Ireland shows the mean score that would have been achieved by Irish students, counting only the items on each country’s TCMA. The shaded column shows the mean score of the other countries in relation to the items on Ireland’s curriculum.
The bottom two rows show, firstly, the average of all TIMSS countries per each individual country’s TCMA; and secondly, the number of items and score points that each country judged to be included in their own TCMA.38
Fourth grade – mathematics and scienceTable 8.5 shows the results of this analysis for Fourth grade mathematics. As shown, the score of Fourth Class pupils varies very little regardless of which country’s curriculum is used as the reference point (ranging from 544 to 550 across our comparison countries). If only the Fourth Class curriculum had been used as the basis of the TIMSS assessment, pupils in Ireland would have been expected to achieve a score of 549, very close to the actual achieved score (548). A similar pattern was seen internationally, with most countries’ scores fluctuating within a narrow range depending on which curriculum is used as the reference point.
38 Thenumberofscorepointsishigherthanthenumberofitemsbecausesomeitemsareworth2points(fullcredit)or1point(partial credit).

Chapter 8: Curriculum coverage in TIMSS
59TIMSS 2019 Ireland’s results in mathematics and science
Among our comparison countries, Australia judged substantially fewer mathematics items to be covered by their curriculum than most other countries, although variation is evident throughout.
Table 8.5: Average scale scores on all items versus items in the curriculum, Ireland and comparison countries – Fourth grade mathematics
CountryAv
erag
e sc
ale
scor
e on
all
item
s
Sing
apor
e
Kore
a, R
ep. o
f
Chi
nese
Tai
pei
Japa
n
Nor
ther
n Ire
land
Engl
and
Irela
nd
Uni
ted
Stat
es
Finl
and
Aust
ralia
New
Zea
land
Singapore 625 629 625 626 624 626 625 627 625 625 624 622
Korea, Rep. of 600 599 606 598 604 600 599 600 599 601 601 599
Chinese Taipei 599 601 601 601 604 600 600 600 599 601 592 596
Japan 593 591 598 591 601 593 594 593 592 596 590 590
Northern Ireland 566 569 566 567 564 566 566 566 566 565 567 567
England 556 559 556 556 553 557 556 556 556 555 552 557
Ireland 548 550 548 549 547 549 549 549 549 548 544 547
United States 535 536 534 536 534 535 534 535 535 535 530 534
Finland 532 529 530 530 529 532 531 532 531 532 533 532
Australia 516 514 514 514 512 516 515 516 516 516 521 518
New Zealand 487 485 485 485 483 487 487 487 487 488 489 489
TIMSS average 523 524 524 523 523 523 523 523 523 523 524 523
Number of items (score points) included in curriculum *
171 (183)
137 (146)
132 (142)
144 (154)
127 (135)
164 (176)
161 (173)
166 (177)
164 (176)
163 (175)
59 (65)
119 (127)
InternationaldatafromMullis,Martin,Foy,KellyandFishbein(2020). *ThenumberofitemsandscorepointsarebasedonthenumberofitemsincludedinscalingtheFourthgrademathematicsachievementdata.SeeMartinetal.(2020)forinformationaboutitemsdeletedorrecodedforscaling.
Table 8.6 shows the equivalent exercise for Fourth grade science. Using only the items judged by experts to be covered by the Irish science curriculum, Irish students would have been expected to achieve a score of 527, which is very close to the actual score (528). Relative to our comparison countries, the expected score of pupils in Ireland ranged from 516 (a low outlier in Japan) to 529 (Finland), with most estimates lying from 524-529.
Several countries, including the high-performing East Asian countries, judged relatively few science items to be covered by their Fourth grade curricula. In Singapore, the Republic of Korea, Japan, and Chinese Taipei, the hypothetical scores based only on their own curricula were substantially higher than their achieved score. However, for most countries, the TCMA shows only minimal differences between a country’s hypothetical and actual scores.

Chapter 8: Curriculum coverage in TIMSS
TIMSS 2019 Ireland’s results in mathematics and science60
Table 8.6: Average scale scores on all items versus items in the curriculum, Ireland and comparison countries – Fourth grade science
Country
Aver
age
scal
e sc
ore
on a
ll ite
ms
Sing
apor
e
Kore
a, R
ep. o
f
Japa
n
Chi
nese
Tai
pei
Finl
and
Uni
ted
Stat
es
Engl
and
Aust
ralia
Irela
nd
Nor
ther
n Ire
land
New
Zea
land
Singapore 595 675 601 619 608 591 598 595 608 596 596 600
Korea, Rep. of 588 577 604 595 599 578 588 588 581 586 581 586
Japan 562 578 578 592 578 556 562 562 567 561 558 564
Chinese Taipei 558 547 558 571 582 551 559 558 557 558 560 556
Finland 555 540 549 538 549 555 555 555 553 554 554 552
United States 539 527 534 529 534 538 541 539 540 537 541 539
England 537 535 534 532 536 538 537 537 538 537 539 535
Australia 533 532 527 522 534 535 533 533 533 533 535 533
Ireland 528 524 528 516 526 529 528 528 526 527 528 527
Northern Ireland 518 512 513 501 509 520 519 518 516 518 521 517
New Zealand 503 494 498 491 501 505 503 503 500 501 504 502
TIMSS average 491 492 490 490 490 490 491 491 492 491 491 490
Number of items (score points) included in curriculum *
169 (174)
42 (43)
64 (65)
46 (46)
64 (64)
97 (99)
144 (149)
169 (174)
91 (92)
136 (139)
135 (139)
105 (109)
InternationaldatafromMullis,Martin,Foy,KellyandFishbein(2020). *ThenumberofitemsandscorepointsarebasedonthenumberofitemsincludedinscalingtheFourthgradescienceachievementdata.SeeMartinetal.(2020)forinformationaboutitemsdeletedorrecodedforscaling.
Eighth grade – mathematics and science
Table 8.7 presents the mathematics performance of Ireland and each of our comparison countries, along with the TIMSS overall average, according to the TCMA. In total, there were 206 mathematics items included in the scaling of the Eighth grade mathematics achievement data. The number of these items judged to be covered by the Eighth grade mathematics curricula of our comparison countries ranged from 177 items in Japan and New Zealand to 206 (i.e., all TIMSS mathematics items) in the United States. Ireland’s mean mathematics score was 524 when performance was examined using just the subset of items that were considered to be taught to the majority of students by the end of Second Year, which is the same as Ireland’s performance on the complete set of TIMSS Eighth grade mathematics items (524). All of our comparison countries, with the exceptions of the United States, England and Finland, saw very small increases in their hypothetical scores (of between one and five points) when using the subset of items for their country.

Chapter 8: Curriculum coverage in TIMSS
61TIMSS 2019 Ireland’s results in mathematics and science
There was also little variation in Ireland’s mean mathematics score when using the subsets of items identified as being covered by the end of Eighth grade in each of our comparison countries. Ireland’s mathematics performance ranged from 523 on the subset of items for Chinese Taipei to 526 on the subsets of items selected for the Republic of Korea, Japan and New Zealand. There was also little difference (in the region of one to two points) between the mean scores of our comparison countries on the complete set of TIMSS science items compared to their mean science scores when using the subset of items identified as being taught by the end of Second Year in Ireland.
Table 8.7: Average scale scores on all items versus items in the curriculum, Ireland and comparison countries – Eighth grade mathematics
Country
Aver
age
scal
e sc
ore
on a
ll ite
ms
Sing
apor
e
Chi
nese
Tai
pei
Kore
a, R
ep. o
f
Japa
n
Irela
nd
Aust
ralia
Uni
ted
Stat
es
Engl
and
Finl
and
New
Zea
land
Singapore 616 617 616 615 615 616 616 616 616 616 613
Chinese Taipei 612 613 617 613 611 613 612 612 612 612 611
Korea, Rep. of 607 608 606 610 607 605 605 607 606 607 603
Japan 594 593 593 595 599 595 594 594 593 593 592
Ireland 524 524 523 526 526 524 525 524 524 524 526
Australia 517 516 515 517 519 518 518 517 518 518 520
United States 515 515 514 515 515 515 515 515 515 516 514
England 515 514 512 515 518 516 516 515 515 515 517
Finland 509 509 509 510 511 509 509 509 509 509 510
New Zealand 482 480 480 481 484 482 482 482 481 482 484
TIMSS average 489 489 489 489 489 489 489 489 489 489 488
Number of items (score points) included in curriculum *
206 (217)
198 (209)
185 (195)
185 (194)
177 (186)
200 (211)
188 (198)
206 (217)
202 (213)
198 (209)
177 (187)
AdaptedfromMullis,Martin,Foy,KellyandFishbein(2020).*ThenumberofitemsandscorepointsarebasedonthenumberofitemsincludedinscalingtheEighthgrademathematicsachievementdata.SeeMartinetal.(2020)forinformationaboutitemsdeletedorrecodedforscaling.
Altogether, 211 items were included in the scaling of the Eighth grade science achievement data (Table 8.8). The number of these items included in the TCMA of our comparison countries ranged from 95 items in Japan (i.e., less than half of all TIMSS science items) to 198 items in Finland. Using the subset of science items that were considered to be taught to most students by the end of Second Year, Ireland’s mean science score was 526, slightly above the mean score for Ireland when using all Eighth grade TIMSS science items (523). With the exception of Finland, all of our comparison countries saw increases in their mean scores when performance was examined using the subset of items for their country, from about one point in England and the Republic of Korea to about 14 points in Japan.

Chapter 8: Curriculum coverage in TIMSS
TIMSS 2019 Ireland’s results in mathematics and science62
There was little variation (in the region of one to four points) between the mean scores of our comparison countries on the complete set of TIMSS science items and their mean scores when their performance was examined on the subset of items for Ireland. Further, when Ireland’s performance was examined using the subsets of items identified as being covered by the end of Eighth grade in each of our comparison countries, the hypothetical mean science score of Second Year students ranged from 517 (for the items selected for Singapore and Japan) to 524 (for the subset of items selected for Finland).
Table 8.8: Average scale scores on all items versus items in the curriculum, Ireland and comparison countries – Eighth grade science
Country
Aver
age
scal
e sc
ore
on a
ll ite
ms
Sing
apor
e
Chi
nese
Tai
pei
Japa
n
Kore
a, R
ep. o
f
Finl
and
Aust
ralia
Irela
nd
Uni
ted
Stat
es
Engl
and
New
Zea
land
Singapore 608 621 612 614 613 607 611 607 605 609 608
Chinese Taipei 574 571 578 574 575 572 569 572 571 574 571
Japan 570 568 570 584 571 568 569 571 571 569 566
Korea, Rep. of 561 557 558 558 562 560 562 561 562 560 559
Finland 543 538 542 538 542 543 539 542 542 541 543
Australia 528 524 527 524 526 530 533 527 530 528 529
Ireland 523 517 522 517 523 524 523 526 523 523 523
United States 522 518 522 516 520 524 525 518 524 522 522
England 517 514 517 515 516 517 515 518 517 518 516
New Zealand 499 494 497 489 498 502 500 497 500 499 501
TIMSS average 490 490 490 490 491 490 490 489 490 490 490
Number of items (score points) included in curriculum *
211 (233)
138 (154)
174 (195)
95 (109)
159 (177)
198 (216)
157 (175)
148 (163)
186 (206)
194 (215)
171 (189)
AdaptedfromMullis,Martin,Foy,KellyandFishbein(2020).*ThenumberofitemsandscorepointsarebasedonthenumberofitemsincludedinscalingtheEighthgradescienceachievementdata.SeeMartinetal.(2020)forinformationaboutitemsdeletedorrecodedforscaling.
Teacher reports of TIMSS topic coverage
The overlap between the TIMSS assessment frameworks and the Irish curricula in the first section of this chapter (Table 8.1 to Table 8.4) present the findings in terms of the main content domains (e.g., Number, Data, Life Science, Physical Science). Each of these content domains is composed of a number of more specific topics, which teachers were asked to consider and report whether each topic had been taught to their students mostly before this year, mostly this year, or not yet taught or just introduced. These teacher reports can therefore give another perspective on the extent to which students in Ireland might be expected to have been familiar with the topics covered by the TIMSS assessment.

Chapter 8: Curriculum coverage in TIMSS
63TIMSS 2019 Ireland’s results in mathematics and science
Table 8.9 to Table 8.12 summarise teachers’ reports of topic coverage in Ireland and at the TIMSS average, for each of the main content domains. A complete presentation of teachers’ reports of the extent to which specific mathematics topics (e.g., finding and estimating perimeter, area and volume) and science topics (e.g., human health: transmission and prevention of diseases, everyday behaviours that promote good health) had been taught at each grade level is provided in Appendix D.
Fourth grade – mathematics and scienceIn Ireland, teachers reported a higher level of coverage of the Fourth grade mathematics topics (88%) than was reported on average across TIMSS countries (80%) (Table 8.9). This was especially noticeable for Data topics, where coverage in Ireland was reported at 92% compared to 78% internationally – albeit with the caveat that the Data domain comprised fewer topics (three) than either Number (seven) or Measurement & Geometry (seven). Number was the most-covered domain, both in Ireland and internationally.
Table 8.9: Percentages of pupils taught the TIMSS mathematics topics – Fourth grade
All mathematics(17 topics)
% (SE)
Number(7 topics)
% (SE)
Measurement & Geometry
(7 topics)% (SE)
Data(3 topics)
% (SE)Ireland 88 (0.8) 94 (0.9) 81 (1.4) 92 (1.9)TIMSS 80 (0.1) 86 (0.1) 76 (0.2) 78 (0.3)Percentagesofpupilsmostlytaughtbeforeorintheassessmentyear,averagedacrosstopics. SeeAppendixDformoredetailonindividualtopics.InternationaldatafromMullis,Martin,Foy,KellyandFishbein(2020).
Coverage of the science topics was lower than for mathematics, both in Ireland (71%) and internationally (62%) (Table 8.10).39 Physical Science topics were reported to receive somewhat less coverage by Fourth grade than topics in Life Science or Earth Science, both in Ireland and at the TIMSS average.
Table 8.10: Percentages of pupils taught the TIMSS science topics – Fourth grade
All science(26 topics)
% (SE)
Life Science(7 topics)
% (SE)
Physical Science(12 topics)
% (SE)
Earth Science(7 topics)
% (SE)Ireland 71 (1.3) 76 (1.6) 68 (1.6) 72 (1.5)TIMSS 62 (0.2) 73 (0.2) 58 (0.2) 60 (0.3)Percentagesofpupilsmostlytaughtbeforeorintheassessmentyear,averagedacrosstopics.SeeAppendixDformoredetailonindividualtopics.InternationaldatafromMullis,Martin,Foy,KellyandFishbein(2020).
39 Therewerefivesciencetopicswhichtheteachersofatleast50%ofFourthClasspupilsreportedashavingbeennotyettaughtorjust introducedbytheendofFourthClass(AppendixD,TableD2):characteristicsofplantsandanimalsthatareinherited(LifeScience); mixtures,includingmethodsforseparatingamixtureintoitscomponentsandchemicalchangesineverydaylife(bothPhysical Science);andchangesinEarth’ssurfaceovertimeandfossilsandwhattheycantellusaboutpastconditionsonEarth(bothEarth Science).Incontrast,therewerenomathematicstopicstowhichatleast50%ofpupilshadnotyetbeenintroduced(TableD1).

Chapter 8: Curriculum coverage in TIMSS
TIMSS 2019 Ireland’s results in mathematics and science64
Second Year – mathematics and scienceTable 8.11 presents the percentages of Second Year students taught the TIMSS mathematics topics in Ireland as well as the average across all TIMSS countries, according to teachers’ reports. Overall, slightly fewer students in Ireland (68%) were taught the TIMSS mathematics topics compared to the TIMSS average (72%). However, there was considerable variation in the coverage of topics across the four mathematical content domains. Greater percentages of students in Ireland compared to the TIMSS average were taught the topics on the Data and Probability and Algebra domains. Almost all students in Ireland and on average across TIMSS countries had covered the topics on the Number domain. On the other hand, less than half of students in Ireland had been taught the Geometry topics, compared to a TIMSS average of 76% of students.40
Table 8.11: Percentages of students taught the TIMSS mathematics topics – Eighth grade
All mathematics
(22 topics)% (SE)
Number(3 topics)
% (SE)
Algebra(7 topics)
% (SE)
Geometry(6 topics)
% (SE)
Data & Probability(6 topics)
% (SE)Ireland 68 (1.1) 99 (0.3) 73 (1.3) 49 (2.3) 66 (2.2)TIMSS 72 (0.2) 98 (0.1) 68 (0.2) 76 (0.2) 60 (0.3)Percentagesofstudentsmostlytaughtbeforeorintheassessmentyear,averagedacrosstopics.SeeAppendixDformoredetailonindividualtopics.InternationaldatafromMullis,Martin,Foy,KellyandFishbein(2020).
Overall coverage of Eighth grade science items was lower in Ireland than on average across TIMSS countries (63% compared to 72%) (Table 8.12). However, as for mathematics, there was variation in coverage across the four content domains. The highest level of coverage in Ireland was in Chemistry with 77% of students having teachers who reported that these topics were taught by the end of Second Year, which is slightly higher than the TIMSS average (74%). Across the other three content domains, coverage of topics was lower in Ireland than on average across TIMSS countries. In particular, coverage of Physics topics was considerably lower in Ireland, with 48% of students’ teachers reporting that these topics were taught by the end of Second Year compared to a TIMSS average of 68%.41
Table 8.12: Percentages of students taught the TIMSS science topics – Eighth grade
All science(26 topics)
% (SE)
Biology(7 topics)
% (SE)
Chemistry(8 topics)
% (SE)
Physics(7 topics)
% (SE)
Earth Science(4 topics)
% (SE)Ireland 63 (0.8) 66 (1.2) 77 (1.1) 48 (1.4) 54 (2.5)TIMSS 72 (0.2) 74 (0.2) 74 (0.2) 68 (0.2) 71 (0.3)Percentagesofstudentsmostlytaughtbeforeorintheassessmentyear,averagedacrosstopics.SeeAppendixDformoredetailonindividualtopics.InternationaldatafromMullis,Martin,Foy,KellyandFishbein(2020).
40 Therewerefourmathematicstopicsthatteachersofatleast50%ofSecondYearstudentsreportedashavingbeennotyettaughtor justintroducedbytheendofSecondYear.ThreeofthesetopicswereinGeometry(translation,reflectionandrotation;congruent figuresandsimilartriangles;andsolvingproblemswith3Dshapes).Thefourthtopic(theoreticalandempiricalprobabilityofcompound events)wasintheDataandProbabilitydomain(seeAppendixD,TableD3).
41 Therewere10sciencetopicswhichteachersofatleast50%ofSecondYearstudentsreportedashavingbeennotyettaughtorjust introducedbytheendofSecondYear.TwoofthesewereinBiology(roleofvariationandadaptationinsurvival/extinction;and interdependenceofpopulationsoforganismsinecosystems);twowereinChemistry(matterandenergyinchemicalreactions;andthe roleofelectronsinchemicalbonds);fourwereinPhysics(properties/behavioursoflight;properties/behavioursofsound;electric circuits;andpropertiesandusesofpermanentmagnetsandelectromagnets);andtwowereinEarthScience(Earth’sstructureand physicalfeatures;Earth’sprocesses,cyclesandhistory).

Chapter 9: Summary
65TIMSS 2019 Ireland’s results in mathematics and science
Chapter 9: Summary This chapter provides a summary of the mathematics and science performance of students in Ireland in TIMSS 2019, which are described in full in the preceding chapters. An overview of an analysis of curriculum coverage in TIMSS is also presented, and details of further national reporting on TIMSS 2019 are provided.
Mathematics and science performance at Fourth Class
Fourth Class pupils achieved a mean score of 548 in mathematics and 528 in science. Seven countries for mathematics, and 12 countries for science, achieved significantly higher scores than Ireland. Conversely, 46 countries for mathematics, and 33 countries for science, achieved significantly lower scores than Ireland. Five countries (Singapore, the Republic of Korea, the Russian Federation, Japan, and Chinese Taipei) significantly outperformed Ireland in both domains. Hong Kong and Northern Ireland achieved significantly higher scores than Ireland for mathematics but similar (Hong Kong) or significantly lower (Northern Ireland) scores for science.
Of the 22 EU countries that participated at Fourth grade, no EU country had a higher mean mathematics score than Ireland, while four (Finland, Latvia, Lithuania and Sweden) significantly outperformed Ireland in science. Two EU countries (Latvia and Lithuania) had similar mathematics performance to Ireland and 19 achieved significantly lower mean mathematics scores than Ireland. For science, eight EU countries had similar mean scores as Ireland while nine performed at significantly lower levels.
Trends (1995-2011-2015-2019)There were no significant changes in Fourth Class pupils’ mean performance in either mathematics or science since 2015. In both domains, the mean score achieved in 2019 was within one scale point of the 2015 Fourth Class averages. Comparing further back, the mean scores achieved in 2019 were significantly higher than those observed in 2011 and in 1995, for both domains.
Differences between boys and girlsDifferences between boys and girls at Fourth Class were small and not statistically significant. In mathematics, boys achieved an average score of 552, while girls’ average score was 545. Since 2015, there has been a small increase in boys’ score (from 549 in 2015) and no change among girls (545 in 2015). Compared to 2011 (529 for boys and 526 for girls), substantial increases have been observed. In science, differences between boys (530) and girls (526) were also small and not statistically significant. Both scores were almost identical to those reported in 2015 (531 and 526, respectively) and higher than those reported in 2011 (516 for both boys and girls).
Mathematics and science performance at Second Year
Second Year students in Ireland achieved a mean score of 524 in mathematics and 523 in science. Six countries significantly outperformed Ireland in mathematics, and seven countries had significantly higher mean science scores than Ireland. Singapore, Chinese Taipei, the Republic of Korea, Japan and the Russian Federation significantly outperformed Ireland in both mathematics and science. In addition, Hong Kong achieved a significantly higher mean mathematics score (but not science) than Ireland, while Finland and Lithuania significantly outperformed Ireland in science (but not mathematics). Ireland’s mathematics performance did not differ significantly from the performance of six countries and 26 countries performed significantly lower than Ireland in mathematics. For science, eight countries had average scores that did not differ significantly from Ireland’s score, while Ireland significantly outperformed 23 countries in science.

Chapter 9: Summary
TIMSS 2019 Ireland’s results in mathematics and science66
Of the ten EU countries that participated at Eighth grade, none significantly outperformed Ireland in mathematics while two (Finland and Lithuania) achieved significantly higher mean scores in science. Two EU countries (Lithuania and Hungary) had similar mathematics performance to Ireland and seven achieved significantly lower mean mathematics scores than Ireland. For science, three EU countries (Hungary, Sweden and Portugal) had similar mean scores as Ireland while four (Italy, France, Cyprus and Romania) achieved significantly lower scores.
Trends (1995-2015-2019)Ireland’s mean mathematics performance has not changed significantly since 2015 or 1995. Although not statistically significant, Ireland’s mean score in science dropped by seven points since 2015. This means that, while Ireland’s mean science score increased significantly by 12 points between 1995 and 2015, Ireland’s science performance in 2019 does not differ significantly from either 2015 or 1995.
Differences between boys and girlsOn average, boys and girls in Ireland achieved very similar mathematics scores (523 and 524, respectively). The performance of boys in Ireland in mathematics has remained relatively stable since 1995, when their average score was 525 points. On the other hand, the mathematics performance of girls increased considerably between 1995 and 2019 (from 512 to 524 points). The average science performance of boys and girls in Ireland was also similar (521 and 526, respectively). Between 1995 and 2015, the average science score for boys remained stable, changing slightly from 527 to 529. On the other hand, girls experienced a large increase from 510 to 531 in their average science score. Between 2015 and 2019, average science performance in Ireland dropped by eight points for boys and almost five points for girls.
Distribution of performance
The performance of students within a country can also be described in terms of the distribution of achievement (i.e., from the lowest- to the highest-achieving students) which can highlight important patterns among students.
Fourth ClassA general overview of the distribution of achievement at Fourth Class compared to Fourth grade in our comparison countries suggests that pupils in Ireland perform relatively well at the lower end of the distribution (e.g., at the 5th percentile) but less well at the upper end (e.g., at the 95th percentile).
This can be seen by comparing the distribution of mathematics achievement in Ireland to those in Northern Ireland (with a higher mean score) and England (with a similar score to Ireland). The score achieved at the 5th percentile among Fourth Class pupils was slightly higher than the 5th percentile in both countries, but mathematics achievement in Ireland was lower at the 75th and, particularly, the 95th
percentiles. At the same time, the score at the 95th percentile in the United States (where the mean score was significantly lower than in Ireland) was similar to the 95th percentile in Ireland, but the United States’ score at the 5th percentile was substantially lower than in Ireland. These patterns suggest that the highest-performing pupils in Ireland are underperforming in mathematics, relative to the achievement of the lower-achieving students in Ireland and the national average achievement.
This pattern was not as clear in science. Among our comparison countries, Australia achieved a similar mean score to Ireland but had a wider distribution of achievement at both tails – that is, the lowest-performing pupils in Australia achieved lower scores than in Ireland, and the highest-achieving pupils in Australia achieved higher scores than in Ireland. The highest-performing pupils in Ireland achieved higher scores than their counterparts in Northern Ireland (with a lower mean score), even

Chapter 9: Summary
67TIMSS 2019 Ireland’s results in mathematics and science
though performance at the lower end of the distribution was similar in both jurisdictions. However, in England (with a higher mean score), pupils at the 5th percentile achieved substantially higher scores than pupils in Ireland, but the score among the highest-achieving students was only slightly higher than in Ireland. These mixed patterns, and the more moderate performance of Fourth Class pupils in science compared to mathematics relative to all TIMSS countries, suggests that there is room for strengthening science learning in Fourth Class at all levels of achievement.
A comparison of trends indicates that, between TIMSS 2011 and 2015, substantial improvements were observed among lower-achieving pupils (those at the 5th percentile of all scores in Ireland), which meant that the overall distribution of achievement narrowed considerably (i.e., there was less of a gap between lower- and high-achieving pupils). In contrast, the distribution of achievement in 2019 is very similar to 2015, with no major changes. In fact, a very slight widening of the distribution (lower at the 5th percentile and higher at the 95th percentile) can be seen.
Second YearAt Second Year, the lowest-achieving students in Ireland (i.e., those at the 5th percentile) perform relatively well in both mathematics and science compared to their international counterparts, while those with the highest performance in each domain (i.e., at the 95th percentile) achieve relatively less well.
In mathematics, the lowest-achieving students in Ireland score over 50 points lower than their peers in Singapore (the country with the highest achievement), while the difference is over 100 points for the highest-achieving students. Students at the 5th percentile in Ireland have a mathematics score that is considerably higher than the corresponding scores of students in countries with similar overall performance (including Australia, England and the United States). On the other hand, the mathematics score of those at the 95th percentile in Ireland is lower than the corresponding scores of students in these countries. However, the performance of students at the 75th percentile in Ireland is similar to that of their peers in a number of countries with similar overall performance (including England and Australia), indicating that the relative underperformance of students in Ireland at the upper end of the mathematics distribution is among the very highest-achieving students.
A similar pattern can be observed for the distribution of science achievement at Second Year. The score of those at the 5th percentile in Ireland is similar to or higher than the corresponding scores in many of the countries with similar overall science performance (students in Portugal and Hungary have considerably higher scores at the 5th percentile). The score of students in Ireland at the 95th percentile is lower than that of their peers in all but one of the eight countries with similar overall mean science scores (the corresponding score in Portugal was about 13 points lower than Ireland’s score).
Looking back to previous cycles, we see that between TIMSS 1995 and 2015 there was a marked improvement in both mathematics and science among lower-achieving students (those at the 5th
percentile of all scores in Ireland). While there was a more modest improvement (of about 3 points) in mathematics between 2015 and 2019, the science scores of students at the 5th and 25th percentiles declined by about 12 points. The performance of high-achieving students in mathematics and science (at the 95th percentile) has remained stable between 2015 and 2019, while it is somewhat lower in 2019 than in 1995.

Chapter 9: Summary
TIMSS 2019 Ireland’s results in mathematics and science68
Performance at International Benchmarks
TIMSS also describes student achievement with reference to specific skills that students at particular levels are able to demonstrate. At each grade level, and for both mathematics and science, four Benchmarks, or levels of achievement, are described: Low, Intermediate, High and Advanced. Students achieving at the Low Benchmark can demonstrate some basic knowledge in a subject area. The skills and knowledge that students can demonstrate increase with each Benchmark, with those at the Advanced Benchmark able to apply knowledge and reason in a variety of situations.
Fourth ClassFor mathematics, the percentage of Fourth Class pupils reaching each Benchmark was higher than the corresponding TIMSS median percentages. Almost all pupils in Ireland (97%) reached at least the Low Benchmark (TIMSS median: 92%), and most (84%) achieved at least an Intermediate level of proficiency (TIMSS median: 71%). More than half of Fourth Class pupils (52%) were classified as reaching the High Benchmark for mathematics (TIMSS median: 34%). Finally, about one-seventh of Fourth Class pupils (15%) reached the Advanced Benchmark for mathematics, compared to 7% at the TIMSS median.
There were no significant differences between the percentages of boys and girls reaching any of the mathematics Benchmarks in Ireland. Compared to previous TIMSS assessments, there were no significant differences between Benchmark performance in TIMSS 2015 and TIMSS 2019. However, the percentage of pupils reaching each mathematics Benchmark was significantly higher in 2019 than in TIMSS 2011 or TIMSS 1995.
Performance at the science Benchmarks was not as strong at Fourth Class as for mathematics. In science, most Fourth Class pupils could reach the Low (94%) and Intermediate (77%) Benchmarks (TIMSS median: 92% and 71%, respectively). However, this means that 6% of pupils could not consistently demonstrate the most basic skills assessed by the test. Fewer than half of pupils in Fourth Class (41%) reached the High Benchmark (TIMSS median: 32%), while almost one-tenth (9%) achieved the Advanced Benchmark (TIMSS median: 6%).
There were no significant differences between boys and girls at any of the science Benchmarks at Fourth Class. There were also no significant differences between the percentages of pupils reaching each Benchmark in 2019 compared to 2015. However, compared to TIMSS 2011, a significantly greater percentage of pupils reached the Intermediate and High Benchmarks. Compared to TIMSS 1995, a significantly greater percentage of pupils reached the Low, Intermediate, and High Benchmarks. There has been no significant change in the percentage of pupils reaching the Advanced Benchmark for science at Fourth Class since Ireland first took part in TIMSS (8% in 1995, 7% in 2011, 7% in 2015, and 9% in 2019).
Second YearAt Second Year, the percentages of students reaching each Benchmark in mathematics are higher than the corresponding international median percentages, although only marginally so at the Advanced Benchmark. In Ireland, 94% of students reached at least the Low Benchmark in mathematics, compared to a TIMSS median of 87%. This means that about 6% of Second Year students in Ireland could not consistently demonstrate the most basic skills assessed in the mathematics test. Further, 76% of students in Ireland reached the Intermediate Benchmark (TIMSS median: 56%) and 38% reached at least the High Benchmark (TIMSS median: 25%). Seven percent of Second Year students achieved at the Advanced Benchmark, compared to a TIMSS median of 5%. In Singapore, the highest-achieving country, the percentages reaching the Intermediate (92%), High (79%) and Advanced (51%) Benchmarks

Chapter 9: Summary
69TIMSS 2019 Ireland’s results in mathematics and science
are considerably higher than in Ireland. There were no significant differences between the percentages of boys and girls reaching each mathematics Benchmark in Ireland. The overall percentages of Irish students reaching these Benchmarks has not changed significantly since 1995.
For science, 92% of students in Ireland reached at least the Low Benchmark (TIMSS median: 85%), meaning that 8% of students did not consistently demonstrate the most basic skills measured by the science assessment. The percentages of students in Ireland reaching at least the Intermediate and High Benchmarks (73% and 40%, respectively) were considerably higher than the corresponding TIMSS median percentages (61% and 29%, respectively) but substantially lower than the percentages reaching these levels in Singapore (91% and 77%, respectively). Ten percent of students in Ireland achieved the Advanced Benchmark, slightly above the international median of 7% but substantially lower than the corresponding percentage in Singapore (48%). In Ireland, significantly more girls than boys reached at least the Low Benchmark, while there were no significant differences in the percentages of girls and boys reaching the Intermediate, High or Advanced Benchmarks. The percentages of students reaching the Low, High, and Advanced Benchmarks in Ireland are not significantly different to the corresponding percentages in 2015 or 1995. However, there was a statistically significant decrease in the percentage of students reaching the Intermediate benchmark for science in 2019 (73%) compared to 2015 (77%).
Performance on the content and cognitive domains
As well as measuring overall performance in mathematics and science, TIMSS describes performance in these subjects across a number of content and cognitive subscales. For mathematics, three content areas were assessed at Fourth grade (Number, Measurement & Geometry, and Data) while four content areas were assessed at Eighth grade (Number, Algebra, Geometry, and Data & Probability). Three content areas were assessed for science at Fourth grade (Life Science, Physical Science, and Earth Science) and four areas at Eighth grade (Biology, Chemistry, Physics, and Earth Science). At each grade level and for each subject, there are three cognitive subscales: Knowing, Applying and Reasoning. Within each country, performance on each of these content and cognitive subscales is compared to overall performance on the subject so that areas of relative strength and weakness can be identified.
Table 9.1 presents the areas of relative strength in mathematics and science at both Fourth grade and Eighth grade. In mathematics, Number was an area of relative strength for students in Ireland at both grade levels. Algebra is incorporated into the Number domain at primary level, but is assessed as a separate domain at Second Year and was found to be an area of relative weakness. Students in Ireland also displayed a relative weakness in the areas of Measurement & Geometry (at Fourth Class) and Geometry (at Second Year). While Data was an area of relative weakness for Fourth Class students, Second Year students displayed a relative strength in Data & Probability. Girls and boys did not differ significantly from each other on any of the mathematics content domain at Fourth Class. At Second Year, girls significantly outperformed boys on the Algebra content domain, while no significant differences between boys and girls were observed on the other content domains.
In science, Earth Science was found to be a relative strength at both grade levels in Ireland. At Second Year, Physics and Chemistry were areas of relative weakness, as was Physical Science at Fourth Class (which include aspects of both Physics and Chemistry). Students’ performance on Life Science (at Fourth Class) and Biology (at Second Year) was in line with their overall science performance. Few differences were observed between boys and girls across the science content domains. At Fourth Class, boys significantly outperformed girls on items assessing Earth Science, while girls significantly outperformed boys in Chemistry at Second Year.

Chapter 9: Summary
TIMSS 2019 Ireland’s results in mathematics and science70
Table 9.1: Summary of relative strengths and weaknesses in mathematics and science content domains
Mathematics Science
Relative weakness
Similar to overall
performance
Relative strength
Relative weakness
Similar to overall
performance
Relative strength
Fourth Class
Measurement & Geometry
Data- Number Physical
ScienceLife
Science Earth Science
Second Year
Algebra
Geometry-
Number
Data & Probability
Chemistry
PhysicsBiology Earth Science
The relative strengths and weaknesses of students in Ireland across the cognitive domains (Knowing, Applying, and Reasoning) measured in mathematics and science are presented in Table 9.2. In mathematics, both Fourth Class and Second Year students in Ireland showed a relative strength in the Applying cognitive domain and a relative weakness in Reasoning. On the other hand, performance on mathematics items measuring the Knowing cognitive domain was in line with overall mathematics performance at Fourth Class, but was an area of relative strength at Second Year. No significant differences were observed between boys and girls in any of the mathematics cognitive domains in Ireland, at either grade level.
For science, Fourth Class students displayed a relative strength in Knowing, while this was an area of relative weakness among Second Year students. Performance on the items measuring the Applying cognitive domain was in line with overall science performance at both grade levels. Reasoning was an area of relative strength among Second Year students, while at Fourth Class, performance on this domain was in line with overall science performance. No significant differences were observed between boys and girls across any of the science cognitive domains at either Fourth Class or Second Year.
Table 9.2: Summary of relative strengths and weaknesses in mathematics and science cognitive domains
Mathematics Science
Relative weakness
Similar to overall
performance
Relative strength
Relative weakness
Similar to overall
performance
Relative strength
Fourth Class Reasoning Knowing Applying -
Applying
ReasoningKnowing
Second Year Reasoning -
Knowing
ApplyingKnowing Applying Reasoning

Chapter 9: Summary
71TIMSS 2019 Ireland’s results in mathematics and science
Curriculum analysis
Almost all (98%) of the TIMSS Fourth grade mathematics assessment was considered by subject experts in Ireland to be covered by pupils in Ireland by the end of Fourth Class. While the coverage of science items was also relatively high (81%) in Ireland, it was much lower than for mathematics. A similar pattern was observed at Eighth grade, where 97% of mathematics items and 69% of science items were considered to be covered by most students by the end of Second Year. Geometry was the mathematics content area with the lowest coverage at both Fourth grade (Measurement & Geometry: 96%) and Second Year (Geometry: 93%) For science, coverage was lowest for items in the Earth Science domain at Fourth grade (57%) and the Physics domain at Eighth grade (60%).
The Test-Curriculum Matching Analysis allows us to examine how student performance may vary if students were only presented with the subsets of items which were judged to be included in the curricula in their country. At each grade level and domain, Ireland’s average performance on these subsets of items did not vary substantially from performance on the complete set of items on the TIMSS tests. This was also the case for many of our comparison countries, when performance was re-examined using just the relevant subset of items for each country. Some notable exceptions were observed for Fourth grade science, where students in Singapore, the Republic of Korea, Japan and Chinese Taipei performed considerably better on the items judged to be part of their respective curricula. Coverage of the TIMSS Fourth grade science items in the curricula of these countries was also very low.
Ireland’s mean scores also did not change greatly when performance was examined on each of the subsets of items included in the TCMAs of our comparison countries, with the exception of Fourth grade science performance on the items included in Japan’s TCMA. The relative stability of students’ performance on the assessment regardless of which country’s curriculum is used as the reference point hints at the myriad of factors that contribute to mathematics and science achievement beyond the intended curriculum and classroom coverage of topics. Our follow-up national reporting on TIMSS 2019, described briefly below, will examine some of these other factors, including student, home, teacher/class, and school factors (see also, for example, Clerkin, Perkins & Chubb, 2020).
Finally, teachers were asked to indicate whether they taught specific topic areas in their lessons with the TIMSS students. Fourth Class teachers reported higher overall coverage of the TIMSS mathematics and science topics (88% for mathematics and 71% for science) when compared to the corresponding international averages (80% for mathematics and 63% for science). Reported coverage was also higher in Ireland across each of the mathematics and science content domains at Fourth Class. At Second Year, teachers reported slightly lower coverage of mathematics items overall when compared to the international average (68% compared to 72%), but coverage varied considerably by content domain. For example, in Ireland, reported coverage of Algebra (73%) and Data & Probability (66%) topics was higher than on average across TIMSS countries (68% and 60%, respectively), but coverage of Geometry items was considerably lower (49% in Ireland, 76% internationally).
Overall, reported coverage of TIMSS science topics at Fourth grade was also higher in Ireland than on average across TIMSS countries (71% compared to 62%) and this was especially the case for topics in Earth Science (72% compared to 60%). On the other hand, overall reported coverage of science topics at Eighth grade was somewhat lower in Ireland compared to the international average (63% compared to 72%). As was the case for mathematics, coverage of topics varied by content domain, with reported coverage of Chemistry being slightly higher in Ireland than at the international average (77% compared to 74%), while coverage of the other domains was lower and was especially low for Physics (48% compared to 68%). Reported coverage of Earth Science topics by teachers in Ireland was also considerably lower than the TIMSS average (54% compared to 71%). However, it should
Chapter 9: Summary
TIMSS 2019 Ireland’s results in mathematics and science72
be noted that some of the Earth Science content domain in TIMSS is covered by the geography curriculum in Ireland.
Further publications for TIMSS 2019
The current report presents the initial TIMSS 2019 achievement findings for Ireland. TIMSS also collects a variety of contextual information from students, their parents (at Fourth Class only), their teachers, and their principals. These data include:
• Structural characteristics of the Irish education system.• Characteristics of Fourth Class and Second Year teachers in Ireland, including their classroom
practices and professional development needs.• Use of ICT in the classroom by teachers and students, as well as students' use of ICT at home.• Students’ attitudes towards learning mathematics and science as well as attitudes towards school
more generally.• Students’ experiences in school, including bullying behaviour.• Interaction between the students’ homes and their schools.
These data are presented for all countries in TIMSS 2019 International Results in Mathematics and Science (Mullis, Martin, Foy, Kelly & Fishbein, 2020). Further national reporting will examine the relationships between student achievement and these contextual factors in Ireland. Separate contextual reports will be published for Fourth Class and Second Year and will be available at www.erc.ie/timss.

References
73TIMSS 2019 Ireland’s results in mathematics and science
ReferencesClerkin, A., Perkins, R., & Cunningham, R. (2016). TIMSS 2015 in Ireland: Mathematics and science in
primary and post-primary schools. Dublin, Ireland: Educational Research Centre. Retrieved from: https://www.erc.ie/wp-content/uploads/2016/11/TIMSS-initial-report-FINAL.pdf
Clerkin, A., Perkins, R., & Chubb, E. (2020). The home learning environment in Ireland: Insights from TIMSS 2015. Dublin, Ireland: Educational Research Centre. Retrieved from: https://www.erc.ie/wp-content/uploads/2020/11/Home-Report-Online-FINAL.pdf
Department of Education and Skills (DES). (2011). Literacy and numeracy for learning and life: The national strategy to improve literacy and numeracy among children and young people, 2011-2020. Dublin, Ireland: Author. Retrieved from: https://www.education.ie/en/publications/policy-reports/lit_num_strategy_full.pdf
Department of Education and Skills (DES). (2017). National Strategy: Literacy and Numeracy for Learning and Life 2011-2020. Interim Review 2011-2016. New Targets: 2017-2020. Dublin, Ireland: Author. Retrieved from: https://www.education.ie/en/Publications/Education-Reports/pub_ed_interim_review_literacy_numeracy_2011_2020.PDF
Martin, M. O., von Davier, M. & Mullis, I. V. S. (Eds.). (2020) Methods and Procedures: TIMSS 2019 Technical Report. Boston, USA: TIMSS & PIRLS International Study Center. Retrieved from: https://timssandpirls.bc.edu/timss2019/methods
Mullis, I. V. S., & Martin, M. O. (Eds.). (2017). TIMSS 2019 Assessment Frameworks. Boston, USA: TIMSS & PIRLS International Study Center. Retrieved from: http://timssandpirls.bc.edu/timss2019/frameworks/
Mullis, I. V. S., Martin, M. O., Foy, P., Kelly, D., & Fishbein, B. (2020). TIMSS 2019 International Results in Mathematics and Science. Boston, USA: TIMSS & PIRLS International Study Center. Retrieved from: http://timssandpirls.bc.edu/timss2019/international-results/
Appendix A: National Advisory Committees
TIMSS 2019 Ireland’s results in mathematics and science74
Appendix A: National Advisory CommitteesIreland’s participation in TIMSS 2019 was assisted by a National Advisory Committee at each grade level. The members of the committees, as of November 2020, are named below
Fourth Class• Aedín Ní Thuathail (Irish Primary Principals’ Network).• Aidan Clerkin (Educational Research Centre).• Áine Lynch (National Parents Council – Primary).• Arlene Forster (National Council for Curriculum and Assessment).• Deirbhile Nic Craith (Irish National Teachers’ Organisation).• Eddie Fox (Educate Together).• Fionnuala Shortt (Educational Research Centre).• John Mescal (Department of Education).• Máirín Ní Chéileachair (Gaelscoileanna).• Mary Delaney (Educational Research Centre).• Noreen Fiorentini (Department of Education, Chair).• Nuala Taaffe (Professional Development Service for Teachers).• Seán Delaney (Marino Institute of Education).
Second Year• Conor Galvin (University College Dublin).• Elizabeth Oldham (Trinity College Dublin, the University of Dublin).• Gerry Hyde (State Examinations Commission).• Kevin McClean (Department of Education) • Liz O’Neill (Department of Education).• Maurice O’Reilly (Dublin City University).• Odilla Finlayson (Dublin City University).• Orlaith O’Connor (Department of Education, Chair). • Paul Behan (National Council for Curriculum and Assessment).• Philip Matthews (Trinity College Dublin, the University of Dublin).• Rachel Linney (National Council for Curriculum and Assessment).• Rachel Perkins (Educational Research Centre).• Tom McCloughlin (Dublin City University).

Appendix B: Percentiles of achievement
75TIMSS 2019 Ireland’s results in mathematics and science
Appendix B: Percentiles of achievementTable B1: Percentiles of mathematics achievement for Ireland and comparison countries – Fourth grade
5th 10th 25th 50th 75th 90th 95th
Singapore 481 (8.0) 519 (7.0) 578 (4.9) 633 (4.5) 682 (3.8) 720 (3.5) 741 (3.8)
Korea, Rep. of 477 (5.7) 509 (4.1) 556 (3.0) 603 (2.3) 648 (2.7) 687 (3.3) 710 (4.0)
Chinese Taipei 483 (5.6) 513 (4.9) 557 (2.7) 603 (1.7) 645 (3.2) 681 (2.4) 701 (2.6)
Japan 474 (3.7) 502 (3.3) 548 (2.5) 595 (2.0) 641 (2.3) 680 (2.9) 703 (3.1)
Northern Ireland 410 (8.0) 449 (5.2) 510 (3.6) 572 (3.6) 627 (3.4) 672 (5.3) 699 (5.9)
England 411 (5.5) 445 (5.1) 499 (3.5) 558 (4.4) 615 (4.1) 665 (4.8) 693 (6.5)
Ireland 414 (5.6) 446 (5.2) 501 (3.5) 553 (2.3) 601 (2.1) 643 (4.2) 665 (3.4)
United States 383 (5.9) 421 (4.4) 480 (3.2) 542 (2.8) 594 (3.0) 639 (2.8) 663 (4.0)
Finland 402 (5.0) 431 (4.9) 483 (3.4) 535 (3.3) 585 (1.9) 628 (3.6) 653 (3.2)
Australia 364 (6.0) 401 (5.9) 460 (3.6) 519 (3.0) 575 (3.4) 625 (3.7) 654 (5.8)
New Zealand 338 (4.7) 368 (4.4) 425 (3.4) 489 (3.2) 549 (3.3) 602 (3.6) 634 (4.2)
Table B2: Percentiles of science achievement for Ireland and comparison countries – Fourth grade
5th 10th 25th 50th 75th 90th 95th
Singapore 454 (6.3) 493 (5.8) 548 (4.5) 602 (3.7) 649 (3.3) 687 (3.2) 708 (3.7)
Korea, Rep. of 474 (7.0) 504 (4.2) 545 (3.2) 590 (2.3) 633 (2.3) 671 (3.1) 693 (4.1)
Japan 442 (4.5) 473 (3.8) 519 (2.7) 566 (1.9) 609 (2.1) 645 (2.7) 668 (3.4)
Chinese Taipei 444 (4.7) 471 (4.4) 516 (2.7) 562 (2.0) 604 (1.9) 639 (2.7) 659 (4.1)
Finland 429 (6.9) 464 (4.5) 513 (3.1) 559 (1.9) 602 (2.8) 640 (3.0) 662 (3.3)
United States 387 (5.6) 426 (4.8) 486 (3.6) 546 (3.0) 598 (2.2) 641 (2.5) 664 (2.6)
England 413 (6.8) 444 (4.5) 491 (3.3) 540 (2.7) 587 (3.3) 626 (4.6) 648 (4.8)
Australia 389 (6.0) 427 (4.4) 484 (2.8) 538 (3.2) 587 (2.4) 629 (3.6) 653 (4.3)
Ireland 393 (7.1) 427 (5.4) 481 (4.8) 534 (3.5) 580 (3.2) 620 (2.8) 643 (4.5)
Northern Ireland 392 (7.0) 424 (4.1) 473 (3.3) 524 (3.0) 568 (2.8) 606 (3.7) 627 (4.7)
New Zealand 360 (4.0) 392 (4.5) 448 (3.2) 507 (2.6) 561 (2.5) 605 (3.4) 629 (3.7)

Appendix B: Percentiles of achievement
TIMSS 2019 Ireland’s results in mathematics and science76
Table B3: Percentiles of mathematics achievement for Ireland and comparison countries – Eighth grade
5th 10th 25th 50th 75th 90th 95th
Singapore 445 (7.8) 487 (10.4) 565 (7.5) 628 (4.6) 679 (3.1) 718 (2.8) 740 (3.3)
Chinese Taipei 435 (5.4) 475 (3.9) 550 (4.0) 623 (3.3) 682 (3.6) 731 (3.5) 759 (4.8)
Korea, Rep. of 435 (6.2) 475 (5.5) 547 (3.1) 613 (2.7) 674 (4.1) 727 (6.6) 755 (6.0)
Japan 451 (4.3) 485 (3.9) 538 (2.6) 595 (2.3) 653 (3.5) 700 (5.4) 727 (6.9)
Ireland 395 (7.3) 426 (5.8) 476 (3.9) 528 (2.7) 574 (2.5) 614 (3.8) 636 (3.0)
Australia 369 (5.3) 401 (4.0) 456 (3.8) 518 (4.2) 578 (5.2) 632 (7.0) 666 (9.0)
United States 348 (9.4) 385 (7.2) 448 (5.8) 518 (5.1) 588 (5.3) 642 (4.8) 671 (4.9)
England 363 (9.2) 398 (8.3) 457 (6.9) 516 (5.9) 575 (6.8) 628 (7.6) 660 (10.2)
Finland 384 (6.0) 412 (5.4) 460 (3.6) 512 (2.7) 560 (2.9) 602 (3.1) 624 (2.9)
New Zealand 333 (7.1) 367 (6.3) 422 (5.1) 482 (3.5) 542 (3.6) 598 (4.0) 629 (4.3)
Table B4: Percentiles of science achievement for Ireland and comparison countries – Eighth grade
5th 10th 25th 50th 75th 90th 95th
Singapore 439 (12.2) 485 (9.4) 557 (7.4) 621 (4.5) 669 (2.8) 708 (3.2) 731 (2.6)
Chinese Taipei 426 (5.6) 464 (3.2) 522 (2.2) 581 (2.6) 634 (2.4) 674 (2.4) 698 (3.9)
Japan 444 (3.7) 473 (3.6) 523 (2.1) 573 (2.4) 620 (3.2) 659 (4.0) 681 (4.7)
Korea, Rep. of 415 (6.5) 453 (4.1) 509 (3.4) 563 (1.9) 617 (2.9) 666 (3.9) 694 (5.6)
Finland 388 (8.8) 428 (6.6) 490 (4.2) 549 (3.1) 602 (2.7) 647 (4.0) 673 (3.8)
Australia 373 (6.5) 409 (4.6) 473 (4.3) 534 (3.4) 589 (3.8) 635 (4.8) 663 (6.2)
Ireland 376 (8.7) 413 (5.9) 470 (4.2) 529 (3.4) 582 (3.4) 624 (3.1) 649 (5.2)
United States 345 (11.0) 388 (8.8) 458 (6.4) 531 (5.4) 594 (4.1) 642 (4.2) 670 (3.9)
England 356 (9.3) 393 (8.6) 458 (6.9) 523 (5.0) 580 (4.7) 630 (6.6) 659 (7.9)
New Zealand 336 (8.1) 375 (6.5) 440 (5.1) 505 (3.5) 563 (3.7) 613 (3.4) 643 (4.2)

Appendix C: Standard errors for mean scores on content and cognitive subscales
77TIMSS 2019 Ireland’s results in mathematics and science
Appendix C: Standard errors for mean scores on content and cognitive subscalesMathematics – Fourth Class – content domains
Table C1: Mean scores of girls and boys and associated standard errors in mathematics content domains – Fourth Class
Number Measurement & Geometry Data
Girls Boys Girls Boys Girls BoysSingapore 631 (4.3) 639 (4.3) 615 (4.0) 625 (4.5) 611 (4.1) 616 (4.3)
Korea, Rep. of 589 (2.6) 597 (3.1) 605 (3.0) 610 (3.1) 605 (3.2) 600 (3.5)
Chinese Taipei 597 (2.4) 602 (2.2) 606 (1.9) 609 (2.4) 588 (3.6) 592 (2.7)
Japan 585 (2.2) 587 (2.2) 602 (3.4) 601 (2.6) 608 (2.5) 603 (2.2)
Northern Ireland 571 (3.6) 574 (3.8) 551 (3.8) 560 (3.7) 564 (3.1) 564 (4.0)
England 556 (4.4) 562 (3.4) 540 (4.5) 550 (3.2) 561 (4.2) 568 (3.5)
Ireland 551 (3.2) 558 (3.2) 538 (3.7) 543 (3.2) 540 (3.8) 545 (3.4)
United States 537 (2.9) 547 (3.1) 513 (3.0) 526 (3.0) 527 (3.2) 539 (3.8)
Finland 525 (2.9) 530 (2.8) 537 (3.4) 540 (3.3) 534 (3.6) 534 (3.1)
Australia 501 (3.0) 511 (3.8) 509 (3.2) 523 (3.9) 531 (4.0) 537 (3.6)
New Zealand 476 (4.3) 481 (3.6) 476 (3.7) 486 (3.4) 503 (4.8) 504 (3.8)Shading indicates that the subscale score is significantly higher than for the other gender on that subscale.
Mathematics – Fourth Class – cognitive domains
Table C2: Mean scores of girls and boys and associated standard errors in mathematics cognitive domains – Fourth Class
Knowing Applying Reasoning
Girls Boys Girls Boys Girls BoysSingapore 634 (4.2) 646 (4.4) 623 (4.0) 628 (4.2) 609 (4.2) 619 (4.4)
Korea, Rep. of 608 (4.8) 616 (4.3) 594 (2.7) 595 (2.9) 591 (3.1) 601 (3.5)
Chinese Taipei 619 (2.1) 624 (2.6) 599 (1.9) 601 (2.0) 570 (2.4) 581 (2.9)
Japan 597 (2.4) 598 (2.6) 594 (2.8) 591 (2.0) 588 (3.0) 590 (2.5)
Northern Ireland 570 (4.0) 579 (4.2) 565 (3.4) 564 (3.7) 556 (3.2) 561 (3.9)
England 555 (4.4) 570 (3.6) 552 (4.1) 555 (3.4) 550 (5.0) 558 (3.3)
Ireland 546 (4.1) 554 (3.4) 548 (3.4) 554 (3.0) 538 (3.4) 546 (3.3)
United States 528 (3.0) 544 (3.0) 534 (3.0) 541 (2.9) 516 (3.3) 531 (2.8)
Finland 528 (3.1) 534 (3.0) 532 (3.1) 530 (2.8) 533 (3.1) 538 (3.2)
Australia 499 (3.4) 519 (4.0) 513 (2.9) 519 (3.5) 517 (3.2) 528 (3.8)
New Zealand 469 (4.3) 482 (3.6) 487 (3.7) 488 (3.1) 499 (3.5) 503 (3.5)Shading indicates that the subscale score is significantly higher than for the other gender on that subscale.

Appendix C: Standard errors for mean scores on content and cognitive subscales
TIMSS 2019 Ireland’s results in mathematics and science78
Mathematics – Second Year – content domains
Table C3: Mean scores of girls and boys and associated standard errors in mathematics content domains – Second Year
Number Algebra Geometry Data & ProbabilityGirls Boys Girls Boys Girls Boys Girls Boys
Singapore 611 (4.5) 611 (4.8) 623 (5.1) 615 (5.3) 620 (4.7) 618 (4.4) 623 (5.4) 618 (5.3)
Chinese Taipei 612 (3.3) 614 (3.5) 623 (3.0) 613 (3.4) 623 (3.2) 623 (3.7) 593 (3.7) 594 (3.4)
Korea, Rep. of 602 (3.3) 608 (3.2) 611 (4.2) 608 (4.0) 613 (3.9) 621 (3.3) 594 (3.5) 601 (3.0)
Japan 573 (3.7) 583 (4.0) 605 (2.9) 600 (4.1) 609 (3.4) 611 (4.0) 592 (2.7) 597 (3.0)
Ireland 538 (3.4) 544 (4.0) 510 (3.1) 501 (3.7) 504 (3.5) 508 (3.6) 541 (3.6) 540 (4.6)
Australia 515 (3.7) 528 (5.7) 502 (4.1) 501 (5.9) 510 (3.9) 517 (5.8) 532 (3.8) 534 (5.7)
United States 518 (3.7) 522 (5.7) 528 (4.5) 512 (6.8) 500 (4.1) 499 (6.1) 510 (4.4) 509 (7.0)
England 513 (5.6) 526 (7.4) 507 (6.5) 500 (7.8) 510 (5.8) 507 (7.2) 523 (6.6) 523 (8.3)
Finland 512 (2.8) 517 (3.1) 495 (3.2) 483 (3.6) 517 (3.7) 504 (3.8) 517 (3.6) 511 (4.4)
New Zealand 477 (3.8) 489 (5.1) 464 (4.1) 464 (5.2) 474 (4.1) 479 (5.1) 492 (3.9) 499 (5.5)Shading indicates that the subscale score is significantly higher than for the other gender on that subscale.
Mathematics – Second Year – cognitive domains
Table C4: Mean scores of girls and boys and associated standard errors in mathematics cognitive domains – Second Year
Knowing Applying Reasoning
Girls Boys Girls Boys Girls BoysSingapore 618 (5.0) 611 (4.8) 616 (4.4) 613 (4.2) 622 (5.0) 619 (5.1)
Chinese Taipei 619 (3.4) 613 (3.7) 611 (3.0) 609 (3.2) 616 (3.0) 616 (3.2)
Korea, Rep. of 612 (4.2) 616 (3.5) 602 (3.5) 606 (2.9) 606 (3.3) 612 (3.7)
Japan 589 (3.6) 589 (3.5) 594 (3.0) 598 (3.2) 598 (3.3) 600 (3.6)
Ireland 533 (3.4) 528 (3.6) 527 (2.9) 526 (3.6) 507 (3.5) 509 (4.3)
Australia 509 (3.7) 513 (5.8) 519 (3.6) 524 (5.6) 512 (4.0) 517 (5.7)
United States 525 (4.4) 519 (6.6) 517 (4.1) 513 (6.3) 508 (3.9) 507 (5.8)
England 507 (6.1) 514 (7.3) 519 (5.7) 517 (7.2) 512 (6.1) 512 (7.8)
Finland 506 (2.8) 504 (3.0) 513 (2.9) 508 (3.3) 509 (3.2) 504 (3.5)
New Zealand 462 (3.7) 473 (5.2) 483 (3.5) 489 (4.6) 483 (3.4) 489 (5.0)Shading indicates that the subscale score is significantly higher than for the other gender on that subscale.

Appendix C: Standard errors for mean scores on content and cognitive subscales
79TIMSS 2019 Ireland’s results in mathematics and science
Science – Fourth Class – content domains
Table C5: Mean scores of girls and boys and associated standard errors in science content domains – Fourth Class
Life Science Physical Science Earth Science
Girls Boys Girls Boys Girls BoysSingapore 601 (3.9) 605 (4.2) 607 (3.9) 619 (4.0) 548 (3.9) 565 (4.5)
Korea, Rep. of 572 (3.2) 576 (2.5) 600 (3.3) 613 (2.8) 579 (3.5) 594 (3.7)
Japan 554 (2.4) 547 (2.4) 580 (2.2) 577 (2.2) 558 (2.9) 560 (3.2)
Chinese Taipei 542 (3.6) 539 (2.3) 570 (1.9) 576 (2.8) 565 (2.7) 571 (2.0)
Finland 565 (3.7) 552 (3.3) 544 (3.8) 544 (4.3) 564 (3.7) 562 (5.1)
United States 547 (2.6) 546 (3.4) 523 (3.7) 531 (3.1) 533 (3.7) 543 (3.4)
England 540 (3.7) 535 (3.7) 534 (4.2) 540 (3.6) 532 (3.3) 534 (3.8)
Australia 543 (2.9) 535 (3.4) 524 (3.4) 528 (3.3) 524 (3.0) 530 (3.5)
Ireland 530 (4.3) 526 (3.6) 520 (4.1) 526 (3.3) 529 (4.8) 543 (3.9)
Northern Ireland 523 (3.9) 517 (4.2) 510 (2.7) 512 (2.9) 521 (3.2) 528 (3.9)
New Zealand 516 (3.9) 504 (2.8) 493 (2.9) 492 (2.9) 501 (5.4) 505 (3.6)Shading indicates that the subscale score is significantly higher than for the other gender on that subscale.
Science – Fourth Class – cognitive domains
Table C6: Mean scores of girls and boys and associated standard errors in science cognitive domains – Fourth Class
Knowing Applying Reasoning
Girls Boys Girls Boys Girls BoysSingapore 580 (3.9) 595 (4.2) 591 (4.1) 599 (3.9) 605 (4.0) 603 (3.8)
Korea, Rep. of 573 (2.3) 595 (3.2) 594 (2.9) 598 (2.8) 580 (2.9) 583 (3.7)
Japan 533 (2.5) 537 (3.3) 581 (2.3) 572 (2.9) 585 (3.1) 574 (4.3)
Chinese Taipei 556 (2.3) 565 (2.6) 559 (2.5) 562 (2.4) 556 (4.1) 548 (3.0)
Finland 553 (3.1) 553 (2.7) 554 (3.3) 548 (2.7) 568 (3.1) 557 (3.2)
United States 537 (3.4) 547 (3.1) 534 (3.1) 536 (3.7) 538 (3.1) 539 (3.2)
England 542 (3.9) 545 (4.0) 526 (4.1) 525 (3.4) 548 (3.9) 539 (4.5)
Australia 535 (3.0) 540 (3.7) 526 (4.0) 521 (3.5) 541 (3.2) 534 (3.3)
Ireland 528 (4.8) 535 (3.5) 524 (4.0) 527 (3.1) 527 (4.7) 524 (4.1)
Northern Ireland 521 (3.7) 525 (3.7) 514 (3.6) 514 (3.3) 525 (3.9) 514 (4.0)
New Zealand 504 (3.8) 505 (3.6) 500 (3.6) 495 (3.5) 512 (3.5) 498 (3.3)Shading indicates that the subscale score is significantly higher than for the other gender on that subscale.

Appendix C: Standard errors for mean scores on content and cognitive subscales
TIMSS 2019 Ireland’s results in mathematics and science80
Science – Second Year – content domains
Table C7: Mean scores of girls and boys and associated standard errors in science content domains – Second Year
Number Algebra Geometry Data & ProbabilityGirls Boys Girls Boys Girls Boys Girls Boys
Singapore 621 (4.7) 623 (5.2) 617 (5.8) 614 (5.7) 614 (5.0) 624 (4.8) 551 (5.4) 572 (4.3)
Chinese Taipei 577 (3.1) 575 (2.7) 598 (3.3) 591 (3.1) 550 (3.3) 560 (3.3) 572 (3.4) 586 (2.8)
Japan 571 (2.2) 577 (3.2) 560 (2.5) 560 (3.6) 563 (2.8) 578 (3.4) 563 (3.5) 581 (4.9)
Korea, Rep. of 554 (3.0) 565 (2.8) 553 (4.0) 549 (3.7) 563 (3.7) 575 (3.2) 549 (4.3) 574 (3.7)
Finland 549 (3.4) 520 (4.1) 561 (4.0) 530 (4.7) 542 (4.0) 537 (5.1) 562 (4.4) 555 (4.0)
Australia 533 (3.2) 529 (4.8) 519 (3.5) 510 (5.3) 524 (3.6) 533 (5.0) 531 (3.3) 536 (4.6)
Ireland 523 (3.2) 520 (4.4) 525 (4.6) 500 (5.0) 517 (4.1) 520 (4.7) 536 (4.5) 536 (4.2)
United States 536 (4.0) 524 (6.2) 515 (4.6) 503 (7.0) 514 (4.2) 515 (6.6) 527 (4.5) 532 (6.8)
England 518 (5.9) 513 (6.7) 521 (7.5) 502 (7.9) 517 (5.9) 515 (7.2) 513 (6.8) 523 (7.0)
New Zealand 500 (3.7) 496 (5.0) 483 (3.8) 481 (6.1) 496 (3.9) 507 (5.4) 502 (3.5) 517 (5.4)Shading indicates that the subscale score is significantly higher than for the other gender on that subscale.
Science – Second Year – cognitive domains
Table C8: Mean scores of girls and boys and associated standard errors in science cognitive domains – Second Year
Knowing Applying Reasoning
Girls Boys Girls Boys Girls BoysSingapore 617 (4.9) 624 (4.9) 604 (4.6) 613 (5.0) 591 (4.8) 598 (4.5)
Chinese Taipei 592 (2.9) 608 (2.9) 567 (2.5) 567 (2.9) 560 (2.7) 558 (2.6)
Japan 555 (3.3) 572 (2.7) 571 (2.5) 581 (2.7) 569 (2.5) 571 (3.0)
Korea, Rep. of 549 (3.8) 567 (3.0) 554 (3.2) 566 (2.8) 562 (3.4) 566 (2.5)
Finland 553 (3.2) 537 (4.2) 547 (3.4) 527 (4.0) 559 (3.9) 537 (4.1)
Australia 511 (3.3) 518 (5.3) 534 (3.2) 530 (4.9) 538 (3.1) 533 (4.7)
Ireland 512 (3.6) 514 (4.1) 525 (4.1) 518 (4.2) 538 (3.6) 531 (4.6)
United States 515 (4.1) 514 (5.9) 525 (4.2) 521 (6.3) 530 (3.8) 526 (6.2)
England 519 (6.1) 521 (6.9) 517 (6.0) 512 (6.8) 516 (5.7) 510 (6.8)
New Zealand 475 (3.7) 484 (5.3) 500 (4.2) 505 (5.2) 510 (3.6) 509 (5.0)Shading indicates that the subscale score is significantly higher than for the other gender on that subscale.

Appendix D: Teacher reports of topic coverage
81TIMSS 2019 Ireland’s results in mathematics and science
Appendix D: Teacher reports of topic coverageMathematics – Fourth Class Table D1: Percentages of students taught the TIMSS mathematics topics (teachers’ reports) – Fourth Class
Mostly taught
before this year
% students (SE)
Mostly taught
this year% students
(SE)
Not yet taught or just
introduced% students
(SE)
Number
Concepts of whole numbers, including place value and ordering 71 (3.0) 27 (3.2) 1 (1.2)
Adding, subtracting, multiplying and dividing with whole numbers 57 (3.3) 43 (3.3) 0.3 (0.3)
Concepts of multiples and factors; odd and even numbers 53 (4.0) 42 (3.8) 5 (1.6)
Number sentences (finding the missing number, representing problem situations with number sentences)
54 (3.8) 40 (3.5) 6 (1.7)
Number patterns (extending number patterns and finding missing terms) 60 (3.6) 36 (3.7) 4 (1.2)
Concepts of fractions, including representing, comparing and ordering, adding and subtracting simple fractions
13 (2.2) 73 (2.9) 14 (2.5)
Concepts of decimals, including place value and ordering, adding and subtracting with decimals
13 (2.7) 79 (3.6) 8 (2.7)
Measurement & Geometry
Solving problems involving length, including measuring and estimating 42 (3.7) 47 (3.7) 11 (1.8)
Solving problems involving mass, volume and time 22 (3.1) 43 (4.1) 35 (3.7)
Finding and estimating perimeter, area and volume 12 (2.6) 55 (4.3) 33 (3.9)
Parallel and perpendicular lines 22 (3.3) 76 (3.1) 2 (1.0)Comparing and drawing angles 10 (2.4) 62 (4.2) 28 (3.7)Elementary properties of common geometric shapes 39 (3.9) 49 (3.9) 12 (2.4)
3-D shapes, including relationships with their 2-D representations 36 (4.1) 52 (3.8) 13 (2.2)
Data
Reading and interpreting data from tables, pictographs, bar graphs, line graphs and pie charts
41 (3.6) 53 (3.6) 6 (1.8)
Organising and representing data to help answer questions 33 (3.8) 58 (3.8) 9 (2.2)
Drawing conclusions from data displays 32 (4.1) 58 (3.8) 10 (2.2)Due to rounding, percentages do not always add to 100.

Appendix D: Teacher reports of topic coverage
TIMSS 2019 Ireland’s results in mathematics and science82
Science – Fourth Class
Table D2: Percentages of pupils taught the TIMSS science topics (teachers’ reports) – Fourth Class
Mostly taught before
this year% students
(SE)
Mostly taught
this year% students
(SE)
Not yet taught or just
introduced% students
(SE)
Life Science
Physical and behavioural characteristics of living things and major groups of living things (e.g., mammals, birds, insects, flowering plants)
59 (3.8) 36 (3.7) 4 (1.5)
Major body structures and their functions in humans, other animals and plants 28 (3.5) 57 (3.7) 16 (2.6)
Life cycles of common plants and animals (e.g., flowering plants, butterflies, frogs) 72 (3.5) 16 (2.7) 11 (2.6)
Characteristics of plants and animals that are inherited 30 (3.4) 19 (2.7) 51 (3.8)Interactions between organisms and their environment (e.g., physical features and behaviours that help living things survive in their environments)
24 (3.2) 47 (4.2) 29 (3.4)
Relationships in ecosystems (e.g., simple food chains, predator-prey relationships, competition) 29 (3.4) 43 (3.6) 28 (2.7)
Human health (transmission and prevention of diseases, everyday behaviours that promote good health)
30 (3.6) 45 (3.8) 25 (3.6)
Physical Science
States of matter (solid, liquid, gas) and their properties (volume, shape) 23 (3.2) 55 (4.2) 22 (3.3)
Classifying materials based on physical properties (weight/mass, volume, state of matter, conductivity of heat or electricity)
22 (3.1) 44 (4.2) 34 (3.9)
Mixtures, including methods for separating a mixture into its components (e.g., sifting, filtering, evaporation, using a magnet)
17 (2.9) 31 (3.0) 52 (3.4)
Properties of magnets (e.g., like poles repel and opposite poles attract, magnets can attract some objects)
42 (3.6) 38 (3.8) 20 (3.1)
Physical changes in everyday life (e.g., changes of state, dissolving) 32 (3.6) 42 (4.0) 25 (3.7)
Chemical changes in everyday life (e.g., decaying, burning, rusting, cooking) 17 (2.7) 30 (3.5) 53 (3.6)
Common sources of energy (e.g., the Sun, wind, oil) and uses of energy (heating and cooling homes, providing light)
30 (3.1) 60 (3.8) 10 (2.5)
Light and sound in everyday life (e.g., shadows and reflections, vibrating objects make sound) 39 (4.0) 43 (4.4) 18 (3.3)
Heat transfer (e.g., energy flows from a hot object to a colder object) 20 (2.9) 35 (3.4) 44 (3.7)
Electricity and simple circuits (e.g., a circuit must be complete to work correctly) 22 (2.9) 34 (3.5) 44 (4.2)
Forces that cause objects to move (e.g., gravity, pushing/pulling) or change their motion (e.g., friction) 32 (3.9) 46 (3.7) 22 (3.1)
Simple machines (e.g., levers pulleys, wheels, ramps) that help make motion easier 21 (2.8) 38 (3.2) 41 (3.4)
(Cont.)

Appendix D: Teacher reports of topic coverage
83TIMSS 2019 Ireland’s results in mathematics and science
Table D2 (continued): Percentages of pupils taught the TIMSS science topics (teachers’ reports) – Fourth Class
Mostly taught before
this year% students
(SE)
Mostly taught
this year% students
(SE)
Not yet taught or just
introduced% students
(SE)
Earth Science
Physical makeup of Earth's surface (e.g., land and water in unequal proportions, sources of fresh and salt water)
24 (3.6) 49 (4.1) 27 (3.0)
Earth’s resources used in everyday life (e.g., water, wind, soil, forests, oil, natural gas, minerals) 19 (3.1) 62 (3.5) 19 (2.7)
Changes in Earth’s surface over time (e.g., mountain building, weathering, erosion) 8 (2.0) 41 (3.6) 50 (3.9)
Fossils and what they can tell us about past conditions on Earth 14 (2.5) 28 (3.3) 58 (3.6)
Weather and climate (e.g., daily, seasonal, and locational variations versus long-term trends) 31 (3.7) 60 (3.9) 9 (1.9)
Objects in the solar system (the Sun, the Earth, the Moon, and other planets) and their movements 40 (3.8) 43 (3.5) 17 (3.1)
Earth’s motion and related patterns observed on Earth (e.g., day and night, seasons) 40 (3.4) 44 (3.4) 16 (2.8)
Due to rounding, percentages do not always add to 100.

Appendix D: Teacher reports of topic coverage
TIMSS 2019 Ireland’s results in mathematics and science84
Mathematics – Second Year
Table D3: Percentages of students taught the TIMSS mathematics topics (teachers’ reports) – Second Year
Mostly taught
before this year
% students (SE)
Mostly taught this
year% students
(SE)
Not yet taught or just
introduced% students
(SE)
NumberComputing with negative numbers 94 (1.3) 6 (1.3) 0 (0.0)Concepts of fractions and decimals 94 (1.3) 6 (1.3) 0 (0.0)Solving problems involving proportions and percent 74 (2.7) 23 (2.7) 3 (0.9)
Algebra
Simplifying and evaluating algebraic expressions 42 (3.4) 57 (3.4) 1 (0.4)Simple linear equations 37 (3.1) 61 (3.1) 2 (0.6)Simple linear inequalities 6 (1.4) 72 (3.1) 22 (2.7)Simultaneous (two variables) equations 2 (1.1) 70 (3.2) 28 (3.0)Representation of liner and quadratic functions in tables, graphs, words or equations 2 (0.8) 56 (2.8) 42 (2.9)
Properties of functions 3 (1.4) 51 (3.2) 45 (3.4)Numeric, algebraic and geometric patterns of sequences 13 (2.2) 41 (3.3) 46 (3.4)
Geometry
Geometric properties of angles, pairs of lines and geometric shapes 42 (3.2) 32 (3.1) 27 (3.0)
Solving problems involving perimeters, circumferences and areas 22 (2.9) 52 (3.4) 26 (3.0)
Solving problems involving the Pythagorean Theorem 2 (0.8) 53 (3.4) 45 (3.5)Translation, reflection and rotation 12 (2.5) 18 (2.6) 70 (3.2)Congruent figures and similar triangles 3 (1.1) 27 (3.1) 70 (3.3)Solving problems with 3D shapes 2 (0.9) 33 (3.4) 65 (3.5)
Data and Probability
Reading and interpreting data from one or more sources to solve problems 28 (2.9) 38 (3.3) 34 (3.2)
Identifying appropriate procedures for collecting data 46 (3.4) 37 (3.4) 17 (2.6)Organising and representing data to help answer questions 42 (3.5) 41 (3.3) 17 (2.5)
Calculating and interpreting statistics summarising data distributions 18 (2.8) 47 (3.6) 35 (3.5)
Theoretical and empirical probability of simple events 25 (2.9) 33 (3.3) 42 (2.9)Theoretical and empirical probability of compound events 9 (1.9) 30 (3.1) 61 (3.4)
Due to rounding, percentages do not always add to 100.

Appendix D: Teacher reports of topic coverage
85TIMSS 2019 Ireland’s results in mathematics and science
Science – Second Year
Table D4: Percentages of students taught the TIMSS science topics (teachers’ reports) – Second Year
Mostly taught
before this year
% students (SE)
Mostly taught this
year% students
(SE)
Not yet taught or just
introduced% students
(SE)
Biology
Differences among major taxonomic groups of organisms 53 (3.2) 12 (2.3) 35 (3.3)
Major organs and organ systems in humans and other organisms 43 (3.6) 51 (3.4) 6 (1.9)
Cells, their structure and functions including respiration and photosynthesis 58 (2.9) 33 (3.0) 9 (2.1)
Life cycles, sexual reproduction and heredity 9 (2.3) 49 (4.0) 42 (4.0)Role of variation and adaptation in survival/extinction 8 (1.9) 34 (3.6) 59 (3.5)
Interdependence of populations of organisms in ecosystems 7 (1.6) 35 (3.2) 58 (3.5)
Human health 29 (3.1) 41 (3.3) 30 (3.2)
Chemistry
Particulate structure, classification and composition of matter 40 (4.0) 54 (3.8) 6 (1.9)
The periodic table as an organising principle for the known elements 26 (3.0) 66 (3.5) 8 (2.1)
Physical and chemical properties of matter 67 (3.5) 29 (3.3) 4 (1.4)Mixtures and solutions 80 (2.6) 17 (2.3) 2 (1.2)Properties of common acids and bases 21 (3.3) 61 (3.8) 18 (2.3)Characteristics of chemical reactions 8 (2.2) 51 (4.0) 40 (3.7)Matter and energy in chemical reactions 6 (1.4) 40 (3.6) 54 (3.9)The role of electrons in chemical bonds 4 (1.2) 46 (4.0) 50 (4.0)
Physics
Physical states and changes in matter 78 (2.7) 15 (2.5) 7 (1.4)Energy transformation and transfer 32 (3.4) 48 (3.9) 21 (3.0)Properties/behaviours of light 7 (1.7) 13 (2.4) 81 (2.6)Properties/behaviours of sound 4 (0.9) 17 (2.7) 79 (2.7)Electric circuits 3 (1.1) 16 (2.6) 81 (2.8)Properties and uses of permanent magnets and electromagnets 7 (1.4) 17 (2.7) 76 (2.8)
Motion and forces 19 (3.2) 61 (3.7) 20 (3.3)
Earth Science
Earth’s structure and physical features 25 (3.0) 22 (2.9) 53 (3.6)Earth’s processes, cycles and history 12 (2.2) 31 (3.8) 57 (3.6)
Earth’s resources, their use and conservation 16 (2.6) 39 (3.7) 44 (3.7)
Earth in the solar system and the universe 27 (3.2) 44 (3.6) 28 (3.8)Due to rounding, percentages do not always add to 100..
www.erc.ie