Northern Ireland’s longstanding ... - discovery.ucl.ac.uk
19
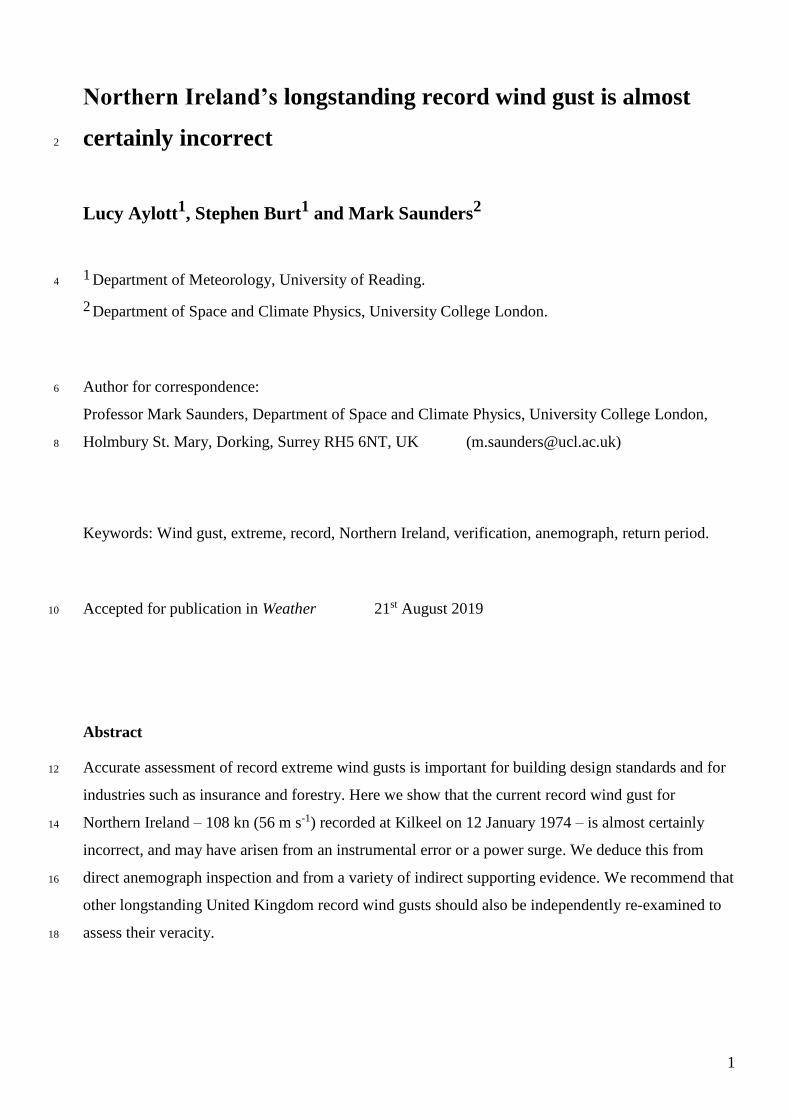
1 Northern Ireland’s longstanding record wind gust is almost certainly incorrect 2 Lucy Aylott 1 , Stephen Burt 1 and Mark Saunders 2 1 Department of Meteorology, University of Reading. 4 2 Department of Space and Climate Physics, University College London. Author for correspondence: 6 Professor Mark Saunders, Department of Space and Climate Physics, University College London, Holmbury St. Mary, Dorking, Surrey RH5 6NT, UK ([email protected]) 8 Keywords: Wind gust, extreme, record, Northern Ireland, verification, anemograph, return period. Accepted for publication in Weather 21 st August 2019 10 Abstract Accurate assessment of record extreme wind gusts is important for building design standards and for 12 industries such as insurance and forestry. Here we show that the current record wind gust for Northern Ireland – 108 kn (56 m s -1 ) recorded at Kilkeel on 12 January 1974 – is almost certainly 14 incorrect, and may have arisen from an instrumental error or a power surge. We deduce this from direct anemograph inspection and from a variety of indirect supporting evidence. We recommend that 16 other longstanding United Kingdom record wind gusts should also be independently re-examined to assess their veracity. 18
Transcript of Northern Ireland’s longstanding ... - discovery.ucl.ac.uk
1
Northern Ireland’s longstanding record wind gust is almost
certainly incorrect 2
Lucy Aylott1, Stephen Burt1 and Mark Saunders2
1 Department of Meteorology, University of Reading. 4
2 Department of Space and Climate Physics, University College London.
Author for correspondence: 6
Professor Mark Saunders, Department of Space and Climate Physics, University College London,
Holmbury St. Mary, Dorking, Surrey RH5 6NT, UK ([email protected]) 8
Keywords: Wind gust, extreme, record, Northern Ireland, verification, anemograph, return period.
Accepted for publication in Weather 21st August 2019 10
Abstract
Accurate assessment of record extreme wind gusts is important for building design standards and for 12
industries such as insurance and forestry. Here we show that the current record wind gust for
Northern Ireland – 108 kn (56 m s-1) recorded at Kilkeel on 12 January 1974 – is almost certainly 14
incorrect, and may have arisen from an instrumental error or a power surge. We deduce this from
direct anemograph inspection and from a variety of indirect supporting evidence. We recommend that 16
other longstanding United Kingdom record wind gusts should also be independently re-examined to
assess their veracity. 18
2
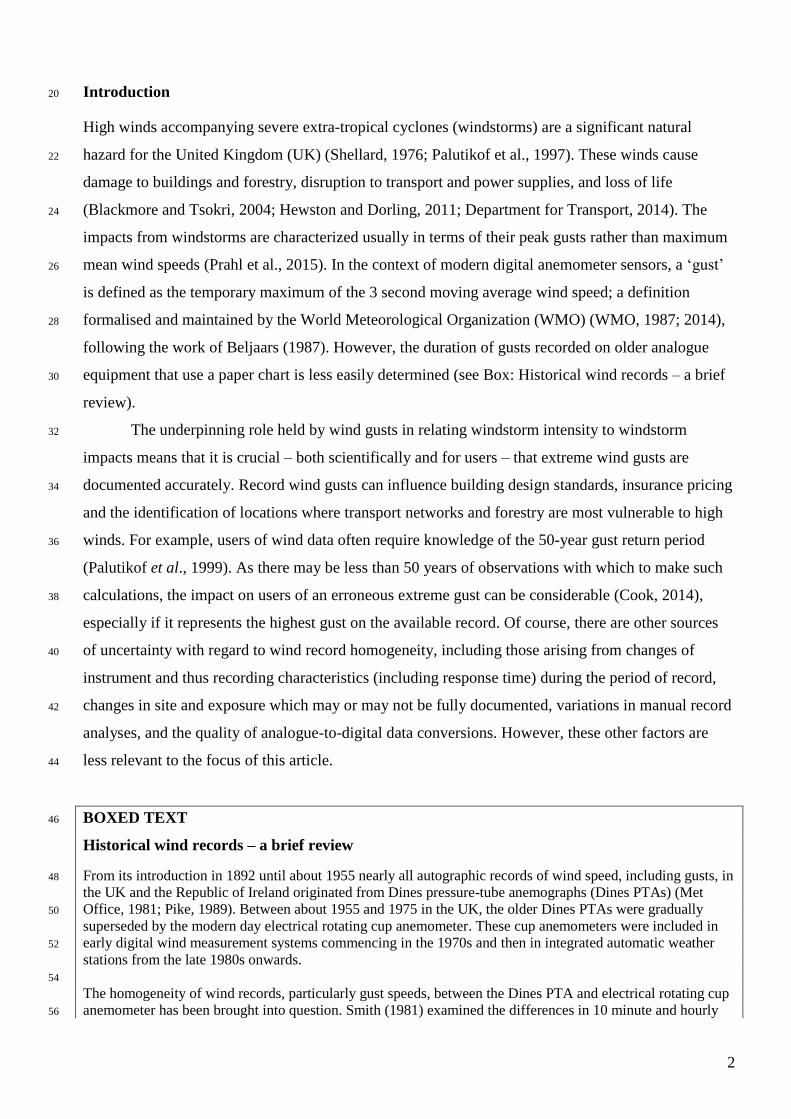
Introduction 20
High winds accompanying severe extra-tropical cyclones (windstorms) are a significant natural
hazard for the United Kingdom (UK) (Shellard, 1976; Palutikof et al., 1997). These winds cause 22
damage to buildings and forestry, disruption to transport and power supplies, and loss of life
(Blackmore and Tsokri, 2004; Hewston and Dorling, 2011; Department for Transport, 2014). The 24
impacts from windstorms are characterized usually in terms of their peak gusts rather than maximum
mean wind speeds (Prahl et al., 2015). In the context of modern digital anemometer sensors, a ‘gust’ 26
is defined as the temporary maximum of the 3 second moving average wind speed; a definition
formalised and maintained by the World Meteorological Organization (WMO) (WMO, 1987; 2014), 28
following the work of Beljaars (1987). However, the duration of gusts recorded on older analogue
equipment that use a paper chart is less easily determined (see Box: Historical wind records – a brief 30
review).
The underpinning role held by wind gusts in relating windstorm intensity to windstorm 32
impacts means that it is crucial – both scientifically and for users – that extreme wind gusts are
documented accurately. Record wind gusts can influence building design standards, insurance pricing 34
and the identification of locations where transport networks and forestry are most vulnerable to high
winds. For example, users of wind data often require knowledge of the 50-year gust return period 36
(Palutikof et al., 1999). As there may be less than 50 years of observations with which to make such
calculations, the impact on users of an erroneous extreme gust can be considerable (Cook, 2014), 38
especially if it represents the highest gust on the available record. Of course, there are other sources
of uncertainty with regard to wind record homogeneity, including those arising from changes of 40
instrument and thus recording characteristics (including response time) during the period of record,
changes in site and exposure which may or may not be fully documented, variations in manual record 42
analyses, and the quality of analogue-to-digital data conversions. However, these other factors are
less relevant to the focus of this article. 44
BOXED TEXT 46
Historical wind records – a brief review
From its introduction in 1892 until about 1955 nearly all autographic records of wind speed, including gusts, in 48
the UK and the Republic of Ireland originated from Dines pressure-tube anemographs (Dines PTAs) (Met
Office, 1981; Pike, 1989). Between about 1955 and 1975 in the UK, the older Dines PTAs were gradually 50
superseded by the modern day electrical rotating cup anemometer. These cup anemometers were included in
early digital wind measurement systems commencing in the 1970s and then in integrated automatic weather 52
stations from the late 1980s onwards.
54
The homogeneity of wind records, particularly gust speeds, between the Dines PTA and electrical rotating cup
anemometer has been brought into question. Smith (1981) examined the differences in 10 minute and hourly 56
3
mean wind speeds recorded by both instruments, finding that the rotating cup anemometer produced mean
wind speeds 5% higher than the PTA during high winds, although the analysis did not extend to gust speeds. 58
Miller et al. (2013) found that gusts recorded by the Dines PTA were 5-10% higher than those recorded by a
cup anemometer under the same conditions, and that these differences increased with adoption of the WMO-60
recommended 3 s gust definition. The typical gust averaging period obtained from an anemograph trace is
stated as 1.5 s in the Met Office Surface Data Users Guide (Met Office, 2019b, Section 5.5; Hewston and 62
Dorling, 2011), although no source for this statement is specified and 1.5 s seems unrealistically low. While
calibration errors of around 5% that are also applied to the gust speeds from anemographs may act to offset 64
differences between 1.5 s and 3 s gust measurement periods (Burt, 2012, Chapter 9, Figure 9.5; Met Office,
2019b), the periods when these calibration errors occurred do not appear to be properly documented (Hewston 66
and Dorling, 2011). Cook (2014) found that following full automation in 1995 of the process to generate and
archive wind data in the Met Office that virtually all incorrect data artefacts have been removed. However, pre-68
automation wind and gust data still comprise a substantial part of the historical archive.
70
In the UK, lists of weather and climate extremes are documented and published online by the 72
Met Office (Met Office 2019a). With specific regard to extreme wind gust records, Met Office online
notes clarify that published values for ‘record’ gust speeds are based exclusively on more recent 74
observations (1969 onwards), exclude stations above 500 m altitude, and that attempts have been
made to verify these records by comparison with nearby stations. However, to our knowledge, these 76
record gust values have not undergone independent scrutiny and verification, and may well have
remained unchecked since the time of their initial recording. This matter is considered in more detail 78
subsequently.
On 12 January 1974, a gust of 108 kn was reported from Kilkeel in Northern Ireland during an 80
intense extratropical cyclone. This established a new Met Office record for the highest gust speed at a
low-level station in Northern Ireland; a record that remains in place to date (Met Office, 2019a). At 82
the time of the gust, the Kilkeel weather station was equipped with an electrical-recording cup
anemometer system, which produced a paper chart record (an anemogram). 84
The article is structured as follows. An overview of the synoptic situation leading to the
extreme gust measurement at Kilkeel is given, followed by a review of the wind data recorded during 86
the storm at other sites in the UK and in the Republic of Ireland. The Kilkeel anemogram for the
‘record’ gust is then presented and carefully examined, after which we assess the evidence for and 88
against the veracity of the gust. The article concludes by discussing the implications of our findings,
and by recommending the creation of an independent review committee to improve the compilation, 90
adjudication and publication of record UK wind gusts and, by implication and extension, for other
UK weather extremes. 92
Synoptic overview and storm damage 94
The extreme gust at Kilkeel was recorded at 0536 GMT on 12 January 1974 during the close passage
of an intense extratropical cyclone. This storm and its impacts are noted briefly in Lamb (1991) and 96
4
in Eden (2008). Figure 1 shows the nature, track and strength of the extratropical cyclone during the
24 hours spanning the Kilkeel gust event, as documented in the Daily Weather Report (Met Office, 98
1974a). The storm deepened explosively (defined as a central pressure fall of at least 24 hPa in 24 h;
Sanders and Gyakum, 1980) to the south-west of Ireland on 11 January (not shown) with its central 100
pressure falling to 960 hPa by 1800 GMT (Figure 1a). The occluding depression then moved north-
eastward somewhat to the west of Ireland and Scotland between 0000 and 1200 GMT 12 January, 102
attaining a minimum central pressure of 956 hPa at 0600 GMT, at which time the depression was
centred to the north-west of Ireland (Figure 1c). A very strong pressure gradient developed across the 104
British Isles between 0000 and 1200 GMT on 12 January: a Met Éireann report (Keane and Sheahan,
1974) states that the geostrophic gradient wind speed reached 145 kn to the south and south-east of 106
the depression centre at about 0600 GMT, although evidence for this statement was not quantified.
An unstable returning polar maritime airmass was introduced behind the system’s cold front (Figure 108
1c), and by 1200 GMT (Figure 1d) gradient winds began to moderate over Ireland as the depression
moved away to the north-west of Scotland. 110
The windstorm of 11-12 January 1974 caused extensive damage in the Republic of Ireland
(Keane and Sheahan, 1974). The sustained high winds and extreme gusts uprooted thousands of trees 112
causing severe disruption to transport as a result of blocked roads and railway lines. There was
widespread damage to buildings, especially to roofs, chimneys, windows and exposed walls, and 114
three lives were lost. The windstorm caused considerable power and telephone outages with some
electricity supplies taking a week to be restored. At the time, the Irish Electricity Supply Board, 116
established in 1927, described the storm as the “worst disaster in the history of the Board”. Sixty
percent of the Electricity Supply Board’s damage bill occurred in the south-western and southern 118
counties of Kerry, Cork, Limerick, and Waterford, where the greatest mean wind speeds were
recorded. The storm damage was exacerbated by storm surge in some coastal areas. 120
In contrast to the widespread damage that occurred in the Republic of Ireland during this
windstorm, there are few reports of significant damage in Northern Ireland or in other areas of the 122
UK other than the less severe damage levels expected from a storm whose peak gusts reached 60-70
kn. However, a gust of 114 kn was measured during the event at Great Dun Fell, an exposed high-124
level site (847 m elevation) in the Pennines (Met Office, 1974b).
126
Surface wind observations
Wind gusts during the 11-12 January 1974 windstorm are examined here for the 24 anemometer sites 128
shown in Figure 2. These stations comprise the 15 Met Éireann stations whose storm maximum gusts
are reported by Keane and Sheahan (1974), five of which experienced new gust speed records to that 130
5
date, and nine Met Office/UK stations, namely Kilkeel and the eight stations located closest to
Kilkeel in Northern Ireland and bordering the Irish Sea. The UK station data come from the Met 132
Office Integrated Data Archive System (MIDAS) (Met Office, 2012) and consist of hourly mean
winds and hourly peak gusts. 134
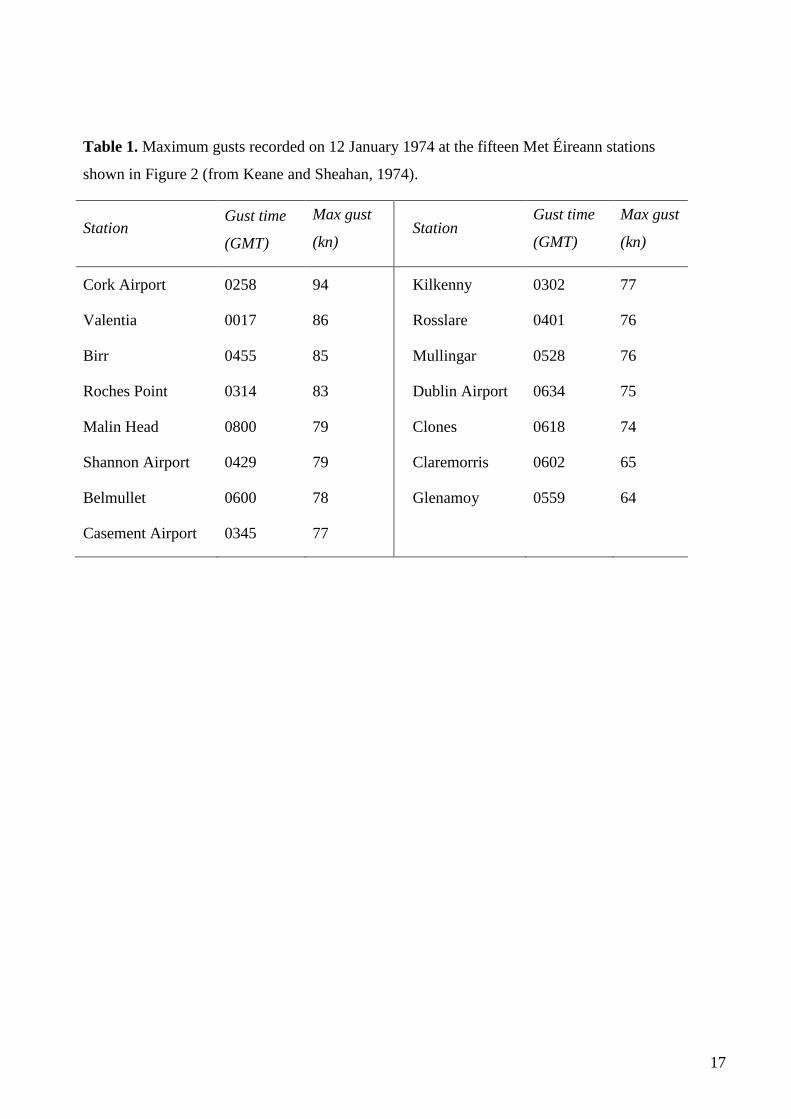
Table 1 sets out the maximum recorded gusts at the Met Éireann stations. The two highest gusts
during the storm were 94 kn at Cork Airport and 86 kn at Valentia. Both sites are located in south-136
west Ireland (Figure 2). The stations located in eastern Ireland (Casement Airport, Dublin Airport and
Rosslare) that have an exposure and wind fetch similar to that of Kilkeel all recorded maximum gusts 138
between 75 and 77 kn, some 30 kn lower than the reported 108 kn gust at Kilkeel.
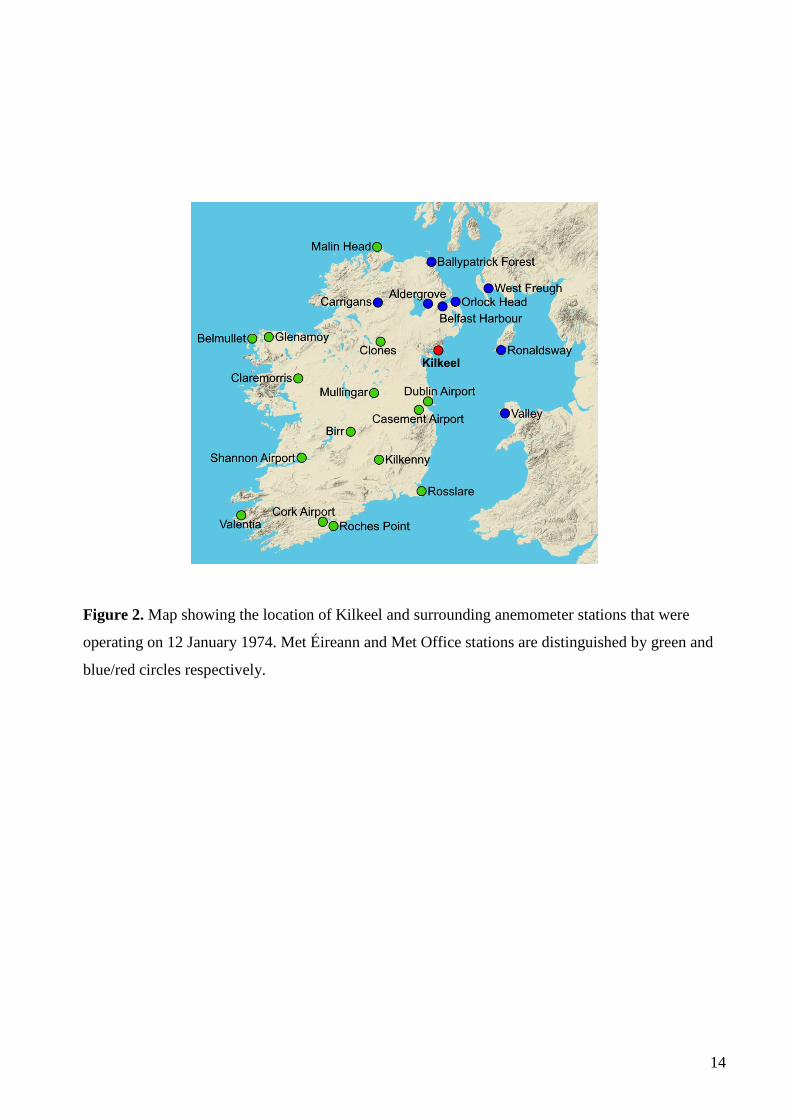
Figure 3 compares the hourly mean wind speeds and hourly maximum gusts recorded at Kilkeel 140
with the same wind parameters recorded at the nearest eight Met Office stations for the 24 hour
period centred on the Kilkeel gust event. All nine sites show similar profiles in hourly mean wind 142
(Figure 3a) and hourly maximum gust (Figure 3b). For the hour ending 0600 GMT, the hourly mean
wind speed at Kilkeel (53 kn) was slightly higher than at any other station, although at Valley on 144
Anglesey (Figure 2) the hourly mean was very similar (51 kn). With the exception of the 108 kn gust
in question, Figure 3b shows that the hourly maximum gust speeds at Kilkeel were in line with those 146
at the other stations.
148
Kilkeel anemogram
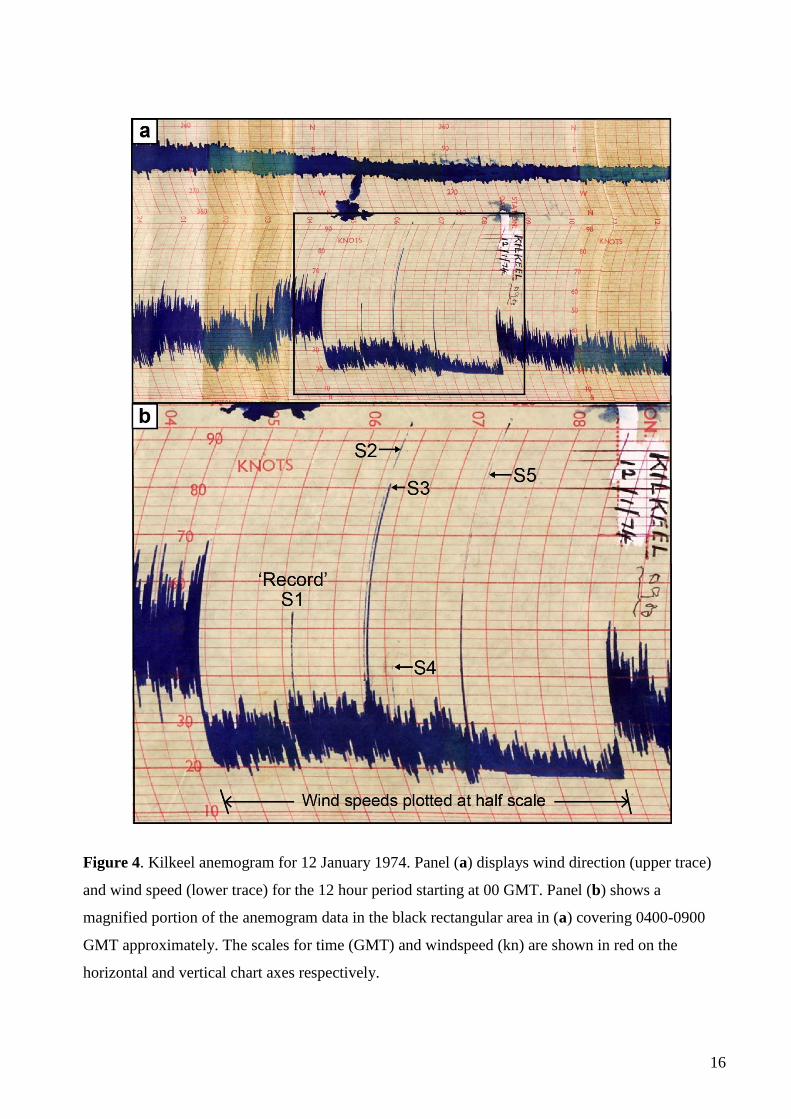
The original anemogram for the Kilkeel record wind gust is shown in Figure 4. The extreme gust 150
spike identified as the 108 kn record wind gust is marked as ‘Record S1’ and is clearest in the
magnified anemogram portion in Figure 4b 1. It is believed that this anemometer was equipped with 152
an automatic range-change device designed to trigger the chart recorder pen to record at half scale
once the wind speed exceeded 70 kn. The half-scale device required manual resetting in order to 154
return to the default scale (Met Office, 1981). It should be noted when interpreting the anemogram
that this half-scale device was in operation between approximately 0440 and 0840 GMT, evident 156
from the apparent halving in wind speed at ~0440 GMT and from the abrupt doubling in wind speed
at ~0840 GMT: the switch to half-scale recording appears to have been triggered automatically by a 158
gust of 69 kn, while the return to full-scale recording appears to have resulted from a manual reset by
the observer on duty. 160
1 As the response time of the instrument in use at the time is unknown, it is impossible to state whether the gusts recorded
on the Kilkeel anemograph correspond directly to the current WMO gust definition of the 3 second moving average wind
speed (WMO, 2014), or to a longer period average. If the latter was the case, then the equivalent 3 second gusts would be
higher than the spikes evident on the Kilkeel anemograph.
6
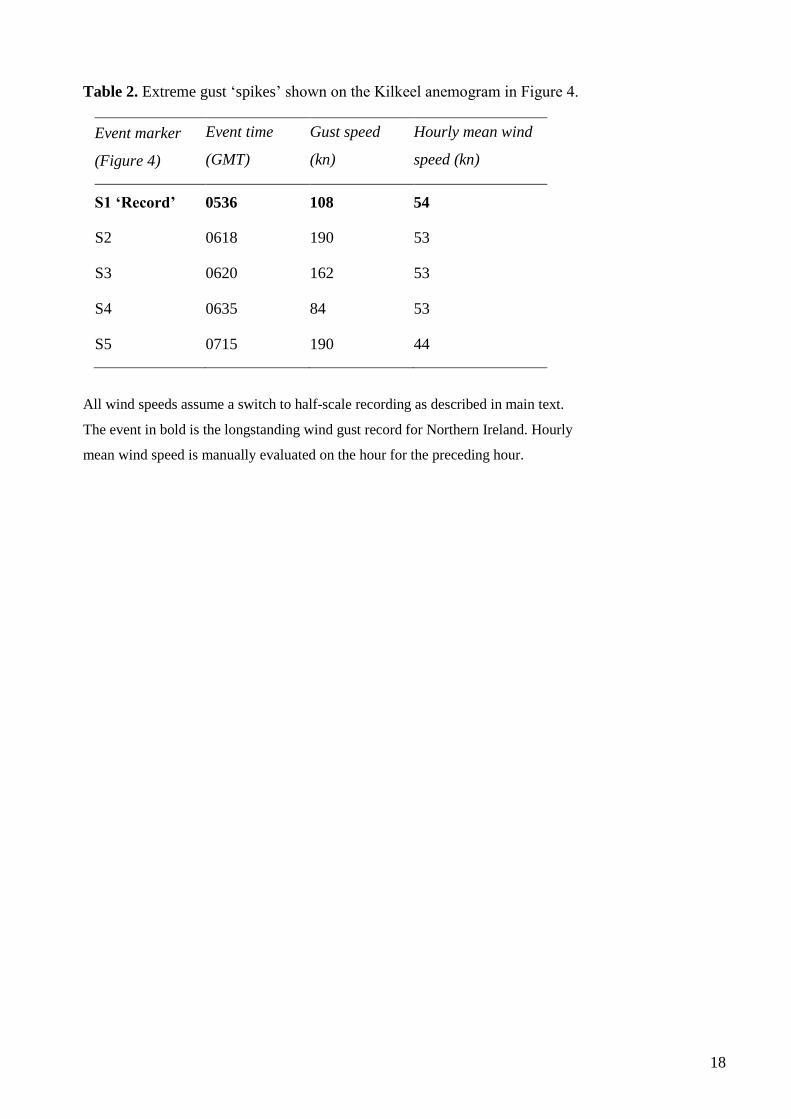
Inspection of Figure 4 shows that during the period when the instrument was in ‘half-scale’
mode, five extreme spikes occur on the wind speed record. We mark these spikes as S1 to S5 on the 162
enlarged portion of the anemograph trace in Figure 4b and provide the times and gust speeds for these
spikes in Table 2. The 108 kn and 84 kn lines (spikes S1 and S4) were accepted as legitimate gusts in 164
the MIDAS dataset (Met Office, 2012), and remain so, but the other spikes were not. If these five
anomalous spikes are discounted, the next highest recorded gust is 78 kn at 0619 GMT. 166
The five anomalous gust spikes in Figure 4 and Table 2 appear very similar in nature. All occur
suddenly and in isolation to any similar strength gust. This behaviour seems unnatural and out of 168
character with the other Kilkeel gust data in Figure 4. Furthermore, none of the spikes is associated
with any change in wind direction as might be expected to occur at a sharp gust front. As the three 170
most extreme spikes on the anemogram (S2, S3 and S5, corresponding respectively to gusts of 190,
162 and 190 kn) cannot be genuine gusts, it is reasonable to infer that the two smaller but similar 172
spikes are also spurious.
174
Compilation and assessment of evidence
A further cogent reason for questioning the accuracy of the 108 kn gust at Kilkeel is its vast return 176
period, assessed as being in excess of 1 million years. This return period was deduced by applying the
method of independent storms with a robust peak-over-threshold extreme value analysis to all the 178
Kilkeel hourly gust data from 1969 (Saunders and Lea, 2017). Also telling is that the second-highest
gust recorded at Kilkeel in all other extra-tropical cyclones between 1969 and 2013 was ‘only’ 75 kn, 180
30 per cent lower than the extreme gust in question. Related to this, it is worthwhile to note that, after
discounting the seemingly anomalous spikes on the anemogram in Figure 4, the highest remaining 182
gust of 78 kn on 12 January 1974 would still rank as the highest recorded gust at Kilkeel between
1969 and 2013. 184
Table 3 lists the evidence for and against the veracity of the 108 kn gust at Kilkeel. The three
points in support of the ‘gust’ being genuine are the best reasons that we can offer, but in our opinion 186
all three reasons are weak. The occurrence of high hourly mean winds at Kilkeel is beyond dispute,
although these mean winds were broadly comparable to those experienced elsewhere during the storm 188
in question. In contrast, the maximum gusts recorded at these same sites were considerably lower
than the 108 kn reported from Kilkeel. Similarly, the occurrence of significant storm damage in the 190
Republic of Ireland is simply consistent with the highest storm gusts occurring in the south-west and
south of the country, and is not supportive evidence for a 108 kn gust at Kilkeel. 192
On the other hand, the evidence against the ‘Kilkeel gust’ being genuine is strong and
compelling. The alleged gust is one of five sudden, unnatural and (we submit) spurious gust spikes 194
7
recorded when the Kilkeel anemograph was operating in ‘half-scale’ mode on 12 January 1974. The
three spikes that correspond to gusts of 190 kn (twice) and 162 kn cannot be real, as they far exceed 196
both the current UK record low-level gust speed (123 kn, at Fraserburgh, Scotland, on 13 February
1989) and the UK record high-level gust speed (150 kn, on Cairngorm Summit, 1245 m elevation, on 198
20 March 1986) (Met Office, 2019a). Since the alleged 108 kn gust is very similar in nature to other
clearly spurious ‘gust’ events on the Kilkeel anemograph record it too is unlikely to be genuine. This 200
direct anemograph evidence combined with strong indirect supporting evidence — namely the
absence of reports of storm damage near Kilkeel compatible with gusts in excess of 100 kn, and the 202
vast return period for the alleged record gust — leave little doubt that Northern Ireland’s longstanding
record wind gust is incorrect. 204
Discussion 206
What may have caused the sudden spurious gust spikes on the Kilkeel anemograph? Two possible
explanations are that they arose either from an instrumental error or from brief surges in electrical 208
power. The latter is realistic because the severe windstorm caused much disruption to power supplies
across the Republic of Ireland (Keane and Sheahan, 1974). Since the Kilkeel anemograph record was 210
electrical (rotation of the anemometer cups generating a voltage proportional to wind speed), the
travel of the pen on the paper chart may have been susceptible to fluctuations in the mains electricity 212
supply. External voltage surges can arise when power lines are brought down or, more commonly,
when lightning strikes nearby electrical circuits leading to overhead power cables receiving a brief 214
electrical spike. Although thunderstorms and lightning are rare in Northern Ireland in winter, Keane
and Sheahan (1974) report that some cattle were killed by lightning during the 11-12 January 1974 216
windstorm, so there is evidence that thundery activity did occur during the event in question.
Furthermore, Geurts (1975) reports the presence of considerable thundery activity on the cold front of 218
the preceding depression which affected the British Isles on 11 January 1974, a day earlier.
Finally we note that, at the time of writing, all the current UK national (Scotland, Northern 220
Ireland, Wales and England) records for low-level gust speed were set between 1969 and 1989 during
the initial 21 years of digitized UK windspeed data (Met Office, 2019a). In contrast, no national 222
record has occurred during the subsequent 29 year period between 1990 and 2018, despite the greater
coverage by operational recording anemometers following automation of the Met Office station 224
network (Green, 2010) and the occurrence of frequent winter windstorms including, recently, the
stormy winter of 2013/14 (Kendon and McCarthy, 2015). Unless the intensity of windstorms 226
resulting from intense extratropical cyclones affecting the British Isles has decreased since the 1970s
and 1980s, the lack of entries appears odd to say the least, and raises questions about the veracity of 228
8
other longstanding UK national record gust speeds. Indeed while performing our analysis of the
Kilkeel ‘record’ gust we re-examined two further UK national current record gust events, and found 230
that the veracity of both is open to question. One event is a gust spike that resembles the Kilkeel
anomalous gust spikes in appearance. The second event is ambiguous due to uncertainty about the 232
change in windspeed scale. Both events have vast return periods assessed as being at least 100,000
years, and neither event appears associated with damage that is compatible with the reported gust 234
levels.
236
Conclusion and recommendation
The evidence presented herein clearly shows that the longstanding ‘record’ 108 kn gust at Kilkeel on 238
12 January 1974 was almost certainly not a genuine gust, that the anemograph record was probably
affected by spikes in the electricity supply during the windstorm, and that the ‘true’ highest gust was 240
78 kn. Five potential power surges can be seen on the anemogram with two of these corresponding to
gusts of 190 kn. The anemogram spike corresponding to the 108 kn gust is very similar in nature to 242
the four other anomalous spikes and is thus deemed untrustworthy. Furthermore there are no reports
of storm damage in Kilkeel compatible with a gust as high as 108 kn, while the return period for such 244
a gust has been assessed at over 1 million years.
Our research findings imply that other longstanding UK record wind gusts should also be 246
independently re-examined to assess their veracity. To enable this, we recommend that an
independent expert committee be appointed to examine, adjudicate upon and publish the official 248
record values for all UK national and regional weather and climate extremes, including but not
restricted to wind speed. This committee would have terms of operation similar to that of the WMO 250
Global Archive of Weather and Climate Extremes (Purevjav et al., 2015) and of the National Climate
Extremes Committee in the United States (Cerveny et al., 2007). Independent assessment of UK 252
extreme weather records is particularly relevant for record gusts because these records are long-
standing and there remain unresolved questions concerning the homogeneity of wind speed records 254
made by older anemometer instruments (Smith, 1981; Miller et al., 2013; Cook, 2014). The creation
of an independent weather and climate extremes committee in the UK would ensure the validity and 256
reliability of extremes by collecting and assessing all the available evidence before such extremes are
published in ‘official’ listings, and act to ensure permanent and secure archiving of all documentation 258
related to the event.
260
Acknowledgements and authors’ contributions
9
The authors are most grateful to Mark Beswick and Catherine Ross at the National Meteorological 262
Library and Archive, and to the Public Record Office of Northern Ireland, for sourcing and providing
the Kilkeel anemogram in Figure 4. We also thank Mark Beswick for his assistance in providing high 264
quality charts for Figure 1. We thank Adam Lea at UCL for his help in preparing publication quality
figures. 266
This article arises from work conducted by Lucy Aylott during an MSc dissertation at the
University of Reading, supervised by Stephen Burt and Mark Saunders, that examined the nature and 268
veracity of several UK record extreme gusts including the Kilkeel event. This project was conceived
by Mark Saunders. All authors have contributed equally to the content of this article. 270
References 272
Beljaars, ACM, 1987. The influence on sampling and filtering on measured wind gusts. Journal of
Oceanic and Atmospheric Technology, 4: 613-626. https://doi.org/10.1175/1520-274
0426(1987)004<0613:TIOSAF>2.0.CO;2
Blackmore P, Tsokri E. 2004. Windstorm damage to buildings and structures in the UK during 276
2002. Weather, 59: 336-339. https://doi.org/10.1256/wea.230.03
278
Burt S. 2012. The Weather Observer’s Handbook. Cambridge University Press. 456 pp.
280
Cerveny RS, Lawrimore J, Edwards R, Landsea, C. 2007. Extreme weather records: compilation,
adjudication, and publication. Bull. Amer. Meteor. Soc.. 88: 853-860. https://doi.org/10.1175/BAMS-282
88-6-853
284
Cook NJ. 2014. Review of errors in archived wind data. Weather, 69: 72-78.
https://doi.org/10.1002/wea.2148 286
Department for Transport. 2014. Transport resilience review: a review of the resilience of the 288
transport network to extreme weather events. Crown copyright. Available from
https://www.gov.uk/government/publications/transport-resilience-review-recommendations (accessed 290
25 February 2019).
292
Eden P. 2008. Great British Weather Disasters. Continuum. London. 351pp.
294
10
Geurts H. 1975. A thundery cold front in January 1974. Weather, 30: 127-129.
https://doi.org/10.1002/j.1477-8696.1975.tb03349.x 296
Green, A. 2010. From Observations to Forecasts – Part 7. A new meteorological monitoring system 298
for the United Kingdom's Met Office. Weather, 65: 272–277. https://doi: 10.1002/wea.649
300
Hewston R, Dorling SR. 2011. An analysis of observed daily maximum wind gusts in the UK. J.
Wind Eng. Ind. Aerodyn.. 99: 845-856. https://doi.org/10.1016/j.jweia.2011.06.004 302
Keane T, Sheahan MF. 1974. Storms of January 1974. Met Éireann internal memorandum 79/74, 304
20pp. Available from https://www.met.ie/cms/assets/uploads/2017/08/Jan1974_Storm.pdf (accessed
5 February 2019). 306
Kendon M, McCarthy M. 2015. The UK’s wet and stormy winter of 2013/2014. Weather, 70: 40-308
47. https://doi.org/10.1002/wea.2465
310
Lamb HH. 1991. Historic Storms of the North Sea, British Isles and Northwest Europe. Cambridge
University Press, 204pp. 312
Met Office. 1974a. Daily Weather Report, January 1974. Available from 314
https://digital.nmla.metoffice.gov.uk/digitalFile_e161b0ba-6258-4802-bc6e-8489f3da1051/ (accessed
5 February 2019]. 316
Met Office. 1974b. Monthly Weather Report, January 1974. Available from 318
https://digital.nmla.metoffice.gov.uk/file/sdb%3AdigitalFile%7C8a52e819-224a-49db-9fce-
0814091514a6/ (accessed 5 February 2019]. 320
Met Office. 1981. Handbook of Meteorological Instruments, Vol. 4, Measurement of Surface Wind. 322
2nd ed. Her Majesty’s Stationery Office, London.
324
Met Office. 2012. Met Office Integrated Data Archive System (MIDAS) land and marine surface
stations data (1853-current). NCAS British Atmospheric Data Centre, accessed on multiple dates 326
between 2012 and 2016. http://catalogue.ceda.ac.uk/uuid/220a65615218d5c9cc9e4785a3234bd0
(accessed 22 February 2019). 328
https://digital.nmla.metoffice.gov.uk/file/sdb%3AdigitalFile%7C8a52e819-224a-49db-9fce-0814091514a6/
11
Met Office. 2019a. UK climate – Extremes. Highest gust speed records by country and district (low-330
level sites). Available from: https://www.metoffice.gov.uk/public/weather/climate-
extremes/#?tab=climateExtremes (accessed 22 February 2019). 332
Met Office. 2019b. Met Office Surface Data Users Guide. Available from 334
https://artefacts.ceda.ac.uk/badc_datadocs/ukmo-midas/ukmo_guide.html (accessed 11 April 2019).
336
Miller C, Holmes J, Henderson D, Ginger J, Morrison M. 2013. The response of the Dines
anemometer to gusts and comparisons with cup anemometers. J. Atmos. Oceanic Technol., 30: 1320-338
1336. https://doi.org/10.1175/JTECH-D-12-00109.1
340
Palutikof JP, Holt T, Skellern A. 1997. Wind: Resource and Hazard, Chapter 11 in Hulme M and
Barrow E (eds.) Climates of the British Isles: Present, Past and Future. Routledge, London. 342
Palutikof JP, Brabson BB, Lister DH, Adcock ST. 1999. A review of methods to calculate extreme 344
wind speeds. Meteorol. Appl.. 6: 119-132. https://doi.org/10.1017/S1350482799001103.
346
Pike WS. 1989: One hundred years of the Dines pressure-tube anemometer. Meteorol. Mag., 118:
209-214. 348
Prahl BF, Rybski D, Burghoff O, Kropp JP. 2015. Comparison of storm damage functions and 350
their performance. Nat. Hazards Earth Syst. Sci., 15: 769-788. https://doi.org/10.5194/nhess-15-769-
2015. 352
Purevjav G and Coauthors. 2015. The Tosontsengel Mongolia world record sea-level pressure 354
extreme: spatial analysis of elevation bias in adjustment-to-sea-level pressures. Int. J. Climatol., 35:
2968-2977. https://doi.org/10.1002/joc.4186 356
Sanders F, Gyakum JR. 1980. Synoptic-dynamic climatology of the “bomb”. Mon. Wea. Rev., 108: 358
1589-1606. https://doi.org/10.1175/1520-0493(1980)108<1589:SDCOT>2.0.CO;2
360

12
Saunders MA, Lea AS. 2017. Methodology for computation of UK windstorm gust return levels on
a high spatial resolution (100 m) grid. UCL Department of Space & Climate Physics report version 362
1.4, 6pp. http://discovery.ucl.ac.uk/10071923 (accessed 8 April 2019).
364
Shellard HC. 1976. Wind, Chapter 3 in Chandler TJ and Gregory S (eds.) The Climate of the British
Isles. Longman Press Ltd, London and New York. 366
Smith SG, 1981. Comparison of wind speeds recorded by pressure-tube and Meteorological Office 368
electrical cup generator anemographs. Meteorol. Mag., 110: 288-301.
370
World Meteorological Organization (WMO), 1987. The Measurement of Gustiness at Routine
Wind Stations: A Review (ACM Beljaars). Instruments and Observing Methods Report No. 31. 372
Geneva.
374
World Meteorological Organization (WMO), 2014. WMO No.8 - Guide to Meteorological
Instruments and Methods of Observation (CIMO guide) (Updated version, May 2017). Geneva, 1139 376
pp.
13
Figures and captions
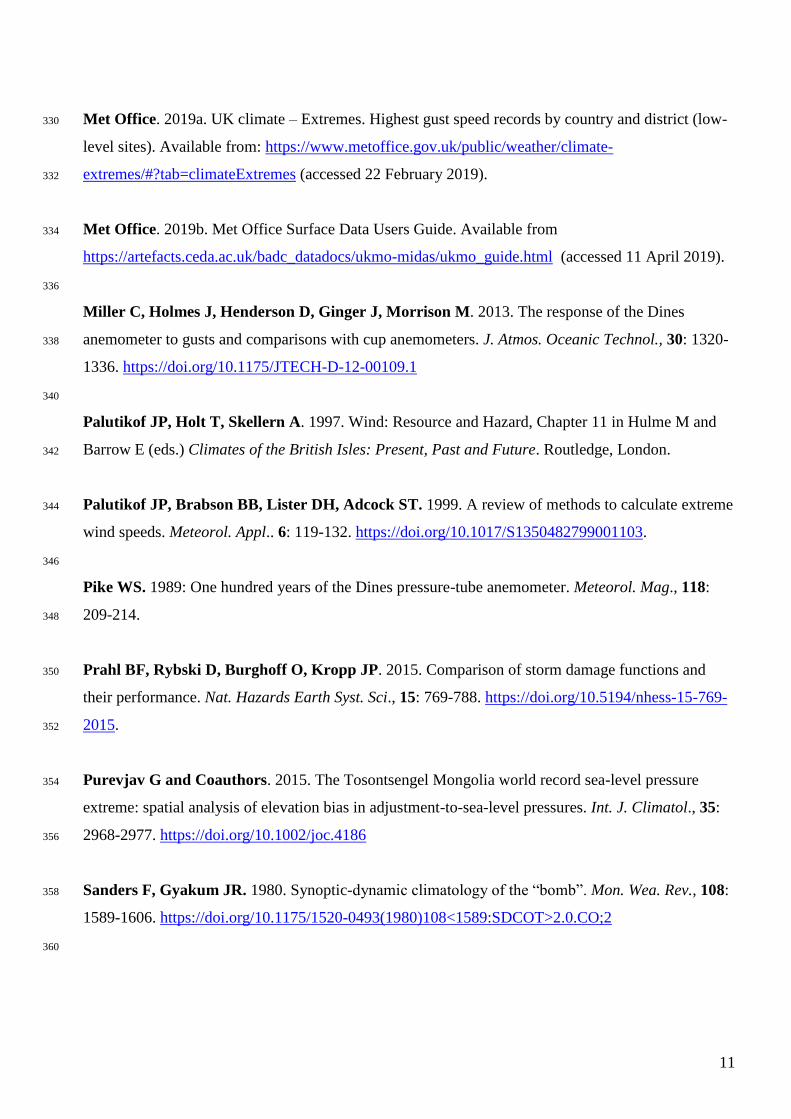
Figure 1. Charts of mean sea level pressure and surface observations around the time of the Kilkeel
gust event. The panels display synoptic data centred on Northern Ireland at six hour intervals
between (a) 1800 GMT on 11 January 1974 and (d) 1200 GMT on 12 January 1974 (Met Office,
1974a).
14
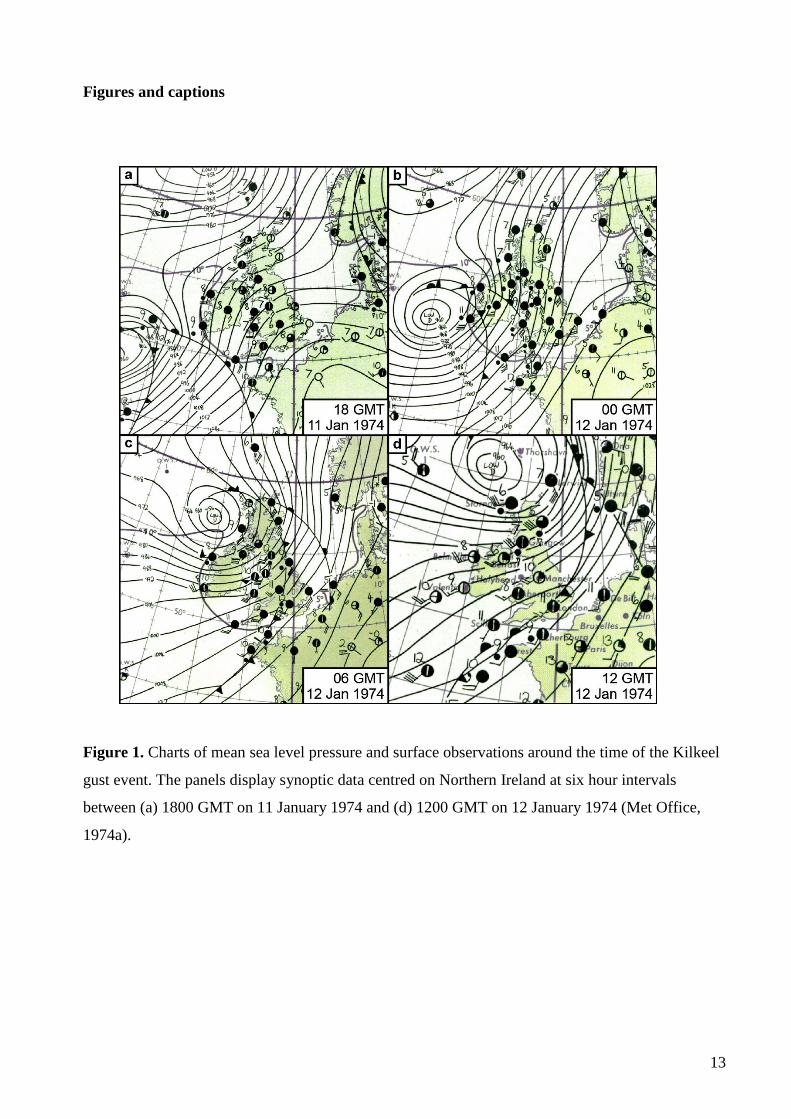
Figure 2. Map showing the location of Kilkeel and surrounding anemometer stations that were
operating on 12 January 1974. Met Éireann and Met Office stations are distinguished by green and
blue/red circles respectively.
15
Figure 3. Comparison of the (a) hourly mean wind speeds and (b) hourly maximum gusts recorded
at Kilkeel and at the eight nearest Met Office stations. Data are shown for the 24 hour period
between hours ending 1800 GMT on 11 January and 1700 GMT on 12 January 1974.
16
Figure 4. Kilkeel anemogram for 12 January 1974. Panel (a) displays wind direction (upper trace)
and wind speed (lower trace) for the 12 hour period starting at 00 GMT. Panel (b) shows a
magnified portion of the anemogram data in the black rectangular area in (a) covering 0400-0900
GMT approximately. The scales for time (GMT) and windspeed (kn) are shown in red on the
horizontal and vertical chart axes respectively.
17
Table 1. Maximum gusts recorded on 12 January 1974 at the fifteen Met Éireann stations
shown in Figure 2 (from Keane and Sheahan, 1974).
Station Gust time
(GMT)
Max gust
(kn) Station
Gust time
(GMT)
Max gust
(kn)
Cork Airport 0258 94 Kilkenny 0302 77
Valentia 0017 86 Rosslare 0401 76
Birr 0455 85 Mullingar 0528 76
Roches Point 0314 83 Dublin Airport 0634 75
Malin Head 0800 79 Clones 0618 74
Shannon Airport 0429 79 Claremorris 0602 65
Belmullet 0600 78 Glenamoy 0559 64
Casement Airport 0345 77
18
Table 2. Extreme gust ‘spikes’ shown on the Kilkeel anemogram in Figure 4.
Event marker
(Figure 4)
Event time
(GMT)
Gust speed
(kn)
Hourly mean wind
speed (kn)
S1 ‘Record’ 0536 108 54
S2 0618 190 53
S3 0620 162 53
S4 0635 84 53
S5 0715 190 44
All wind speeds assume a switch to half-scale recording as described in main text.
The event in bold is the longstanding wind gust record for Northern Ireland. Hourly
mean wind speed is manually evaluated on the hour for the preceding hour.
19
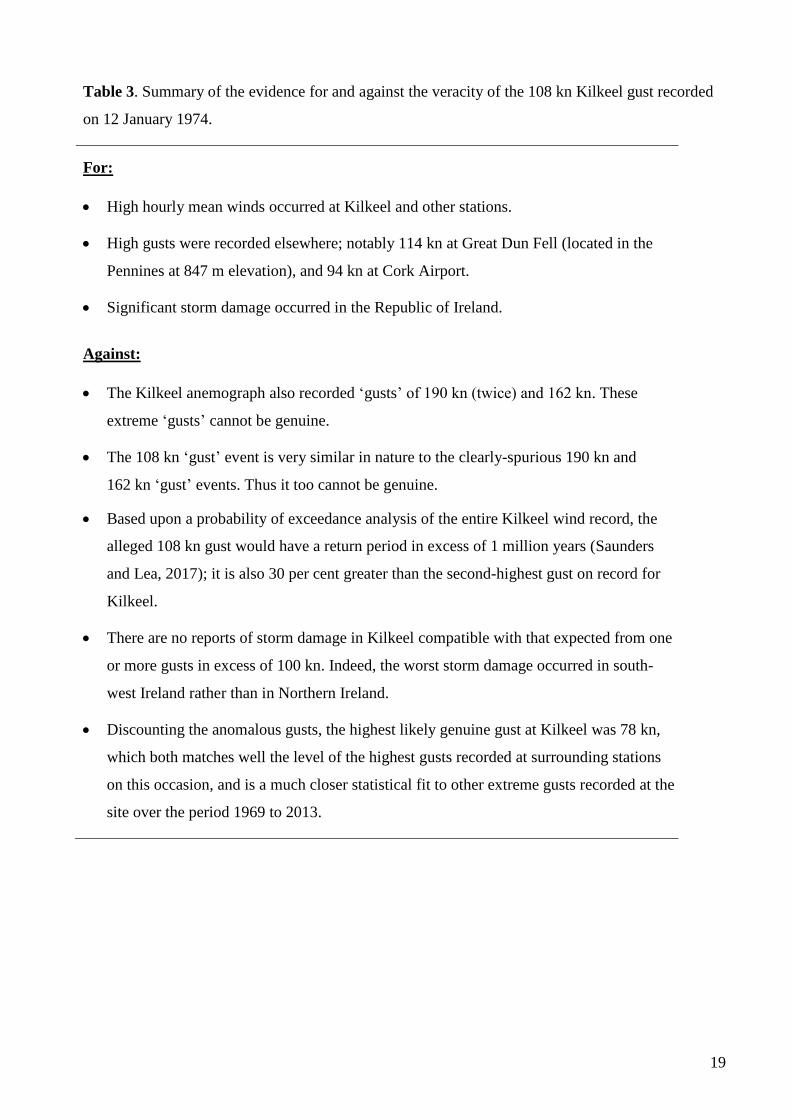
Table 3. Summary of the evidence for and against the veracity of the 108 kn Kilkeel gust recorded
on 12 January 1974.
For:
High hourly mean winds occurred at Kilkeel and other stations.
High gusts were recorded elsewhere; notably 114 kn at Great Dun Fell (located in the
Pennines at 847 m elevation), and 94 kn at Cork Airport.
Significant storm damage occurred in the Republic of Ireland.
Against:
The Kilkeel anemograph also recorded ‘gusts’ of 190 kn (twice) and 162 kn. These
extreme ‘gusts’ cannot be genuine.
The 108 kn ‘gust’ event is very similar in nature to the clearly-spurious 190 kn and
162 kn ‘gust’ events. Thus it too cannot be genuine.
Based upon a probability of exceedance analysis of the entire Kilkeel wind record, the
alleged 108 kn gust would have a return period in excess of 1 million years (Saunders
and Lea, 2017); it is also 30 per cent greater than the second-highest gust on record for
Kilkeel.
There are no reports of storm damage in Kilkeel compatible with that expected from one
or more gusts in excess of 100 kn. Indeed, the worst storm damage occurred in south-
west Ireland rather than in Northern Ireland.
Discounting the anomalous gusts, the highest likely genuine gust at Kilkeel was 78 kn,
which both matches well the level of the highest gusts recorded at surrounding stations
on this occasion, and is a much closer statistical fit to other extreme gusts recorded at the
site over the period 1969 to 2013.