
Ireland’s Competitiveness Scorecard 2015 s Competitiveness... · Ireland’s Competitiveness...
52
Ireland’s Competitiveness Scorecard 2015 July 2015
Transcript of Ireland’s Competitiveness Scorecard 2015 s Competitiveness... · Ireland’s Competitiveness...
Ireland’s Competitiveness Scorecard 2015 July 2015

1 July 2015
2 July 2015
Introduction to the National Competitiveness Council
The National Competitiveness Council reports to the Taoiseach and the Government, through the Minister for
Jobs, Enterprise and Innovation on key competitiveness issues facing the Irish economy and offers
recommendations on policy actions required to enhance Ireland’s competitive position.
Each year the NCC publishes two annual reports.
Ireland’s Competitiveness Scorecard provides a comprehensive statistical assessment of Ireland's
competitiveness performance.
Ireland’s Competitiveness Challenge uses this information along with the latest research to outline the
main challenges to Ireland’s competitiveness and the policy responses required to meet them.
As part of its work, the NCC also publishes an annual Submission to the Action Plan for Jobs and other papers
on specific competitiveness issues.
The work of the National Competitiveness Council is underpinned by research and analysis undertaken by the
Strategic Policy Division of the Department of Jobs, Enterprise and Innovation.
3 July 2015
National Competitiveness Council Members
Prof Peter Clinch Chair, National Competitiveness Council
Liam Casey Chief Executive Officer, PCH International Ltd.
Kevin Callinan Deputy General Secretary, IMPACT Trade Union
Micheál Collins Senior Research Officer, NERI - Nevin Economic Research Institute
Isolde Goggin Chair, Competition and Consumer Protection Commission
John Herlihy Vice President, International SMB Sales and Head of Google Ireland
Declan Hughes Assistant Secretary, Department of Jobs, Enterprise and Innovation
Danny McCoy Chief Executive Officer, Ibec
Jane Magnier Joint Managing Director, Abbey Tours
Seán O'Driscoll Chairman and Chief Executive Officer, Glen Dimplex Group
Louise Phelan Vice President of Global Operations, Europe Middle East and Africa, PayPal
Heather Reynolds Director, Eishtec
Dave Shanahan Chief Executive, Adagio Ventures Commercialisation Partners
Martin Shanahan Chief Executive, IDA Ireland
Ian Talbot Chief Executive, Chambers Ireland
Siobhán Talbot Group Managing Director, Glanbia
Council Advisers
John Callinan Department of the Taoiseach
Ann Derwin Department of Agriculture, Food and the Marine
Maria Graham Department of Environment, Community and Local Government
Katherine Licken Department of Communications, Energy and Natural Resources
John McCarthy Department of Finance
Deirdre McDonnell Department of Education and Skills
Conan McKenna Department of Justice and Equality
David Moloney Department of Public Expenditure and Reform
Ray O’Leary Department of Transport, Tourism, and Sport
Research and Administration
Adrian Devitt Department of Jobs, Enterprise and Innovation
Conor Hand 23 Kildare Street, Dublin 2
John Maher Tel: 01 6312121
Email: [email protected]
Web: www.competitiveness.ie
4 July 2015
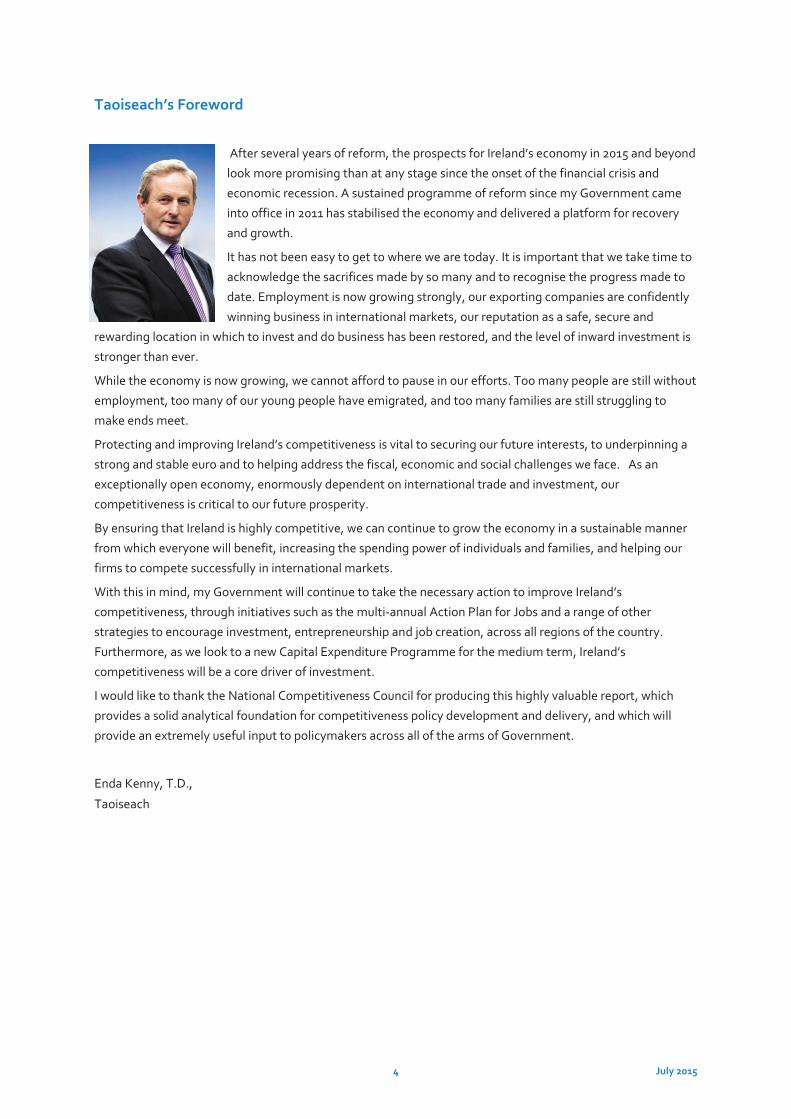
Taoiseach’s Foreword
After several years of reform, the prospects for Ireland’s economy in 2015 and beyond
look more promising than at any stage since the onset of the financial crisis and
economic recession. A sustained programme of reform since my Government came
into office in 2011 has stabilised the economy and delivered a platform for recovery
and growth.
It has not been easy to get to where we are today. It is important that we take time to
acknowledge the sacrifices made by so many and to recognise the progress made to
date. Employment is now growing strongly, our exporting companies are confidently
winning business in international markets, our reputation as a safe, secure and
rewarding location in which to invest and do business has been restored, and the level of inward investment is
stronger than ever.
While the economy is now growing, we cannot afford to pause in our efforts. Too many people are still without
employment, too many of our young people have emigrated, and too many families are still struggling to
make ends meet.
Protecting and improving Ireland’s competitiveness is vital to securing our future interests, to underpinning a
strong and stable euro and to helping address the fiscal, economic and social challenges we face. As an
exceptionally open economy, enormously dependent on international trade and investment, our
competitiveness is critical to our future prosperity.
By ensuring that Ireland is highly competitive, we can continue to grow the economy in a sustainable manner
from which everyone will benefit, increasing the spending power of individuals and families, and helping our
firms to compete successfully in international markets.
With this in mind, my Government will continue to take the necessary action to improve Ireland’s
competitiveness, through initiatives such as the multi-annual Action Plan for Jobs and a range of other
strategies to encourage investment, entrepreneurship and job creation, across all regions of the country.
Furthermore, as we look to a new Capital Expenditure Programme for the medium term, Ireland’s
competitiveness will be a core driver of investment.
I would like to thank the National Competitiveness Council for producing this highly valuable report, which
provides a solid analytical foundation for competitiveness policy development and delivery, and which will
provide an extremely useful input to policymakers across all of the arms of Government.
Enda Kenny, T.D.,
Taoiseach

5 July 2015
Chairman’s Preface
After a traumatic and difficult period of economic adjustment, the Irish economic recovery appears to be becoming more secure. Several quarters of strong economic growth has been translated into significant employment growth, spread across most sectors.
Ireland’s ability to compete in international trade is a key determinant of wages, living standards and financing of social services like health, education and social protection. As a small open economy, Ireland’s ability to achieve sustainable growth is dependent on our ability to maintain international competitiveness. To date, improvements in our competitiveness have been one of the key factors in driving recovery and growth. And yet, there are causes for concern.
There is a clear sense that benign external factors – favourable exchange rates, low energy prices and the weak euro - are boosting Ireland’s international cost competitiveness. While these factors are currently working in our favour, they can be quickly reversed, eroding the gains made to date. They also serve to shield us from some harsh truths: Ireland’s continuing competitiveness is under threat, and indeed, there are indications that pressures are already emerging which are undermining our international ability to compete.
In May 2015, we have seen Ireland’s international competitiveness ranking fall slightly (from 15th to 16th, according to the IMD), after a number of years of steady improvement. While one should not read too much into a change in a single metric, this fall should alert us all to the risks of complacency. Ireland’s recovery remains fragile and too reliant on external factors.
While a small, trade-dependent economy such as ours will always be buffeted by the rise and fall of global markets, ensure that Irish enterprise and the Irish economy are best placed to take advantage of global upturns and to survive global downturns. To achieve sustainable competitiveness, leading to sustainable growth, we must focus on policy areas within the control of domestic policymakers, and relentlessly pursue reforms that allow and assist Irish companies to aggressively compete for market share in the globalised economy. To avoid boom-bust economic cycles, we must deliver the necessary structural reforms required to support competitiveness and growth.
On the costs side, earlier this year the Council pointed out the significant risk that recent competitiveness gains will be eroded as economic growth strengthens. In the Costs of Doing Business in Ireland 2015 report, the Council noted that, relative to some of our key competitors, Ireland remains an expensive location in which to do business. The report highlighted that a number of upward domestic cost pressures are now emerging, particularly in relation to labour, property and business services. In addition, the report highlights the difficulty of achieving further cost reductions against a backdrop of low inflation throughout the EU.
Improved productivity performance offers the best pathway to prosperity. While cost competitiveness is absolutely essential, only productivity growth offers the opportunity over the medium term to grow incomes and employment sustainably. Productivity performance is, therefore, the crucial determinant of Ireland’s international competitiveness.
To achieve the productivity growth necessary to continue Ireland’s recovery, the Council’s analysis has identified a number of policy challenges:
i. There is a need to maintain fiscal stability, ensuring that the State’s finances are prudently managed – this is a crucial element in providing a stable business environment in which enterprise can thrive. A stable and a prudent approach to fiscal policy is also key to ensuring that sufficient public funds are available for investment in productivity-enhancing programmes and infrastructures.
ii. The availability of competitively-priced, world-class infrastructure (energy, telecoms, transport, waste and water) and related services is critical to support economic growth and enterprise development.
6 July 2015
As the country returns to growth, further targeted and prioritised investment and reform is required to address existing and likely infrastructural bottlenecks which could constrain growth in the economy by dampening productivity growth, increasing costs and limiting sectoral opportunities for foreign direct investment (FDI) and indigenous enterprise development. Capital expenditure, however, is not just about physical infrastructure. Investment and growth is increasingly driven by knowledge-based capital – investing in people and R&D must remain a key strategy to improve productivity and competitiveness.
iii. Investment in people is not a new concept – the skills and talent of the work force are essential determinants of labour productivity. Training and upskilling of talent is associated with large increases in both productivity and output. From a national competitiveness perspective it is critical that industrial development and skills policies are adequately aligned and that labour/skills mismatches in the labour market are minimised. Issues relating to labour force participation and participation in lifelong learning also need to be addressed urgently to support competitiveness.
iv. While Irish export performance remains robust, we should not ignore the fact that much of our recent performance is dependent on a relatively small number of sectors selling a narrow range of products into a narrow range of markets. To minimise the adverse consequences from any potential external shocks, there is a need to broaden out into new products, markets and sectors, whilst maintaining the competitive advantages we enjoy in existing ones. We must also look to the domestic market, and ensure that we develop the most supportive environment possible to support entrepreneurship and enterprise development. A range of policy actions are likely to be required in this space, including improving access to finance for enterprise.
v. Finally, the Council’s analysis highlights the importance of innovation as a source of growth. While Ireland’s overall innovation performance has improved in recent years, performance lags innovation leaders such as Denmark, Finland, Germany and Sweden with whom we aspire to compete.
This report provides the evidential base to assist policy makers to identify the key challenges confronting Irish enterprise. The Council will discuss these issues and put forward proposals to address them in its annual policy document Ireland’s Competitiveness Challenge which will be published later this year.
I would like to conclude by thanking the Council members and advisers for their valuable time commitment and helpful contributions throughout the development of this report. I would also like to acknowledge the invaluable work of secretariat in its preparation.
Professor Peter Clinch
Chairman, National Competitiveness Council
7 July 2015
Table of Contents
Taoiseach’s Foreword 4
Chairman’s Preface 5
Chapter 1: Introduction 8
Chapter 2: Sustainable Growth 20
Chapter 3: Essential Conditions 26
Chapter 4: Policy Inputs 37
Appendix One: Note on Methodology 48
8 July 2015
Chapter 1: Introduction
International Competitiveness Rankings
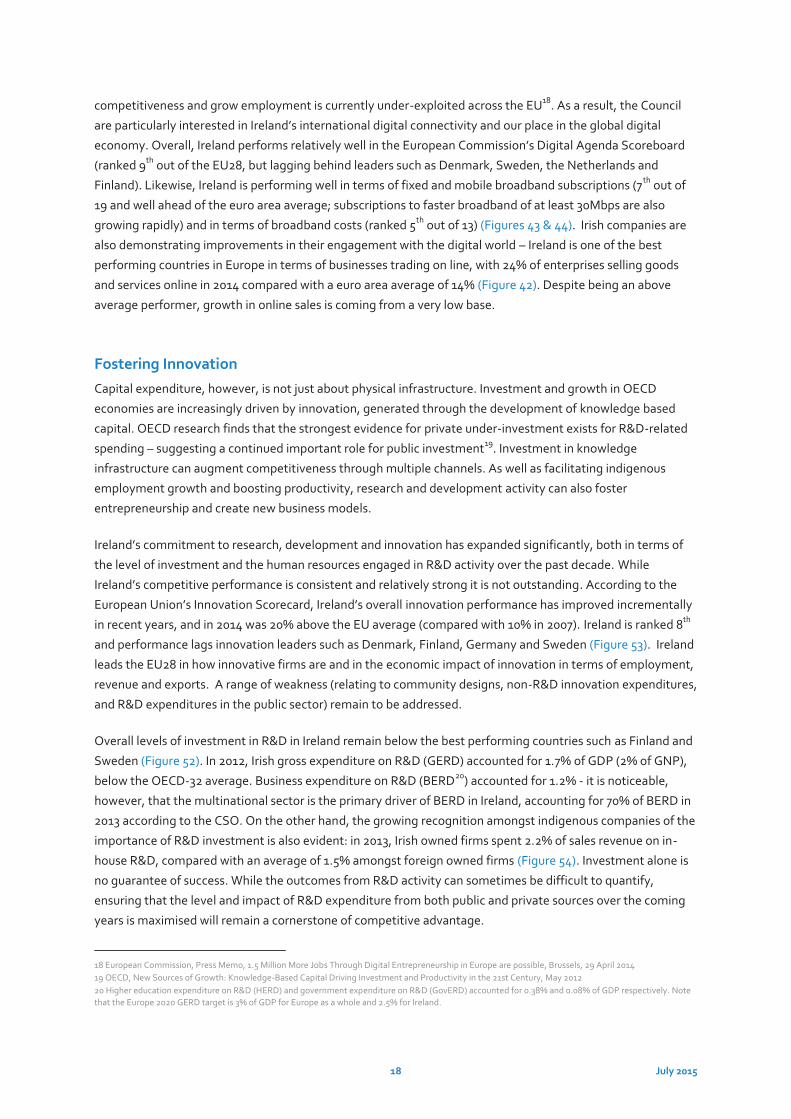
Since 2011, Ireland’s relative international competitiveness as measured by a range of international indices
improved (Figure 1). We have moved from 24th to 16th in the IMD’s World Competitiveness Yearbook and from
29th to 25th in the WEF Global Competitiveness Report. In addition, the World Bank’s most recent “Doing
Business” report shows Ireland is now ranked 13th out of 189 countries, up two places since 2014 (Figure 40).
While welcoming the improvement in Ireland’s rankings over the period 2011-2014, the Council is concerned
that hard won competitiveness gains are at risk of being eroded. International competitiveness is a dynamic
process and competition in the global economy is intense and constant. The IMD’s World Competitiveness
Yearbook published in May 2015, shows that Ireland’s overall competitiveness ranking slipped from 15th in
2014 to 16th in 2015. Ireland’s decline in the IMD can be partially explained as a result of improved performance
amongst some of our key competitors (most notably Luxembourg), emphasising the relative nature of cross
country competitiveness comparisons. While the drop in performance is relatively slight, it serves as a
reminder about Ireland’s vulnerability, the fragile nature of our recovery, and the need to continually focus on
policies to support and enhance competitiveness.
A Return to Growth
Following annual GNP growth of 1.1% and 3.3% in 2012 and 2013 respectively, initial estimates indicate that
the Irish economy is for now the fastest growing economy in Europe with GNP increasing by 5.2% year on year
in 2014, and by 4.8% in GDP terms1. European economic growth resumed in 2014 after two years of negative
performance, euro area growth however was modest at 0.9% GDP with the EU28 growing by 1.4%. From an
Irish perspective, GDP growth in the UK and US of 2.8% and 2.4% respectively is particularly welcome, given
the importance of both countries as export destinations for Irish produced goods and services.
Ireland’s GDP per capita remains well above the euro area average (+24.5%) and is the fourth highest in the
OECD-32 (Figures 2 & 3). In GNP per capita terms, however (a better measure of living standards), the
differential is much narrower (+5%). Although, GDP and GNP are once again increasing, output and incomes
remain approximately 11 per cent below their pre-recession peak. Despite the adverse impact of the recession,
life satisfaction in Ireland (6.8) is above the OECD-32 average (6.7) (Figure 9).
Indeed, the impact of renewed Irish competitiveness and economic growth in our key trading partners is
reflected in Ireland’s buoyant export performance. Services exports, driven by computer sales (both hardware
and software) are increasing strongly and, since 2013, services account for a larger share of exports than goods
(Figure 18). This is evident in Ireland’s increasing share in world services trade (2.7%) and declining share of
merchandise trade (0.6%) (Figure 15). The EU and US accounted for 55% and 22% of total merchandise
exports in 2014, relatively unchanged year on year. Ireland’s current account surplus increased by almost €4
billion in 2014, suggesting that Ireland is now paying its way in the world, and offering the possibility of more
sustainable growth to come (Figure 5). However, the positive current account data must be interpreted with
1 Data refers to the percentage change on the preceding year in GDP volume. See European Commission, European Economy 2/2015, European Economic Forecast, Spring 2015
9 July 2015
caution. Irish export levels must be considered in relation to the performance of foreign owned firms (Figure
19)2
Balanced and Sustainable Growth
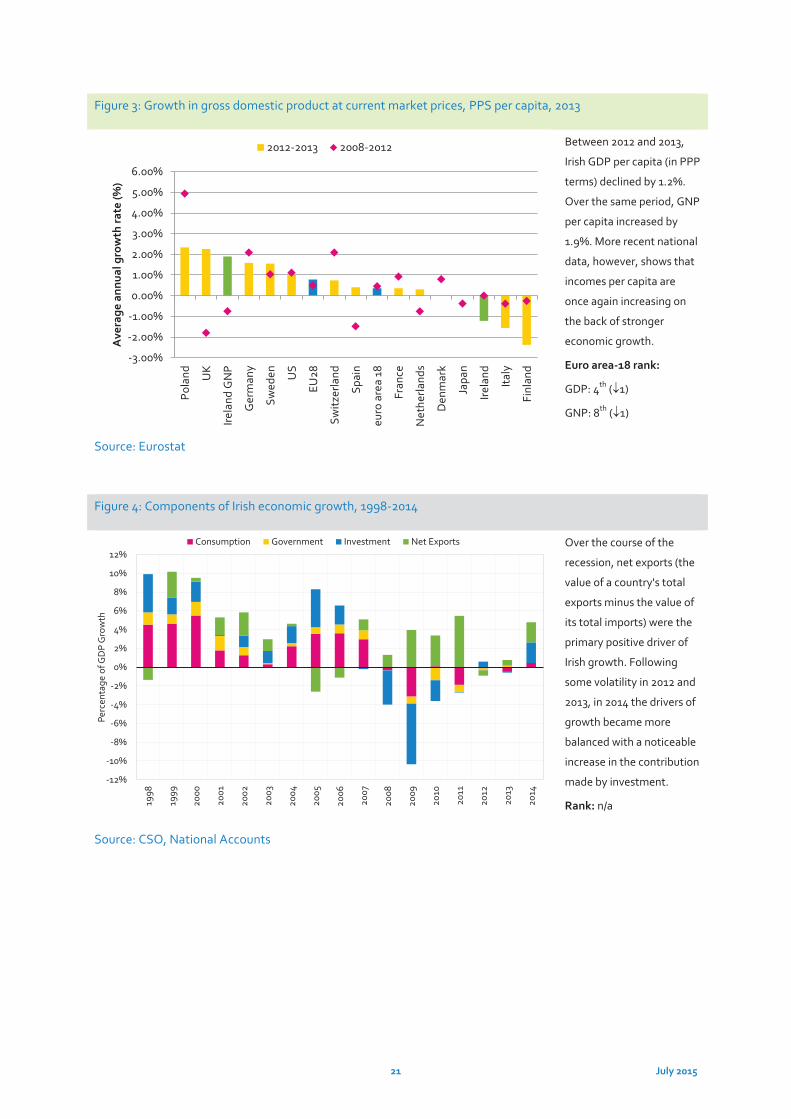
Following some volatility in 2012 and 2013, the drivers of growth became more balanced in 2014 with a
noticeable increase in the contribution made by consumption and investment, albeit from low bases (Figure
4). In 2014 consumption increased by over 1% year on year with retail sales continuing to show modest
growth.
After sharp reductions in investment during the recession, gross fixed capital formation continues to recover,
increasing by 11% in 2014, albeit from a very low base (Figure 12). Irish investment levels in all assets types
almost halved between 2008 and 2013, falling from 22% of GDP to 11.2% of GDP. Over the same period, the
euro area average declined by 18 %. In GNP terms, Irish private investment (17%) mirrors the euro area
average (16.8%), while public investment (1.8%) is significantly below average (2.8%). Inadequate capital
investment, left unaddressed, will choke competitiveness and future economic growth.
Commercial and residential real estate transactions and prices increased in 2014, particularly in Dublin. Likely
as a consequence of increased demand - and hence prices - planning permissions granted for all types of
construction returned to growth and increased by 14% year on year. However, this level remains well below
historic growth trends. New construction output levels also remain significantly below peak and property
supply constraints are emerging. As the market tightens, a sustained shortage of supply of commercial and
residential property and increasing rents and purchase prices could adversely impact competitiveness.
From an international investment perspective, Ireland remains an attractive location, and exhibited a strong
performance in 2014, in terms of both FDI investment levels and employment (Figure 13). Despite intensified
international competition for globally mobile investment, Irish tax rates (on corporations and income) remain
competitive, although the gap between Ireland and OECD countries is narrowing (Figures 33, 34 &35).
Ireland’s stock of inward investment (173% of GDP) remains amongst the highest in the OECD, illustrating the
significant dependence of the economy on FDI: inward FDI flows in 2013 amounted to 16.2% of GDP (Figure
13). Arising out of all of this activity, net employment amongst agency supported foreign owned firms
increased by 7,131 in 2014 and now stands at 174,000.
From an indigenous enterprise perspective, performance was very strong in 2014 and exports from Irish
owned Enterprise Ireland supported firms increased by approximately 10% to €18.6billion. It was also a year of
record employment levels for Enterprise Ireland supported companies, with total direct employment
increasing to 180,072. Year on year, indigenous exports grew across all sectors and international markets.
Irish-owned companies account for 12.2% of total development agency client exports. In export market share
terms, “food and drink”, “traditional manufacturing” and “business services” are the largest indigenous
sectors. While this unprecedented performance is very welcome, maintaining these hard won gains in a global
market where competition for FDI and export share is increasingly intense cannot be taken for granted.
2In recent years, several large MNCs relocated their headquarters to Ireland, in a practice known as re-domiciling. This effect is estimated to add about 4 percentage points to the level of the current account balance. The indication is that the impact of ‘re-domiciled plcs’ on the income balance fell out in 2014, with the impact effectively the same as 2013. See Department of Finance, Ireland’s Stability Programme, Incorporating the Department of Finance’s spring forecasts, April 2015 Update
10 July 2015
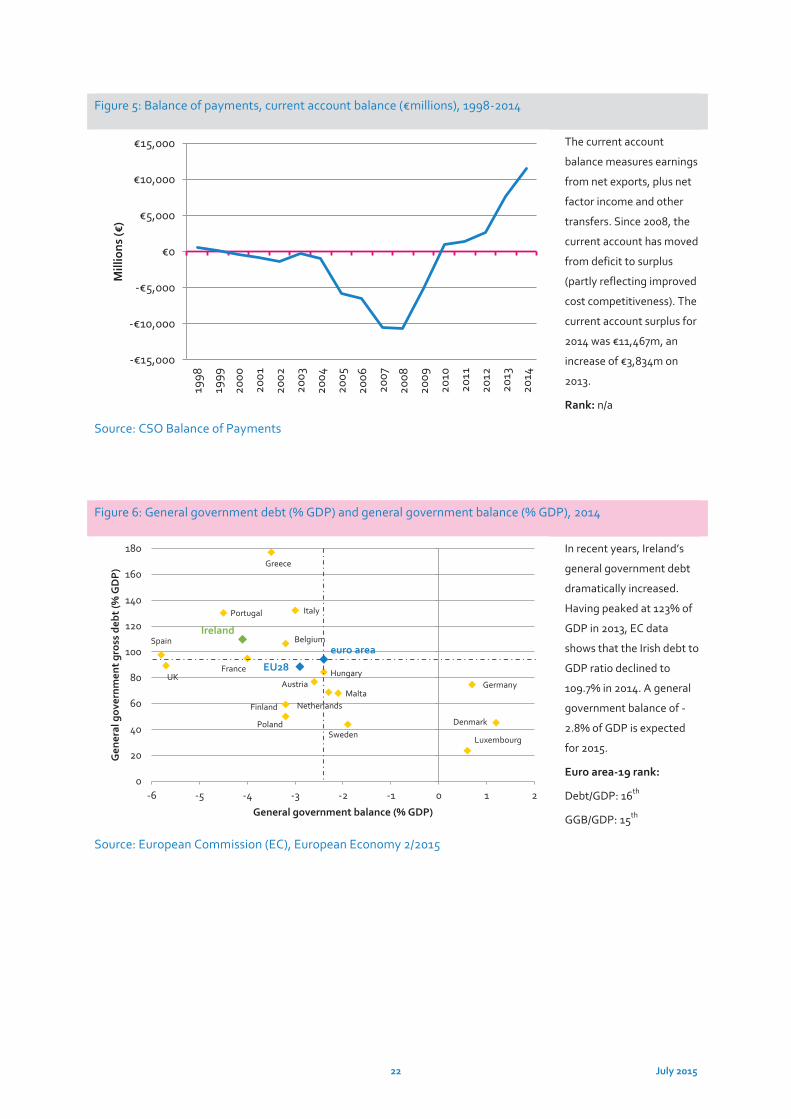
Balanced and Sustainable Public Finances
Economic growth has resulted in significant improvements in the Government finances. While debt levels
remain very high - the Irish debt to GDP ratio has declined from 123.2% of GDP in 2013 to 109.7% in 2014, with
a continued downward trajectory expected over coming years – the general Government deficit subject to
continued discipline, is on course to be eliminated by 20183 (Figure 6). This reflects substantial consolidation
on the expenditure side throughout the recession, as well as more buoyant tax revenues, reflecting
new/increased taxes and the improvement in the economy. The Department of Finance estimate tax revenue
grew by 9.2% in 2014 with significant growth in capital gains, stamp duties, income, VAT and corporation tax
receipts. As a result, a primary general government deficit (i.e. the difference between government revenue
and expenditure excluding interest payments) of 0.1% of GDP is expected for 2014, with a surplus of 0.7%
forecast for 20154.
Stable and sustainable public finances are a prerequisite for competitiveness. Looking out over a longer time
horizon, while Ireland faces a significant challenge to achieve a 60% general government debt to GDP ratio,
the level of fiscal consolidation required will not mirror the level experienced in recent years (Figure 7). The
Council recognises the budgetary challenges of reducing the deficit level while at the same time ensuring that
fiscal policies accommodate sustainable economic growth, investment and employment. Further, the impact
of demographic pressures on the public finances in areas such as health and pensions in the future is
acknowledged. The Council considers that policies which best facilitate and support competitiveness and
growth while minimising the impact of cyclical factors are essential to maintain fiscal stability. Steering an
appropriately balanced course between both revenue and expenditure, (and between current and capital
expenditure), is essential if the State is to have sufficient resources to invest in productivity enhancing
infrastructures and programmes.
Moving beyond the public finances, high levels of indebtedness amongst the business sector (non-financial
corporations) and households continue to impose constraints on investment and consumption (Figure 8).
Likewise the propensity for individuals and firms alike to rebuild their balance sheets (by repaying outstanding
debts, and maintaining relatively high savings rates), while rational, also acts as an impediment to growth.
The levels of non-performing household and business loans remain extremely high. It is positive that the value
of impaired SME loans has been declining slowly in recent quarters- the Central Bank notes that there are
positive signals in relation to arrears workout, particularly with regard to mortgages5. However, the resolution
of non-performing loans (NPLs) by the Banks requires continued focus as the cost of making provisions for
NPLs hinders credit supply to the economy as a whole.
A Need for Jobs-Rich Growth
The impact of Ireland’s improved competitiveness and the return to growth has fed through to the labour
market (Figure 28). Employment has now grown for 3 consecutive years with seasonally adjusted data
showing a 2.1% increase in the year to Q1 2015. By comparison, the European labour market has been sluggish
– employment in the euro area grew by 0.6% in 2014 (Figure 30). From a crisis level low of 1.825 million
employed, in Q1 2012, employment has now rebounded to over 1.9 million. This figure, however, remains
3 See Table 10, Budgetary Projections 2015-2020 in Department of Finance, Stability Programme Update, April 2015 4 According to Department of Finance figures, a General Government Balance of -2.3% of GDP is forecast for 2015, declining to -1.7% of GDP in 2016 and -0.9% in 2017. See Department of Finance, Stability Programme Update, April 2015 5 https://www.centralbank.ie/publications/Documents/Macro-Financial%20Review%202014.2.pdf
11 July 2015
some way short of peak employment of 2.1 million and provides an indication of the scale of the challenge
which still confronts Ireland.
In a break with recent years, in 2014 full time employment accounted for all of the increase in employment in
Ireland – indicating that employers are becoming more confident about the recovery, and that more hours
paid employment are available. Equally importantly, employment growth is spread relatively equally across
the different sectors of the economy. Growth was strongest in construction (7%), professional, scientific and
technical (6%) and accommodation and food service activities (5%). At the same time, unemployment is
noticeably declining. In 2014 unemployment was at 213,000 people – or 114,000 people below peak6. As a
result, the standardised rate of unemployment in Ireland declined from a peak of 15.1% in 2011 to 10.4% in Q4
2014, and to 9.7% in June 2015. The Irish unemployment rate is now well below the euro area average (11.1%
in May 2015).
With strong employment growth, it is likely that labour and skills shortages will increase in the medium term.
Despite a more positive outlook, a number of worrying trends persist. While the number of persons classified
as long-term unemployed decreased by 32,000 (-20.6%) in the year to Q4 2014, long term unemployment
continues to account for approximately 57% of Irish unemployment. At 6.7%, Irish long term unemployment
remains above the euro area average (6.1%) Likewise, the persistence of high rates of youth unemployment in
Ireland is common across the euro area (Figure 29). Youth unemployment in Ireland peaked at 31.1% in June
2012 but had decreased to 23.9% by 2014, marginally above the euro area average.
Interestingly in Ireland, the recession did not result in large scale changes in unemployment differentials
between regions (Figure 31). The differential in unemployment rates across Ireland’s eight regions (15%) is
amongst the lowest in the EU and has not changed significantly since 2009. With the onset of recovery,
employment growth has occurred in most NUTS3 regions; however, employment growth across the Irish
regions has been more uneven than was previously the case and the dispersion of employment rates between
regions increased from 3% in 2008 to 5.1% in 2013.
The Irish labour force participation rate (59.8%) remains below the pre-crisis level (63.8% in Q4 2007), while
the absolute size of the labour force has also decreased from 2.3 million to 2.15 million. This trend has
continued in recent quarters - in the year to Q4 2014, the size of the labour force decreased. CSO data shows
that this negative demographic effect is concentrated amongst 20 to 34 year olds, and is partly attributable to
net outward migration. As a consequence of the recession, emigration returned as a feature of the Irish labour
market in 2009 (Figure 50). Although net emigration in 2014 was at its lowest level since 2009, total net
outward migration remains high at 21,400. More third level qualified people are leaving the country in recent
years than are arriving (Figure 51).
In addition to the social loss associated with emigration, the migratory outflow of skills represents a significant
loss of talent and undermines long term competitiveness. Competition for talent is global and intensifying.
Despite significant increases in graduate numbers, skills shortages are emerging across multiple sectors—
particularly, science, technology, engineering and ICT. Talent is increasingly mobile and Ireland’s ability to
attract and retain talent is necessary to ensure sustainable competitive advantage. The attraction and
retention of talented people will require broadening the policy focus on talent beyond the provision of
6 The upturn in the economy is also reflected in the Live Register, which shows that, in gross terms, over 141,000 people left the live register to take up work during 2014 - an exit rate of 40%, up from 33% in 2012. This degree of churn is an indication of both job creation and destruction, and shows a welcome degree of activity in the Irish labour market.
12 July 2015
education and training, economic migration policies, remuneration and tax policy. While these factors remain
critical, the regulatory, market and social landscapes in a country also facilitate talent attraction and retention.
Quality of life considerations such as ease of mobility, cost of living and personal factors are central to talent
attraction and retention. Social and cultural development and effective city planning as well as the effective
marketing of localities, regions and clusters is increasingly important internationally in attracting and
sustaining talent.
The Outlook and Challenges Ahead
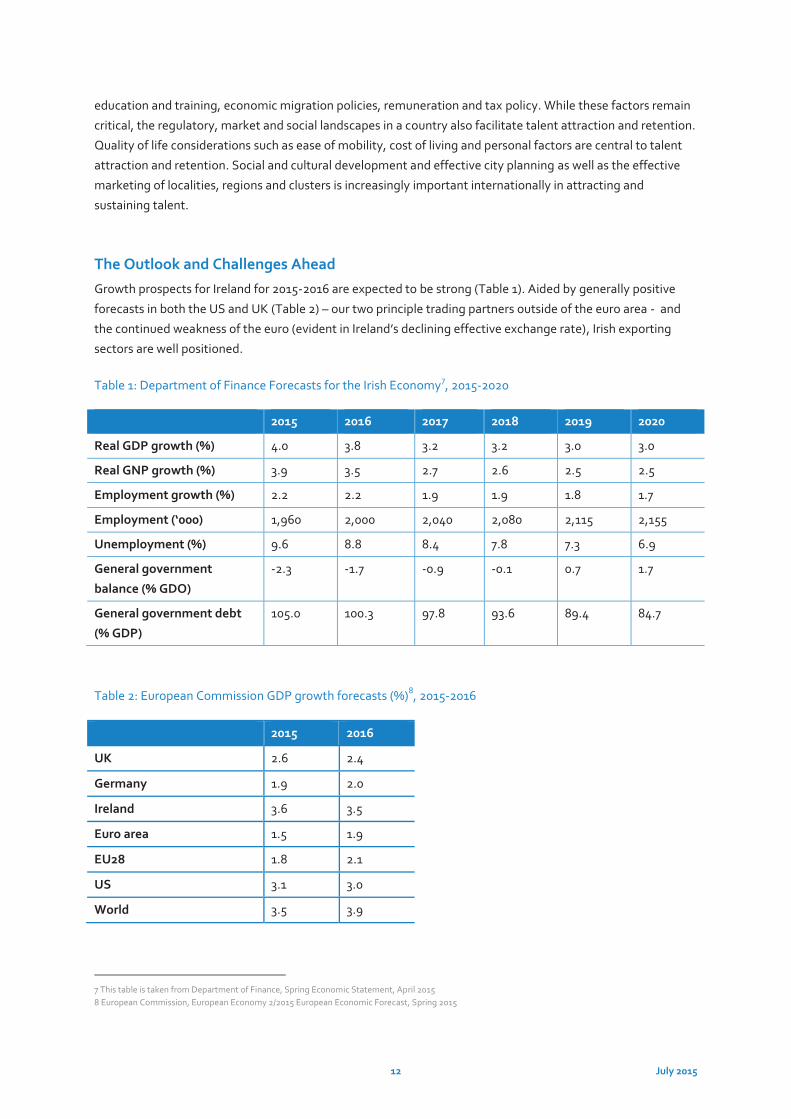
Growth prospects for Ireland for 2015-2016 are expected to be strong (Table 1). Aided by generally positive
forecasts in both the US and UK (Table 2) – our two principle trading partners outside of the euro area - and
the continued weakness of the euro (evident in Ireland’s declining effective exchange rate), Irish exporting
sectors are well positioned.
Table 1: Department of Finance Forecasts for the Irish Economy7, 2015-2020
2015 2016 2017 2018 2019 2020
Real GDP growth (%) 4.0 3.8 3.2 3.2 3.0 3.0
Real GNP growth (%) 3.9 3.5 2.7 2.6 2.5 2.5
Employment growth (%) 2.2 2.2 1.9 1.9 1.8 1.7
Employment (‘000) 1,960 2,000 2,040 2,080 2,115 2,155
Unemployment (%) 9.6 8.8 8.4 7.8 7.3 6.9
General government
balance (% GDO)
-2.3 -1.7 -0.9 -0.1 0.7 1.7
General government debt
(% GDP)
105.0 100.3 97.8 93.6 89.4 84.7
Table 2: European Commission GDP growth forecasts (%)8, 2015-2016
2015 2016
UK 2.6 2.4
Germany 1.9 2.0
Ireland 3.6 3.5
Euro area 1.5 1.9
EU28 1.8 2.1
US 3.1 3.0
World 3.5 3.9
7 This table is taken from Department of Finance, Spring Economic Statement, April 2015 8 European Commission, European Economy 2/2015 European Economic Forecast, Spring 2015
13 July 2015
On the other hand, the ongoing uncertainty in relation to the EU’s economic prospects and the UK’s continued
membership of the EU represent significant downside risks. Nevertheless, the majority of economic indicators
provide a cause for optimism in the short term. The challenge for Ireland is to ensure that the move towards
more balanced growth, with contributions from all sectors of the economy, continues and is robust over the
long term.
If Ireland is to take advantage of the upturn in the global economy however, policy action is required to
address a number of constraints which are currently undermining our competitiveness. Specifically, the
Council believes that to deliver the growth and jobs required to enhance Ireland’s prosperity, a range of issues
must be addressed to enhance productivity, thus improving competitiveness. Most immediately, Ireland’s
international competitiveness reflects our cost competitiveness vis-à-vis our competitors and trading partners.
Costs, therefore, continue to be a major focus for the Council. In the medium term, however, productivity
improvements must be the primary driver of Irish competitiveness. The challenges in improving the quantity
and quality of human and productive capital, and enhancing total factor productivity (through technological
change, innovation and the application of competition policy) are significant but key to achieving sustainable
competitiveness resulting in economic growth, jobs and improved living standards. These challenges are
considered below.
Costs
The Council recently published its 2015 Cost of Doing Business in Ireland report. This report (summarised in
Figure 27) notes that Ireland’s cost base improved considerably in the period 2009-2014. This has made Irish
firms more competitive internationally, and makes Ireland a more attractive location for firms to base
operations. Increasingly, however, improvements in relative cost competitiveness have been driven by
external factors beyond domestic policy control – in particular, the weak euro and low international fuel prices
are the primary factors contributing to Ireland’s cost competitiveness (Figure 24). Ireland cannot rely on
benign external factors to maintain competitiveness, and furthermore, there are significant risks that recent
gains will be eroded as economic growth strengthens.
Despite the improvements achieved during the recession, Ireland remains a high cost location. In 2013, Ireland
was the 3rd most expensive location in the euro area for consumer goods and services (Figure 22). Price levels
were 16.8% above the euro area-18, and costs relative to national income (GNP) remain particularly high
compared to the euro area average. From an enterprise perspective, in Q3 2014, business service prices were
6.5% above 2010 levels. Upward cost pressures are already emerging in Ireland, particularly in relation to
labour, property, insurance and education, as well as a range of business services. In relation to labour costs,
the concern is not that incomes are growing, but rather the extent to which these increases are supported by
productivity (see Figure 26 and below).
The Costs report also highlighted the difficulty of achieving further cost reductions against a backdrop of low
inflation throughout the EU9, and the significant risk that recent competitiveness gains will be eroded as
economic growth strengthens and inflationary pressures begin to emerge. It is imperative, therefore, that Irish
economic policies continue to be considered in terms of their impact on competitiveness and do not
unnecessarily result in cost increases.
9 Europe, in recent years, has been characterised by low inflation – inflation of 0.4% was recorded in 2014, well below the ECB’s price stability target range.
14 July 2015
Human Capital: Enhancing Employability and Skills
The Labour Market
Addressing weaknesses in Ireland’s labour market will remain a key priority and necessity for years to come.
As well as ensuring that companies are in the optimum position to grow and create employment, there is a
need to continue to target the most challenging parts of the labour market and to assist the most vulnerable
members of society. The issue of youth and long term unemployment have already been highlighted above.
There is also a need to address low levels of female labour force participation in Ireland (52.4% in Q1 2015)
which remain well below the euro area average. Ireland has the fourth lowest female participation rate in the
euro area.
In addressing these issues, it is important that all of the factors impacting upon participation and the take up
of employment are carefully considered. For instance, issues such as childcare costs, replacement rates, and
levels of personal taxation are factors which influence labour market outcomes. Childcare costs in Ireland are
among the highest in the OECD, and represent a major disincentive to work for lone parents, or parents
seeking to return to work. In this regard, the replacement rate also plays a role in shaping the incentive to work
for individuals (Figure 32). At present, replacement rates are significantly higher for lower income families in
Ireland (i.e. those earning 67% of the average wage), than other OECD countries. Replacement rates, bands
and thresholds for income tax have a direct impact on the labour market. Currently, the gap between what the
employer pays and what a single employee earning 100% of the average wage receives has increased from
24.7% in 2009 to 28.2% in 2014 (Figures 34 & 35). However, this is still significantly below the OECD average of
35.7%. Generally, marginal tax rates in Ireland are lower for families with children than for single people.
Attracting talent home is also an emerging issue. Marginal tax rates for higher earning and internationally
mobile workers are less competitive.
At a broad level, as recovery deepens, policy makers must be cognisant of the interdependency of the taxation
system, social welfare and replacement rates, and the impact that policy changes can have on labour market
participation.
Skills and Talent
Productivity growth is the preferred mechanism to drive competitiveness in the medium to longer-term, as it
delivers improvements in competitiveness in tandem with sustainable increases in income levels. Labour
productivity is one of the primary determinants of overall productivity performance. Irish (GDP) productivity
grew by an average of 2.6% per annum between 2008 and 2013, and in 2013, productivity levels exceeded the
OECD average (Figure 20). In GNP terms, productivity levels are close to the OECD average.
Despite the positive trend in productivity performance, the Council has previously drawn attention to the
impact changes to the composition of employment had on Irish productivity growth. In particular, the collapse
in the labour intensive construction sector and Ireland’s large base of multinationals in high value added
sectors serves to boost Ireland’s productivity level and disguises to a degree underperforming sectors.
Ireland’s productivity performance (in common with many other countries) is built upon a narrow base of
sectors, and indeed, in some cases, companies.
Skills and talent are two of the primary factors influencing labour and total factor productivity, and hence are
key contributors to competitiveness, economic growth and improved living standards. The output of the
formal Irish educational and training system has generally been increasing in recent years, both in terms of
15 July 2015
quantity and quality, as Ireland’s moves further along the path of becoming a knowledge-based economy. For
example, the proportion of the Irish population aged 25-64 with a tertiary level degree has consistently
increased over the past decade (Figure 45). In 2013, 41.5% of Irish adults aged 25-64 had attained a tertiary
degree in 2013, an increase from 33.9% in 2008. Attainment levels are even higher for younger cohorts –
amongst the population aged 25-34, 51% in Ireland have a third level qualification, compared with 41.6% in the
OECD.
In terms of those skills most in demand from enterprise such as ICT, science, engineering and financial
vacancies, Ireland had 22.5 maths, science and computing graduates per 1,000 of the population aged 20-2910
(Figure 47). This is the 2nd highest level in the euro area, higher than the corresponding figures for the US
(12.2). At second level, student ability as measured by the Programme for International Student Assessment
(PISA) shows that Irish performance has improved since 2009 and that average test scores are above the
OECD average in maths, reading and science. The early school leaving rate continues to decline in Ireland,
from 11.7% in 2009 to 6.9% in 2014 and is well below the euro area average (11.7%).
Concerns remain, however, particularly in relation to the large proportion of adults who have left formal
education with relatively low levels of attainment - the proportion of the population with less than upper
secondary education remains high internationally (Figure 46)and this problem is compounded by low levels of
participation in lifelong learning (Figure 49). More broadly, OECD research indicates that Irish people
(aged 15-64) perform below the OECD averages on mathematical and reading proficiency (Figure 48).
Investment to Drive Competitive Advantage
Access to Finance
Access to affordable finance is a critical determinant of enterprise’s ability to operate, invest and expand. For
SMEs in particular, credit supply in the form of bank loans remains the key funding source. Across the euro
area the volume of credit supplied to non-financial corporations (NFCs) has been weak as a result of low
economic growth, structural adjustments in the banking system and weak demand for credit.
The Irish financial crisis saw significant public funds used to recapitalise the banking sector. Further, the State
has intervened to boost the supply of credit to SMEs through a range of initiatives such as the Microenterprise
Loan Fund, Credit Guarantee Scheme and the Strategic Banking Corporation of Ireland. Central Bank data
shows that annualised gross new lending to non-financial, non-property related SMEs has increased from €1.9
billion in December 2013 to €2.1 billion in June 201411 and to €2.4 billion in December 201412. However, the
total stock of credit continues to fall (Figure 36). Long standing concerns about the cost of finance for
enterprise also persist – with Irish firms paying higher interest rates than their peers elsewhere in the EU for
loans of varying sizes (Figure 37 &38).
The proportion of firms borrowing for ‘growth and expansion’ purposes continues to increase. The agriculture,
wholesale/retail and business and administrative services sectors account for the largest share of new lending
activity. In parallel, SME rejection rates for bank finance declined to 14% (a drop of 5%) in 2014. While the
10 A recently published survey by the Expert Group on Future Skills needs found a range of “hard to fill” vacancies, primarily in IT, engineering, science, health, business and some construction-related occupations, as well as a number of associate professional occupations (including technicians and sales related). See EGFSN, Vacancy Overview 2014, May 2015; further, the most recent National Skills Bulletin identified a similar range of skills shortages but noted that “in most cases, shortages remained confined to specialised areas and were small in magnitude”. See EGFSN, National Skills Bulletin, July 2014 11 Central Bank of Ireland, SME Market Report, 2014 H2, December 2014 12 Central Bank of Ireland, Statistical Release: Trends in Business Credit and Deposits: Q4 2014, March 2015
16 July 2015
proportion of Irish SMES who consider access to finance a major concern has declined13, and the pillar banks
returned to profitability in 2014, a number of weaknesses remain in the financial system.
As well as issues related to the availability of, demand for, and cost of credit for enterprise, the legacy of the
financial crisis and the high proportion of non-performing loans in Ireland remains a cause for concern (Figure
39). Although the proportion is declining, such loans still account for 25.3% of gross loans in Ireland (compared
to an OECD-32 average of 5.9%). The differential in interest rates charged to non-financial corporations
between Ireland and the euro area also remains elevated and is concerning from a competitiveness
perspective14.
Broadening the Enterprise Base
The resilience of our exporting sector has been one of the economy’s greatest strengths in recent years. A
more diversified and broad-based export oriented enterprise sector would enhance competitiveness and
Ireland’s ability to withstand external economic shocks. The availability of finance referred to above, is an
essential factor for firms seeking to expand or reorient their operations, and to move into new markets and
develop new products. Finance, however, is not the only factor which impacts upon the development of the
enterprise base. Notwithstanding the strong performance of Enterprise Ireland supported companies, the
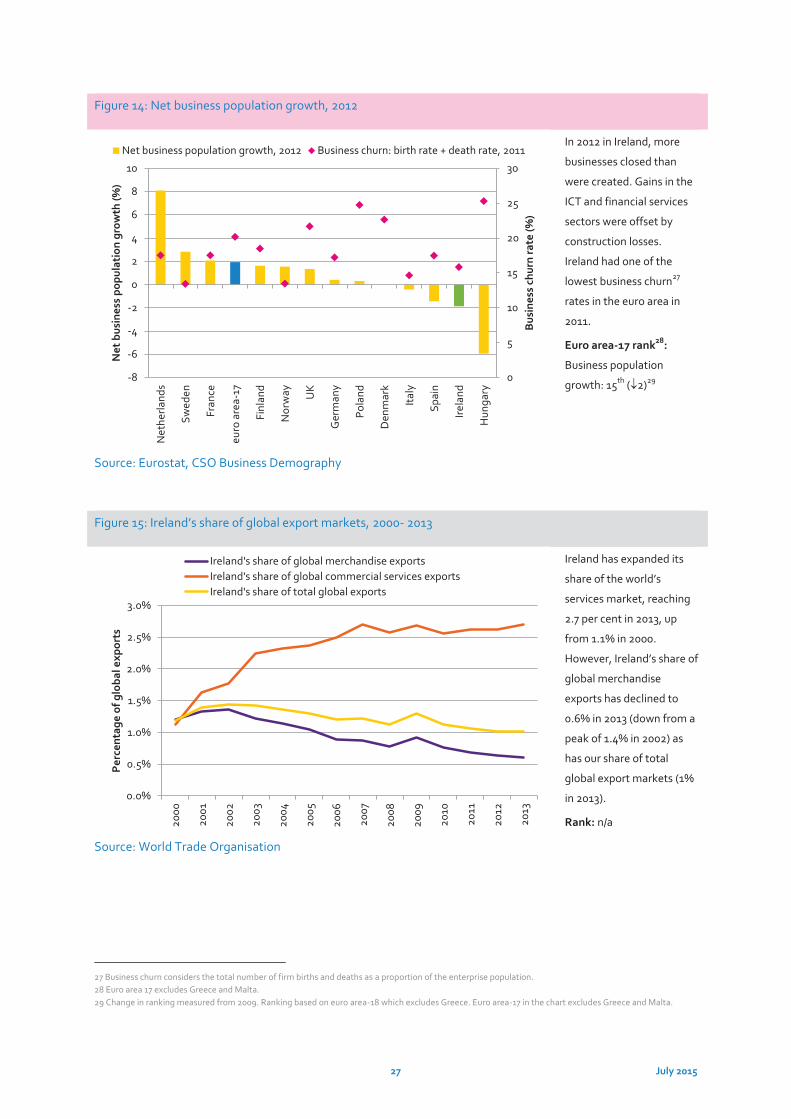
economic crisis severely impeded the level of start-up activity in Ireland. Data for 2012 shows more businesses
closed than were created with gains in the ICT and financial services sectors offset by construction sector
losses (Figure 14). Ireland was ranked 15th in the euro area in terms of new business growth.
From a national competitiveness perspective, facilitating entrepreneurship by ensuring that the State does not
place undue administrative burdens and costs on entrepreneurs and business owners is critical. While a range
of recent structural reforms (e.g. the Companies Act and the Integrated Licensing Applications Service) will
help to support entrepreneurship, other elements of Ireland’s environment for entrepreneurship are relatively
poor in an international competitiveness context; in particular, reducing the time and complexity of
procedures associated with enterprise start-up must continue to be a policy priority.
The composition and range of goods exports from Ireland has changed considerably over the last decade. In
contrast to global trends, goods exports in Ireland are increasingly concentrated in a relatively narrow base of
sectors15. The shift in Irish exports since 2000 is evident in the data: exports of office machinery and electrical
goods decreased from one third of all goods exported in 2000 to less than 10% of goods exports in 2014.
Chemicals and pharmaceutical products’ are now the key driver of export growth and their share of total
exports has been growing steadily since 2000; chemicals now account for 60% of the value of goods exported
from Ireland, compared with approximately 11% of total global exports. While the total value of exports from
this sector is high, these exports are dominated by a small number of foreign owned MNCs. Research indicates
that the high level of import content and the relatively high returns to capital means the sector’s contribution
to Gross National Income is much lower than its export size16.
13 See ECB/EC’s Survey of SME Access to Finance 14 For loans up to and including €1 million, rates charged to Irish business were 5.02% in 2014, 43% higher than the euro area average. Interest rates on loans over €1 million are 50% higher. Interest rates on revolving loans and overdrafts, convenience and extended credit card debt available to Irish NFCs were 26% higher than the euro area average in 2014. 15 See: https://www.centralbank.ie/publications/Documents/The%20Changing%20Nature%20of%20Irish%20Exports.pdf 16 http://www.centralbank.ie/publications/Documents/Quarterly%20Bulletin%20No.%202%202015.pdf
17 July 2015
The impact made by foreign owned enterprises to exports from Ireland in terms of their contribution to
competiveness and productivity has been well documented17. Despite increasing competition and changing
FDI composition, Ireland remains highly competitive as a location for new and existing FDI. The challenge of
sustaining investments from established investors, while at the same time diversifying Ireland’s FDI portfolio
by tapping into new and emerging growth opportunities, is well recognised by IDA Ireland in its new strategy
statement. Improving the linkages between indigenous and foreign owned firms also offers Ireland a potential
source of competitive advantage.
Irish exports remain very dependent on strong trading activity with the euro area (35%), the UK (13%) and US
(22%), accounting for 70% of goods exports in 2014. Trade with the UK is particularly important to the
indigenous enterprise sector. In value terms, 37% of Enterprise Ireland client companies’ exports are to the UK.
As the Council has previously noted, Ireland’s trading patterns leave us vulnerable to external shocks,
particularly changes in the value of the euro. While exports to countries beyond these main trading partners
have increased in recent years, the Council considers Irish exporters must diversify sustainably and
strategically into more markets to reduce reliance on particular countries or regions (Figure 17). In recent years
import growth has been strongest in Asia and emerging economies underlining the importance of policies that
support Irish enterprises, particularly SMEs in broadening and diversifying their export market focus.
Capital Investment
As noted previously, much of the Irish recovery has been driven by the growth of exports. To deliver a
sustainable and balanced recovery, however, investment (both public and private) will need to contribute a
greater proportion to overall growth in the future (Figure 8). The availability of competitively priced world
class infrastructure (energy, telecoms, transport, waste and water) and related services is critical to support
economic growth and enterprise development. Likewise, the provision of adequate housing supply (including
social housing) is an essential determinant maintaining cost competitiveness.
Perceptions about the quality of Ireland’s infrastructure have improved since 2010, reflecting both the impact
of a decade or more of investment, and the reduced capacity constraints as a result of the economic downturn
(Figure 41). Ireland, however, still lags behind the OECD average and scores significantly less than leading
performers. As the economy continues to improve, further investment growth is forecast for 2015. However,
projected public investment levels are insufficient to address the emerging infrastructural needs of a growing
economy and population, particularly as a significant proportion of public funds will be absorbed in
maintaining the existing stock, leaving less funding available for new investment. While recognising the
importance of maintaining sustainable public finances, further additional targeted investment is urgently
required to address constraints which could undermine the economy’s growth prospects, dampening
productivity growth, increasing costs, and weakening Ireland’s attractiveness as an investment location (for
both foreign and indigenous investors). To achieve the improvements required, prioritisation will be required
such that over the medium term, investment is directed to those areas of the economy which can have the
greatest impact upon competitiveness. It is critically important to put in place the appropriate policy and
regulatory frameworks to facilitate this targeted approach.
Digital technologies facilitate increases in innovation and total factor productivity across all economic sectors.
These are key drivers of competitiveness in the economy. However, the potential of digitalisation to support
17 http://www.budget.gov.ie/Budgets/2015/Documents/Economic%20Impact%20of%20the%20FDI%20sector.pdf
18 July 2015
competitiveness and grow employment is currently under-exploited across the EU18. As a result, the Council
are particularly interested in Ireland’s international digital connectivity and our place in the global digital
economy. Overall, Ireland performs relatively well in the European Commission’s Digital Agenda Scoreboard
(ranked 9th out of the EU28, but lagging behind leaders such as Denmark, Sweden, the Netherlands and
Finland). Likewise, Ireland is performing well in terms of fixed and mobile broadband subscriptions (7th out of
19 and well ahead of the euro area average; subscriptions to faster broadband of at least 30Mbps are also
growing rapidly) and in terms of broadband costs (ranked 5th out of 13) (Figures 43 & 44). Irish companies are
also demonstrating improvements in their engagement with the digital world – Ireland is one of the best
performing countries in Europe in terms of businesses trading on line, with 24% of enterprises selling goods
and services online in 2014 compared with a euro area average of 14% (Figure 42). Despite being an above
average performer, growth in online sales is coming from a very low base.
Fostering Innovation
Capital expenditure, however, is not just about physical infrastructure. Investment and growth in OECD
economies are increasingly driven by innovation, generated through the development of knowledge based
capital. OECD research finds that the strongest evidence for private under-investment exists for R&D-related
spending – suggesting a continued important role for public investment19. Investment in knowledge
infrastructure can augment competitiveness through multiple channels. As well as facilitating indigenous
employment growth and boosting productivity, research and development activity can also foster
entrepreneurship and create new business models.
Ireland’s commitment to research, development and innovation has expanded significantly, both in terms of
the level of investment and the human resources engaged in R&D activity over the past decade. While
Ireland’s competitive performance is consistent and relatively strong it is not outstanding. According to the
European Union’s Innovation Scorecard, Ireland’s overall innovation performance has improved incrementally
in recent years, and in 2014 was 20% above the EU average (compared with 10% in 2007). Ireland is ranked 8th
and performance lags innovation leaders such as Denmark, Finland, Germany and Sweden (Figure 53). Ireland
leads the EU28 in how innovative firms are and in the economic impact of innovation in terms of employment,
revenue and exports. A range of weakness (relating to community designs, non-R&D innovation expenditures,
and R&D expenditures in the public sector) remain to be addressed.
Overall levels of investment in R&D in Ireland remain below the best performing countries such as Finland and
Sweden (Figure 52). In 2012, Irish gross expenditure on R&D (GERD) accounted for 1.7% of GDP (2% of GNP),
below the OECD-32 average. Business expenditure on R&D (BERD20) accounted for 1.2% - it is noticeable,
however, that the multinational sector is the primary driver of BERD in Ireland, accounting for 70% of BERD in
2013 according to the CSO. On the other hand, the growing recognition amongst indigenous companies of the
importance of R&D investment is also evident: in 2013, Irish owned firms spent 2.2% of sales revenue on in-
house R&D, compared with an average of 1.5% amongst foreign owned firms (Figure 54). Investment alone is
no guarantee of success. While the outcomes from R&D activity can sometimes be difficult to quantify,
ensuring that the level and impact of R&D expenditure from both public and private sources over the coming
years is maximised will remain a cornerstone of competitive advantage.
18 European Commission, Press Memo, 1.5 Million More Jobs Through Digital Entrepreneurship in Europe are possible, Brussels, 29 April 2014 19 OECD, New Sources of Growth: Knowledge-Based Capital Driving Investment and Productivity in the 21st Century, May 2012 20 Higher education expenditure on R&D (HERD) and government expenditure on R&D (GovERD) accounted for 0.38% and 0.08% of GDP respectively. Note that the Europe 2020 GERD target is 3% of GDP for Europe as a whole and 2.5% for Ireland.

19 July 2015
Ireland’s Competitiveness Challenge
Ireland’s Competitiveness Scorecard does not propose the answers to these challenges. Rather, this report
provides the evidential base to assist policy makers to identify the key challenges confronting Irish enterprise.
The Council will put forward proposals to address them in its annual policy document Ireland’s
Competitiveness Challenge which will be published later this year.
20 July 2015
Chapter 2: Sustainable Growth Figure 1: Overview of Ireland’s international competitiveness rankings (amongst OECD-32)
Figure 1 presents Ireland’s
ranking from amongst 32
OECD member states
across a range of
competitiveness indices - a
ranking of 1 (i.e. close to
the centre of the chart)
would indicate that Ireland
is the most competitive in
the OECD. In general,
Ireland is a mid-table
performer across all of the
indicators21.
Rank: n/a
Source: Miscellaneous
Figure 2: Gross domestic product, euros per capita, current market prices, 2013
Despite the recession
related decline, Irish GDP
per capita remains well
above the euro area
average (+24.5%). In GNP
terms (i.e. removing the
impact of the foreign
owned sector), the
differential is much
narrower (+5%). The
European Commission
forecast per capita GDP
growth of 4.5% in 2015 and
2.8% in 2016 for Ireland.
Euro area-18 rank:
GDP: 4th ( 2)
GNP: 8th ( 3)
Source: Eurostat
21 These indices cover a number of policy areas – some based on directly measureable aspects of policy (e.g. the World Bank Doing Business Index); others measure softer, more subjective issues such as reputation; indices such as the IMD and WEF competitiveness indices capture a mixture of both.
€0
€10,000
€20,000
€30,000
€40,000
€50,000
€60,000
€70,000
Switz
erla
nd
Den
mar
k
Swed
en US
Net
herla
nds
Irela
nd
Finl
and
Ger
man
y
Japa
n
Fran
ce
Irela
nd G
NP
UK
euro
are
a 18
EU28
Italy
Spai
n
Pola
nd
Hun
gary
GD
P p
er c
apit
a (€
)
2013 2008
21 July 2015
Figure 3: Growth in gross domestic product at current market prices, PPS per capita, 2013
Between 2012 and 2013,
Irish GDP per capita (in PPP
terms) declined by 1.2%.
Over the same period, GNP
per capita increased by
1.9%. More recent national
data, however, shows that
incomes per capita are
once again increasing on
the back of stronger
economic growth.
Euro area-18 rank:
GDP: 4th ( 1)
GNP: 8th ( 1)
Source: Eurostat
Figure 4: Components of Irish economic growth, 1998-2014
Over the course of the
recession, net exports (the
value of a country's total
exports minus the value of
its total imports) were the
primary positive driver of
Irish growth. Following
some volatility in 2012 and
2013, in 2014 the drivers of
growth became more
balanced with a noticeable
increase in the contribution
made by investment.
Rank: n/a
Source: CSO, National Accounts
-3.00%
-2.00%
-1.00%
0.00%
1.00%
2.00%
3.00%
4.00%
5.00%
6.00%Po
land U
K
Irela
nd G
NP
Ger
man
y
Swed
en US
EU28
Switz
erla
nd
Spai
n
euro
are
a 18
Fran
ce
Net
herla
nds
Den
mar
k
Japa
n
Irela
nd
Italy
Finl
and
Ave
rage
ann
ual g
row
th ra
te (%
)
2012-2013 2008-2012
-12%
-10%
-8%
-6%
-4%
-2%
0%
2%
4%
6%
8%
10%
12%
1998
1999
2000
2001
2002
2003
2004
2005
2006
2007
2008
2009
2010
2011
2012
2013
2014
Perc
enta
ge o
f GD
P G
row
th
Consumption Government Investment Net Exports
22 July 2015
Figure 5: Balance of payments, current account balance (€millions), 1998-2014
The current account
balance measures earnings
from net exports, plus net
factor income and other
transfers. Since 2008, the
current account has moved
from deficit to surplus
(partly reflecting improved
cost competitiveness). The
current account surplus for
2014 was €11,467m, an
increase of €3,834m on
2013.
Rank: n/a
Source: CSO Balance of Payments
Figure 6: General government debt (% GDP) and general government balance (% GDP), 2014
In recent years, Ireland’s
general government debt
dramatically increased.
Having peaked at 123% of
GDP in 2013, EC data
shows that the Irish debt to
GDP ratio declined to
109.7% in 2014. A general
government balance of -
2.8% of GDP is expected
for 2015.
Euro area-19 rank:
Debt/GDP: 16th
GGB/GDP: 15th
Source: European Commission (EC), European Economy 2/2015
-€15,000
-€10,000
-€5,000
€0
€5,000
€10,000
€15,000
1998
1999
2000
2001
2002
2003
2004
2005
2006
2007
2008
2009
2010
2011
2012
2013
2014
Mill
ions
(€)
Belgium
Germany
Ireland
Greece
Spain
France
Italy
Luxembourg
MaltaNetherlands
Austria
Portugal
Finland
euro area
Denmark
Hungary
PolandSweden
UKEU28
0
20
40
60
80
100
120
140
160
180
-6 -5 -4 -3 -2 -1 0 1 2
Gen
eral
gov
ernm
ent g
ross
deb
t (%
GD
P)
General government balance (% GDP)
23 July 2015
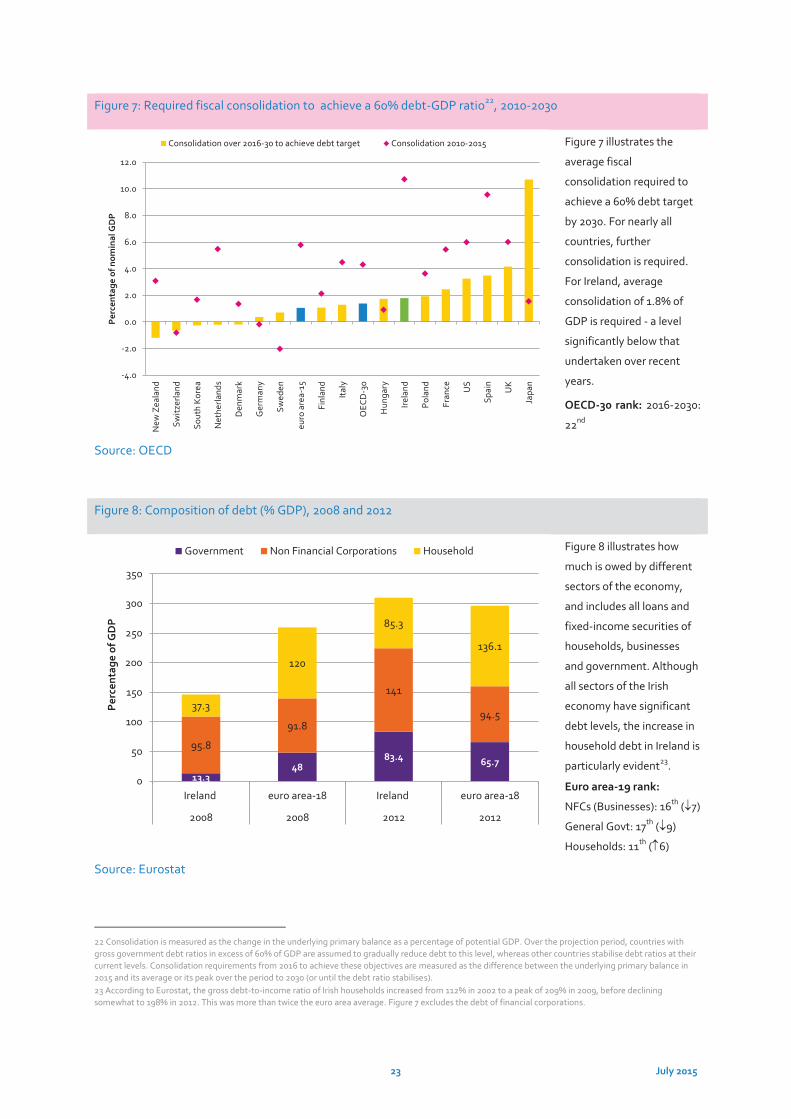
Figure 7: Required fiscal consolidation to achieve a 60% debt-GDP ratio22, 2010-2030
Figure 7 illustrates the
average fiscal
consolidation required to
achieve a 60% debt target
by 2030. For nearly all
countries, further
consolidation is required.
For Ireland, average
consolidation of 1.8% of
GDP is required - a level
significantly below that
undertaken over recent
years.
OECD-30 rank: 2016-2030:
22nd
Source: OECD
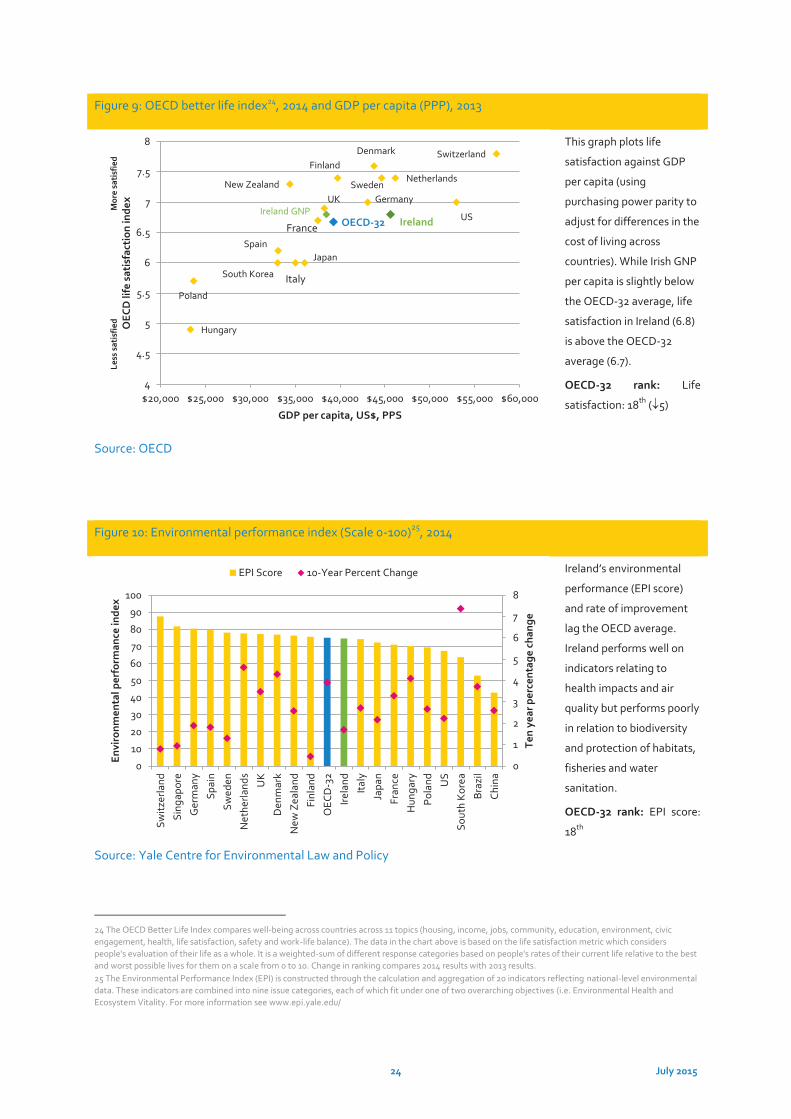
Figure 8: Composition of debt (% GDP), 2008 and 2012
Figure 8 illustrates how
much is owed by different
sectors of the economy,
and includes all loans and
fixed-income securities of
households, businesses
and government. Although
all sectors of the Irish
economy have significant
debt levels, the increase in
household debt in Ireland is
particularly evident23.
Euro area-19 rank:
NFCs (Businesses): 16th ( 7)
General Govt: 17th ( 9)
Households: 11th ( 6)
Source: Eurostat
22 Consolidation is measured as the change in the underlying primary balance as a percentage of potential GDP. Over the projection period, countries with gross government debt ratios in excess of 60% of GDP are assumed to gradually reduce debt to this level, whereas other countries stabilise debt ratios at their current levels. Consolidation requirements from 2016 to achieve these objectives are measured as the difference between the underlying primary balance in 2015 and its average or its peak over the period to 2030 (or until the debt ratio stabilises). 23 According to Eurostat, the gross debt-to-income ratio of Irish households increased from 112% in 2002 to a peak of 209% in 2009, before declining somewhat to 198% in 2012. This was more than twice the euro area average. Figure 7 excludes the debt of financial corporations.
-4.0
-2.0
0.0
2.0
4.0
6.0
8.0
10.0
12.0N
ew Z
eala
nd
Switz
erla
nd
Sout
h K
orea
Net
herla
nds
Den
mar
k
Ger
man
y
Swed
en
euro
are
a-15
Finl
and
Italy
OEC
D-3
0
Hun
gary
Irela
nd
Pola
nd
Fran
ce US
Spai
n
UK
Japa
n
Per
cent
age
of n
omin
al G
DP
Consolidation over 2016-30 to achieve debt target Consolidation 2010-2015
13.348
83.4 65.7
95.8
91.8
141
94.537.3
120
85.3
136.1
0
50
100
150
200
250
300
350
Ireland euro area-18 Ireland euro area-18
2008 2008 2012 2012
Per
cent
age
of G
DP
Government Non Financial Corporations Household
24 July 2015
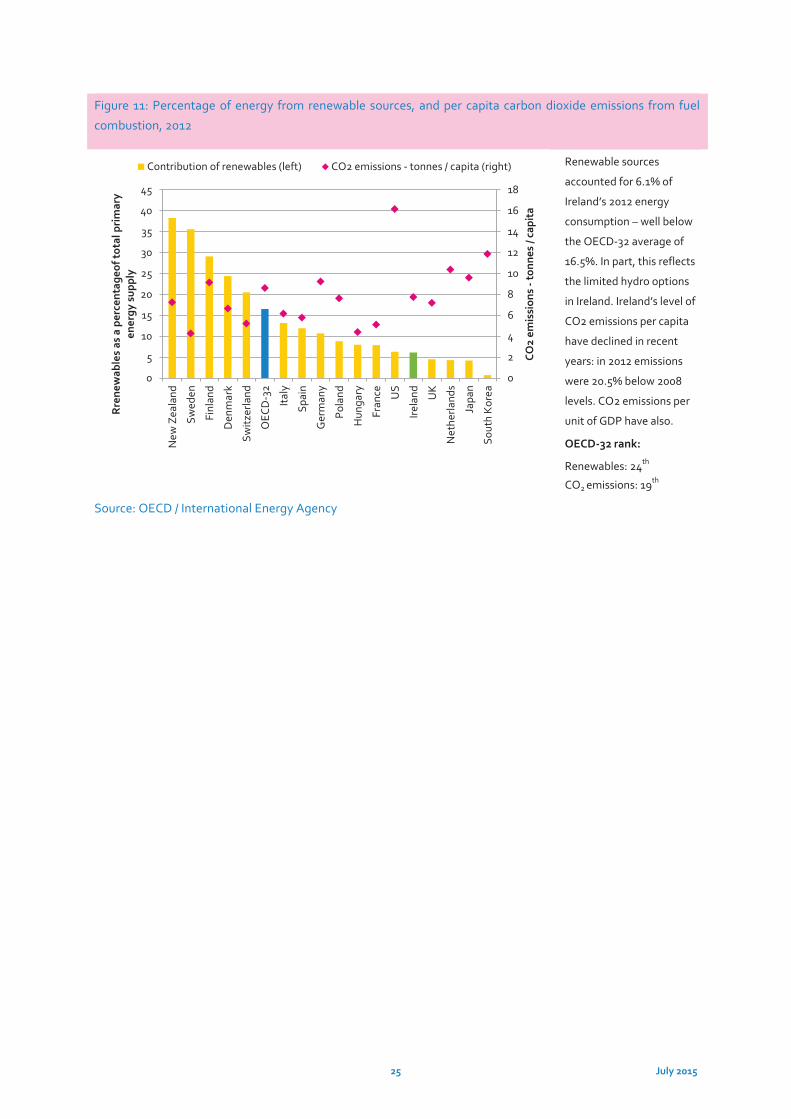
Figure 9: OECD better life index24, 2014 and GDP per capita (PPP), 2013
This graph plots life
satisfaction against GDP
per capita (using
purchasing power parity to
adjust for differences in the
cost of living across
countries). While Irish GNP
per capita is slightly below
the OECD-32 average, life
satisfaction in Ireland (6.8)
is above the OECD-32
average (6.7).
OECD-32 rank: Life
satisfaction: 18th ( 5)
Source: OECD
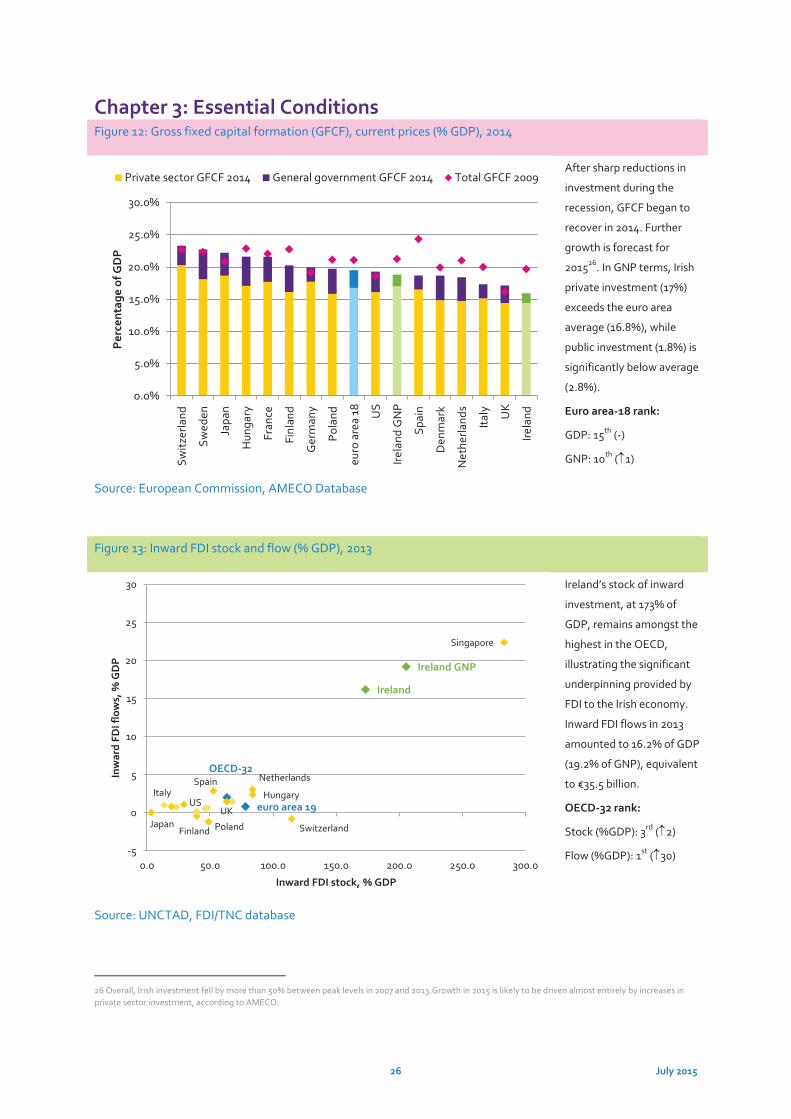
Figure 10: Environmental performance index (Scale 0-100)25, 2014
Ireland’s environmental
performance (EPI score)
and rate of improvement
lag the OECD average.
Ireland performs well on
indicators relating to
health impacts and air
quality but performs poorly
in relation to biodiversity
and protection of habitats,
fisheries and water
sanitation.
OECD-32 rank: EPI score:
18th
Source: Yale Centre for Environmental Law and Policy
24 The OECD Better Life Index compares well-being across countries across 11 topics (housing, income, jobs, community, education, environment, civic engagement, health, life satisfaction, safety and work-life balance). The data in the chart above is based on the life satisfaction metric which considers people's evaluation of their life as a whole. It is a weighted-sum of different response categories based on people's rates of their current life relative to the best and worst possible lives for them on a scale from 0 to 10. Change in ranking compares 2014 results with 2013 results. 25 The Environmental Performance Index (EPI) is constructed through the calculation and aggregation of 20 indicators reflecting national-level environmental data. These indicators are combined into nine issue categories, each of which fit under one of two overarching objectives (i.e. Environmental Health and Ecosystem Vitality. For more information see www.epi.yale.edu/
DenmarkFinland
France
Germany
Hungary
Ireland
Italy
Japan
South Korea
NetherlandsNew Zealand
Poland
Spain
Sweden
Switzerland
UK
USOECD-32Ireland GNP
4
4.5
5
5.5
6
6.5
7
7.5
8
$20,000 $25,000 $30,000 $35,000 $40,000 $45,000 $50,000 $55,000 $60,000
Less
sat
isfie
d
Mor
e sa
tisf
ied
O
ECD
life
sat
isfa
ctio
n in
dex
GDP per capita, US$, PPS
0
1
2
3
4
5
6
7
8
0
10
20
30
40
50
60
70
80
90
100
Switz
erla
nd
Sing
apor
e
Ger
man
y
Spai
n
Swed
en
Net
herla
nds
UK
Den
mar
k
New
Zea
land
Finl
and
OEC
D-3
2
Irela
nd
Italy
Japa
n
Fran
ce
Hun
gary
Pola
nd US
Sout
h K
orea
Braz
il
Chin
a
Ten
year
per
cent
age
chan
ge
Envi
ronm
enta
l per
form
ance
inde
x
EPI Score 10-Year Percent Change
25 July 2015
Figure 11: Percentage of energy from renewable sources, and per capita carbon dioxide emissions from fuel
combustion, 2012
Renewable sources
accounted for 6.1% of
Ireland’s 2012 energy
consumption – well below
the OECD-32 average of
16.5%. In part, this reflects
the limited hydro options
in Ireland. Ireland’s level of
CO2 emissions per capita
have declined in recent
years: in 2012 emissions
were 20.5% below 2008
levels. CO2 emissions per
unit of GDP have also.
OECD-32 rank:
Renewables: 24th
CO2 emissions: 19th
Source: OECD / International Energy Agency
0
2
4
6
8
10
12
14
16
18
0
5
10
15
20
25
30
35
40
45
New
Zea
land
Swed
en
Finl
and
Den
mar
k
Switz
erla
nd
OEC
D-3
2
Italy
Spai
n
Ger
man
y
Pola
nd
Hun
gary
Fran
ce US
Irela
nd UK
Net
herla
nds
Japa
n
Sout
h K
orea
CO2
emis
sion
s -t
onne
s / c
apit
a
Rre
new
able
s as
a p
erce
ntag
eof t
otal
pri
mar
y en
ergy
sup
ply
Contribution of renewables (left) CO2 emissions - tonnes / capita (right)
26 July 2015
Chapter 3: Essential Conditions Figure 12: Gross fixed capital formation (GFCF), current prices (% GDP), 2014
After sharp reductions in
investment during the
recession, GFCF began to
recover in 2014. Further
growth is forecast for
201526. In GNP terms, Irish
private investment (17%)
exceeds the euro area
average (16.8%), while
public investment (1.8%) is
significantly below average
(2.8%).
Euro area-18 rank:
GDP: 15th (-)
GNP: 10th ( 1)
Source: European Commission, AMECO Database
Figure 13: Inward FDI stock and flow (% GDP), 2013
Ireland’s stock of inward
investment, at 173% of
GDP, remains amongst the
highest in the OECD,
illustrating the significant
underpinning provided by
FDI to the Irish economy.
Inward FDI flows in 2013
amounted to 16.2% of GDP
(19.2% of GNP), equivalent
to €35.5 billion.
OECD-32 rank:
Stock (%GDP): 3rd ( 2)
Flow (%GDP): 1st ( 30)
Source: UNCTAD, FDI/TNC database
26 Overall, Irish investment fell by more than 50% between peak levels in 2007 and 2013.Growth in 2015 is likely to be driven almost entirely by increases in private sector investment, according to AMECO.
0.0%
5.0%
10.0%
15.0%
20.0%
25.0%
30.0%
Switz
erla
nd
Swed
en
Japa
n
Hun
gary
Fran
ce
Finl
and
Ger
man
y
Pola
nd
euro
are
a 18 U
S
Irela
nd G
NP
Spai
n
Den
mar
k
Net
herla
nds
Italy UK
Irela
nd
Per
cent
age
of G
DP
Private sector GFCF 2014 General government GFCF 2014 Total GFCF 2009
euro area 19
Finland
Hungary
Ireland
Ireland GNP
Italy
Japan
NetherlandsOECD-32
Poland
Singapore
Spain
Switzerland
UKUS
-5
0
5
10
15
20
25
30
0.0 50.0 100.0 150.0 200.0 250.0 300.0
Inw
ard
FDI f
low
s, %
GD
P
Inward FDI stock, % GDP
27 July 2015
Figure 14: Net business population growth, 2012
In 2012 in Ireland, more
businesses closed than
were created. Gains in the
ICT and financial services
sectors were offset by
construction losses.
Ireland had one of the
lowest business churn27
rates in the euro area in
2011.
Euro area-17 rank28:
Business population
growth: 15th ( 2)29
Source: Eurostat, CSO Business Demography
Figure 15: Ireland’s share of global export markets, 2000- 2013
Ireland has expanded its
share of the world’s
services market, reaching
2.7 per cent in 2013, up
from 1.1% in 2000.
However, Ireland’s share of
global merchandise
exports has declined to
0.6% in 2013 (down from a
peak of 1.4% in 2002) as
has our share of total
global export markets (1%
in 2013).
Rank: n/a
Source: World Trade Organisation
27 Business churn considers the total number of firm births and deaths as a proportion of the enterprise population. 28 Euro area 17 excludes Greece and Malta. 29 Change in ranking measured from 2009. Ranking based on euro area-18 which excludes Greece. Euro area-17 in the chart excludes Greece and Malta.
0
5
10
15
20
25
30
-8
-6
-4
-2
0
2
4
6
8
10N
ethe
rland
s
Swed
en
Fran
ce
euro
are
a-17
Finl
and
Nor
way UK
Ger
man
y
Pola
nd
Den
mar
k
Italy
Spai
n
Irela
nd
Hun
gary
Bus
ines
s ch
urn
rate
(%)
Net
bus
ines
s po
pula
tion
gro
wth
(%)
Net business population growth, 2012 Business churn: birth rate + death rate, 2011
0.0%
0.5%
1.0%
1.5%
2.0%
2.5%
3.0%
2000
2001
2002
2003
2004
2005
2006
2007
2008
2009
2010
2011
2012
2013
Per
cent
age
of g
loba
l exp
orts
Ireland's share of global merchandise exportsIreland's share of global commercial services exportsIreland's share of total global exports
28 July 2015
Figure 16: Ireland’s share of global export markets by sector30, 2013
This data examines
Ireland’s share of world
exports at a sectoral level.
While Ireland’s market
share in computer and
information services held
constant between 2008
and 2013 (as the sector
grew rapidly globally),
slight reductions in market
share occurred in financial
services and
pharmaceuticals. Larger
reductions were recorded
in the insurance sector.
Rank: n/a
Source: World Trade Organisation
Figure 17: Intra and extra-EU merchandise exports (% GDP), 2013
Ireland is one of the most
open trading countries in
the EU. Irish merchandise
exports to the EU-28
amounted to 30% of GDP
in 2013. Ireland also has
significant trading links
with non-EU countries (e.g.
US). As a result of the
importance of non-euro
denominated trade, Irish
firms are particularly
influenced by exchange
rate fluctuations.
Euro area-19 rank:
Merchandise exports: 7th (-)
Extra-EU trade: 3rd
Source: Eurostat
30 Chemicals are a subset of the pharmaceutical sector – this is indicated by the lighter shade of green in the bar chart.
0%2%4%6%8%
10%12%14%16%18%20%
Com
pute
r & in
fo se
rvic
es
Insu
ranc
e se
rvic
es
Fina
ncia
l ser
vice
s
Com
mun
icat
ion
serv
ices
Tran
spor
t ser
vice
s
Phar
mac
eutic
als
Chem
ical
s
Agr
icul
tura
l pro
duct
s
Off
ice
& te
leco
m e
quip
men
t
Mac
hine
ry &
tran
spor
teq
uipm
ent
Per
cent
age
of g
loba
l tra
de
2013 2008
0%
10%
20%
30%
40%
50%
60%
70%
80%
90%
Net
herla
nds
Hun
gary
Irela
nd G
NP
Irela
nd
euro
are
a 19
Ger
man
y
Pola
nd
Den
mar
k
Swed
en
Finl
and
Italy
Spai
n
UK
Fran
ce
Per
cent
age
of G
DP
Intra-EU exports Extra-EU exports 2013 Total exports 2008
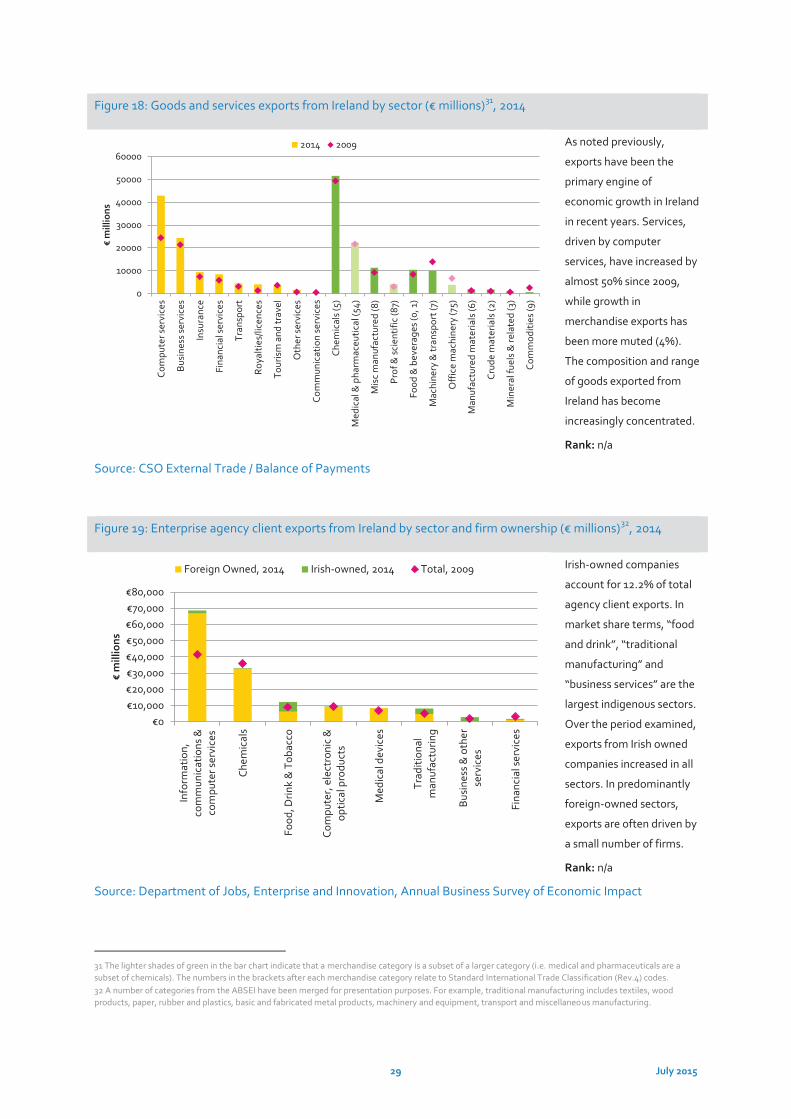
29 July 2015
Figure 18: Goods and services exports from Ireland by sector (€ millions)31, 2014
As noted previously,
exports have been the
primary engine of
economic growth in Ireland
in recent years. Services,
driven by computer
services, have increased by
almost 50% since 2009,
while growth in
merchandise exports has
been more muted (4%).
The composition and range
of goods exported from
Ireland has become
increasingly concentrated.
Rank: n/a
Source: CSO External Trade / Balance of Payments
Figure 19: Enterprise agency client exports from Ireland by sector and firm ownership (€ millions)32, 2014
Irish-owned companies
account for 12.2% of total
agency client exports. In
market share terms, “food
and drink”, “traditional
manufacturing” and
“business services” are the
largest indigenous sectors.
Over the period examined,
exports from Irish owned
companies increased in all
sectors. In predominantly
foreign-owned sectors,
exports are often driven by
a small number of firms.
Rank: n/a
Source: Department of Jobs, Enterprise and Innovation, Annual Business Survey of Economic Impact
31 The lighter shades of green in the bar chart indicate that a merchandise category is a subset of a larger category (i.e. medical and pharmaceuticals are a subset of chemicals). The numbers in the brackets after each merchandise category relate to Standard International Trade Classification (Rev.4) codes. 32 A number of categories from the ABSEI have been merged for presentation purposes. For example, traditional manufacturing includes textiles, wood products, paper, rubber and plastics, basic and fabricated metal products, machinery and equipment, transport and miscellaneous manufacturing.
0
10000
20000
30000
40000
50000
60000Co
mpu
ter s
ervi
ces
Busi
ness
ser
vice
s
Insu
ranc
e
Fina
ncia
l ser
vice
s
Tran
spor
t
Roya
lties
/lice
nces
Tour
ism
and
trav
el
Oth
er s
ervi
ces
Com
mun
icat
ion
serv
ices
Chem
ical
s (5
)
Med
ical
& p
harm
aceu
tical
(54)
Mis
c m
anuf
actu
red
(8)
Prof
& s
cien
tific
(87)
Food
& b
ever
ages
(0, 1
)
Mac
hine
ry &
tran
spor
t (7)
Off
ice
mac
hine
ry (7
5)
Man
ufac
ture
d m
ater
ials
(6)
Crud
e m
ater
ials
(2)
Min
eral
fuel
s &
rela
ted
(3)
Com
mod
ities
(9)
€m
illio
ns
2014 2009
€0€10,000€20,000€30,000€40,000€50,000€60,000€70,000€80,000
Info
rmat
ion,
com
mun
icat
ions
&co
mpu
ter s
ervi
ces
Chem
ical
s
Food
, Drin
k &
Tob
acco
Com
pute
r, e
lect
roni
c &
optic
al p
rodu
cts
Med
ical
dev
ices
Trad
ition
alm
anuf
actu
ring
Busi
ness
& o
ther
serv
ices
Fina
ncia
l ser
vice
s
€m
illio
ns
Foreign Owned, 2014 Irish-owned, 2014 Total, 2009
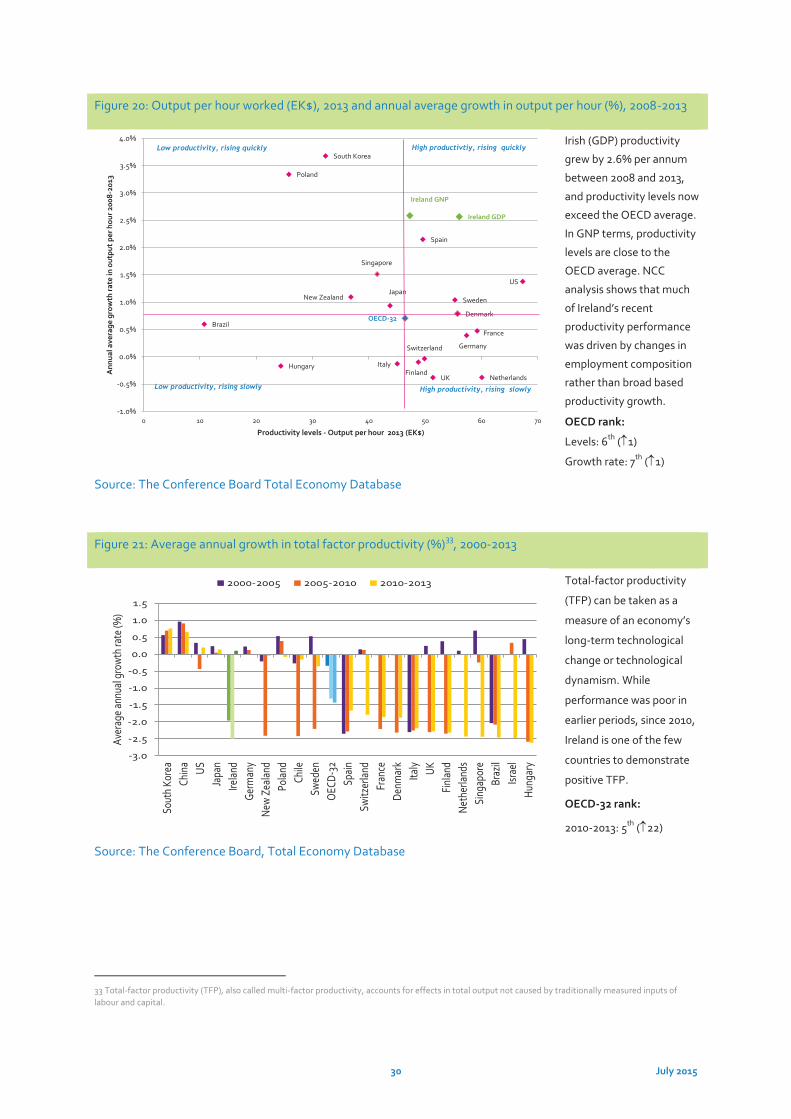
30 July 2015
Figure 20: Output per hour worked (EK$), 2013 and annual average growth in output per hour (%), 2008-2013
Irish (GDP) productivity
grew by 2.6% per annum
between 2008 and 2013,
and productivity levels now
exceed the OECD average.
In GNP terms, productivity
levels are close to the
OECD average. NCC
analysis shows that much
of Ireland’s recent
productivity performance
was driven by changes in
employment composition
rather than broad based
productivity growth.
OECD rank:
Levels: 6th ( 1)
Growth rate: 7th ( 1)
Source: The Conference Board Total Economy Database
Figure 21: Average annual growth in total factor productivity (%)33, 2000-2013
Total-factor productivity
(TFP) can be taken as a
measure of an economy’s
long-term technological
change or technological
dynamism. While
performance was poor in
earlier periods, since 2010,
Ireland is one of the few
countries to demonstrate
positive TFP.
OECD-32 rank:
2010-2013: 5th ( 22)
Source: The Conference Board, Total Economy Database
33 Total-factor productivity (TFP), also called multi-factor productivity, accounts for effects in total output not caused by traditionally measured inputs of labour and capital.
Finland
France
Germany
Ireland GDP
Italy
Netherlands
Spain
Denmark
Hungary
Poland
Sweden
Switzerland
UK
Brazil
Japan
South Korea
New Zealand
US
Ireland GNP
Singapore
OECD-32
-1.0%
-0.5%
0.0%
0.5%
1.0%
1.5%
2.0%
2.5%
3.0%
3.5%
4.0%
0 10 20 30 40 50 60 70
Ann
ual a
vera
ge g
row
th ra
te in
out
put
per h
our 2
008-
2013
Productivity levels - Output per hour 2013 (EK$)
Low productivity, rising quickly
Low productivity, rising slowly
High productivtiy, rising quickly
High productivity, rising slowly
-3.0
-2.5
-2.0
-1.5
-1.0
-0.5
0.0
0.5
1.0
1.5
Sout
h Ko
rea
Chin
aUS
Japa
nIre
land
Germ
any
New
Zeala
ndPo
land
Chile
Swed
enO
ECD-
32Sp
ain
Switz
erla
ndFr
ance
Denm
ark
Italy UK
Finl
and
Neth
erlan
dsSi
ngap
ore
Braz
ilIsr
ael
Hung
ary
Aver
age a
nnua
l gro
wth
rate
(%)
2000-2005 2005-2010 2010-2013
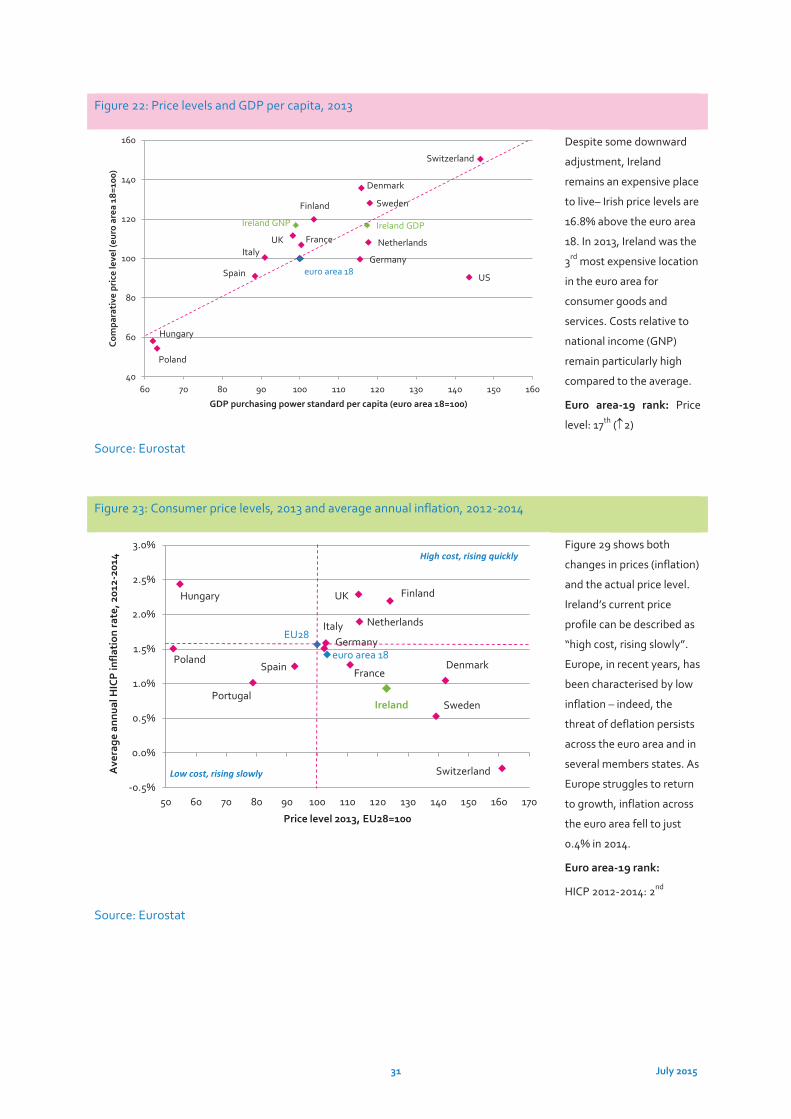
31 July 2015
Figure 22: Price levels and GDP per capita, 2013
Despite some downward
adjustment, Ireland
remains an expensive place
to live– Irish price levels are
16.8% above the euro area
18. In 2013, Ireland was the
3rd most expensive location
in the euro area for
consumer goods and
services. Costs relative to
national income (GNP)
remain particularly high
compared to the average.
Euro area-19 rank: Price
level: 17th ( 2)
Source: Eurostat
Figure 23: Consumer price levels, 2013 and average annual inflation, 2012-2014
Figure 29 shows both
changes in prices (inflation)
and the actual price level.
Ireland’s current price
profile can be described as
“high cost, rising slowly”.
Europe, in recent years, has
been characterised by low
inflation – indeed, the
threat of deflation persists
across the euro area and in
several members states. As
Europe struggles to return
to growth, inflation across
the euro area fell to just
0.4% in 2014.
Euro area-19 rank:
HICP 2012-2014: 2nd
Source: Eurostat
euro area 18
Denmark
Germany
Ireland GDP
Spain
FranceItaly
Hungary
Netherlands
Poland
Finland Sweden
UK
Switzerland
US
Ireland GNP
40
60
80
100
120
140
160
60 70 80 90 100 110 120 130 140 150 160
Com
para
tive
pri
ce le
vel (
euro
are
a 18
=100
)
GDP purchasing power standard per capita (euro area 18=100)
EU28
euro area 18Denmark
Germany
Ireland
Spain France
Italy
Hungary
Netherlands
Poland
Portugal
Finland
Sweden
UK
Switzerland-0.5%
0.0%
0.5%
1.0%
1.5%
2.0%
2.5%
3.0%
50 60 70 80 90 100 110 120 130 140 150 160 170
Ave
rage
ann
ual H
ICP
infla
tion
rate
, 201
2-20
14
Price level 2013, EU28=100
High cost, rising quickly
Low cost, rising slowly
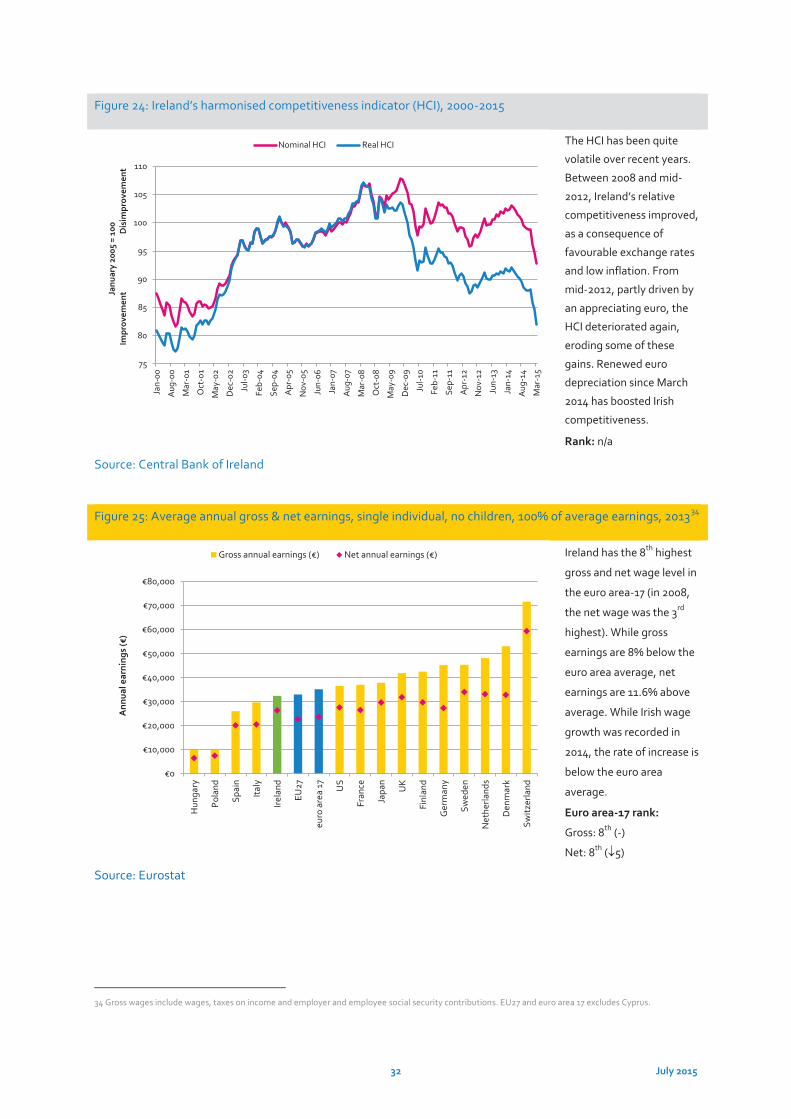
32 July 2015
Figure 24: Ireland’s harmonised competitiveness indicator (HCI), 2000-2015
The HCI has been quite
volatile over recent years.
Between 2008 and mid-
2012, Ireland’s relative
competitiveness improved,
as a consequence of
favourable exchange rates
and low inflation. From
mid-2012, partly driven by
an appreciating euro, the
HCI deteriorated again,
eroding some of these
gains. Renewed euro
depreciation since March
2014 has boosted Irish
competitiveness.
Rank: n/a
Source: Central Bank of Ireland
Figure 25: Average annual gross & net earnings, single individual, no children, 100% of average earnings, 201334
Ireland has the 8th highest
gross and net wage level in
the euro area-17 (in 2008,
the net wage was the 3rd
highest). While gross
earnings are 8% below the
euro area average, net
earnings are 11.6% above
average. While Irish wage
growth was recorded in
2014, the rate of increase is
below the euro area
average.
Euro area-17 rank:
Gross: 8th (-)
Net: 8th ( 5)
Source: Eurostat
34 Gross wages include wages, taxes on income and employer and employee social security contributions. EU27 and euro area 17 excludes Cyprus.
75
80
85
90
95
100
105
110Ja
n-00
Aug
-00
Mar
-01
Oct
-01
May
-02
Dec
-02
Jul-0
3
Feb-
04
Sep-
04
Apr
-05
Nov
-05
Jun-
06
Jan-
07
Aug
-07
Mar
-08
Oct
-08
May
-09
Dec
-09
Jul-1
0
Feb-
11
Sep-
11
Apr
-12
Nov
-12
Jun-
13
Jan-
14
Aug
-14
Mar
-15
Janu
ary
2005
= 1
00Im
prov
emen
t
Dis
impr
ovem
ent
Nominal HCI Real HCI
€0
€10,000
€20,000
€30,000
€40,000
€50,000
€60,000
€70,000
€80,000
Hun
gary
Pola
nd
Spai
n
Italy
Irela
nd
EU27
euro
are
a 17 US
Fran
ce
Japa
n
UK
Finl
and
Ger
man
y
Swed
en
Net
herla
nds
Den
mar
k
Switz
erla
nd
Ann
ual e
arni
ngs
(€)
Gross annual earnings (€) Net annual earnings (€)
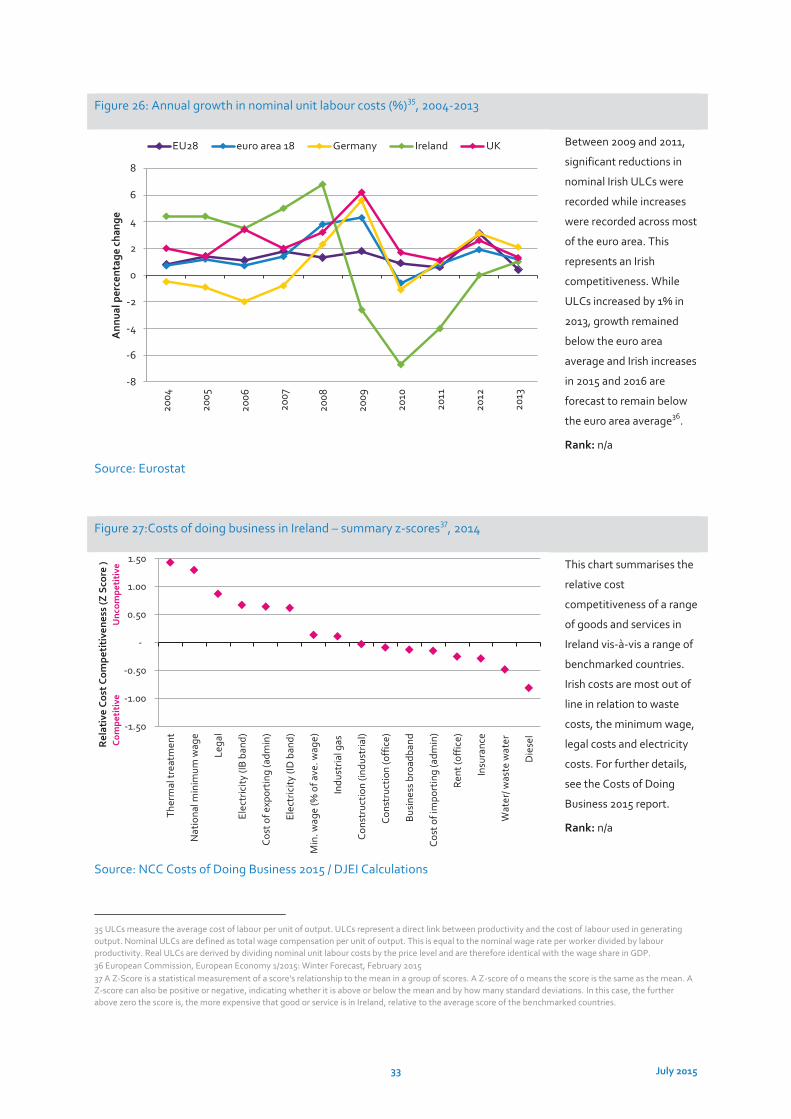
33 July 2015
Figure 26: Annual growth in nominal unit labour costs (%)35, 2004-2013
Between 2009 and 2011,
significant reductions in
nominal Irish ULCs were
recorded while increases
were recorded across most
of the euro area. This
represents an Irish
competitiveness. While
ULCs increased by 1% in
2013, growth remained
below the euro area
average and Irish increases
in 2015 and 2016 are
forecast to remain below
the euro area average36.
Rank: n/a
Source: Eurostat
Figure 27:Costs of doing business in Ireland – summary z-scores37, 2014
This chart summarises the
relative cost
competitiveness of a range
of goods and services in
Ireland vis-à-vis a range of
benchmarked countries.
Irish costs are most out of
line in relation to waste
costs, the minimum wage,
legal costs and electricity
costs. For further details,
see the Costs of Doing
Business 2015 report.
Rank: n/a
Source: NCC Costs of Doing Business 2015 / DJEI Calculations
35 ULCs measure the average cost of labour per unit of output. ULCs represent a direct link between productivity and the cost of labour used in generating output. Nominal ULCs are defined as total wage compensation per unit of output. This is equal to the nominal wage rate per worker divided by labour productivity. Real ULCs are derived by dividing nominal unit labour costs by the price level and are therefore identical with the wage share in GDP. 36 European Commission, European Economy 1/2015: Winter Forecast, February 2015 37 A Z-Score is a statistical measurement of a score's relationship to the mean in a group of scores. A Z-score of 0 means the score is the same as the mean. A Z-score can also be positive or negative, indicating whether it is above or below the mean and by how many standard deviations. In this case, the further above zero the score is, the more expensive that good or service is in Ireland, relative to the average score of the benchmarked countries.
-8
-6
-4
-2
0
2
4
6
820
04
2005
2006
2007
2008
2009
2010
2011
2012
2013
Ann
ual p
erce
ntag
e ch
ange
EU28 euro area 18 Germany Ireland UK
-1.50
-1.00
-0.50
-
0.50
1.00
1.50
Ther
mal
trea
tmen
t
Nat
iona
l min
imum
wag
e
Lega
l
Elec
tric
ity (I
B b
and)
Cost
of e
xpor
ting
(adm
in)
Elec
tric
ity (I
D b
and)
Min
. wag
e (%
of a
ve. w
age)
Indu
stria
l gas
Cons
truc
tion
(indu
stria
l)
Cons
truc
tion
(off
ice)
Busi
ness
bro
adba
nd
Cost
of i
mpo
rtin
g (a
dmin
)
Rent
(off
ice)
Insu
ranc
e
Wat
er/ w
aste
wat
er
Die
sel
Rel
ativ
e Co
st C
ompe
titi
vene
ss (Z
Sco
re )
Co
mpe
titi
ve
Unc
ompe
titi
ve
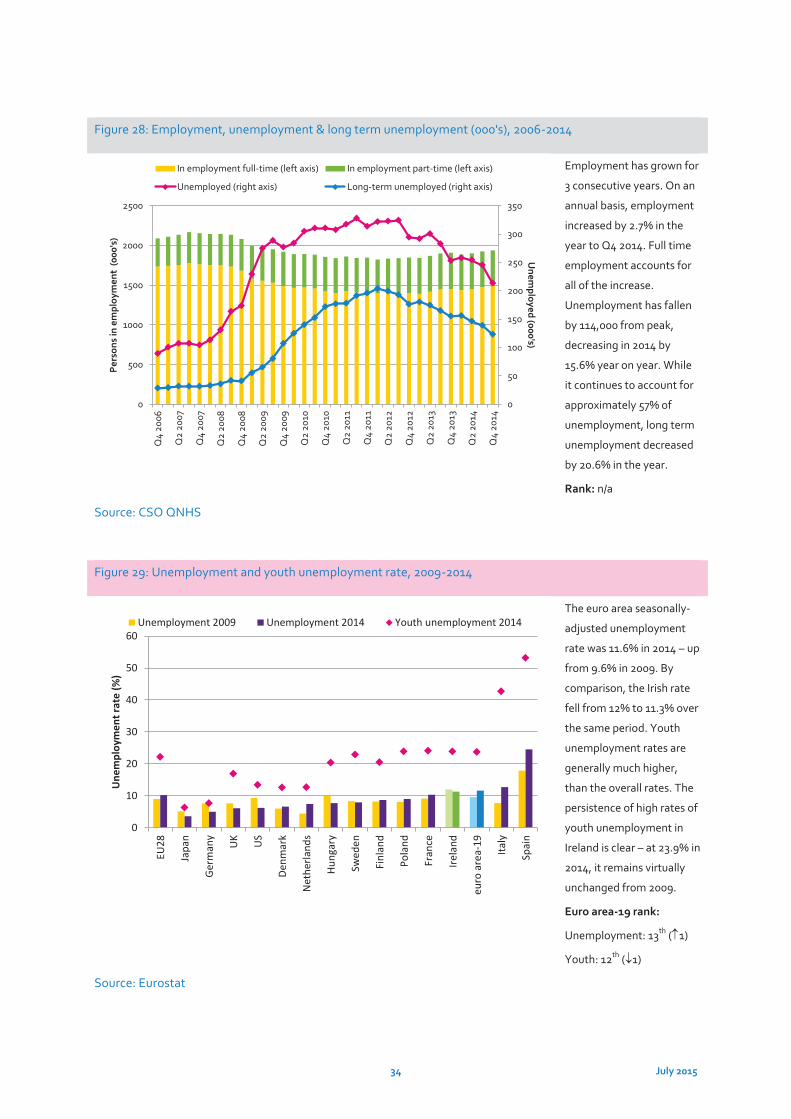
34 July 2015
Figure 28: Employment, unemployment & long term unemployment (000's), 2006-2014
Employment has grown for
3 consecutive years. On an
annual basis, employment
increased by 2.7% in the
year to Q4 2014. Full time
employment accounts for
all of the increase.
Unemployment has fallen
by 114,000 from peak,
decreasing in 2014 by
15.6% year on year. While
it continues to account for
approximately 57% of
unemployment, long term
unemployment decreased
by 20.6% in the year.
Rank: n/a
Source: CSO QNHS
Figure 29: Unemployment and youth unemployment rate, 2009-2014
The euro area seasonally-
adjusted unemployment
rate was 11.6% in 2014 – up
from 9.6% in 2009. By
comparison, the Irish rate
fell from 12% to 11.3% over
the same period. Youth
unemployment rates are
generally much higher,
than the overall rates. The
persistence of high rates of
youth unemployment in
Ireland is clear – at 23.9% in
2014, it remains virtually
unchanged from 2009.
Euro area-19 rank:
Unemployment: 13th ( 1)
Youth: 12th ( 1)
Source: Eurostat
0
50
100
150
200
250
300
350
0
500
1000
1500
2000
2500
Q4
2006
Q2
2007
Q4
2007
Q2
2008
Q4
2008
Q2
2009
Q4
2009
Q2
2010
Q4
2010
Q2
2011
Q4
2011
Q2
2012
Q4
2012
Q2
2013
Q4
2013
Q2
2014
Q4
2014
Unem
ployed (000's)
Per
sons
in e
mpl
oym
ent
(000
's)
In employment full-time (left axis) In employment part-time (left axis)
Unemployed (right axis) Long-term unemployed (right axis)
0
10
20
30
40
50
60
EU28
Japa
n
Ger
man
y
UK US
Denm
ark
Net
herla
nds
Hung
ary
Swed
en
Finl
and
Pola
nd
Fran
ce
Irela
nd
euro
are
a-19
Italy
Spai
n
Une
mpl
oym
ent r
ate
(%)
Unemployment 2009 Unemployment 2014 Youth unemployment 2014
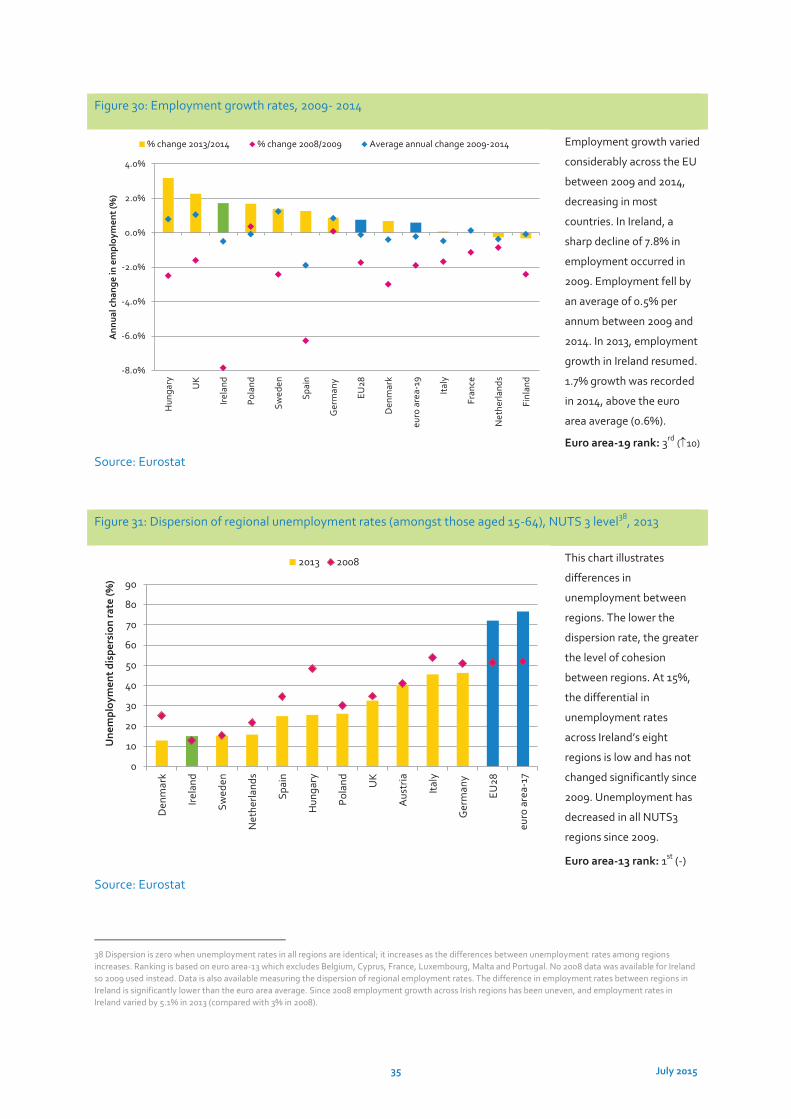
35 July 2015
Figure 30: Employment growth rates, 2009- 2014
Employment growth varied
considerably across the EU
between 2009 and 2014,
decreasing in most
countries. In Ireland, a
sharp decline of 7.8% in
employment occurred in
2009. Employment fell by
an average of 0.5% per
annum between 2009 and
2014. In 2013, employment
growth in Ireland resumed.
1.7% growth was recorded
in 2014, above the euro
area average (0.6%).
Euro area-19 rank: 3rd ( 10)
Source: Eurostat
Figure 31: Dispersion of regional unemployment rates (amongst those aged 15-64), NUTS 3 level38, 2013
This chart illustrates
differences in
unemployment between
regions. The lower the
dispersion rate, the greater
the level of cohesion
between regions. At 15%,
the differential in
unemployment rates
across Ireland’s eight
regions is low and has not
changed significantly since
2009. Unemployment has
decreased in all NUTS3
regions since 2009.
Euro area-13 rank: 1st (-)
Source: Eurostat
38 Dispersion is zero when unemployment rates in all regions are identical; it increases as the differences between unemployment rates among regions increases. Ranking is based on euro area-13 which excludes Belgium, Cyprus, France, Luxembourg, Malta and Portugal. No 2008 data was available for Ireland so 2009 used instead. Data is also available measuring the dispersion of regional employment rates. The difference in employment rates between regions in Ireland is significantly lower than the euro area average. Since 2008 employment growth across Irish regions has been uneven, and employment rates in Ireland varied by 5.1% in 2013 (compared with 3% in 2008).
-8.0%
-6.0%
-4.0%
-2.0%
0.0%
2.0%
4.0%H
unga
ry UK
Irela
nd
Pola
nd
Swed
en
Spai
n
Ger
man
y
EU28
Den
mar
k
euro
are
a-19
Italy
Fran
ce
Net
herla
nds
Finl
and
Ann
ual c
hang
e in
em
ploy
men
t (%
)
% change 2013/2014 % change 2008/2009 Average annual change 2009-2014
0
10
20
30
40
50
60
70
80
90
Den
mar
k
Irela
nd
Swed
en
Net
herla
nds
Spai
n
Hun
gary
Pola
nd UK
Aus
tria
Italy
Ger
man
y
EU28
euro
are
a-17
Une
mpl
oym
ent d
ispe
rsio
n ra
te (%
)
2013 2008
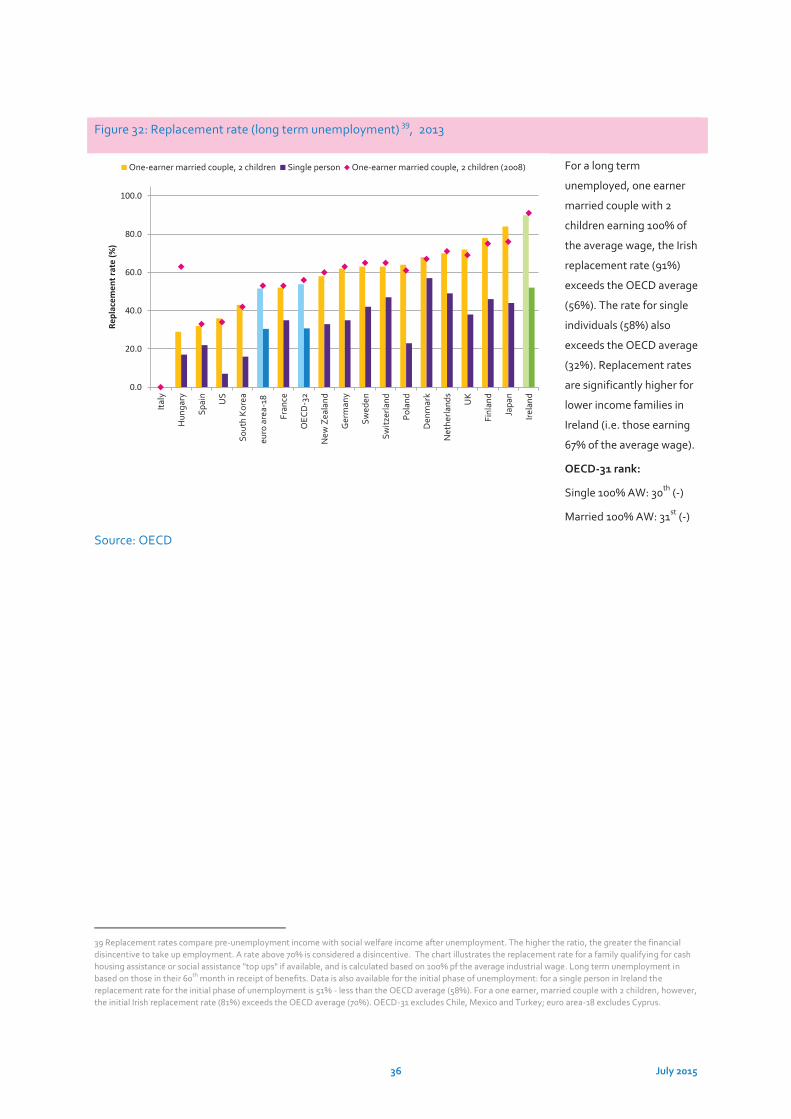
36 July 2015
Figure 32: Replacement rate (long term unemployment) 39, 2013
For a long term
unemployed, one earner
married couple with 2
children earning 100% of
the average wage, the Irish
replacement rate (91%)
exceeds the OECD average
(56%). The rate for single
individuals (58%) also
exceeds the OECD average
(32%). Replacement rates
are significantly higher for
lower income families in
Ireland (i.e. those earning
67% of the average wage).
OECD-31 rank:
Single 100% AW: 30th (-)
Married 100% AW: 31st (-)
Source: OECD
39 Replacement rates compare pre-unemployment income with social welfare income after unemployment. The higher the ratio, the greater the financial disincentive to take up employment. A rate above 70% is considered a disincentive. The chart illustrates the replacement rate for a family qualifying for cash housing assistance or social assistance "top ups" if available, and is calculated based on 100% pf the average industrial wage. Long term unemployment in based on those in their 60th month in receipt of benefits. Data is also available for the initial phase of unemployment: for a single person in Ireland the replacement rate for the initial phase of unemployment is 51% - less than the OECD average (58%). For a one earner, married couple with 2 children, however, the initial Irish replacement rate (81%) exceeds the OECD average (70%). OECD-31 excludes Chile, Mexico and Turkey; euro area-18 excludes Cyprus.
0.0
20.0
40.0
60.0
80.0
100.0
Italy
Hun
gary
Spai
n
US
Sout
h K
orea
euro
are
a-18
Fran
ce
OEC
D-3
2
New
Zea
land
Ger
man
y
Swed
en
Switz
erla
nd
Pola
nd
Den
mar
k
Net
herla
nds
UK
Finl
and
Japa
n
Irela
nd
Repl
acem
ent r
ate
(%)
One-earner married couple, 2 children Single person One-earner married couple, 2 children (2008)
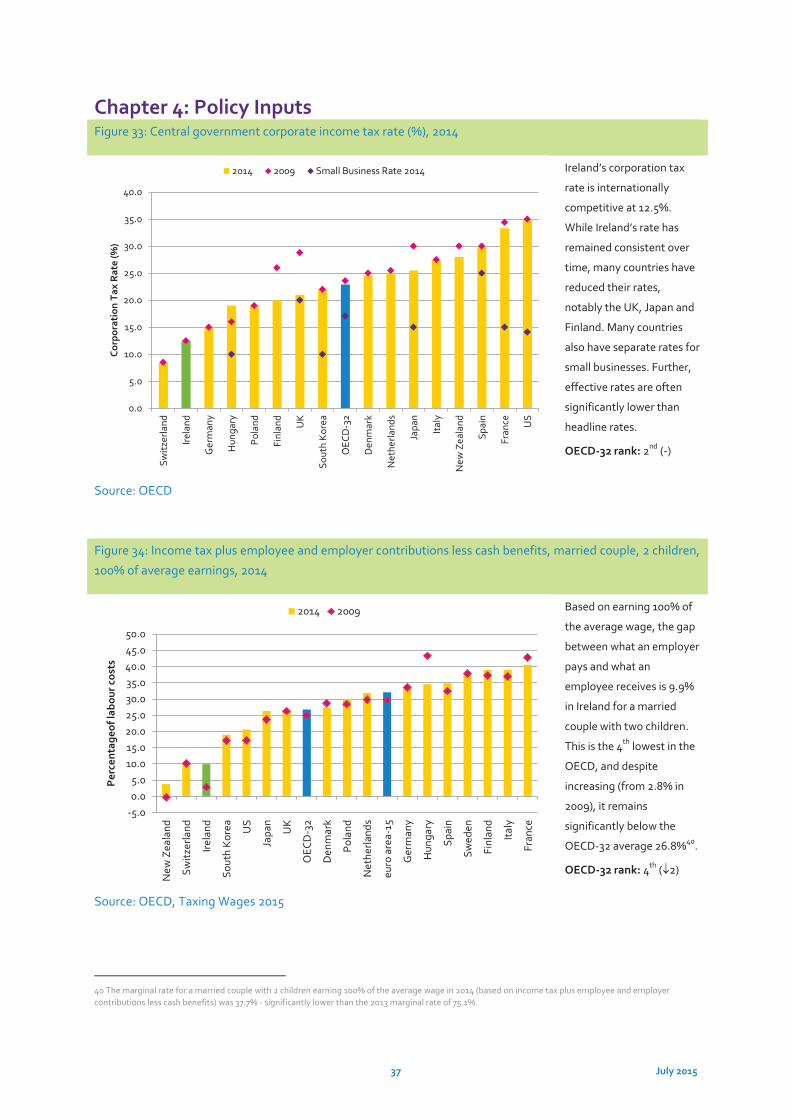
37 July 2015
Chapter 4: Policy Inputs Figure 33: Central government corporate income tax rate (%), 2014
Ireland’s corporation tax
rate is internationally
competitive at 12.5%.
While Ireland’s rate has
remained consistent over
time, many countries have
reduced their rates,
notably the UK, Japan and
Finland. Many countries
also have separate rates for
small businesses. Further,
effective rates are often
significantly lower than
headline rates.
OECD-32 rank: 2nd (-)
Source: OECD
Figure 34: Income tax plus employee and employer contributions less cash benefits, married couple, 2 children,
100% of average earnings, 2014
Based on earning 100% of
the average wage, the gap
between what an employer
pays and what an
employee receives is 9.9%
in Ireland for a married
couple with two children.
This is the 4th lowest in the
OECD, and despite
increasing (from 2.8% in
2009), it remains
significantly below the
OECD-32 average 26.8%40.
OECD-32 rank: 4th ( 2)
Source: OECD, Taxing Wages 2015
40 The marginal rate for a married couple with 2 children earning 100% of the average wage in 2014 (based on income tax plus employee and employer contributions less cash benefits) was 37.7% - significantly lower than the 2013 marginal rate of 75.1%.
0.0
5.0
10.0
15.0
20.0
25.0
30.0
35.0
40.0
Switz
erla
nd
Irela
nd
Ger
man
y
Hun
gary
Pola
nd
Finl
and
UK
Sout
h K
orea
OEC
D-3
2
Den
mar
k
Net
herla
nds
Japa
n
Italy
New
Zea
land
Spai
n
Fran
ce US
Corp
orat
ion
Tax
Rat
e (%
)
2014 2009 Small Business Rate 2014
-5.00.05.0
10.015.020.025.030.035.040.045.050.0
New
Zea
land
Switz
erla
nd
Irela
nd
Sout
h K
orea U
S
Japa
n
UK
OEC
D-3
2
Den
mar
k
Pola
nd
Net
herla
nds
euro
are
a-15
Ger
man
y
Hun
gary
Spai
n
Swed
en
Finl
and
Italy
Fran
ce
Per
cent
ageo
f lab
our c
osts
2014 2009
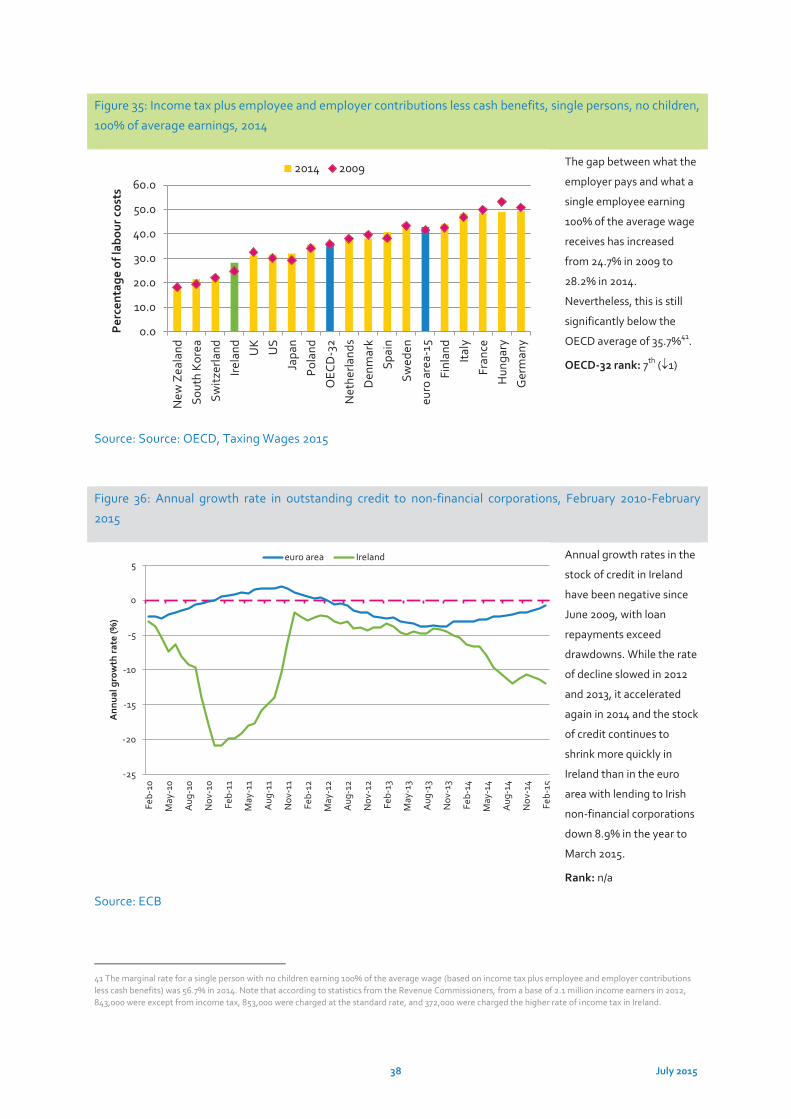
38 July 2015
Figure 35: Income tax plus employee and employer contributions less cash benefits, single persons, no children,
100% of average earnings, 2014
The gap between what the
employer pays and what a
single employee earning
100% of the average wage
receives has increased
from 24.7% in 2009 to
28.2% in 2014.
Nevertheless, this is still
significantly below the
OECD average of 35.7%41.
OECD-32 rank: 7th ( 1)
Source: Source: OECD, Taxing Wages 2015
Figure 36: Annual growth rate in outstanding credit to non-financial corporations, February 2010-February
2015
Annual growth rates in the
stock of credit in Ireland
have been negative since
June 2009, with loan
repayments exceed
drawdowns. While the rate
of decline slowed in 2012
and 2013, it accelerated
again in 2014 and the stock
of credit continues to
shrink more quickly in
Ireland than in the euro
area with lending to Irish
non-financial corporations
down 8.9% in the year to
March 2015.
Rank: n/a
Source: ECB
41 The marginal rate for a single person with no children earning 100% of the average wage (based on income tax plus employee and employer contributions less cash benefits) was 56.7% in 2014. Note that according to statistics from the Revenue Commissioners, from a base of 2.1 million income earners in 2012, 843,000 were except from income tax, 853,000 were charged at the standard rate, and 372,000 were charged the higher rate of income tax in Ireland.
0.0
10.0
20.0
30.0
40.0
50.0
60.0N
ew Z
eala
nd
Sout
h K
orea
Switz
erla
nd
Irela
nd UK
US
Japa
n
Pola
nd
OEC
D-3
2
Net
herla
nds
Den
mar
k
Spai
n
Swed
en
euro
are
a-15
Finl
and
Italy
Fran
ce
Hun
gary
Ger
man
y
Per
cent
age
of la
bour
cos
ts
2014 2009
-25
-20
-15
-10
-5
0
5
Feb-
10
May
-10
Aug
-10
Nov
-10
Feb-
11
May
-11
Aug
-11
Nov
-11
Feb-
12
May
-12
Aug
-12
Nov
-12
Feb-
13
May
-13
Aug
-13
Nov
-13
Feb-
14
May
-14
Aug
-14
Nov
-14
Feb-
15
Ann
ual g
row
th ra
te (%
)
euro area Ireland
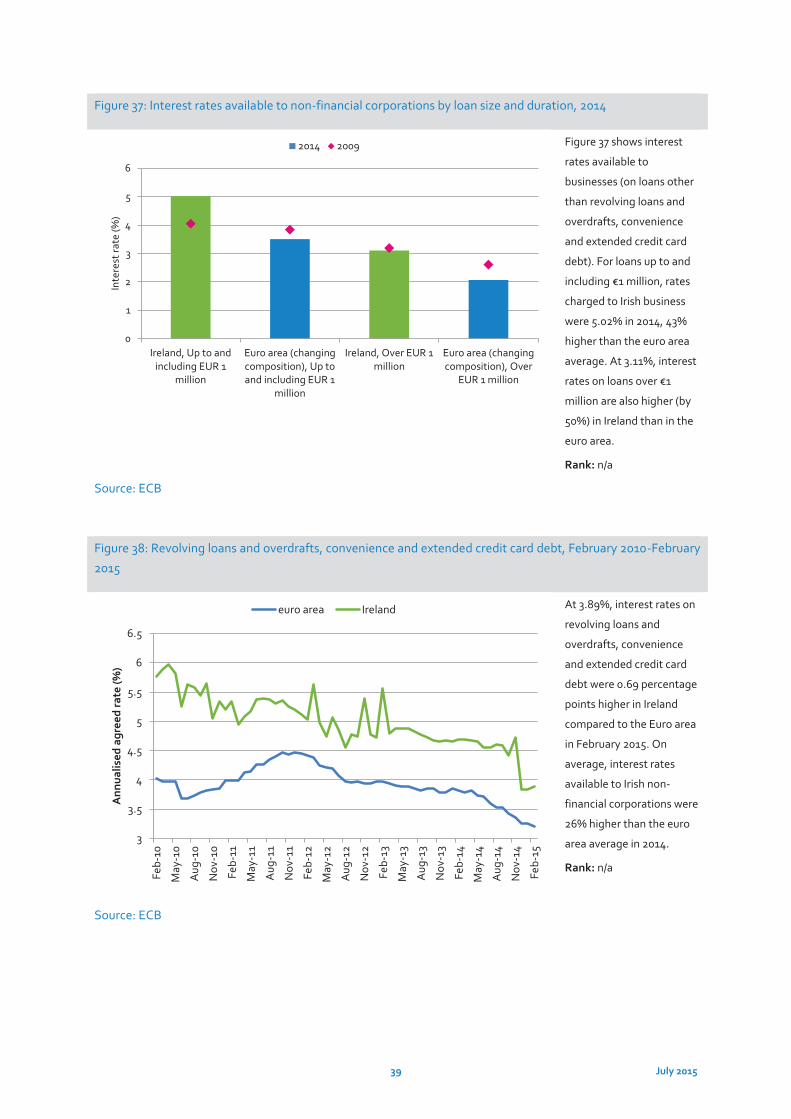
39 July 2015
Figure 37: Interest rates available to non-financial corporations by loan size and duration, 2014
Figure 37 shows interest
rates available to
businesses (on loans other
than revolving loans and
overdrafts, convenience
and extended credit card
debt). For loans up to and
including €1 million, rates
charged to Irish business
were 5.02% in 2014, 43%
higher than the euro area
average. At 3.11%, interest
rates on loans over €1
million are also higher (by
50%) in Ireland than in the
euro area.
Rank: n/a
Source: ECB
Figure 38: Revolving loans and overdrafts, convenience and extended credit card debt, February 2010-February
2015
At 3.89%, interest rates on
revolving loans and
overdrafts, convenience
and extended credit card
debt were 0.69 percentage
points higher in Ireland
compared to the Euro area
in February 2015. On
average, interest rates
available to Irish non-
financial corporations were
26% higher than the euro
area average in 2014.
Rank: n/a
Source: ECB
0
1
2
3
4
5
6
Ireland, Up to andincluding EUR 1
million
Euro area (changingcomposition), Up toand including EUR 1
million
Ireland, Over EUR 1million
Euro area (changingcomposition), Over
EUR 1 million
Inte
rest
rate
(%)
2014 2009
3
3.5
4
4.5
5
5.5
6
6.5
Feb-
10
May
-10
Aug
-10
Nov
-10
Feb-
11
May
-11
Aug
-11
Nov
-11
Feb-
12
May
-12
Aug
-12
Nov
-12
Feb-
13
May
-13
Aug
-13
Nov
-13
Feb-
14
May
-14
Aug
-14
Nov
-14
Feb-
15
Ann
ualis
ed a
gree
d ra
te (%
)
euro area Ireland
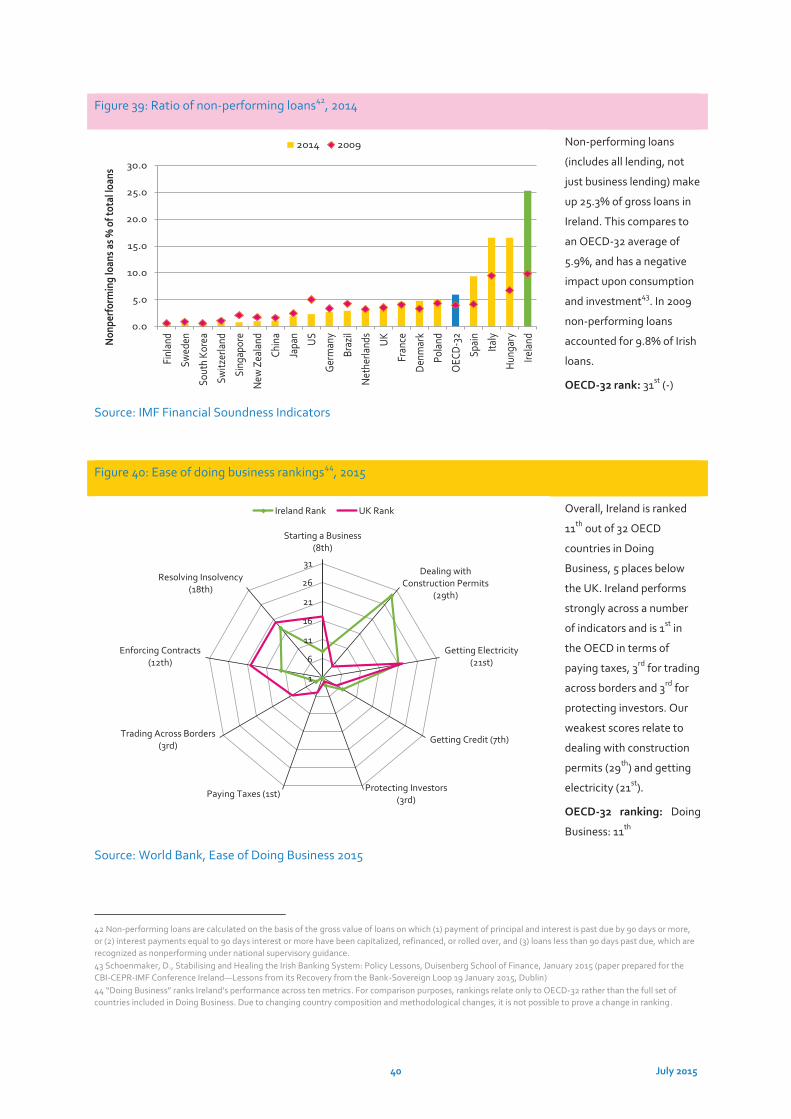
40 July 2015
Figure 39: Ratio of non-performing loans42, 2014
Non-performing loans
(includes all lending, not
just business lending) make
up 25.3% of gross loans in
Ireland. This compares to
an OECD-32 average of
5.9%, and has a negative
impact upon consumption
and investment43. In 2009
non-performing loans
accounted for 9.8% of Irish
loans.
OECD-32 rank: 31st (-)
Source: IMF Financial Soundness Indicators
Figure 40: Ease of doing business rankings44, 2015
Overall, Ireland is ranked
11th out of 32 OECD
countries in Doing
Business, 5 places below
the UK. Ireland performs
strongly across a number
of indicators and is 1st in
the OECD in terms of
paying taxes, 3rd for trading
across borders and 3rd for
protecting investors. Our
weakest scores relate to
dealing with construction
permits (29th) and getting
electricity (21st).
OECD-32 ranking: Doing
Business: 11th
Source: World Bank, Ease of Doing Business 2015
42 Non-performing loans are calculated on the basis of the gross value of loans on which (1) payment of principal and interest is past due by 90 days or more, or (2) interest payments equal to 90 days interest or more have been capitalized, refinanced, or rolled over, and (3) loans less than 90 days past due, which are recognized as nonperforming under national supervisory guidance. 43 Schoenmaker, D., Stabilising and Healing the Irish Banking System: Policy Lessons, Duisenberg School of Finance, January 2015 (paper prepared for the CBI-CEPR-IMF Conference Ireland—Lessons from its Recovery from the Bank-Sovereign Loop 19 January 2015, Dublin) 44 “Doing Business” ranks Ireland’s performance across ten metrics. For comparison purposes, rankings relate only to OECD-32 rather than the full set of countries included in Doing Business. Due to changing country composition and methodological changes, it is not possible to prove a change in ranking.
0.0
5.0
10.0
15.0
20.0
25.0
30.0Fi
nlan
d
Swed
en
Sout
h Ko
rea
Switz
erla
nd
Sing
apor
e
New
Zea
land
Chin
a
Japa
n
US
Germ
any
Braz
il
Net
herla
nds
UK
Fran
ce
Denm
ark
Pola
nd
OEC
D-32
Spai
n
Italy
Hung
ary
Irela
ndNon
perf
orm
ing
loan
s as %
of t
otal
loan
s
2014 2009
1
6
11
16
21
26
31
Starting a Business(8th)
Dealing withConstruction Permits
(29th)
Getting Electricity(21st)
Getting Credit (7th)
Protecting Investors(3rd)
Paying Taxes (1st)
Trading Across Borders(3rd)
Enforcing Contracts(12th)
Resolving Insolvency(18th)
Ireland Rank UK Rank
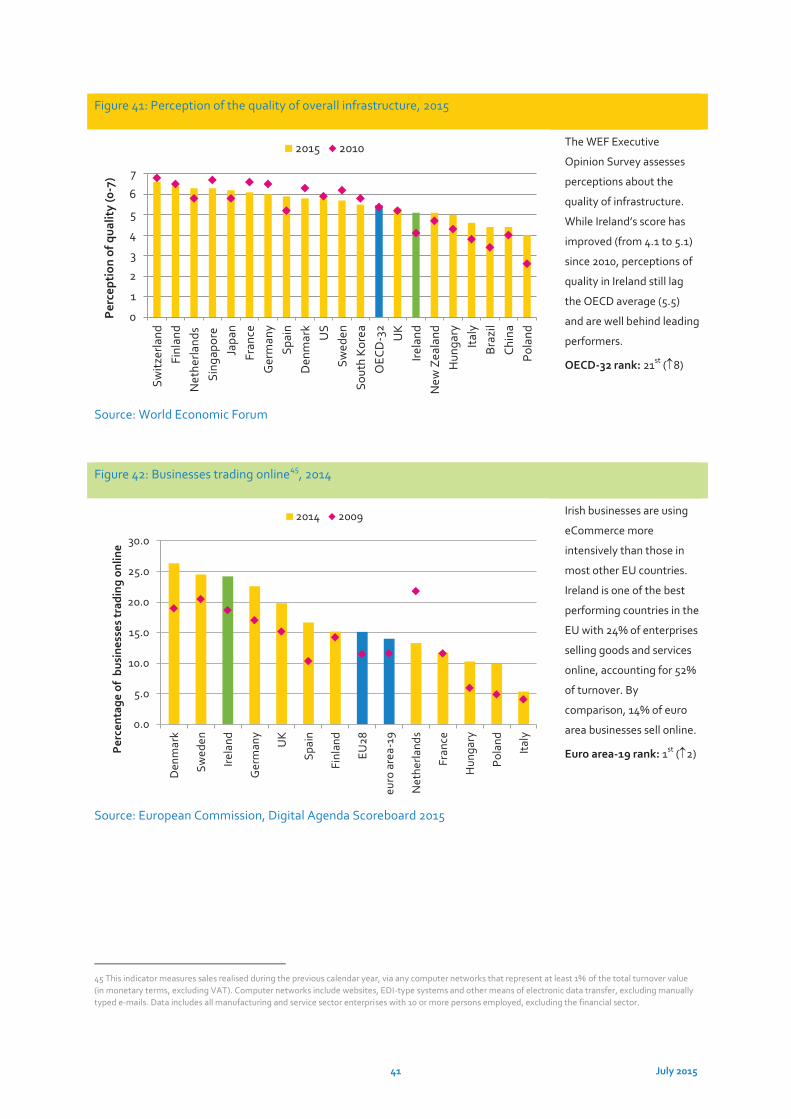
41 July 2015
Figure 41: Perception of the quality of overall infrastructure, 2015
The WEF Executive
Opinion Survey assesses
perceptions about the
quality of infrastructure.
While Ireland’s score has
improved (from 4.1 to 5.1)
since 2010, perceptions of
quality in Ireland still lag
the OECD average (5.5)
and are well behind leading
performers.
OECD-32 rank: 21st ( 8)
Source: World Economic Forum
Figure 42: Businesses trading online45, 2014
Irish businesses are using
eCommerce more
intensively than those in
most other EU countries.
Ireland is one of the best
performing countries in the
EU with 24% of enterprises
selling goods and services
online, accounting for 52%
of turnover. By
comparison, 14% of euro
area businesses sell online.
Euro area-19 rank: 1st ( 2)
Source: European Commission, Digital Agenda Scoreboard 2015
45 This indicator measures sales realised during the previous calendar year, via any computer networks that represent at least 1% of the total turnover value (in monetary terms, excluding VAT). Computer networks include websites, EDI-type systems and other means of electronic data transfer, excluding manually typed e-mails. Data includes all manufacturing and service sector enterprises with 10 or more persons employed, excluding the financial sector.
0
1
2
3
4
5
6
7Sw
itzer
land
Finl
and
Net
herla
nds
Sing
apor
eJa
pan
Fran
ceG
erm
any
Spai
nD
enm
ark
US
Swed
enSo
uth
Kor
eaO
ECD
-32
UK
Irela
ndN
ew Z
eala
ndH
unga
ryIta
lyBr
azil
Chin
aPo
land
Per
cept
ion
of q
ualit
y (0
-7)
2015 2010
0.0
5.0
10.0
15.0
20.0
25.0
30.0
Den
mar
k
Swed
en
Irela
nd
Ger
man
y
UK
Spai
n
Finl
and
EU28
euro
are
a-19
Net
herla
nds
Fran
ce
Hun
gary
Pola
nd
Italy
Per
cent
age
of b
usin
esse
s tr
adin
g on
line
2014 2009
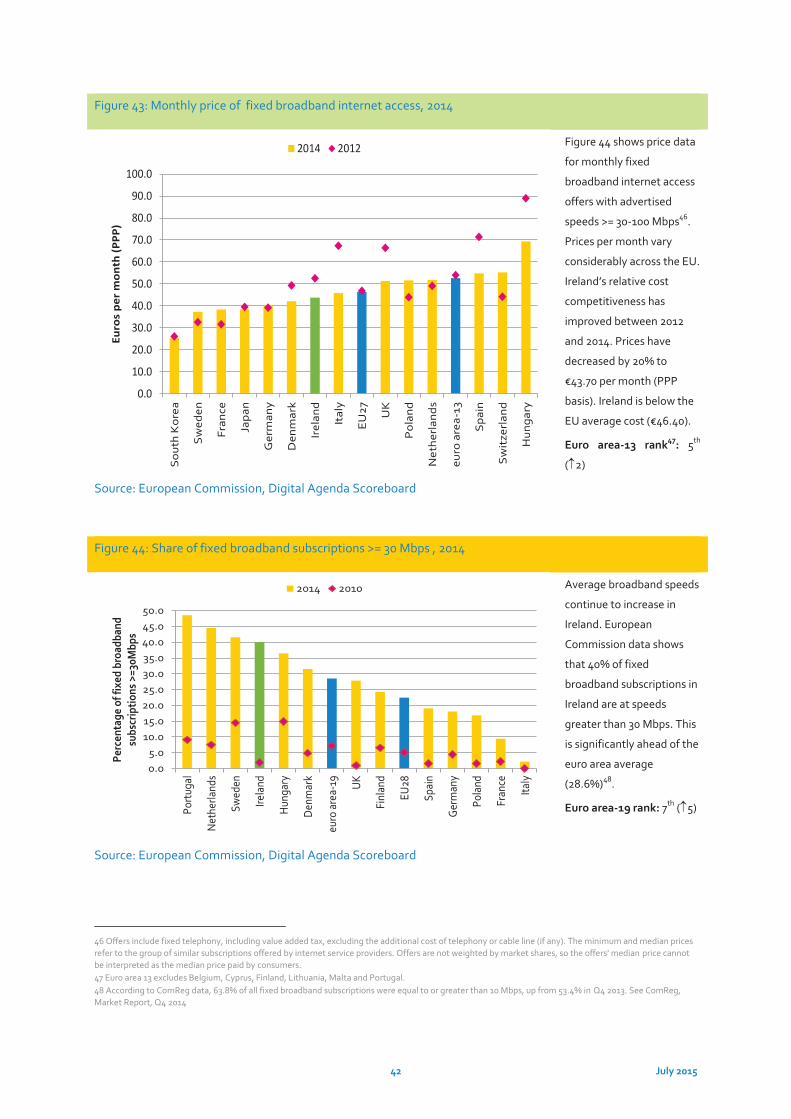
42 July 2015
Figure 43: Monthly price of fixed broadband internet access, 2014
Figure 44 shows price data
for monthly fixed
broadband internet access
offers with advertised
speeds >= 30-100 Mbps46.
Prices per month vary
considerably across the EU.
Ireland’s relative cost
competitiveness has
improved between 2012
and 2014. Prices have
decreased by 20% to
€43.70 per month (PPP
basis). Ireland is below the
EU average cost (€46.40).
Euro area-13 rank47: 5th
( 2)
Source: European Commission, Digital Agenda Scoreboard
Figure 44: Share of fixed broadband subscriptions >= 30 Mbps , 2014
Average broadband speeds
continue to increase in
Ireland. European
Commission data shows
that 40% of fixed
broadband subscriptions in
Ireland are at speeds
greater than 30 Mbps. This
is significantly ahead of the
euro area average
(28.6%)48.
Euro area-19 rank: 7th ( 5)
Source: European Commission, Digital Agenda Scoreboard
46 Offers include fixed telephony, including value added tax, excluding the additional cost of telephony or cable line (if any). The minimum and median prices refer to the group of similar subscriptions offered by internet service providers. Offers are not weighted by market shares, so the offers' median price cannot be interpreted as the median price paid by consumers. 47 Euro area 13 excludes Belgium, Cyprus, Finland, Lithuania, Malta and Portugal. 48 According to ComReg data, 63.8% of all fixed broadband subscriptions were equal to or greater than 10 Mbps, up from 53.4% in Q4 2013. See ComReg, Market Report, Q4 2014
0.0
10.0
20.0
30.0
40.0
50.0
60.0
70.0
80.0
90.0
100.0S
outh
Kor
ea
Sw
eden
Fran
ce
Japa
n
Ger
man
y
Den
mar
k
Irel
and
Ital
y
EU
27 UK
Pol
and
Net
her
land
s
euro
are
a-13
Spa
in
Sw
itze
rlan
d
Hun
gary
Euro
s pe
r mon
th (P
PP)
2014 2012
0.05.0
10.015.020.025.030.035.040.045.050.0
Port
ugal
Net
herla
nds
Swed
en
Irela
nd
Hun
gary
Den
mar
k
euro
are
a-19 UK
Finl
and
EU28
Spai
n
Ger
man
y
Pola
nd
Fran
ce
Italy
Perc
enta
ge o
f fix
ed b
road
band
su
bscr
iptio
ns >
=30M
bps
2014 2010
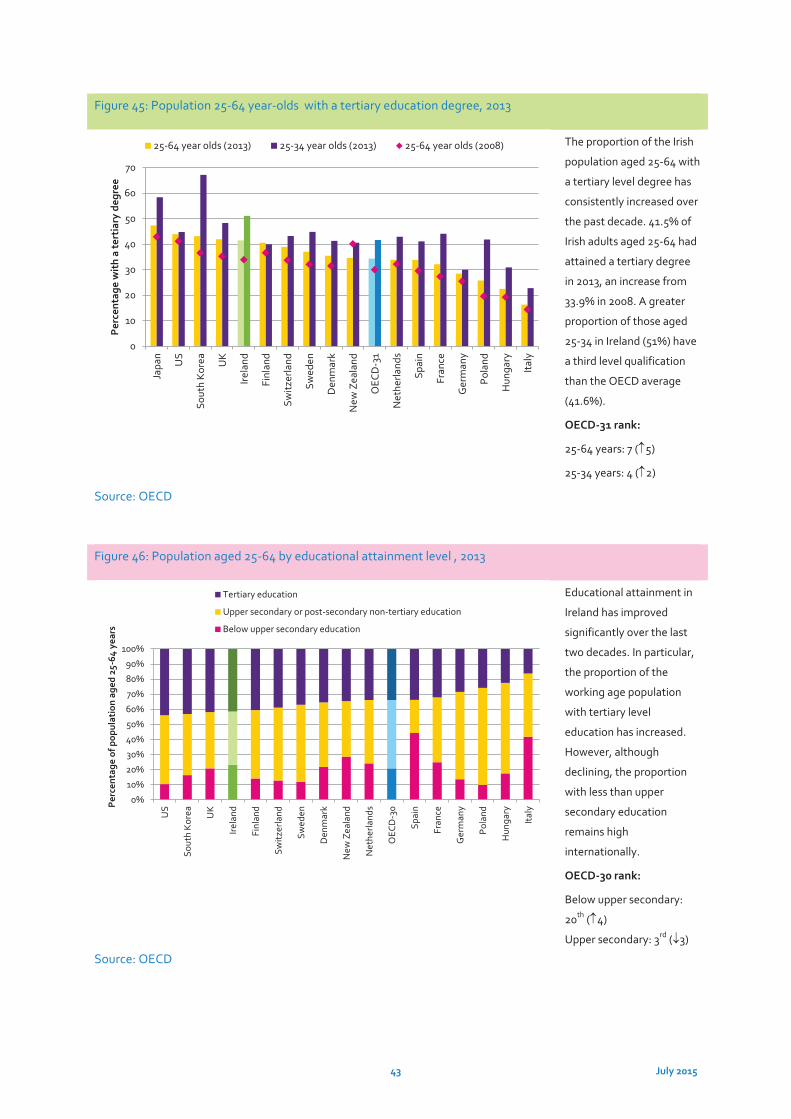
43 July 2015
Figure 45: Population 25-64 year-olds with a tertiary education degree, 2013
The proportion of the Irish
population aged 25-64 with
a tertiary level degree has
consistently increased over
the past decade. 41.5% of
Irish adults aged 25-64 had
attained a tertiary degree
in 2013, an increase from
33.9% in 2008. A greater
proportion of those aged
25-34 in Ireland (51%) have
a third level qualification
than the OECD average
(41.6%).
OECD-31 rank:
25-64 years: 7 ( 5)
25-34 years: 4 ( 2)
Source: OECD
Figure 46: Population aged 25-64 by educational attainment level , 2013
Educational attainment in
Ireland has improved
significantly over the last
two decades. In particular,
the proportion of the
working age population
with tertiary level
education has increased.
However, although
declining, the proportion
with less than upper
secondary education
remains high
internationally.
OECD-30 rank:
Below upper secondary:
20th ( 4)
Upper secondary: 3rd ( 3)
Source: OECD
0
10
20
30
40
50
60
70Ja
pan
US
Sout
h K
orea UK
Irela
nd
Finl
and
Switz
erla
nd
Swed
en
Den
mar
k
New
Zea
land
OEC
D-3
1
Net
herla
nds
Spai
n
Fran
ce
Ger
man
y
Pola
nd
Hun
gary
Italy
Per
cent
age
wit
h a
tert
iary
deg
ree
25-64 year olds (2013) 25-34 year olds (2013) 25-64 year olds (2008)
0%
10%
20%
30%
40%
50%
60%
70%
80%
90%
100%
US
Sout
h K
orea UK
Irela
nd
Finl
and
Switz
erla
nd
Swed
en
Den
mar
k
New
Zea
land
Net
herla
nds
OEC
D-3
0
Spai
n
Fran
ce
Ger
man
y
Pola
nd
Hun
gary
ItalyP
erce
ntag
e of
pop
ulat
ion
aged
25-
64 y
ears
Tertiary education
Upper secondary or post-secondary non-tertiary education
Below upper secondary education
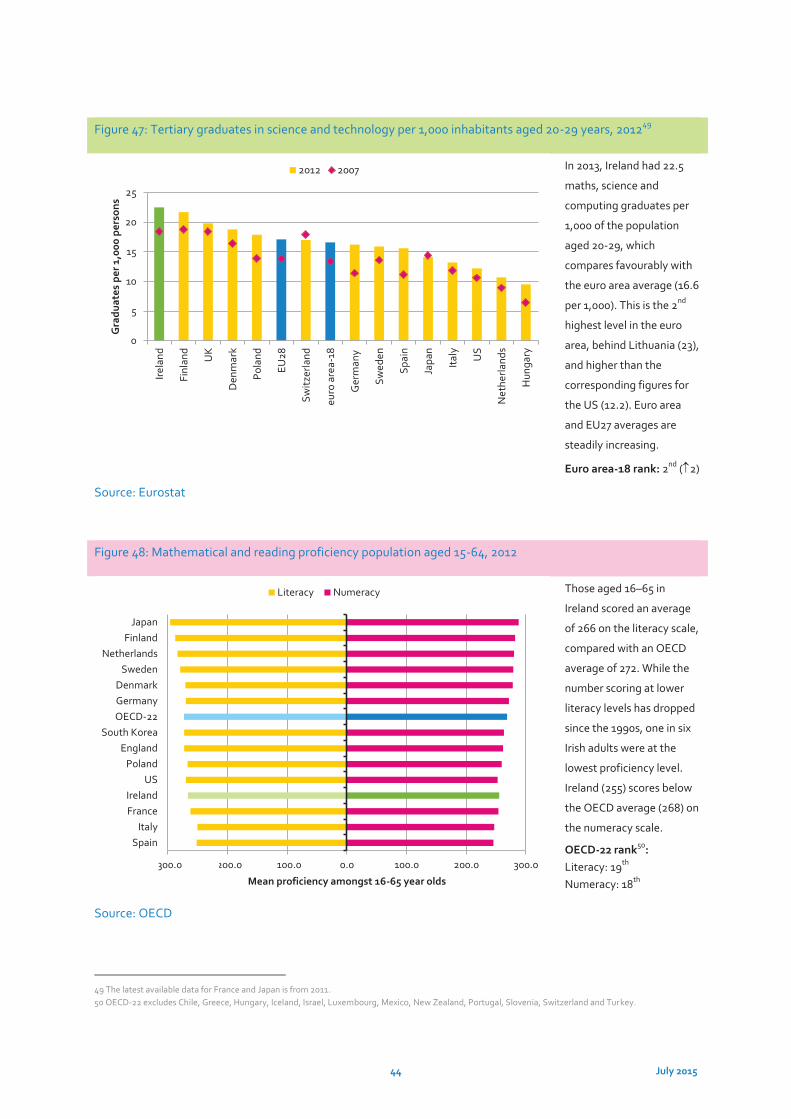
44 July 2015
Figure 47: Tertiary graduates in science and technology per 1,000 inhabitants aged 20-29 years, 201249
In 2013, Ireland had 22.5
maths, science and
computing graduates per
1,000 of the population
aged 20-29, which
compares favourably with
the euro area average (16.6
per 1,000). This is the 2nd
highest level in the euro
area, behind Lithuania (23),
and higher than the
corresponding figures for
the US (12.2). Euro area
and EU27 averages are
steadily increasing.
Euro area-18 rank: 2nd ( 2)
Source: Eurostat
Figure 48: Mathematical and reading proficiency population aged 15-64, 2012
Those aged 16–65 in
Ireland scored an average
of 266 on the literacy scale,
compared with an OECD
average of 272. While the
number scoring at lower
literacy levels has dropped
since the 1990s, one in six
Irish adults were at the
lowest proficiency level.
Ireland (255) scores below
the OECD average (268) on
the numeracy scale.
OECD-22 rank50: Literacy: 19th Numeracy: 18th
Source: OECD
49 The latest available data for France and Japan is from 2011. 50 OECD-22 excludes Chile, Greece, Hungary, Iceland, Israel, Luxembourg, Mexico, New Zealand, Portugal, Slovenia, Switzerland and Turkey.
0
5
10
15
20
25
Irela
nd
Finl
and
UK
Den
mar
k
Pola
nd
EU28
Switz
erla
nd
euro
are
a-18
Ger
man
y
Swed
en
Spai
n
Japa
n
Italy US
Net
herla
nds
Hun
gary
Gra
duat
es p
er 1
,000
per
sons
2012 2007
-300.0 -200.0 -100.0 0.0 100.0 200.0 300.0
SpainItaly
FranceIreland
USPoland
EnglandSouth Korea
OECD-22GermanyDenmark
SwedenNetherlands
FinlandJapan
Mean proficiency amongst 16-65 year olds
Literacy Numeracy
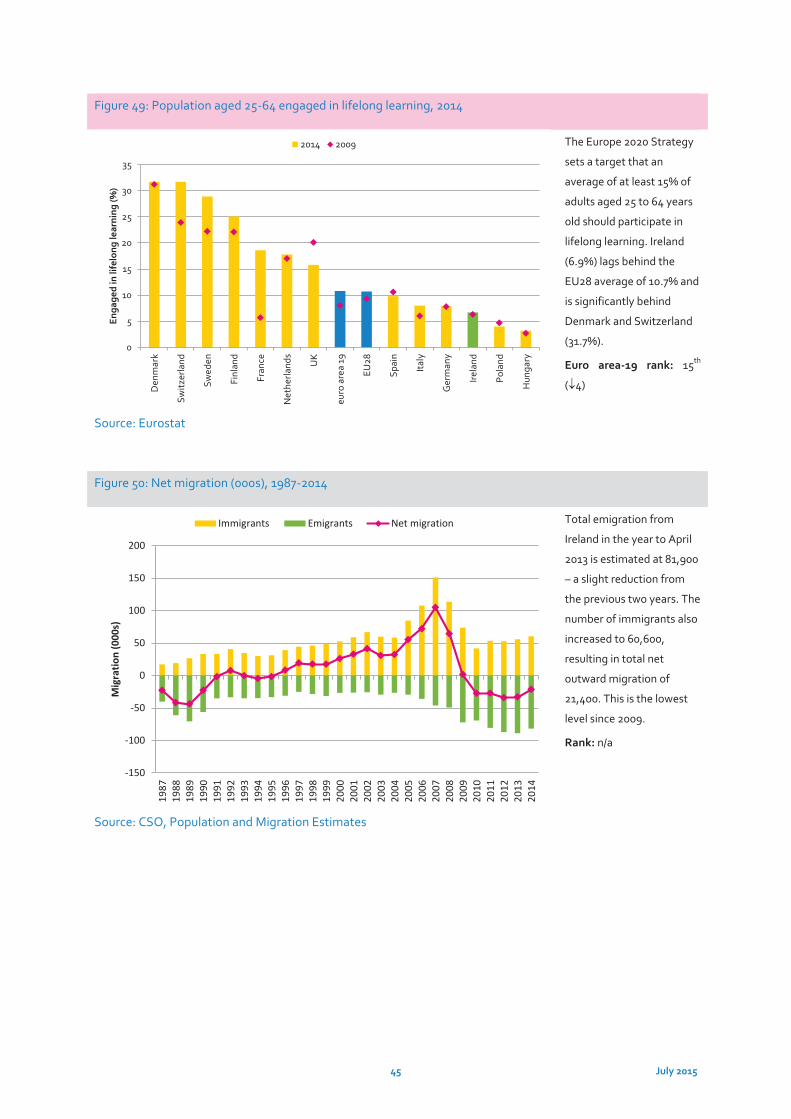
45 July 2015
Figure 49: Population aged 25-64 engaged in lifelong learning, 2014
The Europe 2020 Strategy
sets a target that an
average of at least 15% of
adults aged 25 to 64 years
old should participate in
lifelong learning. Ireland
(6.9%) lags behind the
EU28 average of 10.7% and
is significantly behind
Denmark and Switzerland
(31.7%).
Euro area-19 rank: 15th
( 4)
Source: Eurostat
Figure 50: Net migration (000s), 1987-2014
Total emigration from
Ireland in the year to April
2013 is estimated at 81,900
– a slight reduction from
the previous two years. The
number of immigrants also
increased to 60,600,
resulting in total net
outward migration of
21,400. This is the lowest
level since 2009.
Rank: n/a
Source: CSO, Population and Migration Estimates
0
5
10
15
20
25
30
35D
enm
ark
Switz
erla
nd
Swed
en
Finl
and
Fran
ce
Net
herla
nds
UK
euro
are
a 19
EU28
Spai
n
Italy
Ger
man
y
Irela
nd
Pola
nd
Hun
gary
Enga
ged
in li
felo
ng le
arni
ng (%
)
2014 2009
-150
-100
-50
0
50
100
150
200
1987
1988
1989
1990
1991
1992
1993
1994
1995
1996
1997
1998
1999
2000
2001
2002
2003
2004
2005
2006
2007
2008
2009
2010
2011
2012
2013
2014
Mig
ratio
n (0
00s)
Immigrants Emigrants Net migration
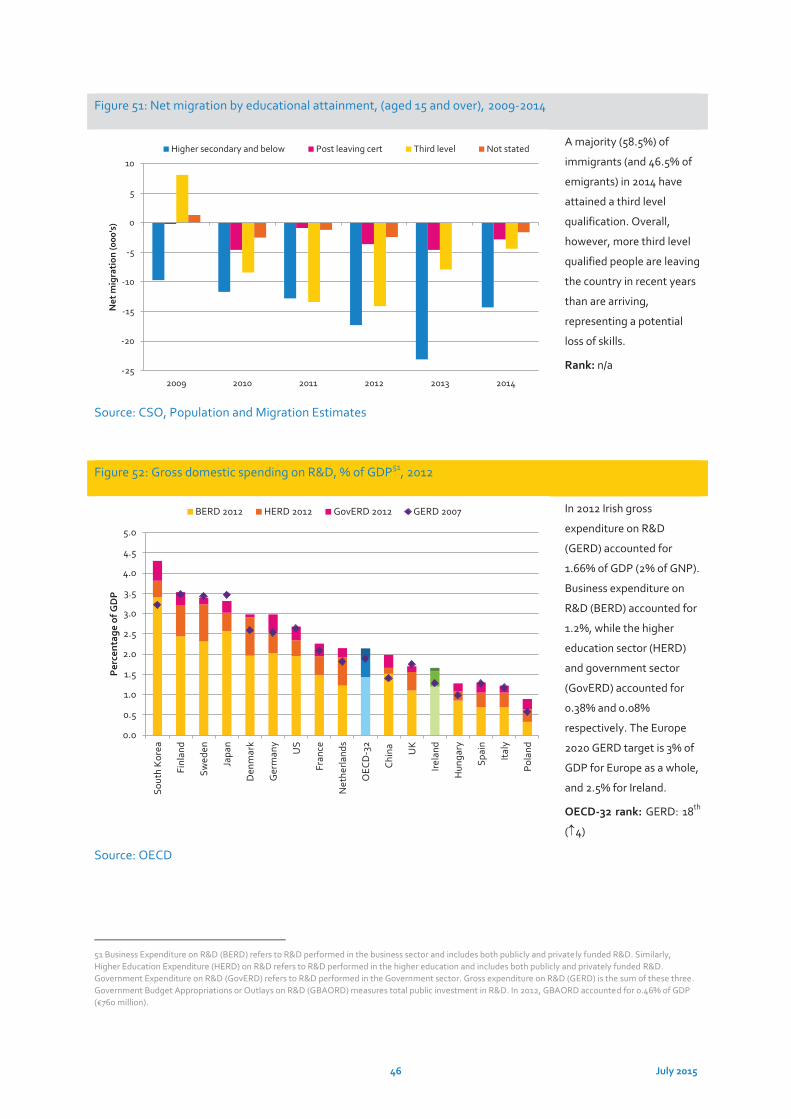
46 July 2015
Figure 51: Net migration by educational attainment, (aged 15 and over), 2009-2014
A majority (58.5%) of
immigrants (and 46.5% of
emigrants) in 2014 have
attained a third level
qualification. Overall,
however, more third level
qualified people are leaving
the country in recent years
than are arriving,
representing a potential
loss of skills.
Rank: n/a
Source: CSO, Population and Migration Estimates
Figure 52: Gross domestic spending on R&D, % of GDP51, 2012
In 2012 Irish gross
expenditure on R&D
(GERD) accounted for
1.66% of GDP (2% of GNP).
Business expenditure on
R&D (BERD) accounted for
1.2%, while the higher
education sector (HERD)
and government sector
(GovERD) accounted for
0.38% and 0.08%
respectively. The Europe
2020 GERD target is 3% of
GDP for Europe as a whole,
and 2.5% for Ireland.
OECD-32 rank: GERD: 18th
( 4)
Source: OECD
51 Business Expenditure on R&D (BERD) refers to R&D performed in the business sector and includes both publicly and privately funded R&D. Similarly, Higher Education Expenditure (HERD) on R&D refers to R&D performed in the higher education and includes both publicly and privately funded R&D. Government Expenditure on R&D (GovERD) refers to R&D performed in the Government sector. Gross expenditure on R&D (GERD) is the sum of these three. Government Budget Appropriations or Outlays on R&D (GBAORD) measures total public investment in R&D. In 2012, GBAORD accounted for 0.46% of GDP (€760 million).
-25
-20
-15
-10
-5
0
5
10
2009 2010 2011 2012 2013 2014
Net
mig
rati
on (0
00's
)
Higher secondary and below Post leaving cert Third level Not stated
0.0
0.5
1.0
1.5
2.0
2.5
3.0
3.5
4.0
4.5
5.0
Sout
h K
orea
Finl
and
Swed
en
Japa
n
Den
mar
k
Ger
man
y
US
Fran
ce
Net
herla
nds
OEC
D-3
2
Chin
a UK
Irela
nd
Hun
gary
Spai
n
Italy
Pola
nd
Per
cent
age
of G
DP
BERD 2012 HERD 2012 GovERD 2012 GERD 2007
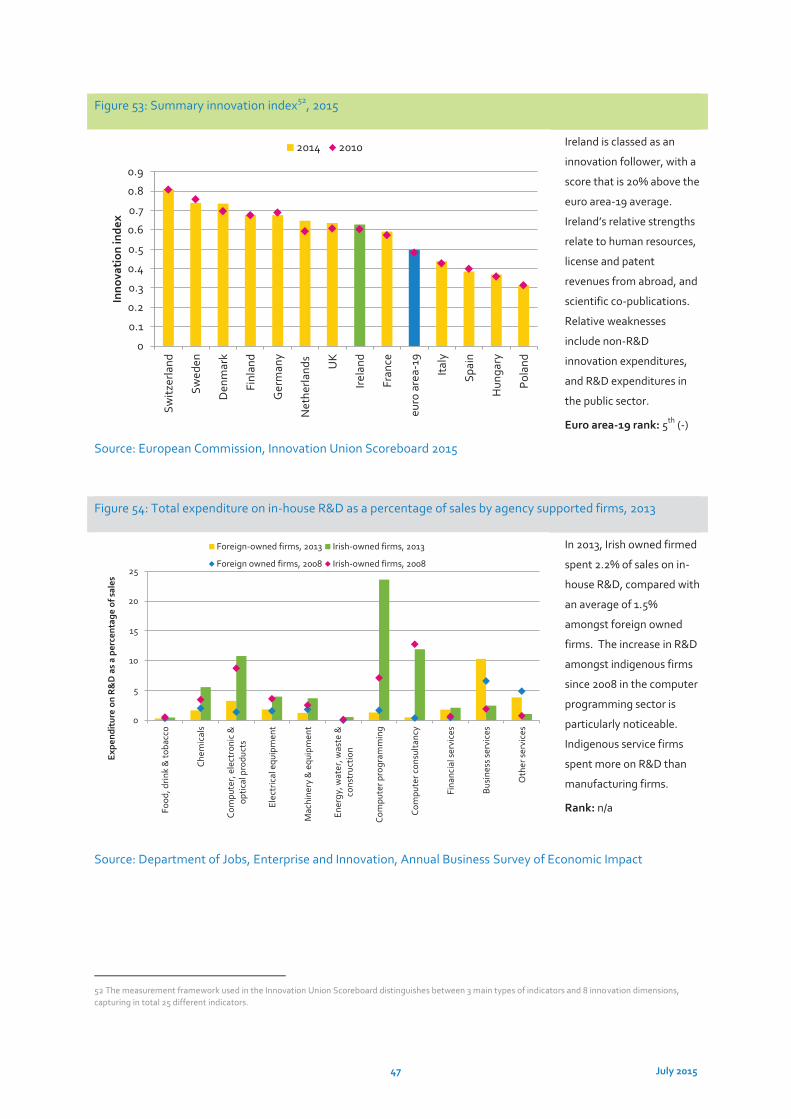
47 July 2015
Figure 53: Summary innovation index52, 2015
Ireland is classed as an
innovation follower, with a
score that is 20% above the
euro area-19 average.
Ireland’s relative strengths
relate to human resources,
license and patent
revenues from abroad, and
scientific co-publications.
Relative weaknesses
include non-R&D
innovation expenditures,
and R&D expenditures in
the public sector.
Euro area-19 rank: 5th (-)
Source: European Commission, Innovation Union Scoreboard 2015
Figure 54: Total expenditure on in-house R&D as a percentage of sales by agency supported firms, 2013
In 2013, Irish owned firmed
spent 2.2% of sales on in-
house R&D, compared with
an average of 1.5%
amongst foreign owned
firms. The increase in R&D
amongst indigenous firms
since 2008 in the computer
programming sector is
particularly noticeable.
Indigenous service firms
spent more on R&D than
manufacturing firms.
Rank: n/a
Source: Department of Jobs, Enterprise and Innovation, Annual Business Survey of Economic Impact
52 The measurement framework used in the Innovation Union Scoreboard distinguishes between 3 main types of indicators and 8 innovation dimensions, capturing in total 25 different indicators.
0
0.1
0.2
0.3
0.4
0.5
0.6
0.7
0.8
0.9Sw
itzer
land
Swed
en
Den
mar
k
Finl
and
Ger
man
y
Net
herla
nds
UK
Irela
nd
Fran
ce
euro
are
a-19
Italy
Spai
n
Hun
gary
Pola
nd
Inno
vati
on in
dex
2014 2010
0
5
10
15
20
25
Food
, drin
k &
toba
cco
Chem
ical
s
Com
pute
r, e
lect
roni
c &
optic
al p
rodu
cts
Elec
tric
al e
quip
men
t
Mac
hine
ry &
equ
ipm
ent
Ener
gy, w
ater
, was
te &
cons
truc
tion
Com
pute
r pro
gram
min
g
Com
pute
r con
sulta
ncy
Fina
ncia
l ser
vice
s
Busi
ness
ser
vice
s
Oth
er s
ervi
ces
Expe
ndit
ure
on R
&D
as
a pe
rcen
tage
of s
ales
Foreign-owned firms, 2013 Irish-owned firms, 2013
Foreign owned firms, 2008 Irish-owned firms, 2008
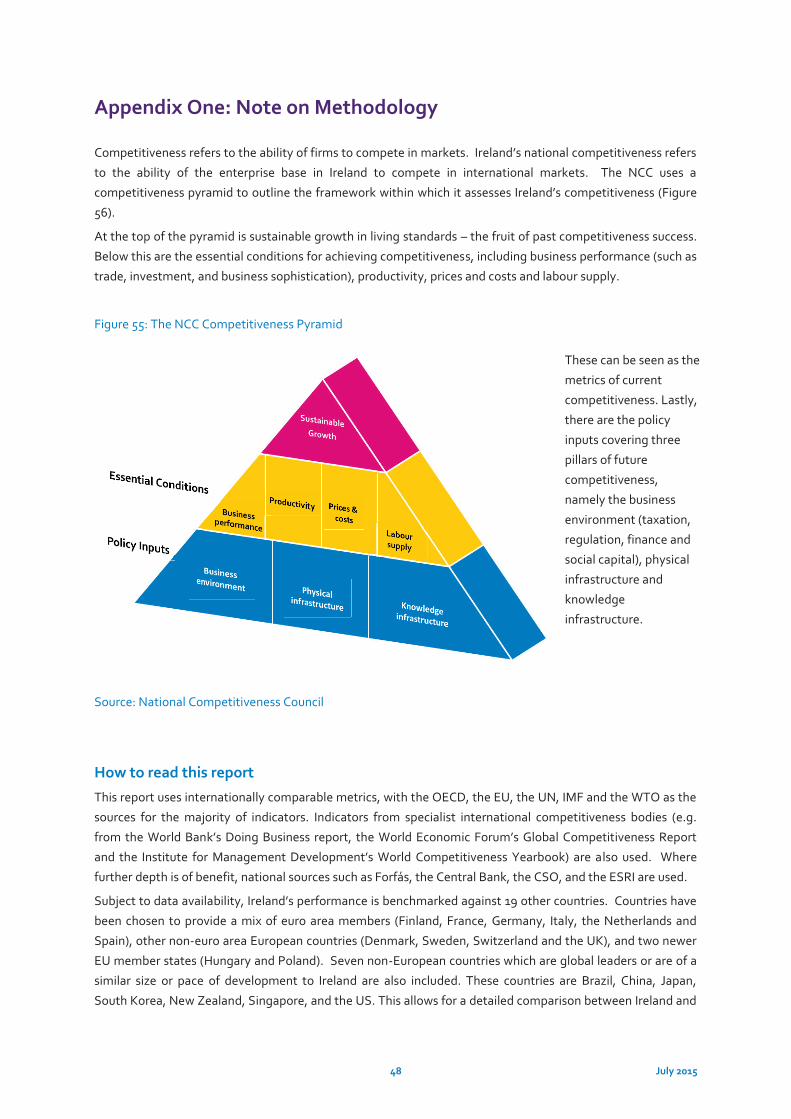
48 July 2015
Appendix One: Note on Methodology
Competitiveness refers to the ability of firms to compete in markets. Ireland’s national competitiveness refers
to the ability of the enterprise base in Ireland to compete in international markets. The NCC uses a
competitiveness pyramid to outline the framework within which it assesses Ireland’s competitiveness (Figure
56).
At the top of the pyramid is sustainable growth in living standards – the fruit of past competitiveness success.
Below this are the essential conditions for achieving competitiveness, including business performance (such as
trade, investment, and business sophistication), productivity, prices and costs and labour supply.
Figure 55: The NCC Competitiveness Pyramid
These can be seen as the
metrics of current
competitiveness. Lastly,
there are the policy
inputs covering three
pillars of future
competitiveness,
namely the business
environment (taxation,
regulation, finance and
social capital), physical
infrastructure and
knowledge
infrastructure.
Source: National Competitiveness Council
How to read this report
This report uses internationally comparable metrics, with the OECD, the EU, the UN, IMF and the WTO as the
sources for the majority of indicators. Indicators from specialist international competitiveness bodies (e.g.
from the World Bank’s Doing Business report, the World Economic Forum’s Global Competitiveness Report
and the Institute for Management Development’s World Competitiveness Yearbook) are also used. Where
further depth is of benefit, national sources such as Forfás, the Central Bank, the CSO, and the ESRI are used.
Subject to data availability, Ireland’s performance is benchmarked against 19 other countries. Countries have
been chosen to provide a mix of euro area members (Finland, France, Germany, Italy, the Netherlands and
Spain), other non-euro area European countries (Denmark, Sweden, Switzerland and the UK), and two newer
EU member states (Hungary and Poland). Seven non-European countries which are global leaders or are of a
similar size or pace of development to Ireland are also included. These countries are Brazil, China, Japan,
South Korea, New Zealand, Singapore, and the US. This allows for a detailed comparison between Ireland and
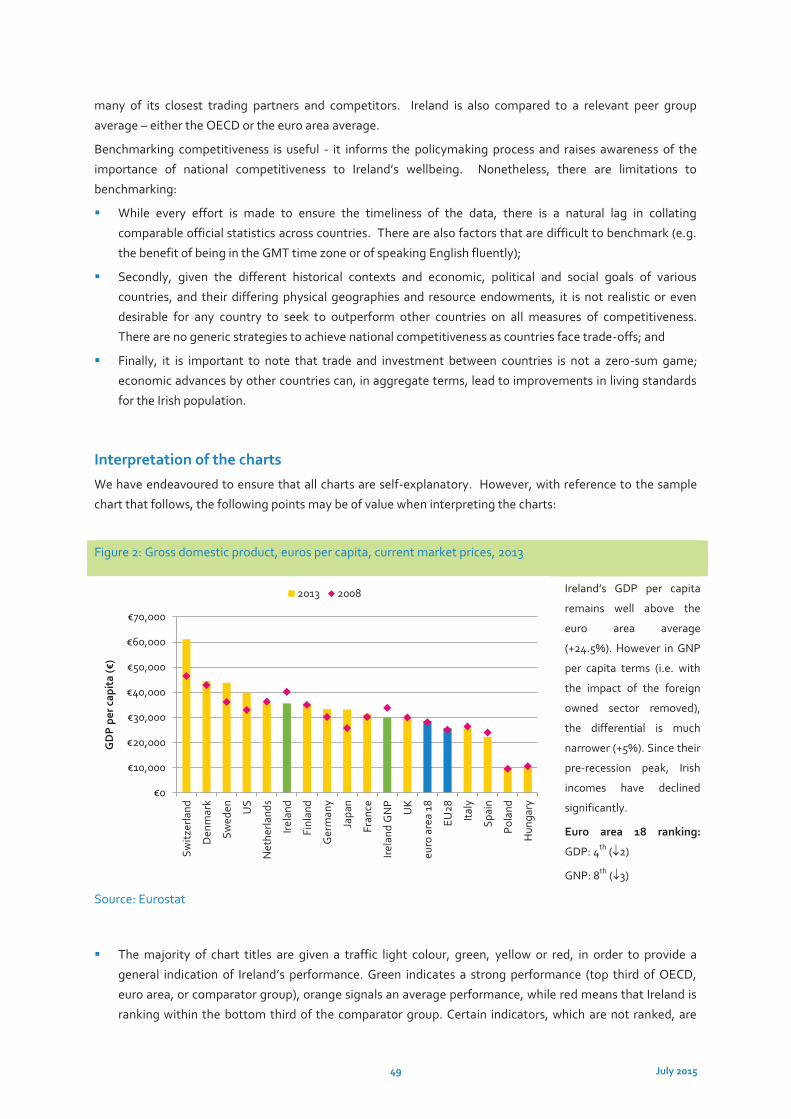
49 July 2015
many of its closest trading partners and competitors. Ireland is also compared to a relevant peer group
average – either the OECD or the euro area average.
Benchmarking competitiveness is useful - it informs the policymaking process and raises awareness of the
importance of national competitiveness to Ireland’s wellbeing. Nonetheless, there are limitations to
benchmarking:
While every effort is made to ensure the timeliness of the data, there is a natural lag in collating
comparable official statistics across countries. There are also factors that are difficult to benchmark (e.g.
the benefit of being in the GMT time zone or of speaking English fluently);
Secondly, given the different historical contexts and economic, political and social goals of various
countries, and their differing physical geographies and resource endowments, it is not realistic or even
desirable for any country to seek to outperform other countries on all measures of competitiveness.
There are no generic strategies to achieve national competitiveness as countries face trade-offs; and
Finally, it is important to note that trade and investment between countries is not a zero-sum game;
economic advances by other countries can, in aggregate terms, lead to improvements in living standards
for the Irish population.
Interpretation of the charts
We have endeavoured to ensure that all charts are self-explanatory. However, with reference to the sample
chart that follows, the following points may be of value when interpreting the charts:
Figure 2: Gross domestic product, euros per capita, current market prices, 2013
Ireland’s GDP per capita
remains well above the
euro area average
(+24.5%). However in GNP
per capita terms (i.e. with
the impact of the foreign
owned sector removed),
the differential is much
narrower (+5%). Since their
pre-recession peak, Irish
incomes have declined
significantly.
Euro area 18 ranking:
GDP: 4th ( 2)
GNP: 8th ( 3)
Source: Eurostat
The majority of chart titles are given a traffic light colour, green, yellow or red, in order to provide a
general indication of Ireland’s performance. Green indicates a strong performance (top third of OECD,
euro area, or comparator group), orange signals an average performance, while red means that Ireland is
ranking within the bottom third of the comparator group. Certain indicators, which are not ranked, are
€0
€10,000
€20,000
€30,000
€40,000
€50,000
€60,000
€70,000
Switz
erla
nd
Den
mar
k
Swed
en US
Net
herla
nds
Irela
nd
Finl
and
Ger
man
y
Japa
n
Fran
ce
Irela
nd G
NP
UK
euro
are
a 18
EU28
Italy
Spai
n
Pola
nd
Hun
gary
GD
P p
er c
apit
a (€
)
2013 2008
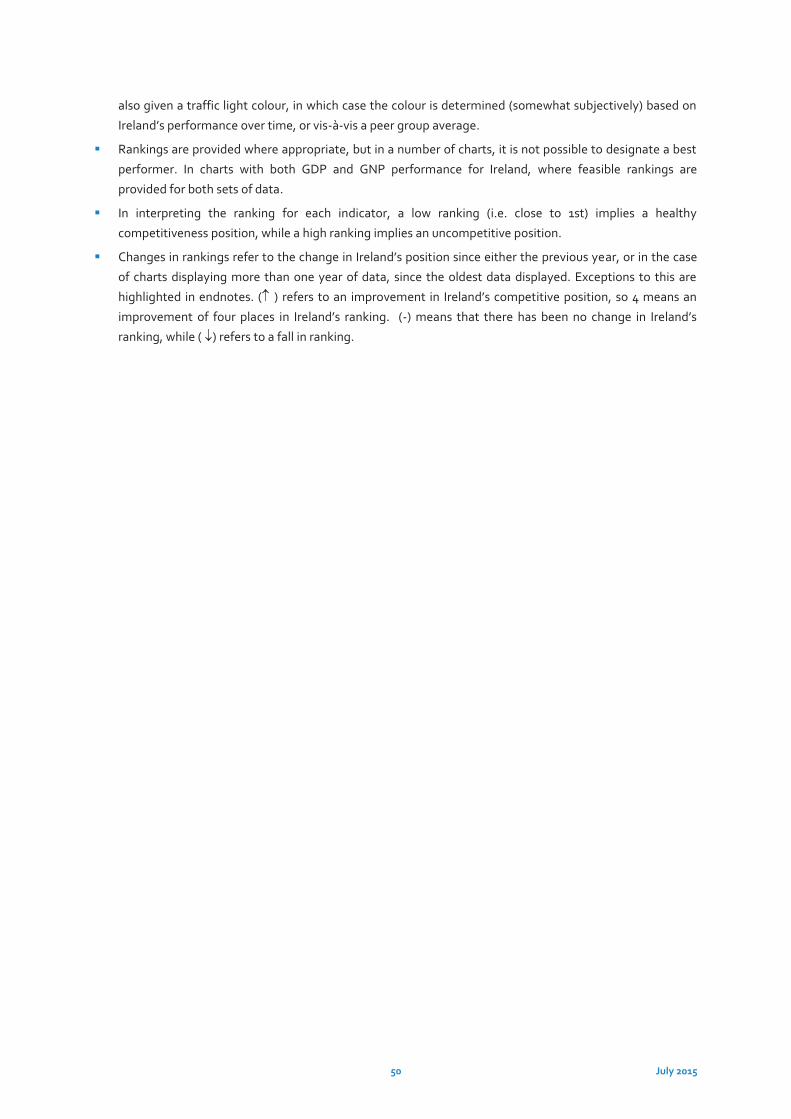
50 July 2015
also given a traffic light colour, in which case the colour is determined (somewhat subjectively) based on
Ireland’s performance over time, or vis-à-vis a peer group average.
Rankings are provided where appropriate, but in a number of charts, it is not possible to designate a best
performer. In charts with both GDP and GNP performance for Ireland, where feasible rankings are
provided for both sets of data.
In interpreting the ranking for each indicator, a low ranking (i.e. close to 1st) implies a healthy
competitiveness position, while a high ranking implies an uncompetitive position.
Changes in rankings refer to the change in Ireland’s position since either the previous year, or in the case
of charts displaying more than one year of data, since the oldest data displayed. Exceptions to this are
highlighted in endnotes. ( ) refers to an improvement in Ireland’s competitive position, so 4 means an
improvement of four places in Ireland’s ranking. (-) means that there has been no change in Ireland’s
ranking, while ( ) refers to a fall in ranking.