Iranian Rehabilitation...
80
Transcript of Iranian Rehabilitation...


Iranian Rehabilitation Journal The official Journal of the University of Social Welfare and Rehabilitation Sciences
Chairperson: Dr. Shahrbanoo Nakhaei
Editor-in-Chief
Hamid Reza Khorram Khorshid, MD, MPH, PhD, Associate Professor University of Social Welfare and Rehabilitation sciences Tehran, Iran [email protected]
Executive Manager
Dr. Reza Seyednour [email protected]
EDITORIAL BOARD Dadkhah Asghar, PhD, Professor
University of Social Welfare and Rehabilitation Sciences, Tehran, Iran Harizuka Susumu, PhD, Professor
Kyushu University, Fukuoka, Japan Helander Einar, PhD, President
Community Based Rehabilitation Organization, Lisbon, Portugal Hosseiny Seyed Ali, PhD, Assistant Professor
University of Social Welfare and Rehabilitation Sciences, Tehran, Iran Kamali Mohammad, PhD, Associate Professor
Iran University of Medical Sciences, Tehran, Iran Kumar Surender, PhD, Professor
Chikushi Jogakuen University, Japan Lotfi Younes, MD, Associate Professor
University of Social Welfare and Rehabilitation Sciences, Tehran, Iran McConkey Roy, PhD, Professor
University of Ulster, Northern Ireland Mirzamani Seyed Mahmood, PhD, Associate Professor
Baqiyatallah University of Medical Science, Tehran, Iran NajmAbadi Hossein, PhD, Professor
University of Social Welfare and Rehabilitation Sciences , Tehran, Iran Nillipour Reza, PhD, Professor
University of Social Welfare and Rehabilitation Sciences, Tehran, Iran Reife Carol, PhD, Associate Professor
Leiden University, Leiden, The Netherlands
EDITORIAL Staff Coordinator: Masoumeh Ganji, BSc
Web Master: Kamran Najafzadeh, BSc
Graphics and Design: Arash Fekri
Journal Citation Reports®: ISC (Islamic world Science Citation); IMEMR (Index Medicus for WHO); Magiran; Iran Medex, DAOJ, Index Copernicus
Editorial Contact
Iranian Rehabilitation Journal (IRJ) [email protected] University of Social Welfare and Rehabilitation Sciences [email protected] Evin, Kudakyar Ave., Tehran - 1985713831, Iran www.rehabj.ir Tel/Fax: +98-21-2218-0082 http://irjrehab.com
CONTENTS
Original Articles
Comparing the Results of Developmental Screening of 4-60 Months Old Children in Tehran Using 3
ASQ & PDQ Soheila Shahshahani, Roshanak Vameghi, Nadia Azari, Firoozeh Sajedi, Anooshirvan Kazemnejad
The Role of non-Linguistic Variables in Production of Complex Linguistic Structures by Hearing- 8
Impaired Children Robab Teymouri, Shahin Nematzadeh, Masoud Gharib, Naeimeh Daneshmandan
The Effect of Swedish Massage on Glycohemoglobin in Children with Diabetes Mellitus 16 Zahra Kashaninia, Akram Abedinipoor, Samaneh Hosainzadeh, Firoozeh Sajedi
Cerebral Palsy: Motor Types, Gross Motor Function and Associated Disorders 21 Farin Soleimani, Roshanak Vameghi, Mehdi Rassafiani, Nazila Akbar Fahimi, Zahra Nobakht
The Relationship Among Personality Factors, Motivational Strategies and Achievement Goals 32
Orientation in Predicting Academic Achievement of the Students with Intellectual Disability Masoume Pourmohamadreza Tajrishi, Mohamad Ashoori, Seyede Somaye Jalil-Abkenar, Jamal Ashoori,
Outcomes of Receiving a Master‟s Degree in “Rehabilitation Management” on Graduates‟ 39 Professional Lives Nikta Hatamizadeh, Seyed Majid Mirkhani, Ahmad Fotoohi, Asghar Makarem, Azar Petrami, Roshanak Vameghi
Persian Cued Speech: The Effect on the Perception of Persian Language Phonemes and 49 Monosyllabic Words with and without Sound in Hearing Impaired Children Guita Movallali
Prevalence of Feeding Problems in Children with Intellectual Disability 56 Mohammad Rezaei, Vahid Rashedi, Masoud Gharib, Gohar Lotfi
The Prevalence of Ear Disease in Sensorineural Hearing Impaired Children Below 18 Years -Old in 60
Deaf Welfare Clinic of Molavi Rehabilitation Center Naeimeh Daneshmandan, Samaneh Hosseinzadeh, Robab Teymouri
Co-Morbidity of Attention Deficit Hyperactivity Disorder (ADHD) and Tourette Syndrome in Child 63
Referral Psychiatry Clinic in IRAN Sahel Hemmati, Nasrin Amiri, Robab Teymouri, Masoud Garib
Review
Hypertonicity in Children with Cerebral Palsy: a New Perspective 66 Mehdi Rassafiani, Robab Sahaf
Case Report
A Case Report of Bilateral Upper Extremities Arthrogryposis 75 Amin Shahrokhi,Masoud Gharib, Vahid Rashedi, Mohammad Reza Kooshesh
2 Vol. 9 - Special Issue - Child NeuroRehabilitation
Iranian Rehabilitation Journal, Vol. 9, December 2011
Original Article
Comparing the Results of Developmental Screening of 4-60 Months
Old Children in Tehran Using ASQ & PDQ Soheila Shahshahani, MD; Roshanak Vameghi, MD; Nadia Azari, MD; Firoozeh Sajedi*, MD
Pediatric Neurorehabilitation Research Center, University of Social Welfare and Rehabilitation
Sciences,
Tehran, Iran
Anooshirvan Kazemnejad, PhD University of Tarbiat Modaress, Tehran, Iran
Objectives: This research was performed to compare the results of two parental-based developmental questionnaires.
Methods: In this study the developmental status of 196, 4-60 months old children were screened using
Ages and Stages Questionnaires (ASQ) and prescreening developmental Questionnaire (PDQ) in 4 primary health care clinics in Tehran. Convenient sampling was used. Data was analyzed by SPSS software.
Results: Using ASQ 18% of children were detected as having developmental disorders. Developmental
screening with PDQ showed that developmental delay or doubtful condition was seen in 20% and 19% of
children respectively. The estimated consistency coefficient between PDQ II and ASQ for fine and gross
motor domains was 0.05 and 0.24, and for language and personal-social issues were 0.18 and 0.06,
respectively. Based on two different categorizing possibilities for questionable scores of PDQ-II, that is,
"delayed" or "normal", the total agreement coefficient between two questionnaires were determined 0.30
and 0.20, respectively
Discussion: The process of developmental screening was changed in recent years and performing a correct
and useful developmental screening is easier today. Several screening tools are available now. Recent studies
showed that parental information about their child‟s development have good accuracy. For selecting a suitable
tool we must consider the validity, reliability, sensitivity, specificity and all other positive and negative points
about the tool of the test.
Conclusion: This study showed that the results of developmental screening of 4-60 months old children in
Tehran using ASQ and PDQ lead to different results. This is necessary that the results of screening are compared
with a diagnostic gold standard test.
Key Words: Developmental screening, ASQ, PDQ
Introduction
The importance of early detection of developmental
disorders in the well-being of children and their
families is approved (1). Nowadays there is an
increasing effort for detection of developmental
disorders at an earlier age because intervention
services are cost effective and when provided in early
childhood, have greater efficacy (2). These services
improve the developmental prognosis and have short
and long term benefits (3-6). The process of
developmental screening was changed in recent years
and today it is easier to perform a correct and useful
developmental screening. In order to detect
*All correspondence to: E-mail: [email protected]
Iranian Rehabilitation Journal
developmental disorders at an early age, the American
Academy of Pediatrics (AAP) has recommended that
pediatricians use developmental screening tools at 9, 18,
24 (or 30) months‟ child health visits (1).
In recent years the focus of pediatric medicine in
developed countries has changed from breast
feeding and child health topics to child‟s well being
and preventive medicine. In those societies early
detection and intervention of developmental disorders
are integrated in routine health care services. In
moderate to low income countries developmental
disorders occur in early childhood and are an
important morbidity factor for whole life because
3

still in these areas the priority of health services are
preventing iron deficiency anemia, improving
mother-child relationship and increasing social-
emotional stimuli (7, 8). Health system is the first
and in some countries the only situation that is
available for service providing to children. Thus
some references recommended that developmental
screening be administrated to children in outpatient
clinics or even for inpatient children that are
hospitalized for any other reasons (9-11).
Several screening tools are available now but their
approaches are different. There is no unique tool that
could be useful for all population or age-ranges (1).
It was suspected that, using parental report about an
screening tool is incorrect but several studies
showed that parental information about their child‟s
abilities is very worthy for predicting developmental
disorders (6, 12). On the other hand, it is possible
that during a routine child health care visit, the child
be ill, messy, hungry, sleepy or fearful and we know
that these circumstances are not suitable for showing
his/her abilities. Thus for preventing this problem,
developmental screening tools that use parental
reports are useful (13-16). Also standard objective
tools are time consuming, need more payment and
their providers need to have knowledge and
expertise for performing them. Thus parental-based
questionnaires are suitable option for developmental
screening because recent studies showed that
parents, regardless of their socioeconomic status,
child rearing experiments or their own health status,
have correct information about their child‟s
development (2, 12, 13, 15) and their opinions have
high validity and will lead to increasing rates of
early detection and intervention of developmental
disorders (9, 17, 18). The only barrier in this way is
inability to read or understand the questionnaires.
This problem can be easily relieved by orally
presenting or translating them (19).
This study was performed from February 2008 to
January 2009 in Tehran, Iran to compare the results
of two parental-based developmental questionnaires
Ages and Stages Questionnaires (ASQ) and
Prescreening Developmental Questionnaire-II (PDQ
II).
Materials and methods
PDQ-II is a developmental prescreening tool that is
derived from Denver Developmental Screening
Test-II (DDST-II). Ninety seven of 105 items of
DDST-II are changed to questions that can be answered by “YES” or “NO” by the care-giver.
4
They are categorized into 4 questionnaires for 0-9
month, 9-24 month, 2-4 year and 4-6 year old
children. The 75th and 95
th percentiles for each
question and also the developmental domain to
which it belongs are shown in front of it (20).
Caregivers must continue answering questions until
they arrive at 3 “NO” answers (it is not necessary
that the NO answers be consecutive). The answer to
each question can be: normal (which means the child
is able to do the task), delayed (which means the
child is not able to do the task that 90% of his/her
age-matched children can do) and caution (which
means the child is not able to do the task that 75% of
his/her age matched children can do). For
interpretation of the results, if the child has ≤1 delay
or ≤2 cautions (considered as suspicious),
developmental advices are given to parents and the
child must return for retesting by the PDQ-II one
month later. If the child is still in a „suspicious‟
condition in the second visit then he/she should be
referred for screening by the DDST-II. If in the first
prescreening visit child has ≥2 delays or ≥3 cautions
(considered as delayed), he/she should be screened
by the DDST-II as soon as possible (20). Research
has shown that using PDQ-II decreases the use of
Denver Developmental Screening Test-II (DDST-II)
that needs more time, expense and expertise to
administer, by 69% (21).
The ASQ are a series of 19 questionnaires designed
to be completed by parents when their infant/child is
4 to 60 months of age with a developmental quotient
range of 75-100. Each questionnaire contains 30
simply-worded items written at a 4th to 6
th grade
reading level, equally divided across the areas of
communication, fine motor, gross motor, personal-
social, and problem solving skills (22). The answers
to questions can be "yes," "sometimes," and "not
yet." Questionnaires are scored by comparing each
domain score with the screening cutoff score for that
domain. If the child's score falls at or below the
established cutoff score in one or more domains, it is
recommended that the child be referred for further
assessment. Test-retest reliability, at a two-week
interval, was found to be 94%. Interobserver
reliability was also 94%. Sensitivity ranged from
51% for the 4-month ASQ to 90% for the 36-month
ASQ, with a 75% overall sensitivity rate. Specificity
ranged from 81% for the 16-month ASQ, to 92% for
the 36-month ASQ, with an overall specificity rate of
86% (23). It is used in different studies worldwide and
in Iran as well (23-26).
Vol. 9 - Special Issue - Child Neuro Rehabilitation
For performing the study, 8 examiners (with a BSc
degree in occupational therapy or clinical
psychology) were trained in a 1 day workshop.
Convenient sampling was used and 196 children
aged 4-60 months, were tested in 4 primary health
care centers situated in south, north, east and
western regions of Tehran. The study was approved
by the Research Committee and thereafter by the
Ethical Committee of the University of Social
Welfare and Rehabilitation Sciences. Parents were
informed about the importance of developmental
screening and how the test was performed. Then
their written consent was acquired. The parents
whose children had developmental problems were
informed, guided and referred for additional
evaluations and interventions. The inclusions criteria
were: 1- age between 4 to 60 months 2- parental
cooperation. Exclusion criteria were: 1- having
obvious developmental delay or disability 2-
parental refusal to attend in the study.
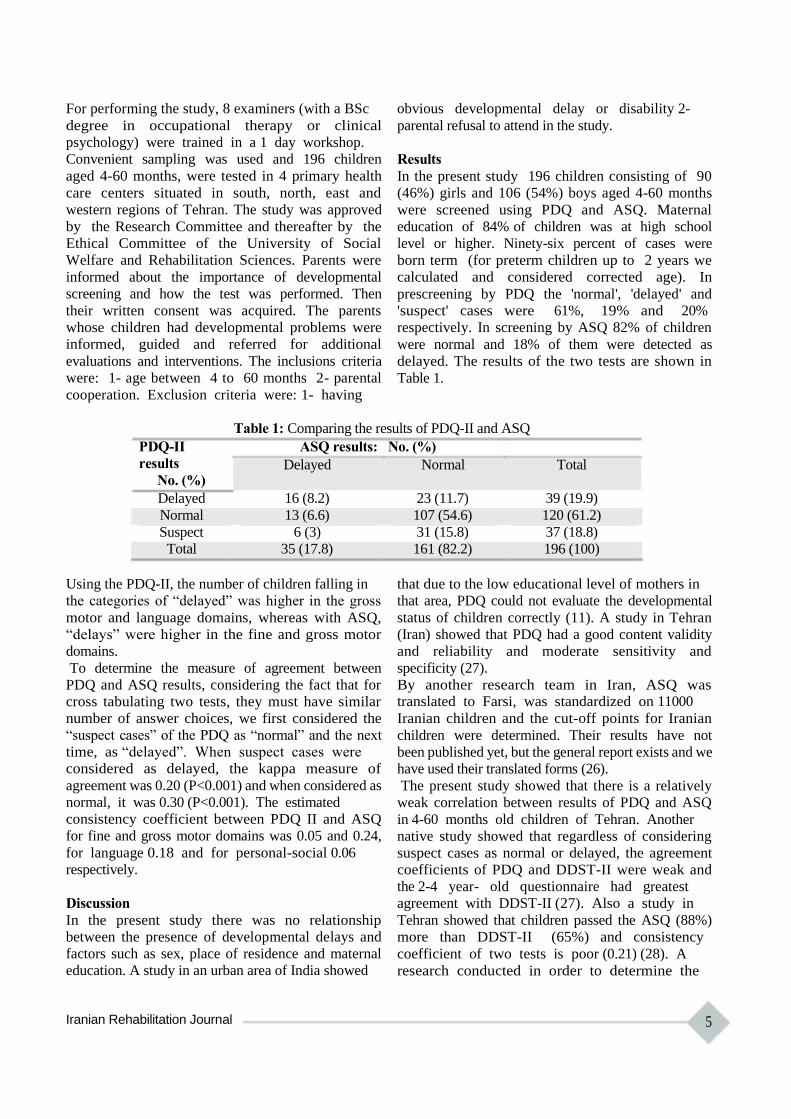
Results
In the present study 196 children consisting of 90
(46%) girls and 106 (54%) boys aged 4-60 months
were screened using PDQ and ASQ. Maternal
education of 84% of children was at high school
level or higher. Ninety-six percent of cases were
born term (for preterm children up to 2 years we
calculated and considered corrected age). In
prescreening by PDQ the 'normal', 'delayed' and
'suspect' cases were 61%, 19% and 20%
respectively. In screening by ASQ 82% of children
were normal and 18% of them were detected as
delayed. The results of the two tests are shown in
Table 1.
Table 1: Comparing the results of PDQ-II and ASQ
PDQ-II ASQ results: No. (%)
results Delayed Normal Total No. (%)
Delayed 16 (8.2) 23 (11.7) 39 (19.9)
Normal 13 (6.6) 107 (54.6) 120 (61.2)
Suspect 6 (3) 31 (15.8) 37 (18.8)
Total 35 (17.8) 161 (82.2) 196 (100)
Using the PDQ-II, the number of children falling in
the categories of “delayed” was higher in the gross
motor and language domains, whereas with ASQ,
“delays” were higher in the fine and gross motor
domains.
To determine the measure of agreement between
PDQ and ASQ results, considering the fact that for
cross tabulating two tests, they must have similar
number of answer choices, we first considered the
“suspect cases” of the PDQ as “normal” and the next
time, as “delayed”. When suspect cases were
considered as delayed, the kappa measure of
agreement was 0.20 (P<0.001) and when considered as
normal, it was 0.30 (P<0.001). The estimated
consistency coefficient between PDQ II and ASQ
for fine and gross motor domains was 0.05 and 0.24,
for language 0.18 and for personal-social 0.06
respectively.
Discussion
In the present study there was no relationship
between the presence of developmental delays and
factors such as sex, place of residence and maternal
education. A study in an urban area of India showed
Iranian Rehabilitation Journal
that due to the low educational level of mothers in
that area, PDQ could not evaluate the developmental
status of children correctly (11). A study in Tehran
(Iran) showed that PDQ had a good content validity
and reliability and moderate sensitivity and
specificity (27).
By another research team in Iran, ASQ was translated to Farsi, was standardized on 11000
Iranian children and the cut-off points for Iranian
children were determined. Their results have not
been published yet, but the general report exists and we
have used their translated forms (26).
The present study showed that there is a relatively
weak correlation between results of PDQ and ASQ
in 4-60 months old children of Tehran. Another
native study showed that regardless of considering
suspect cases as normal or delayed, the agreement
coefficients of PDQ and DDST-II were weak and
the 2-4 year- old questionnaire had greatest
agreement with DDST-II (27). Also a study in
Tehran showed that children passed the ASQ (88%)
more than DDST-II (65%) and consistency
coefficient of two tests is poor (0.21) (28). A
research conducted in order to determine the
5
agreement coefficient of PDQ, its modified version
(M-PDQ) and another questionnaire named Alpern-
Boil Developmental Profile-II, with DDST showed
that all tools had good agreement with DDST (29).
Another study in India showed that the 2-4 year-old
questionnaire of PDQ had no good relationship with
DDST (11). In a research, term and very low birth
weight infants were screened by PDQ and the
Grifffiths developmental scale at 12 months of age
and researcher concluded that these two developmental
screening tools had good agreement (23). Another
study performed by Scices et al showed that
questionnaires completed by parents, may not have
good agreement with each other. They concluded
that PEDS and ASQ developmental screening tests
may not identify the same children (30).
This study has some limitations such as limitation of
time and resources for re-evaluating those children
who were detected as cautious or delayed. On the
other hand we know that developmental screening
tools are not diagnostic and their results must be
followed by a more intensive evaluation. The results
of developmental screening must be determined by
comparison of the test results with a gold standard
developmental diagnostic test. Because there was no
standardized diagnostic test in Iran, we compared
References: 1. American Academy of Pediatrics, Council on Children
With Disabilities, Section on Developmental Behavioral Pediatrics, Bright Futures Steering Committee, Medical Home Initiatives for Children With Special Needs Project Advisory Committee. Identifying infants and young children with developmental disorders in the medical home: An algorithm for developmental surveillance and screening. Pediatrics. 2006;118.
2. Rydz D, Srour M, Oskoui M, Marget N, Shiller M, Birnbaum R, et al. Screening for developmental delay in the setting of a community pediatric clinic: a prospective assessment of parent-report questionnaires. Pediatrics. 2006;118(4):e1178.
3. Wagner J, Jenkins B, Smith JC. Nurses' utilization of parent questionnaires for developmental screening. Pediatric nursing. 2006;32(5):409-12.
4. Mayson TA, Harris SR, Bachman CL. Gross motor development of Asian and European children on four motor assessments: a literature review. Pediatric Physical Therapy. 2007;19(2):148.
5. Vameghi R, Hatamizadeh N, Sajedi F, Shahshahanipoor S, Kazemnejad A. Production of a native developmental screening test: the Iranian experience. Child: Care, Health and Development.36(3):340-5.
6. Levine DA. Guiding Parents Through Behavioral Issues Affecting Their Child's Health: The Primary Care Provider's Role. Ethnicity and Disease. 2006;16(2):3.
7. Ertem IO, Dogan DG, Gok CG, Kizilates SU, Caliskan A, Atay G, et al. A guide for monitoring child development in
6
two screening tools, the PDQ-II and ASQ. `
Early detection and intervention in developmental
problems can reduce their impacts on the well-being
and functioning of child and his/her family and is
an important issue in Pediatrics medicine (19). AAP
recommended that pediatricians use standardized
developmental screening test regularly at the 9, 18
and 30 (or 24) month visits (1). It has been proved
that the results of screening tools are most useful
when they are repeated periodically (19, 20, 31),
they are not diagnostic (32), their results should not
be interpreted alone and decision should be made by
considering the child's total function and
environmental factors.
Different studies in Iran were made to choose a
suitable tool for developmental screening in Iranian
children (5, 27, 28, 33). It is suggested that the
results of each of the used screening tests are
compared with a standard diagnostic test in future
studies.
Acknowledgements
This research was supported by a grant from
Pediatric Neurorehabilitation Research Center of
University of Social Welfare and Rehabilitation
Sciences.
low-and middle-income countries. Pediatrics. 2008;121(3):e581.
8. Schor EL. The future pediatrician: promoting children's health and development. The Journal of Pediatrics. 2007;151(5):S11-S6.
9. Glascoe FP, Shapiro HL. Introduction to developmental and behavioral screening. 2010.
10. Ertem IO, Atay G, Bingoler BE, Dogan DG, Bayhan A, Sarica D. Promoting child development at sick-child visits: a controlled trial. Pediatrics. 2006;118(1):e124. 11. Awasthu S. Validation of revised prescreening Denver Questionnaire in preschool children of urban slums. Indian pediatrics. 1997;34:919-22. 12. Glascoe F. Evidence-based approach to developmental and behavioural surveillance using parents‟ concerns. Child: Care, Health and Development. 2000;26(2):137-49. 13. Glascoe FP. Early detection of developmental and behavioral problems. Pediatrics in Review. 2000;21(8):272. 14. Al-Ansari S, Bella H. Translation and adaptation of the revised Denver pre-screening developmental questionnaire for Madinah children, Saudi Arabia. Annals of Saudi medicine. 1998;18(1):42.
15. Glascoe F. The value of parents‟ concerns to detect and address developmental and behavioural problems. Journal of paediatrics and child health. 1999;35(1):1-8. 16. FP G. Developmental Screening and Surveillance. In: Kliegman RM BR, Jenson HB, Stanton BM., ed. Nelson Textbook of Pediatrics. 18th ed. Philadelphia: Saunders
2008:74-81. 17. Ahsan S, Murphy G, Kealy S, Sharif F. Current developmental surveillance: is it time for change? Irish
Vol. 9 - Special Issue - Child Neuro Rehabilitation

medical journal. 2008;101(4):110. 18. Williams J, Holmes CA. Improving the early detection of
children with subtle developmental problems. Journal of Child Health Care. 2004;8(1):34.
19. Sandler AD, Brazdzuinas D, Cooley W, Gonzalez de Pijem L, Hirsh D, Kastner T, et al. Developmental surveillance and screening of infants and young children. Pediatrics. 2001;108(1):192-6.
20. Frankenburg WK. Developmental surveillance and screening of infants and young children. Pediatrics. 2002;109(1):144.
21. Frankenburg WK, van Doorninck WJ, Liddell TN, Dick NP. The Denver prescreening developmental questionnaire (PDQ). Pediatrics. 1976;57(5):744.
22. McCrae JS, Cahalane H, Fusco RA. Directions for developmental screening in child welfare based on the Ages and Stages Questionnaires. Children and Youth Services Review. 2011.
23. Janson H, Squires J. Parent-completed developmental screening in a Norwegian population sample: a comparison with US normative data. Acta Paediatrica. 2004;93 (11): 1525-9.
24. Marks K, Hix-Small H, Clark K, Newman J. Lowering developmental screening thresholds and raising quality improvement for preterm children. Pediatrics. 2009;123(6):1516.
25. Jee SH, Conn AM, Szilagyi PG, Blumkin A, Baldwin CD, Szilagyi MA. Identification of social emotional problems among young children in foster care. Journal of Child Psychology and Psychiatry.
26. Vameghi R SF, Habibolahi A, Lornezhad H, Tolouie A, Kraskian Mojembari A, Delavar B. . [Standardization of Ages & Stages Questionnaires (ASQ) in Iranian Children (in Persian)] The University of Welfare & Rehabilitation,
Iranian Rehabilitation Journal
Special Education Organization, Family and Public Health Office of Ministry of Health and Medical Education,
Research Institute of Exceptional Children, Unicef, ; 2009. 27. Shahshahani S, Sajedi F, Vameghi R, Kazemnejad A,
Tonekaboni SH. Evaluating the Validity and Reliability of PDQ-II and Comparison with DDST-II for Two Step Developmental Screening. Iranian Journal of Pediatrics.21(3).
28. Shahshahani S, Vameghi R, Azari N, Sajedi F, Kazemnejad A. Validity and Reliability Determination of Denver Developmental Screening Test-II in 0-6 Year-Olds in Tehran. Iranian Journal of Pediatrics. 2010;20(3):313-22. 29.
Burgess DB. Parent report as a means of administering the Prescreening Developmental Questionnaire: An evaluation study. Journal of developmental and behavioral pediatrics. 1984.
30. Sices L, Stancin T, Kirchner HL, Bauchner H. PEDS and ASQ developmental screening tests may not identify the same children. Pediatrics. 2009;124(4):e640.
31. 31. Dworkin PH. 2003 C. Anderson Aldrich Award Lecture: Enhancing Developmental Services in Child Health Supervision—An Idea Whose Time Has Truly Arrived. Pediatrics. 2004;114(3):827.
32. Stein MT, Lukasik MK. Chapter 79 - Developmental screening and assessment: infants, toddlers, and preschoolers. In: William BC, Md, Allen CC, William LC, Ellen Roy E, Heidi M. Feldman MDP, eds. Developmental- Behavioral Pediatrics (Fourth Edition). Philadelphia: W.B. Saunders 2009:785-96.
33. Sajedi F, Vameghi R, Mohseni Bandpey M, Alizad V, Hemati Gorgani S, Shahshahanipour S. Motor developmental delay in 7500 iranian infants: Prevalence and risk factors. Iranian Journal of Child Neurology (IJCN). 2009;3(3):43-50.
7
Iranian Rehabilitation Journal, Vol. 9, December 2011
Original Article
The Role of non-Linguistic Variables in Production of Complex
Linguistic Structures by Hearing-Impaired Children
Robab Teymouri, PhD Pediatric Neurorehabilitation Research Center, University of Social Welfare and Rehabilitation Sciences,
Tehran-Iran
Department of Linguistics, Science and Research Branch, Islamic Azad University, Tehran, Iran
Shahin Nematzadeh, PhD Department of Linguistics, Al-Zahra University, Tehran, Iran
Masoud Gharib, MSc Pediatric Neurorehabilitation Research Center, University of Social Welfare and Rehabilitation Sciences,
Tehran, Iran
Naeimeh Daneshmandan*, MD Pediatric Neurorehabilitation Research Center, Clinical Sciences Department, University of Social Welfare
and Rehabilitation Sciences, Tehran, Iran
Objectives: Language development is often very slower in hearing impaired children compared with their
normal peers. Hearing impairment during childhood affects all aspects of speech production and language
acquisition. It seems that hearing impaired people suffer from language and speech impairments such as
production of complex linguistic structures. The purpose of this study is to determine the role of non-
linguistic variables in production of the complex linguistic sentences in children with hearing impairment.
Method: Twenty normal children, aged 6-7 years and twenty children with severe to profound hearing
impairment, aged 8-12 years were selected in a simple random sampling from normal kindergartens and
schools, and exceptional schools for hearing impaired people. This research was a case-control research.
The confirmation of the audiologist in the exceptional schools for hearing impaired people and the
information recorded in the history of these students were considered in order to determine the kind and
degree of hearing loss, and other non-linguistic variables. The production of complex sentences was
tested by Elicitation Test. The content validity of the production test was determined and then the
reliability was confirmed with Cronbach Alpha Test. Data collected were analyzed by statistical tests such
as Pearson‟s Correlation, Independent Samples T-Test and Mann-Whitney U Test and using SPSS
software.
Results: The results of this study showed that there was no correlation between the non-linguistic
variables such as early detection and early intervention, and production of complex linguistic structures in hearing
impaired children.
Conclusion: In the first months of life, children have to deal with natural language to create the
foundations for linguistic health and complete development of syntax. If language input is not rich and
available during the critical period for learning a first language, the syntactic competence cannot grow
naturally. Therefore, two non-linguistic variables, early identification and early intervention will be the main
predictors for production of complex linguistic structures.
Key words: Hearing Impairment, Non-linguistic Variables, Complex Linguistic Structures, Production
Introduction
It seems that the deviations in hearing-impaired
children‟s communication result from insufficient
language input in an appropriate development age.
They use innate linguistic capability of rule production
*All correspondences to: E-mail:[email protected]
8
to hear things. Therefore, they create functional but
deviational strategies, for which provide the
possibility of the production and comprehension of
complex linguistic constructions. In face to face
communication, they can choose their own
Vol. 9 - Special Issue - Child Neuro Rehabilitation
strategies; and basic and effective language
exchanges can occur (1).
If auditory system does not receive the necessary
inputs from the inner ear, it will not grow enough. In
infancy, the auditory system, which is flexible and
evolvable, can change and grow by receiving
different stimulations from the environment.
Inadequate stimulations prevent the full
development of the auditory nerves, because afferent
and efferent nerves of the brain cortex impose a
bilateral control on each other.
From physiological aspects, the auditory system of
children is flexible and is affected by not only the
anatomical changes, but also changes in the received
auditory stimulations. According to Ruben & Rapin
(2), peripheral and central auditory systems have
mutual control on each other. When the inner ear is
matured, its inputs are essential for development of
at least a part of auditory nerves. When the
peripheral auditory system is fully developed, its
inputs appear to be essential for neural maturation
and development of parts of the central auditory
system. Therefore, since the beginning of the
activity of the inner ear and the eighth cranial nerve
until the maturity of central nervous system (that is
almost from the fifth month of fetal life to the age of
18 to 22 months), environmental sounds have the
greatest impact on formation of hearing ability (3, 4).
Beside linguistic variables, non-linguistic ones are
likely to affect linguistic production of hearing
impaired children and subsequently their
communication. These factors include severity of
hearing impairment (5), age of hearing impairment
onset, or time of detection of hearing problem (6),
and enrollment in early intervention (7), use of
cochlear implants and/or other hearing aids (8, 9),
duration of the using conventional devices (9, 10),
use of sign language or cued speech or other
communication approaches (11), family background
and history and so on.
Some studies have attempted to explain whether
there is a relationship between the linguistic
competences achieved by the hearing impaired
person and non-linguistic factors. However, how
these factors interact with each other and have
impact on language development is still under
debate.
It is important to note that many hearing losses in
children are preventable, but it will be possible only
when it is identified as soon as possible (7, 12, 13),
and their therapeutic services are implemented.
Obviously, if early diagnosis of hearing loss does
Iranian Rehabilitation Journal
not occur, the reduction of the difference created in
the child's language development will be more
difficult than normal people (14). The hearing
impairment which has occurred during the first three
years of life, has a strong deterrent effect on
individual‟s acquired linguistic skills, regardless of
the type (congenital, acquired, transitional, or
sensorineural), which will later affect his/her
psychological, social, educational, and occupational
aspects. Therefore, reducing the harmful effects of
hearing loss on language acquisition, especially
during the first three years of life, is of special
importance (7, 15, 16). This goal can be achieved
when there is early diagnosis of the impairment,
early medical intervention and rehabilitation, and its
follow-up (using a suitable audio-amplifier and
continuous verbal stimulation program) (8, 17-19).
The first 36 months of life are considered as the
critical period of language learning, so that language
is not possible to acquire with that speed at any other
time (20). Therefore, to minimize the negative
effects of hearing loss, professionals rely on early
identification and follow-up of rehabilitation
services at an early age, which this goal is possible to
achieve by performing the controlled newborn
screening programs (21, 22).
Reports (23) indicate that language development in
children with hearing impairment depends on the
age of beginning rehabilitation services. In a study
in Lexington Deaf School, children who were
adopted before the age of 16 months in this center,
were compared with children who had registered
there between the ages of 16 to 24 months. Children
who had been adopted before the age of 16 months,
showed statistically, at the age of 40 months (3.4
years), higher scores in speech and language
comprehension and social communications. Mother-
child relationship in the children who were adopted
at lower age was higher-the factor which may have
had more impact on achieving this success (7,15,24).
Many recent studies have shown that if comprehensive
programs of early intervention are provided until the
age of six months, some English-speaking hearing
impaired children can acquire receptive and
expressive language skills compared to normal peers
(6, 25, 26).
Moeller (7) studied the relationship between age of
enrollment in intervention program, and language
ability (vocabulary skills) in a 112-member group of
pre-linguistic hearing impaired children aged five
years with mild to profound sensorineural hearing
loss. The researcher found a significant negative
9
relationship between the two variables above, which
means that the children who were under early
intervention programs showed better language
scores at the age of five years, compared with
children who were enrolled later (for example, after
the age of 11 months). Their level of vocabulary
growth was comparable to that of their normal peers.
Participation and cooperation of families and
enrollment age in intervention programs significantly
justify the huge differences and changes in the
language ability at the age of five.
About 43% of children receiving cochlear implants at
the age of 2 years, are able to develop language up to
age of 8-9 years, while only 16% of children with
cochlear implants before the age of 4 years successes to
achieve a good language ability (19, 27, 28).
Nicholas & Geers (29) and Ledeberg & Spencer (30)
believe that there is a critical and vital period for the
effectiveness of cochlear implants. The cochlear
implant which is performed before the age of 2, can
be effective in the development of language
(including syntax) with intonation and severity of
more natural changes, unlike the cochlear implant
received after it (31).
Although it is generally accepted and indisputable
that hearing impairment can retard the development
of natural abilities of language (32), the degree of
hearing loss in the language acquisition has an
unclear and ambiguous role.
Several studies that have examined the relationship
between the degree of hearing loss and speech
production and comprehension skills in different
languages, have not yet seen the correlation between
these two factors (8, 33-39).
To investigate relationships among speech perception,
production, language, hearing loss, and age in children
with impaired hearing, Blamey et al. (8) studied the
language ability and speech comprehension in an 87-
member group of children with moderate, severe or
profound hearing impairment. Result of this research
suggests that the degree of hearing loss was only
correlated with speech comprehension. However, the
assumption that greater hearing loss is associated with
more severe language and educational deficits is not
supported by the present data.
Norbury et al. (34, 37) also presented similar results
in English-speaking children with mild to moderate
hearing loss. In the first research, degree of hearing
loss or age of receiving hearing aids was not directly
related to performance, but other language measures
were. The subset was also significantly younger than
the rest of the SNH group, suggesting that
10
acquisition of finite verb morphology may be
delayed in children with hearing impairments (37). In
the second research, children with SLI did poorly on
tests assessing knowledge of Binding principles and
in assigning thematic roles in passive sentences
whereas hearing-impaired children performed close to
control levels, indicating that poor speech
perception cannot account for this pattern of deficit.
However, the pattern of errors on syntactic tasks and
the relatively weak correlation between different
indicators of syntactic deficit seemed incompatible
with a modular hypothesis (34).
Tuller & Jakubowicz (38) studied the comprehension
and production skills of French-speaking hearing
impaired children with 37 to 64 dB of hearing
impairment. In this study, different features and
aspects of French grammar, including the use of
articles, morphemic pronouns and verb conjugations;
and many differences were observed between the
performances of subjects. In people with hearing
impairment who were tested, some features were
few, incomplete and inadequate, and others were
less or were not damaged at all. But these
phenomena were not correlated with the degree of
hearing loss, the age of hearing loss diagnosis and
the age of beginning the use of hearing aid. The
effect of age was only taken into consideration when
younger children have shown more problems than older
children in learning and mastering their language.
Sztermann and Friedmann (33) studied the
comprehension and production of sentences derived
by syntactic movement, in orally trained school-age
Hebrew-speaking children with moderate to
profound hearing impairment, aged 7.8-9.9 years.
The results showed that hearing impaired children
are unable to comprehend the topical sentences and
object-relative clauses. Similarly, in other research,
the same researchers (33) found that individual
performance was strongly correlated with the age of
intervention: only children who received hearing
aids before the age of 8 months performed well in
the comprehension tasks. Type of hearing aid,
duration of cochlear implant, and degree of hearing
loss did not correlate with syntactic comprehension.
Materials and Methods
In this case-control study, twenty normal children,
aged 6-7 years and twenty children with severe to
profound hearing impairment, aged 8-12 years were
selected in a simple random sampling from normal
schools, and exceptional schools for hearing
impaired people. Subjects in both groups spoke one
Vol. 9 - Special Issue - Child Neuro Rehabilitation
language. The normal children were matched with
the hearing impaired children on the basis of
linguistic age. Also among 20 children in the control
group, 10 were male, and 10 were female. Their
average age was 6.5 years; 50 percent were studying
in pre-school level and 50 percent were in the first
grade.
Average age of hearing-impaired students was 10.5
years, 65% of the hearing-impaired group were
boys, and 35% were girls. The children did not have
any confirmed diseases or neurological disorders,
except hearing loss in students with hearing
impairment.
To determine historical variables, such as age of onset of
hearing loss or initiation of early intervention, kind and
degree of hearing loss and so on, the information was
obtained by the principals of the exceptional schools
for hearing-impaired people from children medical
history. Type of hearing impairment among all
hearing-impaired children was sensorineural. Hearing
impairment of all hearing-impaired children was detected
up to three years.
All these children suffered hearing loss in both ears.
They used behind the ear hearing aid. 25% began
using hearing aids at the age of eight, 20% in six
years old, and the rest at lower age.
Each child was tested individually in three to five
sessions. There was no time limit on any of the tests;
and the tester repeated several times each part, as the
subject wanted.
Production of non-canonical sentences was tested by
using a researcher-made task called Eliciting. The
subject hears a sentence that is read by the native
Persian-speaking tester, afterwards the tester asks
the subject “Which child/girl/boy do you like (the
most)?”. Then, he/she sees two pictures on one page:
one on top and another on bottom of the page. While
answering the question, s/he produces a sentence.
Type of constructions of the production task of
eliciting, is classified in terms of word order in two
general groups:
1- Sentences with canonical word order (subject
clefts, object-subject relative)
2- Sentences with non-canonical word order (object
clefts, subject-object relative)
To analyze the data, Independent T-Test, Mann-
Whitney U test, Pearson‟s Correlation and the
software SPSS were used. To determine the
difference between deaf and normal-hearing children
in producing the complex sentences, independent t-
test was used for those scores that had normal
distribution and Mann-Whitney U test was used for
those series of scores that were not normally
distributed. To assess the correlation between
variables, the Pearson‟s Correlation was used.
Results
To identify the non-linguistic factors which are
correlated with the ability to produce the non-
canonical constructions by the hearing impaired
children, we considered the mean of scores of the
subjects in the production tasks of the subject and
object relative clauses and the subject and object
clefts. Then we discussed its correlation with these
variables: age of hearing loss detection, age of
beginning intervention and the use of behind the ear
(BTE) hearing aid, type of hearing impairment and
the degree of hearing impairment.
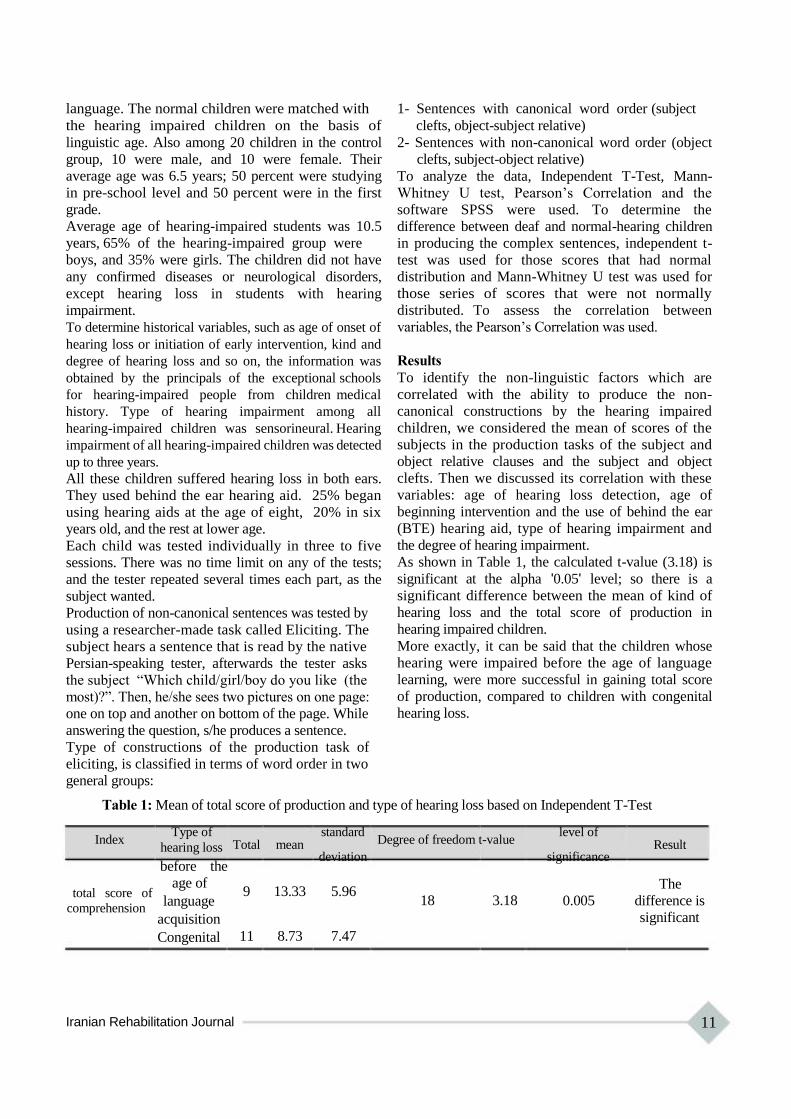
As shown in Table 1, the calculated t-value (3.18) is
significant at the alpha '0.05' level; so there is a
significant difference between the mean of kind of
hearing loss and the total score of production in
hearing impaired children.
More exactly, it can be said that the children whose
hearing were impaired before the age of language
learning, were more successful in gaining total score
of production, compared to children with congenital
hearing loss.
Table 1: Mean of total score of production and type of hearing loss based on Independent T-Test
Index
total score of
comprehension
Type of
hearing loss
before the
age of
language
acquisition
Congenital
standard Total mean
deviation
9 13.33 5.96
11 8.73 7.47
Degree of freedom t-value
18 3.18
level of Result
significance
The
0.005 difference is
significant
Iranian Rehabilitation Journal 11
Iranian Rehabilitation Journal, Vol. 9, December 2011
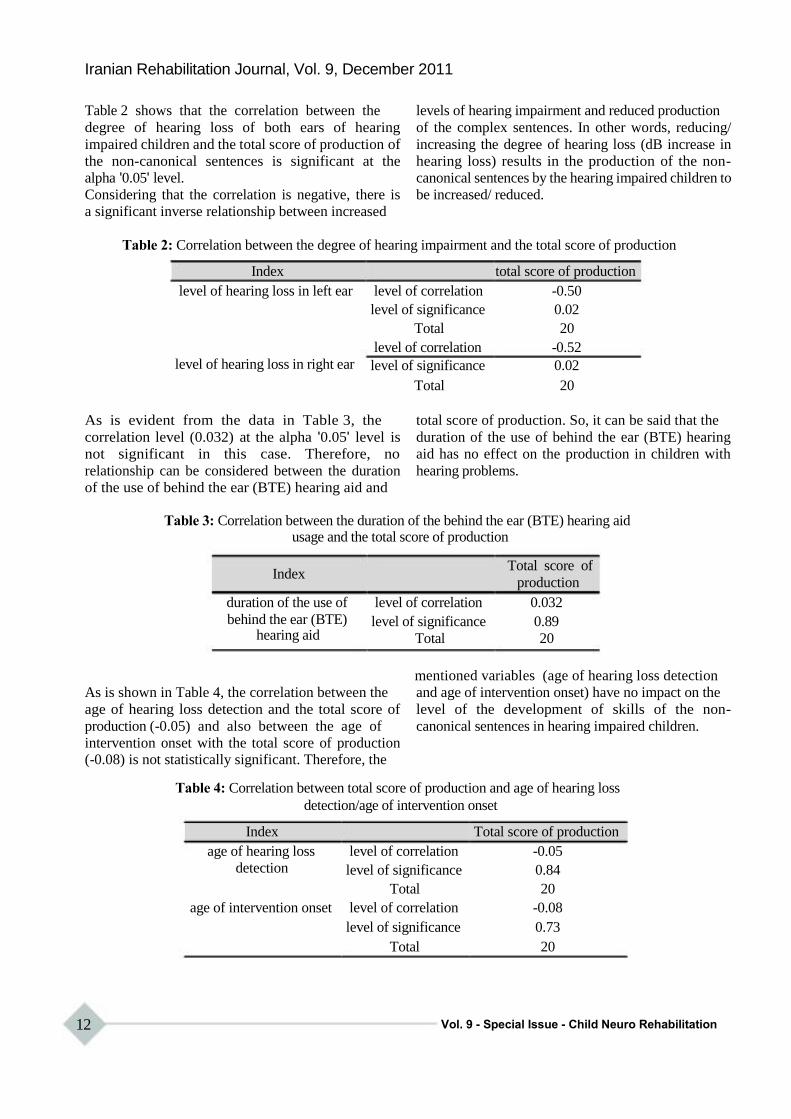
Table 2 shows that the correlation between the
degree of hearing loss of both ears of hearing
impaired children and the total score of production of
the non-canonical sentences is significant at the
alpha '0.05' level.
Considering that the correlation is negative, there is
a significant inverse relationship between increased
levels of hearing impairment and reduced production
of the complex sentences. In other words, reducing/
increasing the degree of hearing loss (dB increase in
hearing loss) results in the production of the non-
canonical sentences by the hearing impaired children to
be increased/ reduced.
Table 2: Correlation between the degree of hearing impairment and the total score of production
Index total score of production
level of hearing loss in left ear level of correlation -0.50
level of significance 0.02
Total 20
level of correlation -0.52
level of hearing loss in right ear level of significance 0.02
Total 20
As is evident from the data in Table 3, the
correlation level (0.032) at the alpha '0.05' level is
not significant in this case. Therefore, no
relationship can be considered between the duration
of the use of behind the ear (BTE) hearing aid and
total score of production. So, it can be said that the
duration of the use of behind the ear (BTE) hearing
aid has no effect on the production in children with
hearing problems.
Table 3: Correlation between the duration of the behind the ear (BTE) hearing aid usage and the total score of production
Index Total score of
production
duration of the use of level of correlation 0.032
behind the ear (BTE) level of significance 0.89 hearing aid Total 20
mentioned variables (age of hearing loss detection
As is shown in Table 4, the correlation between the
age of hearing loss detection and the total score of
production (-0.05) and also between the age of
intervention onset with the total score of production (-0.08) is not statistically significant. Therefore, the
and age of intervention onset) have no impact on the
level of the development of skills of the non-
canonical sentences in hearing impaired children.
Table 4: Correlation between total score of production and age of hearing loss
detection/age of intervention onset
Index Total score of production
age of hearing loss level of correlation -0.05
detection level of significance 0.84
Total 20
age of intervention onset level of correlation -0.08
level of significance 0.73
Total 20
12 Vol. 9 - Special Issue - Child Neuro Rehabilitation
Discussion
In general, according to results of similar studies on
Hebrew language (39) English (40, 41), and French
(42), the performance of normal and hearing
impaired children concerning the non-canonical
sentences was clearly different. Obviously, what is
important is to identify the non-linguistic variables
which are correlated with the ability to produce the
complex linguistic constructions by the hearing
impaired children.
Some results of treatment of non-canonical constructions
in other populations such as individuals with
agrammatic aphasia (43-46) and Specific Language
Impairment (47-49) suggest the production skill of
the non-canonical constructions can be improved
through the simple trainings.
The results of this study showed that the hearing
impaired children whose hearing was impaired
before the age of language acquisition, their
production was better and more in the area of
complex linguistic structures, compared to children
with congenital hearing loss. Therefore, the findings
of the study suggest that the type of hearing
impairment can be associated with syntactic
performance.
We found that degree of hearing loss was inversely
correlated to linguistic production. If the degree of
hearing loss was higher, production of the complex
constructions would also be subject to defects and
disorders; and if the hearing loss was reduced,
production of the mentioned constructions would
also increase. But some previous researchers have
reported a lack of relationship between degree of
hearing loss and expressive oral communication skill
(7, 50-52). It seems that the degree of hearing loss in
the language acquisition has an unclear and
ambiguous role and this does not mean that hearing
loss itself does not influence linguistic
achievements.
In contrast, the age of hearing impairment detection,
the age of beginning intervention services or the age
of the use of behind the ear (BTE) hearing aid, and
duration of use of this tool were not correlated with
the production of complex linguistic structures. Lack
of the relationship between these variables is due to
the fact that hearing impairment in many of these
children has been detected after the critical age of
language acquisition, and intervention services have
been also delayed. Hence, there was no correlation
between many non-linguistic variables and
production skill. Therefore, considering late diagnosis
of hearing impairment and late intervention of
Iranian Rehabilitation Journal
rehabilitation and treatment of these children, the
results of this study are consistent with findings
published by Calderon & Naidu (53). They indicate
that the performance of children whose hearing
impairment was diagnosed from birth to the age of
one year was significantly better in the tasks of
receptive and expressive language than children
whose hearing impairment was diagnosed between
the ages of 13 and 36 months.
Similarly, the findings of Yoshinaga-Itano (13) and
Yoshinaga-Itano and A puzzo (25) suggest that
intervention before the age of 6 months is a strong
predictor for several measures of language
development.
Also, according to studies published by Yoshinaga-
Itano et al. (6) and Moeller (7), the children having
normal cognitive skills who are identified as deaf or
hard hearing before the age of 6 months improve
their language skills to the natural levels at an early
age, in case of timely and appropriate intervention;
and their cognitive skills would be commensurate
with their language skills. Regardless of the degree
of hearing impairment, gender, race, socio-economic
conditions, age at time of problem detection , or type
of communication method, these children can
acquire language skills appropriate to the age from
12 to 36 months (6).
However, according to the same studies, abilities of
receptive and expressive language in children who
are identified later, standard deviation is lower than
children who have been identified in a timely
manner. In other words, if the children with normal
cognitive skills are identified later, they will acquire
score 60 out of 100 during the early years of life, for
general language quotient. If early and appropriate
intervention is made after diagnosis of hearing loss,
hearing impaired children who are identified at ages
6-30 months, will use the same language quotient.
But, language skills of these children are
significantly lower compared to the children who
have been identified before the age of 6 months in a
separate study (54).
Conclusion
In the first months of life, children have to deal with
natural language to create the foundations for
linguistic health and complete development of
syntax. If language input is not rich and available
during the critical period for learning a first
language, the syntactic competence cannot grow
naturally. Therefore, two non-linguistic variables,
early identification and early intervention will be the
13
main predictors for production of complex linguistic
structures and, the role of other non-linguistic
factors has not been certified by the other research.
Acknowledgments
Author and her colleagues in this paper express their
appreciation and thanks to respected authorities in
Tehran Province Education Organization, Tehran
References 1. Elfenbein J, Hardin-Jones M, Davis J. Oral communication
skills of children who are hard of hearing. Journal of Speech and Hearing Research1994;37(1):216.
2. Ruben R, Rapin I. Plasticity of the developing auditory system. The Annals of otology, rhinology, and laryngology, 1980;89(4 Pt 1):303.
3. Emerson MF, Crandall KK, Seikel JA, Chermak GD. Observations on the use of SCAN to identify children at risk for central auditory processing disorder. Language, Speech, and Hearing Services in Schools, 1997;28(1):43.
4. Gravel JS, Ruben RJ. Auditory deprivation and its consequences: From animal models to humans. SPRINGER HANDBOOK OF AUDITORY RESEARCH, 1996;7:86- 115.
5. Wake M, Poulakis Z, Hughes E, Carey-Sargeant C, Rickards F. Hearing impairment: A population study of age at diagnosis, severity, and language outcomes at 7–8 years. Archives of Disease in Childhood, 2005;90(3):238- 44.
6. Yoshinaga-Itano C, Sedey AL, Coulter DK, Mehl AL. Language of early-and later-identified children with hearing loss. Pediatrics, 1998;102(5):1161.
7. Moeller MP. Early intervention and language development in children who are deaf and hard of hearin, Pediatrics, 2000;106(3):e43.
8. Blamey PJ, Sarant JZ, Paatsch LE, Barry JG, Bow CP, Wales RJ, et al. Relationships among speech perception, production, language, hearing loss, and age in children with impaired hearing. Journal of Speech, Language, and Hearing Research, 2001;44(2):264.
9. Tobey EA, Geers AE, Brenner C, Altuna D, Gabbert G. Factors associated with development of speech production skills in children implanted by age five. Ear and Hearing, 2003;24(1):36S.
10. Geers AE. Factors affecting the development of speech, language, and literacy in children with early cochlear implantation. Language, Speech, and Hearing Services in Schools, 2002;33(3):172.
11. Mayberry RI, Eichen EB. The long-lasting advantage of learning sign language in childhood: Another look at the critical period for language acquisition. Journal of Memory and Language, 1991;30(4):486-512.
12. Ruben RJ. Effectiveness and efficacy of early detection of hearing impairment in children. Acta oto-laryngologica, 1991;111(S482):127-35.
13. Yoshinaga-Itano C. From screening to early identification and intervention: Discovering predictors to successful outcomes for children with significant hearing loss. Journal of Deaf Studies and Deaf Education, 2003;8(1):11.
14. Kennedy CR, McCann DC, Campbell MJ, Law CM, Mullee M, Petrou S, et al. Language ability after early detection of permanent childhood hearing impairment. New England Journal of Medicine, 2006;354(20):2131-41.
15. Nicholas JG, Geers AE. Effects of early auditory experience on the spoken language of deaf children at 3 years of age. Ear and Hearing2006;27(3):286.
14
Exceptional Education Department, managers,
teachers, therapists, and speech audiometer
colleagues as well as students participating in this
study and their families for their cooperation.
16. Yoshinaga-Itano C. Levels of evidence: universal newborn hearing screening (UNHS) and early hearing detection and intervention systems (EHDI). Journal of Communication Disorders, 2004;37(5):451-65. 17. Wake M, Hughes EK, Poulakis Z, Collins C, Rickards FW. Outcomes of children with mild-profound congenital hearing loss at 7 to 8 years: a population study. Ear and Hearing, 2004;25(1):1. 18. Robinshaw HM. Early intervention for hearing impairment: differences in the timing of communicative and linguistic development. British Journal of Audiology,
1995;29(6):315-34. 19. Geers AE, Nicholas JG, Sedey AL. Language skills of children with early cochlear implantation. Ear and Hearing2003;24(1):46S. 20. Snow C. Relevance of the notion of a critical period to language acquisition. Sensitive periods in development: Interdisciplinary perspectives, 1987:183-209. 21. Svirsky MA, Teoh SW, Neuburger H. Development of language and speech perception in congenitally, profoundly deaf children as a function of age at cochlear implantation. Audiology and Neurotology, 2004;9(4):224-33. 22. Grimshaw GM, Adelstein A, Bryden MP, MacKinnon G. First-language acquisition in adolescence: Evidence for a critical period for verbal language development. Brain and Language, 1998;63(2):237-55. 23. Galenson E, Miller R, Kaplan E, Rothstein A. Assessment of development in the deaf child. Journal of the American Academy of Child Psychiatry, 1980;18(1):128-42. 24. Weisel A. Early intervention programs for hearing impaired children—evaluation of outcomes. Early Child
Development and Care, 1988;41(1):77-87. 25. Mah-rya LA, Yoshinaga-Itano C. Early identification of infants with significant hearing loss and the Minnesota Child Development Inventory. Semin Hear,
1995;16(2):124-35. 26. Yoshinaga-Itano C, Apuzzo MRL. Identification of hearing loss after age 18 months is not early enough. American Annals of the Deaf, 1998;143:380-7. 27. Boothroyd A, Geers AE, Moog JS. Practical implications of cochlear implants in children. Ear and Hearing, 1991;12(4):81S. 28. Geers AE. Factors influencing spoken language outcomes in children following early cochlear implantation. Advances in Oto Rhino Laryngology, 2006;64:50-65. 29. Nicholas JG, Geers AE. 12. The Process and Early
Outcomes of Cochlear Implantation by Three Years of Age. Advances in the spoken language development of deaf and hard-of-hearing children, 2005;1(9):271-98.
30. Lederberg AR, Spencer PE. Critical periods in the acquisition of lexical skills. Developmental theory and language disorders, 2005;4:121. 31. Schauwers K, Gillis S, Govaerts P. Language acquisition in children with a cochlear implant. Developmental theory and language disorders, 2005;4:95. 32. Davis JM, Elfenbein JL, Schum RL, Bentler RA. Effects of mild and moderate hearing impairments on language,
Vol. 9 - Special Issue - Child Neuro Rehabilitation
educational, and psychosocial behavior of children. Journal of Speech & Hearing Disorders, 1986.
33. Friedmann N, Szterman R. Syntactic movement in orally trained children with hearing impairment. Journal of Deaf Studies and Deaf Education, 2006;11(1):56.
34. Norbury CF, Bishop DVM, Briscoe J. Does impaired grammatical comprehension provide evidence for an innate grammar module? Applied Psycholinguistics 2002;23 (2): 247-68.
35. Fry DB. The development of the phonological system in the normal and the deaf child. The genesis of language, 1966:187-206.
36. Gilbertson M, Kamhi AG. Novel word learning in children with hearing impairment. Journal of Speech and Hearing Research, 1995;38(3):630.
37. Norbury CF, Bishop DVM, Briscoe J. Production of English finite verb morphology: A comparison of SLI and mild-moderate hearing impairment. Journal of Speech, Language, and Hearing Research, 2001;44(1):165.
38. Tuller L, Jakubowicz C. Développement de la morphosyntaxe du français chez des enfants sourds moyens. Le Langage et l'homme, 2004;39(2):191-207.
39. Friedmann N, Szterman R. The Comprehension and Production of Wh-Questions in Deaf and Hard-of-Hearing Children. Journal of Deaf Studies and Deaf Education, 2011;16(2):212.
40. Quigley SP, Paul PV. Language and deafness: College Hill Books; 1984.
41. de Villiers PA. Assessing English syntax in hearing- impaired children: Eliciting production in pragmatically- motivated situations. Journal of the Academy of Rehabilitative Audiology, 1988.
42. Delage H. ةvolution de l'hétérogénéité linguistique chez les enfants sourds moyens et légers: étude de la complexité morphosyntaxique, 2008.
43. Thompson CK, Shapiro LP, Kiran S, Sobecks J. The role of syntactic complexity in treatment of sentence deficits in agrammatic aphasia: The complexity account of treatment efficacy (CATE). Journal of Speech, Language, and Hearing Research, 2003;46(3):591.
44. Friedmann N, Wenkert-Olenik D, Gil M. From theory to practice: Treatment of agrammatic production in Hebrew based on the Tree Pruning Hypothesis. Journal of Neurolinguistics, 2000;13:250-4.
Iranian Rehabilitation Journal
45. Thompson CK, Shapiro LP. Training sentence production in agrammatism - implications for normal and disordered
language. Brain and Language, 1995;50(2):201-24. 46. Thompson CK, Shapiro LP, Ballard KJ, Jacobs BJ,
Schneider SS, Tait ME. Training and generalized production of wh-and NP-movement structures in agrammatic aphasia. Journal of Speech, Language, and Hearing Research, 1997;40(2):228.
47. Ebbels SH, van der Lely HKJ, Dockrell JE. Intervention for verb argument structure in children with persistent SLI: A randomized control trial. Journal of Speech, Language, and Hearing Research, 2007;50(5):1330.
48. Ebbels S. Teaching grammar to school-aged children with specific language impairment using shape coding. Child
Language Teaching and Therapy, 2007;23(1):67. 49. Levy H, Friedmann N. Treatment of syntactic movement in
syntactic SLI: A case study. First Language, 2009;29(1):15- 49.
50. Most T. The effects of degree and type of hearing loss on children's performance in class. Deafness & Education International, 2004;6(3):154-66.
51. Most T. Assessment of school functioning among Israeli Arab children with hearing loss in the primary grades.
American annals of the deaf, 2006;151(3):327-35. 52. Powers S. Influences of student and family factors on
academic outcomes of mainstream secondary school deaf students. Journal of Deaf Studies and Deaf Education, 2003;8(1):57.
53. Calderon R, Naidu S. Further support for the benefits of early identification and intervention for children with hearing loss, 2000;100(5):53-84.
54. Alpiner JG, McCarthy PA. Rehabilitative audiology: Children and adults: Lippincott Williams & Wilkins; 2000. 55.
Yoshinaga-Itano C. Benefits of early intervention for children with hearing loss. Otolaryngologic Clinics of North America, 1999;32(6):1089.
56. Downs MP, Yoshinaga-Itano C. The efficacy of early identification and intervention for children with hearing impairment. Pediatric Clinics of North America, 1999;46(1):79.
57. Jafari Z, Malayeri S, Ashayeri H. The ages of suspicion, diagnosis, amplification, and intervention in deaf children. International journal of pediatric otorhinolaryngology, 2007;71(1):35-40.
15
Iranian Rehabilitation Journal, Vol. 9, December 2011
Original Article
The Effect of Swedish Massage on Glycohemoglobin in Children with
Diabetes Mellitus
Zahra Kashaninia, MSc Nursing Department, University of Social Welfare and Rehabilitation Sciences, Tehran, Iran
Akram Abedinipoor, MSc Nursing Department, University of Qom, Qom, Iran
Samaneh Hosainzadeh, PhD Tarbiat Modarres University, Tehran, Iran
Firoozeh Sajedi*, MD Pediatric Neurorehabilitation Research Center, University of Social Welfare and Rehabilitation Sciences,
Tehran, Iran
Objectives: Diabetes mellitus (DM) is the most common endocrine disease in children. Massage therapy can
improve glucose metabolism in DM. This study was conducted to determine the effect of Swedish massage on
the Glycohemoglobin (HbA1c) in children with DM.
Methods: This study was an semi-experimental (clinical trial) conducted on thirty-six children, 6-12 years
old with (DM), recruited from a clinic of the Qom City, Iran. They were randomly assigned to intervention
and control groups (18 patients in each group). Swedish massage was performed for fifteen minutes, three times
weekly, for three months in intervention group. The HbA1c was evaluated before and after intervention in the
two groups.
Results: The average ages of children in the intervention and control groups were 9.05 (±1.55) and 9.83 (±2.03) years respectively. There was statistically no significant difference in Glycohemoglobin before intervention between two groups (P = 0.491), but the Glycohemoglobin was lower significantly in intervention group in comparison with control group after intervention (P < 0.0001).
Conclusion: Massage therapy can be an assisted treatment in children with DM; reducing the drug consumption by patients for the control of DM.
Key words: Diabetes Mellitus, Swedish massage, Glycohemoglobin (HbA1c), Children.
Introduction
Regarding changes in epidemiological trend of
diseases in developing and developed countries and
increase in life expectancy, stresses of modern urban
life, less mobility and change in diet, the prevalence
of Diabetes Mellitus (DM) has been increased (1).
DM type I is rising in rate of 3% in children and
adolescents and is being estimated that 700,000 of
children under 15 are affected annually. Diabetes
type II that is considered as adult disease, is also
increasing in children and adolescents dramatically.
Due to high prevalence of cardiovascular and
ophthalmic complications in diabetic patients, the
prevention, management and control in these
patients is so important and necessary (2).
*All correspondences to: E-mail: [email protected]
16
Nowadays in addition of medical and surgical
treatments in DM, non-organic treatments such as
weight control, tension reduction and change in
lifestyle are also used (3). Sokolow & Cheitlin (1999)
believe that general criteria such as diet, exercises,
weight loss in overweight people, relaxation
techniques, life equilibrium and consideration of
other risk factors can not be ignored in diabetic
patients‟ care (4).
Relaxation is one of the most efficient treatment
modality in anxiety (5). Relaxation can decrease
muscle tension (6) and increase parasympathetic
nervous system activity via hypothalamus (7).
According to Selye‟s stress theory, the limbic
system links emotions and feelings with somatic and
Vol. 9 - Special Issue - Child Neuro Rehabilitation
psychological behaviors and replace emotions like
stress, anxiety, anger, depression with relaxation and
good feelings and regulates somatic behaviours of
feelings via neuroendocrine, autonomic nervous
and ambulatory systems (8). Stress, anxiety, anger,
depression and emotional distress often increase
muscle tone. Relaxation and happy feelings decrease
muscle tone in reverse. The limbic system effects on
muscle tone via hypothalamus. Increased anterior
hypothalamus activity raises sympathetic, ambulatory
systems and cortex activity, while increasing posterior
hypothalamus activity elevates parasympathetic system
activity and decreases muscle tone (9). Massage as
an enjoyable experience decreases anxiety and
creates relaxation via muscle tone reduction (10).
Swedish massage is one of the prevalent methods in
stress reduction and was used by Henrik ling in 1830
for the first time and spread in Europe gradually.
This is a type of systematic massage that involves
almost all muscles (11) and causes relaxation via
hormones that is effective in raising insulin absorption
and increases circulation that leads to decreased
blood glucose level (10). It is the most common
complementary therapies in nursing that the
implementation is easy, safe, non invasive and
relatively cheap (12). Nurses are usually qualified in
massage (13) and have applied massage techniques
for a long time (14).
Hence, we decided to evaluate the effectiveness of
Swedish massage as a relaxing method on
Glycohemoglobin (HbA1c) level, as an important
indicator of DM control.
Method and Materials
This was a semi-experimental study. Following
ethical approval from the Ethics Committee of the
University of Social Welfare and Rehabilitation
Sciences (USWRS), a prospective, randomized,
controlled trial study was conducted in 2009, at the
Clinic of Kamkar-Arabnia Hospital, Qom City, Iran.
Samples were 36 Iranian children (aged 6-12 years)
with clinical diagnosis of diabetes (based on medical
files). They were assigned into intervention and
control groups randomly (18 patients in each group).
Inclusion criteria were age between 6-12 years and,
patients with DM type II. Exclusion criteria were
unwillingness to cooperation, obvious movement
disorder and complete bed rest order, skin disorder,
skeletal disorder, history of spine malignancy, and
any other drug consumption (except routine
medications for DM) that affects on blood glucose
level.
Iranian Rehabilitation Journal
Measurements were scale, tape-measure and
demographic questionnaire. Individuals‟ heights
were measured by tape-measure and weights by
standard scale. The heights were measured as the
patients stood in front of a wall without shoes and
their heel, shoulders and buttock touched the wall
and the highest area of the head level was signed on
the wall. All measurement instruments were
assessed to reassure proper operation continuously.
Demographic questionnaire includes 13 questions
about age, gender, height, weight, children and their
parents‟ educations, the parents‟ job, duration of
diabetes and diabetes medications (Insuline‟s type
and dose), and family history of diabetes.
A nurse was trained Swedish massage by a
physiotherapy professor at the University of Social
Welfare and Rehabilitation Sciences. First she
implemented Swedish massage on a mannequin then
she had been trained on some patients in a clinic
under supervision of the physiotherapist.
The parents of two groups were asked not to change
their children‟s daily routines such as: exercise, diet
and medications.
Next, massage was implemented in quiet rooms with
appropriate temperature, light at 8 am; the time that
children and their parents were comfort for
cooperation. The child took off his clothes and was
positioned in supine position. He/she was massaged
from arms, neck and head and continued to the toes
then in prone position on legs, hip and back [15].
The child received massage for 15 minutes in each
session. Each child in intervention group received
36 sessions and totally 540 minutes massage during
3 months. The children in control group did not
receive any intervention. HbA1c were measured
before and after massage in both groups.
Chi-square test was used to assess variables
homogeneity in two groups, Kolmogrov-Smirnov to
assess variable distribution normality, and
independent t-test, Mann-Whitney tests, to compare
mean and standard deviation of variables in two
groups. Also Paired t-test was used to assess HbA1c.
Independent t-test was used to compare quantitative
demographic variables in two groups. Chi-square
and fisher‟s exact test were used to compare the
categorical demographic variables in two groups. K-
S test was used to assessing normality of variables.
SPSS version 16 was used to statistical analysis of
data. A p-value ≤ 0.05 was considered statistically
significant.
17

Results
Background variables: A total of 36 children were
enrolled in this study (n=18 in each group). There
were 7 (38.9%) males and 11 (61.1%) females in
control and intervention groups respectively (p=
0.182).
Table 1 shows the demographic characteristics of
two groups. There were no significant differences in
age, weight, height, DM duration, medication
duration, and insulin doses (NPH & regular)
between two groups.
There were also no significant differences in jobs of
mothers (p= 0.104) and fathers (p= o.97), educations
of mothers (p= 1), fathers (p=1) and patients (p=1),
and family history of DM (p=1) between 2 groups by
fishers' exact test.
As it is shown in table 2, there was no significant
difference in HbA1c between before and after
intervention in control group (p= 0.592), but there
was significant difference in HbA1c between
before and after intervention in intervention group
(p< 0.0001).
There was also no significant difference in HbA1c
before intervention between two groups (p= 0.491),
but there was significant difference in HbA1c after
intervention between two groups (p< 0.0001).
Discussion
The results of this study demonstrated that Swedish
massage is effective on HbA1c reduction in diabetic
children.
Hernandez, field et al (2000) assessed massage
effect on blood pressure, stress hormones secreted
from salivary glands and depression, demonstrated
that massage reduces blood pressure (p<0.05),
anxiety (p<0.001), depression ( p<0.01) and stress
hormones secreted from salivary glands (p<0.05).
This research confirms that massage results in
relaxation and stress hormones reduction (16).
Preliminary data were available from one small
randomized trial comparing people with type II
diabetes receiving 45-min, full-body massage three
times a week for 12 weeks (n = 6) to similar patients
on a waiting list for massage (n = 2). Researchers
found that of the six patients receiving massage,
HbA1c decreased in three patients from a baseline of
7.9, 8.3, and 9.8% to 7.3, 8.1, and 8.6%,
respectively. In the other three patients receiving
massage, HbA1c increased from a baseline of 7.4,
8.2, and 8.0% to 7.9%, 10.0%, and 8.5%,
respectively. These patients, whose glycemic control deteriorated while receiving massage, were obese,
18
injecting insulin, or both. None of the group whose
glycemic control improved with massage had either of
these characteristics. In the waiting list control
group, HbA1c level also declined from 7.3 and 8.6% to
6.9 and 8.4%, respectively (15).
In other study, the effects of massage therapy had
been determined on Vital Signs (blood pressure,
heart rate, skin temperature, O2 saturation), anxiety /
depression; and Hemoglobin (HbA1c), Cortisol, and
Insulin. Effleurage (gliding/stroking), Petrissage
(kneading) and Tapotement (cupping / hanking /
pincing), and Vibration Friction of the neck,
extremities, back/torso were used and hand pressure
provided 20 minutes of massage. Immediate effects
of massage were lower heart rate and skin
temperature. Intermediate-long term effects appear
to be higher resting heart rate and blood pressure,
increased blood flow, higher cortisol and a trend
toward improved wellbeing. HbA1c increased 22%.
They concluded that randomized controlled studies
are needed to assess whether there are significant
health benefits (17). In another study by Surwit and his colleagues, patients with type II diabetes were randomized to undergo a five-session diabetes group education program with or without stress management training. They followed the patients for a year, testing their serum for HbA [sub]1c, a marker for long-term glycemic control, and evaluating psychological
parameters with patient questionnaires. They reported
stress management training was associated with a
small (0.5%) but significant reduction in HbA [sub]1c.
Therefore group oriented stress management training programs can produce small but significant improvements in long-term glycemic control in type II diabetics, but highly anxious patients with type II diabetes did not gain more benefits from stress management training than other, less anxious patients (18). Any randomized trial should provide intervention for at least 3 months. This would permit changes to become evident in the HbA1c. Trials measuring HbA1c should also have a 2-month lead-in period during which values are measured but no intervention is given in order to obtain valid baseline measures. Changes in HbA1c may demonstrate whether massage may, in fact, be able to alter disease outcome. The sample size for a large, randomized controlled trial, therefore, should be calculated based on a clinically important change in HbA1c. A 1% decrease in HbA1c reflects a 30 mg/dl decrease in blood glucose (15).
Vol. 9 - Special Issue - Child Neuro Rehabilitation
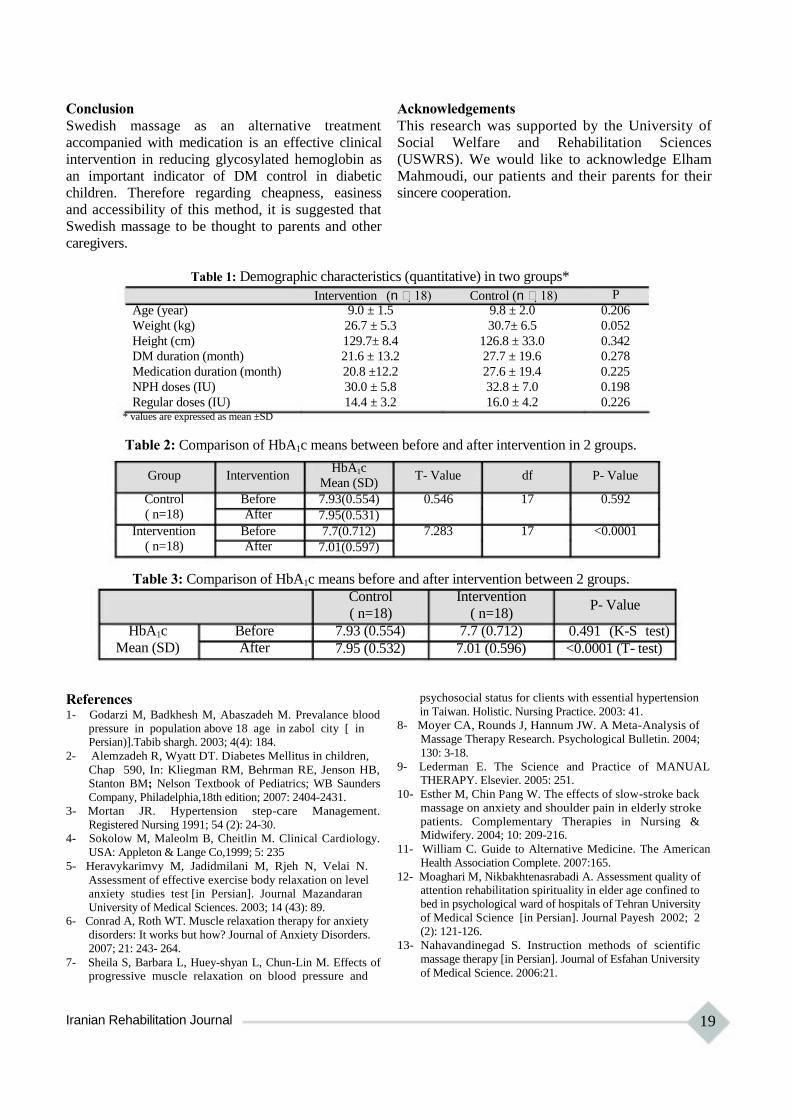
Conclusion
Swedish massage as an alternative treatment
accompanied with medication is an effective clinical
intervention in reducing glycosylated hemoglobin as
an important indicator of DM control in diabetic
children. Therefore regarding cheapness, easiness
and accessibility of this method, it is suggested that
Swedish massage to be thought to parents and other
caregivers.
Acknowledgements
This research was supported by the University of
Social Welfare and Rehabilitation Sciences
(USWRS). We would like to acknowledge Elham
Mahmoudi, our patients and their parents for their
sincere cooperation.
Table 1: Demographic characteristics (quantitative) in two groups*
Intervention (n 18) Control (n 18) P
Age (year) 9.0 ± 1.5 9.8 ± 2.0 0.206
Weight (kg) 26.7 ± 5.3 30.7± 6.5 0.052
Height (cm) 129.7± 8.4 126.8 ± 33.0 0.342
DM duration (month) 21.6 ± 13.2 27.7 ± 19.6 0.278
Medication duration (month) 20.8 ±12.2 27.6 ± 19.4 0.225
NPH doses (IU) 30.0 ± 5.8 32.8 ± 7.0 0.198
Regular doses (IU) 14.4 ± 3.2 16.0 ± 4.2 0.226 * values are expressed as mean ±SD
Table 2: Comparison of HbA1c means between before and after intervention in 2 groups.
Group Intervention
Control Before
( n=18) After
Intervention Before
( n=18) After
HbA1c
Mean (SD)
7.93(0.554)
7.95(0.531)
7.7(0.712)
7.01(0.597)
T- Value df P- Value
0.546 17 0.592
7.283 17 <0.0001
Table 3: Comparison of HbA1c means before and after intervention between 2 groups.
HbA1c Before
Mean (SD) After
Control Intervention
( n=18) ( n=18)
7.93 (0.554) 7.7 (0.712)
7.95 (0.532) 7.01 (0.596)
P- Value
0.491 (K-S test)
<0.0001 (T- test)
References 1- Godarzi M, Badkhesh M, Abaszadeh M. Prevalance blood
pressure in population above 18 age in zabol city [ in Persian)].Tabib shargh. 2003; 4(4): 184.
2- Alemzadeh R, Wyatt DT. Diabetes Mellitus in children,
Chap 590, In: Kliegman RM, Behrman RE, Jenson HB,
Stanton BM; Nelson Textbook of Pediatrics; WB Saunders
Company, Philadelphia,18th edition; 2007: 2404-2431.
3- Mortan JR. Hypertension step-care Management.
Registered Nursing 1991; 54 (2): 24-30.
4- Sokolow M, Maleolm B, Cheitlin M. Clinical Cardiology.
USA: Appleton & Lange Co,1999; 5: 235
5- Heravykarimvy M, Jadidmilani M, Rjeh N, Velai N.
Assessment of effective exercise body relaxation on level
anxiety studies test [in Persian]. Journal Mazandaran
University of Medical Sciences. 2003; 14 (43): 89. 6- Conrad A, Roth WT. Muscle relaxation therapy for anxiety
disorders: It works but how? Journal of Anxiety Disorders.
2007; 21: 243- 264.
7- Sheila S, Barbara L, Huey-shyan L, Chun-Lin M. Effects of progressive muscle relaxation on blood pressure and
Iranian Rehabilitation Journal
psychosocial status for clients with essential hypertension
in Taiwan. Holistic. Nursing Practice. 2003: 41.
8- Moyer CA, Rounds J, Hannum JW. A Meta-Analysis of
Massage Therapy Research. Psychological Bulletin. 2004;
130: 3-18.
9- Lederman E. The Science and Practice of MANUAL THERAPY. Elsevier. 2005: 251.
10- Esther M, Chin Pang W. The effects of slow-stroke back
massage on anxiety and shoulder pain in elderly stroke
patients. Complementary Therapies in Nursing & Midwifery. 2004; 10: 209-216.
11- William C. Guide to Alternative Medicine. The American
Health Association Complete. 2007:165.
12- Moaghari M, Nikbakhtenasrabadi A. Assessment quality of attention rehabilitation spirituality in elder age confined to
bed in psychological ward of hospitals of Tehran University
of Medical Science [in Persian]. Journal Payesh 2002; 2
(2): 121-126.
13- Nahavandinegad S. Instruction methods of scientific
massage therapy [in Persian]. Journal of Esfahan University
of Medical Science. 2006:21.
19
14- Mitzel-Wilkinson A. Massage Therapy as a Nursing Practice. Holist Nurs Pract. 2000; 14 (2): 48-56.
15- Ezzo J, Donner T, Nikols D, Cox M. Is massage useful in the management of diabetes? A systematic review. Diabetes
Spectrum. Alexandria. 2001; 14: 218-225. 16- Hernandez- Reif M, Field T, Krasnegor J, Hossain Z,
Theakston H, Burman I. High blood pressure and associated symptoms were reduced by massage therapy.
Journal of bodywork and movement therapies, 2000; 4: 31- 38.
20
17- Edwards B. Effects of massage therapy on African Americans (AA) with Non-Insulin Dependent Diabetes
Mellitus (NIDDM), American Public Health Association 133rd Annual Meeting & Exposition December 10-
14, 2005 Philadelphia.
18- Surwit RS, Tilburg MLA, Zucker N, McCaskill CC, et al.
Stress management improves long-term glycemic control in
type 2 diabetes. Diabetes Care. Alexandria, 2002; 25: 30-
35.
Vol. 9 - Special Issue - Child Neuro Rehabilitation
Iranian Rehabilitation Journal, Vol. 9, December 2011
Original Article
Cerebral Palsy: Motor Types, Gross Motor Function and Associated
Disorders
Farin Soleimani, MD, Pediatric Neurorehabilitation Research Center,
University of Social Welfare and Rehabilitation Sciences, Tehran, Iran
Roshanak Vameghi, MD, MPH Pediatric Neurorehabilitation Research Center, Clinical Science Department,
University of Social Welfare and Rehabilitation Sciences, Tehran, Iran
Mehdi Rassafiani*, PhD Pediatric Neurorehabilitation Research Center, Occupational Therapy Department
University of Social Welfare and Rehabilitation Sciences, Tehran, Iran
Nazila Akbar Fahimi, PhD; Zahra Nobakht, MSc University of Social Welfare and Rehabilitation Sciences, Tehran, Iran
Objectives: Cerebral palsy (CP) describes a group of disorders in the development of movement and
posture in the developing brain. The main aim of this study was to determine the distribution of motor
impairment and associated disorders in a population of children with CP.
Method: This study was carried out in 2011 during three months, on 200 CP children. Multiple sources of
ascertainment were used, including medical records of patients who access at the major rehabilitation and
special educational centers in Tehran and examination by rehabilitation team. Children were grouped according
to motor type, topographic pattern according to the Surveillance of Cerebral Palsy in Europe (SCPE)
definitions and classifications, Manual Ability Classification System (MACS) and Gross Motor Function
Classification System (GMFCS) scales. In this study we evaluate impairments such as seizure disorders,
hearing and visual problems, and cognitive issues.
Results: During the study period, 200 CP child (103 males, 97 females) aged 4-12 years were seen, with
a mean (SD) age of 7.7(2.4) years. In this study spastic CP was the most common type (80.5%) and more
specifically, bilateral CP (62.5%) was more common than unilateral (18%). With respect to the MACS
classification, level IV (23%), and to the GMFCS classification also level IV (30.5%) was the most
common.
Conclusion: Bilateral spastic CP was the most frequent type that had the worst motor problem, and
difficult treatment, so it seems that the health care system should pay more attention to perinatal insults for
prevention of CP in our population.
Key words: Cerebral palsy, Associated disorder, Child, MACS/GMFCS/SCPE
Introduction
Cerebral palsy (CP) describes a group of disorders in
the development of movement and posture, causing
activity limitation which is attributed to non-progressive
disturbances that occur in the developing fetal or
infant brain. The motor disorders of CP are often
accompanied by disturbances of sensation,
cognition, communication, perception, and/or
behavior, and/or by a seizure disorder (1).
CP is the most common cause of physical disability
affecting children in most developed countries, with
a prevalence of approximately 2 per 1000 live births
*All correspondences to: E-mail: [email protected]
Iranian Rehabilitation Journal
(2). Although these clinical syndromes are often not
pure, recognition of the dominant motor types and
topography has been important for research into
causal pathways and possible prevention, correlation
with brain imaging, and for establishing a prognosis
and setting management goals and strategies. It may
also trigger a search for associated problems such as
epilepsy, cognitive and communication difficulties,
which may significantly impact on the well-being
and development of these children (3-4).
Traditionally, CP has been classified according to motor type, topographical distribution and functional
21

severity (2-3) but as yet there has been no consensus
reached on either the descriptors or the definitions of
motor type and topographical distribution.
The motor type is usually described as spastic,
dyskinetic, ataxic, hypotonic or mixed. Currently in
the USA, under the auspices of the National
Institutes for Health, a taskforce on childhood motor
disorders is working on the important issue of motor
type classifications and some helpful guidelines
have been published (5-7). The Surveillance of CP
in Europe (SCPE) has also gone through a consensus
process to develop standard definitions and classifications
of topography and motor type. However, although
classical presentations are easily recognized, there
are many children with mixed or changing motor
types that are difficult to define (2-8).
Classifications according to topographical distribution
are widely employed. Although hemiplegia, diplegia
and quadriplegia are commonly used terms, monoplegia
and triplegia sometimes exist as separate entities or
may be grouped with hemiplegia and quadriplegia,
respectively (2). Not surprisingly, classifications
based on motor type and topographical distribution
has poor reliability, even when observers are
experienced and undergo special training (2-8).
The most useful development in the classification of
CP in recent years has been the development of the
Gross Motor Function Classification System
(GMFCS) (9). The GMFCS is a five-level ordinal
grading system based on the assessment of self-
initiated movement with emphasis on function
during sitting, standing and walking. Unlike the
classification of motor type and topography, the
GMFCS has been shown to be a valid, reliable,
stable and clinically relevant method for the
classification and prediction of motor function in
children with CP between the ages of 2 and 12 years
(9-10).
Of the many types and subtypes of CP, none have a
known cure. Usually, medical intervention is limited
to the treatment and prevention of complications
arising from CP's effects. A 2003 study put the
economic cost for people with CP in the US at
$921,000 per individual, including lost income (19).
In another study, the incidence in six countries
surveyed was 2.12-2.45 per 1,000 live births, (20)
indicating a slight rise in recent years. Improvements
in neonatology, or the medical specialty which is
involved with treatment of neonates, have helped
reduce the number of babies who develop cerebral
palsy, but the survival of with very low birth weight
neonates has increased, and these babies are more
22
likely to have cerebral palsy (21-22).
Perinatal insults are common causes of cerebral
palsy in Iranian children. Childhood long-term
morbidities and handicaps such as CP are the main
factors of years of life lost (YLL) in Iran. According
to the WHO report 2006 , in Iran " perinatal factors "
cause 10 years of life lost, which is the third most
common cause for lost years in the country (after
ischemic heart disease and road traffic accidents)
(23).
Descriptions of the frequency of CP subtypes in the
population may yield clues regarding etiology, and
studies of functioning can help clinicians and other
service providers develop more coordinated, more
holistic care. The determination of the spectrum of
functional limitation that characterizes the group of
children with CP is essential to enable planning for
resource allocation and to facilitate studies relating to
etiology, prevention or prognosis (2).
The main aim of this study was to determine the
distribution of motor impairment and associated
disorders in a population of children with CP with
respect to the motor type, topographic distribution,
hand abilities and gross motor function according to
the SCPE definitions and classifications, manual
ability classification system (MACS) and GMFCS.
Materials and Methods
This study was carried out in 2011 during 3 months,
on 200 CP children of 4-12 year old. In order to
detect demographic characteristics, a questionnaire
was completed for each child, including the child,
parents, care givers, and child health- medical status,
with the aid of parents and the child's records. This
questionnaire includes the child and parents' age, sex,
job, level of education, siblings, family income,
hometown, insurance, duration and the start age of
rehabilitation program. In addition, associated
problems were collected and information on MACS
and GMFCS were obtained by occupational therapists
with direct examination and parent reports in any of
the children. The questionnaire evaluated for content
validity and pilot studies had been carried out.
Definition of CP
CP is an umbrella term covering a group of non-
progressive but often changing motor impairment
syndromes secondary to lesions or anomalies of the
brain, occurring at any time during brain
development (24).
Patients with CP may also have other
neurodevelopmental impairments that can affect
Vol. 9 - Special Issue - Child Neuro Rehabilitation

adaptive functioning, sensory function, learning,
communication, and behavior, as well as may cause
seizures. Abnormal motor control may be further
impaired by features that are associated with CP.
Resulting limits in movement and posture cause
activity limitation and are often accompanied by
disturbances of sensation, deep perception and other
sight-based perceptual problems, communication
ability, and cognition problems and epilepsy is also
found in 1/3 of cases.
Cerebral palsy is divided into four major classifications
to describe different movement impairments. These
classifications also reflect the areas of the brain that are
damaged. The four major classifications are: spastic,
ataxic, athethoid/dyskinetic and mixed. Secondary
conditions can include seizures, epilepsy, speech and
language or other communication disorders, sensory
impairments, mental retardation, learning disabilities,
urinary or , fecal incontinence and/or behavioral disorders.
Participants
The study was performed on children with CP at
different rehabilitation centers in Tehran between
January 2011 and April 2011.
Ascertainment of cases was based on a standard
definition of CP (25). Multiple sources of
ascertainment were used, including records of
patients who access a variety of services at the main
pediatric rehabilitation and special education centers
in Tehran. The rehabilitation centers were in
different parts of Tehran including: 3 centers in
south, 3 in down town and 2 in north of Tehran (five
non-governmental, one public, and two charities)
and three schools for children with special needs (1
in south and 2 in west) were sources to identify
children with developmental disabilities. The
inclusion criteria were having been diagnosed with
“CP” by a specialist, being in the age range of 4-
12 years, and having accepted participation in the
study. Informed consent was obtained from the
families after they were informed about the study.
All children evaluated by a CP clinician that were 3
senior occupational therapists with an advanced
degree, and good clinical experience, and specially
trained in the assessment of children with CP. In the
absence of excluding conditions such as progressive
disorders and neuromuscular diseases, children were
confirmed as CP cases.
Instruments
CP subtype was determined on the basis of the classification system developed by the Surveillance
Iranian Rehabilitation Journal
of Cerebral Palsy in Europe Collaborative Group
(2).
Children were grouped according to motor type,
topographic pattern, MACS and GMFCS levels.
Motor types were classified as spastic, dyskinetic,
mixed, ataxic and hypotonic, as defined in
Appendix 1(5-7). Spastic patterns were further
classified according to topographical distribution as
unilateral involvement (hemiplegic), bilateral
involvement (diplegia with the lower limbs more
affected than the upper limbs and quadriplegia (with
the upper limbs more or equally involved).
The gross motor function of all patients was
classified according to the GMFCS for CP by the
senior occupational therapists. In this standardized
and validated scale, the severity of motor
impairment of children with CP is classified by age
into five levels. It is based on self-initiated
movement, with particular emphasis on sitting and
walking. Distinctions between the five levels of
motor function are made on functional limitations
and the need for assistive devices. Thus, children
classified as level I have the most independent motor
function, while children at level V have the least
(26). The GMFCS levels of the children were
determined by the same occupational therapists by
means of observation and evaluation of the mobility
of the children.
MACS provide a systematic basis to classify how
children with CP use their hands when handling
objects in daily activities. The MACS is based on
self-initiated manual ability, with particular
emphasis on handling objects in an individual‟s
personal space (the space immediately close to one‟s
body, as distinct from objects that are not within
access). As a general principle, if a child‟s manual
ability fits within a particular level, the child will
probably be classified either at or above that level.
Children who do not perform the functions of a
particular level will almost certainly be classified
below that level. Level I includes children with CP
with, at most, minor limitations compared to
typically developing children, and where the limitations,
if any, barely influence their performance of daily
life tasks. In the MACS, five levels are described.
Distinctions between each pair of levels are also
provided to assist in determining the level that most
closely resembles a child‟s manual abilities. The
scale is ordinal, with no intent that the distances
between levels should be considered equal, or that
children with CP are equally distributed across the
five levels (27). The MACS levels of the children
23
were determined by means of observation and
parents reports.
The GMFCS and the MACS levels were classified
by the same occupational therapist according to the
available manuals for the GMFCS and MACS
(Appendix 2) (26, 27).
Associated impairments
In many individuals with CP, other impairments
interfere with the ability to function in daily life and
may at times produce even greater activity limitation
than the motor impairments that are the hallmark of
CP. In this study we evaluate impairments such as
seizure disorders, hearing and visual problems, and
cognitive issues. These impairments were classified
as present or absent; if present, the extent to which
they interfere with the individual‟s ability to
function or participate in desired activities and roles
were described. The presence or absence of epilepsy
(defined as two or more afebrile, non-neonatal
seizures) was recorded.
The estimated cognitive levels (IQ) of the children
were determined using a form which was filled in by
the families. The form was taken from the
impairment form in the SPARCLE project. The
learning disability was defined as mild in children
with an IQ level of 50 to 70 and severe if the IQ
level was less than 50 (28). The details of the form
are given in Appendix 3. Characteristics and co-
morbidity conditions, such as hearing loss, vision
loss, speech disorders, and seizures, were obtained
from the parents‟ reports and medical records.
The collected data was verified and entered into a
standard database file and analyzed using the
statistical package for social sciences. SPSS 16.0
was used for the statistical analysis.
Results
During the study period, 200 CP children (103
males, 97 females) aged 4-12 years were seen with an
overall male: female ratio of 1.06, with a mean (SD)
age of 7.7(2.4) years. The demographic
characteristics of primary caregivers and children
are shown in table 1. Characteristics and co-
morbidity conditions, such as hearing loss, vision
loss, speech disorders, and seizures are presented in
Table 2, and table 3 shows the frequency and
percentage of associated disorders of cerebral palsy
in this study. The distribution of motor types and
topographical distribution within each GMFCS and
MACS level and each type are shown in Table 4 &
5.
24
One hundred- twenty five children (62.5%) with a
mean age of 7.6 years were bilateral spastic CP, and
36 (18%) children with a mean age of 7.9 years were
unilateral spastic CP, 10 children (5%) with a mean
age of 7.6 years were ataxic, and 14 children (7%)
with a mean age of 8 years were dyskinetic. About
mean age no difference was found among the CP
types.
Level IV in MACS classification (23%) and also
Level IV in GMFCS classification (30.5%) were the
more commons. The remaining cases were
distributed rather equally to other levels, near to (19-
20%) to the MACS classification and (11-24.5%) to
the GMFCS classification per level.
Discussion
In this study spastic CP was the most common
(80.5%) and more specifically, bilateral CP (62.5%)
was more common than unilateral (18%).The other
groups with hypertonia (dyskinetic) accounted for
7% of cases while the remaining motor types
(ataxic) represented 5% of the cases. Level IV of
Both MACS and GMFCS were more common, 23%
and 30.5% respectively.
The information available for providing an adequate
classification of the features of CP in any individual
will vary over the age span and across geographic
regions and settings. The role of aging in changing
the clinical phenomenology of CP has been little
studied, and the possibility of classification changes
over time cannot be completely dismissed. Defining
the presence or degree of associated impairments,
such as cognitive deficits, is age-dependent, and in
infants the type of motor disorder may be hard to
explain. Some young children diagnosed as CP may
in fact have very slowly progressive disorders that
have not yet been clearly identified.
Classification often requires making difficult
decisions about where to draw the boundaries within
ordinal or quantitative measures. Some degree of
arbitrariness is inevitable. Assignment of individuals
with the diagnosis of CP to distinct clinical groups is
not straightforward and will differ depending on the
characteristic(s) chosen as the basis for
classification. No one single approach has emerged
as definitive; depending on the purpose of the
classification, certain characteristics or combinations
of characteristics may be more useful than others.
For example, in assessing the effectiveness of a new
treatment for a specific type of tone abnormality, the
nature of the motor disorder and the level of
functional motor ability are likely to be paramount,
Vol. 9 - Special Issue - Child Neuro Rehabilitation
whereas determining service delivery needs will
require the consideration of associated impairments.
No classification system is useful unless it is
reliable. It is, therefore, not enough to specify the
characteristics to be used in classification; they must
be operationally defined so that, in general,
competent examiners will classify the same individual
in the same way given identical information.
However, providing such definitions is beyond the
scope of this document. For example, the term
spastic diplegia is problematic for classification
because its existing definitions are variable and
imprecise, and because we lack evidence that the
term can be used reliably. Some use the term to
describe children with spastic CP whose only motor
deficit is in the legs, whereas others include children
who have arm involvement of lesser severity than
leg involvement. However, determining the relative
severity of arm and leg involvement can be
challenging because they perform very different
functions. By examining CP subtypes, we can gain
information that may improve our understanding of
possible causes, because certain types of CP may be
associated with recognized risk factors. For
example, spastic diplegia is reported to occur more
often in low birth weight (29). Therefore,
examination of changes in the distribution of
subtypes may yield clues to contextual factors that
may affect the risk of CP.
Similar to previous prevalence reports,(30-34,16)
most children in this study had spastic CP (80.5%),
with bilateral being more common than unilateral
spastic CP. The proportions of children with ataxic
CP (5%), and dyskinetic CP (7%) were low, other
reports of the proportions of dyskinetic and ataxic
CP ranged from 1% to 7% of all cases (33-36).
Few researches have performed relevant studies
about the type, associated disorders and functional
level of CP in Iran. In one study in a rehabilitation
center in Tehran on 112 cases, the frequency of
different types of CP were spastic [hemiplegic
(36.6%), diplegia (31.3%), quadriplegia (12.5%)],
atonic & hypotonic (12.5%), dyskinetic (4.5%), and
mixed (1.8%) (39).
In another study on 200 cases the frequency of
different types of CP were spastic diplegia (39.5%),
mixed (28%), spastic quadriplegia (22%), atonic
(4.5%), dyskinetic (4%), and hemiplegic (2%) (40).
Differences in the prevalence of subtypes may result
from definition issues or ascertainment methods.
Further classifications of the spastic subtype according to
limb involvement (i.e., hemiplegia, quadriplegia,
Iranian Rehabilitation Journal
diplegia, triplegia, or monoplegia) have raised the
issues of reliability. However, other CP investigators
also found that the distinction between spastic
diplegia and spastic quadriplegia is particularly
difficult (37-38). Greater confidence was expressed
and more consistent estimates were found when
cases of spastic CP were classified as either unilateral or
bilateral, as proposed by the Collaboration for
Surveillance of CP in Europe, (37) than when the
limb involvement method was used.
The widespread adoption of the definition of CP
proposed by Bax in 1964 has resulted in the
grouping together of large numbers of children with a
wide variety of movement disorders, topographical
distributions and functional abilities under the
„cerebral palsy umbrella‟ (3,45). The marked
variation in functional abilities of children sharing
the common diagnosis of CP has led to repeated
efforts to classify children into meaningful clinical
syndromes. In terms of motor type and
topographical distribution, these efforts have had
limited success, and this makes it difficult to make
meaningful time and geographical comparisons. (2-
3, 8-9) By contrast, the use of the GMFCS now
facilitates a reliable means of classification of the
severity of the motor disorder. The distribution of
children throughout all GMFCS levels confirms the
wide range of function and disability in a typical
population sample of children with CP. GMFCS
level I children are completely independent, they do
not use aids, and usually have mild spastic
hemiplegia. By contrast, children in GMFCS level V
have no independent mobility and often have severe
spastic dyskinesia in a quadriplegic distribution. It is
of note also, that children with spastic hemiplegia
will usually be in levels I and II, and those with
quadriplegia will be in levels III, IV and V.
In this study, within the spastic group, differences in
motor function among the two topography groups
were extremely clear-cut. Compared to children with
unilateral distribution, children with bilateral were
more severe on the GMFCS and MACS scales.
Children with bilateral spastic had the lowest levels
of function, being significantly higher on the
GMFCS and MACS scales than those with
unilateral. In comparison with the total group with
spasticity, children with ataxia appeared to have
higher levels of function on the GMFCS and MACS
scales, but the numbers of children in this group
were too small for a conclusive finding. Children
classified as having a mixed type of motor disorder
were significantly more severe on the GMFCS and
25
MACS scales than children with ataxia.
The SCPE reported the following incidence of
comorbidities in children with CP (the data are from
1980-1990 and included over 4,500 children over
age 4 whose CP was acquired during the prenatal or
neonatal period): mental disadvantage (IQ < 50):
31%, active seizures: 21%, mental disadvantage (IQ <
50) and unable to walking: 20%, and blindness: 11%
(41).
The SCPE noted that the incidence of comorbidities is
difficult to measure accurately, particularly across
centers. For example, the actual rate of an
intellectual impairment may be difficult to
determine, as the physical and communicational
limitations of people with CP would likely lower
their scores on an IQ test if they were not given a
correctly modified version.
Speech and language disorders are common in
people with cerebral palsy. The incidence of
dysarthria is estimated to range from 31% to 88%.
Speech problems are associated with poor
respiratory control, laryngeal and velopharyngeal
dysfunction as well as oral articulation disorders that
are due to restricted movement in the oral-facial
muscles. In this study speech problems were 47 %
which was near to recent study in Iran (41%) (40).
Concurrent seizure with CP in different reports is
between 25-33% and in this study was 17%.
This report of population characteristics of children
with CP, co-morbid disabilities and evaluation of
gross motor and hand functioning by using the
GMFCS and MACS at eight rehabilitation centers
and two special schools makes an important step
forward in expanding our understanding of CP in the
Tehran. Future analyses will examine the
characteristics of children with CP in other cities in
Iran. We need additional research using consistent,
population-based methods over time and in more
communities to provide a more comprehensive
picture of CP among children in the Iran.
The goal of the classifications in the assessment of
children with CP is to assist in the communication
between clinicians, select homogeneous groups of
use of the instruments improves the ability to care
for children with CP.
Conclusion
In this study the most frequent type of CP was
bilateral spastic that had the worst motor status, and
difficult treatment, so it seems that the health care
system should pay more attention to perinatal insults
for prevention of CP in our population.
Significant number of children with CP (59%) had
IQ>70 or educable, therefore through early diagnosis
and detection of those with normal IQ and use of
specialized educational programs (with special
attention to their functional disabilities), they can a
normal life like others and enjoy themselves.
In conclusion, the term „cerebral palsy‟, despite all
its shortcomings, is worth retaining, although it
might be better to use the term „cerebral palsies‟ to
describe a CP phenotype that encompasses the
enormous variability in motor type, topography and
gross motor function. We think that the best way of
classifying children with CP is a combination of
motor type, topography and gross motor function,
according to the GMFCS and MACS scales.
Acknowledgements
We would like to thank Pediatric Neurorehabilitation
Research Center and University of Social Welfare
and Rehabilitation Sciences (USWRS) for financial
supports and children, parents, care givers,
rehabilitation centers and special schools as well for
their active participation in this study.
Appendix 1
Definitions of motor types
Hypertonia in which resistance to
externally imposed movement increases
Spasticity with increasing speed and varies with
direction of movement and/or rises
rapidly above a threshold speed.
Involuntary, sustained or intermittent
Dyskinesia muscle contractions causing twisting children for clinical research trials, facilitate the
development of rating scales to assess improvement
or deterioration with time, and, eventually, to better
match each individual patient with specific therapies
(49). In our opinion, this paper may provide
pediatricians and rehabilitation teams an
introduction in how far the classification of CP has
come. It may be important to try to make it more
relevant to health professionals and expand why the
26
and repetitive movements, abnormal postures or both.
Mixed Clinical features of more than one type,
motor types usually spastic and dyskinetic.
Abnormal pattern of posture and/or
movement with loss of orderly muscle
Ataxia coordination so that movements are
performed with abnormal force, rhythm
or accuracy.
Vol. 9 - Special Issue - Child Neuro Rehabilitation

Abnormally low tone, in the trunk and
Hypotonia limbs that must be distinguished from
weakness.
Appendix 2
Summary of the criteria for the GMFCS and MACS
(MACS) in children with cerebral palsy. A
population-based study of 359 children. BMC
Musculoskelet Disord 8:50
Appendix 3
Estimated cognitive level of children with CP
For the cognitive level, you can ask the parents some GMFCS MACS
Level I questions and report “estimated cognitive level”:
Cognitive description/IQ
Walks without
restrictions, limitations in
more advanced gross
motor skills
Level II
Walks without
restrictions, limitations
walking outdoors and in
the community
Level III
Handles objects easily
and successfully
Handles most objects
but with somewhat
reduced quality and/or
speed of achievement
Has your child had an assessment of IQ in the last
year or so?
If yes, what was the result?
1. Do you think your child learns as well as other
children of a similar age?...
...Yes/No
2. Does your child play with and be friends with
children of a similar age?... ............... ..Yes/No
If the answer is Yes to Questions 1 and 2, the IQ is
probably >70. If not,consider the following questions:
Walks with assistive
mobility devices,
limitations walking
outdoors and in
community
Handles objects with
difficulty, needs help to
prepare and/or modify
activities
3. Does you child have severe difficulty with
learning in all aspects of development?
... Yes/No
4. Is your child‟s ability to read and understand
ideas like that of a much younger child, such as
Level IV
Self mobility with
limitations, children are
transported or use power
mobility outdoors and in
the community
Level V
Self mobility is severely
limited, even with use of
assistive technology
Handles a limited
selection of easily
managed objects in
adapted situations
Does not handle objects
and has very limited
ability to perform even
simple actions
one more than half of their age? ... ... Yes/No
If the answer is Yes to Questions 3 and 4, IQ is
probably <50.
Otherwise the child probably falls into IQ 50-70, but
this should be confirmed by expecting the answer
Yes to the questions below:
5. Do you think that your child needs much more
help than other children to learn things like
reading and understanding
ideas?... ......................... .. Yes/No
6. Does your child find it easier to make friends and
play with younger children?... ............ ... Yes/No This table was taken from Carnahan KD, Arner M,
Hنgglund G (2007) Association between gross
motor function (GMFCS) and manual ability
Table 1. Demographics of Primary Caregivers and Children Participating in the Study.
Demographics Response Categories Frequency (%)
Gender Male 103 (48.5)
Female 97 (51.5)
4-6 Years 55
6-8Years 41 Preschool 8-10 Years 17
10-12 Years 11
Iranian Rehabilitation Journal 27
Demographics Response Categories Frequency (%)
Total 124 (62)
4-6 Years -
6-8Years 12 Child‟s Education Elementary 8-10 Years 34
School 10-12 Years 24
Total 70 (35)
4-6 Years -
Middle 6-8Years - School 8-10 Years -
10-12 Years 6
Total 6 (3)
Ordinary School 45 (22.5)
Special School 57 (28.5) Type of School Not Going 98 (49)
North 15 (7.5)
Center 20 (10)
East 28 (14)
West 30 (15) Living place of family South 92 (46)
Margin 13 6.5)
Missing 2 (1)
Completed primary School 70 (35)
Completed high School 84 (42)
Over diploma & BS 42 (21) Mother‟s Education MS & higher 2 (1)
Missing 2 (1)
Completed primary School 71 (35.5)
Completed high School 67 (33.5)
Over diploma & BS 46 (23) Father‟s Education MS & higher 13 (6.5)
Missing 3 (1.5)
Table 2. Characteristics and accompanying co-morbidity conditions of children with cerebral palsy (CP)
Characteristic Value
Ages (years), median (range) 7 (4-15)
Types of cerebral palsy N (%)
Unilateral Spastic 36 (18)
Bilateral Spastic 125 (62.5)
Ataxic 10 (5)
Dyskinetic 14(7)
Unclassified(mixed) 15(7.5)
Co-morbidity conditions N (%)
Hearing problems 15 (7.5)
Vision problems 80 (40)
Speech disorders 94 (47)
Seizures, epilepsy 34 (17)
28 Vol. 9 - Special Issue - Child Neuro Rehabilitation
Table 3. The frequency and percentage of associated disorders in 200 children with
cerebral palsy in Tehran
Associated Disorders Frequency (N) Percent (%)
Estimated Cognitive <50 36 18
Level 70-50 46 23
>70 118 59
with functional limitation 40 20
Visual Problems Having without functional limitation 40 20
Not having 114 57
Not Response 6 3
with functional limitation 7 3.5
without functional limitation 8 4
Hearing Problems Having
Not having 182 91
Not Response 3 1.5
with functional limitation 73 36.5
without functional limitation 21 10.5
Speech & Language Having
Disorders Not having 95 47.5
Not Response 11 5.5
with functional limitation 17 8.5
without functional limitation 17 8.5
Epileptic Disorders Having
Not having 157 78.5
Not Response 9 4.5
with functional limitation 37 18.5
without functional limitation 7 3.5
Voiding Having
Incontinence Not having 145 72.5
Not Response 11 5.5
with functional limitation 36 18
Deification without functional limitation 9 4.5
Incontinence Having
Not having 143 71.5
Not Response 12 6
Table 4. Motor types and topographical distribution in 200 children with cerebral palsy in Tehran. For each motor type/topographic pattern, the frequency and percentage are shown
within each GMFCS level and each type.
Motor type/topographic pattern
Hypertonia
Spastic
Unilateral In Total/ n (%)
Spastic In Type(%)
Bilateral In Total/ n (%)
Spastic In Type(%)
In Total/ n (%)
GMFCS
I II III
12(33.3) 16(44.6) 0(0)
33.3 44.4 0
4(3.2) 23(18.4) 25(20)
3.2 18.4 20
2(14.3) 2(14.3) 0(0)
Total
IV V n (%)
6(16.7) 2(5.6) 36(18)
16.7 5.6 100
42(33.6) 31(24.8) 125(62.5)
33.6 24.8 100
6(42.9) 4(28.6) 14(7) Dyskinesia
Unclassified
In Type(%) 14.3
In Total/ n (%) 2(9.1)
14.3 0 42.9 28.6 100
3(6.1) 4(12.9) 6(9.8) 0(0) 15(7.5)
Iranian Rehabilitation Journal 29
Motor type/topographic pattern
In Type(%)
In Total/ n (%)
GMFCS
I II III
13.3 20 26.7
2(9.1) 5(10.2) 2(6.5)
Total
IV V n (%)
40 0 100
1(1.6) 0(0) 10(5) Ataxia
Total /Level
In Type(%) 20
n (%) 38(19)
50 20 10
38(19) 40(20) 46(23)
0 100
38(19) 200 (100)
Table 5. The distribution of motor types and topographical distribution in 200 children with
cerebral palsy in Tehran. For each motor type/topographic pattern, the frequency and percentage
are shown within each MACS level and each type
Motor type/topographic pattern
Unilateral In Total n (%)
Spastic
MACS
I II III
Hypertonia
Spastic
11 7 11
(28.9) (18.4) (27.5)
Total
IV V n (%)
5 2 36
(10.9) (5.3) (18)
Bilateral
Spastic
Dyskinesia
Unclassified
Ataxia
Total
In Type(%)
In Total n (%)
In Type(%)
In Total n (%)
In Type(%)
In Total n (%)
In Type(%)
In Total n (%)
In Type(%)
N (%)
30.6 21
(55.3)
16.8
0(0)
0
2
(5.3)
13.3
4
(10.5)
40
38
(19)
19.4 30.6 13.9
21 (55.3) 22 (55) 31(67.4)
16.8 17.6 24.8
3(7.9) 1 (2.5) 5 (10.9)
21.4 7.1 35.7
2(5.3) 5(12.5) 5 (10.9)
13.3 33.3 33.3
5 (13.2) 1 (2.5) 0 (0)
50 10 0
38 40 46
(19) (20) (23)
5.6 100
30(78.9) 125 (62.5)
24 100
5 (13.2) 14 (7)
35.7 100
1 (2.6) 15 (7.5)
6.7 100
0 (0) 10 (5)
0 100
38 200
(19) (100)
References 1. Bax M, Goldstein M, Rosenbaum PL, Leviton A, Paneth N,
Dan B et al. Executive Committee for the Definition of Cerebral Palsy (2005). Proposed definition and classification of cerebral palsy, April 2005. Dev Med Child Neurol. 2005; 47:571-576
2. Stanley F, Blair E, Alberman E. (eds) Cerebral Palsies:
Epidemiology and Causal Pathways. London: Mac Keith, 2000.
3. Miller G, Clark GD. The Cerebral Palsies: Causes, Consequences, and Management. Boston: Butterworth- Heinemann, 1998.
4. Dobson F, Boyd RN, Parrott J, Nattrass GR, Graham HK. Hip surveillance in children with cerebral palsy. Impact on the surgical management of spastic hip disease. J. Bone Joint Surg. Br. 2002; 84: 720-6.
5. Sanger TD, Delgado MR, Gaebler-Spira D, Hallett M, Mink JW. Classification and definition of disorders causing hypertonia in childhood. Pediatrics. 2003; 111: e89-97.
6. Sanger TD. Pathophysiology of pediatric movement disorders. J.Child Neurol. 2003; 18: S9-24.
7. Delgado M, Albright A. Movement disorders in children: Definitions, classifications and grading systems. J. Child Neurol. 2003; 18: S1-8.
30
8. Blair E, Stanley F. Interobserver agreement in the
classification of cerebral palsy. Dev. Med. Child Neurol. 1985; 27: 615-22.
9. Palisano R, Rosenbaum P, Walter S, Russell D, Wood E, Galuppi B. Development and reliability of a system to classify gross motor function in children with cerebral palsy. Dev. Med. Child Neurol.1997; 39: 214-23.
10. Wood E, Rosenbaum P. The Gross Motor Function Classification System for cerebral palsy: A study of reliability and stability overtime. Dev Med Child Neurol. 2000; 42: 292-6. 11. Honeycutt A, Dunlap L, Chen H, Homsi G. Economic costs associated with mental retardation, cerebral palsy, hearing loss, and vision impairment: United States, 2003. MMWR Morb Mortal Wkly Rep.2004; 53 (3):57- 59. 12. Bhushan V, Paneth N, Kiely JL. Impact of improved survival of very low birth weight infants on recent secular trends in the prevalence of cerebral palsy.
Pediatrics.1993;91 (6):1094- 1100. 13. Topp M, Uldall P, Langhoff-Roos J. Trend in cerebral palsy birth prevalence in eastern Denmark: birth-year period 1979-86. Paediatr Perinat Epidemiol.1997; 11 (4):451-
460.
Vol. 9 - Special Issue - Child Neuro Rehabilitation
14. Pharoah PO, Cooke T, Cooke RW, Rosenbloom L.
Birthweight specific trends in cerebral palsy. Arch Dis Child.1990; 65 (6):602- 606.
15. Meberg A, Nroch H. A changing pattern of cerebral palsy: declining trend for incidence of cerebral palsy in the 20- year period 1970-89. J Perinat Med.1995; 23 (5):395- 402.
16. Hagberg B, Hagberg G, Olow I, Wendt L. The changing panorama of cerebral palsy in Sweden, part VII: prevalence and origin in the birth year period 1987-1990. Acta Paediatr.1996;85 (8):954- 960.
17. Pharoah PO, Cooke T, Johnson MA, King R, Mutch L. Epidemiology of cerebral palsy in England and Scotland, 1984-9. Arch Dis Child Fetal Neonatal Ed.1998;79 (1):F21- F25.
18. Platt MJ, Cans C, Johnson A, et al. Trends in cerebral palsy among infants of very low birthweight (<1500 g) or born prematurely (<32 weeks) in 16 European centres: a database study. Lancet.2007; 369 (9555):43- 50
19. Centers for Disease Control and Prevention (CDC) (2004). "Economic costs associated with mental retardation, cerebral palsy, hearing loss, and vision impairment— United States, 2003". MMWR Morb. Mortal. Wkly. Rep. 53 (3): 57-9. PMID 14749614.
20. ""Summary of "The Epidemiology of cerebral palsy: incidence, impairments and risk factors"". United Cerebral Palsy Research and Education Foundation (U.S.). http://www.ucpresearch.org/fact-sheets/epidemiology- cerebral-palsy.php. Retrieved 5 July 2007.
21. "Information: Scope". http://www.scope.org.uk/information/cp.shtml. Retrieved 2007-12-08.
22. Groch, Judith (January 5). "Medical news: Cerebral palsy rates decline in very low birthweight children". MedPage Today. MedPage Today. http://www.medpagetoday.com/Neurology/GeneralNeurol ogy/tb2/4812. Retrieved 2007-12-08.
23. http://www.who.int/entity/healthinfo/statistics/bodgbddeath dalyestimates. xls.
24. Mutch L, Alberman E, Hagberg B, Kodama K, Perat MV. Cerebral palsy epidemiology: where are we now and where are we going? Dev Med Child Neurol.1992; 34 (6):547- 551.
25. Mutch L, Alberman E, Hagberg B, Kodama K, PeratMV. Cerebral palsy epidemiology: Where are we now and where are we going? Dev Med Child Neurol. 1992; 34: 547-51.
26. Palisano R, Rosenbaum PL, Walter S, Russell D, Wood E, Galuppi B . Development and reliability of a system to classify gross motor function in children with cerebral palsy. Dev Med Child Neurol. 1997; 39:214-223
27. Arner M, Eliasson AC, Rsِblad B, Rosenbaum PL, Beckung E, Krumlinde-Sundholm L (2008) Manual Ability Classification System for children with cerebral palsy. Home page at: http://www.macs.nu
28. Colver A; SPARCLE Group (2006) Study protocol: SPARCLE—a multi-centre European study of the relationship of environment to participation and quality of life in children with cerebral palsy.BMC Public Health 6:105
29. Sundrum R, Logan S, Wallace A, Spencer N. Cerebral palsy and socioeconomic status: a retrospective cohort study. Arch Dis Child.2005;90 (1):15- 18
30. Bhasin TK, Brocksen S, Avchen R, Van Naarden K. Prevalence of four developmental disabilities among children aged 8 years: Metropolitan Atlanta Developmental Disabilities Surveillance Program, 1996 and 2000. MMWR Surveill Summ.2006; 55 (1):1- 9
31. Winter S, Autry A, Boyle C, Yeargin-Allsop M. Trends in
Iranian Rehabilitation Journal
the prevalence of cerebral palsy in a population-based study. Pediatrics.2002; 110 (6):1220- 1225.
32. Himmelmann K, Hagberg G, Beckung E, Hagberg B, Uverbrant P. The changing panorama of cerebral palsy in Sweden, part IX: prevalence and origin in the birth-year period 1995-1998. Acta Paediatr.2005; 94 (3):287- 294. 33. Mongan D, Dunne K, O'Nuallain S, Gaffney G. Prevalence of cerebral palsy in the West of Ireland 1990-1999. Dev Med Child Neurol.2006; 48 (11):892- 895. 34. Parkes J, Dolk H, Pattenden S. Cerebral palsy in Northern Ireland: 1981-93. Paediatr Perinat Epidemiol.2001; 15
(3):278- 286. 35. Serdaroğlu A, Cansu A, Ozkan S, Tezcan S. Prevalence of cerebral palsy in Turkish children between the ages of 2 and 16 years. Dev Med Child eurol.2006;48 (6):413- 416. 36. Hagberg B, Hagberg G, Beckung E, Uvebrant P. Changing panorama of cerebral palsy in Sweden, part VIII: prevalence and origin in the birth year period 1991-1994. Acta Paediatr.2001; 90 (3):271- 277. 37. SCPE Collaborative Group. Surveillance of cerebral palsy in Europe: a collaboration of cerebral palsy surveys and registers. Dev Med Child eurol.2000;42 (12):816- 824. 38. Colver AF, Sethumadhaven T. The term diplegia should be abandoned. Arch Dis Child.2003;88 (4):286- 290. 39. Sajedi F, Togha M, Karimzadeh P. A survey of 200 cases of cerebral palsy in welfare and rehabilitation centers of Tehran. Saudi J Disabil 2003;9(1):1-7. 40. Soleimani F, Hemmati S, Amiri N, Dadkhah A. Cerebral palsy in Iranian children: Etiology, types and associated disorders. MIDDLE EAST J FAMILY MED. 2008; 6(7): 24-29. 41. "Thames Valley Children's Centre - Cerebral Palsy -
Causes and Prevalence". Archived from the original on 2007-08-23. http://web.archive.org/web/20070823084944/http://www.tv cc.on.ca/gateway.php?id=167&cid=2. Retrieved 2007-06- 11.
42. Al-Sulaiman A. Electroencephalographic finding in children with cerebral palsy; a study of 151 patients. funct Neurol. 2001; 16; 325-328.
43. Zafeiriou DI, Kontopoulos EE, Tsikoulas I. Characteristics and prognosis of epilepsy in children with cerebral palsy. J Child Neurol. 1999; 14: 289-294.
44. Schenk-Rootlieb AJF, van Nieuwenhuzen O, van der Graaf Y, Wittebol-Post D, Willense J. The prevalence of cerebral visual disturbances in children with cerebral palsy. Dev Med Child Neurol. 1992; 4:473-480.
45. BaxM. Terminology and classification of cerebral palsy. Dev Med Child Neurol. 1964; 6: 295-307.
46. Nordmark E, Hagglund G, Lagergren J. Cerebral palsy in southern Sweden II. Gross motor function and disabilities. Acta Paediatr. 2001; 90: 1277-82.
47. Surveillance of Cerebral Palsy in Europe. Prevalence and characteristics of children with cerebral palsy in Europe. Dev Med Child Neurol. 2002; 44: 633-40.
48. Gorter JW, Rosenbaum PL, Hanna SE, Palisano RJ, Bartlett DJ, Russell DJ et al. Limb distribution, motor impairment, and functional classification of cerebral palsy. Dev Med Child Neurol. 2004; 46: 461-7.
49. Sanger TD, Chen D, Delgado MR, Gaebler-Spira D, Hallett M, Mink JW; Taskforce on Childhood Motor Disorders. Definition and classification of negative motor signs in childhood. Pediatrics. 2006;118:2159-2167.
50. Kennes J, Rosenbaum P, Hanna SE, Walter S, Russell D, Raina P et al. Health status of school aged children with cerebral palsy: Information from a population based sample. Dev Med Child Neurol. 2002; 44: 240-7.
٣31
Iranian Rehabilitation Journal, Vol. 9, December 2011
Original Article
The Relationship Among Personality Factors, Motivational Strategies
and Achievement Goals Orientation in Predicting Academic
Achievement of the Students with Intellectual Disability
Masoume Pourmohamadreza Tajrishi, PhD Pediatric Neurorehabilitation Research Center, University of Social Welfare and Rehabilitation Sciences,
Tehran, Iran
Mohamad Ashoori*, MSc Department of Educational psychology, Faculty of psychology, Islamic Azad University, Roudehen Branch,
Roudehen, Iran
Seyede Somaye Jalil-Abkenar, MSc University of Social Welfare and Rehabilitation Sciences, Tehran, Iran
Jamal Ashoori, MSc Department of Educational psychology, Faculty of Sciences and Research, Islamic Azad University, Sciences
and Research Branch, Esfahan, Iran
Objectives: Some studies have recognized factors that are effective on academic achievement. The aim of the
present study was to determine the relationship among personality factors, motivational strategies and
achievement goals in predicting academic achievement of 2nd grade high school intellectually disabled
students in Tehran Province.
Methods and Materials: In present correlation study, 200 intellectually disabled students (126 females and 74
males) in 2nd grade high school selected randomly by stratified sampling method from Tehran Province.
Subjects completed Big Five Factor Personality Inventory (NEO-FFI), Motivational Strategies for Learning
Questionnaire (MSLQ) and Achievement Goals Questionnaire-Revised (AGQ-R). Data analysis was based
on stepwise regression analysis method.
Results: As personality factors, openness and being conscientiousness were correlated positively. In
motivational strategies, effort regulation, help seeking and self-efficacy correlated positively, also
mastery-approach and performance-avoidance goals in achievement goals orientation showed positive
correlation (p<0.05). Neuroticism, test-anxiety and academic achievement were correlated negatively
(p<0.01). It can be explained that 44% of variations in academic achievement are due to self-efficacy, Being
conscientiousness, mastery-approach goal and neuroticism (p<0.05). Self-efficacy had the most contribution
in predicting academic achievement of students (p<0.01).
Conclusion: Paying attention to the variables such as: personality (being conscientiousness and
neuroticism), motivational (self-efficacy) and achievement goals orientation (mastery-approach goal) have crucial role in predicting academic achievement in students with intellectual disability.
Key words: Personality factors, Motivational Strategies, Achievement Goals Orientation, Academic Achievement, Intellectual disability.
Introduction
Acquaintance with intellectual disabled students is
helpful for recognizing them, also for planning and
providing educational resources (1). These students
are facing more problems in academic setting in
comparison to normal students. To explore these
students and using appropriate strategies will improve
their educational and academic achievement (2, 3).
Many studies have indicated that the relation
between intelligence and academic achievement is
*All correspondences to: E-mail: [email protected]
32
unexpected. As far as the role of cognitive variables
reduces in prediction of academic achievement, the
contribution of personality variables will increase
(4). One of the characteristics that affects academic
performance is personality. Personality is a set of
stable and organized traits which distinguishes an
individual from others. Schultz proposed that
personality is consisting of five factors: Neuroticism,
extroversion, openness to experience, agreeableness
and conscientiousness (5, 6).
Vol. 9 - Special Issue - Child Neuro Rehabilitation
Previous results are contradictory about the
relationship between personality factors and
academic achievement. Some other studies have
mentioned, a positive and significant relationship
between agreeableness, neuroticism and academic
achievement, but others have showed no significant
correlation between extroversion, conscientiousness,
openness to experience and academic achievement
(7, 8).
Martin reported that there is a negative relationship
between neuroticism and academic achievement,
also positive one between conscientiousness,
openness to experience, extroversion and academic
achievement in intellectual disabled students (9).
Review of literature shows that there is no linear
relation between personality factors and academic
achievement. Some studies have shown that
motivational strategies are determinant factors for
academic achievement. According to Pintrich,
motivational strategies are consisting of three
components such as resources management, self-
efficacy and test-anxiety. Some studies have
indicated positive and significant relationship
between academic achievement and variables like
time management, study environment, effort
regulation, peer learning and help seeking (10, 11).
Also, the other studies revealed no significant relation
between time and place management, effort
regulation, help seeking and academic achievement
(12). However, research on children with intellectual
disability has shown positive and significant
relationship between management strategies and
academic achievement (13-15). In addition, it is
reported that there is positive and significant
relationship between academic achievement and
self-efficacy (15, 16), also negative relation between
test-anxiety and academic achievement in students
with intellectual disability (17, 18, 19, 20, 21, 22,
23).
Achievement goals are considered as one of the
dimensions of motivational strategies. Educational
theorists have mentioned a few goal-oriented
approaches. For example Elliot and Pintrich
introduced goal achievements as a matrix with two
dimensions. Four types of goal approaches can be
recognized based on the matrix as follows: mastery-
approach, mastery-avoidance, performance-approach,
performance-avoidance (24, 25).
Students with mastery-approach goals focus on learning,
task master, learning of new skills, developing or
improving their competencies, concentration on
understanding and insight (26,19,27-28). In contrast,
Iranian Rehabilitation Journal
students with performance-approach goals focus on
avoidance of misunderstanding, no gain control over
the task or profit from wrong criteria (27-31). More
have shown that there is a positive relationship
between mastery-approach and performance-approach
goals with academic achievement and a negative
relationship between performance-avoidance goal
and academic achievement (12, 14, 28, 31-38).
Although many studies have examined the role of
personality factors, motivation strategies and
achievement goals orientation on academic
achievement in normal students, the role of these
variables in students with intellectual disability has
not been known. Additionally, the contribution of
these variables in academic achievement has not
been already studied. In fact, the purpose of present
study is to explain the simultaneous role of
personality factors, motivational strategies and
achievement goals orientation in predictive model
for variations of academic achievement.
Materials and Methods
The study was approved by Ethics Committee of
University of Social Welfare and Rehabilitation
Sciences. This was a descriptive-analytical
correlation study. From 272 secondary school
students who were educating in exceptional centers
in Tehran Province, 200 subjects (126 females and
74 males) were selected randomly by stratified
sampling method. They were 16 to 20 years old. All
students completed Neo Big-Five Factor Personality
Inventory (NEO-FFI; Costa and McCrae, 1992),
Motivational Strategies for Learning Questionnaire
(MSLQ; Pintrich) and Achievement Goals
Questionnaire-Revised (AGQ-R; Elliot and
Murayama) (10, 39).
NEO-FFI: this inventory was made by Costa and
McCrae and is a personality test with two short-
forms (60 and 44 items). In present study, a 44-items
form was used which measured five factors such as
neuroticism, extroversion, openness to experience,
agreeableness and conscientiousness. Each item was
scored according to Likert‟s five-degree scale. Its
reliability was reported 0.90, 0.78, 0.76, 0.86, and
0.90 for above-mentioned five factors respectively
(6).
MSLQ: the questionnaire has 32 items which was
made by Pintrich and consisted of resource
management strategies and motivational strategies.
The first section includes time management and
study environment, effort regulation, peer learning
and help seeking; the second one includes self-
33
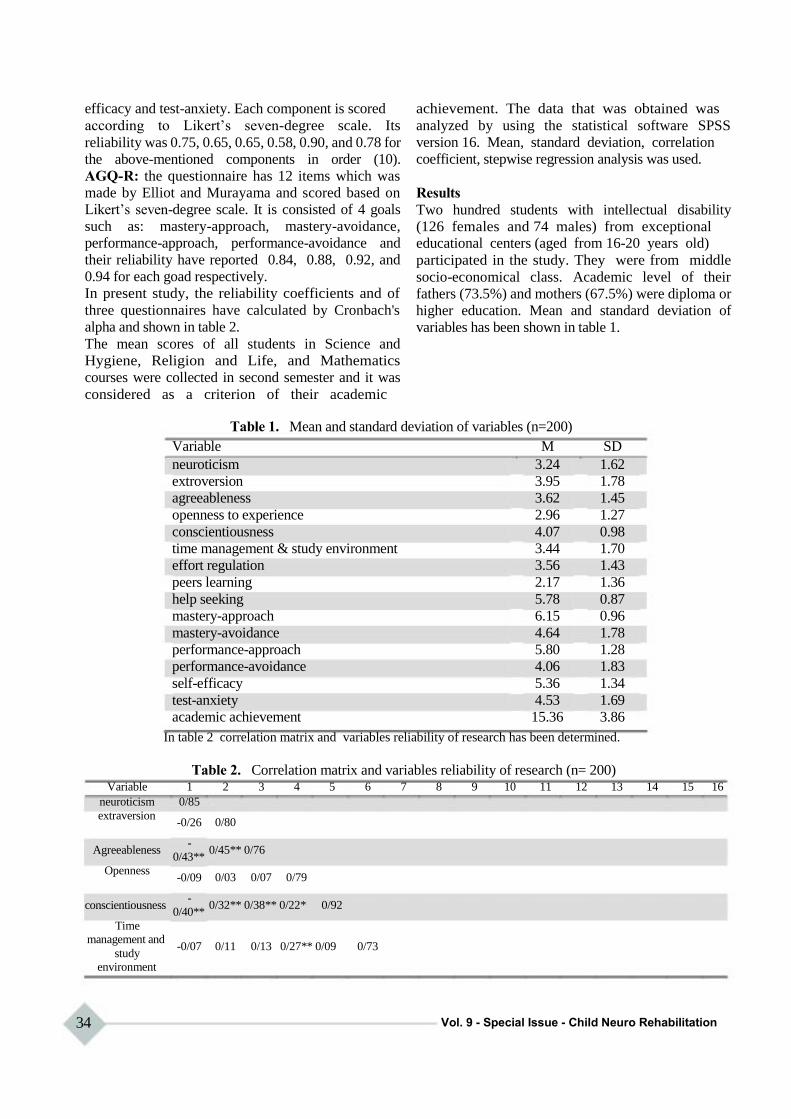
efficacy and test-anxiety. Each component is scored
according to Likert‟s seven-degree scale. Its
reliability was 0.75, 0.65, 0.65, 0.58, 0.90, and 0.78 for
the above-mentioned components in order (10).
AGQ-R: the questionnaire has 12 items which was
made by Elliot and Murayama and scored based on
Likert‟s seven-degree scale. It is consisted of 4 goals
such as: mastery-approach, mastery-avoidance,
performance-approach, performance-avoidance and
their reliability have reported 0.84, 0.88, 0.92, and
0.94 for each goad respectively.
In present study, the reliability coefficients and of
three questionnaires have calculated by Cronbach's
alpha and shown in table 2.
The mean scores of all students in Science and
Hygiene, Religion and Life, and Mathematics
courses were collected in second semester and it was
considered as a criterion of their academic
achievement. The data that was obtained was
analyzed by using the statistical software SPSS
version 16. Mean, standard deviation, correlation
coefficient, stepwise regression analysis was used.
Results
Two hundred students with intellectual disability
(126 females and 74 males) from exceptional educational centers (aged from 16-20 years old)
participated in the study. They were from middle
socio-economical class. Academic level of their
fathers (73.5%) and mothers (67.5%) were diploma or
higher education. Mean and standard deviation of
variables has been shown in table 1.
Table 1. Mean and standard deviation of variables (n=200)
Variable M SD
neuroticism 3.24 1.62
extroversion 3.95 1.78
agreeableness 3.62 1.45
openness to experience 2.96 1.27
conscientiousness 4.07 0.98
time management & study environment 3.44 1.70
effort regulation 3.56 1.43
peers learning 2.17 1.36
help seeking 5.78 0.87
mastery-approach 6.15 0.96
mastery-avoidance 4.64 1.78
performance-approach 5.80 1.28
performance-avoidance 4.06 1.83
self-efficacy 5.36 1.34
test-anxiety 4.53 1.69
academic achievement 15.36 3.86
In table 2 correlation matrix and variables reliability of research has been determined.
Table 2. Correlation matrix and variables reliability of research (n= 200) Variable
neuroticism
extraversion
Agreeableness
Openness
conscientiousness
Time management and
study environment
1
0/85
-0/26
-
0/43**
-0/09
-
0/40**
-0/07
2 3 4 5
0/80
0/45** 0/76
0/03 0/07 0/79
0/32** 0/38** 0/22* 0/92
0/11 0/13 0/27** 0/09
6 7 8 9 10
0/73
11 12 13 14 15 16
34 Vol. 9 - Special Issue - Child Neuro Rehabilitation
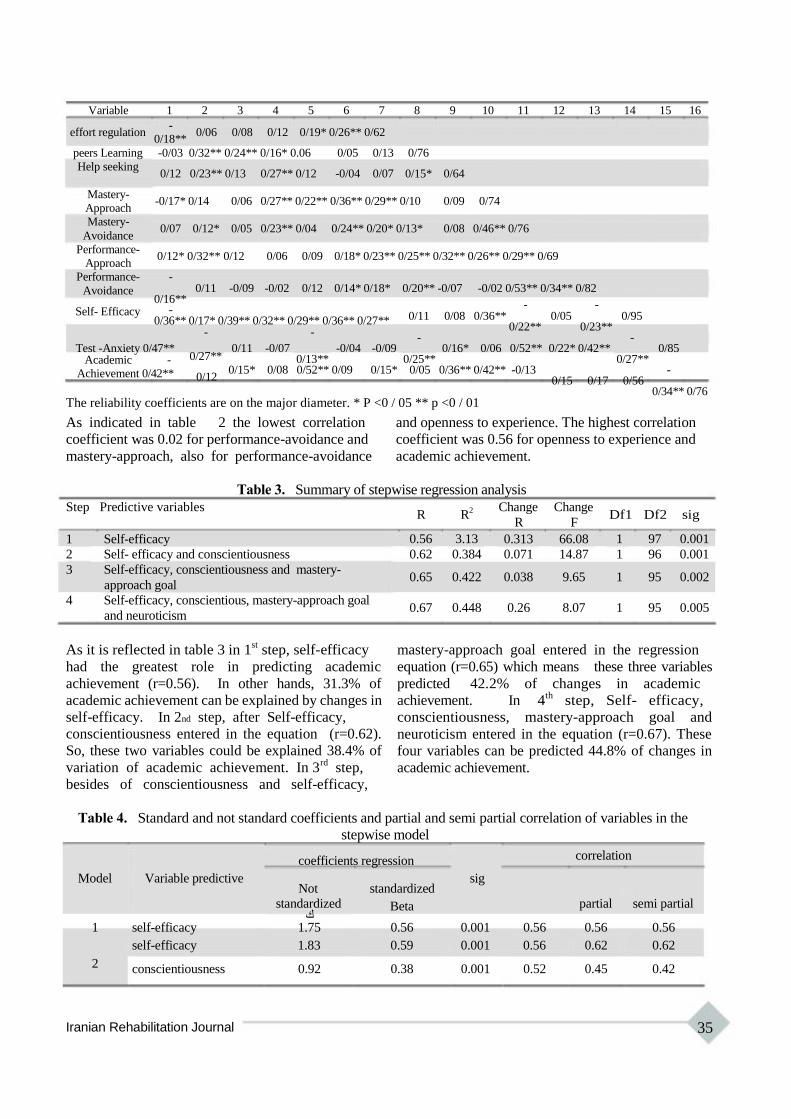
Variable 1 2 3 4 5 6 7 8 9 10 11 12 13 14 15 16
effort regulation -
0/18** 0/06 0/08 0/12 0/19* 0/26** 0/62
peers Learning
Help seeking
Mastery-
Approach Mastery-
Avoidance
Performance-
Approach Performance-
-0/03 0/32** 0/24** 0/16* 0.06 0/05 0/13 0/76
0/12 0/23** 0/13 0/27** 0/12 -0/04 0/07 0/15* 0/64
-0/17* 0/14 0/06 0/27** 0/22** 0/36** 0/29** 0/10 0/09 0/74
0/07 0/12* 0/05 0/23** 0/04 0/24** 0/20* 0/13* 0/08 0/46** 0/76
0/12* 0/32** 0/12 0/06 0/09 0/18* 0/23** 0/25** 0/32** 0/26** 0/29** 0/69
-
Avoidance
Self- Efficacy
0/11 -0/09 -0/02 0/12 0/14* 0/18* 0/16**
- 0/36** 0/17* 0/39** 0/32** 0/29** 0/36** 0/27**
- -
0/20** -0/07 -0/02 0/53** 0/34** 0/82
- - 0/11 0/08 0/36** 0/05 0/95
0/22** 0/23** - -
Test -Anxiety 0/47** Academic -
Achievement 0/42**
0/27**
0/12
0/11 -0/07 -0/04 0/13**
0/15* 0/08 0/52** 0/09
-0/09 0/16* 0/06 0/52** 0/25**
0/15* 0/05 0/36** 0/42** -0/13
0/22* 0/42** 0/85 0/27**
- 0/15 0/17 0/56
0/34** 0/76 The reliability coefficients are on the major diameter. * P <0 / 05 ** p <0 / 01
As indicated in table 2 the lowest correlation and openness to experience. The highest correlation
coefficient was 0.02 for performance-avoidance and coefficient was 0.56 for openness to experience and
mastery-approach, also for performance-avoidance academic achievement.
Table 3. Summary of stepwise regression analysis
Step Predictive variables
1 Self-efficacy
2 Self- efficacy and conscientiousness
3 Self-efficacy, conscientiousness and mastery-
approach goal
4 Self-efficacy, conscientious, mastery-approach goal
and neuroticism
R R2
0.56 3.13
0.62 0.384
0.65 0.422
0.67 0.448
Change Change
R F
0.313 66.08
0.071 14.87
0.038 9.65
0.26 8.07
Df1 Df2 sig
1 97 0.001
1 96 0.001
1 95 0.002
1 95 0.005
As it is reflected in table 3 in 1st step, self-efficacy
had the greatest role in predicting academic
achievement (r=0.56). In other hands, 31.3% of
academic achievement can be explained by changes in
self-efficacy. In 2nd step, after Self-efficacy,
conscientiousness entered in the equation (r=0.62).
So, these two variables could be explained 38.4% of
variation of academic achievement. In 3rd
step,
besides of conscientiousness and self-efficacy,
mastery-approach goal entered in the regression
equation (r=0.65) which means these three variables
predicted 42.2% of changes in academic
achievement. In 4th
step, Self- efficacy,
conscientiousness, mastery-approach goal and
neuroticism entered in the equation (r=0.67). These
four variables can be predicted 44.8% of changes in
academic achievement.
Table 4. Standard and not standard coefficients and partial and semi partial correlation of variables in the
stepwise model
Model Variable predictive
coefficients regression
Not standardized
correlation
sig
standardized Beta partial semi partial ك
1 self-efficacy 1.75 0.56 0.001 0.56 0.56 0.56
self-efficacy 1.83 0.59 0.001 0.56 0.62 0.62
2 conscientiousness 0.92 0.38 0.001 0.52 0.45 0.42
Iranian Rehabilitation Journal 35
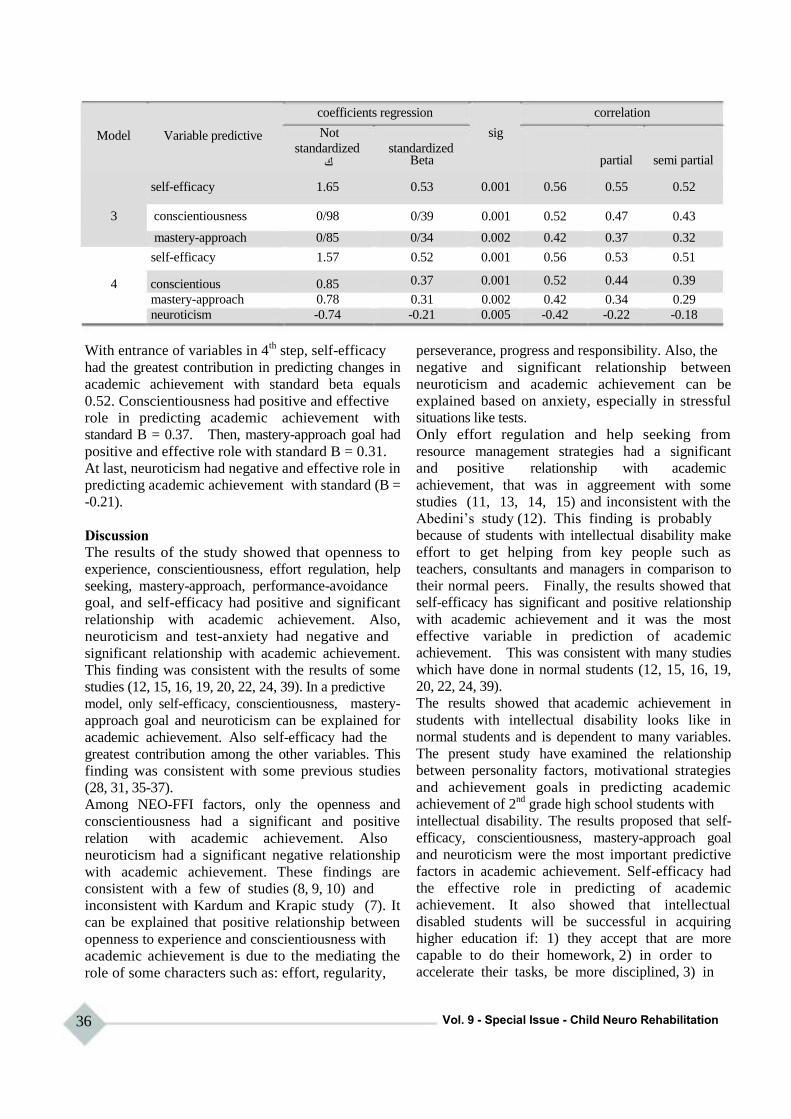
Model Variable predictive
coefficients regression correlation
Not sig
standardized ك
self-efficacy 1.65
3 conscientiousness 0/98
mastery-approach 0/85
self-efficacy 1.57
4 conscientious 0.85
mastery-approach 0.78
neuroticism -0.74
standardized Beta partial semi partial
0.53 0.001 0.56 0.55 0.52
0/39 0.001 0.52 0.47 0.43
0/34 0.002 0.42 0.37 0.32
0.52 0.001 0.56 0.53 0.51
0.37 0.001 0.52 0.44 0.39
0.31 0.002 0.42 0.34 0.29
-0.21 0.005 -0.42 -0.22 -0.18
With entrance of variables in 4th
step, self-efficacy
had the greatest contribution in predicting changes in
academic achievement with standard beta equals
0.52. Conscientiousness had positive and effective
role in predicting academic achievement with
standard B = 0.37. Then, mastery-approach goal had
positive and effective role with standard B = 0.31.
At last, neuroticism had negative and effective role in
predicting academic achievement with standard (B =
-0.21).
Discussion
The results of the study showed that openness to
experience, conscientiousness, effort regulation, help
seeking, mastery-approach, performance-avoidance
goal, and self-efficacy had positive and significant
relationship with academic achievement. Also,
neuroticism and test-anxiety had negative and
significant relationship with academic achievement.
This finding was consistent with the results of some
studies (12, 15, 16, 19, 20, 22, 24, 39). In a predictive
model, only self-efficacy, conscientiousness, mastery-
approach goal and neuroticism can be explained for
academic achievement. Also self-efficacy had the
greatest contribution among the other variables. This
finding was consistent with some previous studies
(28, 31, 35-37).
Among NEO-FFI factors, only the openness and
conscientiousness had a significant and positive
relation with academic achievement. Also
neuroticism had a significant negative relationship
with academic achievement. These findings are
consistent with a few of studies (8, 9, 10) and
inconsistent with Kardum and Krapic study (7). It
can be explained that positive relationship between
openness to experience and conscientiousness with
academic achievement is due to the mediating the
role of some characters such as: effort, regularity,
36
perseverance, progress and responsibility. Also, the
negative and significant relationship between
neuroticism and academic achievement can be
explained based on anxiety, especially in stressful
situations like tests.
Only effort regulation and help seeking from
resource management strategies had a significant
and positive relationship with academic
achievement, that was in aggreement with some
studies (11, 13, 14, 15) and inconsistent with the
Abedini‟s study (12). This finding is probably
because of students with intellectual disability make
effort to get helping from key people such as
teachers, consultants and managers in comparison to
their normal peers. Finally, the results showed that
self-efficacy has significant and positive relationship
with academic achievement and it was the most
effective variable in prediction of academic
achievement. This was consistent with many studies
which have done in normal students (12, 15, 16, 19,
20, 22, 24, 39).
The results showed that academic achievement in
students with intellectual disability looks like in
normal students and is dependent to many variables.
The present study have examined the relationship
between personality factors, motivational strategies
and achievement goals in predicting academic
achievement of 2nd
grade high school students with
intellectual disability. The results proposed that self-
efficacy, conscientiousness, mastery-approach goal
and neuroticism were the most important predictive
factors in academic achievement. Self-efficacy had
the effective role in predicting of academic
achievement. It also showed that intellectual
disabled students will be successful in acquiring
higher education if: 1) they accept that are more
capable to do their homework, 2) in order to
accelerate their tasks, be more disciplined, 3) in
Vol. 9 - Special Issue - Child Neuro Rehabilitation
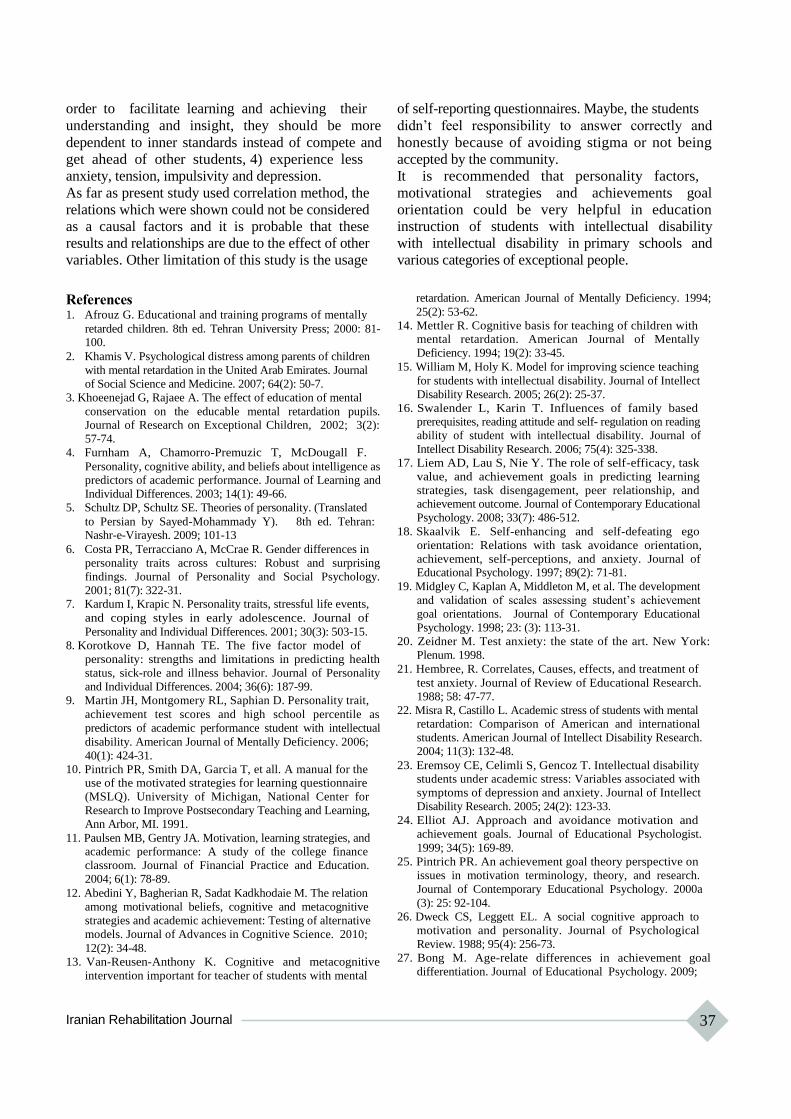
order to facilitate learning and achieving their
understanding and insight, they should be more
dependent to inner standards instead of compete and
get ahead of other students, 4) experience less
anxiety, tension, impulsivity and depression.
As far as present study used correlation method, the
relations which were shown could not be considered
as a causal factors and it is probable that these
results and relationships are due to the effect of other
variables. Other limitation of this study is the usage
References 1. Afrouz G. Educational and training programs of mentally
retarded children. 8th ed. Tehran University Press; 2000: 81- 100.
2. Khamis V. Psychological distress among parents of children
with mental retardation in the United Arab Emirates. Journal
of Social Science and Medicine. 2007; 64(2): 50-7.
3. Khoeenejad G, Rajaee A. The effect of education of mental
conservation on the educable mental retardation pupils. Journal of Research on Exceptional Children, 2002; 3(2):
57-74.
4. Furnham A, Chamorro-Premuzic T, McDougall F.
Personality, cognitive ability, and beliefs about intelligence as predictors of academic performance. Journal of Learning and
Individual Differences. 2003; 14(1): 49-66.
5. Schultz DP, Schultz SE. Theories of personality. (Translated
to Persian by Sayed-Mohammady Y). 8th ed. Tehran: Nashr-e-Virayesh. 2009; 101-13
6. Costa PR, Terracciano A, McCrae R. Gender differences in
personality traits across cultures: Robust and surprising
findings. Journal of Personality and Social Psychology.
2001; 81(7): 322-31. 7. Kardum I, Krapic N. Personality traits, stressful life events,
and coping styles in early adolescence. Journal of
Personality and Individual Differences. 2001; 30(3): 503-15.
8. Korotkove D, Hannah TE. The five factor model of
personality: strengths and limitations in predicting health
status, sick-role and illness behavior. Journal of Personality
and Individual Differences. 2004; 36(6): 187-99.
9. Martin JH, Montgomery RL, Saphian D. Personality trait,
achievement test scores and high school percentile as
predictors of academic performance student with intellectual
disability. American Journal of Mentally Deficiency. 2006;
40(1): 424-31.
10. Pintrich PR, Smith DA, Garcia T, et all. A manual for the use of the motivated strategies for learning questionnaire
(MSLQ). University of Michigan, National Center for
Research to Improve Postsecondary Teaching and Learning,
Ann Arbor, MI. 1991.
11. Paulsen MB, Gentry JA. Motivation, learning strategies, and
academic performance: A study of the college finance
classroom. Journal of Financial Practice and Education.
2004; 6(1): 78-89.
12. Abedini Y, Bagherian R, Sadat Kadkhodaie M. The relation
among motivational beliefs, cognitive and metacognitive
strategies and academic achievement: Testing of alternative
models. Journal of Advances in Cognitive Science. 2010;
12(2): 34-48.
13. Van-Reusen-Anthony K. Cognitive and metacognitive
intervention important for teacher of students with mental
Iranian Rehabilitation Journal
of self-reporting questionnaires. Maybe, the students
didn‟t feel responsibility to answer correctly and
honestly because of avoiding stigma or not being
accepted by the community.
It is recommended that personality factors,
motivational strategies and achievements goal
orientation could be very helpful in education
instruction of students with intellectual disability
with intellectual disability in primary schools and
various categories of exceptional people.
retardation. American Journal of Mentally Deficiency. 1994;
25(2): 53-62.
14. Mettler R. Cognitive basis for teaching of children with mental retardation. American Journal of Mentally
Deficiency. 1994; 19(2): 33-45.
15. William M, Holy K. Model for improving science teaching
for students with intellectual disability. Journal of Intellect
Disability Research. 2005; 26(2): 25-37.
16. Swalender L, Karin T. Influences of family based prerequisites, reading attitude and self- regulation on reading
ability of student with intellectual disability. Journal of
Intellect Disability Research. 2006; 75(4): 325-338.
17. Liem AD, Lau S, Nie Y. The role of self-efficacy, task
value, and achievement goals in predicting learning
strategies, task disengagement, peer relationship, and achievement outcome. Journal of Contemporary Educational
Psychology. 2008; 33(7): 486-512.
18. Skaalvik E. Self-enhancing and self-defeating ego
orientation: Relations with task avoidance orientation,
achievement, self-perceptions, and anxiety. Journal of Educational Psychology. 1997; 89(2): 71-81.
19. Midgley C, Kaplan A, Middleton M, et al. The development
and validation of scales assessing student‟s achievement
goal orientations. Journal of Contemporary Educational
Psychology. 1998; 23: (3): 113-31.
20. Zeidner M. Test anxiety: the state of the art. New York:
Plenum. 1998.
21. Hembree, R. Correlates, Causes, effects, and treatment of
test anxiety. Journal of Review of Educational Research.
1988; 58: 47-77.
22. Misra R, Castillo L. Academic stress of students with mental retardation: Comparison of American and international
students. American Journal of Intellect Disability Research.
2004; 11(3): 132-48.
23. Eremsoy CE, Celimli S, Gencoz T. Intellectual disability students under academic stress: Variables associated with
symptoms of depression and anxiety. Journal of Intellect
Disability Research. 2005; 24(2): 123-33.
24. Elliot AJ. Approach and avoidance motivation and
achievement goals. Journal of Educational Psychologist.
1999; 34(5): 169-89.
25. Pintrich PR. An achievement goal theory perspective on
issues in motivation terminology, theory, and research.
Journal of Contemporary Educational Psychology. 2000a
(3): 25: 92-104.
26. Dweck CS, Leggett EL. A social cognitive approach to
motivation and personality. Journal of Psychological
Review. 1988; 95(4): 256-73.
27. Bong M. Age-relate differences in achievement goal
differentiation. Journal of Educational Psychology. 2009;
37
104(10): 879-896. 28. Dickhauser C, Buch S, Dickhauser O. Achievement after
failure: The role of achievement goals and negative self- related thoughts. Journal of Learning and Instruction. 2011;
21: 152-62. 29. Luo W, Hogam D, Paris SG. Predicting Singapore students‟
achievement goals in their English study: Self-Construal and classroom goal structure. Journal of Learning and Individual
Differences. 2011; 3: 1-10. 30. Elliot AJ, McGregor H. A 2×2 achievement goal
framework. Journal of Personality and Social Psychology. 2001; 80(7): 501-19.
31. Church, MA, Elliot AJ, Gable SL. Perception of classroom environment achievement goals, and achievement outcomes.
Journal of Educational Psychology. 2001; 93(1): 43-54. 32. Bandura A. Social foundations of thought and action: a
social cognitive theory. Englewood cliffs. NJ: Prentice-Hall. 2007.
33. Hardman M, Drew C, Egan W. Human exceptionality.
Society, school, and family. (Translated to Persian by
Alizadeh H, Ganji K, Yousefi-Looyeh M, et al). 7th ed.
38
Tehran. Danjeh Publication; 2007: 282-86 34. Ang RP, Huan V. Academic expectations stress of student with mental retardation. International Journal of Special
Education. 2006; 66(7): 522- 39.
35. Pintrich PR, Conley AMA, Kempler TM. Current issues in
achievement goal theory and research. International Journal
of Educational Research. 2003; 39(5): 319-37.
36. Wolters CA. Advancing achievement goal theory: using goal, structures and goal orientation to predict student
motivation, cognition and achievement. Journal of
Educational Psychology. 2004; 96(3): 236-50.
37. Mouis KR, Edwards O. Examining the stability of
achievement goal orientation. Journal of Cotemporary
Educational Psychology. 2009; 34(3): 265-77.
38. Hanchon TA. The relation between perfectionism and
achievement goals. Journal of Personality and Individual
Differences. 2010; 49(11): 885-890.
39. Elliot AJ, Murayama K. On the measurement of
achievement goals: critique illustration, and application.
Journal of Educational Psychology. 2008; 100(9): 613-628.
Vol. 9 - Special Issue - Child Neuro Rehabilitation

Iranian Rehabilitation Journal, Vol. 9, December 2011
Original Article
Outcomes of Receiving a Master‟s Degree in “Rehabilitation
Management” on Graduates‟ Professional Lives
Nikta Hatamizadeh, MD, MPH Pediatric Neurorehabilitation Research Center, Department of Rehabilitation Management, University of
Social Welfare and Rehabilitation Sciences, Tehran, Iran
Seyed Majid Mirkhani, PhD candidate, Ahmad Fotoohi, MSc University of Social Welfare and Rehabilitation Sciences, Tehran, Iran
Asghar Makarem, MD Department of Rehabilitation management, University of Social Welfare and Rehabilitation Sciences,
Tehran, Iran
Azar Petrami, BA University of Social Welfare and Rehabilitation Sciences, Tehran, Iran
Roshanak Vameghi*MD, MPH Pediatric Neurorehabilitation Research Center, University of Social Welfare and Rehabilitation Sciences,
Tehran, Iran
Objectives: The aim of this study was to determine the outcomes of receiving a master‟s degree in “Rehabilitation Management” in Iran on the professional lives of graduates, as reported by them.
Method: A questionnaire consisting of open and close-ended questions was e-mailed to 75 graduates and alumni
of the course, graduated since the beginning of implementation of the course in Iran, from 1997 to 2003. The total
response rate was 52/75.
Results: Results overall indicated that 67% of graduates believed attending the Rehabilitation
Management post-graduate course was worth the costs and 87% mentioned it as „very effective‟ or „relatively effective‟ on their present quality of job performance.
Conclusion: Findings could serve as a baseline for periodic evaluations and revisions of the Rehabilitation Management curriculum in the future and also for comparisons with other management courses.
Key words: Rehabilitation management, Course outcome evaluation, Graduate, Alumni
Introduction
Rehabilitation management is a relatively new field of higher education in Iran. Although still a small field compared with others, it is expected to grow in the near future. Through the years 1997 to 2003, only the University of Social Welfare and Rehabilitation Sciences offered this Master of Science course. Since 2004 "Iran University of Medical Sciences (IUMS)” and from 2007 “Ahvaz University of Medical Sciences” began to offer this course too. This academic program emphasizes on training experts in management of rehabilitation services. Although few in number, this educational course is important in that it reflects the desire to establish rehabilitation management as a separate field due to the fact that it requires knowledge, skills, attitudes and values distinct, at least in part, from those needed in other fields of management.
* All correspondences to: E-mail: [email protected]
Iranian Rehabilitation Journal
As a generally accepted definition, outcomes are the
end results of a program for the people the program
is intended to serve (1). Finding the outcomes of a
graduate professional program from the point of
view of the graduates involves measuring the
perceived effects that the program has had on them,
including how the program may have affected their
careers (1).
In all graduate and post-graduate professional
programs it is important to know what outcomes
were achieved by the students who graduated from
that program (1). This is even more important about a
program that has been recently launched and has not
as yet proven to be reaching its goals. In fact, a
changing environment requires any educational
institution to make assessments and define new ways of
better fulfilling its mission. (2)
39
One of the most familiar ways of doing this is the
taxonomy in which outcomes are categorized as
either cognitive or affective. Cognitive measures
have to do with behavior that requires the use of
high order mental processes such as reasoning and
logic; affective measures deal with behavior that
relates to the student‟s attitudes, feelings, and
personality. Thus affective outcomes include the
development of self-concept, values, and beliefs.
While cognitive outcomes may be effectively
measured during the students‟ academic careers, the
perceptions of alumni are a necessary component of
the assessment of affective outcomes.
Although the importance of assessing the impact of
academic programs has been well established (3, 4,
5, 6, 7, 8, 9), there has been little research on the
impact of university-based, graduate or post-
graduate level programs on their alumni in the
world, and especially in Iran. Unfortunately, those
outcome assessments that have actually been carried
out reveal relatively little about lasting impacts of
the program and must be supplemented with other
data (10). Assessment must focus on tasks where students can
show application of their skills and knowledge in a
business-world context (11). There are examples of
study projects around the world demonstrating that
students were not prepared adequately for
integrating their academic knowledge and skills with
their job responsibilities (12, 13). Student surveys
conducted in academic outcomes assessment most
commonly target three groups of students:
continuing students, graduating students, and alumni
(10).
A rather frequent confusion exists between two
different purposes of academic outcome assessment:
those assessment efforts aimed at assessing
individual student‟s results for the sake of student
feedback and development, versus assessment aimed
at evaluation of the programs or courses themselves
(3). The latter, which is a more contemporary
approach, usually measures student achievement of
designated program learning outcomes as a result of
their exposure to the program (3). In other words, it
demonstrates the extent to which a university course
or program does what it says it intends to do, thus
reflecting accountability of the educational program to
students, faculty professionals, employers who hire
a university‟s graduates (14), and also to
educational policy makers.
The purpose of the present study was to assess the professional outcomes such as the required
40
knowledge, skills and business perspectives, as
perceived by the students, of receiving a master‟s
degree in Rehabilitation Management in Iran, during
the period 2003 to 2007.
Materials & Methods
For this study completed in 2007, graduating students
and alumni of “Rehabilitation Management”
master‟s degree course from the University of Social
Welfare and Rehabilitation Sciences (USWRS) and
Iran University of Medical Sciences (IUMS) were
surveyed. Both universities are public institutions
located in Tehran city and are the first to offer
master‟s degree courses in rehabilitation
management in Iran. They were the only universities
offering the degree at the time the research was
conducted. Both universities used full-time faculty,
and their curricula were nationally recruited.
First, the total list of Rehabilitation Management
graduating students and alumni of both universities
was acquired. This resulted in a list 75 graduating
students and alumni: 63 from USWRS, and 12 from
IUMS. Of the total 75 people, 6 were inaccessible
because of changes in address and phone number. A
survey questionnaire and cover letter were sent by e-
mail after explaining the study to each participant by
telephone. For those who did not respond at the
expected time, a second e-mail (and then a third one
if necessary) was sent one and tw0 months after the
first. Finally, a total of 52 responses were received,
resulting in an overall response rate of 69.3%.
The questionnaire which was designed by the
researcher asked about graduates‟ perceptions
regarding the extent to which their rehabilitation
master‟s degree had resulted in different outcomes.
The questionnaire consisted of 27 questions
categorized into three parts: 1- demographic
questions, present and previous job titles; 2- open-
ended questions inquiring about the graduates‟
expectations for studying “rehabilitation management”
and about their perceptions of the outcomes of
completing the course, and 3- likert-type questions
on the effects of the course on their competency in
their jobs. At the end of the questionnaire they were
asked if they thought attending the course was
worthwhile overall.
In order to verify the validity for the instrument, a
total number of four experts who were the founders
and pioneers in the field of rehabilitation management
education were asked to review the questionnaire.
The purpose of the review was to ascertain that the
content of the questionnaire appeared to cover the
Vol. 9 - Special Issue - Child Neuro Rehabilitation
major outcomes expected for graduates of the
rehabilitation management master‟s degree course
and whether there was any other important issue
missing in the content. The experts were in general
agreement that the outcomes being measured were
appropriate for graduates of rehabilitation
management master‟s degree program. A few
changes were made based on their suggestions.
Internal consistency for part 3 of the questionnaire
was determined using Cronbach‟s coefficient alpha,
which was determined to be 0.79.
Results
Description of respondents A total number of 52 graduates completed and sent
back the questionnaire. The age range of the
respondents was 25-46 (34.5±6.4) at the time of the
survey. The male/female ratio was 31/21.
Job situation before and after education As it can be seen in Table 1 the graduates were classified
into 4 groups, according to their job situation; 1- Manager
(Top manager, Middle manager, Manager-consultant,
vice-manager), 2- Staff in a related organization (Welfare
Organization, Red Crescent Organization, Veterans'
Organization), 3- Therapist and 4- unemployed.
Table 1: Job situation of graduates before and after attending master‟s course of rehabilitation management
Job situation
Manager
Staff in a related organization
Therapist
Unemployed
Total
Time
Public
*Non public
Total manager
Public
Non public
Total staff
Public
Non public
**Community service
Total Therapist
Before attending the After attending the
course (%) course (%)
Number % Number %
7 15
2 2
9 17% 17 33%
12 18
- -
12 23% 18 35%
22 9
3 7
4 -
29 56% 16 31%
2 1
52 52 *Non public: Means private or NGO.
**Community service: The Iranian Law mandates all people who graduate from public universities, in which education is free of
charge, to work for a certain period of time in places in the country determined by the government where their services are
needed, with a predetermined amount of salary.
It can be seen that 50 of 52 respondents were
employed before attending the course and after
graduation this rose to 51. The total number of
alumni who had a managerial position rose from 9 to
17 and of those who had a staff position in related
departments increased from 12 to 18. With a more
precise look we can see that the increase in number
of people in managerial and staff positions is totally
limited to public centers. On the other hand, in the
non-public sector we can see a rise in the total
number of people who have occupied a therapist
position. It must be noted that of those 6 people who
were either in community service or unemployed
before attending the course; 4 were employed in a
therapist position in a non public center, 1 remained
Iranian Rehabilitation Journal
unemployed and 1 was employed in a managerial
position in a public center. Only 2 graduates had a
managerial position in the non public sector. These
were the same people who were employed in those
positions before starting the course.
Expected and Perceived Achievement of Skills (answers to the open-ended questions) Figure 1 shows students‟ expected and perceived
achievement of skills from completing the course.
As it can be seen, two of the most stated skills which
the graduates had expected to achieve were “skills
for management of rehabilitation centers" and
"planning skills" (mentioned by 43 and 15 of 52
respondents, respectively). Results showed that 12
41

of 43 (28%) graduates who had expected to achieve
rehabilitation management skills believed that they
had achieved the skill, and 3 of 15 (20%) who had
expected to achieve planning skills stated that they
had achieved the skill.
The highest ratio in terms of expected skills to
achieved skills belonged to "the ability of planning
and conducting research projects” which was about
57% (4 out of 7). In this regard the graduates‟
opinions about the course effectiveness in improving
their research skills and its utilization at their work
place were also asked irrespective of their
expectations, using a close-ended likert-type
question. The results showed that overall 43 out of
52 graduates (83%) evaluated their research skills
achievement as acceptable or desirable.
It must be stated that only skills which were
mentioned by at least 2 graduates as their expected
skill outcome have been demonstrated in figure 1.
Other skill expectations, each of which had been
mentioned by only one respondent, and none of
which were stated as achieved, were: strategic
planning skills, crisis management skills,
rehabilitation services, policy making skills,
evaluation skills, consultation skills and finally
official correspondence skills.
Figure 1:Skills improvement Expectations and
Achievements as preceieved by graduates of
Ms degree in rehabilitation management
50
45
40
35
30
25
20
15
10
5
0
42
31
12 12 3
3 4 4 3 3 1
Stated skills
not achieved
3 2
Vol. 9 - Special Issue - Child Neuro Rehabilitation
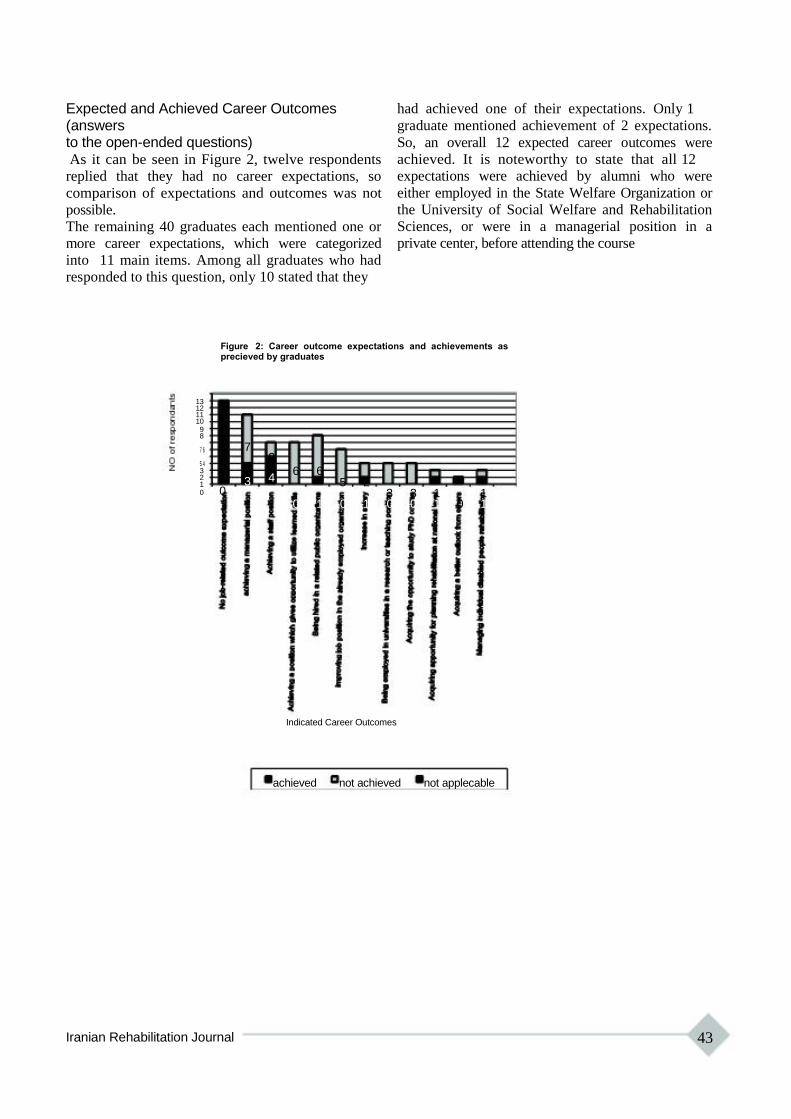
Expected and Achieved Career Outcomes (answers to the open-ended questions) As it can be seen in Figure 2, twelve respondents
replied that they had no career expectations, so
comparison of expectations and outcomes was not
possible.
The remaining 40 graduates each mentioned one or
more career expectations, which were categorized
into 11 main items. Among all graduates who had
responded to this question, only 10 stated that they
had achieved one of their expectations. Only 1
graduate mentioned achievement of 2 expectations.
So, an overall 12 expected career outcomes were
achieved. It is noteworthy to state that all 12
expectations were achieved by alumni who were
either employed in the State Welfare Organization or
the University of Social Welfare and Rehabilitation
Sciences, or were in a managerial position in a
private center, before attending the course
Figure 2: Career outcome expectations and achievements as precieved by graduates
13 12 11 10 9 8
7 6
5 4 3 2 1 0 0
7
3
2
4
6 6 5 2
3 3 1 1 0 1 0 1 0 0 1 0 1
Indicated Career Outcomes
achieved not achieved not applecable
Iranian Rehabilitation Journal 43
Perceived effects of the course on the graduates‟ professional lives (answers to an open-ended question) The graduates‟ opinions were asked about the effects
of the course on their professional lives. As can be
seen in table 3, 33 graduates (63.45%) perceived
positive effects of the course on their professional
lives including such effects as improvement of job
performance, improvement of job position,
broadening of job-related perspectives and outlooks,
and receiving different job offers. On the other hand,
17 graduates (33%) believed that the course did not
affect their professional lives.
Finally, 2 graduates (11%) replied that attending the
course had some negative effects on their
professional lives, pointing to such issues as: a sense of
being rejected at the work place, slogging for
nothing, and lag from life.
Table 3: Perceived outcomes of Rehabilitation Management course on the professional lives of graduates
Overall Effect perceived effect (Number of respondents who mentioned to it)
Positive effect
33 (63.45%) Broadening of job-related perspectives and outlook (5)
Improved insight about disabled people; achievement of a holistic view towards disabled patients; improvement of communication and provision of services for the disabled and their families (4) Improvement in quality of work (9)
Improvement in ability to analyze different situations at the work place; acquiring a better understanding of the work place; acquiring a better understanding of rehabilitation in the country (2)
Increased dignity and prestige at the work place (4)
Positive impact on career progress and job positions (6)
Being hired by the government more easily (1)
Increased Salary (1) Positive effect in general (5)
a sense of being rejected at the work place,
Negative effects slogging for nothing,
2(4%) lag from life (2)
No effects
17 (33%)
Total number of *
respondents
52 (100%) * Some graduates mentioned more than one effect.
Perceived compatibility of course „skill outcomes‟ with the actual requirements of current job (answers to the close-ended questions)
In answering the close-ended question: “how
compatible is your acquired skills with your current
job?”, as is demonstrated in Table 4, 11 graduates
44
among the 17 who held managerial positions after
graduation (65%), 7 graduates among the 18 who
held staff positions (39%), and only 3 out of 16 who
held therapist positions (19%) considered high or
very high compatibility with their current job
requirements.
Vol. 9 - Special Issue - Child Neuro Rehabilitation

Table 4: Perceived compatibility of course „skill outcomes‟ with job requirements after graduation
Job position
Compatibility of
acquired skills with
current job requirements
Very high
high
Moderate
low
Very low
Not applicable
Total
Manager Staff Therapist
No % No % No %
4 41 2 11 - -
5 24 5 28 3 19
- 29 9 50 6 38
1 - 2 11 3 19
- 6 - - 4 25
17 - - - - -
7 100 18 100 16 100
Unempl Total
oyed
No No %
- 9 17
- 12 23
- 20 38
- 5 10
- 5 10
1 1 10
1 52 100
Changes in job positions following graduation from Rehabilitation Management course After inquiring about their job positions before and
after attending the course, the graduates were
classified into six groups considering the size and
direction of change in their job positions. As
demonstrated in table 5, 32 (61%) graduates had no
changes in job positions, 18 (35%) graduates had at
least a single-level improvement and 2 (4%) had a
decline in their job positions after attending the
course.
Table 5: Changes occurring in graduates‟ job positions at work, after attending the Rehabilitation
Management course
Size and direction of change
One level decline in job position
No change in job position
A Single level promotion in job position
Two-level promotion in job
position
Three-level promotion in job
situation
Type of change Number (%) of
graduates
1-decline from therapist position to an 2 (4%)
unemployed position, or
2- decline from a managerial position to a staff
position
32 (61%)
1-advancement from an unemployed position to 12 (23%)
therapist position, or
2- improvement from a therapist position to a
staff position, or
3- improvement from a staff position to a
managerial position
Therapist position to managerial position 5 (10%)
Unemployed position to a managerial position 1 (2%)
Perceived efficiency of attending the Rehabilitation Management course (answers to close-ended question) The graduates were asked whether what they
acquired by attending the Rehabilitation
Management course was worth the costs (such as
costs in time, energy, stress, financial and other
types of-expenses), The results are shown in Table
6. Among 52 graduates, 35 (67%) stated that the
Iranian Rehabilitation Journal
cost-benefit ratio was good or satisfactory.
Meanwhile, 12 graduates believed that the benefits
were not worth the costs, noting that ten of these
graduates either did not experience any changes or
had declines in their job positions after graduation.
It should be stated that 5 (28%) of those whose job
positions had improved after graduation mentioned
that the course was not worth the costs, while 23
(68%) of those who had no improvement in their job
45

positions answered that the course was worth its
costs.
Table 6: Perceived efficiency of the Rehabilitation Management course, in terms
of graduates‟ current job positions
Current job
position
Efficiency
Optimal
Good
Poor
Total
Manager Staff
No % No %
3 33 - -
3 33 9 75
3 33 3 25
9 100 12 100
Unem Total
Therapist ploye
d
No % % No %
7 24 - 10 19
12 41 1 25 48
10 35 1 17 33
29 100 2 52 100
Graduates‟ perceptions about the effect of attending the Rehabilitation Management course on their present quality of job performance (answers to close-ended questions)
Table 7 demonstrates the graduates‟ perception
about the effect of attending the Rehabilitation
Management course on their present quality of job
performance. As can be seen, 45 of the 52 graduates
(87%) have considered it as „very effective‟ or
„relatively effective‟. For those who currently held
managerial positions the figure is as high as 95%,
and for those who didn‟t, it is 69% (all of whom
have considered it as „relatively effective‟).
Table 7: Graduates‟ perceptions about the effect of attending the course on their present quality of job performance, in terms of their current job positions
Current job
position
course
effects on
job performance
Very effective
Relatively effective
Non-effective
Manager Staff
No % No
7 41 1
9 54 16
1 6 1
Une
Therapist mplo Total
yed
% No % No No %
6 - - - 8 15
88 11 69 1 37 71
6 5 31 - 7 13
Total 17 100 18 100 16 100 1 52 100
Discussion
All improvements of study programs, teaching and
support services in educational institutions are based
on the voice of the customer, which in this case are
the students. So measuring the students‟ perception
of the “product” or “service” they receive and their
satisfaction is the cornerstone of every educational
promotion plan (15).
This article aimed at providing an image of
professional life consequences of graduating from
rehabilitation management master‟s degree course in
Iran, as experienced by the alumni of the first eight
courses ever conducted in the country. Being aware
46
of the perspectives of graduating from a course and
of what would be accomplished after graduation is
of great value for those who have to make decisions
about their path for post graduate education. It can
also provide educational policy makers and
managers with good clues for curriculum revision.
Alumni-based outcome assessment is important for
at least three reasons:1- it provides the opportunity
for “detached objectivity”; that is, their measurement
of outcomes is often more reflective, given their
distance from the college setting, both
geographically and temporally; 2- As Robert Pace
and Peter Ewel assert, there is a positive correlation
Vol. 9 - Special Issue - Child Neuro Rehabilitation

between a graduate‟s perception and actual levels of
achievement (16, 17); and 3- alumni-based research
provides an appropriate context within which to
measure long-term objectives, in contrast to
assessments based on current student perceptions,
since alumni have had some reasonable time to live
with the results of their education and reflect upon it.
Especially when „affective outcomes‟ are to be
measured, the matured and detached perspective of
alumni is preferred over the perspective of current
students (16).
One important result of the present study was that
63.45% of graduates perceived positive effects of
the course on their professional lives. Also, overall
67% of graduates believed that the efficiency of
attending the rehabilitation management post-
graduate course was optimal or good, or in other
words it was worth the costs and 87% have
considered it as „very effective‟ or „relatively
effective‟ on their present quality of job
performance. However, this did not mean that they
were satisfied with all course outcomes. For
example, 70% and 72% of graduates declared they
had not reached their career expectations and
expected managerial skills, respectively. It seems
that in each professional education program a
tension is inherent between teaching practical skills
and providing theoretical background (1). Eskilden
et al, have shown that unsatisfied expectations do
not make students lower their expectations. Instead,
it results in a lower evaluation of image as well as
low evaluations for the quality of human and non-
human elements in an educational institution. This is
important since image is the variable with the single
largest impact on student loyalty (15). Therefore,
considering the importance of fulfillment of student
expectations, this result may infer a need for
curriculum revision in the post-graduate
rehabilitation management course in Iran. In case of
such a reform, the results of the present study can be
utilized as basic information and used as a scale for
comparing to future studies.
The results also demonstrated a high employment
rate in graduates, but as most of the have already
employed, the high percentage of graduates‟
References 1. Fletcher KM. The Impact of Receiving a Master‟s Degree
in Nonprofit Management on Graduates‟ Professional Lives. Nonprofit and Voluntary Sector Quarterly 2005; 34: 433.
Iranian Rehabilitation Journal
employments might not be attributed to getting the
degree. However, a significantly higher proportion
of graduates have been employed in higher
managerial positions after graduating the course. So,
acquiring higher professional managerial positions
after graduation was the result that could be
generalized only to future graduates who have
already been employed in the rehabilitation sector.
It seems that having had previous experience in the
professional workplace may play a rather important
role in acquiring managerial positions in that field,
after graduation.
Our results are concordant with the results of a study
performed by Fletcher, in which some respondents
found that their past experience was more important
to prospective employers than their degree. Others
said the degree was no help in getting a job without
relevant experience. According to Fletcher KM, if
some alumni find that their degree is not an asset in
seeking employment, then more work needs to be
done to publicize these degrees and the skills they
impart to graduates, thus making this type of degree
more attractive to employers and the nonprofit
community in general. Thus as Fletcher suggests,
universities should consider having practice or
internship opportunities for students who have little
or no professional or career background so that they
can gain experience while enrolled in the program
(1).
We should also emphasize that since passing the
course seems to have been more effective and
efficient for those who had already held job
positions in rehabilitation or other relevant
organizations or institutions; it is rational to
recommend this course especially for those people
interested in management who are already working in
the rehabilitation sector.
Conclusion
Results of this study could be helpful by future
studies for periodic evaluations and revisions of the
Rehabilitation Management curriculum in Iran and
also as an instrument to compare the perceived
outcomes for graduates of other specialized degree
programs that offer courses in management.
2. McClain CJ. Planning: Using Student Outcome Measures to Plan for the Future. Descriptive Report 141, 1987; Northeast Missouri State University, Kirksville.
3. Roberson MT, Carnes LW, Vice JP. Defining and Measuring Student Competencies: A Content Validation
47
Approach for Business Program Outcome Assessment. The Delta Pi Epsilon Journal 2002; 44(1): 13-24.
4. Association of American Colleges. Integrity in the college curriculum: A report to the academic community. Project on Redefining the Meaning and Purpose of Baccalaureate Degrees 1990; Washington, D.C.: Author.
5. Braathen S, Robles M. The importance of assessment in business education. In: J. Rucker (Ed.), Assessment in business education national business education yearbook 2000; 38: 11-24. Reston, VA: National Business Education Association.
6. Hatfield SR, Gorman KL. Assessment in education-the past, present, and future. In: J Rucker (Ed.), Assessment in business education national business education yearbook 2000; 38: 1-10. Reston, VA: National Business Education Association.
7. Mundrake GA. The evolution of assessment, testing, and evaluation. In: J Rucker (Ed.), Assessment in business education national business education yearbook 2000; 38: 39-47. Reston, VA: National Business Education Association.
8. National Institute of Education (U.S.) Study Group on the Conditions of Excellence in American Higher Education. Involvement in learning: Realizing the potential of American higher education 1984; Washington, D.C.: Department of Education.
9. Nichols JO. A practitioner‟s handbook for institutional effectiveness and student outcomes assessment implementation 1991; New York: Agathon Press.
10. Palomba CA, Banta TW. Assessment essentials: Planning,
48
implementing, and improving assessment in higher education 1999; San Francisco: Jossey-Bass, Inc.
11. Chandler JW. The why, what, and who of assessment: The college prospective. Assessing the outcomes of higher education. Proceedings of the 1986 ETS Invitational
Conference 1986; pp.11-18. Princeton, NJ: Educational Testing Services.
12. National Business Education Association. National standards for business education: What America‟s students should know and be able to do in business 1995; Reston, VA: Author. 13. Secretary‟s commission on Achieving Necessary Skills. A SCANS Report for America 2000, 1991; The workforce skills website. Washington, D.C.: U.S. Department of Labor. 14. Henninger E. Outcomes assessment: The role of business school and program accrediting agencies. Journal of Education for Business 1994; 69: 296-298. 15. Eskildsen JK, Martensen A, Gronholdt L, Kristensen K. Benchmarking Student Satisfaction in Higher Education Based on the ECSI Methodology 2000; The Aarhus School of Business. 16. Pace R. Measuring Quality of Effort: A New Dimension for Understanding Student Learning and Development. Laboratory for Research on Higher Education, University of California 1979. 17. Ewell P. Information on Student Outcomes: How to Get It and How to Use It. National Center for Higher Education Management Systems 1983.
Vol. 9 - Special Issue - Child Neuro Rehabilitation

Iranian Rehabilitation Journal, Vol. 9, December 2011
Original Article
Persian Cued Speech: The Effect on the Perception of Persian
Language Phonemes and Monosyllabic Words with and without
Sound in Hearing Impaired Children
Guita Movallali*, PhD Pediatric Neurorehabilitation Research Center,
University of Social Welfare and Rehabilitation Sciences, Tehran, Iran
Objectives: This paper studies the effect of Persian Cued Speech on the perception of Persian language
phonemes and monosyllabic words with and without sound in hearing impaired children. Cued Speech is a
sound based mode of communication for hearing impaired people that is comprised of a limited series of hand
complements and the normal pattern of speech. And it is shown that it effectively can improve speech skills of
hearing impaired children and adults. Cued Speech has recently been adapted to Persian language (1) and our
knowledge about its efficiency is very limited.
Methods: Two groups of profoundly hearing impaired children participated in the study. They were
matched with each other. The experimental group received an intensive Persian Cued Speech training
program for several months. Prior to and following training and also three weeks after the sample‟s
perception of Persian language phonemes and monosyllabic words were evaluated. Mixed Repeated
Measurement was used to analyze the results.
Results: Findings indicated that experimental group‟s scores in both phonemes and monosyllabic words with
and without sound were significantly difference between pre-test and post-test and follow up as a function of
Cued Speech training (p<0.0001).
Conclusions: The results support the use of Persian Cued Speech for improving perception of Persian hearing impaired children to promote their communication performance.
Key words: Hearing impaired, Cued Speech, Monosyllabic words, Phonemes, Perception.
Introduction
Traditionally speech perception has been associated
almost exclusively with audition. Mc Gurk and Mac
Donald (1976) showed that this assumption was
wrong, as sight does contribute to speech perception.
Their findings have important implications for
hearing impaired people, because visual speech
constitutes the main speech modality (2). Hearing
impaired children who have been orally educated
typically rely heavily on lip-reading. On the other
hand lip-reading has many limitations because
without hearing the sounds, many syllables remain
ambiguous due to their similar articulatory
movements. For example labial consonants in /ma/,
/pa/ and /ba/ or the lip rounding of vowels in /tu/ and
/to/ cannot be differentiated. Only 40 to 60% of the
vowels are recognized by the lip-reading system for
a given language (American English). Thus
understanding spoken language is difficult for many
hearing impaired individuals (3, 4).
* All correspondences to: Email: [email protected]
Iranian Rehabilitation Journal
To overcome these deficiencies, several systems
have been created aimed at disambiguating lip-
reading by adding visual information carried out by
the hands. The most current of them is Cued Speech.
Cued Speech is a simple sound-based system of
manual cues, cued in conjunction with spoken words
which makes all the sounds of spoken language,
fully comprehensible for hearing impaired people.
When Dr. Cornett (1967) first invented Cued
Speech, he set out to create a system, based on English phonemes (5, 6). Ever since then many
people have worked to adapt Cued Speech (CS) to
approximately 60 other languages and dialects
which illustrates how useful Cued Speech is. Persian
Cued Speech (1) is an example of Cued Speech
being recently adapted to a language. Persian Cued
Speech is not well known and Persian speaking
communities are required to increase awareness of
it, as well. Persian Cued Speech consists of nine
hand shapes in three hand placements. Placements of
49
the hand code vowels whereas hand shapes (or
configurations) distinguish among the consonants.
Fig .1 shows the adaptation of Cued Speech for
Persian language.
A large amount of work has been devoted to the
effectiveness of Cued Speech. Cued Speech allows
access to complete phonological representations of
speech (5) and language (7 & 8) and improves
reading and writing performances in hearing
impaired children, exactly like hearing children.
Cued Speech has significant effect on perception of
phonemes both with and without sound, so it
improves lip-reading as well (10). Nichols and Ling
(1982) presented 18 profoundly hearing impaired
children, with English syllables in seven conditions
with auditory, lip-reading and cues presentations
combined together. Under audition (A) alone,
subjects correctly identify 2.3% syllables whereas
scores in lip-reading (L), audition + lip-reading
(AL), cues alone (C) and audition + cues (AC)
reached 30-39% without significant differences. The
scores with lip-reading + cues (LC) and audition +
lip-reading + cues (ALC) reached 83.5% and 80.4%,
respectively Mean scores for keywords were more
than 90% in LC and ALC conditions (11). Kaplan
(1974) studied the effect of Cued Speech on speech-
reading performance of the prelingually hearing
impaired individuals. The results showed that the
presence of manual cues improved speech-reading
scores for all types of materials (12). Chilson (1979)
also showed that learning of Cued Speech
significantly improved the speech reading skills of
normal-hearing college students enrolled in
phonetics courses (13). Uchanski et al., (1994)
confirmed the effectiveness of Cued Speech for the
identification of sentences with high or low predict
performance. Subjects obtained mean scores varying
from 78%to 97% with Cued Speech against 21% to
62% with lip-reading alone. French researchers
showed that the subjects exposed early and
intensively to Cued Speech were better lip-readers
for the identification of words and pseudo words
(14).
Cornett (1985), Kipila (1985), Hage, Alegria and
Perier (1989) reported the effectiveness of Cued
Speech on word perception. Several other studies
indicate the efficiency of Cued Speech in several
languages (15, 16, 17), but there is no evidence that
shows Persian Cued Speech can have the same
effect, because Persian phonetic differs from those
languages; So the purpose of this study was to
examine the effect of Persian Cued Speech on
50
perception of Persian phonemes and monosyllabic
words with and without sound (CS + lipreading vs
CS + Audition + lipreading) in hearing impaired
Iranian children. The goals were to examine whether
Persian Cued Speech improves auditory perception
and lip-reading of the nonsense syllables and mono-
syllabic words or not and whether this effect sustains
after the training.
Materials and Methods
Participants: Sixteen profoundly prelingually hearing
impaired children (eight boys and eight girls), ages
9-12 years old were recruited in this study.
Audiograms showed a pure tone average hearing
loss of 90 dB or more for the better ear, according to
the most recent available medical records. All
participants studied in special schools for the hearing
impaired in Tehran city. All were native speakers of
Persian (Farsi) language and preferred an oral
communication mode and had no other disabilities.
The participants were matched with each other in
IQ, age and sex so that we had two matched pair
groups. Each group consists of eight children (four
girls and four boys).
Instruments: Two tests were elaborated to achieve
the goals of the study. The purpose of the materials
selected was to ensure that the participants'
responses were exclusively due to perception that is
they were not deduced from the context. For this
reason two tests were administered: Speech
Discrimination Score Test (SDS) and Sara test
(No.2). Both of the tests were administered
individually for each participant.
SDS is one of the current routine tests in clinical
audiology. We used one of SDS lists which consist
of 25 monosyllabic words (the Persian version, 18).
In order to examine the lip-reading performance of
the participants, for monosyllabic words, the test
was administered without sound. A female examiner
read each word from the list without sound and
without any exaggeration in lip patterns for each
child. The child should then write whatever he/she
understood on an experimental test page. The
scoring was phonemic-the percent of correct
phonemes not the whole word.
Sara test (19) is a lip-reading test which uses all the
phonemes of Persian language in a simple A-
phoneme-A context, so that the lip-reading
performance of nonsense syllables can be examined.
Errors are not simply counted rather the errors types
are important. In fact groups of phonemes will be
examined not just as a single consonant. For
Vol. 9 - Special Issue - Child Neuro Rehabilitation
example if a child mistakes /apa/ with /aba/ or /ama/,
he/she will obtain 50% of the score. Because /p/, /b/
and /m/ are all bilabial and cannot be distinguished
with lip-reading alone. The correct answer will
obtain 100% of the score and 0% means the entirely
incorrect answer.
Procedure: In this study we used a true experimental
design, in which we had pre-test, post-test and
follow-up with control group. Both of the
experimental and control groups were tested three
times, once before and twice after training. The
groups were matched, so they were assumed equal.
The dependent variables were examined in the same
time and the same condition for both groups. Our
study was administered in several stages.
Pre-test stage:
All of the participants, the experimental and the
control group underwent the examination through
both tests.
Cued Speech Training: Training sessions for
Persian Cued Speech were held for the experimental
group. The experimental group was trained in a five-
month training course, in individual sessions. The
training course last five months and each of the
children were taught 1-2 hours per day. In first
sessions we reviewed the Persian phonemes to
assure that the children know enough about the
sounds that make up words. Because Cued Speech is
a phonemic system, Cueing is relatively easy to
learn; it requires about twenty hours to memorize the
system at which point anything that can be spoken
can be cued, albeit slowly. It is best to learn from an
instructor in a face-to-face setting. Classes were
offered in a room in the children's schools. It is
much easier to follow a demonstration than read a
wordy explanation, so we designed colorful cards
each of them for a given hand shape. Learning to cue
is like learning to take shorthand or to type. After the
basic system is learned, regular practice is required
to develop speed and fluency. One must, over time,
develop the performance to automatically translate
his/her internal representations for words as sounds
into manual patterns. Surprisingly, the hardest part is
identifying the sounds one actually produces when
he speaks. Because we're more accustomed to
dividing words into letters for spelling than into
phonemes and this often leads us astray. Afterwards
each hand shape was taught in several sessions so
they became familiar with all of the hand shapes. In
Persian language there are thirty two consonants,
however only nine hand shapes are necessary to
make each consonant visually distinct. We started
Iranian Rehabilitation Journal
with hand shape No.9 which represents for /gh/
which is a phoneme sound like /r/ in French
language. We used it with vowels /a/ and /i/ which
are produced in side placement-beside the face.
Then hand shapes No.5, No 3, No.2.....were taught.
Then the hand placements (vowels) were practiced.
In the last month, two syllabic words and then multi-
syllabic words and sentences were introduced to the
children.
Figure 1: Persian Cued Speech (Movallali, 2009)
Post-test Stage: Immediately after the completion
of Cued Speech training, all of the participants, both
experimental and control group were examined with
SDS and Sara tests, in Cued Speech plus lip-reading
condition.
Follow-up: One month later, both tests were
repeated with and without sound for all of the
children, with Cued Speech.
For statistical analysis, descriptive statistics were
examined at first. Then to answer the study
questions, we used mixed repeated measurements so
that the effect of Cued Speech on phoneme and
monosyllabic word perception of experimental and
control group in pre-test, post-test and follow-up can
be studied.
51

Results
In this study, we examined the effect of Persian
Cued Speech on phoneme and monosyllabic words
in Iranian profoundly hearing impaired children. The
results are presented in two parts. In the first, we
examined the results of the effect of Persian Cued
Speech on the perception of Persian language
phonemes (nonsense syllables) with and without
sound. And secondly, we presented the effect of
Persian Cued Speech on the perception of
monosyllabic words.
A: Persian language phonemes (nonsense syllables), Sara Test
The results of within-subjects effects of Cued
Speech on perception of phonemes showed that the
amount of the obtained F (516.90) in perception of
phonemes without sound and F (748.01) in
perception of phonemes with sound in two groups
(experimental and control group) was significant (α
=0.01). It is obvious that there was significant
difference in perception of phonemes both with and
without sound in pre-test, post-test and follow-up
stages between experimental and control group.
The between subject effects of Cued Speech on
perception of phonemes results were F (3427.02)
with sound and F (34830.18 ) without sound in two
groups (experimental and control group). Therefore
we can indicate that there is a significant difference
(α =0.01) between perception of phonemes with and
without sound in experimental and control groups.
Therefore mean scores of the perception of
phonemes with and without sound are higher than
control group in post-test and follow-up. That is
Cued Speech had improved the perception of
phonemes with and without sound in experimental
group. The effect size was 0.99 for phoneme
perception with sound and 0.97 without sound that
shows how great the effect of Cued Speech on
phoneme perception is.
52
B. Perception of Monosyllabic Words (SDS Test)
The results of within-subjects effects of Cued
Speech on perception of monosyllabic words with
and without sound showed that the amount of the
calculated F in monosyllabic words perception with
sound (F=121.79) and without sound (F=87.81) in
two groups (experimental and control group) were
significant (P =0.01) and showed that there was
significant difference in the perception of
monosyllabic words with and without sound in pre-
test, post-test and follow-up stages between
experimental and control group.
The results of the between-subject effects of Cued
Speech on perception of monosyllabic words
showed that regarding the amount of calculated F
with sound (F=9047.52) and with sound
(F=8667.18) in perception of monosyllabic words in
two groups (experimental and control group), it
could be concluded that there was a significant
difference (P =0.01) between perception of
monosyllabic words with and without sound of the
experimental and control group. Mean scores of
perception of monosyllabic words with and without
sound in experimental group were higher than
control group, in post-test and follow-up. The Cued
Speech had improved perception of experimental
group for monosyllabic words both with and without
sound. The effect size amount for monosyllabic
perception with sound was 0.96 and monosyllabic
perception without sound at 0.95, that showed the
remarkable effect of Persian Cued Speech on
perception of monosyllabic words.
Figure 2 shows the phoneme and monosyllabic word
perception in four (1-Lipreading, 2-Lipreading +
Audition 3-Cued Speech and Lipreading and 4-
Audition + Cued Speech + Lipreading) in hearing
impaired children. As it is shown Cued Speech
improves the phoneme and monosyllabic word
perception of the cases both with sound (audition)
and without sound (lipreading)
Vol. 9 - Special Issue - Child Neuro Rehabilitation
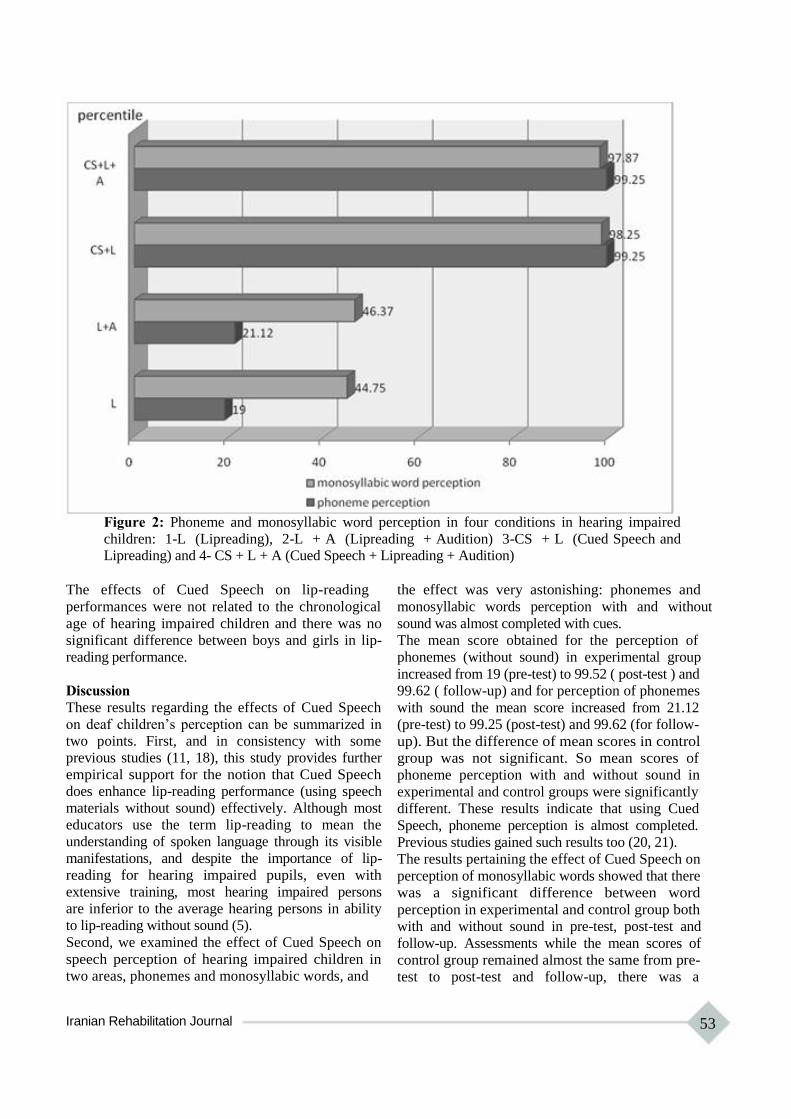
Figure 2: Phoneme and monosyllabic word perception in four conditions in hearing impaired
children: 1-L (Lipreading), 2-L + A (Lipreading + Audition) 3-CS + L (Cued Speech and Lipreading) and 4- CS + L + A (Cued Speech + Lipreading + Audition)
The effects of Cued Speech on lip-reading
performances were not related to the chronological
age of hearing impaired children and there was no
significant difference between boys and girls in lip-
reading performance.
Discussion
These results regarding the effects of Cued Speech
on deaf children‟s perception can be summarized in
two points. First, and in consistency with some
previous studies (11, 18), this study provides further
empirical support for the notion that Cued Speech
does enhance lip-reading performance (using speech
materials without sound) effectively. Although most
educators use the term lip-reading to mean the
understanding of spoken language through its visible
manifestations, and despite the importance of lip-
reading for hearing impaired pupils, even with
extensive training, most hearing impaired persons
are inferior to the average hearing persons in ability
to lip-reading without sound (5).
Second, we examined the effect of Cued Speech on
speech perception of hearing impaired children in
two areas, phonemes and monosyllabic words, and
Iranian Rehabilitation Journal
the effect was very astonishing: phonemes and
monosyllabic words perception with and without
sound was almost completed with cues.
The mean score obtained for the perception of
phonemes (without sound) in experimental group
increased from 19 (pre-test) to 99.52 ( post-test ) and
99.62 ( follow-up) and for perception of phonemes
with sound the mean score increased from 21.12
(pre-test) to 99.25 (post-test) and 99.62 (for follow-
up). But the difference of mean scores in control
group was not significant. So mean scores of
phoneme perception with and without sound in
experimental and control groups were significantly
different. These results indicate that using Cued
Speech, phoneme perception is almost completed.
Previous studies gained such results too (20, 21).
The results pertaining the effect of Cued Speech on
perception of monosyllabic words showed that there
was a significant difference between word
perception in experimental and control group both
with and without sound in pre-test, post-test and
follow-up. Assessments while the mean scores of
control group remained almost the same from pre-
test to post-test and follow-up, there was a
53
significant difference between mean scores of
experimental group in pre-test (44.75), post-test
(98.25) and follow-up (98.75) for monosyllabic
words without sound and an increase from 46.37
(pre-test) to 97.87 (post-test) and 98.62 (follow-up)
for monosyllabic words perception with sound.
These findings again showed the strong effect of
Cued Speech on perception of monosyllabic words
in Persian language, which was in congruence with
previous studies (12, 20). The results also indicate
the great effect of Persian Cued Speech on
lipreading and perception of phonemes and
monosyllabic words do not show significant
differences with and without sound. In the other
word even if there is no sound, the perception is
completed (because of lipreading). One possible
explanation for the excessive improvement effect of
Persian Cued Speech on lip-reading performance
might be related to the Persian phonetics. We have
no diphthongs and have only six vowels in Persian
language so we use only three hand placements,
each representing two vowels, thus Persian Cued
Speech is much more easier to learn than Cued
Speech in some other languages.
References 1. Movallali G. Developing the Persian version of Cued speech
and evaluation of its impact on speech perception of hearing impaired school age children .Unpublished Ph.D thesis, Faculty of Psychology, Tehran University, Tehran, IRAN,2009, [Persian].
2. McGurk H & MacDonald J. Hearing lips and seeing voices.
Nature.1976; 264, 746-748. 3. LaSasso CJ, Crain KL, Leybaert J. Cued Speech and cued
language for deaf and hard of hearing children , San Diego:Plural Publishing,Inc.2010.
4. Portolano M. Cued American English: a variety in the visual mode. Word Englishes.2008; 27, 2, 196-216.
5. Cornett RO and Daisey M. The Cued Speech resource book for parents of hearing impaired children (2nd ed.).Cleveland, OH: National Cued Speech Association. 2001.
6. Alegria J, Leybaert J, Charlier B, Hage C. On the origin of phonological representations in the hearing impaired: Hearing lips and hands .In: Alegria J, Holender D, Morais JJD, Radeau M.(Eds), 1992.Analytic Approaches to Human Cognition.Elsevier Science Publishers,Amsterdam,pp.107- 132.
7. La Sasso C and Metzger M. An alternate route for preparing hearing impaired children for BiBi program: The home language as L.I. and Cued speech for conveying traditionally-spoken language. Journal of Hearing impaired Studies and Hearing impaired Education.1998;3,264-289.
8. Torres S, Moreno-Torres I, Sontana R. Quantitative and qualitative evaluation on linguistic input support to a prelingually deaf child with cued speech. A case study .J Deaf Stu Deaf Educ.2006;11(4):438-448.
9. Leybaert J. La lecture chez l'enfant sourd:l'apport du Langage Parle' Complete.Revue Francaise de Linguistique Appliquee. .,1996 ;1,81-94.
10. Neef NA and Iwata BA. The development of generative
54
One of the study's limitations was that we could not
examine long term effects of Persian Cued Speech
on children's performances, because Persian Cued
Speech is a very newly-introduced system in our
country. Although lip-reading skill is desperately
important to a hearing impaired person, yet it
appears that only a few of them tend to become very
good lip-readers. Prior knowledge of spoken
language is probably the single important factor in
becoming able to lip-read well. The prime function
of Cued Speech during the early years is language
development through easy and clear communication,
therefore it seems reasonable to assume that
children, who grow up on Cued Speech in the home,
will often be skillful in speech perception and lip-
reading (5, 22).
Conclusion
In sum, we can conclude that Persian Cued Speech
strongly contributes to skill in lip-reading. It does
improve the perception of phonemes and
monosyllabic words and so can improve the hearing
impaired children‟s overall language skills. Further
researches are needed to examine long term effects.
lipreading skills in hearing impaired persons using Cued Speech training, Analysis and Intervention in Developmental Disperformance, 1985; 5 , 4 , 289-305.
11. Nichols G, Ling D. Cued Speech and the Reception of Spoken Language, Journal of Speech and Hearing Research,1982;25,262-269. 12. Kaplan H. The Effect of Cued Speech on the Speech reading Performance of the Hearing impaired. Dissertation Abstracts International.1974.36, 2, 645B. 13. Chilson RF. Effects of Cued Speech on Lip-reading Performance. Unpublished master's thesis, University of Rhode Island. 1979. 14. Alegria J, Charlier B, Mattys S. The Effect of lip-reading and Cued Speech in the Processing of Phonological Information in French-educated Hearing impaired Children,European .Journal of Cognitive Psychology.
1999;11,4,451-472. 15. Cornett RO. Diagnostic factors bearing on the use of cued speech with hearing impaired children, Ear and Hearing, .1985;6,1,33-5. 16. Kipila B. Analysis of an oral language sample from prelingually deaf child's cued speech. Cued speech annual, 1985; 1, 46-59. 17. Hage C, Alegria J, Perier O. Cued Speech and language acquisition: The case of grammatical gender morpho- phonology. In Martin D (Ed.), Advances in cognition,
education and hearing impairedness. Washington, DC:Gallaudet University Press. 1990.
18. Delfi M. Evaluation of speech discrimination scores (SDS) in normal hearing and noise induced high frequency hearing impaired workers of fulad company in Khuzestan ,Unpublished Master's dissertation .Iran Medical University. Tehran, IRAN, 2009, [Persian]. 19. Movallali G, Biglarian A. Designing Sara Lipreading test (No2) and implementing it in a group of hearing adults, J
Vol. 9 - Special Issue - Child Neuro Rehabilitation

Reh 2003;4(13):53-58 [Persian] 20. Nicholls G. Cued Speech and the reception of spoken English. Unpublished Ph.D. Thesis , McGill University,
Montreal , Canada. 1979, 21. Perrier O, Charlier B, Hage C, Alegria J. "Evaluation of the effects of prolonged cued Speech practice upon the perception of spoken language".1989. In I.G Taylor (Ed) "The education of hearing impaired: Current
Iranian Rehabilitation Journal
perspectives",1985;1, International Congress on education of the hearing impaired. Beckenham, Kent, UK: Croom
Helm Ltd. (Reprinted in Cued Speech Journal, 1990; 4). 22. Montgomery AA, Jackson PL. Physical Characteristics of the Lips Underlying Vowel Lip-reading Performance, Journal of the Acoustical Society of America .1983;
73,6,2134-2144.
55
Iranian Rehabilitation Journal, Vol. 9, December 2011
Original Article
Prevalence of Feeding Problems in Children with Intellectual
Disability
Mohammad Rezaei, MSc; Vahid Rashedi, MSc Faculty of Rehabilitation Sciences, Hamedan University of
Medical Sciences & Health Services, Hamedan, Iran
Masoud Gharib*, MSc Pediatric Neurorehabilitation Research Center, University of
Social Welfare & Rehabilitation Sciences, Tehran, Iran
Gohar Lotfi, MSc University of Social Welfare and Rehabilitation Sciences, Tehran, Iran
Objectives: Feeding is an essential function which affects quality of life of the intellectually disabled (ID) persons. Approximately 80% of the severe and profound mentally retarded population have some feeding difficulties. This study aimed to determine the prevalence of feeding problems in children with ID.
Methods: In this cross-sectional descriptive study, 144 individuals with Intellectual Disability referred to speech
and language pathology clinic were included using random sampling. To gather the data, Screening Tool
of feeding Problems (STEP) was used. ِData analysis was done through SPSS.
Results: The findings of the study indicated that all subjects were somehow involved with feeding
problems. The results also show that mean score of problem in feeding skills (2.41) are most prevalent and
aspiration risks (0.37) are of less prevalence among the subjects. Analyses revealed that gender and level of ID
severity are effective factors in feeding problems.
Conclusion: Our study indicates that in children with ID, eating problems are more prevalent than
previously reported. The importance of these data is further underscored by the fact that the majority of these
feeding problems had not been previously identified.
Key words: Feeding problems, Intellectual disability, Screening Tool of feeding Problems
Introduction
Feeding, an essential adaptive function that affects
quality of life of the intellectual disabled persons
(ID), is a complex sensorimotor process that
involves integration between the nervous system and
the muscles and is affected by environmental factors
(1). Feeding enables the child to grow up, learn, and
develop relationships with others (2) and is
associated with the development of social and
communicational skills (3). Any deficit in structure
and/or function can lead to difficulties in performing
feeding activities such as chewing, swallowing, and
drinking (4). These feeding problems have been
linked to various disorders, including ID (5), and
shown to affect physical, mental, social and
educational development (6, 7).
Feeding disorders are common in early childhood;
the incidence of minor feeding problems has been
*All correspondences to: E-mail:[email protected]
56
ranged between 25% and 35% in normal children
(8). Palmer, Thompson, and Linscheid reported that
approximately 1/3 of individuals with developmental
disabilities have some feeding problems,
furthermore approximately 80% of the severe and
profound mentally retarded people have some
feeding difficulties (9).
There are numerous types of feeding problems in the
developmentally disabled people, and assessment
and treatment should be tailored to address each
specific one. Sisson and Van Hasselt suggested that
feeding problems could be divided into four
categories; (1) lack of independent skills, (2)
disruptive behavior, (3) eating so much or little, and
(4) selectivity (by type and texture) (10). Though
these categories do account for many feeding
problems, they are not comprehensive. Other
feeding problems presented among the mentally
Vol. 9 - Special Issue - Child Neuro Rehabilitation
retarded population that are not included in this
model are rumination, vomiting, pica, food stealing
(during and/or outside of meal times), and other
areas of selectivity (i.e., setting, temperature, and
feeder). Fredericks, Carr, and Williams found that
6-10% of developmentally disabled persons living
in institutional settings engage in rumination
(behaviors that repeatedly bring food past one‟s
airway) (11). Unfortunately, risks associated with
rumination are aspiration, suffocation and/or
pneumonia which can be fatal. According to
Konarski, Favell, and Favell rumination is estimated
to be the cause of death in 5-10% of those who
ruminate (12). Pica is another serious behavior that
occurs in 9-25% of mentally retarded individuals in
institutional settings (13). Individuals who ingest
inedible objects (i.e., pica) such as paint chips and
cigarette butts are at great risk of poisoning and
intestinal obstruction (14). Individuals who are food
refusal or food selective, either by type (e.g., eat
only cheeseburgers), texture (e.g., eat only pureed
foods), temperature (e.g., eat only foods of room
temperature), feeder (e.g., will only eat if fed by
their mother), location (e.g., will only eat alone), or
a combination of these, are at risk of malnutrition,
and possibly the need for a feeding tube if they do
not take in enough food or lack a well balanced diet.
Many feeding difficulties pose serious health risks,
including aspiration, the need for feeding tubes,
poisoning, and malnutrition (15). O‟Brien, Repp,
Williams and Christophersen discussed the lack of
feeding skills that can result being maintained on a
developmentally inappropriate diet/food texture
(16). An inappropriate diet for the individual‟s
developmental level can result in delayed
development of chewing and sucking. Systematic
and effective identification of feeding problems and
problematic mealtime behaviors is essential in order
to inform the physicians and therapists (i.e., psychologists, nutritionists, speech therapists and
occupational therapists) who can be involved with
evaluation and treatment (17). However, only slight
evidence exists whether how people on the various
levels of ID differ in amount and type of their
feeding problems. According to the aforementioned
issues, the prevalence of feeding problems in ID
children has been targeted in the present study.
Materials and Methods
Participants In this cross-sectional descriptive study, 144
individuals with intellectual disability (mild, moderate and
Iranian Rehabilitation Journal
profound percentiles were 4.8%, 14.2% and 72%
respectively) referred to speech and language
pathology clinic of University of Social Welfare and
Rehabilitation Sciences were recruited using random
sampling. Diagnoses of intellectual disability were
previously made by individually administered
intelligence tests (e.g., Stanford-Binet IV).
Materials To gather the data, feeding problem questionnaire
was used as well as demographic questionnaire
which contains gender, age, height, weight, BMI,
IQ, type of disability, mothers' age and education.
To detect feeding problems in participants, we
applied the Screening Tool of feeding Problems
(STEP). The STEP is a 23-item feeding problem
screening instrument for persons with intellectual
disability. The contents of screening instrument were
instructed to respond the items in terms of two
dimensions, frequency and severity. Each dimension
can be rated on a 3-point Likert-type scale. On the
frequency dimension, “0” indicates no occurrence of
the behavior in the last month, “1” indicates the
behavior occurred once to 10 times, and “2”
indicates the behavior has occurred more than 10
times. For the severity dimension, “0” suggests that
the behavior does not cause any harm or problems,
“1” presents the behavior causes some problems
and/or results in harm, and “2” shows that the
behavior causes serious problems and/or injury. The
general categories of feeding problems included:
aspiration risk, selectivity, feeding skills, food
refusal related behavior problems, and nutrition
related behavior problems.
Data analysis The obtained data from the questionnaires were initially analyzed by descriptive statistics.
Continuous variables are presented in terms of mean
value, SD and range. Data analysis was conducted
using the statistical package for the social sciences
(SPSS) version 12. Simple percentages were
obtained, Independent t-test and Univariate analysis
of variance (ANOVA) were used and correlation
analyses were also performed to assess the
association between variables. P< 0.05 level was
considered for statistical significance.
Results
The number of participants was 144 (96 male, 48
female) ranging from 3 to 13 years old with standard
deviation of 2.125. Distribution of these children
was as follow: 30 down syndrome (20.8%), 30
autistic (20.8%), 46 cerebral palsy (31.94), and 36
57

other disabilities (26.38) with IQ scores of 32 for
mild (22.22%), 80 moderate (55.55%), and 32 cases
severe with ID (22.22%).
Mothers' minimal and maximum ages were 26 and
55 respectively with the SD of 6.47 whose academic
levels included; 10 under diploma (6.94%), 88
diploma (61.11%), 2 associate diploma (1.38%), 40
BSc (27.77%) and 4 MSc (2.77%). Other
Table 3
Variable
Feeding
Problems
Table 4
N = 144
Sever Moderate Mild
Mean SD Mean SD Mean SD
13.81 8.45 6.37 3.15 3.62 1.50
N = 144
SS df MS
P value
< 0.001
F demographic information is presented in table 1. Between Groups 927.93 2 463.96 21.40 Total feeding difficulties for individuals were Within Groups 1495.56 141 21.67
measured by the sum of responses to the 23- STEP Total 2423.50 143
items (with scores ranging from 0 to 46). The
findings of the study indicated that all subjects were
somehow involved with feeding problems. Mean
score for total STEP was 7.41 with a SD of 2.84.
Results showed that among the all participants 42
(29.16%) were at aspiration risk, 106 (73.61%) had
disability of selectivity, 114 (79.16%) showed
feeding skills disorders, 92 (63.88%) suffered from food refusal related behavior problems and 96
(66.66%) with nutrition related behavior problems.
The other results indicate that mean scores of
problem in feeding skills (2.41) are most prevalent
and aspiration risks (0.37) are of less prevalence
among the subjects.
Analyses were also implemented to determine the
mean score in STEP depending on the participants'
gender and level of ID. Independent t-test was used
for comparison between the male and female and
among the mild, moderate and severe levels of ID
group. Severity of feeding difficulty was observed to be
greatest in male participants (table 2). As seen in
tables 3 and 4, the severity of feeding problem was
also greatest for those with severe ID compared to
the mild and moderate level of ID group.
Table 1
N = 144
Discussion
Proper eating/feeding behaviors are important to
have a healthy lifestyle (18). Feeding problems are
serious clinical problems that complicate the
management of children with intellectual disabilities
(19). The results of the current study show a high
prevalence of feeding problems in children with ID.
Other studies report feeding problems in about 80%
of children with intellectual disabilities (9). The
present results suggest a higher prevalence of
feeding problems in children with ID. This is
consistent with the study of Matson (13). Similar to
other problem behaviors in ID, the etiologies of
feeding problems are usually discussed as either
medical or environmental (e.g., esophageal reflux
and food refusing as medical and environmental,
respectively). The most prevalent feeding problems found in this study were in the area of feeding skills, including, inability to feed him/herself independently, requiring special equipment for feeding, and requiring special positioning during feeding. This finding is similar to Matson (13). Feeding skill disorders include items which are motor oriented, may derive from sensory motor difficulties affected by sensory modulation, muscle tone, coordination and endurance that
Variable
Height*
Weight**
BMI * Meter ** Kilogram
Table 2
Variable
Feeding
Problems
58
Min Max Mean
0.75 1.60 1.20
8.00 52.00 28.13
10.20 32.00 18.57
N = 144
Female Male
Mean SD Mean SD
6.12 3.04 8.06 6.76
influence ability in timing and accuracy of the SD 0.21 mouth movements, or from sensory-motor
11.54 disabilities that affect control of the food in the 4.16 mouth. Indeed, the literature suggests that children
with ID often present difficulties in their motor skills that are affected by their general severe brain damage, lack of motivation to develop motor learning, and decreased heart activity (19). The lack of motor experiences may also result in further
P value motor limitations (20). In this instance, being male and more severely intellectually disabled further
0.004 increases the ID person‟s risk for feeding problems. This result should be taken into account in the planning of clinical services, particularly with respect to feeding issues.
Vol. 9 - Special Issue - Child Neuro Rehabilitation
Conclusion
To conclude, our study indicates that in children
with ID, eating problems are more prevalent than
previously reported. The importance of these data is
better underscored by the fact that the majority of
these feeding problems had not been previously
identified. This study may therefore have great
implications for the places where clinicians can
direct efforts and preventative care. It is of
importance that all children with ID will be assessed
for feeding problems, and these problems will be
treated using suitable and proper methods.
References 1. Eynat G, Reem HN, Batya EY. The relationship between the severity of eating problems and intellectual developmental deficit level. Research in Developmental Disabilities. 2011; 32 (5): 1464-1469. 2. Morris SE, Klein MD. Pre-feeding skills: A comprehensive
resource for feeding development. 2nd ed. USA: Academic Pr. 2001.
3. American Occupational Therapy Association. Problems with eating: Interventions for children and adults with developmental disabilities. USA: The American
Occupational Therapy Association.1996. 4. Case-Smith J. Intervention strategies for promoting feeding skills in infants with sensory deficits. Occupational Therapy in Health Care. 1989; 6 (2-3): 129-141. 5. Chatoor I. Diagnosis and treatment of feeding disorders in infants, toddlers and young children. USA: Zero to three. 2009. 6. Gravestock S. Diagnosis and classification of eating disorders in adults with intellectual disability: The diagnostic criteria for psychiatric disorders for use with adults with learning disabilities/mental retardation (DC-LD). Journal of Intellectual Disability Research. 2003; 47 (1): 72- 83. 7. Laud RB, Girolami PA, Boscoe JH, Gulotta CS. Treatment outcomes for severe feeding problems in children with autism spectrum disorder. Behavior Modification. 2009; 33 (5): 520-536. 8. Colin DR, Dana TL. Feeding disorders in infants and children. Pediatric Gastroenterology and Nutrition. 2002; 49 (1): 97-112. 9. Palmer S, Thompson RJ, Linscheid TR. Applied behavior analysis in the treatment of childhood feeding problems. Developmental Medicine and Child Neurology. 1975; 17 (3): 333-339. 10. Sisson KA. Van Hasselt VB. Feeding disorders. In Luiselli JK. Behavioral Medicine and Developmental Disabilities. USA: Springer-Verlag. 1989.
Iranian Rehabilitation Journal
Intervention services may not only affect the quality
of life of those with ID, but may also have potential
to prevent further eating problems, and direct impact
on the physical and emotional wellness of children
with ID.
Acknowledgement
We are so grateful to Amir Rahmani Rasa for
reviewing the original article. The authors thank the
children and their families for good cooperation in
the study.
11. Fredericks DW, Carr JE, Williams WL. Overview of the treatment of rumination disorder for adults in a residential setting. Journal of Behavior Therapy and Experimental Psychiatry. 1998; 29 (1): 31-40. 12. Konarski EA, Favell JE, Favell JE. Manual for the assessment and treatment of the behavior disorders of people with mental retardation. USA: Western Carolina Center Foundation. 1992. 13. Matson JL, Fodstad JC, Boisjoli JA. Cutoff scores, norms and patterns of feeding problems for the Screening Tool of feeding Problems (STEP) for adults with intellectual
disabilities. Research in Developmental Disabilities. 2008; 29 (4): 363-372.
14. Matson JL, Bamburg JW. A descriptive study of pica behavior in persons with mental retardation. Journal of Developmental and Physical Disabilities. 1999; 11 (4): 353- 361. 15. Matson JL, Kuhn DE. Identifying feeding problems in mentally retarded persons: development and reliability of the Screening Tool of feeding Problems (STEP). Research in Developmental Disabilities. 2001; 22 (2): 165-172. 16. O‟Brien S, Repp AC, Williams GE, Christophersen ER. Pediatric feeding disorders. Behavior Modification. 1991; 15 (3): 394-418. 17. Matson JL, Smiroldo BB. The Validity of the mania subscale of the Diagnostic Assessment for the Severely Handicapped-II (DASH-II). Research in Developmental
Disabilities. 1997; 18 (3): 221-225. 18. Rurangirwa J, Van Naarden Braun K, Schendel D & Yeargin-Allsopp M. Healthy behaviors and lifestyles in young adults with a history of developmental disabilities. Research in Developmental Disabilities. 2006; 27: 381-399. 19. Schwarz MS. Feeding disorder in children with developmental disabilities. Infants and Young Children. 2003; 16 (4): 317-330. 20. Antero M, Pauli R & Ulla L. Physical performance of individuals with intellectual disability: A 30-year follow-up. Adapted Physical Activity Quarterly. 2007; 24 (2): 125-143.
59
Iranian Rehabilitation Journal, Vol. 9, December 2011
Original Article
The Prevalence of Ear Disease in Sensorineural Hearing Impaired
Children Below 18 Years-Old in Deaf Welfare Clinic of Molavi
Rehabilitation Center
Naeimeh Daneshmandan, MD; Samaneh Hosseinzadeh, MSc; Robab Teymouri*, PhD Pediatric Neurorehabilitation Research Center, University of Social Welfare and Rehabilitation
Sciences, Tehran, Iran
Objectives: Hearing impairment in children is considered as an important public health problem.
Auditory function in these children is poor and depends on their hearing aids efficacy and also their ears‟ status.
Hearing aids are very expensive and ear disease deteriorates its performance. Therefore detecting the ear
disease and offering proper treatment is necessary. The aim of this study is to highlight the prevalence of
ear disease in children with SNHL to justify the efforts made to insure diagnosis and adequate treatment.
Method: Eighty children with bilateral sensorineural hearing loss were selected in our study from deaf
Welfare Clinic affiliated to Welfare Organization. Otological examination and tympanometry were
performed for all these children.
Results: The most pathologic finding was ear wax and observed in 37 children (48.7%). Ear discharge was
seen in 7 (8.7%) children. Normal TM in 63 (81.8%), abnormal TM in 14 (18.2%) and perforated TM in 3
cases were detected.
Conclusion: The most common disorder was wax which deteriorates hearing aids performance by clogged ear molds. Middle ear disease which aggravates the degree of hearing loss in one forth of
children was observed. The high prevalence of external and middle ear disease highlights the need of regular otological examination in hearing impaired children.
Key words: Prevalence, Ear disease, Deafness, Children, Wax
Introduction
Hearing loss in early childhood can affect the
development of speech and language, social and
behavioral status, attention and academic achievement of
children (1). External and middle ear diseases can
affect auditory performance (2). Ear disease is
common in a general population in any part of the
world. External ear disease is the most common
cause of visits in the district hospital of Ear, Nose
and Throat departments (3). Acute otitis media in
children is one of the most frequent reasons for
concerned parents to take their child for medical
services (4, 5). Many studies performed to determine
the prevalence of ear disease in normal and hearing
impaired children. Jacob et al. in an investigation
showed that, most of children with hearing
impairment had associated middle ear disease (6). A
study in the first year school children showed that
the most common disorder was wax and in
consequence was middle ear disease. The prevalence
*All correspondences to: E-mail: [email protected]
60
of inactive ear disease in these children was the third
common disorder (7). The other study in students of
deaf school performed and ear examination findings
showed that impacted wax was the most common
pathology and the second prevalent disease was
middle ear disease (8). Sensorineural Hearing Loss
(SNHL) children are not sensitive to changes in their
hearing threshold, so there is a need for regular
otological examination in this group to detect and
diagnose any extra or deteriorating conductive
hearing loss (9). On the other hand, hearing aids are
an important resource for the rehabilitation of
hearing impaired children and additional conductive
hearing loss may affect their hearing aids‟ efficacy
(10, 11).
The aim of this study was to determine the
prevalence of ear disease in hearing impaired
children in order to enhance the role of regular
otological examination in deaf rehabilitation centers.
Vol. 9 - Special Issue - Child Neuro Rehabilitation
Materials & Methods
A cross-sectional study was designed. The study
population comprised of 80 SNHL children below
18 years-old from rehabilitation center (Molavi)
affiliated to Social Welfare Organization in 2010-
2011. All cases were examined by otolaryngologist
to determine the ear disease among them.
Tympanometry was performed to confirm our
clinical evaluation of middle ear and tympanic
membrane status. Tymponometry was not performed
in perforated TM. In calculating the individual ear‟s
hearing loss, we used the average of 500, 1000, and
2000 HZ SNHL in better ear. The deafness was
classified as slight hearing loss if the threshold level
was between 10-25 , and mild if it was between 25-
50, moderate if it was between 51-70 , severe if it
was between 71-90, and profound if it was between
91-110 dB.
Results
The range of age was 2-18 with mean 10 years. There were 49 boys (61%) and 31 girls (39%). In external ear examination, wax was present in 37 children (48.7%) of whom 27 children had bilateral wax. Ear discharge was seen in 7 children (8.7%). The most of children had Tympanogram type A (81.8%). Abnormal tympanogram was seen in 14 (18.2%) children. Among the 8 cases with type B, four cases had inactive chronic ear disease and four cases had middle ear effusion. In the last group, three cases respond to medical treatment and one case has been operated. Three children had perforated TM (table 1). The most frequent degree of hearing loss was severe to profound (46.3%). Four cases had serious otitis media, of whom three cases responded to medical treatment, and in one myringotomy with grommet insertion was performed (table 2).
Table 1: distribution of tympanometry types in deaf
children
Tympanometry type No. of case (%)
normal (Type A) 63 (81.8)
Abnormal (Type B, C,…) 14 (18.2)
Table 2: distribution of degree of hearing loss in
deaf children
Degree of hearing loss No. of case (%)
Severe to profound hearing loss 37 (46.25)
Severe hearing loss 17 (21.25)
Moderate hearing loss 18 (22.5)
Mild hearing loss 4 (5)
Slight hearing loss 4 (5) Iranian Rehabilitation Journal
Discussion
Ear disease in general population is very common
(12). On the other hand, external and middle ear
disease can affect auditory performance. Auditory
function in hearing impaired children is poor and
dependent on their hearing aids‟ efficacy and their
ears‟ status too. Ear disease can affect the hearing
threshold but SNHL children are not sensitive to
these changes. Many studies investigated this
problem and showed the high prevalence of ear
disease in hearing impaired children.
Our study showed that wax in SNHL children was a
common disorder (49%) but its prevalence in other
studies such as Swart (1995), Karatas and Egeli
(2003) was 7%, 23% and 39% respectively (7, 8, 13). So,
this comparison indicated that, wax problem was more
frequent in deaf children in our studied group.
We also investigated the middle ear disease in
SNHL children. Eighteen percent of them had
abnormal TM that was less than abnormal TM in
Egeli‟s report (22%) (7). It was compared with
Kartasl and Oztruk studies, (8%) (10, 13) which
showed lower frequency than ours. In our findings 3
children (3.7%) had perforated TM which it was
compatible with the study of Kamal-Eldin et al that
reported 25% middle ear problem and 5% perforated
TM (14).
Roser in 2004 discussed about the aided speech
threshold changes from 40 dB to 90 dB because of
the clogged ear molds by ear wax (11). As we
showed 49% of our NSHL children had wax which
was a few more than other studies.
Most of investigated children (90%) in the present
study had hearing loss with degree of moderate to
profound. The degree of hearing loss in other
studies showed that more than 90% were moderate
to profound too (8-14). We indicated that prevalence
of some of ear diseases in sensorineural hearing
impaired children is high and regular otological
examination is needed and tympanometry as a part
of the screening protocol to diagnose middle ear
disease is essential.
Acknowledgements
This study was supported by the Deputy of Research
and Technology grant from University of Social
Welfare and Rehabilitation Sciences.
I would like to thank Mrs. Malihe Sahami, the head
manager of Molavi Rehabilitation Center, Mrs.
Maryam Panahi, the head of Audiology Department
and finally the hearing impaired children and their
families for their good cooperation in this study.
61

References 1. Storbeck C and Calvert-Evans J. Towards Integrated
Practice in early detection of and Intervention for Deaf and
Hard of Hearing Children, American Annals of the Deaf,
2008. 153(3): p. 314-321.
2. Behrman RE, Kliegman RM and Jenson HB. Nelson text
book of pediatrics, ed. 16. 2000: W.B Saunders Company.
3. Paparela, et al. Otolaryngology, ed.3, 1991: W. B. Sanders
Company.
4. Hayes D, and Northern JL. Infants and Hearing, 1996:
Singular publishing group.
5. Northern JL and Downs MP. Hearing on children, ed. 5.
2002: Lippincott Williams and Wilkins. 6. Jacob A et al. Hearing impairment and otitis media in a rural
primary school in south India. Int J Pediatr Otorhinolaryngol, 1997. 39(2): p. 133-8.
7. Swart S et al. A survey of ear and hearing disorders amongst
a representative sample of grade 1 schoolchildren in
Swaziland, Int J Pediatr Otorhinolaryngol, 1995. 32(1): p. 23-34.
8. Egeli E, Ciçekçi G, and Oztürk O. ear examination findings
62
at the Yeditepe School for the Deaf. Int J Pediatr Otorhinolaryngol, 2003. 67(8): p. 905-10.
9. Elango S, Htun Y, and Raza H. Additional conductive hearing loss in children from a school for the deaf in
Malaysia. Int J Pediatr Otorhinolaryngol, 1994. 28(2-3): p.
125-8.
10. Ozturk O et al. Evaluation of deaf children in a large series
in Turkey, Int J Pediatr Otorhinolaryngol, 2005. 69(3): p. 367-73.
11. Roser RJ and Downs MP. Audiotry disorders in school
children. 2004 New York: Thieme.
12. Berzon D. Ear Disease in a group general practice. A review
of world communities. J Laryngol Otol, 1983. 97(9): p. 817- 24.
13. Karatas E, Kanlikama M and Mumbuc S. Auditory functions in children at schools for the deaf, J Natl Med Assoc, 2006.
98(2): p. 204-10.
14. Abou-Elhamd K-EA, Moussa A-E and Soltan MA-E,
Prevalence of middle ear pathologies in children with
bilateral sensorineural hearing loss, International journal of
Pediatric Otorhinolaryngology, 2006. 70: p. 1081-1084.
Vol. 9 - Special Issue - Child Neuro Rehabilitation

Iranian Rehabilitation Journal, Vol. 9, December 2011
Original Article
Co-Morbidity of Attention Deficit Hyperactivity Disorder (ADHD)
and Tourette Syndrome in Child Referral Psychiatry Clinic in IRAN
Sahel Hemmati* MD; Nasrin Amiri, MD; Robab Teymouri, PhD; Masoud Garib, MSc;
Pediatric Neurorehabilitation Research Center, University of Social
Welfare and Rehabilitation Sciences, Tehran, Iran
Objectives: Tourette syndrome is a disorder with motor and vocal tics, which has many psychiatric
comorbidities. Attention Deficit Hyperactivity Disorder (ADHD) is one of co-morbid features of this
syndrome. The aim of this research is studying Tourette and co morbidity ADHD in school age children. One
of our purposes is to identify the range of ADHD in Iranian Tourette patients.
Methods: Thirty children with Tourette syndrome attended in an adolescence psychiatry disorders clinic
studied during one year using a descriptive, cross sectional method. Control group selected from students of
Tehran schools matched to first group in age and sex. K-SADS questionnaire used to investigate the presence
of ADHD in both groups. Results analyzed with SPSS.
Results: A clear pattern of co-morbidity was demonstrated with ADHD. Seventy percent of Tourette
group had ADHD; this co-morbidity in both sexes was different (20% of girls and 80% of boys).
Conclusions: Although the frequency of ADHD co-morbidity with Tourette is high, but in our study was
higher (50-60% versus 70%). Hence every Tourette patients must be studied for co-morbidity.
Regarding to small size of studied people, similar studies must be performed with larger sample size.
Key words: Attention Deficit Hyperactivity Disorder (ADHD), Tourette syndrome of childhood, Comorbidity, K-SADS.
Introduction
Tourette disorder is a chronic, potentially disabling,
neuropsychiatric disorder of childhood (1). Its
symptoms are involuntary multiple motor and phonic tics, not necessarily concurrent (2). Tics
show waxing and waning patterns in childhood, (2-
3) with a tendency of decline in late childhood (3).
The prevalence of Tourette disorder is ranging from
3-5 per 10,000 (3-4), it is estimated that milder
cases were not counted (5). The co-morbidity of
Tourette disorder was widely discussed (3-4).
Attention-Deficit Hyperactivity Disorder is more
than any other mental disorders co morbid with
Tourette (6-7). Data from clinical studies indicate
that ADHD symptoms occur in half or all of
Tourette patients. In some studies Tourette
diagnosis, has been diagnosed after ADHD (8).
Material and Methods
This study performed in Rozbeh Child and
Adolescence Psychiatry Clinic of Tehran for one
*All correspondences to: E-mail: [email protected]
Iranian Rehabilitation Journal
year. Thirty patients in range of 7-18 years were
recruited in the study. All of 30 children with a
clinical diagnosis of Tourette disorder were
examined individually by the first authors, also
visited by other members of the team. Sampling
methods were simple descriptive-analytical method
and cross sectional method. Parents were
interviewed in accordance with structured DSM-IV-
TR. All children in two groups had IQ test, numbers
lower than 84 were failed for research. This was an
exclusion criterion. There were 5 girls and 25 boys
in our group. We asked to keep on their medications.
At the same time 30 cases were chosen that study in
primary and high school in Tehran. This group was
matched with our patients group in sex and ages, as
well. They were chosen by chance with numbers
from primary and high schools in Tehran. Two
groups were studied with (K-SADS) for psychiatric
disorders. K-SADS (K-SADS is a Kiddy Schedule
for Affective Disorder & Schizophrenia for children)
was used to investigate the presence of ADHD in
63
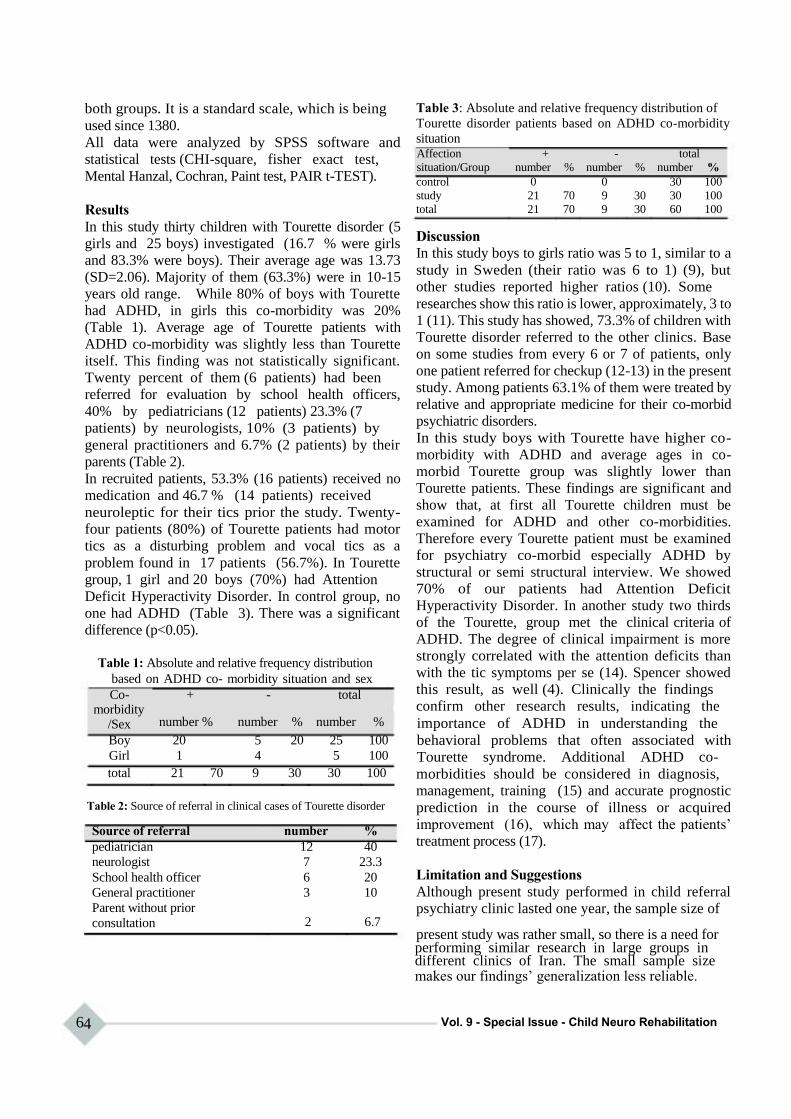
both groups. It is a standard scale, which is being
used since 1380.
All data were analyzed by SPSS software and
statistical tests (CHI-square, fisher exact test,
Mental Hanzal, Cochran, Paint test, PAIR t-TEST).
Results
In this study thirty children with Tourette disorder (5
girls and 25 boys) investigated (16.7 % were girls
and 83.3% were boys). Their average age was 13.73
(SD=2.06). Majority of them (63.3%) were in 10-15
years old range. While 80% of boys with Tourette
had ADHD, in girls this co-morbidity was 20%
(Table 1). Average age of Tourette patients with
ADHD co-morbidity was slightly less than Tourette
itself. This finding was not statistically significant.
Twenty percent of them (6 patients) had been
referred for evaluation by school health officers,
40% by pediatricians (12 patients) 23.3% (7
patients) by neurologists, 10% (3 patients) by
general practitioners and 6.7% (2 patients) by their
parents (Table 2).
In recruited patients, 53.3% (16 patients) received no
medication and 46.7 % (14 patients) received
neuroleptic for their tics prior the study. Twenty-
four patients (80%) of Tourette patients had motor
tics as a disturbing problem and vocal tics as a
problem found in 17 patients (56.7%). In Tourette
group, 1 girl and 20 boys (70%) had Attention
Deficit Hyperactivity Disorder. In control group, no
one had ADHD (Table 3). There was a significant
difference (p<0.05).
Table 1: Absolute and relative frequency distribution
based on ADHD co- morbidity situation and sex
Co- + - total morbidity
Table 3: Absolute and relative frequency distribution of
Tourette disorder patients based on ADHD co-morbidity
situation Affection + - total
situation/Group number % number % number %
control 0 0 30 100
study 21 70 9 30 30 100
total 21 70 9 30 60 100
Discussion
In this study boys to girls ratio was 5 to 1, similar to a
study in Sweden (their ratio was 6 to 1) (9), but
other studies reported higher ratios (10). Some
researches show this ratio is lower, approximately, 3 to
1 (11). This study has showed, 73.3% of children with
Tourette disorder referred to the other clinics. Base
on some studies from every 6 or 7 of patients, only
one patient referred for checkup (12-13) in the present
study. Among patients 63.1% of them were treated by
relative and appropriate medicine for their co-morbid
psychiatric disorders.
In this study boys with Tourette have higher co-
morbidity with ADHD and average ages in co-
morbid Tourette group was slightly lower than
Tourette patients. These findings are significant and
show that, at first all Tourette children must be
examined for ADHD and other co-morbidities.
Therefore every Tourette patient must be examined
for psychiatry co-morbid especially ADHD by
structural or semi structural interview. We showed
70% of our patients had Attention Deficit
Hyperactivity Disorder. In another study two thirds
of the Tourette, group met the clinical criteria of
ADHD. The degree of clinical impairment is more
strongly correlated with the attention deficits than
with the tic symptoms per se (14). Spencer showed
this result, as well (4). Clinically the findings
confirm other research results, indicating the
/Sex
Boy
Girl
number % number % number %
20 5 20 25 100
1 4 5 100
importance of ADHD in understanding the
behavioral problems that often associated with
Tourette syndrome. Additional ADHD co- total 21 70 9 30 30 100
Table 2: Source of referral in clinical cases of Tourette disorder
Source of referral number %
pediatrician 12 40
neurologist 7 23.3
School health officer 6 20
General practitioner 3 10
Parent without prior
morbidities should be considered in diagnosis,
management, training (15) and accurate prognostic
prediction in the course of illness or acquired
improvement (16), which may affect the patients‟
treatment process (17).
Limitation and Suggestions
Although present study performed in child referral
psychiatry clinic lasted one year, the sample size of consultation 2 6.7
present study was rather small, so there is a need for performing similar research in large groups in different clinics of Iran. The small sample size makes our findings‟ generalization less reliable.
64 Vol. 9 - Special Issue - Child Neuro Rehabilitation
References 1. Scahill L, Leckman JF. Tic disorders. In: Sadock BJ, Sadock VA. Comprehensive textbook of psychiatry, 18th Ed,
Philadelphia, Lippincott Williams & Wilkins; 2005, Vol .4, p: 3228-3235
2. Haerlet T. Children with Tourette syndrome: A parent's guide, 1st ed., Rockville, Woodbine; 2003, p: 16- 25 3. Tanner C, Goldman S. Epidemiology of Tourette syndrome, Neuro Clin 1997; 15:395-402 4. Spencer T, Biederman J, Coffey B, Geller D, Faraone S, and Wilens T. Tourette disorder and ADHD, Adv Neural, 2001; 85:57 5. Biederman J, Coffey BJ, Geller D. Distinguishing illness severity from tic severity in children and adolescents with Tourette disorder, Am Academic Child Adolescent Psychiatry, 2000, May; 39 (5): 556-61 6. Comings DE, C0mings BG: a controlled study of Tourette syndrome in; attention deficit disorder, Learning disorders, and school problems. AmJHumGenet 1987; 41:701-741 7. Kerbershian J, Burd L. Case study: co morbidity among Tourette syndrome, autistic disorder, and bipolar disorder, J Am Aca Child Adolesc Psychiatry 1996; 35:681 - 685 8. Kaplan & Sadock: Tourette disorder, 10th Ed, Synopsis of psychiatry, Philadelphia; Wolters Kluwer, Lippincott, Williams& Wilkins, 2007; p: 1235-1240 9. Larsson B, Frisk M. Social competence and emotional/behavior problems in 6-12 year old Swedish
Iranian Rehabilitation Journal
school children. Eur child Adolescent psychiatry 1999; 8:24- 33
10. Comings DE, Himes J. comings: an epidemiological study of Tourette syndrome in school district; Clin psychiatry 1990; 51:463-465 11. Burd L, kerbeshian J, WikenheiserM, fisher W: Prevalence study of Gilles de la Tourette syndrome in North Dakota school - age children; Am academy child psychiatry 1986; 25:552-3 12. Leckman JF, Peterson BS,Anderson GM, Arnsten AFT, Pauls DL, Cohen DJ. Pathogenesis of Tourette syndrome; Child Psycho Psychiatry 1997;38:119-142 13. Leckman JF, Zhang H, Vitale A. Course of Tic severity in Tourette syndrome: the first two decades. Pediatrics 1998; 14-19 14. Kadesjo B, Gillberg C. Tourett,s Disorder: Epidemiology and Comorbidity in primary school Children, J Am Acad Child Adolesc Psychiatry, 39:5, May 2000.P:548-549 15. Freeman RD. Tic disorders and ADHD: Answers from a world-wide clinical Database on Tourette syndrome. Eurppean child and adolescents psychiatry J, Vol 16.Sup1 15-23 DOI:10-1007/s00787-007-1003-7 16. Swain JE, Leckman JF. Tourette syndrome and tic disorders: Overview and practical guide to diagnosis and treatment, Psychiatry J, 2005, Jul;2(7):28-36 17. Coffey B, Park K. behavioral and emotional aspects of Tourette syndrome, Neuro clin, 1997; 15:277-289
18.
65
Iranian Rehabilitation Journal, Vol. 9, December 2011
Review
Hypertonicity in Children with Cerebral Palsy: a New Perspective
Mehdi Rassafiani, PhD Pediatric Neurorehabilitation Research Center, Department of Occupational Therapy, University of Social
Welfare and Rehabilitation Sciences, Tehran, Iran
Robab Sahaf*; MD, PhD Iranian Research Center on Aging, University of Social Welfare and Rehabilitation Sciences, Tehran, Iran
Objectives: Hypertonicity is a major problem in children with cerebral palsy that has not been explained
effectively to address clinical decision making. Therefore, this article aims to provide a theoretical framework about hypertonicity for clinicians, rehabilitation and medical practitioners to be used in their practice.
Methods: Literature was reviewed to examine the new perspectives towards the hypertonicity and its
signs and symptoms. Then, these symptoms were scrutinized to identify various aspects of the
phenomena.
Results: The results of this review revealed various components of hypertonicity, including neural and
biomechanical. Neural component was also classified into positive and negative symptoms. These
components altogether influence gross and fine motor function and consequently disturb children in their daily
activities.
Conclusion: Using term “spasticity” is not definitively enough to explain various aspects of the affected
persons. Therefore, the term “hypertonicity” appears to be much appropriate to be used by professions in their
daily practices. Furthermore, to have a very effective intervention, practitioners should consider all various signs
and symptoms of hypertonicity that are explained in this review.
Key words: Hypertonicity, Cerebral palsy, Children
Introduction
As individuals with cerebral palsy (CP) present a large
group of clients visited by occupational therapists,
understanding clinical decision making in this context is
very important. Moreover, the literature suggests that
both pathology and diagnosis can influence clinicians‟
data collection and clinical reasoning, therefore it is
necessary to understand these children in depth.
Hypertonicity is the most prevalent type of CP (85%)
and, therefore, clinical decision making occurs more
frequently for this type of diagnosis. Various factors may
influence clinical decision making including individual
(e.g., range of movement, amount of spasticity), familial
(e.g., family income) (1), and contextual factors (e.g.,
work place, hospital or school) (2). Research involving
therapists with various level of expertise demonstrated
that hypertonicity is the most important influential factor
on their decision making (3-5). Therefore, this review
aims to investigate the most prevalent type of CP - the
hypertonic (spastic) -including its neural and
biomechanical components. Prior to this review, CP will be
explained and its classification will be discussed.
*All correspondences to: E-mail:[email protected]
66
Cerebral Palsy Cerebral palsy is the most common cause of
movement disorders in children (6-8). As such,
people with CP constitute a major client group for
occupational therapists as both outpatients and those
receiving short and long term rehabilitation services
(9). CP is an umbrella term, used to describe a group
of non-progressive, but often changing, motor
impairment syndromes secondary to lesions or
anomalies of the brain, arising in the early stages of
its development (10). CP is a lifelong condition (11),
usually associated with various other disabling
abnormalities including: seizures, learning
disabilities, communication and intellectual
impairments, behavioural problems, feeding, visual,
speech and hearing difficulties, as well as sensory
impairments (6, 12-15). The severity of CP varies
from person to person and constitutes a continuum.
At one end of the continuum all muscles and body
movements are severely affected (16), making the
person functionally dependent. At the other end, the
influence of the disorder is minimal and only mild
neurological signs are evident.
Vol. 9 - Special Issue - Child Neuro Rehabilitation
Classification of children with CP Cerebral palsy is most commonly classified
according to: (1) central control and area of brain
involvement; (2) functional motor abilities; (3)
nature and typology of motor disorder; and (4)
anatomic distribution (17). The area of central
control involves selective and automatic processes
(18). Selective control refers to the pyramidal tracts
in the central nervous system (CNS) that control
selective movements and its lesions causes spasticity.
Automatic control is ruled by extrapyramidal tracts and
their lesions results in athetosis and ataxia. Damage to
both tracts can cause a mixed presentation.
Classification on the basis of functional motor
abilities aims to address the importance of evaluating the
functional consequences of disabilities emphasised
by the World Health Organization International
Classification of Functioning, Disability and Health
(ICF) (19). Two scales of objective function for
upper and lower limb have been recently developed:
the Manual Ability Classification System (MACS)
and the Gross Motor Function Classification System
(GMFCS). MACS aims to classify children with CP
on the basis of how to use their hands when
manipulating objects in daily activities and rank
them into five levels on the basis of proficiency (20).
The GMFCS is based on the concepts of abilities
and limitations in gross motor functions. This
classification is a reliable and valid system and
similar to MACS classifies children with CP based
on their age specific gross motor activity into five
levels (21).
Involuntary movement disorders and tonality
abnormalities provide the third concept for
classification of CP (22). Tone is described as
spastic (hypertonic), hypotonic, ataxic, athetoid,
and/or mixed. Involuntary movement disorder is
defined as any involuntary and uncontrolled
movement that appears in the affected part of body.
Muscle tone refers to the amount of resistance felt
against passive movement, while an individual is
attempting to be relaxed (23). This resistance is
produced by neural and biomechanical mechanisms
(24). Neural factors refer to the amount of
contraction that is present naturally in the muscles as
a result of tonic stretch reflex (24, 25).
Biomechanical factors include physical inertia of the
extremity as well as the elastic properties of tissues,
joints, blood vessels, muscles etc (25, 26). Any
resistance present in a relaxed person is mostly
biomechanical and only some is related to neural
factors (26).
Iranian Rehabilitation Journal
The last classification of CP is based on anatomic
distribution (22) that is traditionally called
topography. This refers to the pattern and extent of
motor involvement (27) regarding different anatomic
areas including all body regions (i.e., trunk and
limbs) (22). Such a classification can therefore be
referred to as monoplegia in which one limb is
affected (usually one arm); hemiplegia when one side of the body is affected (left or right side);
diplegia where both upper and lower limbs are
affected, but lower limbs are affected more severely
than upper limbs; and quadriplegia where all limbs
are affected (27).
Both the nature and typology of motor disorder and its
anatomic distribution are usually employed to
describe a person with CP, however, there is
disagreement in sub-classifications, for example,
between those used in Europe and Sweden. The
European classification (28) was introduced by
different teams from European countries in which
CP was classified into three types: spastic, ataxic,
and dyskinetic. Although this classification tries to
distinguish and define different types of CP based on
affected areas, it does not completely addresses the
impact of CP in terms the number of limbs involved
or the extent to which they are affected (i.e., diplegic
versus quadriplegia).
Hypertonicity Hypertonicity (spasticity) is the most prevalent
estimated as high as 85% of CPcases, in Europe and
Australia, and 94% in Northern Ireland (6, 29, 30).
For the purpose of this article the term
„hypertonicity‟ will be used, because it is an
umbrella term which subsumes a number of signs
and symptoms consistent with central nervous
system (CNS) lesions. These signs and symptoms
usually occur together and seem to influence each
other during task performance, for example when a
person with hemiplegia wants to reach out to grasp a
glass of water, she/he may experience resistance
against the initial starting movement caused by
spastic dystonia affecting the upper limb in a flexor
pattern. When the movement starts, the agonist
muscles trigger antagonist stretch reflexes and
therefore, spasticity develops (e.g., elbow extension
triggers stretch reflex in elbow flexors causing
spasticity). Associated reactions may also occur in
the other affected limbs. The clasp knife phenomenon
(i.e., sudden muscle relaxation following initial
resistance to movement in spastic muscles)
manifests during movement usually at the end range.
67
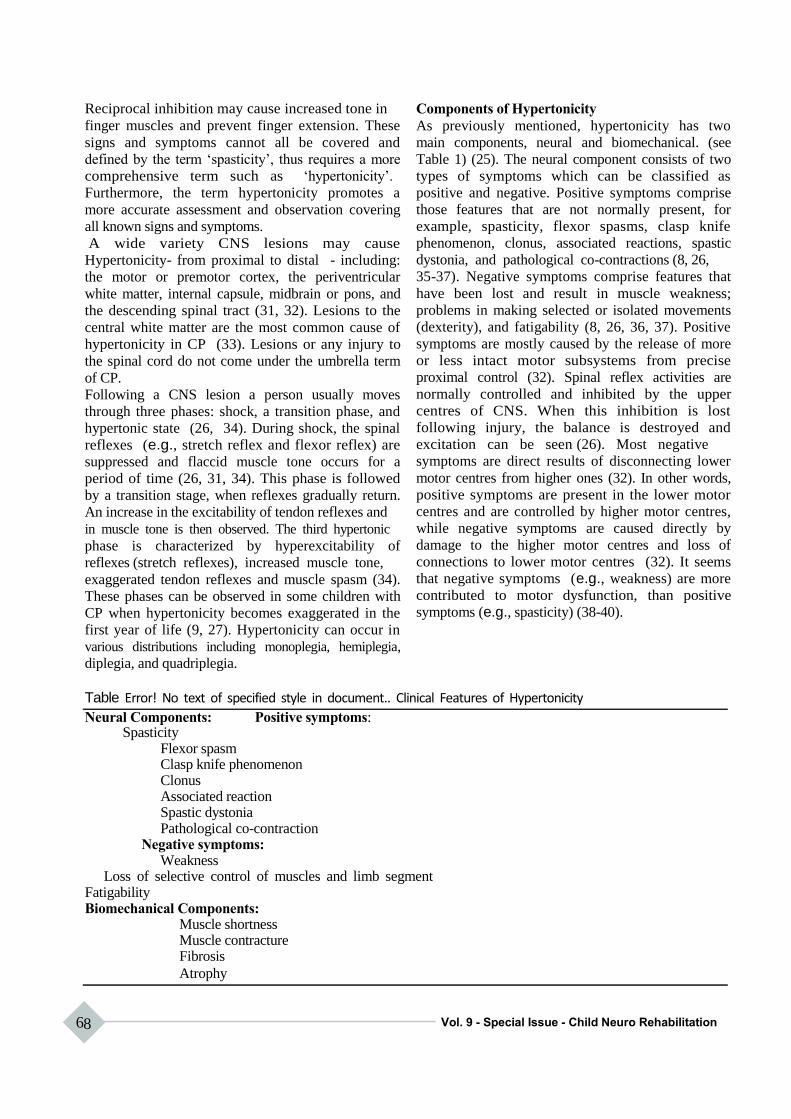
Reciprocal inhibition may cause increased tone in
finger muscles and prevent finger extension. These
signs and symptoms cannot all be covered and
defined by the term „spasticity‟, thus requires a more
comprehensive term such as „hypertonicity‟.
Furthermore, the term hypertonicity promotes a
more accurate assessment and observation covering
all known signs and symptoms.
A wide variety CNS lesions may cause
Hypertonicity- from proximal to distal - including:
the motor or premotor cortex, the periventricular
white matter, internal capsule, midbrain or pons, and
the descending spinal tract (31, 32). Lesions to the
central white matter are the most common cause of
hypertonicity in CP (33). Lesions or any injury to
the spinal cord do not come under the umbrella term
of CP.
Following a CNS lesion a person usually moves
through three phases: shock, a transition phase, and
hypertonic state (26, 34). During shock, the spinal
reflexes (e.g., stretch reflex and flexor reflex) are
suppressed and flaccid muscle tone occurs for a
period of time (26, 31, 34). This phase is followed
by a transition stage, when reflexes gradually return.
An increase in the excitability of tendon reflexes and
in muscle tone is then observed. The third hypertonic
phase is characterized by hyperexcitability of
reflexes (stretch reflexes), increased muscle tone,
exaggerated tendon reflexes and muscle spasm (34).
These phases can be observed in some children with
CP when hypertonicity becomes exaggerated in the
first year of life (9, 27). Hypertonicity can occur in
various distributions including monoplegia, hemiplegia,
diplegia, and quadriplegia.
Components of Hypertonicity
As previously mentioned, hypertonicity has two
main components, neural and biomechanical. (see
Table 1) (25). The neural component consists of two
types of symptoms which can be classified as
positive and negative. Positive symptoms comprise
those features that are not normally present, for
example, spasticity, flexor spasms, clasp knife
phenomenon, clonus, associated reactions, spastic
dystonia, and pathological co-contractions (8, 26,
35-37). Negative symptoms comprise features that
have been lost and result in muscle weakness;
problems in making selected or isolated movements
(dexterity), and fatigability (8, 26, 36, 37). Positive
symptoms are mostly caused by the release of more
or less intact motor subsystems from precise
proximal control (32). Spinal reflex activities are
normally controlled and inhibited by the upper
centres of CNS. When this inhibition is lost
following injury, the balance is destroyed and
excitation can be seen (26). Most negative
symptoms are direct results of disconnecting lower
motor centres from higher ones (32). In other words,
positive symptoms are present in the lower motor
centres and are controlled by higher motor centres,
while negative symptoms are caused directly by
damage to the higher motor centres and loss of
connections to lower motor centres (32). It seems
that negative symptoms (e.g., weakness) are more
contributed to motor dysfunction, than positive
symptoms (e.g., spasticity) (38-40).
Table Error! No text of specified style in document.. Clinical Features of Hypertonicity
Neural Components: Positive symptoms: Spasticity
Flexor spasm Clasp knife phenomenon Clonus Associated reaction Spastic dystonia Pathological co-contraction
Negative symptoms: Weakness
Loss of selective control of muscles and limb segment Fatigability Biomechanical Components:
Muscle shortness Muscle contracture Fibrosis
Atrophy
68 Vol. 9 - Special Issue - Child Neuro Rehabilitation
Based on Barens, 2001; Burke, 1988; Katz &Rymer,
1989; Mayer, 1997; O‟Dwyer et al., 1996; Sanger,
2003b; Sheean, 2002; Young, 1989.
The biomechanical components of hypertonicity
include shortness occurring in soft tissues, muscles,
joints, and blood vessels as well as contractures
causing limitation in passive range of motion (26,
36). There is also restriction of passive and active
range of motion. The inertia of the limb that
produces resistance in normal muscle tone does not
change in hypertonicity(25). The different
components (i.e., neural and biomechanical) of hypertonicity will now be addressed.
Spasticity is defined as a problem in muscle tone
due to a velocity-dependent increase in tonic stretch
reflexes. Velocity-dependence refers to the speed of
the stretch impacting on resistance resulting in
greater stretch reflex activity. The tonic stretch
reflex is a sustained muscle stretch, and has a long-
term response, rather than a phasic one, similar to a
tendon reflex (26). Spasticity is mediated by Ia
afferent fibres situated in muscle spindles. Any
stretch to Ia causes muscle contraction via the spinal
cord. Spasticity is also length-dependent which
means that the excitability of the tonic stretch reflex
depends on the length of the muscle which is being
stretched (26), The shorter the muscle, the greater
the resistance.
Flexor spasm is another type of positive symptoms
resulting from the dis-inhibited normal “flexor
withdrawal reflex” that shows itself in a flexor
pattern (26). Flexor withdrawal reflex is a
nociceptive reflex normally elicited in response to a
painful stimulus and resulting in a withdrawal
reaction. This reaction helps a person to protect
his/her body against harmful situations such as a
sharp object. In the presence of an upper motor
neuron lesion, this reflex becomes exaggerated
resulting in a flexor pattern in upper limb (26).
Clasp knife phenomenon accompanies spasticity
and is characterized by sudden muscle relaxation
following initial resistance to passive movement
around a joint. The underlying mechanism is
different from spasticity. Because spasticity is
length-dependent, in stretching the spastic muscle,
the tonic stretch reflex is greater when the muscle is
short. As the stretch is continued and the muscle
lengthens, the excitability of the tonic stretch reflex
reduces. At the same time, the resistance to the
stretch slows movement, and it reduces the spasticity
due to the velocity-dependent mechanism. The
Iranian Rehabilitation Journal
combination of velocity-dependent and length-
dependent mechanisms lead to a point where the
stretch is so slow and the muscle so long that it
results in a reduction of the excitability of the tonic
stretch reflex to such an extent that resistance
suddenly disappears (26).
Spastic dystonia is a sustained (tonic) flexor posture
that can affect elbow, fingers and wrist flexors and
leg extensors. Hemiplegic posture is one example of
spastic dystonia in which the person stands or walks
while her/his arm is in high flexion and leg in
increased extension. The mechanism underlying
spastic dystonia is not clear. It seems to come from a
supraspinal drive to the alpha motor neurones (26).
The dis-inhibition of vestibulospinal tract may cause
spastic dystonia, because one of the responsibilities
of the vestibulospinal tract is the maintenance of
antigravity muscles (i.e., the extensor muscle group
in the lower limb and flexor muscle group in the
upper limb) (41).
Associated reactions occur when there is an
increase in spasticity in involved areas when a
person with hypertonicity attempts to do a task
(voluntary movement). The greater the effort, the
more exaggeration of the response of the associated
reaction (26). It may manifest in an exaggerated
flexor pattern in the left affected arm and extensor
pattern in the left affected leg, for example, when the
person tries to comb his/her hair with the sound right
hand. Associated reactions are not due to any stretch
or nociceptive reflex, but appear to be the result of
tonic efferent drive to the alpha motor neurons of
muscles (26).
Pathological reciprocal inhibition: Reciprocal
inhibition occurs normally in groups of muscles in
two ways. First, when agonist muscles contract, their
antagonist muscles relax simultaneously to allow a
smooth movement to occur (26) (for example, in
reaching out elbow extensors contract and inhibit
elbow flexors). Second, in some circumstances, both
flexor and extensor muscles work together to fix the
joint for a movement (26), such as, fixing elbow and
wrist during writing.
Reciprocal inhibition may be disordered in two
ways. It may be reduced leading to inappropriate co-
contraction. For example, during elbow extension,
flexors are not inhibited and oppose the movement.
This may be explained by two mechanisms: the
triggering of the tonic stretch reflex and/or out-of-
phase activation of antagonists (in the previous
example, elbow flexors) (26, 36). Excessive
69

reciprocal inhibition is the second type of disorder in
which weakness of antagonists may occur, e.g., excessive inhibition of muscle elbow extensors by
the elbow flexors may cause weakness in the
extensors (36).
Negative symptoms caused by upper motor neuron
(UMN) lesions in hypertonicity may include
weakness that is characterized by an inability to
generate force adequately, and slow movement (8,
26, 36). Two problems in the motor units may
contribute to weakness. First, an inability to recruit
sufficient motor units and difficulties sustaining
their discharge rate (Hoefer, & Putnam, 1940 cited
in Mayer, 1997). Secondly, an inability to orderly
recruit and modulate motoneurons within a given
motoneuron pool can lead to insufficient muscle
activation (25). Another negative sign is impairment in
making selected or isolated movements across
specific joints (36). Clients with hypertonicity
usually show stereotypic whole limb movements in
which they demonstrate mass flexor or extensor
patterns. The last negative symptom is fatigability
(32, 42) resulting from inefficient muscle activation
due to loss of orderly recruitment and rate
modulation of motoneurons (25).
Biomechanical changes in muscles may be largely
responsible for hypertonicity (25) and may
contribute to resistance to passive movements more
than tonic stretch reflexes (37). Biomechanical
changes involve muscle contracture and shortening
in soft tissue. Contracture is defined as an increased
resistance to passive stretch due to shortening of
muscle length resulting from a decrease in the
number of sarcomeres in series along the myofibrils
(43). Contractures in children with hypertonicity
may happen over time through three mechanisms.
Firstly, a cerebral lesion, associated with paresis,
causes a transformation of motor units resulting
most probably in shortening of muscle fibres leading
to contracture (44). Muscle and soft tissue changes
compensate for the loss of supraspinal drive and
contribute essentially to hypertonicity in both active
and passive movements (45). Secondly, the limited
and stereotypical movements as well as weakness
typical for most people with hypertonicity tends to
result in shortening of muscle fibres, a reduced range
of movement, and the onset of contractures, as they
get older (26, 36, 46). Thirdly, when a CNS lesion
70
occurs in childhood, the race between bone and
muscle growth in the child may accelerate
development of more contractures and deformities
(47). The presence of soft tissue changes apart from
contractures is controversial, requiring further
research. While some believe that degenerative
changes (fibrosis) and muscle atrophy may also
occur following hypertonicity (25, 36), others argue
that it results from shortening in muscle fibres rather
than atrophy and fibrosis (48).
The development of contractures in CP appears to
progress through three stages. First, deformities are
flexible and reversible. This occurs typically in the
younger child with hypertonicity. In the second
stage, contractures become fixed and may require
surgical intervention. In the third stage, in addition
to contractures, there are changes in the structure of
bones and joints (7).
In the assessment of a client with recent onset of
hypertonicity (before the onset of shortness and
contracture), the abnormal resistance against passive
movement is the result of reflexes and neural
activities. However, in chronic hypertonicity, both
neural and biomechanical components may provide
resistance against passive movement. In other
words, resistance felt by clinicians is generated by
reflex activity and abnormal properties of muscle
and other soft tissues (36). In active movements,
nevertheless, it is very difficult to distinguish
clinically between the contribution of abnormal
neuronal and biomechanical components (36).
Electromyographic (EMG) and biomechanical
recordings show that overall muscle activity is
reduced during functional movements in muscles
with hypertonicity (45). Therefore, the influence of
the signs and symptoms of hypertonicity on active
and passive movements differs requiring more
investigation for effective treatment.
Biomechanical components as well as positive and
negative symptoms may affect the movement
activities (movement dysfunction) of a person with
hypertonicity (26, 36, 39, 46), resulting in
limitations in occupational performance (i.e., activities of daily living, work and school activities,
play, and recreational activities). Figure 1 illustrates
the interactions between positive and negative
symptoms, and biomechanical components
contributing to occupational performance.
Vol. 9 - Special Issue - Child Neuro Rehabilitation

Upper Motor Neuron
Lesion
Non-CNS factors (e.g.
Hypertonicity
Neural component Altered muscle function (e.g.,
prolonged shortening)
Positive Symptoms:
Dynamic: Negative symptoms:
Spasm Weakness
Co-contraction Lack of selective control
Clonus of muscles
Associated reaction Fatigability
Flexor withdrawal
Static:
Spasticity
Spastic dystonia
Movement dysfunction
Limitation in occupational performance
areas including self-care (activities of daily
living), work, play and recreational activities
immobilization)
Biomechanical component:
altered passive mechanical
properties, shortness in soft
tissue, blood vessels,
contracture
Figure 1. Interaction and relationship among positive and negative neural
symptoms, and biomechanical components.
Iranian Rehabilitation Journal 71
Clinical Manifestations of Hypertonicity
When hypertonicity occurs, there are accompanying
abnormalities in patterns of motor behaviour
observed throughout the body in both gross and fine
movements. Persistent and exaggerated postural
reflexes such as tonic neck reflexes, asymmetrical
and symmetrical tonic neck reflexes cause the
development of abnormal movement patterns
resulting in difficulties in maintaining the body in
space, and restricting active and passive movements
(17). Righting and equilibrium reactions might also
be poor in people with hypertonicity and limit active
movement patterns and upright positions.
Consequently, movement and function of the upper
limbs are affected and can impact on the
performance of everyday tasks.
Gross movement in children with hypertonicity and
CP might be affected in two ways. First,
hypertonicity may cause delays in the attainment of
gross movement milestones compared with normal
children. The rate of delay depends on the severity
of hypertonicity, the more severe, the greater the
delay. Secondly, presence of abnormal patterns of
movement and posture in people with hypertonicity
can make this problem worse. Abnormal patterns of
movement and posture manifest in all developmental
milestones such as rolling over, creeping, crawling,
sitting, standing up, and walking.
Postural reflexes such as asymmetrical and
symmetrical tonic neck reflexes, and tonic
labyrinthine reflexes (supine and prone) are essential
to normal child development (49). For example, the
asymmetrical tonic neck reflex normally helps a
child to develop eye-hand coordination by bringing
the hand towards the midline. However, these
reflexes in a child with hypertonicity may be
exaggerated thereby hampering developmental
progress (49). In this situation, the asymmetrical
tonic neck reflex may cause asymmetry in the body,
prevent arms coming to midline, and restrict
movement such as rolling from supine to prone. In
another example, the tonic labyrinthine reflex may
increase extensor tone in the trunk during sitting up
from the supine position and provide excessive
resistance against flexion. Exaggerated postural
reflexes may also impede the maintenance of the
body in space. In an upright position such as sitting,
the tonic labyrinthine reflex may decrease balance
and stability. Therefore, as the child moves his/her
head, this reflex is activated resulting in loss of
72
balance. All problems in gross movements and
maintaining position interfere with a child‟s ability to
carry out activities of daily living, playing and
school work.
Upper limb function is also affected by
hypertonicity. The upper limbs are important for the
performance of daily tasks. With the help of hands
and arms, a person is able to reach out, grasp,
manipulate, transfer and release objects. People
accomplish activities of daily living such as
dressing, feeding, toilet, and showering by using
their arms and hands. Moreover, hands provide the
means whereby human beings manipulate their
environment. Hands have a main role in every
aspects of motor, social, language, and cognitive
development (50). The contribution of the hands to
development starts even before birth, e.g. , by
grasping and releasing the umbilical cord, and
sucking the thumb (Milani-Comparetti, 1980 cited in
Erhardt) and continues after birth.
Hypertonicity imposes abnormal patterns on the
upper limbs, causing limitation in range of
movement and speed and resulting in excessive
efforts in the performance of tasks (50). Different
patterns may be observed in the upper limbs of
people with hypertonicity, but the most prevalent
one is the antigravity pattern (51), that is, scapular
protraction and depression, shoulder adduction and
internal rotation, elbow flexion, forearm pronation,
wrist flexion and ulnar deviation, thumb adduction
and flexion, and finger flexion.
Impaired upper limb function also interferes with
gross motor development and impacts on actions
such as rolling over, creeping, and crawling. For
example, because children with hypertonicity have
limited hand function (e.g., by holding walking aide)
they are not able to facilitate standing and walking.
These limitations result in a delay in attaining
developmental milestones.
Conclusion
Hypertonicity includes two neural and
biomechanical components resulting in abnormal
movement patterns in both gross motor function and
manual abilities in the children with CP;
consequently, these children experience problems in
their all activities of daily living. Focusing on all
aspects of the hypertonicity will surely help to
decide better for these children and have better
results.
Vol. 9 - Special Issue - Child Neuro Rehabilitation

References 1. Rassafiani M, Ziviani J, Rodger S, Dalgleish L. Managing
upper limb hypertonicity: Factors influencing therapists'
decisions. The British Journal of Occupational Therapy,
2006;69(8):373-8.
2. Rassafiani M, Ziviani J, Rodger S. Occupational therapists'
decision making in three therapy settings in Australia. Asian
Journal of Occupational Therapy2006;5(1):29-39. 3. Burgess T, Rassafiani M, Copley J. Factors associated with
the acquisition of expertise in upper limb hypertonicity
management. The British Journal of Occupational
Therapy2008;71(8):329-38.
4. Rassafiani M, Ziviani J, Rodger S, Dalgleish L.
Occupational therapists' decision-making in the management of
clients with upper limb hypertonicity. Scand J Occup
Ther2008 Jun;15(2):105-15.
5. Rassafiani M, Ziviani J, Rodger S, Dalgleish L.
Identification of occupational therapy clinical expertise:
Decision-making characteristics. Australian Occupational
Therapy Journal2009;56(3):156-66.
6. Parkes J, Dolk H, Hill N, Pattenden S. Cerebral palsy in Northern Ireland: 1981-93. Paediatric and Perinatal
Epidemiology2001;15:278-86. 7. Pirpiris M, Graham HK. Management of spasticity in
children. In: Barnes MP, Johnson GR, editors. Upper motor neurone syndrome and spasticity: Clinical management and neurophysiology. Cambridge: Cambridge University Press;
2001. p. 266-305.
8. Sanger TD. Pathophysiology of pediatric movement
disorders. Journal of Child Neurology2003;18(Suppl 1):s9-
s24. 9. Dudgeon BJ. Pediatric rehabilitation. In: Case-Smith J,
editor. Occupational therapy for children. 4th ed. St Louis: Mosby; 2001. p. 843-63.
10. Mutch L, Alberman E, Hagber B, Kodama K, Perat MV.
Cerebral palsy epidemiology: Where have we been and where are we going? Developmental Medicine and Child
Neurology1992;34:547-51.
11. Lowes LP. Evaluation of standing balance of children with cerebral palsy and the tools for assessment [PhD
Dissertation]. MI: Allegheny University of the Health Sciences; 1997.
12. Cerebral Palsy Associations of Canada. Cerebral Palsy Q & A. 2003 [cited 2003 13-12]; Available from:
http://www.cerebalpalsycanada.com/q&a.htm.
13. Hagberg B, Hagberg G, Olow I, von Wendt L. The changing
panorama of cerebral palsy in Sweden. Acta Paediatrica
Scandinavica1989;78:283-90.
14. Odding E, Roebroeck M, Stam H. The epidemiology of
cerebral palsy: incidence, impairments and risk factors.
Disability & Rehabilitation2006;28(4):183-91.
15. Pellegrine L. Cerebral palsy. In: Batshaw ML, editor. Children with disabilities. 4th ed. Baltimore: Brookes; 1997.
p. 499- 528.
16. Badawi N, Watson L, Petterson B, Blair E, Slee J, Haan E, et al. What constitutes cerebral palsy? Developmental
Medicine and Child Neurology1998;40:520-7.
17. Scherzer AL. History, definition, and classification of cerebral palsy. In: Scherzer AL, editor. Early diagnosis and
interventional therapy in cerebral palsy: An interdisciplinary
age-focused approach. NY: Marcel Dekke; 2001. p. 1-25. 18. Gage JR. Clinics in Developmental Medicine NO. 121: Gait
analysis in cerebral palsy. London: Mac Keith Press; 1991.
Iranian Rehabilitation Journal
19. World Health Organization. International classification of
impairments, Disability and health. Geneva: World Health
Organization; 2001.
20. Eliasson A, Krumlinde-Sundholm L, Rsِblad B, Beckung E, Arner M, ضhrvall A, et al. The Manual Ability Classification
System (MACS) for children with cerebral palsy: scale
development and evidence of validity and reliability.
Developmental Medicine & Child
Neurology2006;48(7):549-54.
21. Palisano R, Rosenbaum P, Walter S, Russell D, Wood E,
Galuppi B. Development and reliability of a system to
classify gross motor function in children with cerebral palsy.
Developmental Medicine & Child Neurology1997;39(4):214-23.
22. Bax M, Goldstein M, Rosenbaum P, Leviton A, Paneth N,
Dan B, et al. Proposed definition and classification of
cerebral palsy, April 2005. Developmental Medicine & Child Neurology2005;47(08):571-6.
23. Lance JW. Control of muscle tone, reflexes, and movement: Robert Wartenberg Lecture. Neurology1980;30:1303-13.
24. Powers RK, Campbell DL, Rymer W. Stretch reflex
dynamics in spastic elbow flexor muscles. Annals of
Neurology1989;25:32-42.
25. Katz RT, Rymer WZ. Spastic hypertonia: Mechanisms and
measurement. Archives of Physical Medicine and
Rehabilitation1989;70:144-55.
26. Sheean GL. The pathophysiology of spasticity. European
Journal of Neurology2002;Supplementary 1:3-9.
27. Ratliffe KT. Clinical pediatric physical therapy: A guide for
the physical therapy team. Philadelphia: Mosby; 1998.
28. Surveillance of Cerebral Palsy in Europe. Surveillance of
Cerebral Palsy in Europe: A collaboration of cerebral palsy
surveys and registers. Developmental Medicine and Child
Neurology2000;42:816-24.
29. Stanley F, Watson L. Trends in perinatal mortality and
cerebral palsy in Western Australia, 1967 to 1985. British Medical Journal1992;304(6843):1658-63.
30. Surveillance of Cerebral Palsy in Europe. Prevalence and
characteristics of children with cerebral palsy in Europe.
Developmental Medicine and Child Neurology2002;44:633-
40.
31. Sanger TD. Pediatric movement disorders. Current Opinion
in Neurology2003;16:529-35.
32. Young RR. Spasticity: A review. Neurology 1994; 44
(supplementary 9):S12-S20.
33. Back SA, Han AH, Luo NL, Chricton CA, Xanthoudakis S,
Tam J, et al. Selective vulnerability of late oligodendrocyte progenitors to hypoxia- ischemia. The Journal of
Neuroscience2002;22(2):455-63.
34. Hiersemenzel L, Curt A, Dietz V. From spinal shock to
spasticity: Neuronal adaptations to a spinal cord injury.
Neurology2000;54(8):1574-82.
35. Gans BM, Glenn MB. Introduction. In: Glenn MB, Whyte J, editors. The practical management of spasticity in children
and adults. Philadelphia: Lea & Febiger; 1982. p. 1-7.
36. Mayer NH. Clinicophysiological concepts of spasticity and
motor dysfunction in adults with upper motoneuron lesion.
Muscle & Nerve1997;Supplement 6:S1-S13.
37. O'Dwyer NJ, Ada L, Neilson PD. Spasticity and muscle contracture following stroke. Brain1996;119:1737-49.
38. Burke D. Spasticity as an adaptation to pyramidal tract injury. Advances in Neurology1988;47:401-23.
39. O'Dwyer NJ, Ada L. Reflex hyperexcitability and muscle
73
contracture in relation to spastic hypertonia. Current Opinion in Neurology1996;9:451-5.
40. Sheean GL. Botulinum treatment of spasticity: Why is it so difficult to show a functional benefit? Current Opinion in
Neurology2001;14:771-6. 41. Dewald JP, Pope PS, Given JD, Buchanan T, Rymer W.
Abnormal muscle coactivation patterns during isometric torque generation at the elbow and shoulder in hemiparetic
subjects. Brain1995;118(Pt 2):495-510. 42. Sanger TD, Delgado MR, Gaedler-Spira D, Hallett M, Mink
JW. Classification and definition of disorders causing
hypertonia in childhood. Pediatrics2003;111(1):e89-e97.
43. O'Dwyer NJ, Neilson PD, Nash J. Mechanisms of muscle
growth related to muscle contracture in cerebral palsy.
Developmental Medicine and Child Neurology1989;31:543- 7.
44. Dietz V. Supraspinal pathways and the development of muscle-tone dysregulation. Developmental Medicine and
Child Neurology1999;41:708-15.
45. Dietz V. Spastic movement disorder: What is the impact of
research on clinical practice? Journal of Neurology, Neurosurgery, and Psychiatry2003;74:820-1.
46. Hanna SE, Law MC, Rosenbaum PL, KIng GA, Walter SD,
74
Pollock N, et al. Development of hand function among
children with cerebral palsy: Growth curve analysis for ages
16 to 70 months. Developmental Medicine and Child Neurology2003;45:448-55.
47. Boyd RN, Morris ME, Graham HK. Management of upper
limb dysfunction in children with cerebral palsy: A
systematic review. European Journal of Neurology2001;8(Suppl. 5):150-66.
48. Tardieu C, Huet de la Tour E, Bret MD, Tardieu G. Muscle hyperextensibility in children with cerebral palsy: I. Clinical
and experimental observations. Archives of Physical
Medicine and Rehabilitation1982;63:97-102.
49. Fiorentino MR. A basis for sensorimotor development-
normal and abnormal : The influence of primitive, postural reflexes on the development and distribution of tone.
Springfield: Thomas; 1981.
50. Erhardt RP. Developmental hand dysfunction: Theory, assessment, and treatment. 2nd ed. Tucson, AZ: Therapy
Skill Builders; 1994.
51. Colangelo C. Biomechanical frame of reference. In: Kramer
P, Hinojosa J, editors. Frames of reference for pediatric
occupational therapy. 2nd ed. Philadelphia: Williams &
Wilkins; 1999. p. 257-322.
Vol. 9 - Special Issue - Child Neuro Rehabilitation
Iranian Rehabilitation Journal, Vol. 9, December 2011
Case Report
A Case Report of Bilateral Upper Extremities Arthrogryposis
Amin Shahrokhi, MD; Masoud Gharib*, MSc Pediatric Neurorehabilitation Research Center, University of Social Welfare & Rehabilitation Sciences,
Tehran, Iran
Vahid Rashedi, MSc Faculty of Rehabilitation Sciences, Hamedan University of Medical Sciences & Health Services
Mohammad Reza Kooshesh, MSc Pediatric Neurorehabilitation Research Center, University of Social Welfare & Rehabilitation Sciences,
Tehran, Iran
Arthrogriposis is a disorder in which two or more joints in more than one limb of body, place in a stable
position and malformation status that usually is the result of joints' immobilization during fetal period.
Problems resulting from this congenital deficit can occur in difference places, in upper and lower limbs,
trunk, and even in face. It occurs in 3 of 1000 births, in two-third of these patients, all four limbs suffer
and one-third of patients suffer in lower limbs and it rarely occurs in upper limbs. In this case affected
children and their parents try different treatment such as surgical and non-surgical treatments which are of
argument and controversial even among specialists of these treatments. In this paper, a 3-year old boy has
been introduced who suffers from congenital deficit with developmental disorder in upper extremity
bones and the absence of flexor muscles group and extensor of wrist. The boy was sent to Bahar
Rehabilitation Center for occupational therapy and rehabilitation services by physician of rehabilitation
clinic in Tehran.
Key words: Arthrogryposis, Upper extremity, Rehabilitation
Introduction
Arthrogryposis Multiple Congenital is one of the
congenital defects that has been observed during
birth, the exact cause of this has not been still known
but variety of causes like decrease of foetus
movement, damage to anterior horn of spinal cord,
genetic reasons, lack of amniotic liquid, unnatural
growth of connective tissue, viral or bacterial
infections and endocrine disorders etc. can be
effective in this disorder (1, 2).
Usually the joints are involved bilaterally. In
general, this disorder can be divided into two
groups: neurological and non-neurological. First
group includes central and peripheral nervous
system disorders and the second group includes
rheumatologic disorders and movement limitations
(2).
Classic arthrogryposis or amyopalsia was first
suggested by Shlordane in 1932. This disorder is due
to lack of muscles groups and occurs because of
muscles replacement which happens by fibrous or
fat tissue. The most prevail type of this disorder
involves both lower and upper limb joints and rarely *All correspondences to: E-mail: [email protected]
Iranian Rehabilitation Journal
involves upper extremity isolatedly; it occurs 1 to 5
in l0000 births (3).
Clinical manifestations in upper extremity has more
affected by elbow joint that could be in flexion and
extension positions. In the first case because of
flexion in child‟s elbow joint, he/she can use his/her
hand to reach his/her mouth and face for hygiene or
eating, but in the second case which is more
important, elbow extends, arm bone and forearm
rotate internally and wrist is inflexed which is called
"waiter's hand" (4, 5) .
The only advantage of this shape of the hand is in
hygiene of genital area. In this case the child is
unable to bend elbow joint to eat or brush his teeth.
These children usually have delayed movement
growth such as crawling, and getting up from ground
and walking. Usually they move from one place to
another place with the help of upper extremity when
their buttock is on the ground, because in this
condition their dorsal of the hand is on the ground,
the extent of motion increases and also increases the
lumbar lordosis. Usually in these children upper
extremity is shorter than should be in normal case.
Treatment of these children depends on the present
75
circumstances including the range of motion,
situation and the power of upper extremity muscles.
The final goal in treatment of these patients is to
help them being able to eat and do their face and
genital area hygiene (8-9).
The main current surgical option for these children
is elbow capsulotomy and triceps release. This
operation is usually for bending elbow joint in a
passive way and if we want to bend the elbow in an
active way, we must transfer one of the triceps,
pectoralis major, wrist and fingers flexors and
latisimus dorsi in addition to what has been
mentioned. In order to transfer of each of the
mentioned parts, there are different ideas among
muscle surgeons. Such transfers also depend on rang
of motions of the shoulder and elbow and wrist and
the most crucial item is the power of the muscle
which has been transferred (9-11).
In treatment of these children, it is necessary to
know that treatment of each person is unique and is
based on the extent of limitation of upper extremity
and the level of independence in basic activities that is
vital for the person.
All rehabilitation team members including
physicians, therapists, orthopedic surgeons,
psychologists and so on must be well informed
about their crucial role in patient management and
counseling and explaining the treatment options and
each option advantages or disadvantages.
The involved team including psychologist,
occupational therapist, physiotherapist, orthopedic
surgeons, technical orthopedic must work together
and explain to parents the ways of treatment.
Rehabilitation team has a key role before and after
the surgery.
In order to improve the range of motion and muscle
reinforcement, occupational therapist and
physiotherapist should use support traction exercise,
manipulation, warming, serial casting and
hydrotherapy prior to surgery. To increase function
and maintain the range of motion, technical
orthopedics should make suitable splint or orthosis
considering the patient conditions as well.
Occupational therapist can also have a very
important role in designing and using equipments to
make daily activity of patients independent. After
the operation, rehabilitations are very important.
Orthosis-prothesis prescriptions must be
accompanied with a complete assessment and should
be continued to six months after operation. By
active/passive movement of uncasted joints we must
stop the stiffness of joints during non-movement
76
period. Muscle exercise should be the priority of
rehabilitation exercises, if muscle transfer happens
(12-13).
Because this disease is rare and therapists have little
information about it, such patients have many
problems (in addition to psychosomatic and physical
disorders) the different kinds of treatment for these
patients, cause stress and confusion for their parents.
Rehabilitation treatment is a crucial and effective
part of treatment both before and after the surgery.
Thus, knowing the disease and the role of therapists
are the most important factors in the treatment of
affected persons.
Case report
The patient was a 3-year old boy whom was
recognized as having the bilateral upper extremity
due to arthrogryposis. To improve the range of
motion and to reinforce the daily activity training by
therapist recommendation, he came to Bahar
Rehabilitation Clinic in Tehran. The parents were
not related and they did not have any history of such
disease in their family. Mother was 38 years old
when she got pregnant and the child was born
through cesarean section. The birth time weighed
and height was 3/5 kg and 50 cm, respectively and
head circumference was normal. Radiography
showed severe mal-development on elbow and wrist
joints, arm bone and forearm, when he was 2.5 years
old. Because the wrist of infant was bent, steps of
motion development like grasping things had very
slow development but other steps of motion were
almost in time, as the parents explained, he could
control his head and neck when he was 4 months
old, he could sit when he was7 months old, he was
able to move by sitting on his buttock when he was 9
months old, and he could stand up straight from
sitting when he was 13 months. Other steps of
motion development like crawling were not done
because of disorder in toddler. Because the toddler
was able to bring up his hand from his shoulder and
had good muscle strength, all of the rehabilitation
treatments were related to increase range of elbow
flexibility. Although the wrist flexibility would help
him eat by himself, but for holding things he needs
to bring up his wrist. Therapist should not forget to
straighten his wrist. The child was able to put the
pieces of food in his mouth with the assist of the
other hand, when he was 3\5 years old and with the
increase of range of motions of elbow of his right
hand, was able to do most of his personal activities
when he was 4. Some surgeons believed that
Vol. 9 - Special Issue - Child Neuro Rehabilitation

operation must be done in younger ages and some
others recommended postponing the surgery. After
bone growth and joint plates completed, some
believed that one hand should be bent and fixed and
then operation can be done on them, and some
believed that one hand should be bent and not
moved. Therefore one hand performs the needs of
upper half, and the other hand stays straight to do the
needs of the lower half of the body, and also in the
References 1. Taricco LD, Aoki SS. Rehabilitation of an adult patient with
arthrogryposis multiplex congenita treated with an external fixator. Am J Phys Med Rehabil. May 2009;88(5):431-4.
2. Darin N, Kimber E, Kroksmark AK, Tulinius M. Multiple
congenital contractures: birth prevalence, etiology, and
outcome. J Pediatr. Jan 2002;140(1):61-7.
3. Bamshad M, Van Heest AE, Pleasure D. Arthrogryposis: a
review and update. J Bone Joint Surg Am. Jul 2009;91 Suppl 4:40-6.
4. Alves PV, Zhao L, Patel PK, Bolognese AM. Arthrogryposis:
diagnosis and therapeutic planning for patients seeking
orthodontic treatment or orthognathic surgery. J Craniofac
Surg. Jul 2007;18(4):838-43.
5. Axt MW, Niethard FU, Doderlein L. Principles of treatment of the upper extremity in arthrogryposis multiplex congenita
type I. J Pediatr Orthop B. Jul 1997;6(3):179-85.
6. Bayne LG. Hand assessment and management of arthrogryposis multiplex congenita. Clin
Orthop. Apr 1985;(194):68-73.
Iranian Rehabilitation Journal
case of muscle surgery, some suggest pectoralis
major muscle and some others surgeons suggest
triceps release. But rehabilitation treatment have
been done with emphasis on practices of muscles to
improve their strength, improvement of range of
motion, prevention of joints deformation, the
mental support of parents and infant, and teaching
the parents to teach their infant how to be
independent.
7. Kroksmark AK, Kimber E, Jerre R, Beckung E, Tulinius
M. Muscle involvement and motor function in
amyoplasia. Am J Med Genet Part A. Aug
15 2006;140(16):1757-67.
8. Bennett JB, Hansen PE, Granberry WM. Surgical
management of arthrogryposis in the upper extremity, J
Pediatr Orthop. May-Jun 1985;5(3):281-6.
9. Lahoti O and Bell MJ. Transfer of pectoralis major in arthrogryposis to restore elbow flexion: Deteriorating results
in the long term, J Bone Joint Surg Br, June 1, 2005; 87-
B(6): 858 - 860.
10. Palmer PM, MacEwen GD, Bowen JR, Mathews PA. Passive
motion therapy for infants with arthrogryposis. Clin Orthop Relat Res. Apr 1985;(194):54-9.
11. Williams PF. Management of upper limb problems in
arthrogryposis. Clin Orthop Relat Res. Apr 1985;(194):60-7.
12. Thompson GH, Bilenker RM. Comprehensive management
of arthrogryposis multiplex congenita. Clin Orthop Apr 1985;(194):6-14.
13. Mennen U, van Heest A, Ezaki MB, Tonkin M, Gericke
G. Arthrogryposis multiplex congenita. J Hand Surg
[Br]. Oct 2005;30(5):468-74
77
Author Guidelines
Manuscripts for Iranian Rehabilitation Journal should follow the following instructions:
1. MANUSCRIPT TYPES ACCEPTED
The editorial policy of the Iranian Rehabilitation Journal (IRJ) is to encourage the publication of evidence-based research articles related to rehabilitation. IRJ publishes articles within the more basis aspects of rehabilitation in following forms:
A- Original Research Articles: Original Research Articles must describe novel and significant observations and provide sufficient
detail so that the findings can be critically evaluated and, if necessary, repeated.
B- Reviews: Reviews are selected for their broad general interest; all are refereed by experts in the field who are asked to comment on
issues such as timeliness, general interest and balanced treatment of controversies, as well as on scientific accuracy.
C- Case Reports/Case series: Authors are invited to submit case reports on clinical topics of relevance to the aim and scope of the Iranian Rehabilitation Journal. The reports should not be more than 2000 words.
D- Commentaries: Are opinion pieces on topics of general interest to the rehabilitation community.
2. MANUSCRIPT SUBMISSION PROCEDURE Manuscripts can be submitted in the following ways:
A- Electronically via the online submission site http://www.irjrehab.com. The use of an online submission and peer review site enables immediate distribution of manuscripts and consequentially speeds up the review process.
B- E-mail submission. Submit all materials electronically to [email protected] or [email protected] Submit manuscript and all
materials as one electronic file, except for tables and figures. C- Via Post. You can post the CD of the article and 3 copies to editorial address:
Iranian Rehabilitation Journal, University of social welfare and rehabilitation sciences
Evin, Kudakyar Ave., Tehran 1985713831, IRAN
3. MANUSCRIPT FORMAT AND STRUCTURE
3.1. Format Language: The language of publication is English. Abbreviations, Symbols and Nomenclature: Iranian Rehabilitation Journal adhere to the conventions outlined in Units, Symbols and Abbreviations: A Guide for Medical and Scientific Editors and Authors.
3.2. Structure
All manuscripts submitted to the Iranian Rehabilitation Journal should include: Title page, abstract, main text, acknowledgements,
references and tables, figures and figure legends as appropriate.
Title: Title page should include title; name of authors, complete names of institution for each author, and the name, address, telephone number, fax number and e-mail address for the corresponding author. Abstract: Abstract should include Objectives, Methods, Results, and Discussion (for Original articles) contain at most 250 words with 3 to 5 keywords. Main Text of Original Research Articles: should include Introduction, Materials and Methods, Results and Discussions.
Introduction: should be focused, outlining the historical or logical origins of the study and not summarize the results; exhaustive literature reviews are not appropriate.
Materials and Methods: must contain sufficient detail such that, in combination with the references cited, all experiments reported can be
fully reproduced.
Results: should present the observations with minimal reference to earlier literature or to possible interpretations. Presentation of data with tables, related figures and appropriate graphs is encouraged. Discussion: may usefully start with a brief summary of the major findings, but repetition of parts of the abstract or of the results section should be avoided.
Main Text of Reviews and Case Reports: need not follow the usual divisions of original research articles, but should contain
appropriate headings and subheadings. Acknowledgements: should proceeded by the References.
References: References should be numbered consecutively in the order in which they are first mentioned in the text. Identify
references in text, tables, and legends by English numerals in parentheses. Use the style of the examples below, which are based on
the formats used by the NLM in Index Medicus. The titles of journals should be abbreviated according to the style used in Index
Medicus. Journals Lobbezoo F, van der Zaag J, Naeije M. Bruxism: its multiple causes and its effects on dental implants - an updated review. J Oral Rehabil. 2006; 33: 293-300
Books: Fejerskov O, Kidd E. (eds) Dental caries: The Disease and its Clinical Management. Copenhagen: Blackwell Munksgaard; 2003. Tables, Figures and Figure Legends
Tables: should be double-spaced with no vertical rulings, with a single bold ruling beneath the column titles. Units of measurements must be included in the column title.
Figures: All figures should be planned to fit within either 1 column width (8.0 cm), 1.5 column widths (13.0 cm) or 2 column widths (17.0
cm).