INVESTOR May 2018 PRESENTATION Governance/Quarter 4 investor presentation.pdfCompany started 24 MW...
35
INVESTOR PRESENTATION May 2018
Transcript of INVESTOR May 2018 PRESENTATION Governance/Quarter 4 investor presentation.pdfCompany started 24 MW...

INVESTORPRESENTATION M
ay 2
018

1
DISCUSSIONSUMMARY
Company Overview
Strategic Priorities & Growth Outlook
Financial Results
Annexure
03
04
05
01
Business Overview02
COMPANY OVERVIEW

253
43 37 21 150.00
50.00
100.00
150.00
200.00
250.00
300.00
CY13 CY14 CY15 CY16 CY17
No. of Incidents(including minor)
Assets & Operational Detail• At SEML, safety is taken as top priority. The workers are
equipped with necessary safety gears on their operational role
• Regular medical check-up and in house medical facilities ensures that workers keep in good health
• The incident rate (including minor injuries) has seen a declining trend over past few years
• All employees at plant has to go through training on safety every year
Corporate Social Responsibility• The Company has adopted 90 single-teacher schools in the
tribal areas of Chhattisgarh for providing basic education
• The Company actively sponsors medical facilities, assisting in primary healthcare across villages.
• It runs a well-equipped ambulance with doctors and set up first-aid facilities in the villages surrounding its mines
• Extended financial assistance to Bhartiya Vidya Bhawan and R K Sarda Vidhya Ashram for school buildings/operations
Health and Safety
3

1979-89
Company acquired Raipur Wires and Steel as a sick unit in 1979
Installed 10 MT electric arc furnace in 1981 to produce ingot
Installed Continuous casting machine in 1984 for Billet production
1989-99
Installed 25 TPD Electric Arc Furnance in 1990
Acquired 3 Power units in 1993-94
Installed Two Sponge Iron Kilns of 30K MT each in 1993 and 1995
Sold two power units and installed one as captive power plant
1999-08
2008-18
Post 2018
Company started 24 MW captive power plant and Ferro Alloy plant in 2001
Commenced a fly ash brick plant to utilize hazardous fly ash from captive power plant
Acquired Iron ore mine with reserves of 20 Mn MT. I, commenced iron ore extraction from the mines n 2004
Coal mines and 4.8 MW Hydro power plant started operations in 2008-09
Pellet plant commenced operations in 2009-10
66 MVA Ferro Alloys plant and 80 MW Thermal power plant started at Vizag in 2012-13
24 MW Hydro Power project started in July 2017
Key MilestoneKey Milestone
4
Steel plant capacity to be increased by 50% in FY 2019
Commissioning of 96 MW Hydro Power plant located in Sikkim in FY 2020 and 24 MW plant located in Chhattisgarh in FY 2022

Company at GlanceCompany at a GlanceCompany at a Glance
5
Ferro Alloys
Background
Sustainable Growth
Low Gearing
Production has grown profitably in
the last few years across segment
Debt to Equity stands at 0.79 in
FY18, lower than 0.88 in FY17, is
one of the lowest in the sector
Revenue grown at 21% CAGR in
last two years. EBITDA has
Grown 45% in the same period
Sarda Energy & Minerals Limited
(SEML), incorporated in 1973, is the
flagship company of Sarda Group.
Vertically integrated producer of
steel with captive raw materials
Leading Manufacturer and
exporter of niche grade
manganese based ferro alloys.
Ventured into hydro power in
Uttarakhand, Chhattisgarh and Sikkim as
Government push towards clean energy
Operations Financials
Steel
Hydro Power
Financial Performance
Background

Company at GlanceCompany at a GlanceFY2018 - A landmark Year in Sarda History
5
Pellet Highest ever Pellet production of 6 lakh tonne
Billet highest ever production at 1.36 lakh tonne
Ferro Alloys Highest ever production of 148982 MTs in FY2018
Hydro Power Highest ever energy generated 19.10 Mn units
Revenue Highest ever revenue over 2200 crores with all division contributing to the growth
EBITDA Highest ever EBITDA of INR 4,016 mn
PAT reached highest ever PAT of INR 2057 million
Dividend Highest ever dividend of Rs. 5 per share reflect management focus towards rewarding shareholder
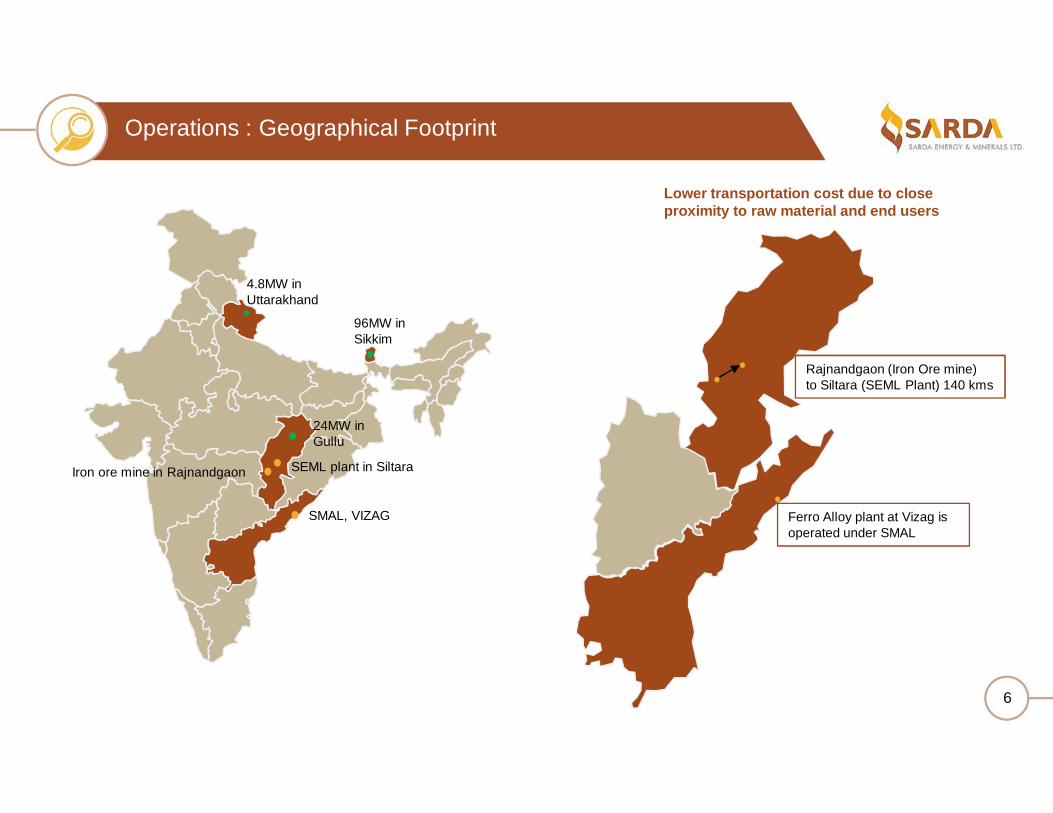
OperationsOperations : Geographical Footprint
Rajnandgaon (Iron Ore mine) to Siltara (SEML Plant) 140 kms
Ferro Alloy plant at Vizag is operated under SMAL
6
4.8MW in Uttarakhand
96MW in Sikkim
24MW in Gullu
SEML plant in SiltaraIron ore mine in Rajnandgaon
SMAL, VIZAG
Lower transportation cost due to close proximity to raw material and end users

Buiness Offerings Demand Driver
Steel
Infrastructure & Urban development
Housing for All
Construction
Ferro – Alloys
All types of Steel, demand aligned to increased in steel demand
Requirement is higher in manufacturing Alloy Steel
Hydro Power
Government Push towards clean energy
To meet peak demand for power
Hydro more viable option in difficult terrain with limited sun light and wind for logistic
Product Offering
7
Iron
Ore
Pelle
t &
Spon
ge
Iron
Bill
et
Wire
Rod
& H
B
Wire
Silic
o M
anga
nese
Ferr
oM
anga
nese

Board of Directors
8
Pankaj Sarda, Jt Managing DirectorMS in Industrial Administration from Purdue University, USA, With industry experience of more than 12 years.
Gajinder Singh SahniPost Graduate from Cardiff University. IAS officer from Madhya Pradesh Cadre and Former MD, MSIDC & MP, Cabinet Secretariat, Govt of India
Uma Sarda, DirectorArts graduate with specialization in Home Science. Active member of NGO that works for primary education and healthcare of tribal people
Jitender BalakrishnanPGDM in Industrial Management. Ex DY. MD, IDBI Bank, having wide experience in the field of Oil & Gas, Refineries, Power, Steel etc.
Prabhakar TripathiFormer CMD of NMDC with a rich experience of 45 years in the field of mining and related activities.
Asit Kumar BasuBME graduate with 40 years of experience in the field of finance. Ex chief general manager of IDBI Bank.
Padam Kumar Jain, Director and CFOCA, CS with a rich experience of 31 years in the field of accounting, finance, taxation, costing and corporate laws.
Rakesh Mehra, FCWA with over 35 yrs of experience in finance & accounting. Ex GM, Madhya Pradesh Audhyogik Vikas Nigam.
C K LakshminarayananAn Engineer with experience spanning across various institutions like ST CMS Electric, IDBI etc.
Kamal Kishore Sarda, CMDMechanical Engineer with 40 years experience in Iron and Steel Industry. He is responsible for steering SEML towards the path of growth
Independent Non Executive Director

Strong Corporate Governance
9
Experienced BoardMajority consisting of independent directors from diverse field with rich experience who drive the Board and policy decisions and strategy making
ValuesManagement has a culture of ethical
values to be followed while working with the company.
Employee EngagementClarity on thought process related to
business is clearly communicated to all the employees which helps them to align
their goals with the vision of the management
TransparencyThe management team also believes in
transparency on all the company matters which helps them to build a
surrounding of rich moral values within the organization
Corporate PolicyAll the crucial decisions related to
company’s operations are taken without deviating from the company’s policy
Shareholder WealthThe company also believes in
rewarding shareholders, Dividend is being paid consistently since
FY 2003-04

BUSINESS OVERVIEW

Sector overview• India became the 2nd largest crude steel producer in 2018, as large
public and private sector players strengthen steel production capacity in view of rising demand.
• India is the largest producer of Direct Reduced Iron (DRI) or Sponge Iron.
• The steel sector contributes over 2 per cent to the GDP of the nation
• India’s per capita consumption of steel grew from 59.6 kgs in FY 14 to 68 kgs in FY18
Future Growth• Renewed push towards infrastructure development will increase
steel demand going forward
• Government has set target for 300 million tonne production by 2030, c.3x from current production run-rate
8289 90
97102
50
60
70
80
90
100
110
FY 14 FY 15 FY 16 FY 17 FY 18
India Crude Steel Production (Mn Tonne)
USA, 294 Germany, 484
Japan,497
Russia, 275Turkey, 437
Brazil. 103 China, 489India. 68
0
10000
20000
30000
40000
50000
60000
0 100 200 300 400 500 600
World Steel Demand Intensity
Per capita GDP, USD
Per capita Steel Consumption, kg
Steel Business India’s Steel Industry Overview
10Source: IBEF; FICCI report

Iron ore
Pellet
Sponge Iron
Billet
Wire Rod & HB Wire
• Iron ore mines near SEML plant in Siltara• Production run rate of 5 lakh tonne with mine life of 30
years
• Pellets are produced from Iron Ore Fines and majority is sold in local markets, remaining is consumed captively for production of Sponge Iron.
• The capacity of the pellet plant is 6lakh tonne
• Sponge Iron is produced from Captive Iron Ore Lumps and Pellets• Sponge Iron capacity is 3.6 lakh tonne
• Billets are semi finished steel products produced by continuous casting process
• Billet production capacity is 2 lakh tonne
• Wire Rods are hot rolled products made from direct hot billet charging• Wire Rods production capacity is 1.8 lakh MT’s• Wire Rods are cold drawn to produce HB Wires
Steel Business
11
Eco Bricks• Eco-Bricks are mainly manufactured from fly-ash and waste generated from
the power plant• Company’s annual production capacity is 1.3 lakh tonne

Assets & Operational Detail
• Company’s operational Iron Ore mine has potential reserves of 180 Lakh MT and annual production output of 4 Lakh MT*
• Semi-mechanised mine commenced operation in 2004
• Iron ore business act as a feeder to Pellet & Sponge Iron Plants
Future Strategy
• Iron ore production will be increased up to 5 Lakh MT in FY2019 based on requirement from Sponge and Pellet plant
• Further mines allotted in Chhattisgarh with estimated 2,400 lakh tonne of reserves, further clearances in process
Steel BusinessIron Ore
12* Production run-rate at the end of FY18 at 5 lakh mt
2.55
3.71
1.48
4.54
FY 15 FY 16 FY 17 FY 18
Iron Ore Production (Lakh MT)
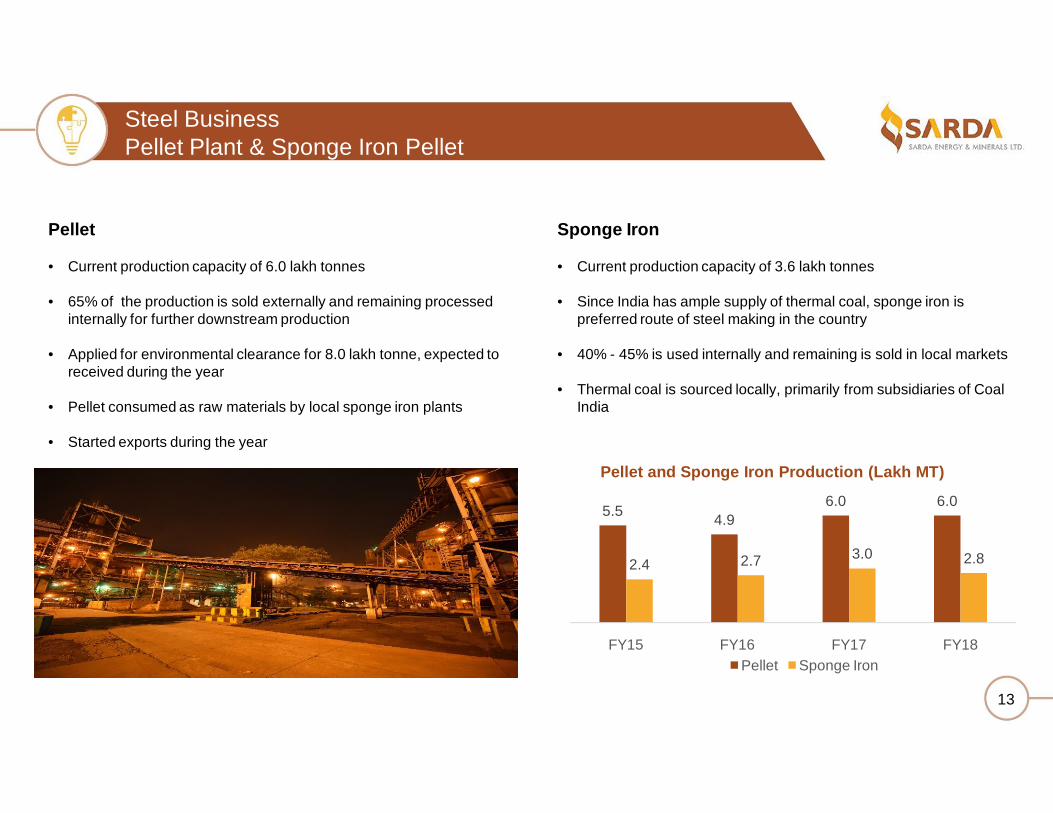
Pellet
• Current production capacity of 6.0 lakh tonnes
• 65% of the production is sold externally and remaining processed internally for further downstream production
• Applied for environmental clearance for 8.0 lakh tonne, expected to received during the year
• Pellet consumed as raw materials by local sponge iron plants
• Started exports during the year
Sponge Iron
• Current production capacity of 3.6 lakh tonnes
• Since India has ample supply of thermal coal, sponge iron is preferred route of steel making in the country
• 40% - 45% is used internally and remaining is sold in local markets
• Thermal coal is sourced locally, primarily from subsidiaries of Coal India
5.5 4.96.0 6.0
2.4 2.7 3.0 2.8
0.00
1.00
2.00
3.00
4.00
5.00
6.00
7.00
FY15 FY16 FY17 FY18
Pellet and Sponge Iron Production (Lakh MT)
Pellet Sponge Iron
Steel BusinessPellet Plant & Sponge Iron Pellet
13

Billet
• Current production capacity of 2 lakh tonnes
• 15% of the production is sold externally, remaining processed internally for further downstream production
• The company plans to expand steel billet capacity to 3 lakh tonnes in FY 2019
• Well positioned with complete back end integration to enhance capacity
1.18
1.35 1.331.36
1.05
1.10
1.15
1.20
1.25
1.30
1.35
1.40
FY15 FY16 FY17 FY18
Billet Production (Lakh MT)
Steel BusinessBillet
14

Wire Rod
• Current production capacity of 1.8 lakh tonne, with current capacity utilization of over 60%
• Wire Rod is a hot rolled product made from hot charged Billets
• High strength products offered at reasonable price in the local markets
• Wire Rod is sold to local markets, hence minimum expense on logistics
• The company has exported Wire Rod for the first time in FY 17-18
• Increase in Billet production capacity will lead to rise in production of Wire Rods without any incremental capex
HB Wire
• Current production capacity of 30,000 tonnes
• HB Wire are Cold drawn from Wire Rod and sold on different specification, sold to local markets in Chhattisgarh
0.820.92 1.01
1.13
0.22 0.27 0.30 0.28
0.00
0.20
0.40
0.60
0.80
1.00
1.20
FY15 FY16 FY17 FY18
Wire Rod and HB Wire Production (lakh tonnes)
Wire Rod HB Wire
Steel Business Wire Rod and HB Wire
15

Sector Overview
• Ferro Alloys are vital additives for Steel making.
• Ferro Alloys enhance the strength of the Steel and acts as a de-oxidant in Steel manufacturing
• Approximately 1.5% of Manganese Alloy is required to produce each tonne of Steel
Future Growth
• Globally, the industry is expected to grow at a CAGR of 5.9% between 2017 and 2025 and is expected to reach a valuation of US $188.7 billion by 2025.
• The growth in the steel sector will drive the demand for Ferro Alloys
Source: CRU India and IFAPA
Ferro AlloysIndia’s Ferro Alloys Industry Overview
16
0.5 0.5 0.4 0.5
1.80 1.70 1.70 1.90
FY 14 FY 15 FY 16 FY 17
India’s Ferro Alloys Production (Mn Tonne)
Ferro Manganese Silico Manganese

1.13 1.071.28
1.49
0.00
0.20
0.40
0.60
0.80
1.00
1.20
1.40
1.60
FY 15 FY 16 FY 17 FY 18
Ferro Alloys Production (Lakh MT)• Company has two operational plants of Ferro Alloys which are
located at Raipur and Vizag with a total installed capacity of 111 MVA
• The company manufacturers manganese based Ferro Alloys which is sold domestically as well exported to other countries
• Company received the prestigious export promotion council award in 2018
• SEML& its subsidiary both have been awarded Two-Star export house status from Government of India.
• The company exports majority of the Ferro Alloys exports to Japan
• Company’s Ferro Alloys exports grew from 0.37 Lakh MT to 0.86 Lakh MT in FY 18.
Ferro Alloy Business
17
0.52 0.43 0.37 0.86
31195
[VALUE] [VALUE]
[VALUE]
FY 15 FY 16 FY 17 FY 18
Ferro Alloys Exports
Ferro Alloys Exports (Lakh MT) Ferro Alloys Exports ( Rs Lakh)

• Government of India has set a target of adding 175 GW of renewable power in the country by 2022
• Government has earmarked US$ 250 billion for renewable energy over next 5 years.
• Discom are mandated to procure 15% of energy units from renewable source by FY 20
• India’s small Hydro power installed capacity has grown from 3804 MW in FY 14 to 4486 MW in FY 18
• India’s large Hydro power installed capacity has grown from 40531 MW in FY 14 to 45293 MW in FY 18
• India has committed towards reducing its carbon footprint, hence reducing carbon emission by 33% – 35% from 2005 levels by 2030
• Under Union Budget 2018-19, US$ 581 million has been allocated for grid-interactive renewable energy schemes and projects.
Source: MNRE, CEA
India Push For Hydro Energy
18
3,804 3,991 4,274 4,418 4,486
40,531 41,267 42,78344,478 45,293
0
5000
10000
15000
20000
25000
30000
35000
40000
45000
50000
FY 14 FY 15 FY 16 FY 17 FY 18
Hydro Power Installed Capacity
Small Hydro (MW) Large Hydro (MW)
Hydro Power projects below 25 MW is considered as Small Hydro as per Government of India’s guidelines and they are a part of Renewable Energy

Uttarakhand4.8MW
Operational since 2008
Chhattisgarh24MW
Operational sinceJuly, 2017
Under Execution
Operated at 45.42% PLF during FY 14-17
PPA signed at 3.85 per unit with the state discoms for 35 years
Average units sold stands at 19.33 mn on a yearly basis
18.26 mn units were sold in FY 2017-18
Operation started in the mid of year, expected PLF to be around 50% in FY2019
PPA signed at 5.04 per unit with the grid and tenure of PPA is 35 years.
Chhattisgarh needs hydro power to meet its renewable energy obligation against thermal power generation
Sikkim power plant to be commissioned in FY 2020
Sikkim offers ideal terrain for hydro power
Chhattisgarh power plant to be commissioned in FY 2022
Hydro Power Business
19
Sikkim 96MW & Chhattisgarh 24MW

STRATEGICPRIORITIESAND GROWTHOUTLOOK

Financial Discipline
Maintain financial health of
the company, with Debt
Equity ratio not more than 2x
Profitable Growth
Gradually ramping up Iron
Ore production capacity
and increasing profitability
of the company
Integrated Operations
Different business division
complements each
other, thereby increasing
overall efficiency and
profitability
Identifying next growth avenues
Strategically expanding
ongoing operations and
scouting for future growth from
inorganic route
02 03 0401
Strategic Priorities
21

Capacity pre-expansion
Post-expansion Capacity
Incremental Capex Spend till date Remarks
Steel (Pellet plant) 6.0 Lakh MT 7.5 Lakh MT Nil Nil Approvals are required and Pellets will also be
sold externally along with captive consumption
Steel(Billet plant) 2 Lakh MT 3 Lakh MT Rs 25 Crores Rs 10 Crores
The upcoming Steel plant will be commissioned by FY19 which will lead to higher capacity utilisation
Ferro Alloys 111 MVA 144 MVA 125 Crores Rs 1 Crore Capacity utilisation by commissioning of Vizag plant will be increased by FY 2020
Hydro Power 29 MW 149 MW 1430 Crores Rs 835 Crores
Sikkim Hydro Power plant (96 MW) will be commissioned by FY 2020 and Chhattisgarh power plant (24 MW) will be commissioned by FY 2022
Sarda EnergyProject Expansion Plan
22

FINANCIALRESULTS

Q4 FY18 YoY ANALYSIS (Standalone)
2,296
3,917
Q4 FY17 Q4 FY18
REVENUES *
359947
15.6% 24.2%
Q4 FY17 Q4 FY18EBIDTA EBIDTA Margin %
EBITDA & EBITDA MARGIN% #
184
5508.0%14.0%
Q4 FY17 Q4 FY18PAT PAT Margin %
PAT, & PAT MARGIN %In Rs Mn
Results Highlights
24
1,270 2,057
8.9% 9.5%
FY 2017 FY 2018PAT PAT Margin %
* Revenue excluding excise duty, previous numbers restated accordingly
14,342
21,737
FY 2017 FY 2018
2,1704,016
15.1% 18.5%
FY 2017 FY 2018EBIDTA EBIDTA Margin %
FY18 YoY ANALYSIS (Consolidated)

35.9%
42.6%
21.1%
0.4%
Steel Ferro Alloys Power Others
60%
39%
1%
Steel Ferro Alloys Power
REVENUE EBIT
The Ferro Alloys business segment contributed 42.6% to the overall revenue in FY 17-18 followed by Steel Business and Power
The EBIT as on FY 17-18 clearly displays Steel business segment commanding a higher proportion of 60% than Ferro Alloys which has 39%
Commissioning of hydro power at Sikkim will further move revenue and EBITDA split towards more stable and predictive business
FY2018 – Segment Analysis
25

Consolidated Profit & Loss
Particulars (INR Mn) FY 18 FY 17 YoY changeSteel 9,114 6,437 42%Ferro Alloys 10,809 6,941 56%Power 5,348 4,563 17%Unallocated 96 77 25%Less Excise duty 429 1,368 NALess Inter Segment Revenue 3,201 2,308 39%Total Income 21,737 14,342 51%COGS 14,778 9,422 57%Employee Benefit Expenses 771 754 2%Other Operating Expenses 2,172 1,995 9%Total Expenditure 17,721 12,172 46%EBITDA 4,016 2,170 85%EBITDA (%) 18.5% 15.1% 31%Other Income 703 674 4%Depreciation/ Amortization 732 687 7%Finance Cost 967 938 3%PBT 3,021 1,220 148%Share of Profit/ (Loss) from Subsidiaries 9.1 0.7 NMExceptional Items 78 282 -72%Tax 895 232 286%Profit after Tax (Before MI) 2,057 1,270 62%
27* Revenue excluding excise duty, previous numbers restated accordingly

Consolidated Balance Sheet
Liabilities (INR Mn) FY 18 FY 17
Equity Share Capital 360 360Other Equity 16,289 14,046Total Equity 16,649 14,407
Borrowings 9,832 9,232Other Financial Liabilities 152 129Other Non Current Liabilities 78 95Deferred Tax Liabilities 681 557Total Non Current Liabilities 10,743 10,012
Borrowings 3,267 3,483Trade Payables 1,308 1,111Other Financial Liabilities 1,623 1,858
Provisions and Other Current Liabilities536 280
Total Current Liabilities 6,734 6,732Total Liabilities 34,126 31,151
Assets (INR Mn) FY 18 FY 17
Fixed Assets 21,420 19,824Investments 548 225Other Financial Assets 165 150Deferred Tax Assets
Other Non-Current Assets 676 427Total Non Current Assets 22,809 20,626
Inventories 4,113 3,426Trade Receivables 1,312 1,065Cash & Cash Equivalents 216 106Other Financial Assets 4,423 4,597Current Tax Assets (Net) 4 2Other Current Assets (Net) 1,249 1,330Assets Classified as held for sale
Total Current Assets 11,317 10,525Total Assets 34,126 31,151
28

ANNEXURE

Sarda Energy : Financial Data
30
3,773
1,920 2,170
4,016
FY 15 FY 16 FY 17 FY 18
EBITDA (Mn)
1.010.90 0.88
0.79
FY 15 FY 16 FY 17 FY 18
Debt Equity Ratio
563
1,277 1,270
2,057
0
500
1000
1500
2000
2500
FY15 FY16 FY17 FY18
PAT (Mn)
17,59914,799 14,342
21,737
0
5000
10000
15000
20000
25000
FY15 FY16 FY17 FY18
Revenue (Mn)
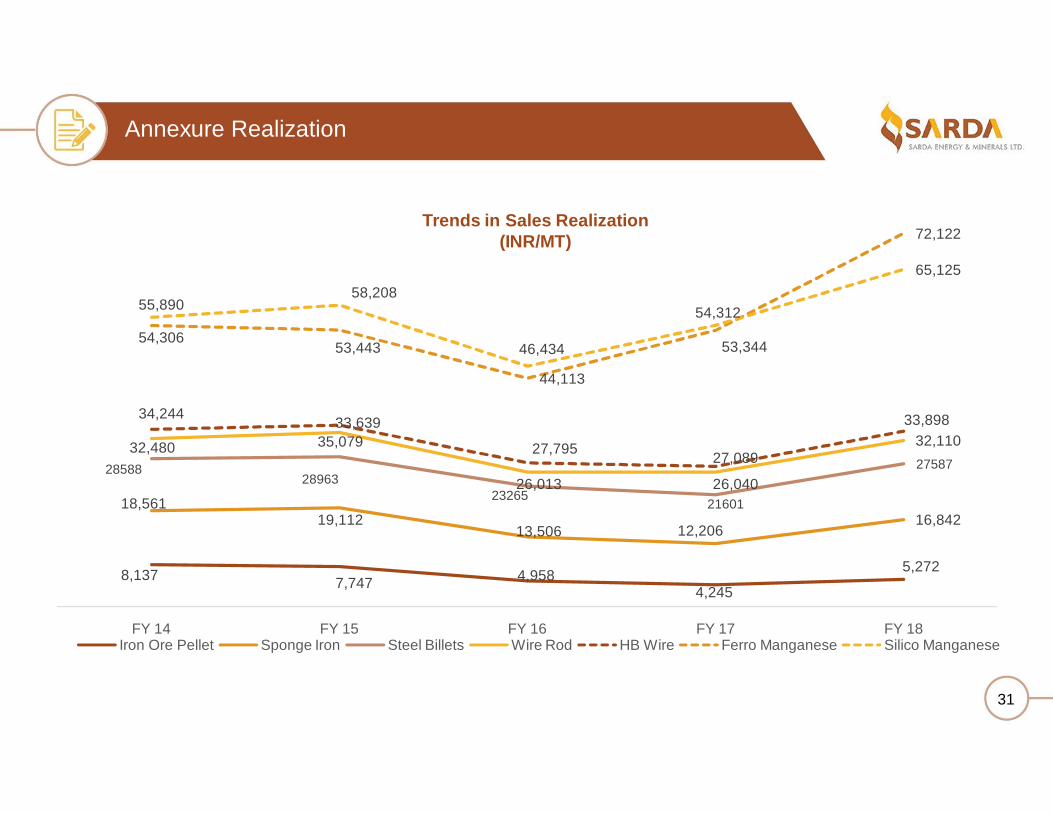
8,137 7,747 4,9584,245
5,272
18,56119,112
13,506 12,20616,842
2858828963
23265 21601
2758732,480
33,639
26,013 26,040
32,110
34,244
35,079 27,795 27,089
33,898
54,30653,443
44,113
53,344
72,122
55,89058,208
46,434
54,312
65,125
0
10000
20000
30000
40000
50000
60000
70000
80000
FY 14 FY 15 FY 16 FY 17 FY 18Iron Ore Pellet Sponge Iron Steel Billets Wire Rod HB Wire Ferro Manganese Silico Manganese
Trends in Sales Realization (INR/MT)
Annexure Realization
31
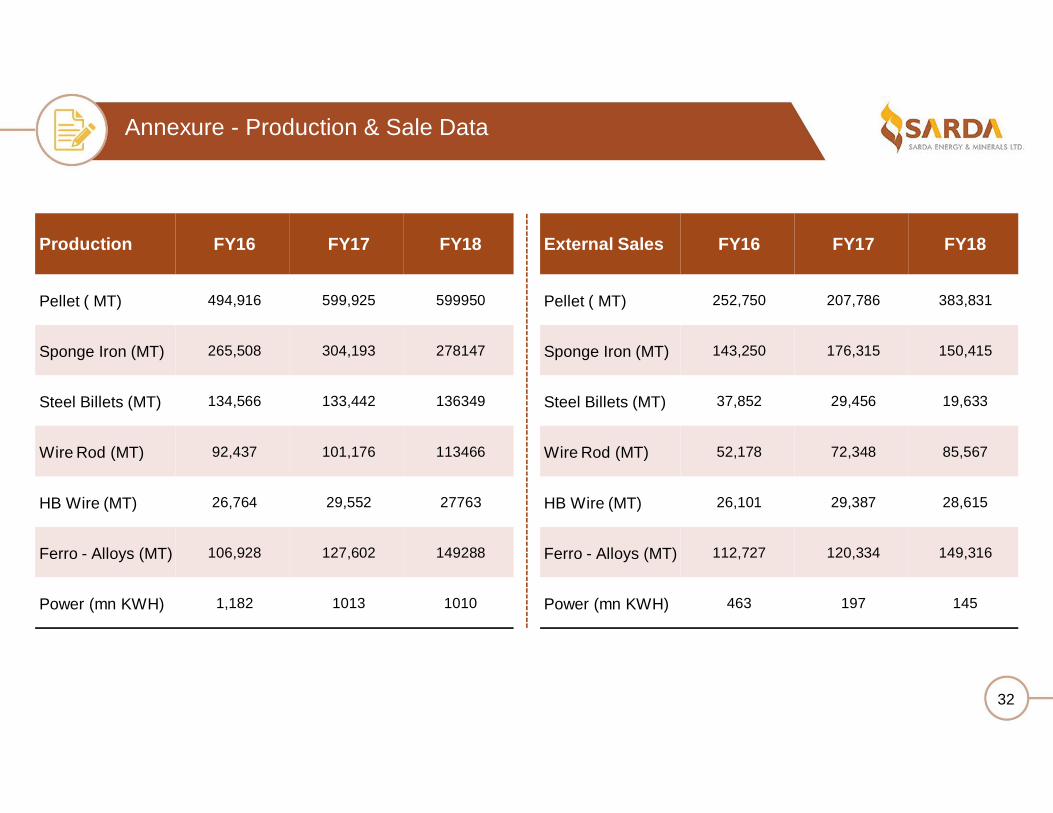
Production FY16 FY17 FY18
Pellet ( MT) 494,916 599,925 599950
Sponge Iron (MT) 265,508 304,193 278147
Steel Billets (MT) 134,566 133,442 136349
Wire Rod (MT) 92,437 101,176 113466
HB Wire (MT) 26,764 29,552 27763
Ferro - Alloys (MT) 106,928 127,602 149288
Power (mn KWH) 1,182 1013 1010
External Sales FY16 FY17 FY18
Pellet ( MT) 252,750 207,786 383,831
Sponge Iron (MT) 143,250 176,315 150,415
Steel Billets (MT) 37,852 29,456 19,633
Wire Rod (MT) 52,178 72,348 85,567
HB Wire (MT) 26,101 29,387 28,615
Ferro - Alloys (MT) 112,727 120,334 149,316
Power (mn KWH) 463 197 145
Annexure - Production & Sale Data
32

THANKYOU
Aakash Mehta - IR ConsultantContact No: +91 98706 79263Email: [email protected]
Padam Kumar Jain - CFOContact No: +91 77122 14238Email: [email protected]
Ravindra Bhandari - IR ConsultantContact No: +91 92836 14197Email: [email protected]

![AHLUWALIA CONTRACTS (INDIA) LIMITED [ACIL] - … Investor PPT Feb... · Moser Baer plant at Greater Noida Expansion of Apollo Tyre Plant at Baroda Cold Rolling Mill for Jindal steels](https://static.fdocuments.net/doc/165x107/5ad815a97f8b9a3e578d01d0/ahluwalia-contracts-india-limited-acil-investor-ppt-febmoser-baer-plant.jpg)