Investor Days21.q4cdn.com/.../2017/11/TPI-InvestorDay-11-17-17-FINAL.pdf2017/11/17 · Investor Day...
93
| | Investor Day November 17, 2017
Transcript of Investor Days21.q4cdn.com/.../2017/11/TPI-InvestorDay-11-17-17-FINAL.pdf2017/11/17 · Investor Day...

| |
Investor DayNovember 17, 2017

| |
Legal Disclaimer
This presentation contains forward-looking statements within the meaning of the
federal securities laws. All statements other than statements of historical facts
contained in this presentation, including statements regarding our future results of
operations and financial position, business strategy and plans and objectives of
management for future operations, are forward-looking statements. In many cases,
you can identify forward-looking statements by terms such as “may,” “should,”
“expects,” “plans,” “anticipates,” “could,” “intends,” “target,” “projects,” “contemplates,”
“believes,” “estimates,” “predicts,” “potential” or “continue” or the negative of these
terms or other similar words. Forward-looking statements contained in this
presentation include, but are not limited to, statements about (i) our financial guidance
for calendar year 2018 and summary financial targets for 2019; (ii) growth of the wind
energy market and our addressable market; (iii) the potential impact of GE’s
acquisition of LM Wind Power upon our business; (iv) our future financial performance,
including our net sales, cost of goods sold, gross profit or gross margin, operating
expenses, ability to generate positive cash flow, and ability to achieve or maintain
profitability; (v) the sufficiency of our cash and cash equivalents to meet our liquidity
needs; (vi) our ability to attract and retain customers for our products, and to optimize
product pricing; (vii) competition from other wind blade and wind blade turbine
manufacturers; (viii) the discovery of defects in our products; (ix) our ability to
successfully expand in our existing markets and into new international markets; (x)
worldwide economic conditions and their impact on customer demand; (xi) our ability to
effectively manage our growth strategy and future expenses; (xii) our ability to
maintain, protect and enhance our intellectual property; (xiii) our ability to comply with
existing, modified or new laws and regulations applying to our business, including the
imposition of new taxes, duties or similar assessments on our products; (xiv) the
attraction and retention of qualified employees and key personnel; and (xv) changes in
domestic or international government or regulatory policy, including without limitation,
changes in tax policy.
These forward-looking statements are only predictions. These statements relate to
future events or our future financial performance and involve known and unknown
risks, uncertainties and other important factors that may cause our actual results,
levels of activity, performance or achievements to materially differ from any future
results, levels of activity, performance or achievements expressed or implied by these
forward-looking statements. Because forward-looking statements are inherently
subject to risks and uncertainties, some of which cannot be predicted or quantified,
you should not rely on these forward-looking statements as guarantees of future
events. Further information on the factors, risks and uncertainties that could affect our
financial results and the forward-looking statements in this presentation are included in
our filings with the Securities and Exchange Commission and will be included in
subsequent periodic and current reports we make with the Securities and Exchange
Commission from time to time, including in our Annual Report on Form 10-K for the
year ended December 31, 2016 and subsequent Quarterly Reports on Form 10-Q.
The forward-looking statements in this presentation represent our views as of the date
of this presentation. We anticipate that subsequent events and developments will
cause our views to change. However, while we may elect to update these forward-
looking statements at some point in the future, we undertake no obligation to update
any forward-looking statement to reflect events or developments after the date on
which the statement is made or to reflect the occurrence of unanticipated events
except to the extent required by applicable law. You should, therefore, not rely on
these forward-looking statements as representing our views as of any date after the
date of this presentation. Our forward-looking statements do not reflect the potential
impact of any future acquisitions, mergers, dispositions, joint ventures, or investments
we may make.
This presentation includes unaudited non-GAAP financial measures including total
billings, adjusted EBITDA and free cash flow. We define total billings as the total
amounts we have invoiced our customers for products and services for which we are
entitled to payment under the terms of our long-term supply agreements or other
contractual agreements. We define adjusted EBITDA as net income (loss) attributable
to the Company plus interest expense (including losses on the extinguishment of debt
and net of interest income), income taxes, depreciation and amortization and share-
based compensation expense, plus or minus any gains or losses from foreign currency
remeasurement. We define free cash flow as net cash flow generated from operating
activities less capital expenditures. We present non-GAAP measures when we believe
that the additional information is useful and meaningful to investors. Non-GAAP
financial measures do not have any standardized meaning and are therefore unlikely
to be comparable to similar measures presented by other companies. The
presentation of non-GAAP financial measures is not intended to be a substitute for,
and should not be considered in isolation from, the financial measures reported in
accordance with GAAP. See the appendix for the reconciliations of certain non-GAAP
financial measures to the comparable GAAP measures.
This presentation also contains estimates and other information concerning our
industry that are based on industry publications, surveys and forecasts. This
information involves a number of assumptions and limitations, and we have not
independently verified the accuracy or completeness of the information.
November 17, 2017 2Investor Day

| |
Steve Lockard – President and CEO
INTRODUCTION AND OPENING REMARKS

| |
Introduction to TPI Composites
Only independent manufacturer of composite wind blades
for the high-growth wind energy market with a global
footprint
Provides wind blades to some of the industry’s leading
OEMs such as: Vestas, GE, Siemens/Gamesa,
Nordex/Acciona and Senvion
Operates nine wind blade manufacturing plants and three
tooling and R&D facilities across four countries:
• United States • Mexico
• China • Turkey
Applying advanced composites technology to production of
clean transportation solutions, including electric buses
Long-term supply agreements with customers, providing
contracted volumes that generate significant revenue
visibility and drive capital efficiency
Founded in 1968 and headquartered in Scottsdale, Arizona
Approximately 8,000 employees globally
November 17, 2017 4Investor Day
Business Overview Strong Historical Financial Results
Revenue
CAGR
52%
2013-2016
Adjusted
EBITDA
CAGR
99%
2013-2016
Adjusted
EBITDA
Margin growth
12.4%
2013-Q3 2017
3.9%

| |
Investment Thesis
November 17, 2017 5Investor Day
Capitalizing on Wind Market Growth and Blade Outsourcing Trend
Only Independent Blade Manufacturer with a Global Footprint
Advanced Composite Technology and Production Expertise Provide Barrier to Entry
Collaborative Dedicated Supplier Model to Share Gain and Drive Down LCOE
Long-Term Supply Agreements Provide Significant Revenue Visibility
Compelling Return on Invested Capital
Seasoned Management Team with Significant Global Growth Experience

| |
Investment Thesis
November 17, 2017 6Investor Day
Capitalizing on Wind Market Growth and Blade Outsourcing Trend
Only Independent Blade Manufacturer with a Global Footprint
Advanced Composite Technology and Production Expertise Provide Barrier to Entry
Collaborative Dedicated Supplier Model to Share Gain and Drive Down LCOE
Long-Term Supply Agreements Provide Significant Revenue Visibility
Compelling Return on Invested Capital
Seasoned Management Team with Significant Global Growth Experience
• Renewables and wind energy are mainstream, large, growing, competitive and desired by customers.
• Emerging markets around the world are growing faster than mature markets.
• Blades are being outsourced to access emerging growth markets, drive cost and efficiently utilize capital.
• Same competitive dynamics in place today that put us in business.

| |
Investment Thesis
November 17, 2017 7Investor Day
Capitalizing on Wind Market Growth and Blade Outsourcing Trend
Only Independent Blade Manufacturer with a Global Footprint
Advanced Composite Technology and Production Expertise Provide Barrier to Entry
Collaborative Dedicated Supplier Model to Share Gain and Drive Down LCOE
Long-Term Supply Agreements Provide Significant Revenue Visibility
Compelling Return on Invested Capital
Seasoned Management Team with Significant Global Growth Experience
• We’ve made good choices – customers, locations and markets.
• Our factories are low cost, world class hubs that serve large, diverse and growing addressable markets,
reducing the effect of individual market fluctuations.
| |
Investment Thesis
November 17, 2017 8Investor Day
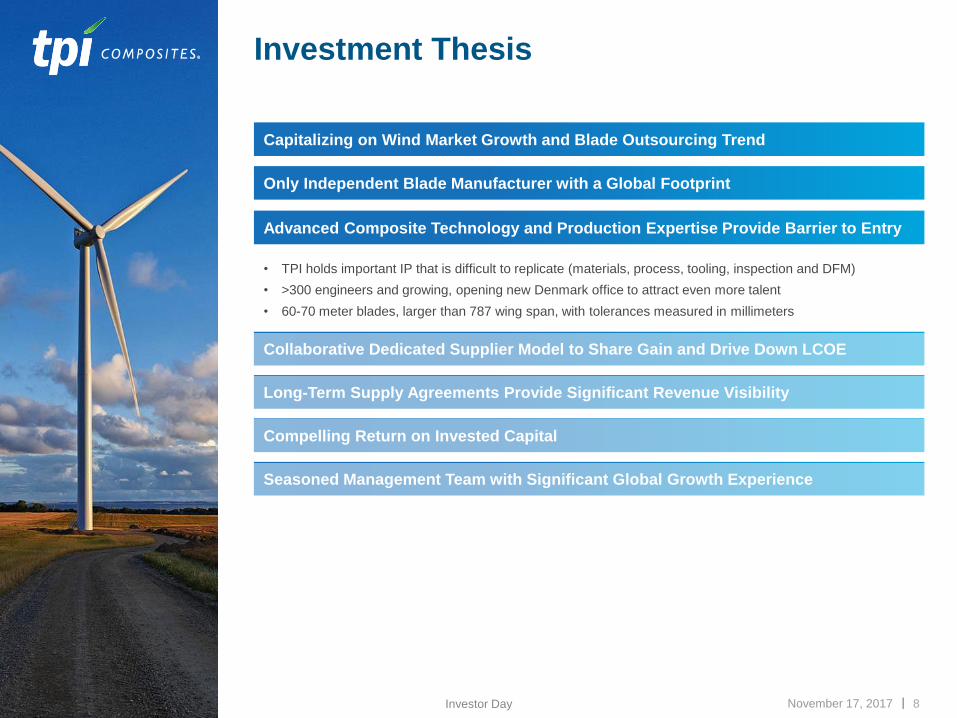
Capitalizing on Wind Market Growth and Blade Outsourcing Trend
Only Independent Blade Manufacturer with a Global Footprint
Advanced Composite Technology and Production Expertise Provide Barrier to Entry
Collaborative Dedicated Supplier Model to Share Gain and Drive Down LCOE
Long-Term Supply Agreements Provide Significant Revenue Visibility
Compelling Return on Invested Capital
Seasoned Management Team with Significant Global Growth Experience
• TPI holds important IP that is difficult to replicate (materials, process, tooling, inspection and DFM)
• >300 engineers and growing, opening new Denmark office to attract even more talent
• 60-70 meter blades, larger than 787 wing span, with tolerances measured in millimeters

| |
Investment Thesis
November 17, 2017 9Investor Day
Capitalizing on Wind Market Growth and Blade Outsourcing Trend
Only Independent Blade Manufacturer with a Global Footprint
Advanced Composite Technology and Production Expertise Provide Barrier to Entry
Collaborative Dedicated Supplier Model to Share Gain and Drive Down LCOE
Long-Term Supply Agreements Provide Significant Revenue Visibility
Compelling Return on Invested Capital
Seasoned Management Team with Significant Global Growth Experience
• Our business model helps TPI customers to gain market share in a cost effective and capital efficient
manner by sharing the investment, spreading overhead, driving down material cost, improving productivity
and sharing a large portion of that benefit with our customers.

| |
Investment Thesis
November 17, 2017 10Investor Day
Capitalizing on Wind Market Growth and Blade Outsourcing Trend
Only Independent Blade Manufacturer with a Global Footprint
Advanced Composite Technology and Production Expertise Provide Barrier to Entry
Collaborative Dedicated Supplier Model to Share Gain and Drive Down LCOE
Long-Term Supply Agreements Provide Significant Revenue Visibility
Compelling Return on Invested Capital
Seasoned Management Team with Significant Global Growth Experience
• Current agreements provide up to $4.4B in visible revenue through 2023
• Volume based pricing and shared investment motivate both parties to keep plants full

| |
Investment Thesis
November 17, 2017 11Investor Day
Capitalizing on Wind Market Growth and Blade Outsourcing Trend
Only Independent Blade Manufacturer with a Global Footprint
Advanced Composite Technology and Production Expertise Provide Barrier to Entry
Collaborative Dedicated Supplier Model to Share Gain and Drive Down LCOE
Long-Term Supply Agreements Provide Significant Revenue Visibility
Compelling Return on Invested Capital
Seasoned Management Team with Significant Global Growth Experience
• Shared capital investment results in a “capital-light” model for TPI and our customers
• New investments target an initial average five-year ROIC hurdle rate of 25%
• Consolidated ROIC continuing to trend up from ~18% in 2014 to an estimated 33% in 2017
| |
Investment Thesis
November 17, 2017 12Investor Day
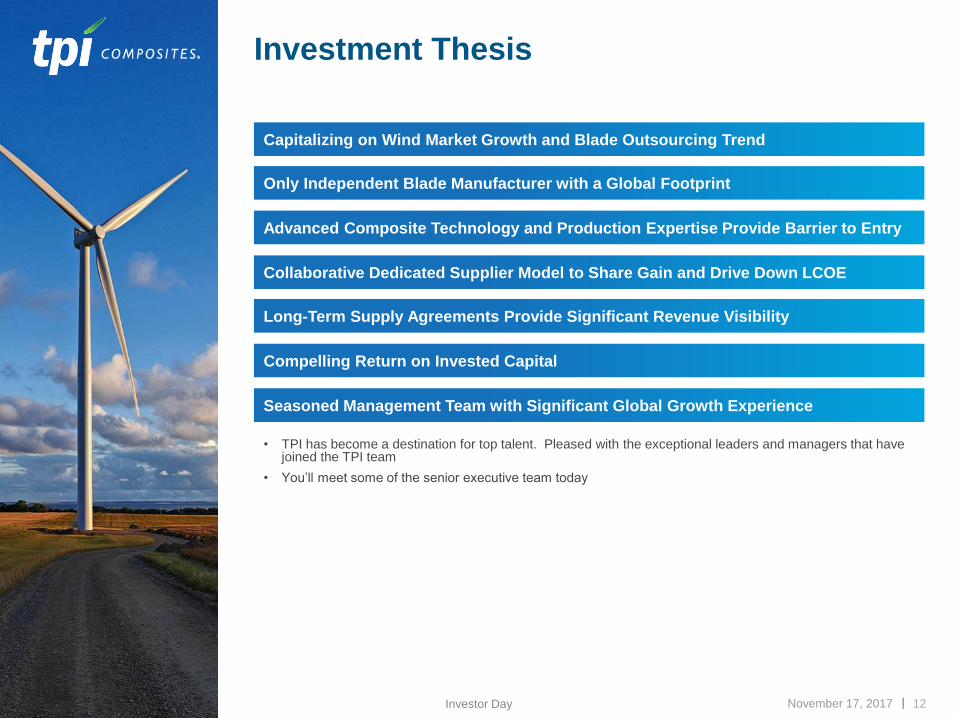
Capitalizing on Wind Market Growth and Blade Outsourcing Trend
Only Independent Blade Manufacturer with a Global Footprint
Advanced Composite Technology and Production Expertise Provide Barrier to Entry
Collaborative Dedicated Supplier Model to Share Gain and Drive Down LCOE
Long-Term Supply Agreements Provide Significant Revenue Visibility
Compelling Return on Invested Capital
Seasoned Management Team with Significant Global Growth Experience
• TPI has become a destination for top talent. Pleased with the exceptional leaders and managers that have joined the TPI team
• You’ll meet some of the senior executive team today

| |
TPI Financial Targets
November 17, 2017 13Investor Day
20%-25%Revenue Growth2016 A – 2019 E
12+%Adj. EBITDA Margin
35+%ROIC(1)
.
(1) ROIC target is based on an estimate of tax effected income from operations plus implied interest on operating leases divided by beginning
of the period capital which includes total shareholders’ equity plus cash and cash equivalents, total outstanding debt and the net present value
of operating leases.

| |
Key Messages
• Applying our advanced composites technology to major growth trends including the decarbonization of
the electric sector and clean transportation systems
• BNEF estimates that $10 trillion will be invested in new power generation capacity through 2040 and of
this, 72% will be renewables and $3.3 trillion will be wind
• BNEF estimates that by 2040 annual global EV sales will reach 65 million units
• MarketsandMarkets projects the aerospace composites market to grow from $24.5 billion in 2016 to
$43 billion by 2022, or a CAGR of 9.85% between 2017 and 2022
• Wind industry and market dynamics are rationalizing. Large global players are competing
• TPI is a large global player with >10% global share, ~20% ex-China and ~40% ex-China outsourced
and a strong global reach
• TPI has executed really well delivering revenue growth, market share growth, cost reduction,
operational improvements and profit expansion
• After four years of 45% annual revenue growth, 2018 will be an investment year, positioning us for
strong growth in 2019 and 2020
• Will continue to advance TPI technology, further expand global footprint, and drive world class cost to
differentiate and win
• Will utilize deep partnership business model to provide capacity flexibility and share gain to help our
customers increase market share while we maintain and grow our profit
• TPI strategy of strong and diversified growth will continue to build shareholder value
November 17, 2017 14Investor Day

| |
Today’s Agenda – NOVEMBER 17, 2017
8:30–9:15 am Opening Remarks: Steve Lockard
Wind Market and Growth Plans: Steve Lockard and Joe Kishkill
9:15–9:40 am Operational Excellence: Mark McFeely, TJ Castle
9:40–9:50 am Technology and Industrialization: Ramesh Gopalakrishnan
9:50–10:00 am Global Supply Chain: Jim Schimanski
10:00–10:30 am Q & A
10:30–10:50 am Coffee Break
10:50–11:50 am Financial Section: Bill Siwek
11:50 am–12:00 pm Closing Remarks: Steve Lockard
12:00–1:00 pm Lunch

| |
Key Biographies
November 17, 2017 16Investor Day
Joe KishkillChief Commercial Officer
• Joined TPI in August 2017
• Global energy executive
• 25 years in oil & gas, solar
• First Solar, Exterran, Enron
• BSEE Brown, MBA Harvard
Mark McFeelyChief Operating Officer
• Joined TPI in November 2015
• Global manufacturing operations executive
• 20 years in automotive and aerospace
• Remy, Danaher, Honeywell
• BA Colorado State, MBA Penn State
TJ Castle SVP North America and
Global Operational Excellence
• Joined TPI in November 2015
• Global manufacturing operations executive
• 21 years in aerospace
• Honeywell, GE
• BS Aeronautics St Louis
Ramesh GopalakrishnanSVP Technology & Industrialization
• Joined TPI in September 2016
• Global wind blade composites engineering and
manufacturing executive
• 20 years advanced composites
• Senvion, Suzlon, Halliburton, GE
• BS Indian Institute Tech, MS and PhD SUNY
Jim SchimanskiVP Global Supply Chain
• Joined TPI in May 2016
• Global manufacturing supply chain executive
• 30 years in manufacturing
• GE, Alstom
• BS Business Management, Russell Sage
College
Bill SiwekChief Financial Officer
• Joined TPI in September 2013
• International financial, operations and real estate
executive
• 33 years in accounting, finance, IT, operations
• T.W. Lewis, Lyle Andersen, Arthur Anderson
• BS Accounting and Economics, Univ. of
Redlands

| |
Steve Lockard – President and CEO
Joe Kishkill – Chief Commercial Officer
WIND MARKET AND GROWTH STRATEGY

| |
Onshore Global Market Growth
November 17, 2017 18Investor Day
42.5 38.3 40.5 43.0 44.7
41.4 40.7 38.5 40.5 44.7 45.9
7.6
8.1
11.7 14.1
14.5 14.3 14.2 15.5
16.6
17.6 17.8 50.1
46.4
52.2
57.159.2
55.7 54.9 54.057.1
62.363.7
2016 2017 2018 2019 2020 2021 2022 2023 2024 2025 2026
Developing wind markets
Mature wind markets
Annual installed global wind capacity (GW): 2016 – 2026E
Source: MAKE Q2 2017 Global W ind Power Market Outlook Update
Note: Developing wind markets defined as fewer than 6 GW of 2016 instal led capacity
8.8%CAGR
0.8%CAGR
Developing Markets Share
15.2% 17.5% 22.4% 24.7% 24.5% 25.6% 25.9% 28.6% 29.1% 28.3% 27.9%
Mature Markets Share84.8% 82.5% 77.6% 75.3% 75.5% 74.1% 74.1% 71.4% 70.9% 71.1% 72.1%
Annual installed wind capacity growth is propelled by an uptick in developing wind markets,
including Turkey and Mexico where TPI Composites is well positioned to succeed.

| |
Total Onshore and Offshore Global Market Growth
November 17, 2017 19Investor Day
Annual installed global wind capacity (GW): 2016 – 2026E
Source: MAKE Q2 2017 Global W ind Power Market Outlook Update
Offshore is starting from a smaller base but is growing at a faster pace and offers a growth opportunity for TPI
17.2%CAGR
50.1 46.4 52.2
57.0 59.2 55.6 55.0 54.0 57.1 62.3 63.7
2.3 3.1
4.1
5.3 4.4 5.6 7.0 6.6
9.5
10.1 11.1
52.449.5
56.3
62.3 63.661.2 62.0 60.6
66.6
72.474.8
2016 2017 2018 2019 2020 2021 2022 2023 2024 2025 2026E
Offshore
Onshore
2.4%CAGR
Offshore Wind Market Share
4.4% 6.2% 7.3% 8.5% 6.9% 9.2% 11.3% 10.9% 14.2% 13.9% 14.9%
Onshore Wind Market Share95.6% 93.8% 92.7% 91.5% 93.1% 90.8% 88.7% 89.1% 85.8% 86.1% 85.1%
| | November 17, 2017
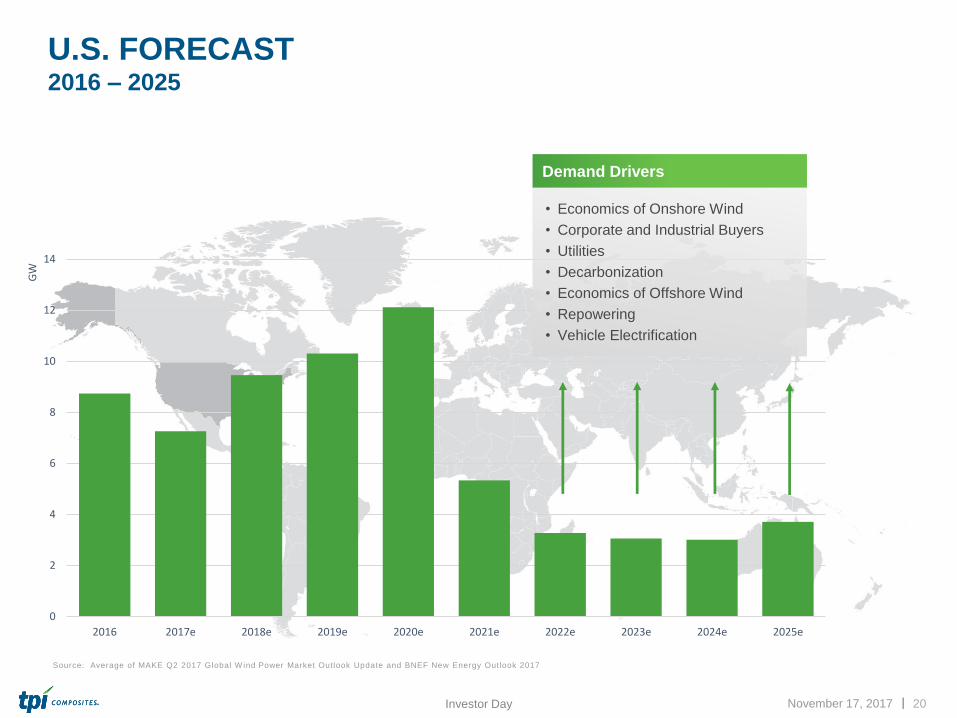
U.S. FORECAST 2016 – 2025
20Investor Day
0
2
4
6
8
10
12
14
2016 2017e 2018e 2019e 2020e 2021e 2022e 2023e 2024e 2025e
GW
• Economics of Onshore Wind
• Corporate and Industrial Buyers
• Utilities
• Decarbonization
• Economics of Offshore Wind
• Repowering
• Vehicle Electrification
Demand Drivers
Source: Average of MAKE Q2 2017 Global W ind Power Market Outlook Update and BNEF New Energy Outlook 2017

| |
EMEA FORECAST 2016 – 2025
November 17, 2017 21Analyst Day
Source: MAKE Consulting & Bloomberg New Energy Finance
0
5
10
15
20
25
2016 2017e 2018e 2019e 2020e 2021e 2022e 2023e 2024e 2025e
GW
| |
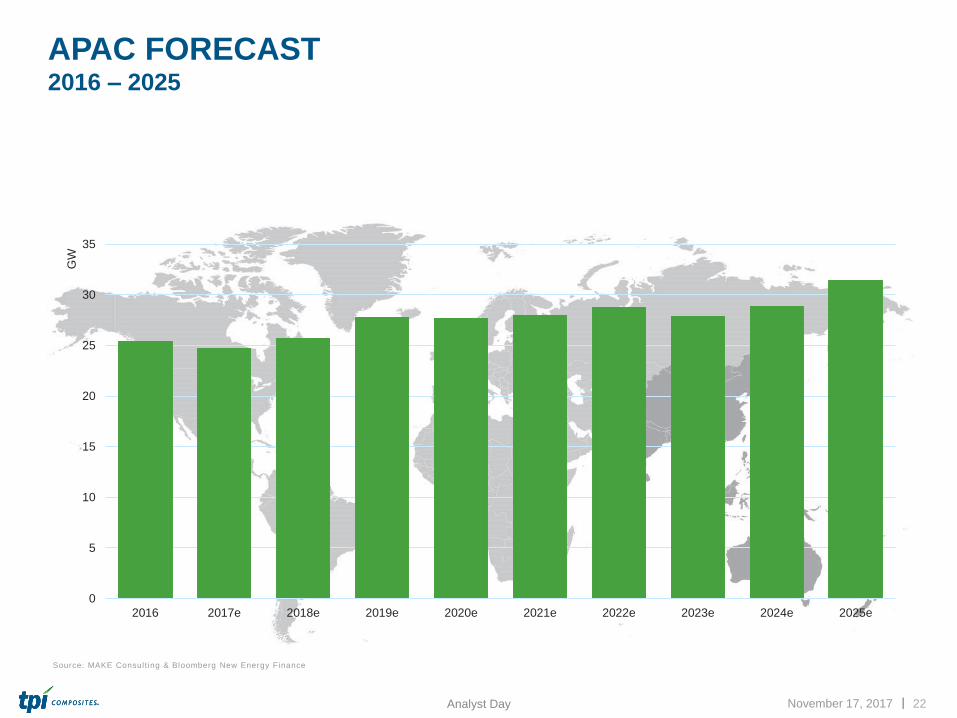
APAC FORECAST 2016 – 2025
November 17, 2017 22Analyst Day
Source: MAKE Consulting & Bloomberg New Energy Finance
0
5
10
15
20
25
30
35
2016 2017e 2018e 2019e 2020e 2021e 2022e 2023e 2024e 2025e
GW
| |
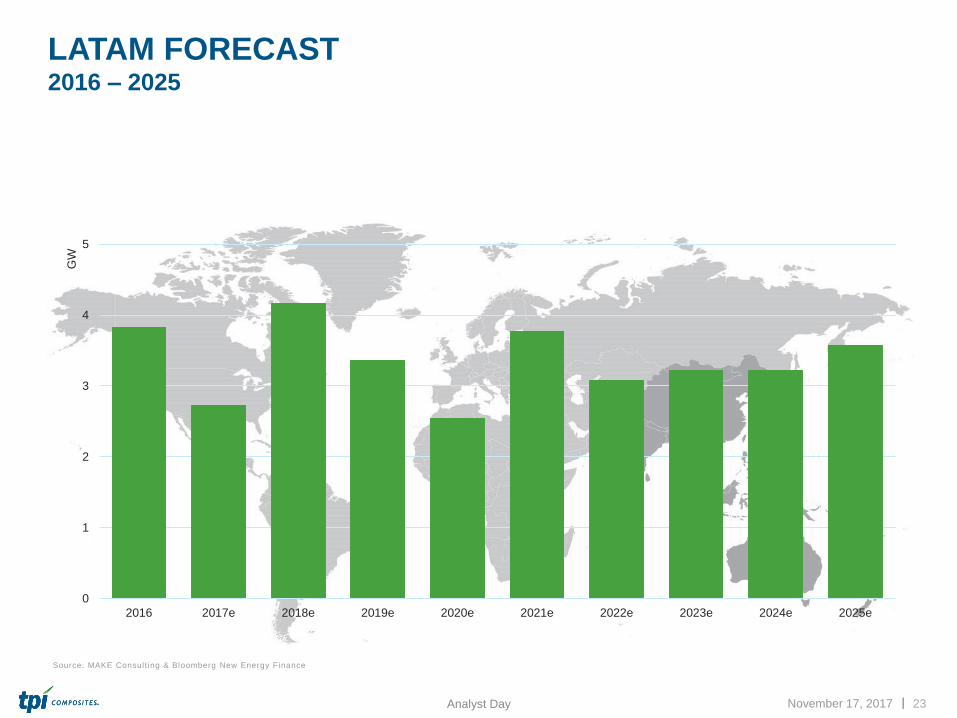
LATAM FORECAST 2016 – 2025
November 17, 2017 23Analyst Day
Source: MAKE Consulting & Bloomberg New Energy Finance
0
1
2
3
4
5
2016 2017e 2018e 2019e 2020e 2021e 2022e 2023e 2024e 2025e
GW

| |
Declining LCOEAllows Wind Energy to be More Competitive with Conventional Power
Generation
• The cost of onshore wind has declined by over
67% in the last eight years, with costs expected to
continue to fall due to progress made in reducing the
costs of wind turbines, improving capacity factors and
lower operating and maintenance costs over the next
decade
• Wind blades represent the second largest
component of the total cost of wind turbines. The
advancement of wind blade technology, including
increased blade length / rotor diameter, has
increased energy capture and played a fundamental
role in reducing LCOE for onshore wind
November 17, 2017 24Investor Day
Source: Lazard Level ized Cost of Energy Analysis (version 11.0).
1. Costs are on an unsubsidized basis. Ranges reflect di fferences in resources, geography, fuel costs and cost of capital , among other factors.
2. U.S. Department of Energy National Renewable Energy Laboratory (NREL)
$169
$148
$92 $95 $95
$81$77
$62 $60
$101 $99
$50 $48 $45$37 $32 $32 $30
$0
$63
$125
$188
$250
2009 2010 2011 2012 2013 2014 2015 2016 2017
Onshore wind
LCOE Mean
Onshore wind
LCOE Range
Global Onshore Wind LCOE Over Time(1)
— ($/MWh)
Global LCOE for onshore wind generation has become increasingly competitive and is now on par with new combined cycle gas turbines with an additional 50% decline expected by 2030(2)
67%Eight year percentage
decrease

| |
Demand Drivers
November 17, 2017 25Investor Day
Drivers U.S. Global
Economics of Onshore Wind
Corporate and Industrial Buyers
Utilities
Decarbonization
Repowering
Economics of Offshore Wind
Vehicle Electrification
Penetration in Large Markets
Emerging Markets
Availability and Stability of Electricity in Developing Countries

| |
Cost Effective and Flexible
GLOBAL REACH

| | November 17, 2017 27Investor Day
Global Footprint STRATEGICALLY OPTIMIZED FOR REGIONAL INDUSTRY DEMAND
Iowa, U.S.A.
By Truck
By Rail
| | November 17, 2017 28Investor Day
Iowa, U.S.A.
By Truck
By Rail
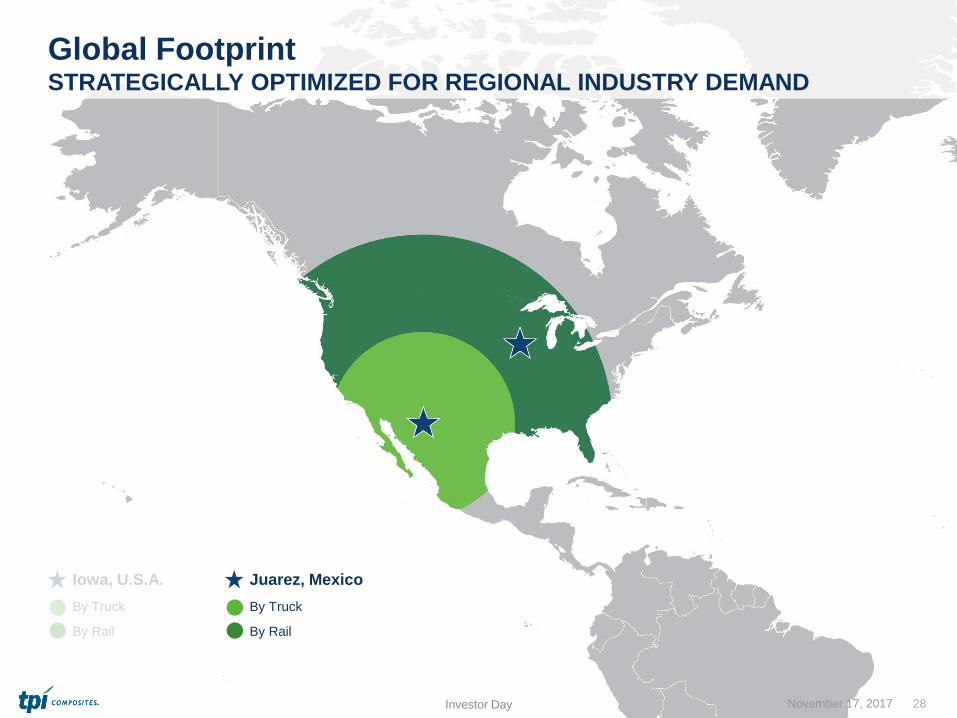
Juarez, Mexico
By Truck
By Rail
Global Footprint STRATEGICALLY OPTIMIZED FOR REGIONAL INDUSTRY DEMAND
| | November 17, 2017 29Investor Day
Iowa, U.S.A.
By Truck
By Rail
Juarez, Mexico
By Truck
By Rail
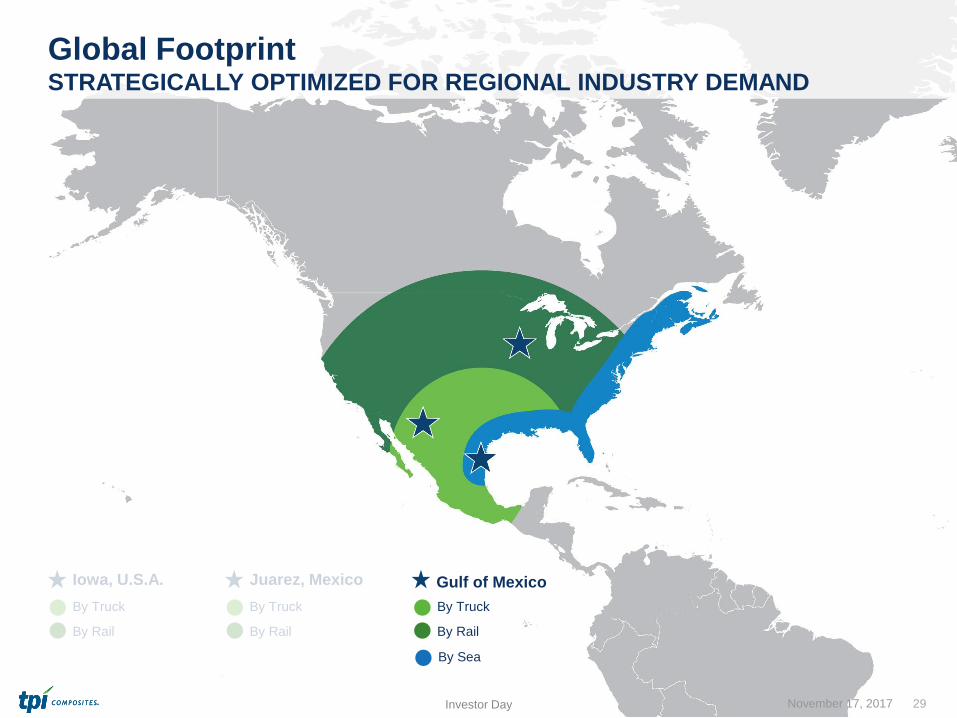
Gulf of Mexico
By Sea
By Truck
By Rail
Global Footprint STRATEGICALLY OPTIMIZED FOR REGIONAL INDUSTRY DEMAND
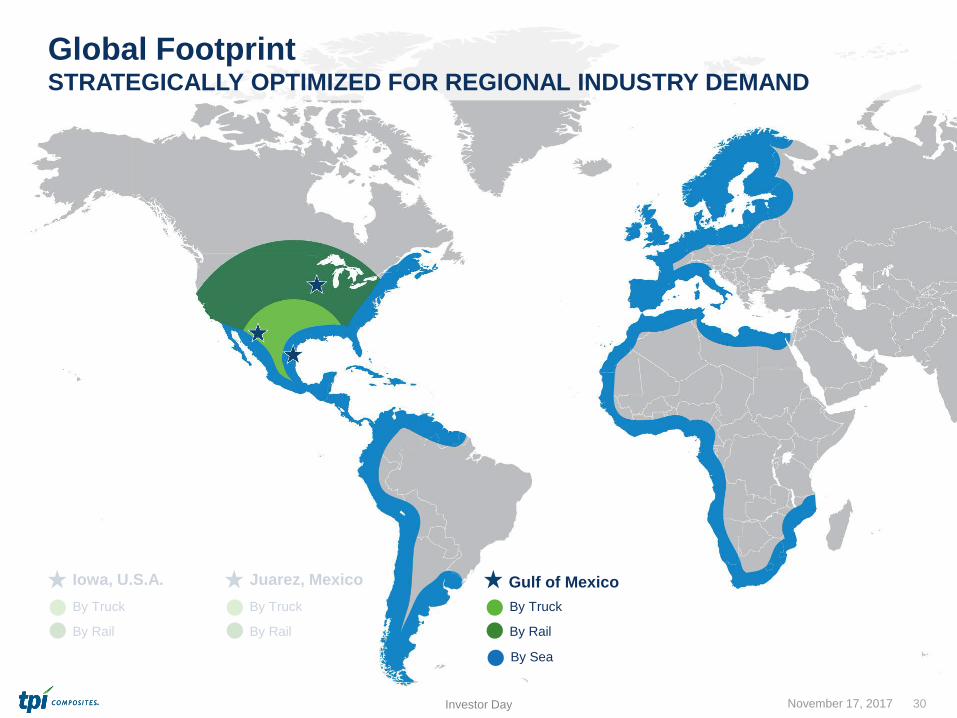
| | November 17, 2017 30Investor Day
Global Footprint STRATEGICALLY OPTIMIZED FOR REGIONAL INDUSTRY DEMAND
Iowa, U.S.A.
By Truck
By Rail
Juarez, Mexico
By Truck
By Rail
Gulf of Mexico
By Sea
By Truck
By Rail

| | November 17, 2017 31Investor Day
Global FootprintSTRATEGICALLY OPTIMIZED FOR REGIONAL INDUSTRY DEMAND
Turkey
By Truck
By Sea
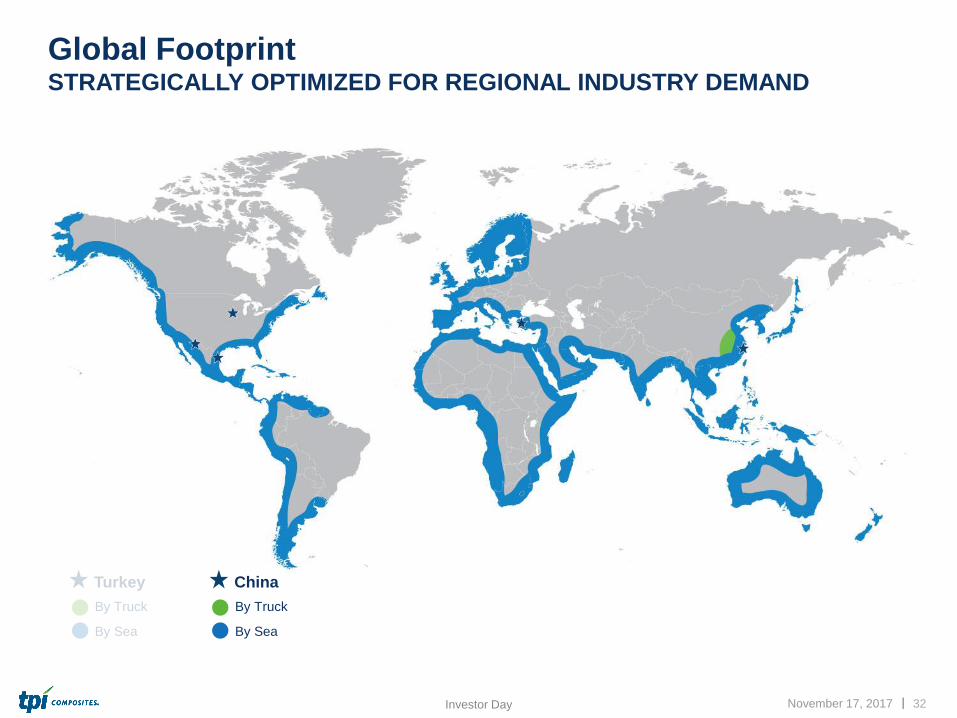
| | November 17, 2017 32Investor Day
Global Footprint STRATEGICALLY OPTIMIZED FOR REGIONAL INDUSTRY DEMAND
Turkey
By Truck
By Sea
China
By Truck
By Sea
| |
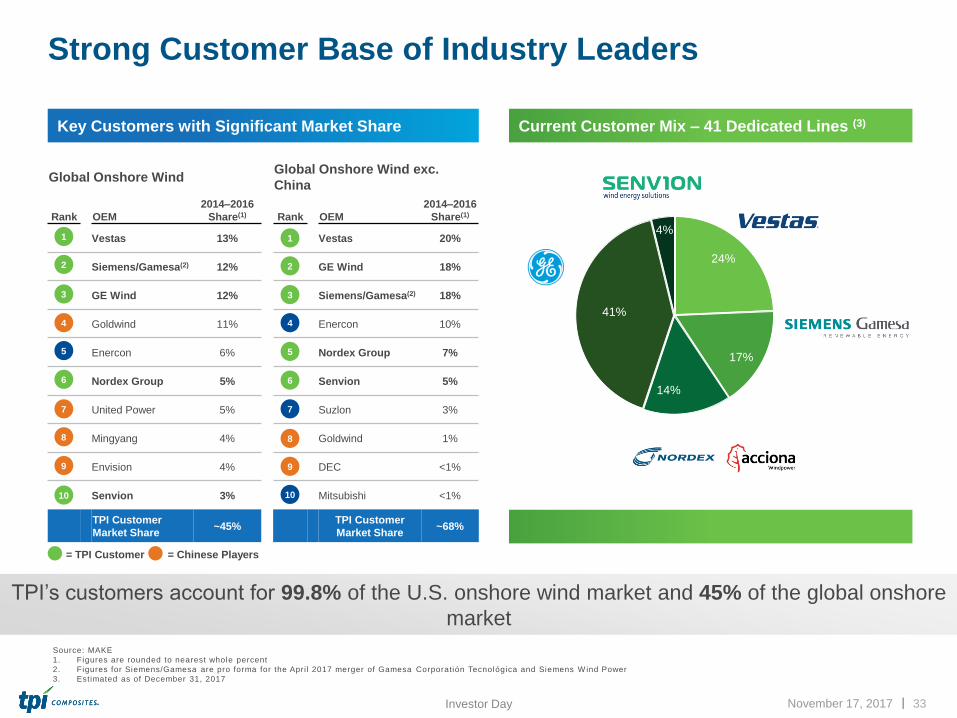
TPI’s customers account for 99.8% of the U.S. onshore wind market and 45% of the global onshore
market
Current Customer Mix – 41 Dedicated Lines (3)
Strong Customer Base of Industry Leaders
November 17, 2017 33Investor Day
= TPI Customer
Global Onshore Wind Global Onshore Wind exc.
China
Rank OEM
2014–2016
Share(1) Rank OEM
2014–2016
Share(1)
1 Vestas 13% Vestas 20%
2 Siemens/Gamesa(2) 12% GE Wind 18%
3 GE Wind 12% Siemens/Gamesa(2) 18%
4 Goldwind 11% Enercon 10%
5 Enercon 6% Nordex Group 7%
6 Nordex Group 5% Senvion 5%
7 United Power 5% Suzlon 3%
8 Mingyang 4% Goldwind 1%
9 Envision 4% DEC <1%
Senvion 3% Mitsubishi <1%
TPI Customer
Market Share ~45%
TPI Customer
Market Share~68%
1
2
4
5
7
3
6
8
9
= Chinese Players
1
2
5
6
3
4
9
7
8
10
Source: MAKE
1. Figures are rounded to nearest whole percent
2. Figures for Siemens/Gamesa are pro forma for the Apri l 2017 merger of Gamesa Corporatión Tecnológica and Siemens W ind Power
3. Estimated as of December 31, 2017
24%
17%
14%
41%
4%
Key Customers with Significant Market Share
10

| |
Prioritized Pipeline
November 17, 2017 34Investor Day
Annual Revenue Potential – Wind Only > $1.7 Billion
Prioritized Pipeline represents those opportunities
we have prioritized to close in the next twenty-four
months
Prioritized Pipeline – 22 lines
• 60-70m+ blades, >$35M/yr/line
• New and Existing Customers
• New and Existing Geographies
• Onshore and Offshore
Long-term
Revenue
Potential
Size of Total
Addressable
Market
OEM(s)
Share
(1) Annual revenue potential based on 2018 wind blade revenue guidance
(2) Annual revenue potential based on $35 million per line per year and that all lines are in full production
$970
$770
$0.0
$0.2
$0.4
$0.6
$0.8
$1.0
$1.2
$1.4
$1.6
$1.8
$2.0
2018 2018-2019
$ B
illio
ns
LinesUnder
Contract41
PrioritizedPipeline
22
(1) (2)

| |
Multiple development programs in:
• Passenger automotive
• EVs
• Commercial vehicles
Growing with Proterra
Diversification Strategy
November 17, 2017 35Investor Day
CLEAN TRANSPORTATION – In EVs, lighter weight equates to longer range or
fewer batteries which drives cost

| |
Diversification Strategy
November 17, 2017 36Investor Day
• Founded in 2004
• Offices and manufacturing in CA and SC
• 300+ employees, strong executive management team
• Backed by industry-leading VC and corporate investors
• >42 customers; >400 vehicles sold
• >117 vehicles delivered; >4,000,000 service miles
• >13,700,000 pounds of CO2 emissions avoided
• Demonstrated >1,100 miles on single charge
Proterra’s MissionAdvancing electric vehicle technology to deliver the world’s best-performing transit vehicles
Strong Executive Team
Solid Financial Backing
Source: Proterra Inc.

| |
Large Market Opportunity
• Addresses large opportunity given
mission-critical nature of transit
• Cusp of wide-spread adoption
• Technology applicable everywhere
• Compelling growth potential
November 17, 2017 37Investor Day
20 50150
270
525
1,000
1,600
2,140
2015 2016 2017 2018 2019 2020 2021 2022
0% 1% 3% 5% 8% 16% 24% 31%
% share of total transit
North American Electric Bus Market (Units)
Source: Frost & Sul l ivan, HD Transi t Bus Market – Global Analysis, March 2016
95%CAGR
| |
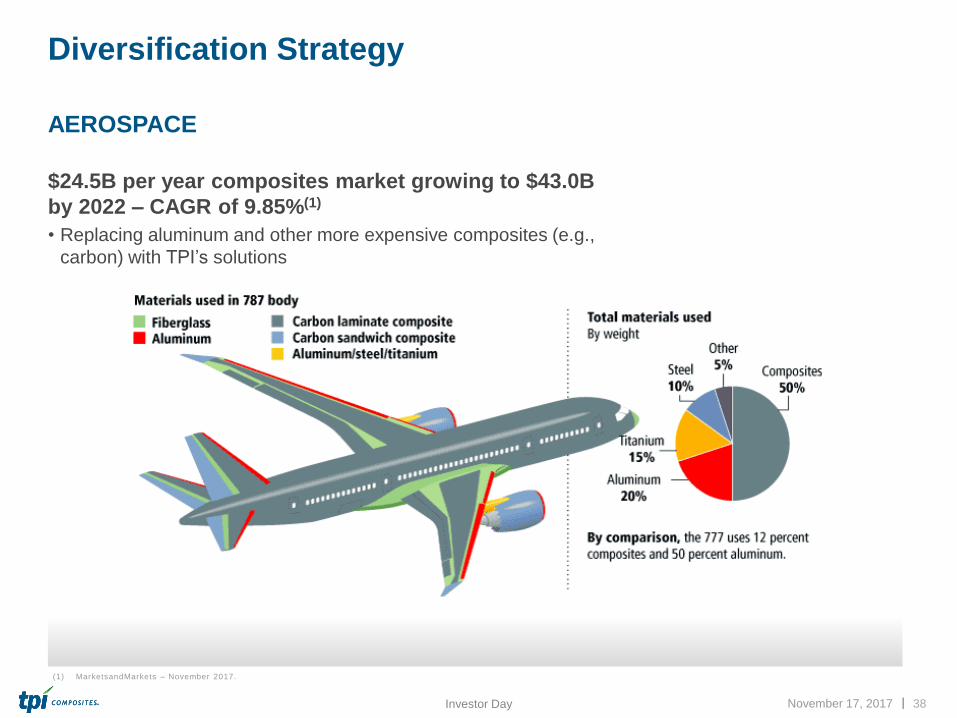
Diversification Strategy
$24.5B per year composites market growing to $43.0B
by 2022 – CAGR of 9.85%(1)
• Replacing aluminum and other more expensive composites (e.g.,
carbon) with TPI’s solutions
November 17, 2017 38Investor Day
AEROSPACE
(1) MarketsandMarkets – November 2017.

| |
Mark McFeely – COO
OPERATIONS OVERVIEW

| |
Relentless Pursuit of Operational Excellence
SAFETY
November 17, 2017 40Investor Day
• Repeatable Results from TPI Integrated Production System (TIPS)
• Focus on Advanced Technology to stay ahead
• Best in Class Supply Chain
QUALITY DELIVERY COST
Core Drivers OF OPERATIONAL EXCELLENCE
Consistent Focus ON RESULTS
| |
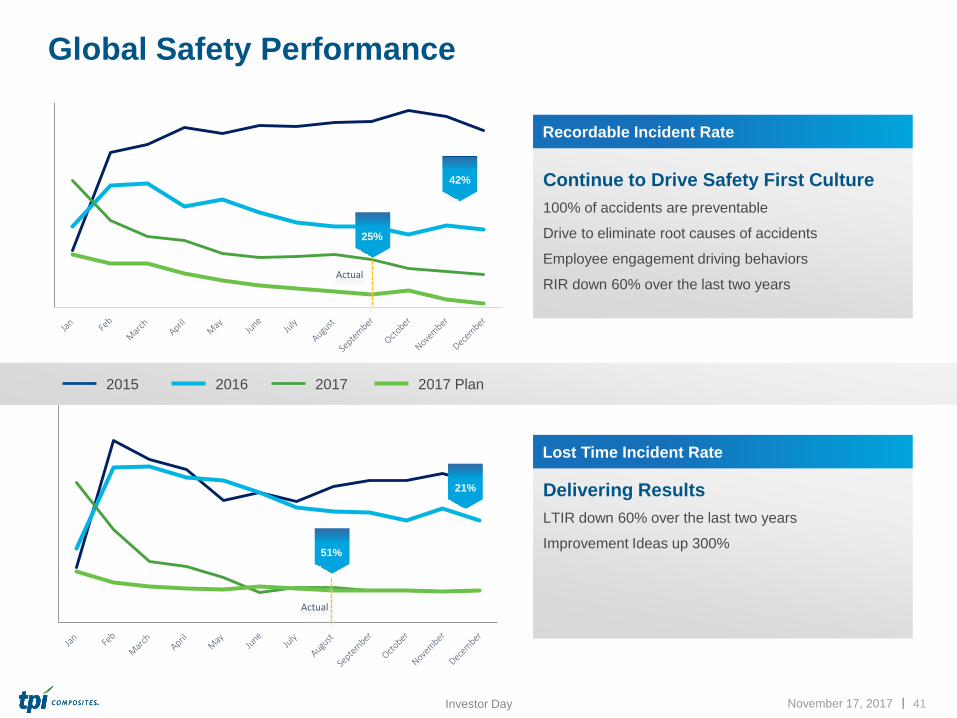
Global Safety Performance
November 17, 2017 41Investor Day
Recordable Incident Rate
Continue to Drive Safety First Culture
100% of accidents are preventable
Drive to eliminate root causes of accidents
Employee engagement driving behaviors
RIR down 60% over the last two years
Lost Time Incident Rate
Delivering Results
LTIR down 60% over the last two years
Improvement Ideas up 300%
Actual
Actual
25%
42%
21%
51%
2015 2016 2017 2017 Plan

| |
Global Quality Performance
Globally Standardized Systems and Processes Globally• ISO 9001 Quality Management System implemented at all locations
• Integrated Management System (Quality, Safety, Environmental) by end of 2018 at all sites
• Global Supply Chain Transformation (Oracle) and PLM software platform implemented at all sites
Data Driven Performance Improvement• > 40% reduction in rework hrs. YTD globally
• All sites showing significant improvement on
rework hour/blade reduction
• Driving Results with proven tools:
• Top 10 Defect Paretos
• Six Sigma, DFMEA.
Collaborative Approach with Customers• Executed two new programs in 2017 with two top customers where proactive design analysis, and
manufacturing process documentation were built collaboratively
• Collaboration is critical to prevention of design related quality/field issues as well as to reduce build
cycle time, e.g. on one blade model cycle time (CT) was reduced from 42 hours to 30 hours just
based on collaborate design initiatives
November 17, 2017 42Investor Day
2016 Avg 2017-Q1 2017-Q2 2017-Jul 2017-Aug 2017-Sep
| |
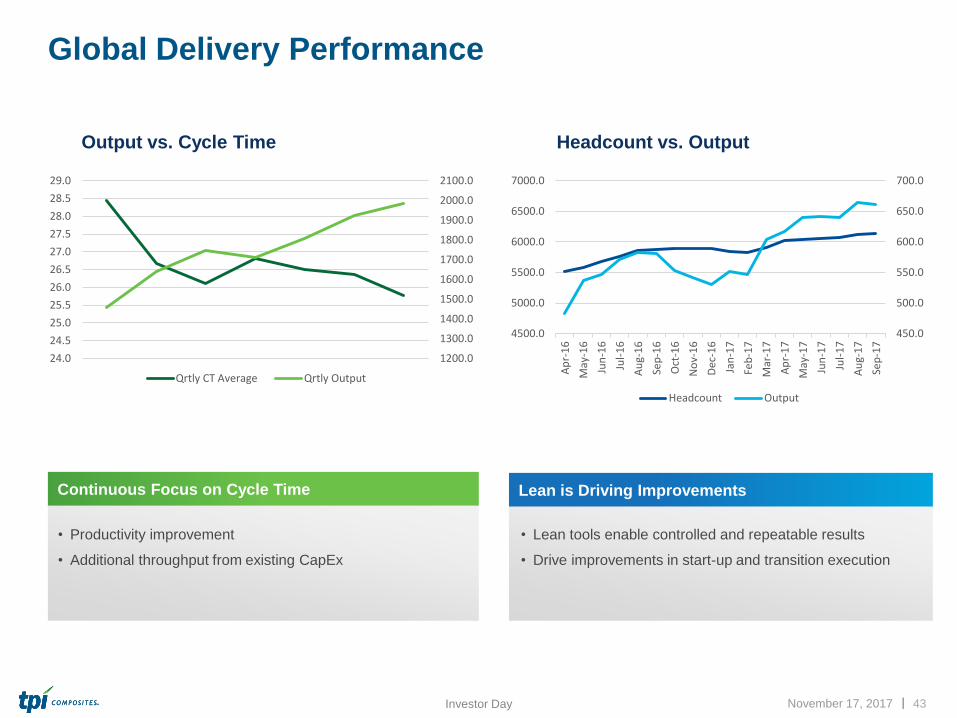
Global Delivery Performance
November 17, 2017 43Investor Day
1200.0
1300.0
1400.0
1500.0
1600.0
1700.0
1800.0
1900.0
2000.0
2100.0
24.0
24.5
25.0
25.5
26.0
26.5
27.0
27.5
28.0
28.5
29.0
Qrtly CT Average Qrtly Output
450.0
500.0
550.0
600.0
650.0
700.0
4500.0
5000.0
5500.0
6000.0
6500.0
7000.0
Ap
r-1
6
May
-16
Jun
-16
Jul-
16
Au
g-1
6
Sep
-16
Oct
-16
No
v-1
6
Dec
-16
Jan
-17
Feb
-17
Mar
-17
Ap
r-1
7
May
-17
Jun
-17
Jul-
17
Au
g-1
7
Sep
-17
Headcount Output
• Productivity improvement
• Additional throughput from existing CapEx
• Lean tools enable controlled and repeatable results
• Drive improvements in start-up and transition execution
Lean is Driving Improvements
Output vs. Cycle Time Headcount vs. Output
Continuous Focus on Cycle Time

| |
• Lean organization mindsets
and behaviors
• Balanced scorecard
• Daily accountability process
• Daily meeting structure
• Leader standard work
• Lean audits
• Tollgate reviews
• Visual displays
• Tools
• Instructions,
• Behaviors
Driving Repeatable Results
November 17, 2017 44Investor Day
Objectives of the Production System
Process
Improvement
Materials
Management
Process Reliably
& Duration
Factory
Organization
Culture of Continuous Improvement
Lean Culture
Lean Management System
Lean Operating System
Drive Process
Establishment expectation of continuous improvement
Management processes to sustain & continuously
improve the operating system processes
Safety, Quality, Delivery and Cost

| |
TJ Castle – SVP North America and Global Operational Excellence
TPI INTEGRATED PRODUCTION SYSTEM

| |
TIPS – TPI Integrated Production System
November 17, 2017 46Investor Day
Process Improvement
Tools to reduce defects,
cycle and lead time
• 5S
• RCCA
• CI Cards
• Visual Management
• Layered Audit
• Gemba walks
Materials Management
Exact, requirement-oriented
material provision (volume,
time, location, quality)
• Pull system/ KANBAN
• Inventory management
• Supplier management and
development
• Material presentation
Process Reliability
& Duration
Possibility of process
interruption in case of
problems
• Total Preventive
Maintenance (TPM)
• TQC (including firewall)
• Set up reduction
Operational Efficiency
Tools to Identify and
eliminate systemic issues
• Kaizen
• Value Stream Mapping
• Waste elimination
• Daily production boards
• Poka Yoke (Mistake Proof)
• Standard Work
TPI Integrated Production System
To facilitate synergy in the TPI organization that
produces highly functioning processes, people and
business through a lean culture.
Culture of Continuous Improvement
Safety, Quality, Delivery and Cost

| |
20
18
+ • Tiered Maturity Ratings system
• Full EHS integration
• External Supplier Engagement
• Organizational Design
• Process Automation
• Transition Tollgate Process
• Rapid Transition Readiness (RTR)
Broad integration of Lean: Inherent Product Quality (IPQ)
• Value Stream Mapping
• Leadership Standard Work
• Kanban
• Layered Audits
• Global Maturity Assessment
• TPM Maintenance
• Strategy Deployment
Additional Tools Deployed
20
17
TIPS Journey – DRIVING RESULTS
November 17, 2017 47Investor Day
• 5S
• Visual Management Boards
• Identifying the forms of waste
• Continuous Improvement
• Kaizen
• Poka Yoke (Mistake Proof)
• RCCA (Root Cause Analysis)
• Standard
Foundational Tools Deployed
20
16
Repair hrs./blade Output/monthRIR C/T DL hrs./blade
77% 74%30% 30% 100%
A journey in lean manufacturing, driving results in Safety, Quality, Delivery and Cost

| |
Ramesh Gopalakrishnan– SVP Technology & Industrialization
TECHNOLOGY AND INDUSTRIALIZATION

| |
TPI Technology
Advanced Technology
Collaborative Space
November 17, 2017 49Investor Day
Customer Technology
Aero DesignDesign of external shape (airfoil)
Structural DesignDesign of internal
structure
Material TechnologyDevelop new materials to
reduce weight and cost
Prototype BuildManufacture of zero
series blades
Tooling DesignAdvanced tooling
design to manufacture
bladesProcess TechnologyDevelop manufacturing
process technology to
enable manufacture
Design for Manufacturing
Technical Due Diligence

| |
Customer Technology
Aero DesignDesign of external shape (airfoil)
TPI Technology
Tooling DesignAdvanced tooling
design to manufacture
blades
Prototype BuildManufacture of zero
series blades
Material TechnologyDevelop new materials to
reduce weight and cost
Advanced Technology
November 17, 2017 50Investor Day
Structural DesignDesign of internal
structure
Process TechnologyDevelop manufacturing
process technology to
enable manufacture
Enhanced TPI Customer
Collaboration
• Technology Partnership built on long-term
relationships and mutual dependency
• ‘True’ Partnerships with customers in
their New Product Development process
• Move upstream - Collaborative due
diligence on Design for Manufacturing and
Risk Mitigation
• Customer Intimacy - Joint prototyping of
blades with customers in customer facilities
Design for Manufacturing
Technical Due Diligence
Collaborative Space
Structural DesignDesign of internal
structure
Material TechnologyDevelop new materials to
reduce weight and cost
Process TechnologyDevelop manufacturing
process technology to
enable manufacture
Design for Manufacturing
Technical Due Diligence

| |
Expanding Technology Development Footprint
November 17, 2017 51Investor Day
Rhode Island, US
•Deep historical partnerships
with U.S. Gov’t agencies to
advance composite
manufacturing technologies
•Pilot projects to demonstrate
new technologies like
thermoplastics
Kolding, Denmark
•Establishing Advanced
Technology Center to
enhance capabilities to
serve European customer
base
•Expand technical resource
base to enable growth
Izmir, Turkey
•Established AR-GE
program to leverage
Turkish Gov’t R&D
Funding
•R&D programs in tooling
and process engineering
Taicang, China
•Accredited materials lab
•Significant process and
tooling development
•Tooling transition process
expertise
Applied Development at all Manufacturing Sites Over 300 engineers globally. TPI is a destination for top talent.
| |
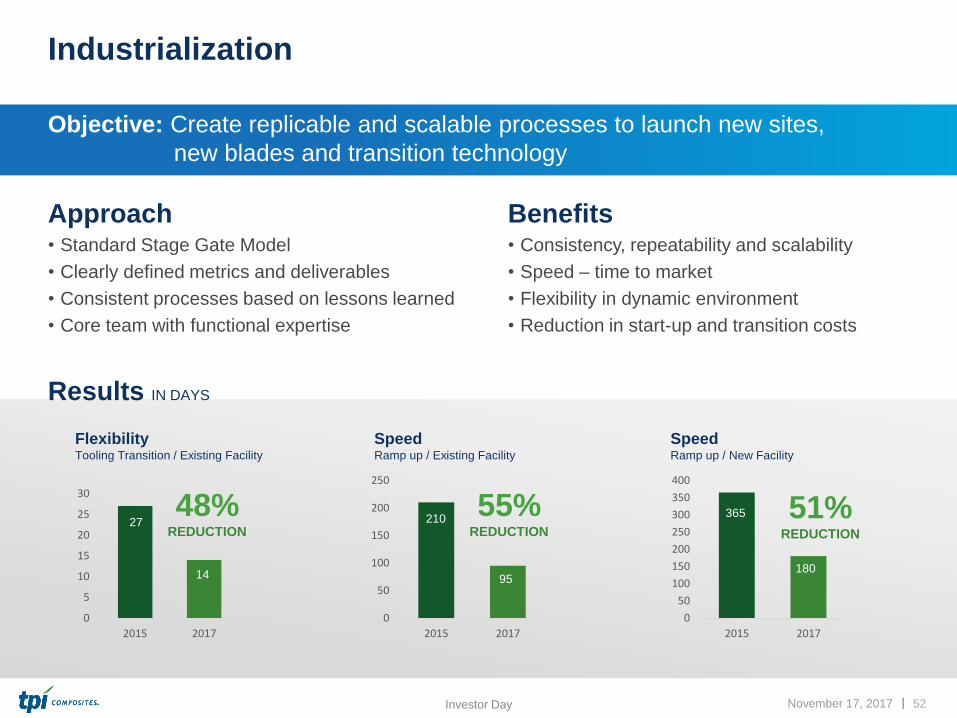
Industrialization
Approach• Standard Stage Gate Model
• Clearly defined metrics and deliverables
• Consistent processes based on lessons learned
• Core team with functional expertise
November 17, 2017 52Investor Day
Objective: Create replicable and scalable processes to launch new sites,
new blades and transition technology
Results IN DAYS
0
5
10
15
20
25
30
2015 2017
FlexibilityTooling Transition / Existing Facility
27
14
48%REDUCTION
0
50
100
150
200
250
2015 2017
SpeedRamp up / Existing Facility
210
95
55%REDUCTION
0
50
100
150
200
250
300
350
400
2015 2017
SpeedRamp up / New Facility
365
180
51%REDUCTION
Benefits • Consistency, repeatability and scalability
• Speed – time to market
• Flexibility in dynamic environment
• Reduction in start-up and transition costs

| |
Jim Schimanski – VP Global Supply Chain
GLOBAL SUPPLY CHAIN
| |
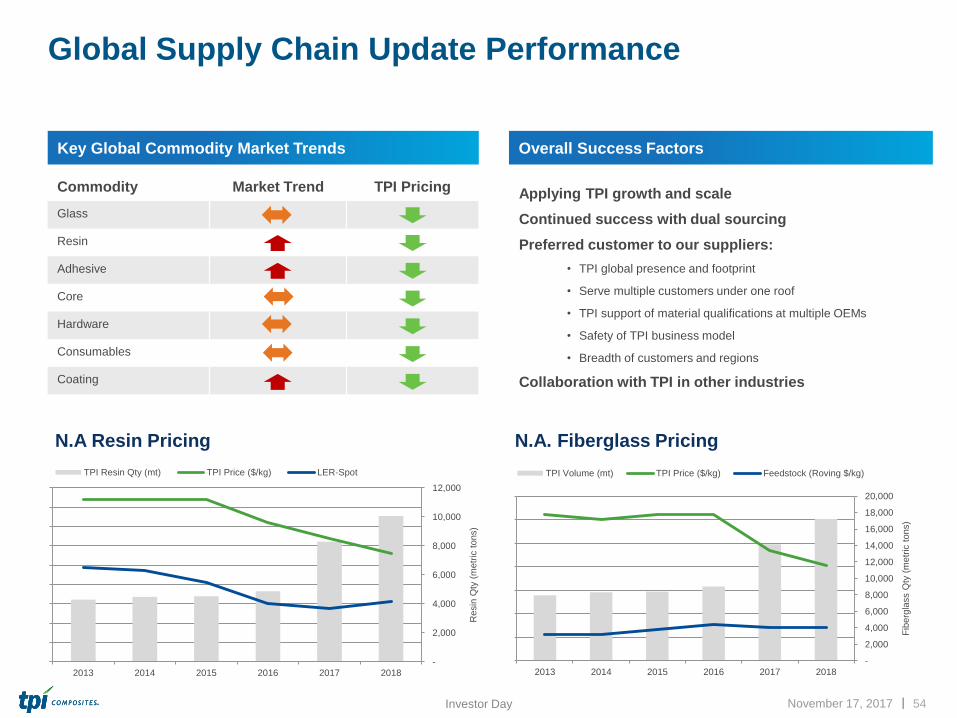
Global Supply Chain Update Performance
November 17, 2017 54Investor Day
Key Global Commodity Market Trends Overall Success Factors
Applying TPI growth and scale
Continued success with dual sourcing
Preferred customer to our suppliers:
• TPI global presence and footprint
• Serve multiple customers under one roof
• TPI support of material qualifications at multiple OEMs
• Safety of TPI business model
• Breadth of customers and regions
Collaboration with TPI in other industries
N.A Resin Pricing N.A. Fiberglass Pricing
Commodity Market Trend TPI Pricing
Glass
Resin
Adhesive
Core
Hardware
Consumables
Coating
-
2,000
4,000
6,000
8,000
10,000
12,000
$0.50
$1.00
$1.50
$2.00
$2.50
$3.00
$3.50
$4.00
$4.50
$5.00
2013 2014 2015 2016 2017 2018
Resin
Qty
(m
etr
ic t
ons)
TPI Resin Qty (mt) TPI Price ($/kg) LER-Spot
-
2,000
4,000
6,000
8,000
10,000
12,000
14,000
16,000
18,000
20,000
$1.00
$1.20
$1.40
$1.60
$1.80
$2.00
$2.20
$2.40
2013 2014 2015 2016 2017 2018
Fib
erg
lass Q
ty (
metr
ic t
ons)
TPI Volume (mt) TPI Price ($/kg) Feedstock (Roving $/kg)

| |
Spend and Savings
November 17, 2017 55Investor Day
• Team organized to focus on largest category spend
• Textile percentages vary based with carbon content
• Continued strong annual savings delivered
CHEMICALS30%
CONSUMABLES8%
CORE13%
HARDWARE7%
PRODUCTION MTL4%
TEXTILES36%
OTHER BOM1%
Spend by Category
$11.1
$27.7 $27.6
2016 2017 2018
Hardware/LPS
Core
Consumables
Textiles
Chemicals
RFP Year-over-Year Supplier Savings (%)
4%
8% 8%
| |
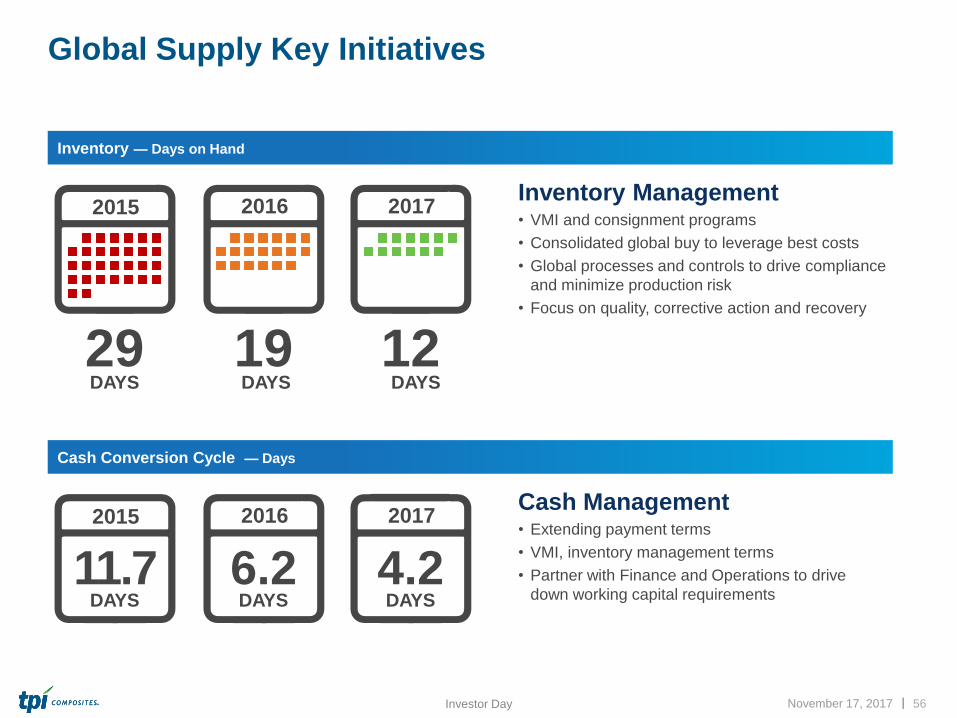
Global Supply Key Initiatives
November 17, 2017 56Investor Day
Inventory Management• VMI and consignment programs
• Consolidated global buy to leverage best costs
• Global processes and controls to drive compliance
and minimize production risk
• Focus on quality, corrective action and recovery
29DAYS
2015
19DAYS
2016
12DAYS
2017
Inventory — Days on Hand
Cash Management• Extending payment terms
• VMI, inventory management terms
• Partner with Finance and Operations to drive
down working capital requirements11.7
DAYS
2015
6.2DAYS
2016
4.2DAYS
2017
Cash Conversion Cycle — Days

| |
Q&A

| |
COFFEE BREAK

| |
Today’s Agenda – NOVEMBER 17, 2017
8:30–9:15 am Opening Remarks: Steve Lockard
Wind Market and Growth Plans: Steve Lockard and Joe Kishkill
9:15–9:40 am Operational Excellence: Mark McFeely, TJ Castle
9:40–9:50 am Technology and Industrialization: Ramesh Gopalakrishnan
9:50–10:00 am Global Supply Chain: Jim Schimanski
10:00–10:30 am Q & A
10:30–10:50 am Coffee Break
10:50–11:50 am Financial Section: Bill Siwek
11:50 am–12:00 pm Closing Remarks: Steve Lockard
12:00–1:00 pm Lunch

| |
Bill Siwek – Chief Financial Officer
FINANCIALS

| |
Financial Results
November 17, 2017 61Investor Day
$14
$39
$66
$20
$30
($0)
$10
$20
$30
$40
$50
$60
$70
2014 2015 2016 Q3 2016 Q3 2017
$321
$586
$755
$199 $243
$363
$600
$764
$196
$256
$0
$100
$200
$300
$400
$500
$600
$700
$800
$900
2014 2015 2016 Q3 2016 Q3 2017
Sales Billings
1. Total bi l l ings refers to the total amounts we have invoiced our customers for products and services for which we are enti t led to payment under the terms of our long-term
supply agreements or other contractual agreements
2. See appendix for reconci l iations of non-GAAP financial data
GAAP Net Sales and Total Billings ($ in millions) (1) (2) Adjusted EBITDA ($ in millions) (2)
52%‘13–’16 CAGR
99%‘13–’16 CAGR
4.2% 6.7% 8.8% 9.9% 12.4%Margin

| |
Q3 2017 Highlights
Operating results and year-over-year increases compared
to the third quarter 2016
• Net sales were up 22.3% to $243.4 million for the quarter
• Total billings were up 30.8% to $256.4 million for the quarter
• Net income for the quarter increased to $20.4 million versus
$2.8 million in Q3 2016
• Adjusted EBITDA for the quarter increased by 53.4% to $30.1
million
• Adjusted EBITDA margin for the quarter was up 250 bps to
12.4%
Signed a multiyear supply agreement with a Senvion for
two manufacturing lines in Taicang Port, China
Signed a five-year supply agreement with Proterra to
become the supplier of composite bus bodies for their
Catalyst® zero-emission electric transit buses
Hired Joe Kerkhove as Senior Vice President, Strategic
Markets to lead business development initiatives to expand
the application of TPI’s advanced composite technologies
to adjacent strategic markets such as aerospace and
transportation
November 17, 2017 62Investor Day
Q3 2017 Highlights and Recent Company News GAAP Net Sales ($ in millions)
$569
$683
$199
$243
$0
$200
$400
$600
$800
YTD 2016 YTD 2017 Q3'16 Q3 '17
20%INCREASE
22%INCREASE

| |
42%
18%
10%
29%
1%
Diversified GrowthBY GEOGRAPHY AND CUSTOMER
November 17, 2017 63Investor Day
2014 FYEDecember 31
By Geography
By Customer
45%
9%
21%
25% 25%
17%
18%
40%
73%
22%
1%
50%
18%
11%
20%
1%
Net Sales $321 million
2016 FYEDecember 31
Net Sales $586 million
2017 YTDSeptember 30
Net Sales $683 million
GE
Nordex/Acciona
SGRE
Vestas
Other
U.S.
Asia
EMEA
Mexico
4%
20%
19%
20%
41%

| |
Annual Revenue PotentialFROM DEDICATED LINES AND PRIORITIZED PIPELINE
November 17, 2017 64Investor Day
• Average annual revenue/line on new deals
increasing from $20 - $25 million to $35+
million – driven by higher ASP and higher
output/line.
• As we transition existing lines, revenue/line
will also increase due to higher ASP and
output/line – growth from existing lines.
• A fewer number of lines today and in the
future will provide the same or more
revenue potential and the same or more
MW as a larger number of lines in the past
Annual Revenue Potential – Wind Only > $1.7 Billion
(1) Annual revenue potential based on 2018 wind blade revenue guidance
(2) Annual revenue potential based on $35 million per line per year and that all lines are in full production
$970
$770
$0.0
$0.2
$0.4
$0.6
$0.8
$1.0
$1.2
$1.4
$1.6
$1.8
$2.0
2018 2018-2019
$ B
illio
ns
LinesUnder
Contract41
PrioritizedPipeline
22
(1) (2)
| |
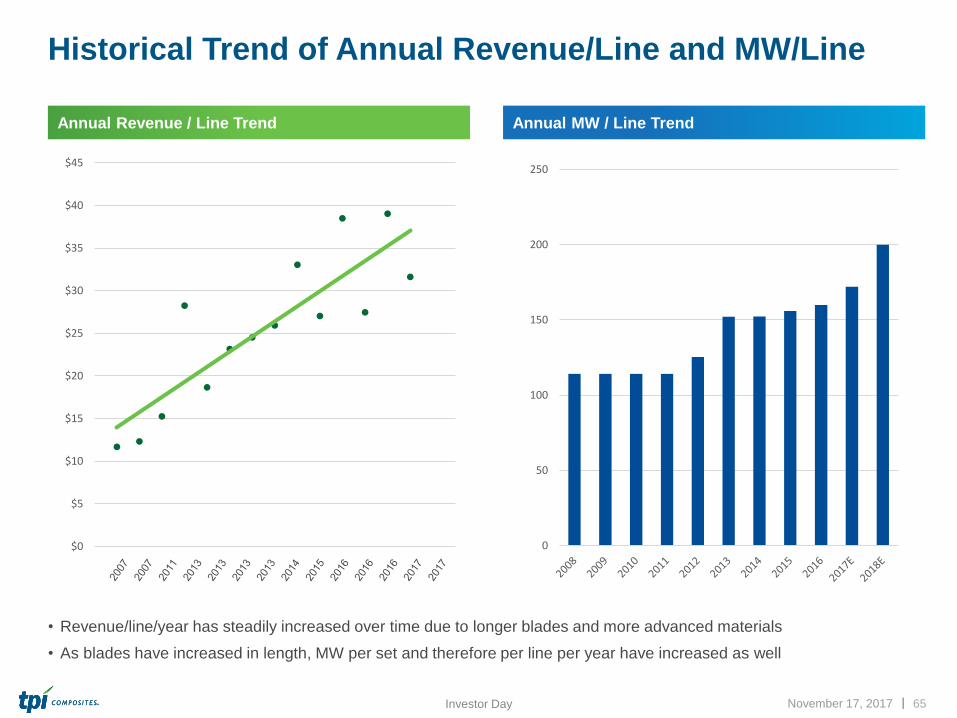
Historical Trend of Annual Revenue/Line and MW/Line
Annual Revenue / Line Trend
November 17, 2017 65Investor Day
Annual MW / Line Trend
• Revenue/line/year has steadily increased over time due to longer blades and more advanced materials
• As blades have increased in length, MW per set and therefore per line per year have increased as well
$0
$5
$10
$15
$20
$25
$30
$35
$40
$45
0
50
100
150
200
250
| |
GUIDANCE FOR 2018
AND TARGETS FOR 2019
| |
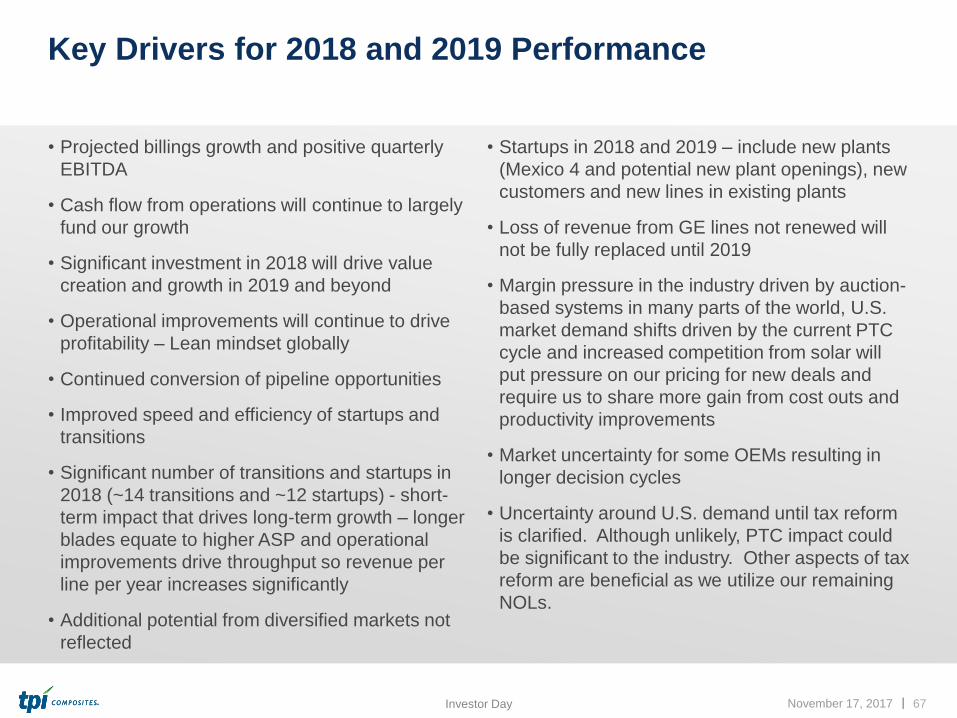
Key Drivers for 2018 and 2019 Performance
• Projected billings growth and positive quarterly
EBITDA
• Cash flow from operations will continue to largely
fund our growth
• Significant investment in 2018 will drive value
creation and growth in 2019 and beyond
• Operational improvements will continue to drive
profitability – Lean mindset globally
• Continued conversion of pipeline opportunities
• Improved speed and efficiency of startups and
transitions
• Significant number of transitions and startups in
2018 (~14 transitions and ~12 startups) - short-
term impact that drives long-term growth – longer
blades equate to higher ASP and operational
improvements drive throughput so revenue per
line per year increases significantly
• Additional potential from diversified markets not
reflected
• Startups in 2018 and 2019 – include new plants
(Mexico 4 and potential new plant openings), new
customers and new lines in existing plants
• Loss of revenue from GE lines not renewed will
not be fully replaced until 2019
• Margin pressure in the industry driven by auction-
based systems in many parts of the world, U.S.
market demand shifts driven by the current PTC
cycle and increased competition from solar will
put pressure on our pricing for new deals and
require us to share more gain from cost outs and
productivity improvements
• Market uncertainty for some OEMs resulting in
longer decision cycles
• Uncertainty around U.S. demand until tax reform
is clarified. Although unlikely, PTC impact could
be significant to the industry. Other aspects of tax
reform are beneficial as we utilize our remaining
NOLs.
November 17, 2017 67Investor Day
| | November 17, 2017 68Investor Day
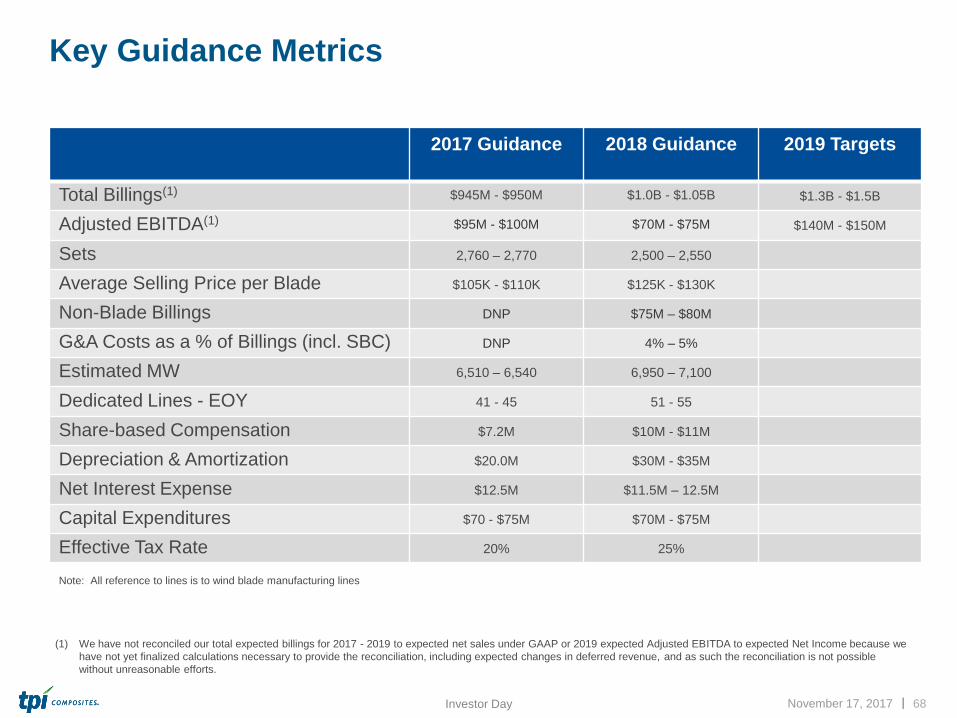
2017 Guidance 2018 Guidance 2019 Targets
Total Billings(1) $945M - $950M $1.0B - $1.05B $1.3B - $1.5B
Adjusted EBITDA(1) $95M - $100M $70M - $75M $140M - $150M
Sets 2,760 – 2,770 2,500 – 2,550
Average Selling Price per Blade $105K - $110K $125K - $130K
Non-Blade Billings DNP $75M – $80M
G&A Costs as a % of Billings (incl. SBC) DNP 4% – 5%
Estimated MW 6,510 – 6,540 6,950 – 7,100
Dedicated Lines - EOY 41 - 45 51 - 55
Share-based Compensation $7.2M $10M - $11M
Depreciation & Amortization $20.0M $30M - $35M
Net Interest Expense $12.5M $11.5M – 12.5M
Capital Expenditures $70 - $75M $70M - $75M
Effective Tax Rate 20% 25%
Note: All reference to lines is to wind blade manufacturing lines
Key Guidance Metrics
(1) We have not reconciled our total expected billings for 2017 - 2019 to expected net sales under GAAP or 2019 expected Adjusted EBITDA to expected Net Income because we
have not yet finalized calculations necessary to provide the reconciliation, including expected changes in deferred revenue, and as such the reconciliation is not possible
without unreasonable efforts.

| | November 17, 2017 69Investor Day
2018
2017 Q1 Q2 Q3 Q4 TOTAL
Lines Installed – end of period
41 41 40 47 47 47
Lines in Startup - during period
15 6 6 8 8 12
Lines in Transition -during period
4 7 10 10 5 14
Startup & Transition Costs
$40M $16M– $17M $19M – $20M $14M – $15M $9M – $10M $58M – $62M
Note: All reference to lines is to wind blade manufacturing lines
Startup and Transition Guidance Metrics

| |
Total Billings(1) (2)
Strong Financial Performance and Outlook
November 17, 2017 70Investor Day
22%Three-year
CAGR
$363
$600
$764
$948
$1,025
$1,400
$0
$200
$400
$600
$800
$1,000
$1,200
$1,400
$1,600
2014A 2015A 2016A 2017E 2018E 2019E
Adjusted EBITDA(1) (2)
$14
$39
$66
$98
$73
$145
$0
$20
$40
$60
$80
$100
$120
$140
$160
2014A 2015A 2016A 2017E 2018E 2019E
Note: Dollars in millions
(1) Estimates for 2017 – 2019 are shown at the midpoint of ranges provided. See appendix for reconciliation of non-GAAP financial data.
(2) We have not reconciled our total expected billings for 2017 - 2019 to expected net sales under GAAP or 2019 expected Adjusted EBITDA to expected Net Income because we have not yet
finalized calculations necessary to provide the reconciliation, including expected changes in deferred revenue, and as such the reconciliation is not possible without unreasonable efforts.
30%Three-year
CAGR
Margin % 4.2% 6.7% 8.8% 10.3% 7.1% 10.4%

| |
Total Billings Bridge
November 17, 2017 71Investor Day
Note: Dol lars in mi l l ions.
$1,025
$1,400
$86
$10
$948
$153$10
$369
$16
$500
$600
$700
$800
$900
$1,000
$1,100
$1,200
$1,300
$1,400
$1,500
2017 Billings Net Volume Net ASP Impact Other 2018 Billings Net Volume Net ASP Impact Other 2019 Billings
| |
Adjusted EBITDA Bridge
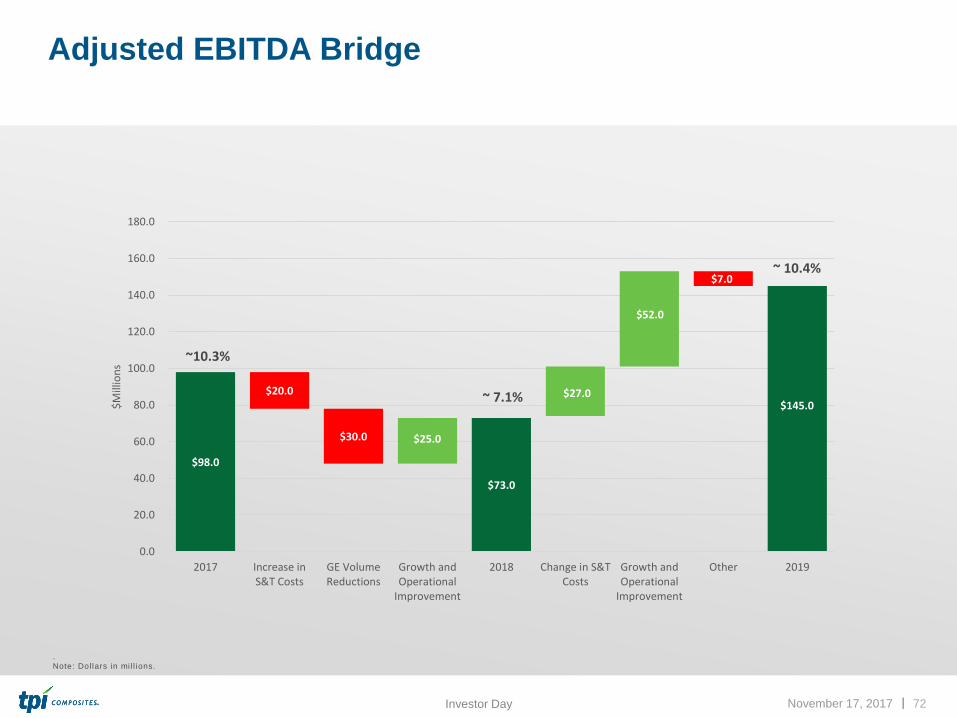
November 17, 2017 72Investor Day
.
Note: Dol lars in mi l l ions.
$73.0
$20.0
$30.0
$98.0
0.0
20.0
40.0
60.0
80.0
100.0
120.0
140.0
160.0
180.0
2017 Increase inS&T Costs
GE VolumeReductions
Growth andOperational
Improvement
2018 Change in S&TCosts
Growth andOperational
Improvement
Other 2019
$M
illio
ns
$27.0
$52.0
$7.0
$145.0
$25.0
~10.3%
~ 7.1%
~ 10.4%

| |
Pro Forma Adjusted EBITDA Walk
November 17, 2017 73Investor Day
2017E 2018E 2019E
Adjusted EBITDA (1) $ 98.0M $ 73.0M $145.0M
Add: Startup and Transition costs $ 40.0M $ 58.0M $33.0M
Pro forma Adjusted EBITDA $ 138.0M $ 131.0M $178.0M
Impact of GE non-renewal (30.0M) - -
Pro forma Adjusted EBITDA $ 108.0M $ 131.0M $178.0M
Pro forma Adjusted EBITDA Margin 13.1%(2) 12.7%(1) 12.7%(1)
(1) Based on mid-point of guidance and target
(2) Based on mid-point of total bi l l ings guidance reduced by GE revenue in Turkey and China

| |
Margin Evolution
2014 2015 2016 2017E 2018E 2019E
Gross Margin (GM) % 4.6% 7.1% 10.2% 11.9% 8.3% 12.0%
GM% before S&T 9.7% 9.8% 12.6% 16.2% 14.1% 14.6%
GM% before S&T at CC 8.0% 9.1% 10.5% 14.7% 14.1% 14.6%
November 17, 2017 74Investor Day

| |
Free Cash Flow and Capital Expenditures
November 17, 2017 75Investor Day
.
Note: Dol lars in mi l l ions.
(1) Free Cash Flow defined as operating cash flow less capital expenditures.
Free Cash Flow (1) Capital Expenditures
($52)
$5
$23
($0)
$4
$60
($60)
($40)
($20)
$0
$20
$40
$60
$80
2014A 2015A 2016A 2017E 2018E 2019E
$1
$8 $11 $11$15
$3
$24
$22
$62 $62
$40
$19 $26
$31
$73 $73
$55
$0
$10
$20
$30
$40
$50
$60
$70
2014A 2015A 2016A 2017E 2018E 2019E
Maintenance Growth

| |
TRANSITION AND EXPANSION ANALYSIS

| |
Illustrative Manufacturing Facility Expansion
Assumptions
Compelling Return on Invested Capital on New Plants
November 17, 2017 77Investor Day
Illustrative Plant Financial Results
Year 0 Year 1 Year 2 Year 3 Year 4 Year 5 Average
Net Sales $1 $132 $210 $210 $210 $210 $162
COGS (excluding depreciation) (8) (108) (174) (174) (174) (174) ($135)
EBITDA ($7) $24 $36 $36 $36 $36 $27
Taxes 0 (6) (9) (9) (9) (9) (7)
Tax-Effected EBITDA ($7) $18 $27 $27 $27 $27 $20
Depreciation (3) (5) (5) (5) (5) (5) (4)
Net Income ($10) $14 $23 $23 $23 $23 $16
Return on Invested Capital -17% 23% 38% 38% 38% 38% 26%
Invested Capital $60 $60 $60 $60 $60 $60 $60
Note: Return on Invested Capital (ROIC) is calculated as Net Income divided by Invested Capital
Financial Highlights
• 6 lines per plant
• Total invested capital of $60 million (CapEx and Startup Losses)
• Gross margin of 15%
• Illustrative effective tax rate of 25%
• Full run-rate achieved by end of year 2
• 500,000 sq. ft. per facility – leased by TPI
• Assumes 5 production year supply agreement(s)
• Assumes 25% - 30% of annual set volume from a line in startup during
the startup year
• Average sets per line per year of 75
• Steady state revenue of $210M per year
• $36M million of annual run-rate EBITDA
• Target hurdle ROIC of 25% over the first five years of production

| |
Transition Overview
November 17, 2017 78Investor Day
• More frequent than the past
Key Considerations
Transition Timing
• No significant “additional costs” other than potential CapEx
• 80% of Manufacturing Overhead (MOH) is fixed, therefore overhead costs are under-absorbed during transitions
• TPI does not layoff workers during transitions, resulting in both underutilized Direct Labor (DL) and slight benefit of
lower overtime during initial months of transition
• Impact on a particular plant includes lost revenue due to:
• Reduced volume during new mold install and ramp up. Approximately 45% - 50% of annual set volume from a line
in transition during the transition year; and
• Negative Operating Income and EBITDA impact due to under absorbed MOH and underutilized DL
Short-Term Costs
and Volume Impact
• In addition to transition fees charged to customers to cover opportunity and capital costs, TPI generally receives high-
margin, non-recurring engineering fees
• Premium pricing on the initial blades produced on the new lines helps cover transition costs
• Most full blade transitions will also involve some level of CapEx on the part of TPI, which is factored into new blade
pricing (depreciation and financing impact) and transition fees
• CapEx can include a plant expansion, which results in higher transition fees and generally requires a contract term
extension
Cost Recovery
Mechanisms
• Tooling Revenue and EBITDA is generally realized by our tooling factories reducing the global impact of a transition
• CapEx can include a plant’s expansion, resulting in higher transition fees and significant contract term extension
• With all full blade transitions, TPI generally requires the customer to extend the term of its contract which
significantly impacts TPI’s long-term revenue and profitability
• Serial production ASP on new blades is generally higher since new blades are larger and in many cases have more
advanced materials. Post-transition blade margins are also generally higher due to our “shared gain” contract structure
• Therefore, Revenue and EBITDA from new lines in serial production are higher, enabling TPI to recoup its entire
transition investment in a timely fashion, maximize ROIC and grow revenue.
Short- and
Long-Term Benefits

| |
SENSITIVITY ANALYSIS

| |
GE Sensitivity Analysis
• Like all of our customers, GE has minimum
volume commitments in each contract.
• We are currently GE’s only supplier of
blades from Mexico for their needs in the
U.S. and Mexico and GE has told us we are
an important partner for epoxy-based
blades to their home market
• Iowa serves the north central U.S. cost
effectively
• Mexico serves the western half of the U.S.
and Mexico cost effectively
• Pipeline beyond “Prioritized Pipeline” not
reflected
• Diversified market upside potential not
reflected
November 17, 2017 80Investor Day
Annual Wind-only Revenue Potential With and Without GE
(1) Annual revenue potential based on 2018 wind blade revenue guidance
(2) Annual revenue potential based on average annual revenue of $35 million per line per year and that all lines are in full production
(3) Reduction in annual revenue based on average annual revenue per line of approximately $25 million
(4) Annual revenue potential based on all lines at an average annual revenue of $32.5 million and that all lines are in full production
$1,625$325
$970
$770
$0.0
$0.2
$0.4
$0.6
$0.8
$1.0
$1.2
$1.4
$1.6
$1.8
$2.0
2018 2018-2019 2021 2021
0
200
400
600
800
1000
1200
1400
1600
1800
2000
$ B
illio
ns
Lines Under
Contract41
PrioritizedPipeline
22
GE Lines13
Lines50
(1) (2) (3) (4)
| |
ASC 606 IMPACT
| |
ASC 606: IMPACT TO TPI
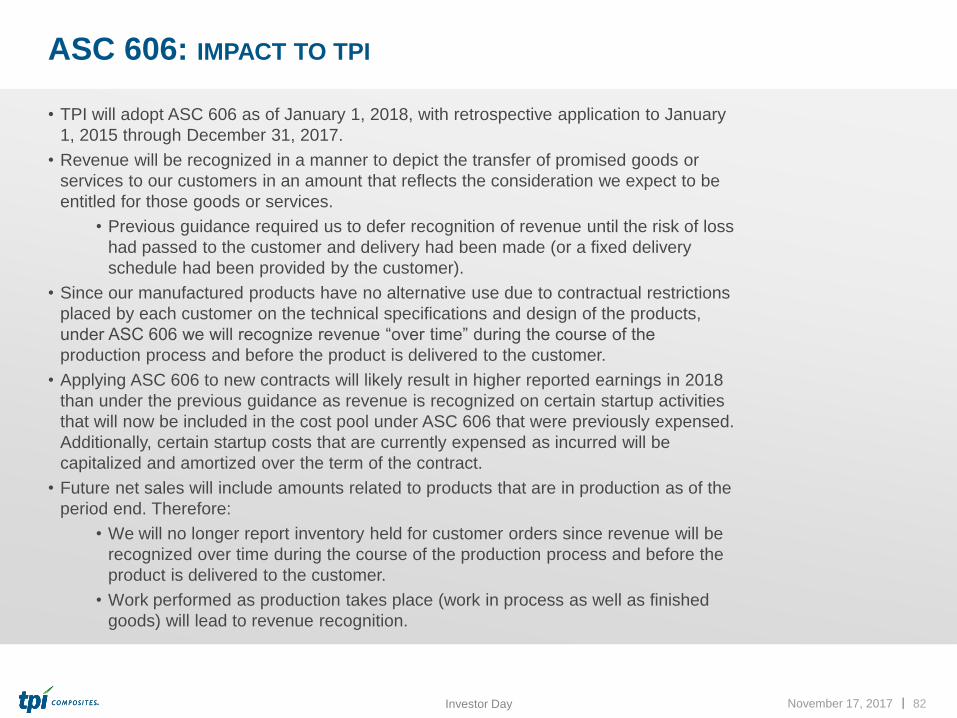
• TPI will adopt ASC 606 as of January 1, 2018, with retrospective application to January
1, 2015 through December 31, 2017.
• Revenue will be recognized in a manner to depict the transfer of promised goods or
services to our customers in an amount that reflects the consideration we expect to be
entitled for those goods or services.
• Previous guidance required us to defer recognition of revenue until the risk of loss
had passed to the customer and delivery had been made (or a fixed delivery
schedule had been provided by the customer).
• Since our manufactured products have no alternative use due to contractual restrictions
placed by each customer on the technical specifications and design of the products,
under ASC 606 we will recognize revenue “over time” during the course of the
production process and before the product is delivered to the customer.
• Applying ASC 606 to new contracts will likely result in higher reported earnings in 2018
than under the previous guidance as revenue is recognized on certain startup activities
that will now be included in the cost pool under ASC 606 that were previously expensed.
Additionally, certain startup costs that are currently expensed as incurred will be
capitalized and amortized over the term of the contract.
• Future net sales will include amounts related to products that are in production as of the
period end. Therefore:
• We will no longer report inventory held for customer orders since revenue will be
recognized over time during the course of the production process and before the
product is delivered to the customer.
• Work performed as production takes place (work in process as well as finished
goods) will lead to revenue recognition.
November 17, 2017 82Investor Day
| |
ASC 606: IMPACT TO TPI
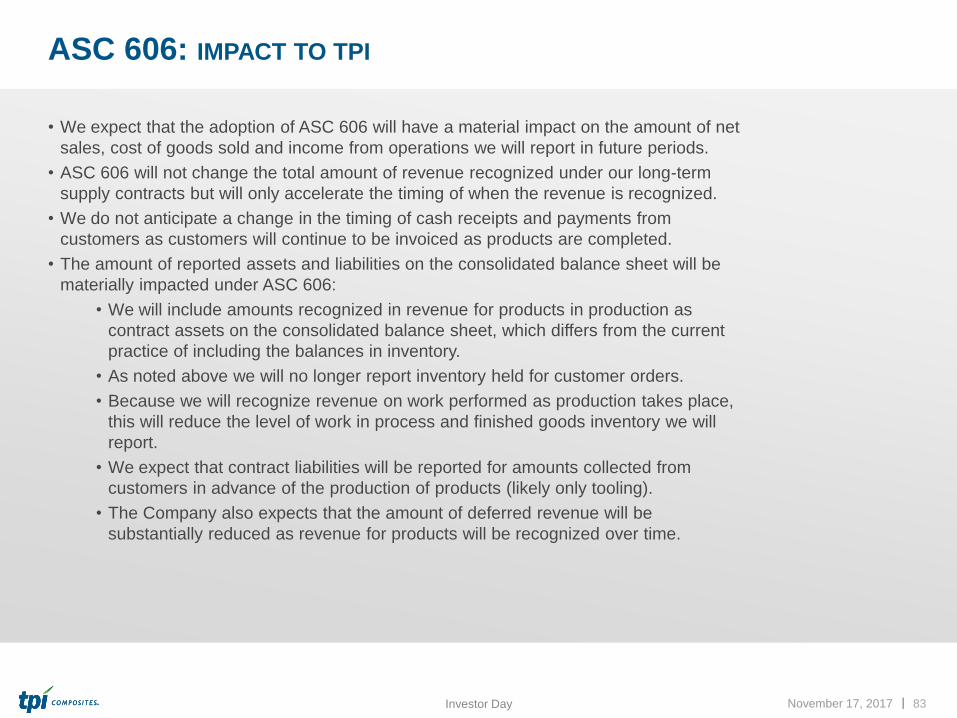
• We expect that the adoption of ASC 606 will have a material impact on the amount of net
sales, cost of goods sold and income from operations we will report in future periods.
• ASC 606 will not change the total amount of revenue recognized under our long-term
supply contracts but will only accelerate the timing of when the revenue is recognized.
• We do not anticipate a change in the timing of cash receipts and payments from
customers as customers will continue to be invoiced as products are completed.
• The amount of reported assets and liabilities on the consolidated balance sheet will be
materially impacted under ASC 606:
• We will include amounts recognized in revenue for products in production as
contract assets on the consolidated balance sheet, which differs from the current
practice of including the balances in inventory.
• As noted above we will no longer report inventory held for customer orders.
• Because we will recognize revenue on work performed as production takes place,
this will reduce the level of work in process and finished goods inventory we will
report.
• We expect that contract liabilities will be reported for amounts collected from
customers in advance of the production of products (likely only tooling).
• The Company also expects that the amount of deferred revenue will be
substantially reduced as revenue for products will be recognized over time.
November 17, 2017 83Investor Day

| |
Steve Lockard – President and CEO
CLOSING REMARKS

| |
Key Messages
November 17, 2017 85Investor Day
• Applying our advanced composites technology to major growth trends including the decarbonization of
the electric sector and clean transportation systems
• BNEF estimates that $10 trillion will be invested in new power generation capacity through 2040 and of
this, 72% will be renewables and $3.3 trillion will be wind
• BNEF estimates that by 2040 annual global EV sales will reach 65 million units
• MarketsandMarkets projects the aerospace composites market to grow from $24.5 billion in 2016 to
$43 billion by 2022, or a CAGR of 9.85% between 2017 and 2022
• Wind industry and market dynamics are rationalizing. Large global players are competing
• TPI is a large global player with >10% global share, ~20% ex-China and ~40% ex-China outsourced
and a strong global reach
• TPI has executed really well delivering revenue growth, market share growth, cost reduction,
operational improvements and profit expansion
• After 4 years of 45% growth, 2018 will be an investment year, positioning us for strong growth in 2019
and 2020
• Will continue to advance TPI technology, further expand global footprint, and drive world class cost to
differentiate and win
• Will utilize deep partnership business model to provide capacity flexibility and share gain to help our
customers increase market share while we maintain and grow our profit
• TPI strategy of strong and diversified growth will continue to build shareholder value

| |
THANK YOU
| |
APPENDIX

| |
Balance Sheets
November 17, 2017 88Analyst Day
December 31, September 30,
($ in thousands) 2015 2016 2017
Assets
Current assets:
Cash and cash equivalents $45,917 $119,066 $139,065
Restricted cash 1,760 2,259 3,802
Accounts receivable 72,913 67,842 134,458
Inventories 50,841 53,095 60,593
Inventories held for customer orders 49,594 52,308 69,788
Prepaid expenses and other current assets 31,337 30,657 29,776
Total current assets 252,362 325,227 437,482
Noncurrent assets:
Property, plant, and equipment, net 67,732 91,166 119,635
Goodwill and other intangible assets, net 3,226 3,072 2,957
Other noncurrent assets 6,600 17,741 16,287
Total assets $329,920 $437,206 $576,361
Liabilities and Shareholders' Equity
Current liabilities:
Accounts payable and accrued expenses $101,108 $112,281 $160,858
Accrued warranty 13,596 19,912 28,150
Current maturities of long-term debt 52,065 33,403 44,498
Deferred revenue 65,520 69,568 87,294
Customer deposits and customer advances 8,905 1,390 10,409
Total current liabilities 241,194 236,554 331,209
Non current liabilities:
Long-term debt 77,281 89,752 89,139
Other noncurrent liabilities 3,812 4,393 4,245
Total liabilities 322,287 330,699 424,593
Convertible and senior redeemable preferred shares and warrants 198,830 – –
Total shareholders' equity (deficit) (191,197) 106,507 151,768
Total liabilities and shareholders' equity (deficit) $329,920 $437,206 $576,361
Source: Year end 2015 and 2016 audited financial statements and interim September 30, 2017 unaudited financial statements .

| |
Income Statements
November 17, 2017 89Analyst Day
Year Ended December 31,
Nine Months Ended
September 30,
Three Months Ended
September 30,
($ in thousands) 2014 2015 2016 2016 2017 2016 2017
Net sales $320,747 $585,852 $754,877 $569,303 $683,142 $198,938 $243,354
Cost of sales 289,528 528,247 659,745 499,896 568,659 171,648 198,141
Startup and transition costs 16,567 15,860 18,127 11,449 29,051 5,088 12,352
Total cost of goods sold 306,095 544,107 677,872 511,345 597,710 176,736 210,493
Gross profit 14,652 41,745 77,005 57,958 85,432 22,202 32,861
General and administrative expenses 9,175 14,126 33,892 24,154 28,373 14,065 9,315
Income from operations 5,477 27,619 43,113 33,804 57,059 8,137 23,546
Other income (expense):
Interest income 186 161 344 76 78 27 48
Interest expense (7,236) (14,565) (17,614) (12,709) (9,215) (4,663) (3,254)
Loss on extinguishment of debt (2,946) – (4,487) – – – –
Realized gain (loss) on foreign currency remeasurement (1,743) (1,802) (757) (700) (2,575) (243) 39
Miscellaneous income (expense) 539 246 238 192 968 (152) 390
Total other expense (11,200) (15,960) (22,276) (13,141) (10,744) (5,031) (2,777)
Income (loss) before income taxes (5,723) 11,659 20,837 20,663 46,315 3,106 20,769
Income tax provision (925) (3,977) (6,995) (4,565) (8,514) (309) (371)
Net income (loss) (6,648) 7,682 13,842 16,098 37,801 2,797 20,398
Net income attributable to preferred shareholders 13,930 9,423 5,471 5,471 – 596 –
Net income (loss) attributable to common shareholders ($20,578) ($1,741) $8,371 $10,627 $37,801 $2,201 $20,398
Non-GAAP Metrics:
Total billings $362,749 $600,107 $764,424 $566,779 $698,833 $196,095 $256,404
Adjusted EBITDA $13,457 $39,281 $66,150 $51,816 $76,443 $19,632 $30,118
Source: Year end 2014 through 2016 audited financial statements and interim September 30, 2017 and 2016 unaudited financial s tatements.

| |
Cash Flow Statements
November 17, 2017 90Analyst Day
Year Ended December 31,Nine Months Ended
September 30,Three Months Ended
September 30,
($ in thousands) 2014 2015 2016 2016 2017 2016 2017
Cash flows from operating activities
Net income (loss) ($6,648) $7,682 $13,842 $16,098 $37,801 $2,797 $20,398
Loss on disposal of property and equipment 128 185 – – – – –
Depreciation and amortization 7,441 11,416 12,897 9,703 13,622 3,530 5,139
Amortization of debt issuance costs 715 1,303 1,663 1,273 430 443 144
Loss on extinguishment of debt 2,946 – 4,487 – – – –
Amortization of debt discount – 3,016 3,018 3,018 – 1,509 –
Share-based compensation expense – – 9,902 8,117 4,794 8,117 1,043
Loss on investment in joint venture 6 2 2 – – – –
Amortization of discount on customer advances 218 – – – – – –
Deferred income taxes (1,018) (765) (2,782) – – – –
Changes in assets and liabilities (37,005) 8,454 10,812 (10,233) (5,124) 1,405 (9,134)
Net cash provided by (used in) operating activities (33,217) 31,293 53,841 27,976 51,523 17,801 17,590
Cash flows from investing activities
Proceeds from sale of assets – 146 – – – – –
Purchase of property and equipment (18,924) (26,361) (30,507) (18,917) (35,312) (4,673) (8,585)
Net cash used in investing activities (18,924) (26,215) (30,507) (18,917) (35,312) (4,673) (8,585)
Cash flows from financing activities
Proceeds from issuance of common stock – – 67,199 67,199 – 67,199 –
Net proceeds from (repayment of) debt 77,220 1,554 (15,370) (14,179) 5,302 (2,186) 380
Debt issuance costs (4,818) (1,113) – – – – –
Payment on acquisition of noncontrolling interest (1,625) (1,875) – – – – –
Net proceeds from (repayment of) customer advances 4,500 – – – – (2,000) –
Proceeds from issuance of preferred stock 6,846 – – – – – –
Proceeds from exercise from stock options – – – – 988 – 988
Repurchase of common stock including shares withheld in lieu of income taxes
– – – – (1,264) – (1,264)
Restricted cash 1,898 (989) (499) (649) (1,543) (1) (1,019)
Net cash provided by (used in) financing activities 84,021 (2,423) 51,330 52,371 3,483 63,012 (915)
Impact of foreign exchange rates on cash and cash equivalents
(43) (330) (1,515) (545) 305 (395) 141
Net change in cash and cash equivalents 31,837 2,325 73,149 60,885 19,999 75,745 8,231
Cash and cash equivalents, beginning of period 11,755 43,592 45,917 45,917 119,066 31,057 130,834
Cash and cash equivalents, end of period $43,592 $45,917 $119,066 $106,802 $139,065 $106,802 $139,065
Non-GAAP Metric:
Free cash flow $(52,141) $4,932 $23,334 $9,059 $16,211 $13,128 $9,005
Source: Year end 2014 through 2016 audited financial statements and interim September 30, 2017 and 2016 unaudited financial s tatements.
| |
Non-GAAP Reconciliations
Net sales is reconciled to total billings as follows:
November 17, 2017 91Analyst Day
Year Ended December 31,
Nine Months Ended
September 30,
Three Months Ended
September 30,
($ in thousands) 2014 2015 2016 2016 2017 2016 2017
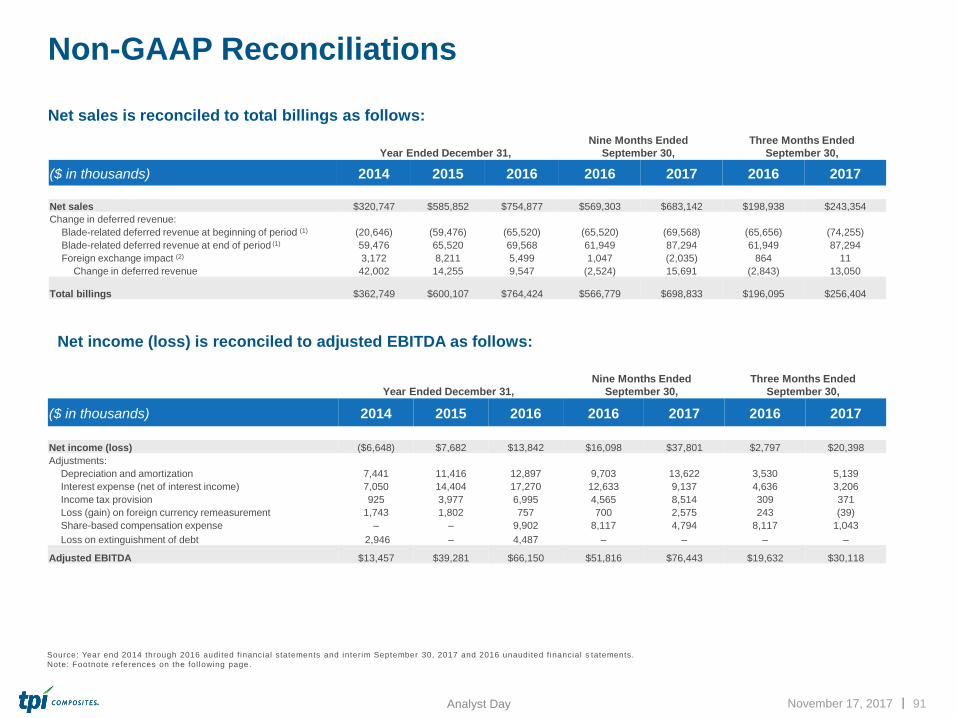
Net sales $320,747 $585,852 $754,877 $569,303 $683,142 $198,938 $243,354
Change in deferred revenue:
Blade-related deferred revenue at beginning of period (1) (20,646) (59,476) (65,520) (65,520) (69,568) (65,656) (74,255)
Blade-related deferred revenue at end of period (1) 59,476 65,520 69,568 61,949 87,294 61,949 87,294
Foreign exchange impact (2) 3,172 8,211 5,499 1,047 (2,035) 864 11
Change in deferred revenue 42,002 14,255 9,547 (2,524) 15,691 (2,843) 13,050
Total billings $362,749 $600,107 $764,424 $566,779 $698,833 $196,095 $256,404
Year Ended December 31,
Nine Months Ended
September 30,
Three Months Ended
September 30,
($ in thousands) 2014 2015 2016 2016 2017 2016 2017
Net income (loss) ($6,648) $7,682 $13,842 $16,098 $37,801 $2,797 $20,398
Adjustments:
Depreciation and amortization 7,441 11,416 12,897 9,703 13,622 3,530 5,139
Interest expense (net of interest income) 7,050 14,404 17,270 12,633 9,137 4,636 3,206
Income tax provision 925 3,977 6,995 4,565 8,514 309 371
Loss (gain) on foreign currency remeasurement 1,743 1,802 757 700 2,575 243 (39)
Share-based compensation expense – – 9,902 8,117 4,794 8,117 1,043
Loss on extinguishment of debt 2,946 – 4,487 – – – –
Adjusted EBITDA $13,457 $39,281 $66,150 $51,816 $76,443 $19,632 $30,118
Source: Year end 2014 through 2016 audited financial statements and interim September 30, 2017 and 2016 unaudited financial s tatements.
Note: Footnote references on the fol lowing page .
Net income (loss) is reconciled to adjusted EBITDA as follows:

| |
Non-GAAP Reconciliations (CONT’D)
November 17, 2017 92Analyst Day
1. Total billings is reconciled using the blade-related deferred revenue amounts at the beginning and the end of the period as foll ows:
Year Ended December 31,
Nine Months Ended
September 30,
Three Months Ended
September 30,
($ in thousands) 2014 2015 2016 2016 2017 2017 2017
Blade-related deferred revenue at beginning of period $20,646 $59,476 $65,520 $65,520 $69,568 $65,656 $74,255
Non-blade related deferred revenue at beginning of period 757 – – – – – –
Total current and noncurrent deferred revenue at beginning of
period $21,403 $59,476 $65,520 $65,520 $69,568 $65,656 $74,255
Blade-related deferred revenue at end of period $59,476 $65,520 $69,568 $61,949 $87,294 $61,949 $87,294
Non-blade related deferred revenue at end of period – – – – – – –
Total current and noncurrent deferred revenue at end of
period $59,476 $65,520 $69,568 $61,949 $87,294 $61,949 $87,294
Source: Year end 2014 through 2016 audited financial statements and interim September 30, 2017 and 2016 unaudited financial s tatements.
2. Represents the effect of the difference between the exchange rate used by our various foreign subsidiaries on the invoice dat e
versus the exchange rate used at the period-end balance sheet date.
| |
Non-GAAP Reconciliations (CONT’D)
November 17, 2017 93Analyst Day
Year Ended December 31,Nine Months Ended
September 30,Three Months Ended
September 30,
($ in thousands) 2014 2015 2016 2016 2017 2016 2017
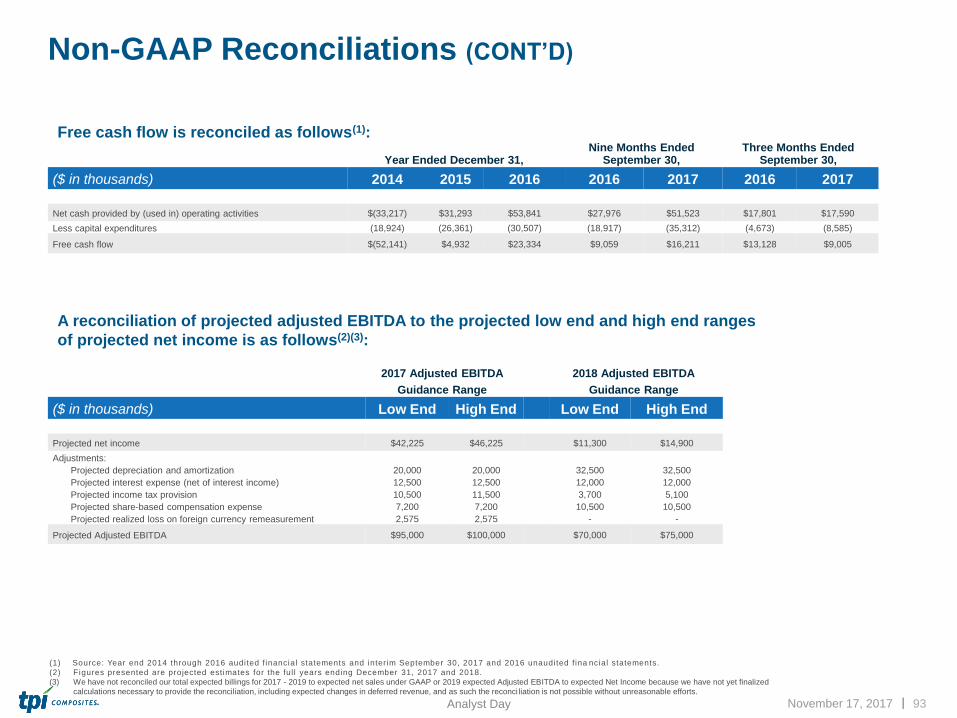
Net cash provided by (used in) operating activities $(33,217) $31,293 $53,841 $27,976 $51,523 $17,801 $17,590
Less capital expenditures (18,924) (26,361) (30,507) (18,917) (35,312) (4,673) (8,585)
Free cash flow $(52,141) $4,932 $23,334 $9,059 $16,211 $13,128 $9,005
(1) Source: Year end 2014 through 2016 audited financial statements and interim September 30, 2017 and 2016 unaudited fina ncial statements.
(2) Figures presented are projected estimates for the ful l years ending December 31, 2017 and 2018.
(3) We have not reconciled our total expected billings for 2017 - 2019 to expected net sales under GAAP or 2019 expected Adjusted EBITDA to expected Net Income because we have not yet finalized
calculations necessary to provide the reconciliation, including expected changes in deferred revenue, and as such the reconci liation is not possible without unreasonable efforts.
Free cash flow is reconciled as follows(1):
A reconciliation of projected adjusted EBITDA to the projected low end and high end ranges
of projected net income is as follows(2)(3):
2017 Adjusted EBITDA
Guidance Range
2018 Adjusted EBITDA
Guidance Range
($ in thousands) Low End High End Low End High End
Projected net income $42,225 $46,225 $11,300 $14,900
Adjustments:
Projected depreciation and amortization 20,000 20,000 32,500 32,500
Projected interest expense (net of interest income) 12,500 12,500 12,000 12,000
Projected income tax provision 10,500 11,500 3,700 5,100
Projected share-based compensation expense 7,200 7,200 10,500 10,500
Projected realized loss on foreign currency remeasurement 2,575 2,575 - -
Projected Adjusted EBITDA $95,000 $100,000 $70,000 $75,000