Gaz de France Exploration-Production - ENGIE · Gaz de France Exploration-Production Successful...
109
Gaz de France Investor Day 22 May 2007 Gaz de France Exploration-Production Successful track record and ambitious prospects
Transcript of Gaz de France Exploration-Production - ENGIE · Gaz de France Exploration-Production Successful...

Gaz de France
Investor Day
22 May 2007
Gaz de France Exploration-Production
Successful track record and ambitious prospects

Gaz de France
Investor Day
22 May 2007
2
The objectives summarised above are based on data, assumptions and estimates deemed reasonable by Gaz de France. The said data, assumptions and estimates may evolve or be changed as a result of uncertainties due in particular to the economic, financial, competitive, regulatory or weather conditions. In addition, the materialisation of certain risks factors described in Chapter 4 of the Document de Référence filed with the Autorité des marchés financiers (“AMF”) under Number R07-046 on 27 April 2007 (hereinafter referred to as the “Document de Référence”) could have an impact on the group’s operations and its ability to achieve its objectives. In addition, achieving those objectives is dependent on the success of the commercial strategy described in Chapter 6.1.2 of the Document de Référence. Gaz de France consequently disclaims any undertaking and gives no representation as to the fact that it will achieve its objectives and does not undertake to publish or issue possible revisions or updates of such forward-looking statements or information, beyond what is required by the laws and regulations with which it must comply.
This communication does not constitute an offer to purchase or exchange or the solicitation of an offer to sell or exchange any securities of Suez or an offer to sell or exchange or the solicitation of an offer to buy or exchange any securities of Gaz de France, nor shall there be any sale or exchange of securities in any jurisdiction (including the United States, Germany, Italy and Japan) in which such offer, solicitation or sale or exchange would be unlawful prior to the registration or qualification under the laws of such jurisdiction. The distribution of this communication may, in some countries, be restricted by law or regulation. Accordingly, persons who come into possession of this document should inform themselves of and observe these restrictions. To the fullest extent permitted by applicable law, Gaz de France and Suez disclaim any responsibility or liability for the violation of such restrictions by any person.
The Gaz de France ordinary shares to be issued in connection with the proposed business combination to holders of Suez ordinary shares (including Suez ordinary shares represented by Suez American Depositary Shares) may not be offered or sold in the United States except pursuant to an effective registration statement under the United States Securities Act of 1933, as amended, or pursuant to a valid exemption from registration.
In connection with the proposed business combination, the required information document will be filed with the AMF and, to the extent Gaz de France is required or otherwise decides to register the Gaz de France ordinary shares to be issued in connection with the business combination in the United States, Gaz de France may file with the United States Securities and Exchange Commission (“SEC”), a registration statement on Form F-4, which will include a prospectus. Investors are strongly advised to read the information document filed with the AMF, the registration statement and the prospectus, if and when available, and any other relevant documents filed with the SEC and/or the AMF, as well as any amendments and supplements to those documents, because they will contain important information. If and when filed, investors may obtain free copies of the registration statement, the prospectus as well as other relevant documents filed with the SEC, at the SEC’s website at www.sec.gov and will receive information at an appropriate time on how to obtain these transaction-related documents for free from Gaz de France or its duly designated agent. Investors and holders of Gaz de France and Suez securities may obtain free copies of documents filed with the AMF at the AMF’s website at www.amf-france.org or directly from Gaz de France on its website at: www.gazdefrance.com or directly from Suez on its website at: www.suez.com, as the case may be.
Disclaimer
Gaz de France
Investor Day
22 May 2007
Introduction
Jean-Marie Dauger
Chief Operating OfficerHead of the "Supply & Production" Branch

Gaz de France
Investor Day
22 May 2007
4
Gaz de France Group
Energy Supply and Services
Exploration -
Production
Purchase
and Sale
of Energy
Services
Infrastructures
Transmission
and Storage
- France
Distribution
- France
Transmission
and Distribution
- International
Exploration-Production within Gaz de France
Division
Seg
men
t
Global Gas
+ LNG + Trading

Gaz de France
Investor Day
22 May 2007
5
1,270EBITDA
1,659Net sales
Operating income
Exploration-Production: Significant contribution to Group’s profitability and growth
935
726
1,139
2005
457
In million euros
625
968
2004
229
2006
25%
Contribution to Group 2006 EBITDA
26%
Contribution to Group 2006 Operating profit
Proportion of 2005-06 Group Capex*
* Investments excluding external growth 15% in 2004 10% in 2004
20%

Gaz de France
Investor Day
22 May 2007
6
Strong cash flow generation: over €1 billion in 2006
* Net Cash flow: EBITDA – taxes + EFOG (dividends & debt repayments) - Capex
0
200
400
600
800
1 000
1 200
2004 2005 2006
Cash Flow
Capex
Net Cash flow*
€m

Gaz de France
Investor Day
22 May 2007
Exploration-Production
Didier Holleaux
Vice President Exploration-Production

Gaz de France
Investor Day
22 May 2007
8
Gaz de France Exploration-Production
Exploration-Production a fully established player
Successful track record
Growth driven strategy
Assets & projects portfolio
Ambitious prospects
Wrap up
Gaz de France
Investor Day
22 May 2007
9
Gaz de France Exploration-Production
Exploration-Production a fully established player
Successful track record
Growth driven strategy
Assets & projects portfolio
Ambitious prospects
Wrap up

Gaz de France
Investor Day
22 May 2007
10
Multi-country organisation E
xplo
ratio
n-P
rodu
ctio
n a
fully
est
ablis
hed
play
er1
Vice PresidentDidier Holleaux
Deputy Vice PresidentPhilippe Marcus
GDF BritainMark Hugues
Germany (PEG)Patrick Vannetzel
Albrecht Möhring
West Africa & Middle East Team(WAME)
René Montaz-Rosset
Norway (Gaz de France Norge)Bernard Ott
Germany (EEG)Jürgen Rückheim
North Africa Team (NAT)Gilbert Meunier
Subsurface expertiseHenri de Moegen
ExplorationPhilip Drijkoningen
OperationsMaqsood Sher
DevelopmentThierry Lefeuvre
Legal, commercial, human resources, communication …
Netherlands (ProNed)Jan Treffers
* Merger expected in 2007
*
1,115 employees
FinanceMonique Huet

Gaz de France
Investor Day
22 May 2007
11
316 exploration and production licenses
193 operator licenses
Total acreage (2006)
• 70 000 km2 (gross GdF)
• 31 500 km2 (net GdF)
Large portfolio of licenses
Exploration ProductionExploration
Exp
lora
tion-
Pro
duct
ion
a fu
lly e
stab
lishe
d pl
ayer
1

Gaz de France
Investor Day
22 May 2007
12
Producer in 5 countries, active in 9
Sources: WoodMackenzie, NPD, WEG, UKOOA.
Positions exclude state entities: Petoro/SDFI and EBN
UK
16th gas producer
21st liquid producer
19th for oil & gas reserves
Ivory Coast
Production dedicated
to a local power plant
Germany
3rd gas producer
5th liquid producer
Top 5 for oil & gas reserves
Netherlands
3 - 4th gas producer
Top 5 for oil & gas reserves
Norway
13th liquid producer
13th for oil & gas reserves
13th for gas
Exp
lora
tion-
Pro
duct
ion
a fu
lly e
stab
lishe
d pl
ayer
1

Gaz de France
Investor Day
22 May 2007
13
Strong skills in conventional projects
Exploration, development and production
• Onshore: Germany, Algeria
• Offshore: UK, Netherlands, Norway, Germany
• Gas and oil
Skills to operate some non-conventional fields
• Tight gas reservoirs
Synergies with Gaz de France’s LNG* and gas storage expertise
* Liquefied natural gas
Exp
lora
tion-
Pro
duct
ion
a fu
lly e
stab
lishe
d pl
ayer
1
Gaz de France
Investor Day
22 May 2007
14
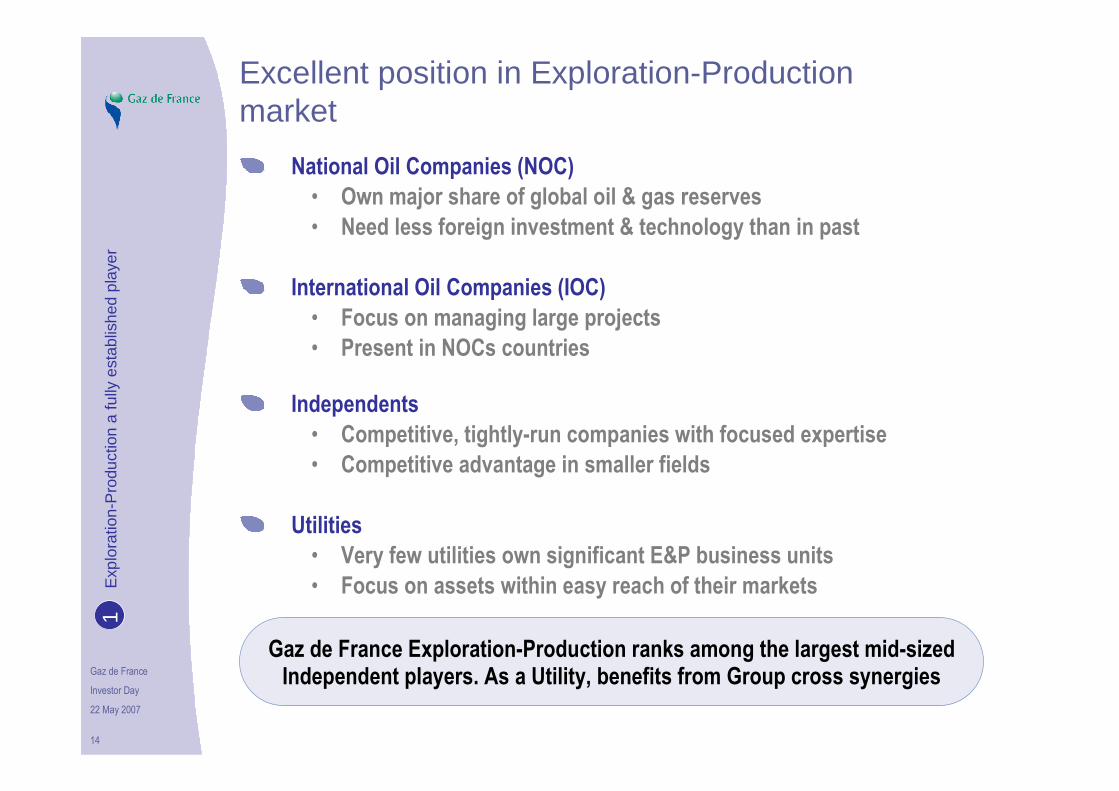
National Oil Companies (NOC)
• Own major share of global oil & gas reserves
• Need less foreign investment & technology than in past
International Oil Companies (IOC)
• Focus on managing large projects
• Present in NOCs countries
Independents
• Competitive, tightly-run companies with focused expertise
• Competitive advantage in smaller fields
Utilities
• Very few utilities own significant E&P business units
• Focus on assets within easy reach of their markets
Gaz de France Exploration-Production ranks among the largest mid-sized Independent players. As a Utility, benefits from Group cross synergies
Excellent position in Exploration-Production market
Exp
lora
tion-
Pro
duct
ion
a fu
lly e
stab
lishe
d pl
ayer
1

Gaz de France
Investor Day
22 May 2007
15
Top standard reserve evaluation
Proven and Probable (2P) reserves evaluated on guidelines from:
• Society of Petroleum Engineers (SPE)
• World Petroleum Congress (WPC)
Internal evaluation process based on industry best practices
• Affiliates evaluate reserves following HQ guidelines updated annually
• HQ reviews all assets and implements dedicated auditson selected assets annually
• DeGolyer&McNaughton* certified 98% of reserves in past 3 years
� One third of reserves certified annually by independent, external audit
* Independent leading worldwide company in certification
Exp
lora
tion-
Pro
duct
ion
a fu
lly e
stab
lishe
d pl
ayer
1
Gaz de France
Investor Day
22 May 2007
16
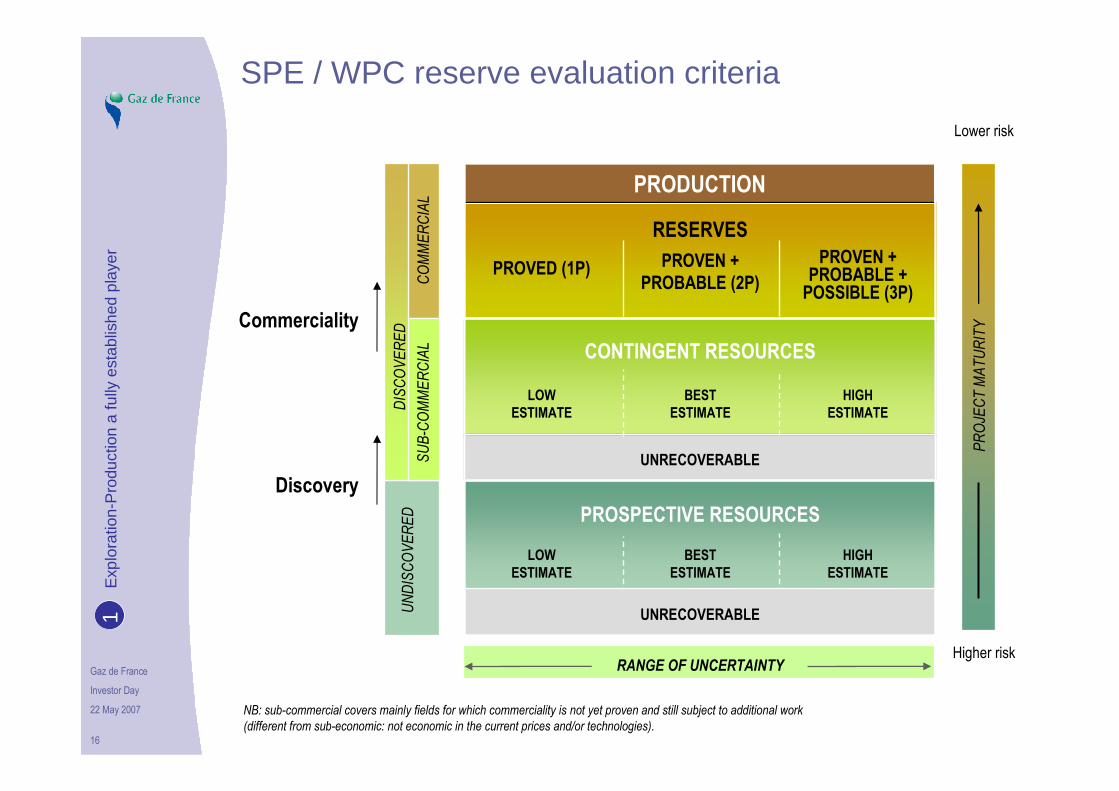
SPE / WPC reserve evaluation criteria
PROJECT MATURITY
RANGE OF UNCERTAINTY
UNRECOVERABLE
LOWESTIMATE
BESTESTIMATE
HIGHESTIMATE
LOWESTIMATE
BESTESTIMATE
HIGHESTIMATE
PROSPECTIVE RESOURCES
CONTINGENT RESOURCES
PROVED (1P) PROVEN +PROBABLE (2P)
RESERVES
PROVEN +PROBABLE +POSSIBLE (3P)
PRODUCTION
UNRECOVERABLE
UNRECOVERABLE
Lower risk
Higher risk
NB: sub-commercial covers mainly fields for which commerciality is not yet proven and still subject to additional work
(different from sub-economic: not economic in the current prices and/or technologies).
COMMERCIAL
DISCOVERED
SUB-COMMERCIAL
UNDISCOVERED
Commerciality
Discovery
Exp
lora
tion-
Pro
duct
ion
a fu
lly e
stab
lishe
d pl
ayer
1

Gaz de France
Investor Day
22 May 2007
17
Decreasing uncertainty for reserves evaluation
Phase Exploration Appraisal Development Production
High 3P
Medium2P
Low 1P
Seismic
Wells
Production Data
ClassificationProspective
Resources
Contingent
Resources
Uncertainty
Available Data
Method of
evaluation
Decline curve analysis
Reservess
Analogy
Static Calculation
Numerical Simulation
Material Balance
Time line and level of certainty
Exp
lora
tion-
Pro
duct
ion
a fu
lly e
stab
lishe
d pl
ayer
1

Gaz de France
Investor Day
22 May 2007
18
Gaz de France Exploration-Production
Exploration-Production a fully established player
Successful track record
Growth driven strategy
Assets & projects portfolio
Ambitious prospects
Wrap up
• Operation
• Finance
• Exploration

Gaz de France
Investor Day
22 May 2007
19
Solid asset portfolio built in just one decade
1994 - 1999: the early years
• Acquisition of EEG and EFOG, creation of GDF Britain
2000 - 2003: acceleration
• Acquisition of GdF ProNed, PEG
• Asset deals: Snohvit, Gjoa, assets in NL and UK
2004 - 2006: consolidation
• Successful integration of previous acquisitions
• Portfolio management: KMG sale and asset swaps in UK
• Strong focus on internal growth
� Increased resources for exploration
� Successful nearby field drilling and exploration in NL & UK
� Entry to new markets at exploration stage in Egypt & Mauritania
Suc
cess
ful t
rack
rec
ord
2

Gaz de France
Investor Day
22 May 2007
20
Strong growth profile in reserves
Gaz de France outperformed E&P sector based on successful growth strategy
In 2006, 2P reserves/production ratio = 15 years
Evolution of 2P reserves (2001 – 2006)
1 Proven and probable reserves (SPE definition, including EFOG)2 Million of barrel of oil equivalent
Source: Herold Global Upstream Performance Revenue
479
669 695 753 685
2002 2003 2004 2005 2006
2P1 reserves in Mboe2
+10 %
448
1/1/2002 Discoveries Revisions Acquisition Production 31/12/2006
448
685
207273
10566
Suc
cess
ful t
rack
rec
ord
2

Gaz de France
Investor Day
22 May 2007
21
Profitable growth
* Net sales, EBITDA and Operating Income do not account for EFOG consolidated under the Equity Method
2002 2003 2004 2005 2006
Net sales* EBITDA* Operating Income*
EFOG net results Oil & gas production incl. EFOG
0
300
600
900
1200
1500
1800
MEUR
15
20
25
30
35
40
45
50
55
Mboe
+42%
+53%
+112%
+13%
Suc
cess
ful t
rack
rec
ord
2

Gaz de France
Investor Day
22 May 2007
22
Gaz de France primarily operates concession contracts
• With the exception of Ivory Coast
PSC* accounts for < 1% of production and reserves
Sales portfolio breakdown (% production)
Diversified portfolio of commercial contracts
New production fields to modify sales portfolio breakdown
* PSC: Production Sharing Contract
0%
20%
40%
60%
80%
100%
2004 2005 2006 2007 estimated
Long term contract(gas)
Market price(gas)
Brent related(oil)
Suc
cess
ful t
rack
rec
ord
2

Gaz de France
Investor Day
22 May 2007
23
Competitive technical costs
Technical costs very comparable to Peer Group2 composed of main license partners
In the context of rising cost for E&P sector 3, Gaz de France costs are remaining stable
1 For the definition of technical costs: see appendices2 Peer group includes european activities of Majors, Independants and Utilities (BG, Centrica, CoP, Dana, Dong, ENI, Hess,
Marathon, MOL, Norsk Hydro, OMV, Petro-Canada, RWE-Dea, Statoil, Talisman, Total, Wintershall)3 See appendix
Technical costs1 in eur/boe
13.6 12.9 12.8 12.7 13.3
Peer Group2 Europe (2 years average) GdF (2 years average)
2001-02 2002-03 2003-04 2004-05 2005-06
Source: Internal research
Suc
cess
ful t
rack
rec
ord
2

Gaz de France
Investor Day
22 May 2007
24
Strong cash flow generation: over €1 billion in 2006
Exploration-Production cash flow before capex: €2.2 billion generated in three year period
* Net Cash flow: EBITDA – taxes + EFOG (dividends & debt repayments) - Capex
0
200
400
600
800
1 000
1 200
2004 2005 2006
Cash Flow
Capex
Net Cash flow*
Tax position optimised and/or special incentives benefits
• E.g. Norway - GdF E&P offsets total revenue against fiscal deficit
Suc
cess
ful t
rack
rec
ord
2
€m

Gaz de France
Investor Day
22 May 2007
25
Sustained Upstream investments
Capex (acquisition, development, exploration)
Capex development Acquisition Exploration
0
250
500
750
1 000
1 250
1 500
2002 2003 2004 2005 2006
In MEUR
Exploration budget
CAGR +17%
0
50
100
150
200
2002 2003 2004 2005 2006
In MEUR
3 billion euros invested in past 5 years
• Acquisition of PEGin Germany
• Asset deals in UK and Netherlands
• Development projects in Norway and Netherlands
CAGR +17% 2002-2006
Suc
cess
ful t
rack
rec
ord
2

Gaz de France
Investor Day
22 May 2007
Exploration track record
Philip Drijkoningen
Head of Exploration
2S
ucce
ssfu
l tra
ck r
ecor
d

Gaz de France
Investor Day
22 May 2007
27
Reserve Replacement Ratio*
Reserve Replacement Ratio*
298%
112%
0%
100%
200%
300%
400%
2002-2004 2004-2006
Acquisition of PEG
Time between discovery and booking reserves
• Most discoveries are classified as Contingent Resources until they meet reserve definition criteria
Acquisitions and divesture significantly impact RRR*
• PEG acquisition in 2003, KGM sale in 2006
* RRR = ( Revisions + Discoveries + Acquisitions – Sales) / Production
Computed on a three years average based on 2P reserves
Suc
cess
ful t
rack
rec
ord
2

Gaz de France
Investor Day
22 May 2007
28
24 discoveries out of 42 exploration wells:
• 57% of success
+200 million barrels discovered:
• 2P reserves + unrisked contingent resources
57% success rate in exploration
0
2
4
6
8
10
12
14
2002 2003 2004 2005 2006
Number of exploration wells
Mauritania
Egypt
Algeria
Norway
Germany
Netherlands
UK
Suc
cess
ful t
rack
rec
ord
2
Gaz de France
Investor Day
22 May 2007
29
Competitive finding costs
Finding costs for 2P Reserves and Contingent Resources (unrisked)
• 1.8 Euro/boe
Finding costs limited to 2P Reserves
• 6.7 Euro/boe
Finding costs calculated as ratio of budget/volume over 5 years periodS
ucce
ssfu
l tra
ck r
ecor
d2

Gaz de France
Investor Day
22 May 2007
30
Industry benchmark confirms our solid performance
0%
10%
20%
30%
40%
IRR
0
5
10
15
20
Finding Cost US$/boe (2000-04)
0%
10%
20%
30%
40%
50%
60%
Success rate (2000-04)
* Peer Group: BG, Marathon, Apache, Repsol-YPF,
Wintershall, Norsk Hydro, Total, OMV, DONG, Woodside,
Occidental, Amerada, Kerr-McGee, Talisman, RWE-Dea,
ENI, ConocoPhilips, Encana.
Company results not disclosed for confidentiality reasons.
Peer Group*GDF
Peer Group*GDF
Peer Group*GDF
Source: Survey performed by WoodMackenzie early 2006
Suc
cess
ful t
rack
rec
ord
2
Gaz de France
Investor Day
22 May 2007
31
Gaz de France Exploration-Production
Exploration-Production a fully established player
Successful track record
Growth driven strategy
Assets & projects portfolio
Ambitious prospects
Wrap up
Gaz de France
Investor Day
22 May 2007
32
Our ambition: achieve double digit growth in production
Objective of 1,000Mboe for 2P reserves
Balance between oil and gas
Double digit growth for production
Gro
wth
driv
en s
trat
egy
3

Gaz de France
Investor Day
22 May 2007
33
Our growth strategy
Enlarge geographic coverage
Balance organic and external growth
Leverage value for other Group divisions
Gro
wth
driv
en s
trat
egy
3

Gaz de France
Investor Day
22 May 2007
34
Enlarge geographic coverage
Currently active in Europe and North Africa
Strong position built in a short period of time in mature countries, closed to our markets
Reinforce positions in "growth" countries
• Norway, Algeria
Enlarge geographic coverage to new growth regions
• West Africa, Middle East, Caspian SeaGro
wth
driv
en s
trat
egy
3

Gaz de France
Investor Day
22 May 2007
35
Drivers and challenges for organic growth
Drivers
• Develop production nearby existing fields and infrastructures
• Grow existing portfolio reserves and resources
• Explore new opportunities and book future reserves
Challenges
• Increasing share of frontier area in exploration portfolio
• Technical challenges: High Pressure/High Temperature, Tight gas, Deep Water
We are confident, we have the right people & skills
to meet these challenges
Gro
wth
driv
en s
trat
egy
3
Gaz de France
Investor Day
22 May 2007
36
External growth strategy
Boost operations and growth in new regions
• Initiate and sustain exploration efforts via bidding rounds, farm ins and acquisition of focused exploration portfolios
• Accelerate learning curve (subsurface expertise, etc)in a given basin
• Provide critical size in new areas
Balance asset portfolio across all stages (exploration, development, production) to sustain long term growth
Take advantage of value driven opportunistic acquisitions in line with capital discipline
Gro
wth
driv
en s
trat
egy
3

Gaz de France
Investor Day
22 May 2007
37
Leverage value for Gaz de France’ other activities
Synergies with Purchase & Sales division
• Development in markets where supply is "tight" or already contracted by incumbents
� Germany
• Integration along the value chain
� LNG in Norway can be shipped to Europe or the US
• Support entry to Exploration-Production assets
� Idku LNG plant, Elgin Franklin
Access new storage sites in countries where capacities are needed
• Depleted fields and salt caverns in Germany
Gro
wth
driv
en s
trat
egy
3

Gaz de France
Investor Day
22 May 2007
38
Gaz de France Exploration-Production
Exploration-Production a fully established player
Successful track record
Growth driven strategy
Assets & projects portfolio
Ambitious prospects
Wrap up
• Main producing countries
• Development projects
• Exploration portfolio
• Acquisition strategy

Gaz de France
Investor Day
22 May 2007
39
Balance between regions and maturity of projects
Production Development Exploration
Mature basins
On trend basins
Frontier areas
Southern gas basin (UK, NL, Germany)
Mauritania
Egypte(Nile Delta)
West of Shetland
Central North Sea
Barents Sea
Norvegian Sea
Algeria
Snohvit(Barents Sea)
GjoaTouat
Cash cows Medium to long term
Ass
ets
& p
roje
cts
port
folio
4
Gaz de France
Investor Day
22 May 2007
40
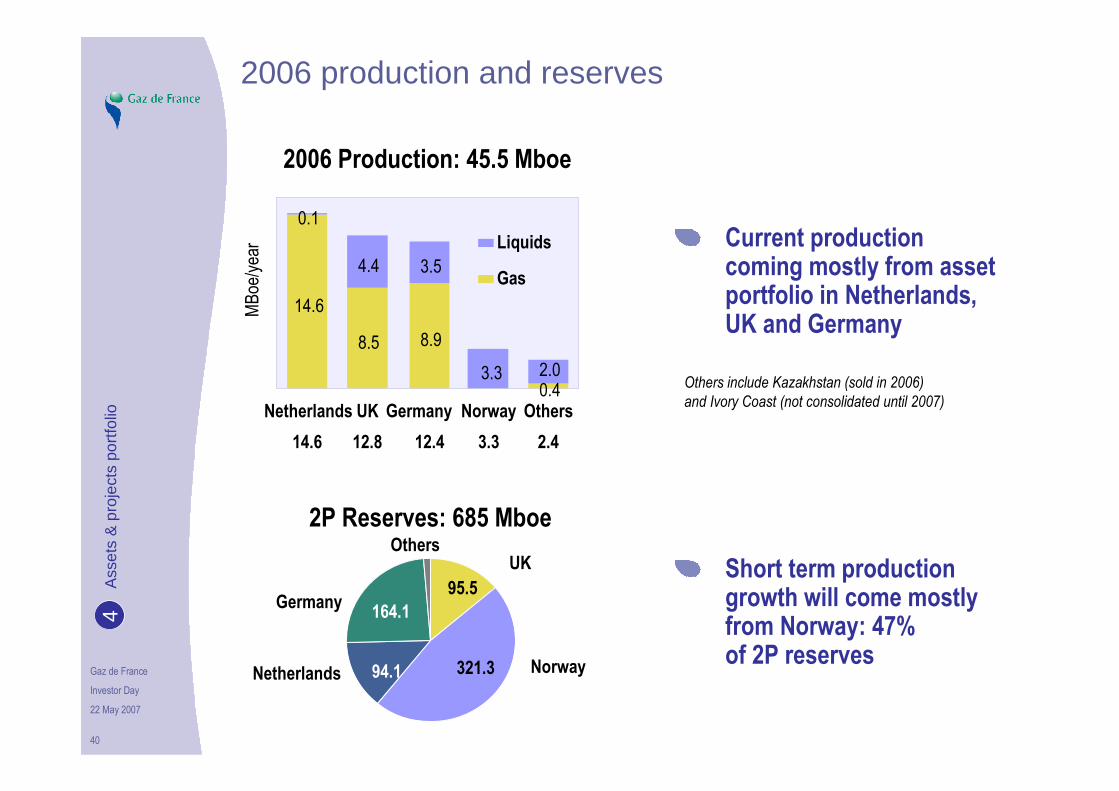
2006 Production: 45.5 Mboe
Others include Kazakhstan (sold in 2006)
and Ivory Coast (not consolidated until 2007)
14.6
8.5 8.9
0.4
0.1
4.4 3.5
3.3 2.0
Netherlands UK Germany Norway Others
MBoe/year Liquids
Gas
14.6 12.8 12.4 3.3 2.4
2P Reserves: 685 Mboe
Current production coming mostly from asset portfolio in Netherlands, UK and Germany
Short term production growth will come mostly from Norway: 47% of 2P reserves
2006 production and reservesA
sset
s &
pro
ject
s po
rtfo
lio4
321.3
164.1
94.1
95.5
UK
NorwayNetherlands
Germany
Others

Gaz de France
Investor Day
22 May 2007
Video presentation
GdF ProNed
Ass
ets
& p
roje
cts
port
folio
4

Gaz de France
Investor Day
22 May 2007
Netherlands and G block case study
Jan Treffers
President & General Manager GdF ProNed
Ass
ets
& p
roje
cts
port
folio
4

Gaz de France
Investor Day
22 May 2007
43
Reserves (end 2006)
• 94 Mboe net GDF
Production planned 2007/2008
• 28 Mboe net GDF
Operate 30 platforms and 5 sub-sea wells
74 producing wells
• Capacity 15 M m3/day
670 km of pipeline
• Inclusive 480 km NGT
NGT* treating plant Uithuizen
Revenues 2006
• €545 million
220 employees (incl NGT)
Average 140 contractors
* Noordgastransport B.V.
GdF Proned: 3rd producer in the NetherlandsA
sset
s &
pro
ject
s po
rtfo
lio4

Gaz de France
Investor Day
22 May 2007
44
GdF Proned: competitive differentiation
Successful exploration results
• 57% average success ratio in last 5 years
Low cost operator (operating and investment) with high HSE standards
Innovative operator
• 1st in sub-sea development in Netherlands (1988)
• World’s largest offshore CO2 removal plant (1987)
• 1st to re-use platforms (5 platforms re-used, 1 planned in 2007)
Ass
ets
& p
roje
cts
port
folio
4

Gaz de France
Investor Day
22 May 2007
45
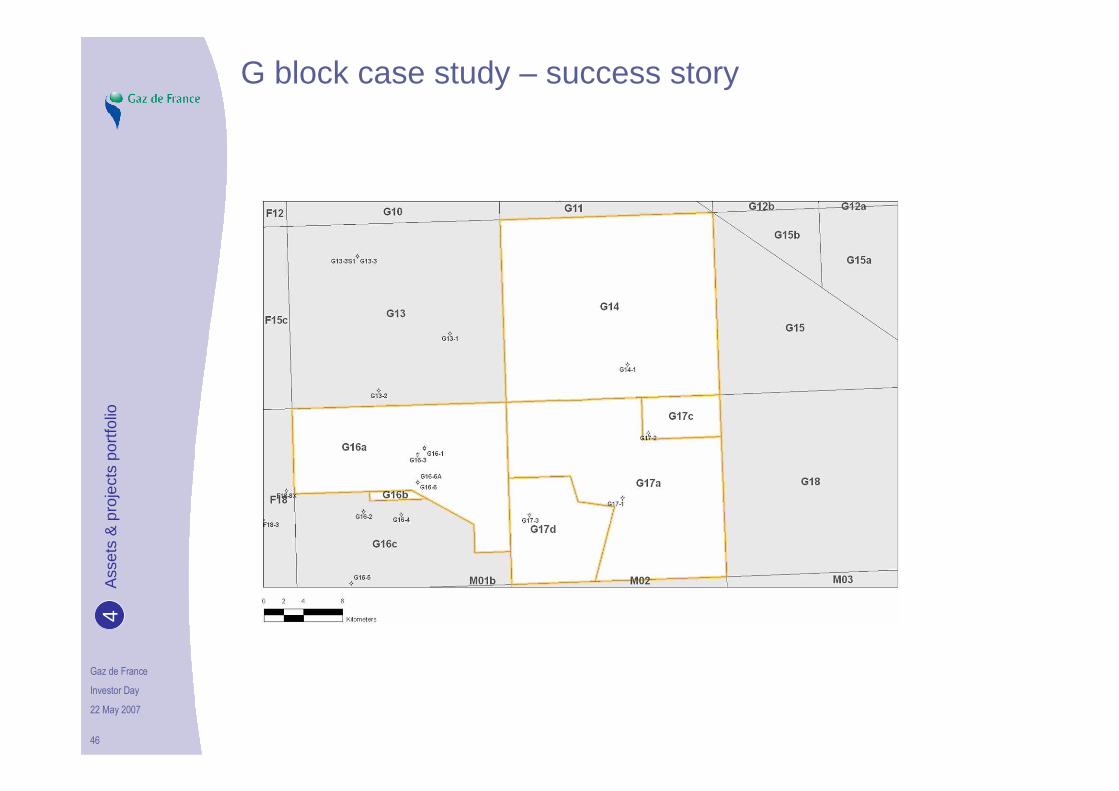
G-BlocksG-Blocks
G block case study – success storyA
sset
s &
pro
ject
s po
rtfo
lio4
Gaz de France
Investor Day
22 May 2007
46
G block case study – success story A
sset
s &
pro
ject
s po
rtfo
lio4
Gaz de France
Investor Day
22 May 2007
47
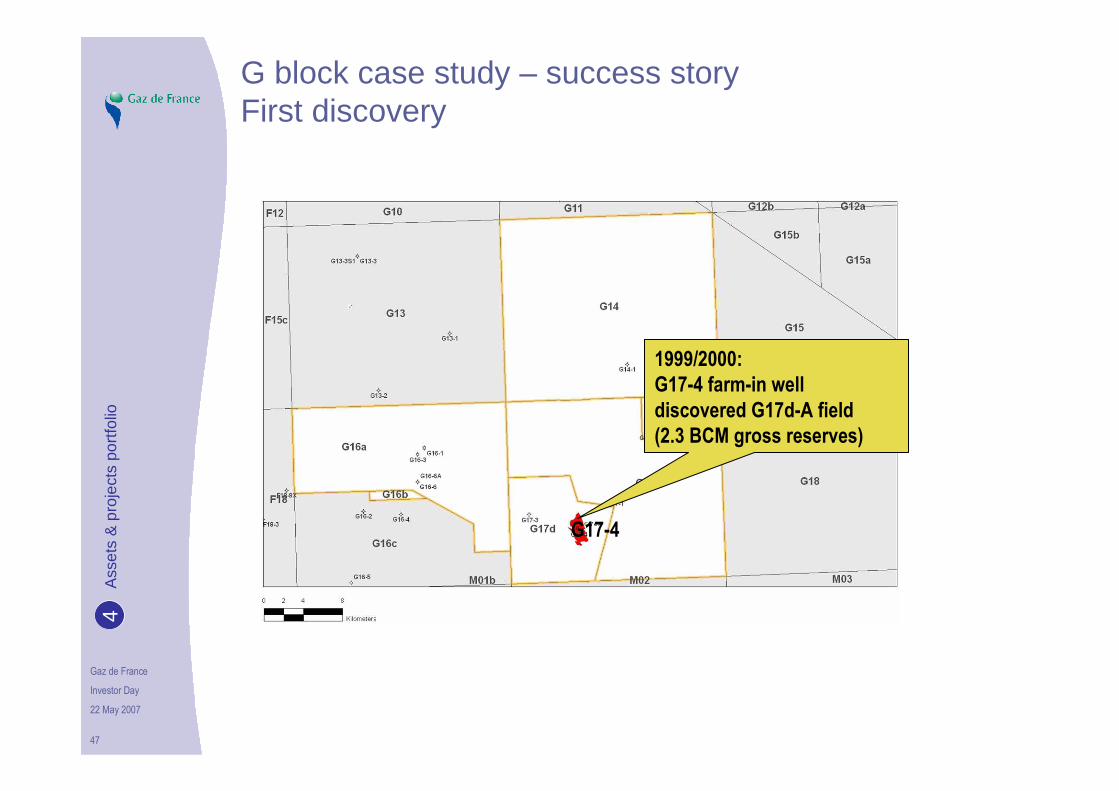
1999/2000:G17-4 farm-in well discovered G17d-A field (2.3 BCM gross reserves)
G17-4
G block case study – success storyFirst discovery
Ass
ets
& p
roje
cts
port
folio
4

Gaz de France
Investor Day
22 May 2007
48
G17d-A
2002:G17d-A Platform & NGT pipeline installedFirst gas production G-blocks
G block case study – success storyFirst gas production
Ass
ets
& p
roje
cts
port
folio
4

Gaz de France
Investor Day
22 May 2007
49
2002:Joint NAM/GDF well: G14-2Gas shows
G14-2
G block case study – success storyCooperation with Nam
Ass
ets
& p
roje
cts
port
folio
4

Gaz de France
Investor Day
22 May 2007
50
2003:Sole risk GDF well: G14-2stDiscovered G14-A field(Reserves 6 BCM)
G14-2st
G block case study – success storySole risk GDF well
Ass
ets
& p
roje
cts
port
folio
4

Gaz de France
Investor Day
22 May 2007
51
G16a-A field
2003:GDF Acquired blocks G16a&b with G16a-A field from NAM(1.7 BCM reserves)
G block case study – success storyGDF acquires blocks from Nam
Ass
ets
& p
roje
cts
port
folio
4

Gaz de France
Investor Day
22 May 2007
52
2004:Drilled G14-3 well to farm-in to G14 block and obtain operatorship from NAMDiscovered G14-B field(3.6 BCM reserves)
G14-3
G block case study – success storyGDF becomes operator
Ass
ets
& p
roje
cts
port
folio
4
Gaz de France
Investor Day
22 May 2007
53
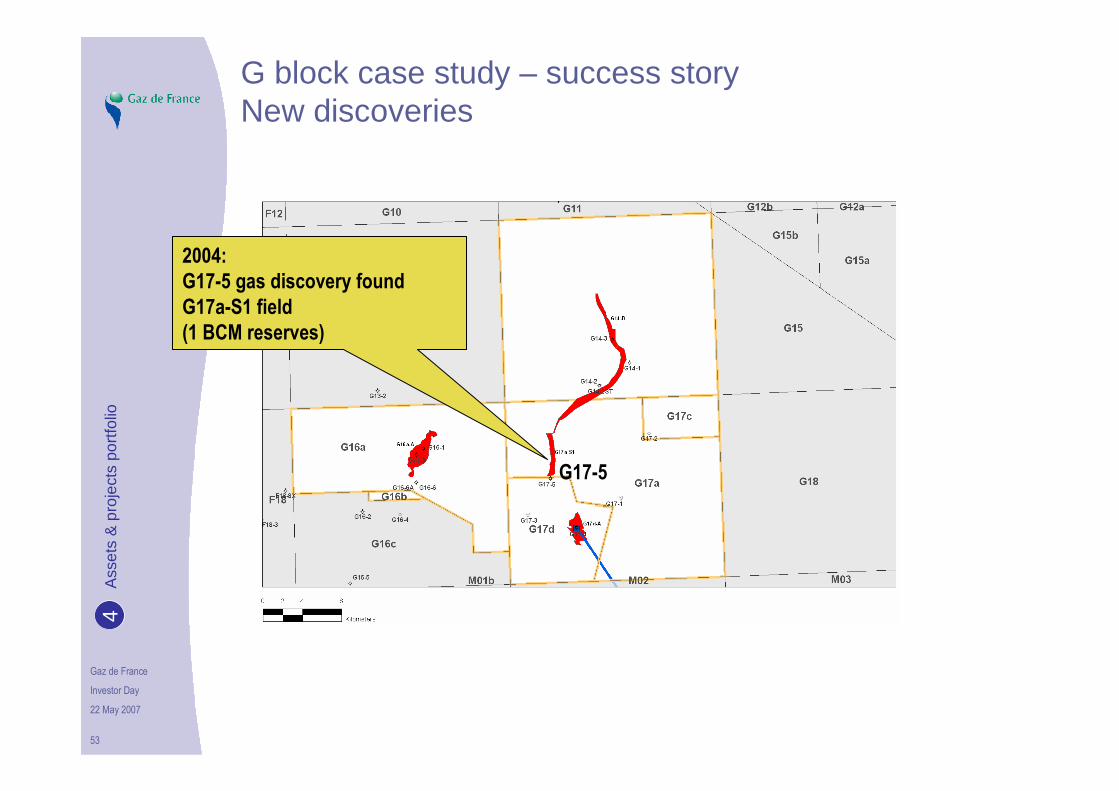
G17-5
2004:G17-5 gas discovery found G17a-S1 field(1 BCM reserves)
G block case study – success storyNew discoveries
Ass
ets
& p
roje
cts
port
folio
4
Gaz de France
Investor Day
22 May 2007
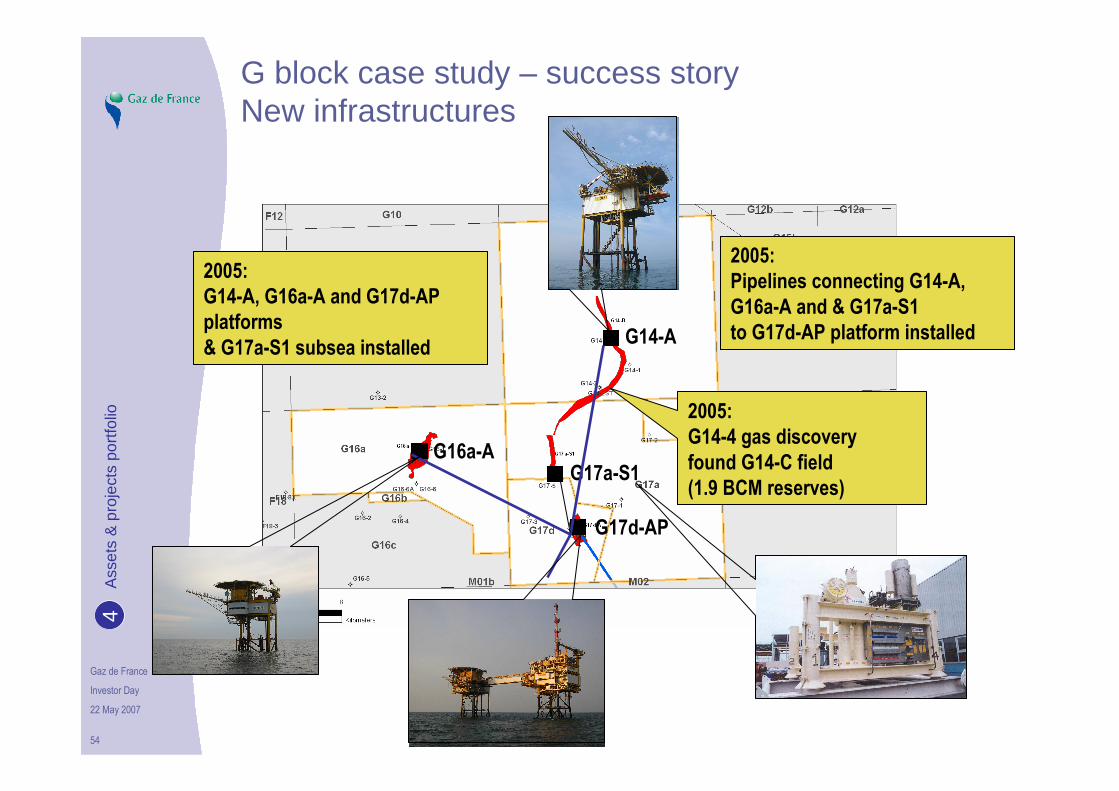
54
2005:G14-A, G16a-A and G17d-AP platforms& G17a-S1 subsea installed
G17a-S1G16a-A
G14-A
G17d-AP
G block case study – success storyNew infrastructures
2005:Pipelines connecting G14-A, G16a-A and & G17a-S1 to G17d-AP platform installed
2005:G14-4 gas discovery found G14-C field(1.9 BCM reserves)
Ass
ets
& p
roje
cts
port
folio
4

Gaz de France
Investor Day
22 May 2007
55
2005:G14-5 dry well
G14-5
G block case study – success storyNormal industry risks
2006:G17-6 dry well
Ass
ets
& p
roje
cts
port
folio
4

Gaz de France
Investor Day
22 May 2007
56
2007:G16-7 exploration well
Future G14exploration well?
Future G16exploration well?
G block case study – success storyStill a prospective area
Ass
ets
& p
roje
cts
port
folio
4
Gaz de France
Investor Day
22 May 2007
57
The G block success story
Discovered and developed 80 MBoe of gas within 3 years in a mature region(net annual sales to Gaz de France of 4 Mboe)
Invested 300 million euros (gross)
Combined investment in infrastructure,farm-in opportunities, exploration (incl sole risk) and acquisition
Built vast Gaz de France ProNed experienceAss
ets
& p
roje
cts
port
folio
4

Gaz de France
Investor Day
22 May 2007
58
UK: 3 main distinct basins in GDF Britain and EFOG
Southern North Sea
• Around CMS pipeline
� CMSIII developments
� Minke (NL/UK)
• More growth potential
Central North Sea
• Main asset EFOG
And Frontier areas
• West of Shetland: exploration licenses
Ass
ets
& p
roje
cts
port
folio
4

Gaz de France
Investor Day
22 May 2007
59
EFOG: e.g of downstream - upstream synergies
• High Pressure / High Temperature
• Operated by Total
• Gaz de France Purchase & Sale division as customer for gas
Ass
ets
& p
roje
cts
port
folio
4
Gaz de France
Investor Day
22 May 2007
Exploration-Production in Germany
Albrecht Möhring
Managing Director, Technical AffairsGaz de France - PEG
Ass
ets
& p
roje
cts
port
folio
4
Gaz de France
Investor Day
22 May 2007
61
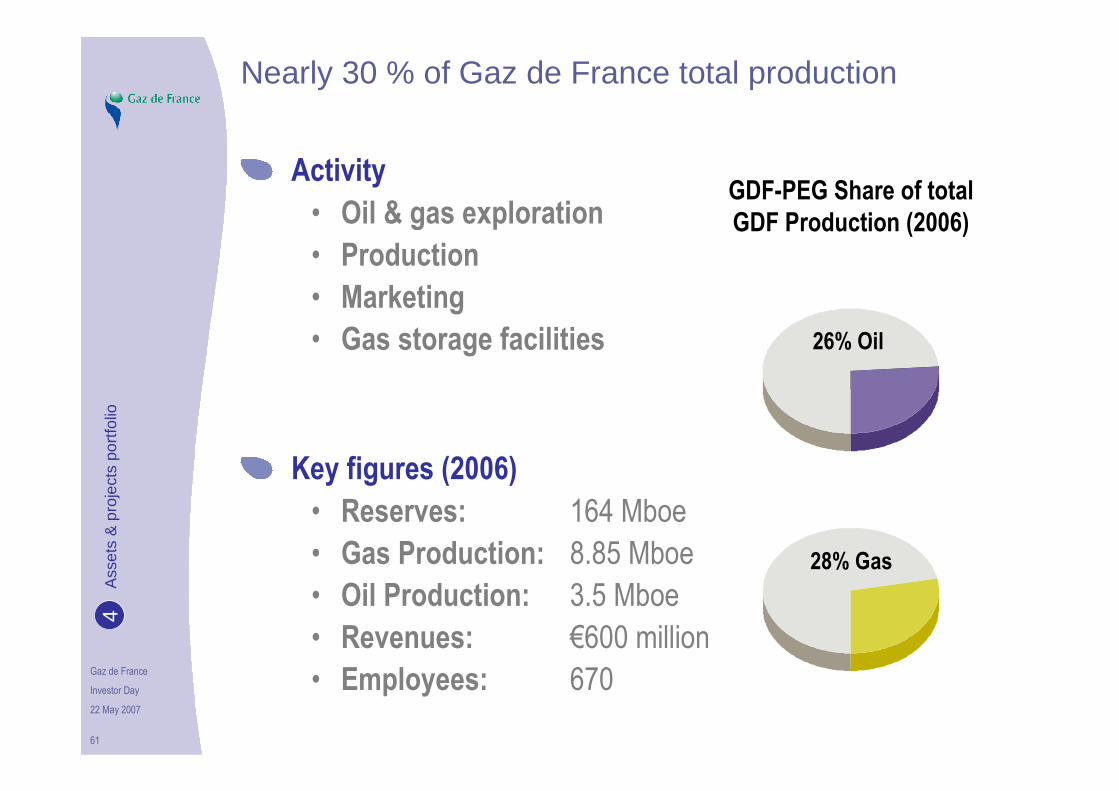
Nearly 30 % of Gaz de France total production
Activity
• Oil & gas exploration
• Production
• Marketing
• Gas storage facilities
Key figures (2006)
• Reserves: 164 Mboe
• Gas Production: 8.85 Mboe
• Oil Production: 3.5 Mboe
• Revenues: €600 million
• Employees: 670
26% Oil
28% Gas
GDF-PEG Share of total GDF Production (2006)
Ass
ets
& p
roje
cts
port
folio
4

Gaz de France
Investor Day
22 May 2007
62
Production areas in Northern Germany
GAS REGION
OIL REGION
CONCESSIONAREA
GAS STORAGE
D
NL
ROTENBURG/TAAKEN
NORD/OSTVORPOMMERN
ALTMARK
MÄRKISCHODERLAND
WESTTHÜRINGEN
NORTH SEA
OST-HANNOVER
SCHNEEREN/WIEHENGEBIRGE
BERLIN
HAMBURG
EMSLAND
EMSLAND
OSTFRIESLAND
LINGEN
FRONHOFEN
SCHMIDHAUSEN
EMPELDE
OST-HANNOVER PECKENSEN
REITBROOK
Ass
ets
& p
roje
cts
port
folio
4

Gaz de France
Investor Day
22 May 2007
63
Tight Gas Development: Innovative technology (1/9)
Ass
ets
& p
roje
cts
port
folio
4

Gaz de France
Investor Day
22 May 2007
64
4km
Leer ExplorationDepth Structure Map
of the "Base Zechstein"
12 potential exploration targets are in the closer vicinity of the Leer Central Block
Exploration wells might enable us to tie a suitable rig to the project in a long term view
Ass
ets
& p
roje
cts
port
folio
4
Tight Gas Development: Innovative technology (2/9)
Gaz de France
Investor Day
22 May 2007
65
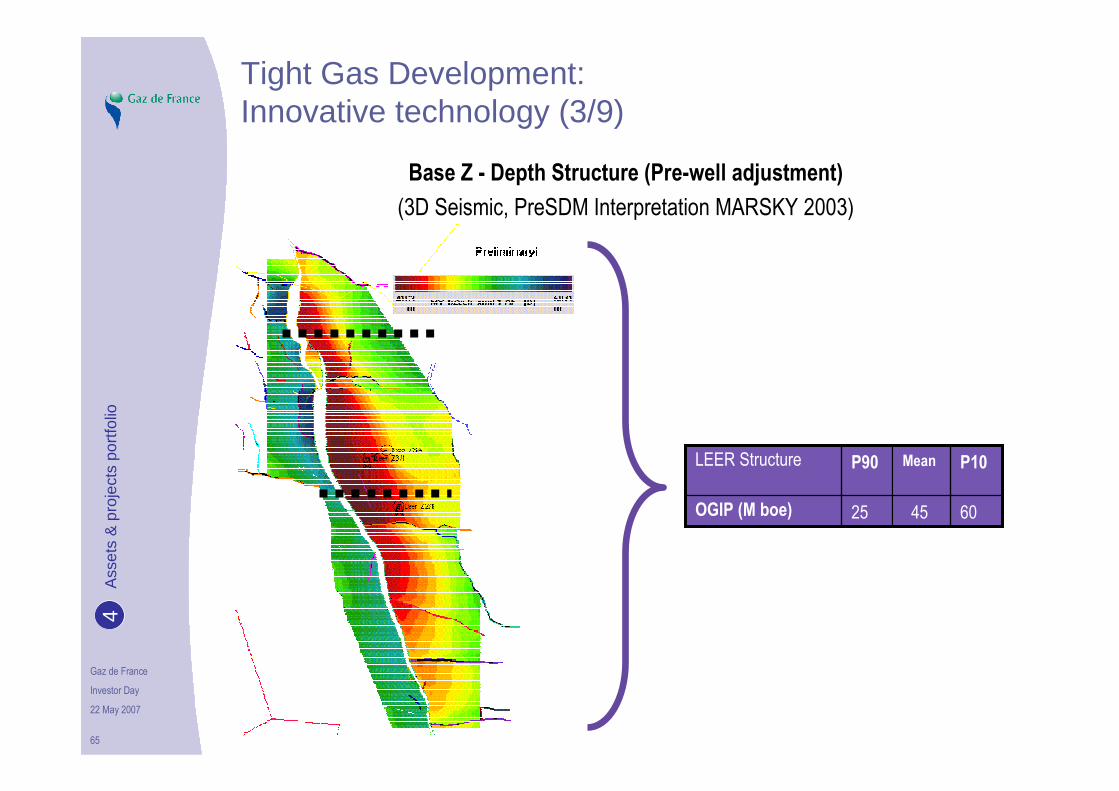
604525OGIP (M boe)
P10MeanP90LEER Structure
Base Z - Depth Structure (Pre-well adjustment)
(3D Seismic, PreSDM Interpretation MARSKY 2003)
Ass
ets
& p
roje
cts
port
folio
4
Tight Gas Development: Innovative technology (3/9)

Gaz de France
Investor Day
22 May 2007
66
Salzstock Rhaude
Oberkreide
Jura
Keuper
Muschelkalk
Buntsandstein
Zechstein
Karbon(Westfal C)
Tertiär500
1000
1500
2000
2500
3000
3500
4000
4500
5000
5500
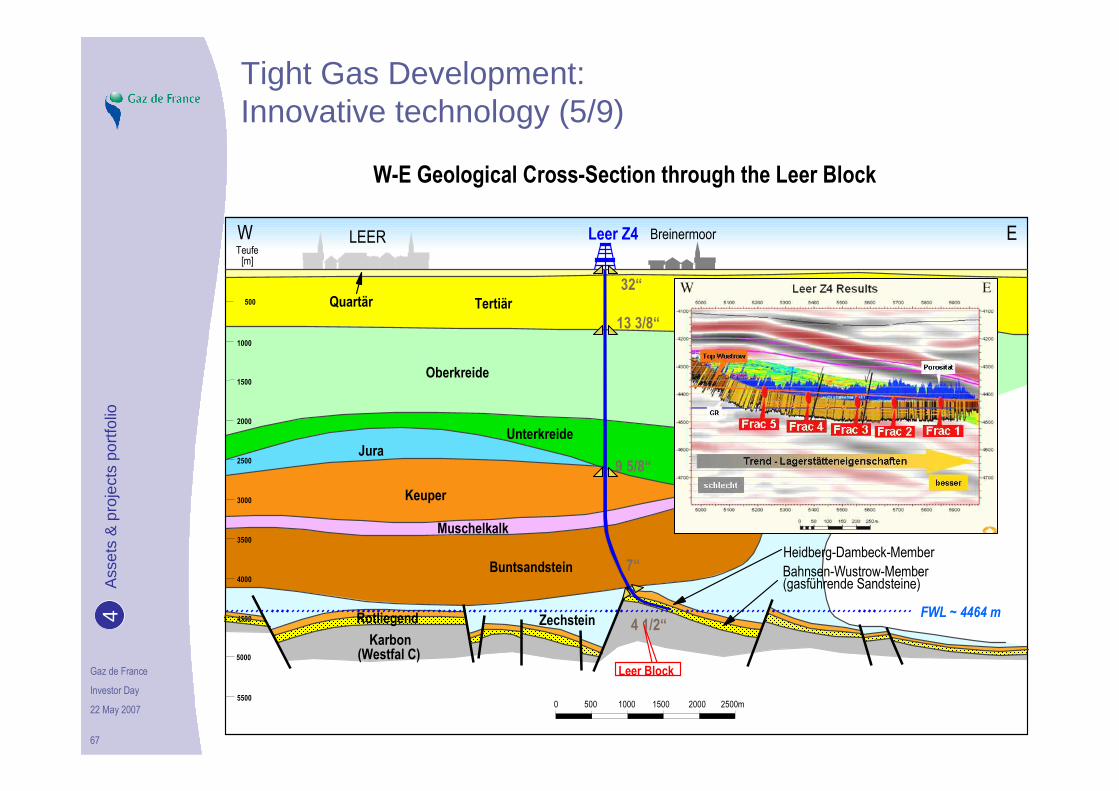
Leer Z4Teufe[m]
W E
Leer Block
Unterkreide
Heidberg-Dambeck-Member
Bahnsen-Wustrow-Member(gasführende Sandsteine)
Quartär
GWC ~4470m
0 500 1000 1500 2000 2500m
LEER Breinermoor
Rotliegend FWL ~ 4464 m
13 3/8“
9 5/8“
7“
4 1/2“
32“
W-E Geological Cross-Section through the Leer Block
Ass
ets
& p
roje
cts
port
folio
4
Tight Gas Development: Innovative technology (4/9)
Gaz de France
Investor Day
22 May 2007
67
Salzstock Rhaude
Oberkreide
Jura
Keuper
Muschelkalk
Buntsandstein
Zechstein
Karbon(Westfal C)
Tertiär500
1000
1500
2000
2500
3000
3500
4000
4500
5000
5500
Leer Z4Teufe[m]
W E
Leer Block
Unterkreide
Heidberg-Dambeck-Member
Bahnsen-Wustrow-Member(gasführende Sandsteine)
Quartär
GWC ~4470m
0 500 1000 1500 2000 2500m
LEER Breinermoor
Rotliegend FWL ~ 4464 m
13 3/8“
9 5/8“
7“
4 1/2“
32“
W-E Geological Cross-Section through the Leer Block
Ass
ets
& p
roje
cts
port
folio
4
Tight Gas Development: Innovative technology (5/9)

Gaz de France
Investor Day
22 May 2007
68
Frac Technic
Ass
ets
& p
roje
cts
port
folio
4
Tight Gas Development: Innovative technology (6/9)

Gaz de France
Investor Day
22 May 2007
69
Frac Technic
Ass
ets
& p
roje
cts
port
folio
4
Tight Gas Development: Innovative technology (7/9)

Gaz de France
Investor Day
22 May 2007
70
Test Rate: 14,000 m³/h vs 4,000 m³/h without technology
Leer Z4 - Gas Test
Ass
ets
& p
roje
cts
port
folio
4
Tight Gas Development: Innovative technology (8/9)

Gaz de France
Investor Day
22 May 2007
71
Leer Z4 - Facility
Ass
ets
& p
roje
cts
port
folio
4
Tight Gas Development: Innovative technology (9/9)

Gaz de France
Investor Day
22 May 2007
72
Norway: High potential portfoliofrom Barents Sea to Northern North Sea
Ass
ets
& p
roje
cts
port
folio
4

Gaz de France
Investor Day
22 May 2007
Video presentation
Snøhvit
Ass
ets
& p
roje
cts
port
folio
4

Gaz de France
Investor Day
22 May 2007
74
Snøhvit - challenging & innovative project
• Fields: Snøhvit, Albatross and Askeladd, discovered in 1981–84
• Water depth: 250 – 340 m
• Distance to shore: 140 km
• Gas in place (GIIP): 317 GSm3 / 11.2 TCF
• Condensate: 34 MSm3
• Annual LNG production : 5.7 GSm3
• Annual GPL production: 130000 to 330000t
• Annual Condensate prod. : 370000 to 630000t
• Consortium:
Statoil ASA (Operator) 33.53%
Petoro AS 30.00%
Total E&P Norge AS 18.40%
Gaz de France Norge AS 12.00%
Amerada Hess Norge AS 3.26%
RWE Dea Norge AS 2.81%
Ass
ets
& p
roje
cts
port
folio
4

Gaz de France
Investor Day
22 May 2007
75
Ass
ets
& p
roje
cts
port
folio
4

Gaz de France
Investor Day
22 May 2007
76
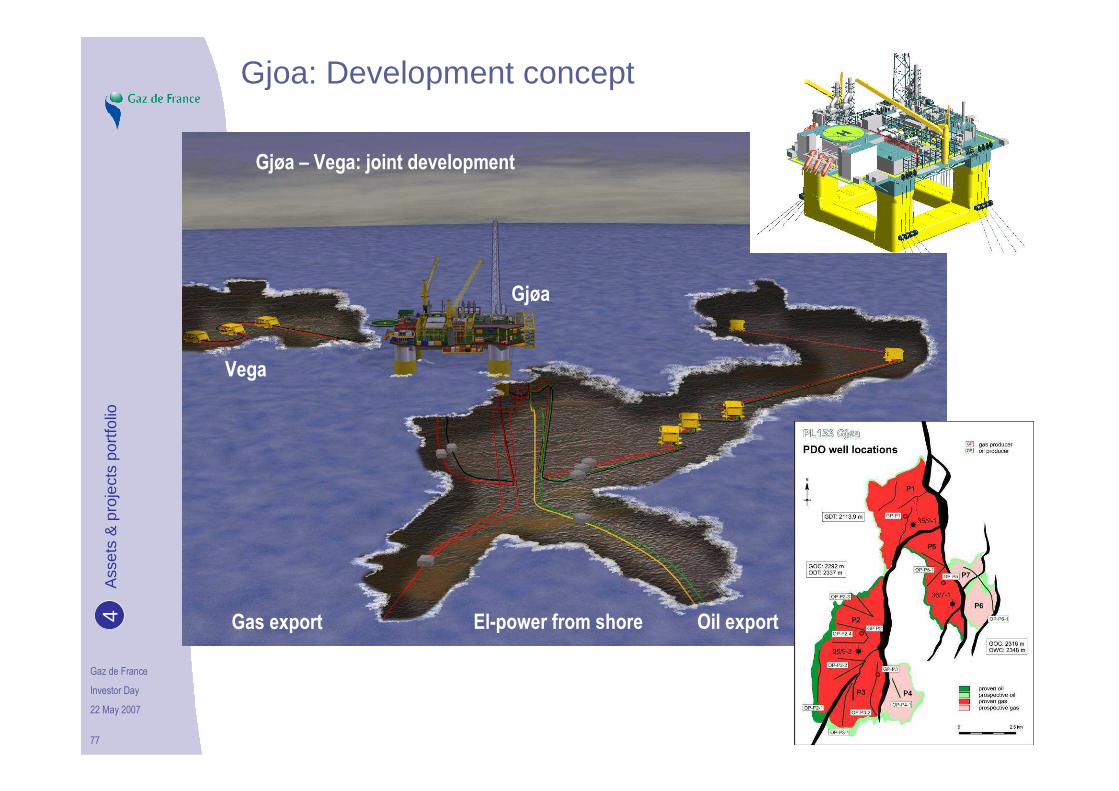
Gjoa project – offers huge potential
Off shore gas field situated in the Northern part of Norwegian Sea
Partnership structure:
• Gaz de France (30%)
• Statoil (20%)
• Petoro (30%)
• Shell (12%)
• RWE-Dea (8%)
Gaz de France at 15% in Vega (Fram B):joint development with Gjoa
Statoil: operator during development phase
Gaz de France: operator for the production phase
Investment for Gaz de France (Gjoa and Vega): €1.1 billion
Gas piped to St Fergus (Scotland)
Liquids (20% of reserves) exported to Mongstad (Norway)
Florø
Bergen
Mongstad
Sture
61 ° T roll
35/8 Gjøa
Fram
Camilla- Belinda
Fram B
Florø
Bergen
Mongstad
Sture
61 ° T roll
35/8 Gjøa
Fram
Camilla- Belinda
Fram B
Florø
Bergen
Mongstad
Sture
61 ° T roll
35/8 Gjøa
Fram
-
Ass
ets
& p
roje
cts
port
folio
4
Gaz de France
Investor Day
22 May 2007
77
Gjoa: Development concept
Gas export El-power from shore Oil export
Vega
Gjøa
Gjøa – Vega: joint development
Ass
ets
& p
roje
cts
port
folio
4
Gaz de France
Investor Day
22 May 2007
78
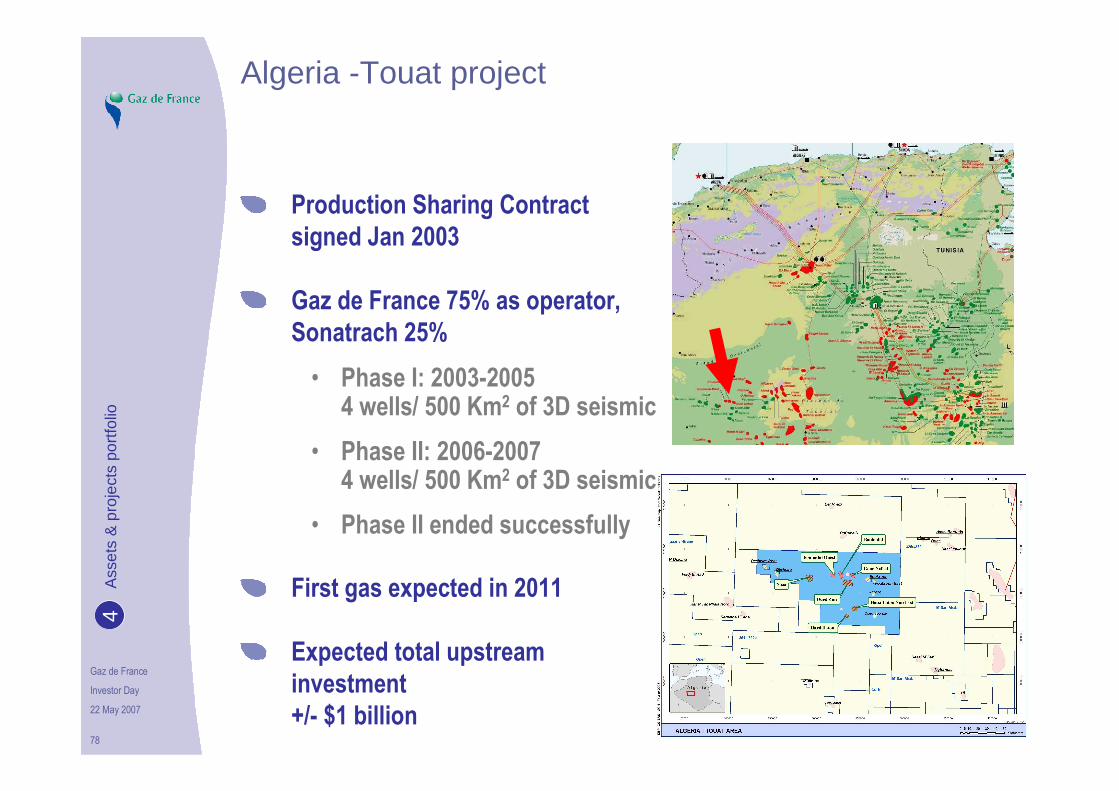
Algeria -Touat project
Production Sharing Contractsigned Jan 2003
Gaz de France 75% as operator, Sonatrach 25%
• Phase I: 2003-2005 4 wells/ 500 Km2 of 3D seismic
• Phase II: 2006-2007 4 wells/ 500 Km2 of 3D seismic
• Phase II ended successfully
First gas expected in 2011
Expected total upstream investment +/- $1 billion
Ass
ets
& p
roje
cts
port
folio
4

Gaz de France
Investor Day
22 May 2007
Video presentation
Touat
Ass
ets
& p
roje
cts
port
folio
4

Gaz de France
Investor Day
22 May 2007
Exploration strategy
Philip Drijkoningen
Head of Exploration
Ass
ets
& p
roje
cts
port
folio
4

Gaz de France
Investor Day
22 May 2007
81
Exploration Strategy
Continue with value driven nearby field exploration in mature regions
• Benefit from short time-to-market, regional expertise and low risk acreage
Manage evolving portfolio mix of higher reward, higher risk opportunities in emerging countries
• Develop regional knowledge to identify new promising regions
• Ensure prospect profile meets strategic fit, competitive advantage and Gaz de France’ objectives
• Apply technical and risk assessment methods to measure opportunities
Ass
ets
& p
roje
cts
port
folio
4

Gaz de France
Investor Day
22 May 2007
82
Exploration Budget
Long term target risk/reward balance
2006 and 2007 exploration budget: €150 million
* Probability of Success
Ass
ets
& p
roje
cts
port
folio
4
% of budgetType of exploration Standard POS*
Nearby Field Exploration- Lower Risk
- Smaller size fields40-60% 45%
Evolving Plays / On Trend - Moderate Risk/reward
20-40% 25%
Frontier Plays- Higher Risk/reward - Larger volumes
10-30% 15%

Gaz de France
Investor Day
22 May 2007
83
Exploration & appraisal wells to be started in 2007*
United Kingdom
• 30/2a,2c Jackdaw
• 44/19b Harrison
• 47/14b Juliet
Germany
• Boetersen Sued Z1
• Kirchdorf Z1
• Kempten 1
• J10-1
• B15alpha
Netherlands
• G16-7 Truffle
• D15-Tourmaline
• F17a-S1
Norway
• PL90D C-East
• PL90 F-West
• PL90 H-North
• PL110 Askeladd Beta
• PL110 Snohvit oil app
• PL107/132 Njord NWF A
• PL329 Cygnus
• PL289 Marsvin
Egypt
• West Burullus
* Results of some wells will be known in 2008
Ass
ets
& p
roje
cts
port
folio
4
Gaz de France
Investor Day
22 May 2007
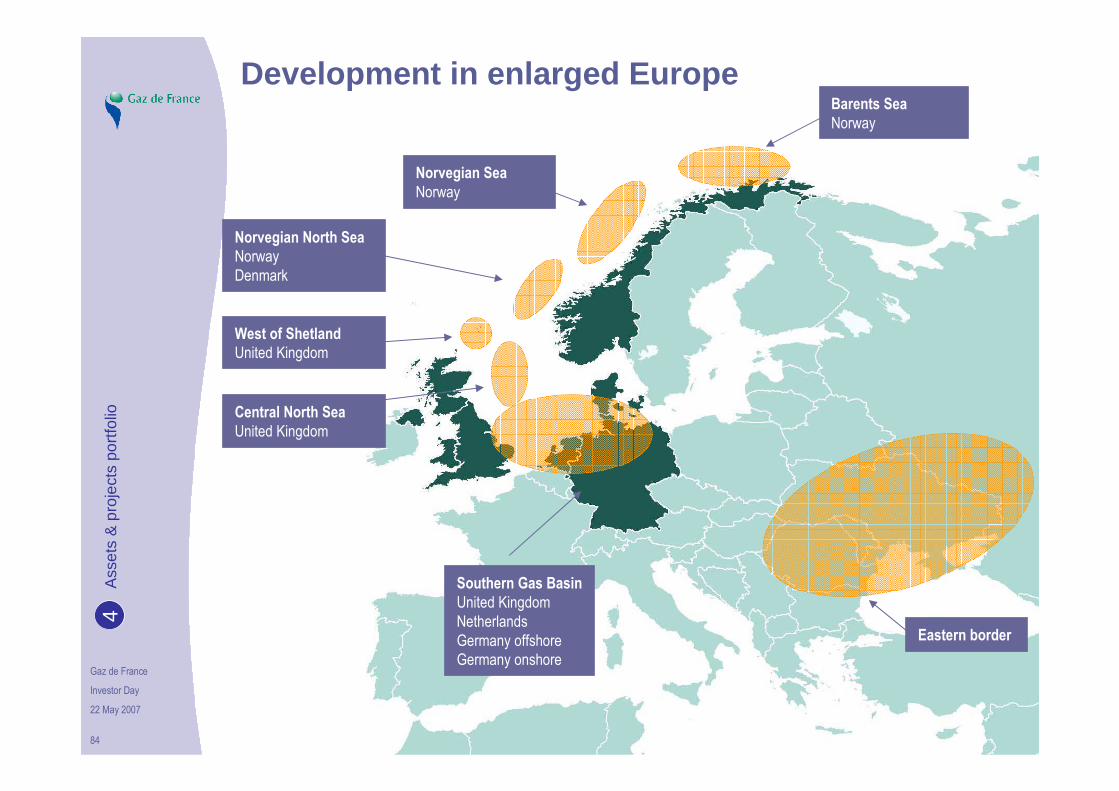
84
Southern Gas BasinUnited Kingdom
Netherlands
Germany offshore
Germany onshore
Central North SeaUnited Kingdom
Norvegian SeaNorway
Barents SeaNorway
Development in enlarged Europe
Eastern border
West of ShetlandUnited Kingdom
Norvegian North SeaNorway
Denmark
Ass
ets
& p
roje
cts
port
folio
4

Gaz de France
Investor Day
22 May 2007
85
Nile Delta BasinEgypt
Mauritaniaoffshore
Ivory Coast offshore
Sbaa BasinAlgerie
North Africa, West Africa, Middle East, Caspian Sea
Exploration licenses currently held by GdF
Projects under analysis –focus for the area
Ass
ets
& p
roje
cts
port
folio
4

Gaz de France
Investor Day
22 May 2007
86
Gaz de France Exploration-Production
Exploration-Production a fully established player
Successful track record
Growth driven strategy
Assets & projects portfolio
Ambitious prospects
Wrap up

Gaz de France
Investor Day
22 May 2007
87
Boost organic growth
Organic Capex 2007-2011
• Budget €3-3.5 billion (Gjoa, Touat.., excl. acquisitions)
Production organic growth 2007-2011
Am
bitio
us p
rosp
ects
5
Estimated Production profile
MBoe/year
0
10
20
30
40
50
60
70
2006 2011
45
61+ 6%

Gaz de France
Investor Day
22 May 2007
88
Significant developments in near future, in addition to exploration to boost production
Targeted acquisitions to complete reserves and reach 1 billion barrels
100
200
300
400
500
600
700
800
900
1 000
2006
2007
2008
2009
2010
2011
2012
2013
Current reserves
Appraisal North Sea
Norway upside
Exploration
Reserve profile (Mboe)
Balance of organic and external growth
0
External growth
Am
bitio
us p
rosp
ects
5

Gaz de France
Investor Day
22 May 2007
89
Gaz de France Exploration-Production
Exploration-Production a fully established player
Successful track record
Growth driven strategy
Assets & projects portfolio
Ambitious prospects
Wrap up

Gaz de France
Investor Day
22 May 2007
90
Wrap up
Gaz de France is well positioned as an established Exploration-Production company
Our track record in generating growth is excellent
We aim to be a large Independent in terms of size and profitability
To achieve this, we will:
• Capitalise on existing positions
• Develop reserves and resources already in our portfolio
• Explore new opportunities and book future reserves
• Boost external growth and balance portfolio by acquiring profitable assets
Wra
p up
6

Gaz de France
Investor Day
22 May 2007
Thank you for your attention
It’s time for questions !

Gaz de France
Investor Day
22 May 2007
Appendices / Back-up

Gaz de France
Investor Day
22 May 2007
93
Booming upstream investments
Strong competition for assets and large number of "new entrants"such as NOCs outside their own countries and small exploration firms
Lead to very significant increase in E&P investments worldwide
E&P investments in billion USD
Source: IFP 2006
0
50
100
150
200
250
300
350
2004 2005 2006 2007e
North America Latin America North Sea Russia and China Others
App
endi
ces
7

Gaz de France
Investor Day
22 May 2007
94
Upstream costs on the rise for few years
• Increased investments in E&P and
• Higher commodity prices driven by overall economic growth
� Shortage of rigs and experienced people
� Rising drilling and construction costs
� Delays in developments
In such a context, know how of operating companies is key: management of drilling rigs, planning, control of investments … help minimize risks
Rising production and development costsA
ppen
dice
s7
Evolution of Upstream capital costs(index 100 in 2000)
90
110
130
150
170
190
2000 2001 2002 2003 2004 2005 2006
Source: les Echos / CERA

Gaz de France
Investor Day
22 May 2007
95
National Oil Companies (NOC)
Very different history and legal context
Largest part of oil and gas reserves in the world: more than 75% of oil reserves and 60% of gas reserves
Less in need of International Oil Companies for investment
Still in need for technologies ?
Tend to invest more and more outside their own backyard
Look for upstream to downstream integration
Source: James Baker Institute – Rice University
Based on Proven reserves figures – not exhaustive
App
endi
ces
7

Gaz de France
Investor Day
22 May 2007
96
International Oil Companies (IOC)
Successors of the Seven Sisters: Exxon Mobil, BP, Chevron, Shell
IOCs also include: Total, ENI, ConocoPhillips…
"Mega"mergers took place since the Seven Sisters, but decreasing share of the oil&gas reserves since mid 70s
Some companies are intermediate between IOCs and NOCs: Statoil, Petronas…
Competitive advantages in managing large projects and in technologies
Large projects tend to be located in countries with strong NOCs:
• Face growth difficulties along with the increasing political and financial strengths of NOCs
App
endi
ces
7

Gaz de France
Investor Day
22 May 2007
97
E&P Independents
Smaller size portfolios
Very specific risk profile with strong focus on:
• Limited number of countries
• Few type of projects/technologies
Comparative advantage in smaller fields:
• More reactive
• Lower fixed costs
• Increasing role as average field size declines ?
M&A market very active, smaller size producers tend to merge or acquire each other
App
endi
ces
7

Gaz de France
Investor Day
22 May 2007
98
Utilities companies
Few North American utilities developed upstream business (Calenergy …)
Limited number of European utilities have really invested in E&P: RWE-Dea, Eon Ruhrgas, Centrica
Generally looking for assets within reach of their markets
App
endi
ces
7

Gaz de France
Investor Day
22 May 2007
99
2002-04 Discoveries
2004 Development sanction
2006 Start of production
2019 Estimate of abandonment
From exploration to production
For historical reasons, time to market has been very long in E&P:
• The average for oil in the world is 12-15 years
• More than 30 years for gas: huge amount of stranded gas
Significant difference between mature areas with existing infrastructure and green field areas …
Elgin/ Franklin (UK) G14 (NL)
1986-91 Discoveries
1997 Development sanction
1997-2001 Platform Construction
2001 Start of production
2042 Estimate of abandonment
2004-06 Platform ConstructionApp
endi
ces
7

Gaz de France
Investor Day
22 May 2007
100
SNØHVIT : an integrated project from gas and condensate production to LNG shipping
CO2 Injection
well
Production well
Seabed
Reservoir
Albatross
Production wells
CDU
Plem
Production wells
Production wells
Snøhvit
CO2 Injection well
Slug catcher Inlet facilities
Pretreatment
Fractionation
Carbon dioxide
MEG recovery
Condensate production
LPG production
LNG production
Liquefaction cycle Subcooling cycle
Storage and loading:
LNG, LPG, condensate
Precooling cycle
Prepared by Petrolink as

Gaz de France
Investor Day
22 May 2007
101
Other countries positions
Ivory Coast: profitable gasproduction dedicatedto a power plant
Egypt: one exploration licence and looking for more assets
Mauritania: LNG or local electricity production ?
App
endi
ces
7

Gaz de France
Investor Day
22 May 2007
102
Commercial and fiscal aspects
Tax rates in concession regimes varies for Gaz de France affiliates, between 35-40% and 78% in Norway
• Investment incentives in Norway are such that Gaz de France offsets all its revenues against its fiscal deficit
Current gas and oil sales can be split between:
• Oil and liquids sold under contracts with a strong link to Brent (adjusted for quality and transportation costs)
• Gas sold under:
� Gas market indexes: NBP, Zeebrugge, TTF
� Typical continental gas contracts including various fuel
indexes and slipping averages
Although volumes sold under gas market indexes increased, long term contracts – continental type – remain dominant
App
endi
ces
7

Gaz de France
Investor Day
22 May 2007
103
The main fiscal regimes
Concession regimes: taxation applies mainly to income, there can be special tax rates for E&P activities and royalties
• UK, Netherlands, Germany, Norway…
• Most of the reserves and production of Gaz de France are under concession regimes, except Ivory Coast (PSC)
Production Sharing Contracts can be split into two subcategories where:
• E&P companies have rights to a portion of hydrocarbons: production and reserves are already net of tax ("entitlement")
• E&P companies have no (physical) rights on hydrocarbons, they receive the financial value of it
• Booking of reserves under PSC is less favorable as the entitlement is already net of tax
Service contracts (or Buy Backs): the E&P company is paid like a service provider and has no access to hydrocarbons: Iran…
• Booking of reserves requires a case by case analysis
App
endi
ces
7

Gaz de France
Investor Day
22 May 2007
104
Reserves - Definition and evaluation of reserves
Reserves are volumes of discovered hydrocarbons estimated to be technically and commercially recoverable
Oil and gas reserves are based on interpretation of geologic and engineering data available at the time of the estimate
Reserves are estimated under conditions of uncertainties, they are not counted for as a stock of goods
Different classification systems and definitions existApp
endi
ces
7

Gaz de France
Investor Day
22 May 2007
105
Evaluation according to SPE / WPC guidelines
Gaz de France evaluates its Proven and Probable (2P) reserves according to the guidelines of:
• The Society of Petroleum Engineers (SPE) and
• The World Petroleum Congress (WPC)
2P reserves are those quantities of hydrocarbons that are estimated to be recoverable more likely than not
• Commercially
• From known geologic accumulations
• From a given date forward
• With existing technologies
• Under the economic assumptions of the evaluator (evolution of prices, inflation and exchange rates)
App
endi
ces
7

Gaz de France
Investor Day
22 May 2007
106
Technical costs per barrel
A synthetic indicator calculated as follows:
• Opex : all expenses related to production, including treatment, transportation and G&A cost related to production
• Exploration costs expended (G&G expenses, seismic studies and G&A related cost as well as dry hole cost)
• And DD&A (Unit of production depreciation plus abandonment)
• Divided by the production of the year
How to understand it:
• Numerator includes all stages of projects from exploration to dismantling, it gives a fair view of upstream costs/investments
• Denominator reflects only the producing assets, a sudden increase or drop in production will affect it : pluriannualaverages are more significant
• Vary strongly according to the type of portfolio (large exploration base vs large producing base) and to the growth strategy (acquisition vs exploration)
App
endi
ces
7

Gaz de France
Investor Day
22 May 2007
107
Benchmark confirms performance
Comparison of GDF performance with peers, key metrics:
• Exploration well success rates
• Finding costs
• IRR
Survey performed by WoodMackenzie early 2006:
• Covers exploration activity of Gaz de France and Peer Group (2000-2004)
• Peer Group includes: BG, Marathon, Apache, Repsol-YPF, Wintershall, Norsk Hydro, Total, OMV, DONG, Woodside, Occidental, Amerada, Kerr-McGee, Talisman, RWE-Dea, ENI, ConocoPhilips, Encana
• Focus on Europe and North Africa
Definitions and methodology: WoodMackenzie
App
endi
ces
7

Gaz de France
Investor Day
22 May 2007
108
Build growth and create long term value
Cumulated value for the Group
Time line
2P reserves: "cash cows" and fields to be developed
Contingent resources: fields to be developed in coming years
Exploration portfolio: from mature to frontier areas
Projects matured internally
or integrated in portfolio
via acquisitionApp
endi
ces
7
CO2 sequestration: convert R&D project into profitable business model
Storage in depleted fields: new sites made available for the Group

Gaz de France
Investor Day
22 May 2007
109
CO2 sequestration projectsGaz de France involvment
CO2 injection on going
Gaz de France operator
CO2 injection pilot project
Gaz de France operator
CO2 injection project
Gaz de France partner
CO2 injection project
Gaz de France operator
Participation to various R&D
consortium on CO2
sequestration in depleted fields
and deep saline aquifersApp
endi
ces
7
TOUAT
SNØHVIT
K12B
ALTMARK