Investment-Banking Relationships: 1933-2007 · Investment-Banking Relationships: 1933-2007 Alan D....
66
Investment-Banking Relationships: 1933-2007 * Alan D. Morrison, Saïd Business School, University of Oxford Aaron Thegeya, International Monetary Fund Carola Schenone, McIntire School of Commerce, University of Virginia William J. Wilhelm, Jr., McIntire School of Commerce, University of Virginia October 4, 2013 * We are grateful to Ron Burt, Zhaohui Chen, Brian Coulter, Leora Friedberg, Mike Gallmeyer, Bill Greene, Anna Kovner, Pedro Matos, Hamid Mehran, Stavros Peristiani, Chris Yung and seminar participants at the Federal Reserve Bank of New York, William & Mary and the Oxford University Centre for Corporate Reputation 2013 Symposium for helpful comments. Paul Bennett, Steve Wheeler, Janet Linde (New York Stock Exchange), Tom Nicholas (Harvard Business School), and the staff at the Mudd Library (Princeton University) provided generous assistance in gaining access to the historical data. Patrick Dennis provided valuable programming assistance and Brendan Abrams, Ye Feng, Vaibhav Kapoor, Thomas Knull, Qiao Ma, Mary Weisskopf, and David Wilhelm provided excellent research assistance. We gratefully acknowledge financial support from the Oxford Centre for Corporate Reputation (Morrison and Thegeya); the Ledford Faculty Fellowship at the McIntire School of Commerce (Schenone); and the Walker Fund and the King Fund for Excellence at the McIntire School of Commerce (Wilhelm).
Transcript of Investment-Banking Relationships: 1933-2007 · Investment-Banking Relationships: 1933-2007 Alan D....

Investment-Banking Relationships:1933-2007∗
Alan D. Morrison,Saïd Business School,University of Oxford
Aaron Thegeya,International Monetary Fund
Carola Schenone,McIntire School of Commerce,
University of Virginia
William J. Wilhelm, Jr.,McIntire School of Commerce,
University of Virginia
October 4, 2013
∗We are grateful to Ron Burt, Zhaohui Chen, Brian Coulter, Leora Friedberg, Mike Gallmeyer, Bill Greene, AnnaKovner, Pedro Matos, Hamid Mehran, Stavros Peristiani, Chris Yung and seminar participants at the Federal ReserveBank of New York, William & Mary and the Oxford University Centre for Corporate Reputation 2013 Symposium forhelpful comments. Paul Bennett, Steve Wheeler, Janet Linde (New York Stock Exchange), Tom Nicholas (HarvardBusiness School), and the staff at the Mudd Library (Princeton University) provided generous assistance in gainingaccess to the historical data. Patrick Dennis provided valuable programming assistance and Brendan Abrams, YeFeng, Vaibhav Kapoor, Thomas Knull, Qiao Ma, Mary Weisskopf, and David Wilhelm provided excellent researchassistance. We gratefully acknowledge financial support from the Oxford Centre for Corporate Reputation (Morrisonand Thegeya); the Ledford Faculty Fellowship at the McIntire School of Commerce (Schenone); and the Walker Fundand the King Fund for Excellence at the McIntire School of Commerce (Wilhelm).

Investment-Banking Relationships: 1933-2007
Abstract
We use a unique dataset of underwritten securities offerings and their syndicate composition
from 1933-1969, together with similar data for 1970-2007 from SDC, to study long-run
trends in investment-bank relationships with their clients, and with one another. The degree
to which issuers conditioned upon prior relationship strength when selecting an investment
bank declined steadily after the 1960s. The probability of an issuer selecting a bank that
had strong relationships with the issuer’s competitors also declined after the 1970s. In
contrast, issuers have placed an increasing emphasis upon the quantity and the quality of
their investment bank’s connections with other banks. We argue that these changes reflect
technological changes that have served to alter the institutional constraints under which
security issuance occurs.

INVESTMENT-BANKING RELATIONSHIPS: 1933-2007
1. Introduction
Securities transactions are the focal point of relationships between investment banks and their
corporate clients. Until the middle of the 20th century these relationships were so stable that the
small banking partnerships that dominated the industry generally were willing to provide advisory
services on the expectation of being awarded future underwriting mandates.1 With the rise of large,
full-service banks, client relationships have become less stable, more fee-for-service oriented, and
increasingly subject to concern for conflicts of interest and violations of client trust.2 In this paper
we study the evolution of investment-banking relationships from 1933 through 2007 in an attempt
to better understand the sources and consequences of this profound change in the structure of
capital markets.
Our analysis draws on a hand-collected dataset that includes all underwritten securities trans-
actions, both public and private, over $1 million from 1933-1969. We append this dataset to post-
1970 coverage provided by Securities Data Corporation (SDC) and follow Ljungqvist, Marston,
and Wilhelm (2006; 2009) in measuring the state of a client’s banking relationships as each bank’s
dollar share of the client’s past securities offerings. We use a similar strategy to measure the state
of a bank’s relationships within industry groups (4-digit SIC categories). Finally, we use graph-
theoretic methods to measure a bank’s connectedness with other banks via syndicate participations.
We then estimate conditional logit models in which issuers condition the assignment of underwrit-
ing mandates on these bank-specific attributes.
The 1933 (Glass-Steagall) Banking Act provides a natural starting point for a long-run analy-
sis of investment-banking relationships because it upset client relationships that rested heavily on
commercial banks’ ability to underwrite securities offerings and thereby created new opportunities
1Eccles and Crane (1988) identify this behavior as a “loose linkage” between fees and service. Ellis (2009, ch.4)identifies the 1955 merger that created Warner Lambert Pharmaceuticals as the first instance in which Goldman Sachscharged a fee for merger advice. Lazard was viewed as a pioneer for developing its fee-based merger advisory businessduring the 1960s. Morgan Stanley did not create a mergers and acquisitions department until 1972. See Morrison andWilhelm (2007, pp.255-259) and Carosso (1970, p.502) for further discussion.
2Goldman Sachs recently attempted a spectacular balancing act by advising both sides of Kinder Morgan’s pro-posed $21 billion acquisition of El Paso Corporation while also holding two board seats and maintaining a $4 billionfinancial stake in Kinder Morgan. A stockholder appeal for a preliminary injunction elicited a detailed and entertain-ing analysis of the case from Chancellor Strine of the Delaware Court of Chancery. See “In Re El Paso CorporationShareholder Litigation,” Civil Action No. 6949-CS, February 29, 2012. Goldman’s experience is not unique.
2

INVESTMENT-BANKING RELATIONSHIPS: 1933-2007
for private (investment) banks.3 The Act was followed in close succession by further regulatory
intervention aimed at weakening bank relationships culminating with an unsuccessful 1947 civil
suit filed by the U.S. Justice Department (U.S. v. Henry S. Morgan et al.) against 17 investment
banks charged with conspiring through their syndicate connections to monopolize the U.S. securi-
ties business.
In spite of this regulatory upheaval during the early part of the sample period, we find that
issuers placed increasing weight on the state of their banking relationships in their decision whether
to (re)engage a bank to manage a transaction and on the state of the bank’s relationships with the
issuer’s competitors. On the other hand, banks’ syndicate connections had a modest but negative
effect on bank selection. In other words, during the early part of our sample period, it appears that
the influence of bank/client relationships strengthened in the face of regulatory action intended
to weaken them and that, contrary to the motivation for U.S. v. Henry S. Morgan et al., strong
syndicate connections provided little, if any, competitive advantage.
In contrast, we find that the influence of bank/client relationships began to weaken and syndi-
cate ties strengthen beginning in the 1960s. By the time that commercial banks began to reenter
the securities underwriting business the influence of bank/client relationships had stabilized at a
level similar to that observed in the immediate aftermath of the post-Depression regulatory effort.
Similarly, issuers responded much less favorably to banks with strong relationships within the is-
suer’s SIC category after the 1970s. On the other hand, by the last decade of the sample period, the
increase in a bank’s odds of being selected for a one unit increase in our measure of the strength of
its syndicate connections was about 8 times larger than its estimated level for the 1960s.
We explain the declining influence of bank/client relationships by first recognizing that they rest
on banks’ ability to build and preserve a reputation for their bankers being skillful and trustwor-
thy. Morrison and Wilhelm (2004) identify limited organizational scale and relative immobility
among human capitalists as being conducive to building and preserving institutional reputation.
We show that these conditions were met by banking partnerships throughout the early part of our
sample period. But beginning around 1960 the investment-banking industry entered a period of
3By the end of the 1920s two large commercial banks, Chase National and National City of New York, sponsoredover half of all new securities offerings. See Morrison and Wilhelm (2007, p.210).
3

INVESTMENT-BANKING RELATIONSHIPS: 1933-2007
unprecedented technological and organizational upheaval that culminated in 1970 with the New
York Stock Exchange’s (NYSE) membership (including virtually all of the major banks) agreeing
to permit members to operate as public corporations. Morrison and Wilhelm (2008) argue that
these changes began to undermine reputation concerns among investment banks at precisely the
time that we observe the influence of bank/client relationships beginning to weaken.
Bank/client relationships stem from interactions between individual bankers and client repre-
sentatives. During the early part of our sample period, bankers generally spent their entire careers
with a single, typically quite small, banking partnership. It was not unusual for a banker to be
responsible for a specific client relationship for many years, even decades. Coupling long-term
partnership commitments with longstanding client relationships provided bankers with the oppor-
tunity to build client trust and the incentive to protect their individual and institutional reputations
for having done so. We document the longevity of individual bankers and their long-term commit-
ments to a single institution by tracking the identity of bank partners annually. We also illustrate
bankers’ long-term responsibility for specific clients by documenting the number and length of
individual bankers’ directorships through the first part of our sample period for the 17 defendant
banks in U.S. v. Henry S. Morgan et al. Tracking individual partners annually provides evidence
of erosion in the conditions that contributed to long-lived, personal relationships with clients be-
ginning in the late 1950s and gathering force through the 1970s. Our bank-choice model indicates
that issuers responded negatively to the departure of bank partners during the 1960s and 1970s.
Our results related to the state of a bank’s relationships within an issuer’s industry suggest that
issuer’s valued industry expertise throughout the sample period. The substantial decline in this
effect during the 1980s is consistent with evidence provided by Asker and Ljungqvist (2010) of
potential conflicts of interest and leakage of strategic information causing large issuers to avoid
engaging banks that also managed transactions for firms in the same industry.4 Coupled with the
simultaneous decline in the influence of bank/client relationships and the negative effect of banker
turnover, these results suggest that the 1970s and 1980s mark the outset of an erosion of trust
between banks and their clients.
4See Bodnaruk, Massa, and Simonov (2009) and Griffin, Shu, and Topaloglu (2012) for mixed evidence onwhether client information is exploited for trading purposes.
4
INVESTMENT-BANKING RELATIONSHIPS: 1933-2007
The influence of syndicate connections began to rise alongside the rise of institutional invest-
ing. We suggest that syndicate connections are of greatest interest to issuers when they promote
efficiency in information acquisition from (institutional) investors as in Benveniste and Spindt
(1989). Pichler and Wilhelm (2001) argue that the syndicate structure is an efficient mechanism
for maintaining the investor relationships central to information acquisition. To the extent that
trust between banks and their clients was declining during the latter part the sample period, is-
suers may also have valued syndicate connections more highly for the competitive pressure and
cross-monitoring opportunities that they created among bankers. Corwin and Schultz (2005) and
Morrison and Wilhelm (2008) suggest that the syndicate aligns the lead underwriter’s incentives
with those of the issuer by rewarding co-managers for revealing lead-underwriter malfeasance.
Co-managers have incentive to communicate if by doing so they are more likely to be selected to
manage the issuer’s future transactions. Ljungqvist, Marston, and Wilhelm (2009) provide evi-
dence that co-management is indeed a stepping stone to management opportunities.
Our paper is related to a growing body of recent work studying how issuers assign underwriting
mandates for their securities offerings.5 Early work examined why firms switch banks between
their initial public offering of equity (IPO) and first subsequent equity offering. Krigman, Shaw,
and Womack (2001) argue that switching occurs as firms seek to “graduate” to more prestigious
underwriters, in part, as a means of gaining better research coverage (on the latter point, see also
Cliff and Denis (2004)). In contrast, Ljungqvist and Wilhelm (2005) find that switching away from
the IPO underwriter is related to behavioral proxies for insider (dis)satisfaction with the outcome
of the IPO. Chitru, Gatchev, and Spindt (2005) provide a theory and evidence consistent with
“positive assortative” matching between banks and issuers. Ljungqvist, Marston, and Wilhelm
(2006; 2009) offer a broader perspective by studying the issuer’s decision process for both debt
and equity offerings beyond the first post-IPO capital-raising transaction.6
5See Ljungqvist (2007) and Eckbo, Masulis, and Norli (2007) for reviews of the broader literature on equityofferings.
6Yasuda (2005) examines the issuer’s bank choice for a sample of debt issues brought to market in the UnitedStates between January 1, 1993 and August 31, 1997. For our purposes, her central finding is that issuers were morelikely to choose banks with which they maintained a lending relationship during the early stages of commercial bankentry to debt underwriting covered by her sample period. Yasuda (2007) reports similar findings for the Japanesebond market. Schenone (2004) documents benefits to IPO issuers that select a bank with which they have a lendingrelationship and Benzoni and Schenone (2010) find no evidence of conflicts of interest in such cases.
5

INVESTMENT-BANKING RELATIONSHIPS: 1933-2007
Our use of eigenvector centrality to study bank connectedness is motivated by recent work
indicating that network connections influence the performance of financial intermediaries.7 For
example, Ljungqvist et. al. (2009) report that strong syndicate connections weakly strengthen a
bank’s bid for lead management (and only for debt offerings) but they find stronger evidence of
a positive effect on the likelihood of being appointed a co-manager. Hochberg, Ljungqvist, and
Lu (2007) report that funds run by better-networked venture capital firms perform better than their
peers and that their portfolio companies are more likely to gain subsequent financing and achieve a
successful exit. Hochberg, Ljungqvist, and Lu (2010) show further that strong local venture capital
networks pose a barrier to entry for nonlocal venture capitalists.
Finally, our documentation of weakening client relationships and diminishing institutional
commitment among bankers provides a suggestive backdrop for recent theoretical work aimed
at better understanding why reputation concerns appear to have become less effective for control-
ling conflicts of interest within investment banks. Chen, Morrison, and Wilhelm (2013a; 2013b)
study the tension between a bank’s interest in maintaining a reputation for trustworthy behavior
and individual bankers having opportunities to signal their ability by taking actions that conflict
with their clients’ interests. In these models, the technological changes that we associate with
weakening client relationships can undermine banks’ incentives to curb self-interested behavior
within their ranks and give rise to the sort of transactions that have been subject to criticism in
the aftermath of the recent financial crisis. The asset securitization market has been a prominent
focal point for such criticism. Winton and Yerramilli (2011), Hartman-Glaser (2013), and Griffin,
Lowery, and Saretto (2013) all develop models in which reputation concerns can fail to resolve
conflicts of interest in this setting.
Because our study of banking relationships cuts across a wide time span, much of which has
been subject to limited statistical analysis, we begin in section 2 with a brief overview of events that
shaped banks’ relationships both with their clients and with one another during the early decades
of our sample period. In section 3 we provide a detailed characterization of the pre-1970 data used
in our analysis and document broad patterns in the data over the entire sample period. In section 4
7See Bonacich (1972) for development of the eigenvector centrality measure and Podolny (1993) for an earlyapplication to investment-banking syndicates.
6

INVESTMENT-BANKING RELATIONSHIPS: 1933-2007
we define and provide summary statistics for the measures of the state of bank relationships used in
the econometric analysis. Section 5 outlines the econometric methodology and section 6 presents
the estimation results. We conclude in section 7 by placing our results in historical context and
suggesting implications for the current state of investment banking.
2. Historical Background
This section provides a timeline of events that influenced investment-banking relationships over the
course of our sample period. It is intended as an overview and therefore is by no means complete.
Carosso (1970), Medina (1954 [1975]), and Seligman (1982) provide authoritative accounts of
events through the first half of the sample period. Morrison and Wilhelm (2007, ch.7-8) and
Morrison and Wilhelm (2008) provide further detail on events during the latter part of the sample
period as well as a discussion of the influence of technological change on the industry.
From 1933 through the early 1950s investment banks were subject to political and regulatory
efforts aimed at weakening their ties with clients and with one another. The 1933 Banking Act was
signed into law on June 16, 1933 and was followed on June 6, 1934 by the Securities Exchange Act.
For our purposes, the Banking Act’s separation of deposit collection and lending from securities
market activity (to be completed by June 16, 1934) stands out for having forced reorganization of
many important banks and and thereby potentially upsetting existing banking relationships.
Some prominent banks (e.g., Goldman Sachs, Kuhn Loeb, Lehman) already specialized in se-
curities offerings and were able to carry on relatively undisturbed. By contrast, in June 1934 J.P.
Morgan formally discontinued its investment banking operations but had effectively left the busi-
ness when the Banking Act was enacted. It was not until September 16, 1935 that several J.P. Mor-
gan partners (Harold Stanley, Henry S. Morgan, and William Ewing) left the firm to incorporate
Morgan Stanley & Co. They were joined by former partners from Drexel & Co. and soon thereafter
by two officers from the former securities affiliate of Guaranty Trust. The fact that the founding
members of the new firm had considerable experience in the industry (each of the three Morgan
men had been a partner for seven years when J.P. Morgan discontinued its investment-banking
operations) contributed to the new firm’s ability to quickly gain a leading position among under-
7

INVESTMENT-BANKING RELATIONSHIPS: 1933-2007
writers. First Boston and Smith Barney followed similar paths bringing together senior bankers
from several pre-1933 banking organizations [Medina (1954 [1975])].
Two additional regulatory changes that were directly aimed at upsetting the industry’s status
quo soon followed. The 1938 Chandler Act implemented a statute-based approach to bankruptcy
reorganization that significantly diminished the value of bank relationships as well as their advisory
role. The Act was followed by a sharp increase in private placements (especially debt) that further
diminished the influence of banks in securities issuance [Morrison and Wilhelm (2008)].8
In spite of repeated attempts at weakening ties between issuers and bankers, a 1940 SEC Public
Utility Division study noted that six leading New York banks managed 62% of bond issues and
57% of bond, preferred stock and common stock issues between January 1934 and June 1939.
Morgan Stanley alone managed 81% of high-grade bond issues including 70% of high-grade utility
bond issues. The study alleged that such concentration reflected “an unwritten code whereby once
a banker brings out an issue, the banker is deemed to have a recognized right to all future public
issues of that company.”9
The SEC responded in 1941 by enacting Rule U-50 requiring competitive bidding (instead of
the traditional negotiated underwriting) for the underwriting of utility issues. It was followed in
1944 by the Interstate Commerce Commission requiring competitive bidding for railroad issues.
The new rules had the desired effect in the sense that they enabled less prominent banks, most
importantly Halsey Stuart and Merrill Lynch, to gain ground on the leading banks. To the extent
that gains were made by breaking the “unwritten code,” they weakened bank-client relationships
as we measure them.
U.S. v. Henry S. Morgan et al. posed a major challenge to bank syndicate relationships. The
1947 civil suit, filed under Sections 1 and 2 of the Sherman Act, charged 17 investment banks with
8Carosso (1970, pp.430) argues that “The ability of great corporations to finance themselves and the growth ofprivate placements had diminished significantly the role and influence of investment bankers in the economy.” In theextreme, AT&T, for example, sold $150m of $730m of securities issued between 1935 and 1940 without the assistanceof investment bankers – i.e., Morgan Stanley [Carosso (1970, pp.405)]. Also see Calomiris and Raff (1995, p.124-132)on the rise of private placements.
9“The problem of maintaining arm’s length bargaining and competitive conditions in the sale and distribution ofsecurities of registered public utility holding companies and their subsidiaries,” Report of the Public Utilities Division,SEC, December 18, 1940. The study is quoted by Seligman (1982, p.218) in a detailed discussion of the politicalbackdrop for the promulgation of the compulsory bidding rules. Also see Carosso (1970, ch.20).
8

INVESTMENT-BANKING RELATIONSHIPS: 1933-2007
“entering into combination, conspiracy and agreements to restrain and monopolize the securities
business of the United States...” and it identified the underwriting syndicate as a primary vehicle
for the alleged abuse of longstanding banking relationships.The opinion rendered by Judge Harold
Medina in October 1953 (and filed on February 4, 1954) dismissed all charges against the defen-
dants and castigated the government for the weakness of its case.10 With respect to the syndicate
system Medina found “...no concert of action, no agreement and no conspiracy, integrated over-all
or otherwise” [Medina (1954 [1975], p.119)].
By the 1940s, the underwriting syndicate’s distribution function already had undergone sub-
stantial change. At the beginning of the 20th century, banks’ securities distribution operations were
quite small and concentrated on the east coast. Underwriting syndicates routinely remained in
place for a year or more as syndicate members travelled to peddle securities to individual investors
[Medina (1954 [1975], pp.22-23)]. Distribution improved as retail brokerage networks expanded
[e.g., Perkins (1999, p.219)] and by the late 1940s syndicate contracts usually were written for
15-30 days [Medina (1954 [1975], p.43)].
The 1940s also witnessed the early stages of change in the investor community that would re-
shape both syndicate and client relationships. Institutional ownership of U.S. equities outstanding
doubled from 7% to 14% between 1945 and 1960 [Federal Reserve Flow of Funds, L.213]. Mutual
fund assets grew from $448 million to $3.5 billion between 1940 and 1952 while pension fund as-
sets grew from $3 billion in 1947 to $18 billion in 1955. And as their assets grew rapidly during the
1940s, life-insurance companies became dominant investors in the burgeoning market for private
placements to the point of crowding out investment banks by investing in direct placements.11 By
the 1950s, The NYSE’s daily trading volume averaged about 2.2 million shares on open interest of
5.6 billion shares. Average daily trading volume stood at about 3 million shares in 1960 and then
nearly quadrupled by 1970, and then quadrupled again by 1980 [Morrison and Wilhelm (2007,
pp.232-233)]. The evolution of block trading provides a more direct account of the influence of
10The case did not go to trial until November 28, 1950 and it concluded on May 19, 1953. In the interim, counselfor the government and defendant banks produced, in the words of Judge Medina, “truckloads of documents... Theprecise number of the hundreds of thousands of documents... will probably never be known.” [Medina (1954 [1975],p.213)].
11See Kemmerer (1952), Carosso (1970, pp.499-501), and Sobel (1986, p.64).
9

INVESTMENT-BANKING RELATIONSHIPS: 1933-2007
institutional trading. In 1965, the NYSE reported 2,171 block trades accounting for about 3% of
reported volume. By 1972 the number of block trades had grown about 15 times to 31,207 trades
(18.5% of volume) and then tripled by 1979 (97,509 transactions, 26.5% of volume).
In spite of fixed commission rates (abolished in May, 1975), the rapid increase in trading vol-
ume proved a life-threatening burden for many investment banks. Closing transactions required
physical exchange of stock certificates and back office capacity was being challenged by the pa-
perwork required to manage the flood of new business. Although fixed commissions prevented
price competition, early adopters of nascent batch-processing computer technology, such as Mer-
rill Lynch, gained a competitive edge that ultimately proved to be decisive. By the late 1960s
the industry was in the midst of a back-office crisis stemming from the inability of many firms to
close transactions in a timely manner. “Losses associated with ‘too much business’ led approxi-
mately 160 NYSE member firms either to merge with competitors or to dissolve their operations”
[Morrison and Wilhelm (2007, pp.235-236)]. Among firms that survived, Merrill Lynch, Goldman
Sachs, and Salomon Brothers were noteworthy for having strengthened their investor relationships
by investing heavily in block trading and arbitrage services [New York Times, July 17, 1971]. With
other firms claiming to have been forced to decline institutional business for want of capital to fund
investments in technology, the NYSE membership decided in 1970 to permit member firms to op-
erate as public corporations. Investment banks went public in two waves [Morrison and Wilhelm
(2008)]. Most banks with substantial retail brokerage operations had gone public or combined with
a public firm by the end of the 1970s. By 1987, among the major wholesale banks, only Goldman
Sachs and Lazard remained private partnerships.
As we noted earlier, advising on mergers and acquisitions evolved into a significant fee-for-
service business during the 1960s and 1970s. The 1978 Bankruptcy Code reversed the provisions in
the 1938 Chandler Act that prevented banks taking an active role in corporate reorganization. The
confluence of fee-for-service advisory operations, the new bankruptcy code, the development of
the market for junk bonds, and the leveraged buyout helped to fuel 172 successful hostile takeovers
and a total of 35,000 completed mergers in the U.S between 1976 and 1990 [Morrison and Wil-
helm (2007, pp.251-262)]. Hostile takeovers were viewed from the outset as an affront to client
10

INVESTMENT-BANKING RELATIONSHIPS: 1933-2007
relationships.12
Just as banks were beginning to threaten client relationships by advising on hostile takeovers,
the SEC, in March 1982, implemented Rule 415, providing for shelf registration of securities
offerings, with the explicit intention “to produce a decline in the market power of bankers in their
relationship with issuers.”[Calomiris and Raff (1995, p.121)]. Bhagat, Marr, and Thompson (1985)
suggest that shelf registration had the potential for intensifying competition among underwriters
by reducing the costs of informal competitive bidding for the underwriting mandate. The initial
flurry of activity in the market suggested that it may have had the desired effect. From March,
1982 through May, 1983 there were 508 shelf registrations worth $79.3 billion. About 25% of
equity offerings between 1982 and 1983 appearing in the sample studied by Denis (1991) were
shelf registered.
On March 18, 1987 the Federal Reserve Board approved Chase Manhattan’s application to
underwrite and deal in commercial paper in a commercial finance subsidiary. Approval of similar
applications from Citicorp, J.P. Morgan, and Bankers Trust followed soon thereafter. It was not
until January 18, 1989 that commercial banks gained approval for limited underwriting of corporate
debt. As of September 1990 only J. P. Morgan (11), Citibank (14), Chemical Bank (17), Bankers
Trust (19), and First Chicago (20) ranked among the top 20 debt underwriters. The Fed did not
grant equity underwriting powers to commercial banks until September 1990 [Benveniste, Singh,
and Wilhelm (1993)]. The 1933 Banking Act was repealed in 1999 by the Gramm-Leach-Bliley
Act.
3. Data
This Section describes the sources and nature of the data collected for the 1933-1969 period and
details the exclusions used for comparability with related work.
12See Armour and Skeel (2007). John Whitehead justified Goldman’s policy of not working for hostile biddersduring this period “partly as a matter of business ethics, but primarily as a matter of business judgment" [Ellis (2009,p. 271)].
11

INVESTMENT-BANKING RELATIONSHIPS: 1933-2007
3.1. Data for Issues Between 1933 and 1969
We collected the details of securities offerings between 1933 and 1969 from two sources. Counsel
for several defendants in United States v. Henry S. Morgan, et al assembled details of all under-
written issues of $1,000,000 or more from July 26, 1933 to December 31, 1949.13 The records
were subsequently published in 1951 as Issuer Summaries.14 Data for 1950s and 1960s deals were
collected from the Investment Dealers’ Digest.15 Transaction details were scanned using opti-
cal character recognition software, and then checked by hand. Our database contains a complete
transcription of records from these two sources.
For each transaction, the 1933-69 source data includes the name of the issuer,16 the date of the
offering,17 the exact title of the security issue, bond ratings where reported in the source data, the
manager or co-managers for underwritten offerings and the dollar amount raised.18 For transac-
tions between 1933 and 1949 additional information about the gross spread and issue registration
are also included. A descriptive field contains additional information in free text. We used text
processing software to extract information about stock type (preferred, common, cumulative pre-
ferred), debt offerings (preferred, cumulative, convertible, note, debenture), number of shares, debt
yield, and debt maturity from this field.
We need to identify the lead manager for each issue. However, the source data for deals prior
13United States v. Henry S. Morgan, et al., doing business as Morgan Stanley & Co.; et al, (Civil Action No. 43-757), United States District Court for the Southern District of New York. Additional information related to the case isdrawn either from the Corrected Opinion of Judge Harold R. Medina or from the Harold R. Medina Papers housed atthe Mudd Library, Princeton University.
14Sullivan & Cromwell, Issuer summaries; security issues in the United States, July 26, 1933 to December 31,1949. Prepared by counsel for defendants in United States v. Henry S. Morgan, et al., doing business as MorganStanley & Co.; et al. (Baker Old Class JS.065 U571h). For further discussion of the data and its collection, see theappendix to Corrected Opinion of Judge Harold R. Medina.
15Investment Dealers’ Digest, Corporate Financing, 1950-1960, 1961; Investment Dealers’ Digest, Corporate Fi-nancing, 1960-1969.
16The source data frequently included several different names for the same entity. This occurred for both bank andissuer names. For example, Lehman Bros., Lehman Brothers, and Lehman all refer to the same firm. We identifiedcases like these with a similarity algorithm that determined the minimum number of character changes required to turnone text field into another (the “Levenshtein distance”). This enabled us to identify groups of names referring to thesame firm (bank or issuer), and, hence, to map each such name to a common identifier.
17The transaction dates for some deals do not include a day; these transactions are assumed to occur on the firstday of the month.
18For 1933-1949, the data source also includes the number of underwriters including the manager. The datasetcontains dollar amount raised for the 1930s, 40s, and 60s. The data source gave this information only sporadically inthe 1950s. Where possible, we supplemented this information with data from the CRSP database, as discussed below.
12

INVESTMENT-BANKING RELATIONSHIPS: 1933-2007
to 1950 lists all managers and co-managers in alphabetical order, and does not name the lead man-
ager. In practice, this is a relatively small problem: only 1,378 of the offerings performed in the
1940s (17 percent of the total) had more than one manager. We identified the lead bank for 20
percent of those transactions by matching them with contemporary tombstones. The remaining
transactions appear to have been too small to have published tombstones, and we were unable
to identify lead managers for them. We retain them in the database, with syndicate seniority as-
signed alphabetically. Excluding these transactions from our econometric analysis does not have a
significant effect upon our results.
The source data for 1950-1969 records managers and co-managers in decreasing order of se-
niority. We checked that this was the case by matching a random sample of 400 syndicates to
contemporary tombstone advertisements that listed underwriters in decreasing order of seniority.
The combined hand-collected 1933-1969 database comprises 51,278 transactions. We ex-
cluded data that were obviously erroneous, or that were ambiguous.19 We also excluded a subset of
issuance data that were duplicated in 1950s and 1960s source documents. This reduced the sample
to 49,155 transactions.
The 1933-1969 source data does not include SIC codes. We extracted SIC codes, as well as
closing prices and trading volumes, for issuers of sufficient size to appear in the CRSP database.
The SIC codes were then matched to Cusips for use in extracting financial statements from the
Compustat North American database. Since company SIC codes can change over time, we match
company names to SIC codes by decade.
Company names not matched in CRSP were manually checked; those that were easily identi-
fied as banking, insurance, re-insurance, real estate, and securities industry players were assigned
SIC code 6000. Similarly, all public and government bodies were assigned SIC code 9000. We
used text-processing programs to identify companies in the natural resources and agricultural sec-
tors, to which we assigned SIC code 1000, railroad companies, which were assigned SIC code
4011, and utilities and transport companies excluding railroads, which were assigned SIC code
19Generally, this occurred when commas were misplaced: for example, we excluded data that included numbersrecorded as 1,00,000.
13

INVESTMENT-BANKING RELATIONSHIPS: 1933-2007
4911.20 Using these methods, we were able to identify SIC codes for 25,088 out of 49,155 trans-
actions between 1933 and 1969.
3.2. Data for Issues from 1970 to 2007
Data for issues between 1970 and 2007 were taken from the Thomson Reuters SDC database. The
data were cleaned to exclude foreign exchange-listed issues, foreign-traded issues, and issues listed
by non-US incorporated entities. This dataset holds incomplete records for issues between 1970
and 1979. For example, there is no private placements data for this period; SDC were unable to
provide more complete data.
3.3. Standard Data Exclusions
The full sample dataset (1933-2007) contains 287,332 transactions after the exclusions detailed
in Sections 3.1 and 3.2. To ensure consistency with the related literature, we exclude issues by
financial institutions (SIC codes 6000-6999), government and public bodies (SIC codes 9000-
9999), agricultural and natural resources companies (SIC codes 0-1499), electric, gas, and sanitary
services companies (SIC codes 4900-4999), pipelines other than natural gas (SIC codes 4611-
4619), and the United States Postal Service (SIC code 4311). We also excluded deals whose
industry was recorded as falling into one of these categories.21
For the post-1969 period, for which we had more complete information, we made some ad-
ditional exclusions. Deals for which the underwriter is recorded as “No Underwriter” or “Not
Available” are excluded; so were issues by funds, depositaries, leveraged buyout deals, issues by
limited partnerships, rights issues, unit issues, regulation S issues, World Bank issues, and self-
20Specifically, we used regular expression matching within Python scripts to identify companies with specifickeywords in their names. Natural resource and agriculture companies were matched to the following keywords:mining, mines, mineral, coal, fuels, oil, petroleum, drill, onshore, farm, grower, dairy, ranch, cattle, breed, irrigation,tree, timber, forest, soil, marine. Railroads companies were matched to keywords rail, RR, Rr, railroad. Utilities andtransportation companies excluding railroads were matched to the following keywords: power, light, heat, atomic,energy, electric, public service, gas, utility, hydro, hydraulic, water, pipeline, waste, recycle.
21Specifically, we excluded deals whose industry was recorded as “Other Finance,” “REIT,” “Real Estate,” “Invest-ment Bank,” “S&L/Thrift,” “Investment Fund,” “Mortgage Bank,” “Agriculture,” “Fedl Credit Agcy,” “Gas Distribu-tion,” “Natural Resource,” “Oil/Gas Pipeline,” or “Water Supply.”
14

INVESTMENT-BANKING RELATIONSHIPS: 1933-2007
funded issues.
Finally, we include only straight equity issues that are classified as common, ordinary, cumu-
lative, or capital shares. We retain only those preferred deals that are identified in the source data
as cumulative, convertible, capital, or certificate. We exclude floating, indexed, reset, serial, and
variable coupon debt issues, and retain other debt deals only if they are classified as bonds, deben-
tures, notes, or certificates, and if they have a maturity of at least two years. These exclusions trim
the sample to 63,302 transactions.
Table I provides an overview of the banking landscape from the perspective of this subsample
by reporting the top 30 banks by market share for the 1933-1969 and 1970-2007 periods. Looking
across the two halves of the sample period, concentration levels increased markedly. The top 30
banks measured by proceeds held about 84% of market share during the first half of the sample
and about 91% during the second half. The top 5 (10) banks accounted for 40% (61%) of proceeds
during the first half of the sample and about 50% (75%) during the second half.22
3.4. The Issuer’s Bank Choice Set
Our econometric analysis involves estimation of bank choice models for 7 time periods that, with
the exception of the first, correspond with decades. The issuer’s choice set for a given transaction
includes the top 30 banks ranked by the dollar volume of transactions for which they served as the
lead manager during the decade in which the transaction took place. This means that transactions
managed by banks outside of the top 30 in a given decade are excluded from the analysis.23 We use
the 1933-1942 time window to seed the relationship measure described in the following section.
Finally, we retain only those transactions for which the issuer’s SIC code is available. Taken
together these restrictions yield a final sample of 33,577 transactions for use in the econometric
analysis.
22This table is not used as a basis for our relationship analysis and, in order to make trends of the type discussedin this paragraph clear, it does not reflect the lifeline mappings discussed in the next section. Hence, for example,Bank of America deals are illustrated independently of Merrill Lynch deals, even though both are assigned to the samelifeline in our relationship analyses.
23The appendix includes a list of the 30 banks that appear in each decade’s choice set and their market share duringthe decade.
15

INVESTMENT-BANKING RELATIONSHIPS: 1933-2007
Table II reports the distribution of transactions in total and by type across the estimation peri-
ods. The number of transactions in an estimation period ranges from a minimum of 842 for the
1943-1949 sample to a maximum of 12,574 for 1990-1999 sample. Debt issues substantially out-
number equity (and preferred) issues in every estimation period. Over the entire sample period,
debt, equity, and preferred issues accounted for 64%, 31%, and 5% of the sample of transactions.
We also report the number and fraction of transactions for which the issuer had no other transac-
tion during the 10 years preceding the year of the transaction at hand managed by a bank in its
choice set. In the full sample, the percentage of transactions carried out by issuers that had no
prior relationship with a bank in its choice set ranged from 73% during the 1943-1949 estimation
period to 21% during the 1950-1959 estimation period. The absence of a relationship was most
prevalent between 1970 and 1989. As we show later, this was a period of considerable upheaval in
bank/client relationships. Generally, equity issuers were were less likely than debt issuers to have
dealt with a bank in its choice set during the preceding ten years. In the next section we explain
how the state of a banking relationship is measured for estimation purposes.
The relatively small number of observations for the 1970-1979 period reflects the previously
mentioned absence of private placement coverage by SDC during this decade. This could bias
our results if issuers systematically approach the selection of an underwriter differently for private
placements than for other transactions. With respect to the relationship strength variable, there is
considerable anecdotal evidence that the sharp increase in private placements following the 1938
Chandler Act’s implementation of a statute-based approach to bankruptcy reorganization dimin-
ished the influence of banks in securities issuance.24 If the same is true for the 1970s, the exclusion
of private placements should bias our results toward greater issuer dependence on its relationship
with a prospective bank than would be the case if private transactions were included in the anal-
ysis. But any such bias would then lend weight to our conclusion that the extent to which issuers
conditioned their bank selection on the strength of a prior relationship declined during the 1970s.
24See Skeel (2001) for a detailed account of the Chandler Act and its influence on the industry.
16

INVESTMENT-BANKING RELATIONSHIPS: 1933-2007
4. Investment-Bank Relationships
The first challenge in measuring the state of banking relationships at a point in time stems from
the frequent name changes and mergers involving both banks and issuers throughout the sample
period. If we were to base our analysis upon the names that banks had when a deal was brought
to market it would therefore be impossible to track the fortunes of many major banks through the
entire period considered. We avoid this problem by defining a bank’s lifeline.
We follow Ljungqvist, Marston, and Wilhelm (2006; 2009) in defining a bank’s lifeline at a
particular date to comprise the names of all of the institutions that were merged into, or that were
acquired by, the bank prior to that date. The bank’s lifeline ends either when it fails, or when it is
absorbed into another bank. Each lifeline is given a name, which we use in place of the specific
name of a bank whenever it is used in our analysis as a member of the lifeline.
In the case of Merrill Lynch, for example, it acquired Goodbody in 1970 and White, Weld in
1978. Each acquired firm’s lifeline terminates with the acquisition and its underwriting relationship
history is merged with Merrill’s. It is impossible to avoid the exercise of judgment in creating the
lifeline for a bank, as it is necessary to decide whenever two banks combine, through merger or
acquisition, which bank’s lifeline terminates. When the combined entity takes the name of one
of the banks this choice is easy; on other occasions, we assigned the combined institution to the
lifeline that we believe to represent the more significant investment banking house. For example,
after 2008 we would assign Bank of America Merrill Lynch to the “Merrill Lynch” lifeline. Using
a similar strategy, we assign clients and their underwriting histories with sample banks to corporate
families when sample firms merge.
4.1. Measuring Bank-Client Relationships
We measure the state of relationships between banks and clients over 10-year, rolling measurement
windows beginning with data from 1933. In the econometric analysis we use a relationship strength
index in which for any bank and any issuer, the relationship strength is calculated on a particular
date D as follows. First, we calculate the total dollar quantity Q of proceeds raised by any firm
17

INVESTMENT-BANKING RELATIONSHIPS: 1933-2007
in the issuer’s corporate family during the preceding ten years. Second, the total amount A lead
managed for the firm’s corporate family by a member of the bank’s date D lifeline is computed.
The strength of the relationship between the bank and the company at date D is defined to be the
ratio of A to Q. In our analysis we use relationship strength measures calculated using data for all
deals between the bank and the company as well as separate measures for debt and equity deals.
Table III provides an overview of client relationships for the top 30 banks by market share for
the periods 1933-1969 and 1970-2007. The table reports the number of clients for which each bank
managed securities offerings, the percentage of its clients with which it had an exclusive relation-
ship, and the fraction of all of its clients’ transactions by value for which the bank was the lead
manager. Proceeds from transactions with multiple bookrunners are apportioned equally among
the bookrunners.25 Table III reveals a shift from a single bank underwriting a large fraction, and in
many cases all, of an issuer’s securities offerings from 1933-1969 to a world in which underwriting
relationships were far less exclusive. During the first half of the sample period 53% of all client
relationships among the top 30 banks were exclusive – the bank managed every deal that the issuer
brought to market. This figure dropped to “only” 34% during the second half of the sample period.
The larger change occurred in the banks’ share of proceeds raised by both clients with which it
maintained an exclusive relationship and those with which it did not. The decline from about 39%
to 16% reflects, in no small part, large-scale “poaching” of active issuers by commercial banks
during the 1990s and 2000s. This effect is most evident among relative latecomers such as UBS
which ranked 16th by market share over the 1970-2007 period but accounted for only about 7% of
proceeds raised during this period by issuers for which it managed deals.
Figure 1 provides a different perspective on this change by reporting average relationship
strengths on an annual basis for Goldman Sachs, Merrill Lynch, and Morgan Stanley as well as
for the 30 banks that appear in the choice set facing issuers in a given year in our econometric
analysis. Goldman and Morgan Stanley managed deals accounting for nearly 90% of proceeds
raised by their clients through the 1960s (and later in the case of Goldman). By contrast, dur-
25We use the terms “lead underwriter,” “lead manager,” and “bookrunner” interchangeably and distinguish themfrom co-manager with equal apportionment of proceeds. The presence of co-managers and multiple bookrunnersis largely a post-1990 phenomenon. Ljungqvist, Marston, and Wilhelm (2009) provide evidence of co-managementserving as a stepping-stone to lead-management opportunities.
18

INVESTMENT-BANKING RELATIONSHIPS: 1933-2007
ing the early part of the sample period Merrill accounted for less than 80% of proceeds raised by
firms for which it managed a deal in the preceding 10 years. This is likely a reflection of the fact
that Merrill remained primarily a retail-oriented firm with a modest underwriting presence. But
over time the firm’s retail brokerage network attracted syndicate invitations and, ultimately, lead-
management opportunities. By 1970 the three firms maintained similarly exclusive relationships
with their clients and followed a similar path of declining exclusivity through the remainder of the
sample period. By 2009, the average relationship strength among clients for all three banks, as
well as the average among the top 30 banks by market share from 2000-2009, was slightly above
50%.
4.2. Measuring Bank Relationships within Industry Groups
In addition to treating issuers as conditioning their bank choice on the state of their relationship
with each bank in the choice set, we allow for the issuer conditioning on whether banks have
relationships with their competitors. Asker and Ljungqvist (2010) find that issuers avoid banks
that work with their competitors out of concern for leakage of strategic information. Alternatively,
it is conceivable that some banks maintain industry-specific expertise that is attractive to issuers
within that industry.
We use the following strategy to design measures of each bank’s breadth and depth of activity
within an industry group. For each year and bank in the issuer’s choice set during the year of a
given transaction, we measure the state of the bank’s relationships with all recent issuers in 4-digit
SIC categories. We use a 10-year, rolling window to identify all transactions for each bank in the
issuer’s choice set in a given year. These transactions are then sorted by the issuer’s 4-digit SIC
code. Within each SIC code category, we identify banks that managed one or more transactions
with more than one firm during the 10-year window. For these banks, we measure the relationship
strength variable described above for each firm in the SIC category with which the bank worked
during the window and the number of firms with which the bank worked. The relationship strength
measures are averaged to create an annual measure of the state of a bank’s relationships within the
SIC category. For banks that managed deals for one or fewer firms within the SIC category during
19

INVESTMENT-BANKING RELATIONSHIPS: 1933-2007
the 10-year window, both the firm count variable and the average relationship strength variable
within the SIC category take a zero value.
Using a 5-year, rolling window, Asker and Ljungqvist (2010) show that the fraction of banks
with multiple equity (debt) issuance relationships with the three largest firms within an SIC cate-
gory rarely exceeds 5% (10%) over the 1975-2003 period. Extended to the 10 largest firms in an
SIC category, the fraction of banks with multiple equity relationships rises above 10% only after
2001. Similarly, the fraction of banks with multiple debt relationships does not exceed 20% before
2001.
Our approach casts a wider net by considering all issuers within an SIC category. Figure
2 reveals that after 1980 the fraction of banks with multiple equity relationships exceeded 15%
(peaking at 37% in 2001) and often exceeded the fraction of banks with multiple debt relationships.
More striking from our perspective is the sharp decline through the 1960s in the relative frequency
of banks with multiple relationships within an SIC category. Prior to 1960, the fraction of banks
with multiple relationships across issue types hovered between 18 and 20%.26 The pre-1960 peak
was not surpassed until 1985.
4.3. Measuring Relationships Among Banks
A substantial body of research suggests that issuers condition their bank choice on the quality of the
bank’s pricing and distribution services, the quality of analyst coverage that it can deliver, and its
market-making capacity. Throughout the sample period, the underwriting (and selling) syndicate
played a central role in the delivery of these services. Given the importance of the syndicate, we
treat issuers as conditioning on the degree and quality of a bank’s connections to other banks. We
quantify the state of a bank’s relationships with other banks using techniques from graph theory.27
26The low relative frequency of multiple equity relationships during this period is, in part, a reflection of the lowfrequency of equity issuance within many SIC categories that more frequently yielded a single bank appearing in theSIC category dealing with a single issuer. For the 1944-1969 period, breaking the sample into year/SIC code pairs forwhich the number of banks with at least one relationship within the SIC category is less than 5 or greater than or equalto 5, yields 8% (28%) of banks in the former (latter) category with multiple relationships. For the 1970-2007 period,year/SIC code pairs with fewer than (greater than or equal to) 5 banks with one or more relationships average about9% (41%) with multiple relationships.
27All of our network calculations were performed using the Stanford Network Analysis Platform (SNAP, availablefrom http://snap.stanford.edu/), a C++ library for performing network and graph-theoretic calculations.
20

INVESTMENT-BANKING RELATIONSHIPS: 1933-2007
We regard two banks as being connected in a particular time window if one bank invites another
to be a co-manager in a syndicate for which it is the lead manager. This defines a network of
relationships for a 5-year, rolling time window. We then calculate annually for each bank in the
choice set a standard measure of network connectedness called eigenvector centrality (EVC).28
Eigenvector centrality accounts both for the number of relationships that a bank has, and for the
quality of those relationships. Hence, a bank that is networked to bulge-bracket investment banks is
regarded as more connected than a bank whose network comprises smaller, less-significant players.
The formal definition of this measure appears in the Appendix.
Figures 3 plots EVC (normalized to lie between 0 and 100) against the total underwriting pro-
ceeds managed by every bank in our database for the 1950-1955 and 2000-2005 time periods. In
both cases, we label some of the points that correspond to particularly significant banks. The most
striking feature of Figure 3 is that very profitable and reputable banks in the middle of the twen-
tieth century were not necessarily closely connected to their peers. Morgan Stanley generated the
highest underwriting proceeds over this period yet it maintained few connections with other well-
placed firms. Indeed, the firm was noted for its unwillingness to share business.29 Halsey, Stuart
& Co. also had a low EVC and high underwriting proceeds over this period. However, it was very
different to Morgan Stanley in the sense that it was an aggressive bidder for competitive tenders, by
which it hoped to destroy existing bank-client relationships (Chernow, 1990, pp. 506, 623) and, as
shown in Table III, it maintained relatively weak relationships with its clients. In contrast, Morgan
Stanley was a strong defender of traditional, negotiation-based modes of doing business during
this period and its client relationships were among the strongest.30 Morgan Stanley’s low connect-
edness appears to reflect a strong reputation and an excellent client network, while Halsey, Stuart’s
low connectedness was evidence of the opposite qualities. By the end of the sample period, there is
a much stronger positive relation between EVC and underwriting market share. Moreover, the ma-
28EVC is calculated for the 30 banks in the choice set using all transactions and banks during the rolling timewindow. In other words, EVC does not measure connectedness strictly among the 30 banks in the choice set. Insteadit measures connectedess with all banks that participated in a transaction carried out within the time window.
29As late as the 1970s, Morgan Stanley was seen as lacking distribution capacity and thus, in this respect, dependenton other, usually less prestigious, syndicate members. The firm diluted the power of individual members by workingwith “up to two hundred firms” in its syndicates (Chernow, 1990, p.624).
30See for example “Open clash seen in underwriting,” Howard W. Calkins, New York Times, 7 September 1941.
21

INVESTMENT-BANKING RELATIONSHIPS: 1933-2007
jor commercial banks, in spite of having entered securities relatively recently, were well-connected
with their peers.
4.4. Summary Statistics for Bank Relationship Variables
For estimation purposes, both the client relationship strength variables and EVC have been nor-
malized to a 0-100 scale. Table IV reports summary statistics for these variables by time period
and conditional on whether or not the bank was selected from the issuer’s choice set. For example,
during the 1943-1949 period the client’s mean relationship strength with the bank it chose to man-
age its transaction was 32.79. In other words, on average, banks selected to manage transactions
during this time period had management responsibility for about 33% of the issuer’s proceeds from
transactions executed during the ten years preceding the transaction at hand. By contrast, banks
within the choice set that were not selected to manage a transaction accounted for about 1% of the
issuer’s proceeds during the preceding ten years. The difference in means is statistically significant
at the 1% level. The difference in means increased during the 1950-1959 period and then decreased
every period thereafter. In every period the difference in means is statistically significant.
Table IV also reveals that banks selected to manage deals generally maintained (statistically)
stronger relationships with other firms in the issuer’s 4-digit SIC category. This is consistent with
issuers valuing industry-specific expertise. However, the absolute difference in this measure be-
tween banks that were chosen and those that were not is smaller during the latter part of the sample
period. This pattern is broadly consistent with the argument advanced by Asker and Ljungqvist
(2010). Moreover, it suggests that the increasing frequency of banks with multiple relationships
within an SIC category documented in Figure 2 rests on a preponderance of relatively weak (non-
exclusive) relationships.
On average, banks selected by issuers were better connected with their peers across the entire
sample period. In absolute terms, differences in EVC across banks selected by the issuer and those
that were not are considerably smaller than for the relationship variables but they remain statisti-
cally significant. In further contrast, the mean levels for EVC for both bank types are relatively
stable through time.
22

INVESTMENT-BANKING RELATIONSHIPS: 1933-2007
We also report the mean rank (by market share for the decade at hand) within the issuer’s
choice set for the two bank types. On average, issuers selected higher-ranking banks (with lower
mean rank values) and this pattern strengthened through time. Finally, the lower panel of Table
IV provides summary statistics for two transaction-specific attributes: the dollar value of the trans-
action and the number of transactions carried out by the issuer since 1933. The latter is intended
as a measure of the issuer’s activity level in the capital markets. These variables, along with an
indicator variable identifying equity issues, will appear in two specifications of the econometric
model described in the next section.
5. Estimation of the Bank Choice Model
We use the McFadden (1973) conditional logit framework to model the issuer’s bank choice. The
issuer’s choice set contains J = 30 (unordered) alternative banks representing the top 30 banks
ranked by proceeds raised in offerings completed during the decade in which the issuer’s transac-
tion takes place.
The issuer’s bank choice follows an additive random utility model which specifies utility for
transaction i, as:
ui = Xiβ +(ziA)′+ξi
where β is a p x 1 vector of alternative (bank)-specific regression coefficients, A is a q x J matrix of
case (transaction)-specific coefficients, and the elements of the Jx1 error vector ξi are independent
Type I extreme-value random variables. Each transaction i yields a set of observations X∗i j = (Xi,
zi) where Xi is a matrix of bank-specific attribute vectors for each of the J banks in the choice set
and zi is a 1 x q vector of transaction-specific (bank invariant) attributes. Defining β ∗ = (β , A) and
yi j = 1 if the ith issuer selects bank j with attribute vector X∗i j (and 0 otherwise), the model’s choice
probabilities satisfy31
31Note that the conditional logit model admits the possibility of more than one alternative being selected for agiven transaction. This occurs in instances where the issuer selects multiple banks to co-manage its transaction. Thepresence of multiple bookrunners was meaningful only during the last two estimation periods and even during the1990s this appeared in only 3% of sample transactions. During the final estimation period (2000-2007) 32% of sampletransactions had multiple bookrunners.
23

INVESTMENT-BANKING RELATIONSHIPS: 1933-2007
Pr(yi = 1 |Xi,zi ) =exp
(X∗i jβ
∗)
exp(
∑Jj=1(X
∗i jβ∗) .
Our primary interest lies with the influence of the bank-specific attributes, Xi, on the issuer’s
bank choice. These attributes include (i) the state of a bank’s relationship with the issuer (RelStr),
(ii) the state of the bank’s relationships with other firms in the issuer’s SIC category (RelStrSIC),
and (iii) the state of the bank’s relationship with other banks (EVC). Each attribute varies across
banks. RelStr and RelStrSIC generally will vary across transactions but EVC does not. RelStr will
not vary across transactions for issuers with exclusive banking relationships that carry out more
than one transaction during the estimation period. In some specifications of the model, we include
additional control variables that reflect transaction-specific attributes. Each transaction-specific
variable gives rise to 29 bank-specific parameter estimates with the 30th bank’s parameter estimate
normalized to zero.
We estimate three model specifications. We begin with a simple conditional logit specification
(CLogit) that includes only bank-specific attributes. We also estimate conditional logit (ASCLogit)
and nested logit (NLogit) specifications that includes both bank-specific and transaction-specific
attributes. In the NLogit specification banks in the choice set are assigned to one of three groups.32
The results reported in the next section reflect specifications with three transaction-specific at-
tributes: an indicator for whether the transaction is an equity issue; the log of the dollar value of
the transaction; and the number of previous transactions brought to market by the issuer measured
from the beginning of the sample period (1933). The results are not sensitive to the inclusion of
additional transaction-specific attributes that were available for the entire sample period.
Assuming independent and identically distributed errors in the conditional logit framework
yields the independence of irrelevant alternatives (IIA) property that the odds ratio for a given pair
of alternatives is independent of the characteristics of other alternatives. In practice, the assumption
32The specification names correspond with the Stata functions (clogit, asclogit, nlogit) used in their estimation. Incontrast to the expression for the conditional logit choice probabilities given above, the nested logit choice probabilitiesare equal to the product of the probability of selecting a group and the probability of selecting a bank conditional onhaving selected the bank’s group. The nested logit specification reduces to the conditional logit model under theassumption of independent and identically distributed errors. See Cameron and Trivedi (2008, ch.15) for furtherretails.
24

INVESTMENT-BANKING RELATIONSHIPS: 1933-2007
may be violated when members of the choice set are close substitutes for one another as quite
plausibly could be the case among at least some of the banks in our choice sets. In fact, tests for
violations of the IIA assumption [see Hausman and McFadden (1984)] reveal this to be the case.
The nested logit specification addresses this problem by permitting error correlation within groups
while treating errors across groups as independent.
There is no obviously “correct” nesting structure in our setting. Banks can differ from one
another along a number of dimensions including their institutional and retail investor networks,
capitalization, and industry- and product-specific expertise. Ideally, a bank group would comprise
close substitutes with one another that are distinct from banks in other groups. The nested logit
results reported in the next section are based on groups defined by the top 5 banks ranked by
proceeds, the next 15 banks and the final 10. These groupings roughly correspond with the industry
characterization proposed by Hayes (1979) around the midpoint of our sample period: a “special
bracket” comprising 5-6 banks, a “major bracket” comprising 14-16 banks, with the remainder
making up a “submajor” bracket. Returning to Table I, we see for the 1970-2007 period that this
nesting structure places about 50% of market share by proceeds with the top 5 banks, about 37%
in the second group of 15 banks, and about 4% in the last group of 10 banks. Recognizing that
there remains a degree of arbitrariness in our grouping strategy, we have experimented with other
groupings. Although we do not report results for alternative groupings, our conclusions are not
sensitive to the alternatives with which we have experimented.
6. Estimation Results
Table V presents results for three specifications of the bank choice model for each of the 7 estima-
tion periods. It is evident that the alternative specifications yield qualitatively similar results. As
we noted in the preceding section, tests for independent and identically distributed errors reject the
independence of irrelevant alternatives assumption. Thus we focus our discussion of the results
on the NLogit specification. We report estimated coefficients (with standard errors in parentheses)
for each bank-specific attribute. The signs of the coefficients for these attributes can be directly
interpreted to indicate the effect of a change in the attribute on the probability of a bank being
25

INVESTMENT-BANKING RELATIONSHIPS: 1933-2007
selected by the issuer. For the sake of brevity, we do not report coefficients for transaction-specific
attributes but rather discuss their implications in the text below.33
Because the three model specifications are nested, the reported log-likelihood values, which
can reach a maximum of zero, generally would be directly comparable across estimation periods.
Focusing on the first three periods, we see that the ASCLogit specification provides the best fit.
This is not surprising given the greater flexibility afforded by the specification. Both likelihood
ratio and Akaike information criterion tests generally favor the more complex specification at a
0.05 significance level. During the last four estimation periods there are transactions for which
the issuer selects more than one bank. Stata’s NLogit routine excludes these transactions from the
estimation sample. The number of excluded transactions ranges from 5 during the 1970s to 1,797
(32% of the total) during the 2000s. As a consequence of these exclusions the goodness of fit
is not directly comparable across model specifications during these estimation periods. However,
it is clear from the χ2 test statistics that each specification in every estimation period provides a
very good fit to the data. Consistent with these test statistics, the (unreported) average predicted
probabilities for individual banks generally correspond closely with their sample probabilities.
The influence of a bank’s relationship with an issuer (RelStr) on its choice probability is positive
and statistically significant during each of the 7 estimation periods. The influence of relationship
strength on issuer decisions reached its height during the 1960s and then declined thereafter. The
estimated coefficients for RelStrSIC indicate that the state of a bank’s relationships with other firms
within the issuer’s 4-digit SIC category had a more modest (but statistically significant) positive
influence on the issuer’s bank choice through the entire sample period. But the coefficient declined
in value by over 50% from the 1970s to the 1980s. By contrast, the influence of a bank’s syndicate
relationships (EVC) on its choice probability was negative and statistically significant through the
1950s. Issuer’s began to respond positively to this attribute during the 1960s. Issuer sensitivity to
this attribute increased sharply during the 1970s and then again during the 2000-2007 period.
Turning to the transaction-specific coefficients estimated for the top 5 and middle 15 bank nests,
33The ASCLogit specification yields 29 coefficients, associated with individual banks in the choice set, for eachtransaction-specific attribute. These coefficients are interpreted relative to the 30th (base) bank in the choice set.The NLogit specification yields transaction-specific coefficients for each of the first two bank groups which are theninterpreted relative to the third (base) group.
26

INVESTMENT-BANKING RELATIONSHIPS: 1933-2007
we find that equity issuers generally are less likely to select a bank from these two groups relative
to the bottom 10 banks after controlling for bank-specific and other transaction-specific attributes.
Unconditionally, the bottom 10 banks are less likely to be selected to lead any type of deal but their
share of equity deals generally is larger than for either debt or preferred deals. In contrast, relative
to the bottom 10 banks, the top 5 and middle 15 banks are more likely to be selected for larger
deals and for deals brought to market by more active issuers.
Figure 4 provides a graphical summary of the 95% confidence intervals for the estimated co-
efficients from both the ASCLogit and NLogit specifications. For the ASCLogit specification we
conduct χ2 tests of differences in individual coefficients across decades and we indicate in the
figure instances in which the null of equality of coefficients across decades is rejected.34 Figure
4 indicates that the declining influence of relationship strength on issuer decisions documented in
Table V is statistically significant. The coefficient for RelStr estimated for the 1970s is statistically
different from the 1960s coefficient at the 1% level in the ASCLogit specification. Similarly, there
is little overlap in the confidence intervals for the NLogit RelStr coefficients from the 1960s and
1970s. It is less clear that the change from the 1970s to the 1980s is statistically significant but the
difference between the 1970s and 1990s clearly is significant. The confidence intervals for EVC
indicate a strong increase in the influence of bank syndicate relationships over the course of the
sample period. Finally, the results for RelStrSIC suggest a significant long-run decline in the influ-
ence of the state of a bank’s relationships with a client’s potential competitors with the exception
of a temporary increase during the 1970s.
A rough measure of the economic significance of the estimated coefficients is gained by expo-
nentiating the coefficients to obtain an estimated odds ratio. For bank-specific attributes, the odds
ratio reflects the change in the issuer’s odds of selecting a given bank in the choice set for a 1 unit
34We use Stata’s suest (“seemingly unrelated estimation”) routine to carry out the test. Stata’s NLogit rou-tine does not provide a similar test and we have been unable to devise one that would suit our purpose. Theproblem can be understood by recognizing that the suest routine combines parameter estimates and associated co-variance matrices into one parameter vector and simultaneous covariance matrix of the sandwich/robust type (seehttp://www.stata.com/manuals13/rsuest.pdf). But it does not admit the estimated nest-selection probabilities obtainedfor the NLogit specification. It is possible to simultaneously estimate separate coefficients for each decade in a singlenested logit and test for differences but this requires imposing an equality constraint on the nest probabilities acrossdecades. This constraint yields different parameter estimates from those reported in Table V and a poorer model fit asindicated by the log likelihood for the regression.
27

INVESTMENT-BANKING RELATIONSHIPS: 1933-2007
change in the bank attribute. If, for example, we consider RelStr during the 1943-49 estimation
period, the estimated coefficient of 0.0296 implies an odds ratio of 1.0273. Keeping in mind that
RelStr is the normalized dollar share of the client’s proceeds raised during the preceding decade,
this implies that the issuer’s odds of selecting a given bank in the choice set increase by about 2.7%
for a 1 percentage point increase in RelStr. This is nearly three times the effect of a 1 percentage
point increase in RelStrSIC. The estimated coefficient of -0.0118 for EVC during the first estima-
tion period yields an odds ratio of 0.988. In other words, a one unit change in EVC decreases the
odds of selecting a given bank by about 1%. Unfortunately the scale of EVC does not have any
direct economic content. However, the absolute magnitude of the increase in the coefficient for
EVC over the entire sample period suggests a nontrivial change in issuer behavior.
The summary statistics in Table IV provide further information useful in understanding the eco-
nomic scale of the effects of bank attributes on issuer decisions. Among banks that were selected to
manage transactions, RelStr had a mean value of 32.79% with standard deviation of 40.71% for the
1943-1949 estimation period. This suggests that among selected bank, the odds of being selected
by the issuer would increase by about 110% (2.7 * 40.71), or roughly double, for a 1 standard
deviation increase in the strength of the bank’s relationship with the issuer (predicted probabilities
range from about 2-8% during this estimation period). As we turn our attention to changes across
periods, it is useful to note that both the underlying coefficients (and odds ratios) for RelStr and
the standard deviation of the client relationship strength among selected banks declined after 1970.
Judged from the same perspective, the economic significance of RelStrSIC and EVC appears more
modest although unit changes in EVC do not have a direct economic interpretation.
Banks that were not selected by an issuer generally had no relationship with the issuer during
the decade preceding the transaction. For issuers that raise new capital relatively infrequently,
selecting a bank with which it previously had no relationship results in a relatively large value for
RelStr going forward and a potentially large decline in RelStr for the bank(s) that it selected in
the past. For example, a firm that did two deals of the same size with two different banks would
maintain a value for RelStr of 50% with each bank. If the firm selected a new bank to lead a
subsequent deal of the same size, the new bank’s RelStr value would rise by 33 percentage points.
28

INVESTMENT-BANKING RELATIONSHIPS: 1933-2007
Simultaneously, the two banks with which the firm dealt in the past would each suffer nearly a 17
percentage point decline in RelStr.
We shed further light on the economic significance of the state of the bank/client relationship
by examining choice probability elasticities with respect to RelStr. For each transaction i during
an estimation period, the elasticity with respect to RelStr for bank j is
Elasi =∂ p̂i j
∂RelStri j∗
RelStr j
p̂i j,
where p̂i j is the predicted probability of the issuer selecting bank j for transaction i and RelStri j
is bank j’s relationship strength with the issuer.35 Figure 5 plots elasticities against against their
corresponding value of RelStr for each estimation period. In each panel we pool elasticities from all
transactions (and banks) during the estimation period. For example, the sample for the 1943-1949
estimation period included 842 transactions. For each transaction we obtain an elasticity for each
of the 30 banks in the choice set. Each of the 30 elasticities for each transaction are then plotted
against the bank’s measure of RelStr for the issuing firm. For a given transaction, most banks in
the choice set have no prior relationship with the issuing firm. By definition, the elasticity of their
choice probability with respect to RelStr is zero thus anchoring the scatterplots at the origin.
Several patterns emerge across the seven estimation periods. First, the scatterplot of elasticities
is concave in every period. From 1943-1969, for both low and high levels of RelStr the concen-
tration of data points indicates that choice probabilities are inelastic (< 1.0) with respect to RelStr
and elastic (> 1.0) for intermediate levels of RelStr; issuers were relatively insensitive to a small
change in RelStr for banks with which they had very weak or very strong relationships. This is
consistent with the high level of relationship exclusivity observed in the data. A well-established
relationship was not easily contested. From 1970-1999, there is a much greater frequency of choice
probability elasticities greater than 1.0 among bank/client pairs with intermediate to high levels of
RelStr. As issuer’s conditioned less heavily on RelStr, existing relationships were more open to
35See Cameron and Trivedi (2008, p.492). The partial derivative can either be calculated numerically or by makinguse of the fact that
∂ p̂i j
∂RelStr j= p̂i j ∗ [1− p̂i j]∗ β̂RelStr.
29

INVESTMENT-BANKING RELATIONSHIPS: 1933-2007
challenge from competitors.
With the exception of the 1960-1969 estimation period, there is an apparent separation among
elasticities for a given value of RelStr that corresponds roughly with the nesting structure in the
nested logit. Especially from 1970 forward, elasticities for a given level of RelStr are lowest among
the top 5 banks and greatest among the bottom 10 banks. After 1980 the elasticities for the top 5
banks generally cluster around 1.0 or slightly above for values of RelStr greater than 50. Over the
same range, the next 15 banks maintain a modest degree of concavity with elasticities less than 1.0
appearing only during the 2000-2007 period. By the 2000-2007 period there is little observable
difference between the top 5 and next 15 banks. The bottom 10 banks exhibit a positive slope over
this range but for a wide distribution with a minimum near 1.0 in cases where RelStr = 100.
Figure 6 shows choice probability elasticities with respect to EVC. The general message corre-
sponds with the observation above that the economic significance of EVC is modest relative to that
of RelStr. Only during the final estimation period do we observe elasticities greater than 1 (in ab-
solute value). With the exception of a small number of observations associated with relatively high
values for EVC during the 1970-1979 estimation period, choice probabilities are highly inelastic
with respect to EVC. Although the influence of EVC on issuer decisions is statistically significant,
the effect is weak. By contrast, during the final estimation period for values of EVC exceeding 5
on the 100 point scale, there are many instances in which choice probabilities are highly elastic.
In summary, a comparison of figure 5 with figure 6 reveals that issuers were far more sensitive
to the state of their relationship with a bank than to the bank’s connectedness with other banks.36
The only exception to this statement appears during the final estimation period where it is clear that
issuers were far more sensitive to bank connectedness in their decision process. In the following
subsections we give further consideration to the changing influence of RelStr and EVC on issuer
decisions against the historical backdrop presented in section 2. Figure 7 provides a timeline of the
key events.
36Similar to the case for EVC, choice probabilities generally were inelastic with respect to RelStrSIC during eachestimation period.
30

INVESTMENT-BANKING RELATIONSHIPS: 1933-2007
6.1. The Declining Influence of Bank/Client Relationships
The advisory relationship between a bank and its clients involves a considerable degree of judg-
ment and client willingness to share strategic information with its banker. The client is at a disad-
vantage in judging both the ability of the banker and his willingness to place the client’s interests
first. And even to the extent that ability and the quality of service are observable to the client they
would be difficult for a court to verify. As a consequence, the advisory relationship depends heav-
ily on the banker maintaining a reputation for both an ability to deliver high-quality service and
for managing conflicts of interest to the client’s satisfaction [See Chen, Morrison, and Wilhelm
(2013a; 2013b)].
Client relationships and the trust on which they rest stem from interactions between individual
bankers and client representatives. During the early part of our sample period, bankers generally
spent their entire careers with a single, typically quite small, banking partnership. For example,
Goldman Sachs had 5 partners in 1934. On average, members of this cohort spent 37 years as
partners in the firm.37 None of these partners held a similarly influential position with a competitor
over the course of their careers. Goldman was not exceptional with respect to the longevity and
loyalty of its partners during the early part of our sample period.
Nor was it unusual for a banker to be responsible for a specific client relationship for many
years. These long-term personal commitments often involved serving on the client’s board of
directors. Table VI provides a summary of board service from 1935 through 1949 for the 17
defendant banks in U.S. v. Henry S. Morgan et al. The defendants provided lists of individual
bankers, the firms for which they served as directors, and the length of service in that capacity.
Most of the banks simply listed service over the 1935-1949 period and, in most instances, identified
directorships that began prior to 1935 without providing a date. Goldman Sachs and Lehman
Brothers reported the starting dates for directorships that began prior to 1935. Lehman’s report
also covered service through year-end 1951. We describe these reporting details to emphasize that
the figures for the length of service are conservative.
37All data related to the size and composition of banking partnerships were obtained from member firm directoriesmaintained in the archives of the New York Stock Exchange.
31

INVESTMENT-BANKING RELATIONSHIPS: 1933-2007
Collectively, the 17 banks identified 83 bankers who served as a director for 162 client firms
Clearly, Goldman and Lehman, with 34 and 53 directorships, were exceptional but all of the banks
had men who served as directors for client firms. The significance of this role across banks is best
reflected in the average length of service as a director. Of the 17 banks, 10 averaged at least 10
years of service across their directorships. The average length of service across all of the banks was
13 years and 56 (of 162) directorships equaled or, more likely far, exceeded 15 years. These figures
actually obscure the influence exercised by a number of the most prominent bankers. Because they
generally identified the starting point for directorships that began before 1930, the records provided
by Goldman and Lehman are the most revealing. Focusing once again on Goldman Sachs, Sidney
Weinberg served as a director for 14 client firms for an average of 16 years with 6 directorships
having exceeded 20 years by the end of the reporting period. H.S. Bowers and Walter Sachs
each averaged over 20 years in their directorships and each served two clients for over 30 years.
Lehman’s experience was comparable to Goldman’s.
Coupling longstanding client relationships with long-term partnership commitments provided
bankers with the opportunity to build client trust and an incentive to protect their individual and
institutional reputations for having done so. The results summarized in Figure 4 indicate that the
efforts to weaken bank/client relationships during the early part of our sample period may have
modestly diminished their influence on issuer’s decisions during the 1950s. But the preceding
discussion sheds light on why the state of the banking relationship remained the most important
determinant of the issuer’s bank choice and increasingly so through the 1960s.38
So why did the influence of bank/client relationships decline in our bank choice model begin-
ning in the 1970s? Morrison and Wilhelm (2004) identify limited organizational scale and relative
immobility among human capitalists as being conducive to building human capital and preserving
institutional reputation. These conditions were met by banking partnerships throughout the early
part of our sample period. But as we noted earlier, beginning around 1960 the investment-banking
industry entered a period of unprecedented technological and organizational upheaval that culmi-
38The apparent “domination and control" of issuers via directorships was an important element of the JusticeDepartment’s case. However, upon reviewing the records, Judge Medina dismissed this argument. It is worth notingthat there were a number of transactions for which a bank with a representative on the issuer’s board was not selectedto manage the transaction.
32

INVESTMENT-BANKING RELATIONSHIPS: 1933-2007
nated in 1970 with the New York Stock Exchange’s (NYSE) membership (including virtually all
of the major banks) agreeing to permit members to operate as public corporations. With the ex-
ception of Goldman and Lazard, all of the major investment banks went public, either by IPO or
acquisition, over the next two decades. With the change in organizational structure the investment
banks entered a period of rapid growth in the scale of their operations and capitalization.
In Figure 8 we document this change by plotting the time path of the number of partners for
8 banks for which we have tracked partner identity annually through 1989. The sample includes
both banks with strong retail networks (Dean Witter, E.F. Hutton, Merrill Lynch, Smith Barney)
and those that were more focused in wholesale institutional operations (Goldman Sachs, Lehman
Brothers, Morgan Stanley, Salomon Brothers).39 The growth paths of these banking partnerships
tracked one another quite closely through the mid-1950s and with the exception of Merrill Lynch
they were quite similar in size. Merrill’s much larger number of partners reflects a 1941 merger
with Fenner & Beane that nearly doubled the size of the firm’s retail brokerage network [Perkins
(1999, p.167)].
The growth paths of Merrill, Dean Witter, and E.F. Hutton steepened and began to diverge from
the others in the late 1950s and they also were among the first banks to go public [Merrill in 1971
and Dean Witter and E.F. Hutton in 1972]. The remaining banks in this group, with the exception
of Goldman Sachs, went public or were acquired by a publicly-held firm during the 1980s [Morri-
son and Wilhelm (2008, Table I)]. Alongside the early public offerings, industry observers began to
comment for the first time on banker mobility and client account switching.40 Morrison and Wil-
helm (2008) argue that these changes began to undermine reputation concerns among investment
banks at precisely the time that we observe the influence of bank/client relationships beginning to
weaken.
Although we cannot connect individual bankers with specific client relationships or director-
ships during this period, we can use the partner data for the 8-bank subsample to observe how the
39For most of these and other NYSE member firms for which we have gathered data, there is a close mappingof pre-IPO partners into the identities of post-IPO senior officers, at least through the 1980s. In Figure 8, we reportthe annual number of partners for each bank through 1989 or until there was a meaningful change in their reportingconvention.
40See Thackray (1971) and Thackray (1972).
33

INVESTMENT-BANKING RELATIONSHIPS: 1933-2007
potential for long-term personal interaction changed alongside the influence of bank/client rela-
tionships.41 Figures 9 and 10 summarize two measures of change in the level of partner experience
through time. Figure 9 shows a 3-year moving average of the percentage change in partner tenure
averaged across the subsample of 8 banks. Partner tenure is the number of years a banker has
served as a partner entering a given year. This measure is then averaged across partners within
the bank. We report a 3-year moving average of the percentage change to smooth the effect of
discreteness in the length of partnership agreements that generally determined when old partners
left and new ones were appointed (e.g., Goldman Sachs renewed its partnership agreement on a
2-year cycle). With the exception of the early 1940s when many bank partners were leaving to join
the war effort, average partner tenure increased through 1958. By the late 1950s, we begin to see
signs of bankers having shorter tenures with a single firm. In 1956 when Goldman added 3 new
partners to the existing 13-man partnership, the average partner in this group ultimately served 26
years as a partner over the course of his career – down 11 years from the 1934 cohort described
above.
The measure of experience reported in Figure 9 can be misleading because average tenure
can decline even when a core of senior partners remains stable simply as a consequence of the
arrival of new partners. Hayes (1971, p.147) notes that following the great depression investment
banks did relatively little hiring before the early 1960s. But subsequently, banks collectively faced
the burden of replacing a generation of retiring bankers.42 But Figure 8 also illustrates substantial
growth in the size of banking partnerships, especially among those with significant retail brokerage
operations.
Figure 10 isolates the loss of experience by measuring the total number of years lost by depar-
ture of a partner (or senior officer post-IPO) as a percentage of the total number of years served
by remaining partners. With the exception of the early war years, these 8 banks averaged a loss of
41But for a point of comparison to the pre-1950 board participation among investment bankers, see Guner, Mal-mendier, and Tate (2008). For their sample period of 1988-2001, they examine 282 firms for 2,910 firm-years. In thissample a director from an investment bank appears in 16% of the firm-years. The sample contains 5,378 director-yearsof which 1.7% are accounted for by investment bankers. Across all directors in the sample, the average tenure is 9years.
42As we discuss below, this generational turnover yielded a new breed of banker. Morrison and Wilhelm (2008,p.341) note that only 8% of Harvard’s MBA class of 1965 accepted jobs in investment banking while 21% did so in1969 and 29% in 1989.
34

INVESTMENT-BANKING RELATIONSHIPS: 1933-2007
partner experience of between 2% and 4% per year until the late 1950s. Thereafter, the (moving)
average loss began to rise rapidly and it peaked in 1972 at 14% of the experience base of the re-
maining partners. Returning to the experience of Goldman Sachs, in 1984, 17 partners with 226
years of partnership tenure (a 13 year average per partner) retired from the firm. A 25-member co-
hort of new partners joined 64 remaining partners leaving the firm with an average partner tenure
of 7 years.
In Table VII we report results from re-estimating the NLogit specification of the bank choice
model including these two measures of annual change in partner experience. Tenure is the indi-
vidual bank measure of the percentage change in the 3-year moving average partner tenure used to
obtain Figure 9. Experience is the 3-year moving average of the annual percentage loss of partner
years.43
The coefficients for RelStr and RelStrSIC are similar in magnitude to the NLogit results re-
ported in Table V with the exception that the coefficients for RelStr for the 1950-1959 estimation
period are substantially larger. The coefficients for EVC also are similar to the results reported in
Table V with the exception of the 1980-1989 estimation period where issuer sensitivity to syndicate
connections is much stronger among the subsample banks.
Keeping in mind that we cannot link individual partners to specific client relationships, Tenure
and Experience are intended to proxy for damage to a relationship caused by the departure of a
key banker. From this perspective we expect Tenure to be directly related and Experience inversely
related to a bank’s selection probability. The coefficients estimated for Tenure are statistically
different from zero in each estimation period but have the predicted positive sign only in the 1960-
1969 and 1970-1979 estimation periods. Experience carries the predicted negative sign during the
1940s, 1960s, and 1970s and the effect is statistically significant during 1970-1979 period. Thus
our predictions for the effects of Tenure and Experience best correspond with perhaps the period
43E.F Hutton does not appear in the top 30 banks by market share during the first three estimation periods and sodoes not enter the analysis until the 1970-1979 estimation period. Similarly, Dean Witter does not enter the analysisfor 1943-1949. Although we argued above that declining tenure/experience among bankers would undermine clientrelationships, as we measure the state of a relationship, we do not expect there to a be a causal relation between Tenureor Experience and RelStr. RelStr is intended to proxy for the state of a client relationship at the time of the transactionin question but it does not reflect changes since the client’s last transaction. Since relatively few transactions take placein close proximity to the issuer’s preceding transaction, much could change in the state of the relationship. Generally,there is little overlap in the measurement of Tenure or Experience with the issuer’s last transaction.
35

INVESTMENT-BANKING RELATIONSHIPS: 1933-2007
of greatest upheaval in the industry but appear contradicted by results for the 1950s and 1980s.44
There are two considerations that lead us to speculate further about these seemingly contra-
dictory results. First, it is plausible that negative consequences associated with the retirement of
a senior partner were obviated by a partnership culture in which senior bankers made every effort
to transfer their relationships to the next generation of bankers. As we noted earlier, Morrison and
Wilhelm (2004) identify limited organizational scale and relative immobility among partners as
being conducive to such efforts and it is clear from Figure 8 and our earlier discussion that these
conditions were met during the first two estimation periods. From this perspective, the statistically
insignificant coefficient obtained for the 1943-1949 estimation period is perhaps less surprising.
Moreover, the departure of senior bankers might make way for more talented replacements.
During the first two decades of our sample, family and social connections remained an important,
perhaps the primary, qualification for admission to a banking partnership.45 In the face of techno-
logical change that devalued such human capital, modest turnover might have yielded a net benefit
to clients. The positive effect of Experience corresponds with the relatively modest turnover during
the 1950s illustrated in Figure 9 and the first indications of market forces and technological change
that would sweep the industry during the 1960s. In addition to the back office upheaval discussed
earlier, investment bankers advised on the acquisition of 22% of the Fortune 500 manufacturing
firms between 1962 and 1969 [Seligman (1982, p.418)]. But the 1954 proxy contest for control
of the New York Central Railroad “prefigur[ed] the takeover wars of a generation later” [Chernow
(1990, p.508)] and perhaps made apparent that client advisory service demands would soon grow
more complex. By the 1980s, when the coefficient for Experience is again statistically positive
many bank clients were benefiting from the rapid pace of financial innovation. Moreover, the new
guard of bankers for whom “old-school tie” loyalties [Hayes (1971, p.148)] were much weaker,
44In contrast to RelStr, choice probabilities are generally inelastic with respect to both Tenure and Experience.Thus, while the effects associated with these variables are statistically significant, their economic effects are relativelymodest.
45Chernow (1990, p.513) characterizes Perry Hall, Morgan Stanley’s managing partner from 1951 to 1961, as“perfectly suited to the relationship banking of the 1950s. He would entertain clients while shooting wild turkeysin South Carolina or fishing near his house in Woods Hole, Massachusetts... Hall would perform elite missions forclients and behaved like a member of their family... investment banking didn’t require an enormous amount of financialingenuity.” Compare this to the characterization of Lazard’s Andre Meyer as “the one true genius in the investment-banking profession” [Reich (1983, p.15)]. Meyer was instrumental in creating the fee-for-service M&A advisory roleduring the 1960s.
36

INVESTMENT-BANKING RELATIONSHIPS: 1933-2007
were moving up the ranks. Perhaps the hard skills of this new generation of business-school-trained
banker’s were eclipsing the soft skills of any remaining representatives of the old guard.
Finally, there is no question that the demise of the Glass-Steagall restrictions on commercial
banks also reshaped underwriting relationships. However, given that commercial banks only began
to enter debt underwriting at the end of the 1980-1989 estimation period, their entry appears to have
had relatively little bearing the on the diminished influence of RelStr on issuers’ decisions. In fact,
results from reestimating the full NLogit specification for the 1981-1986 period yielded results that
were not meaningfully different from those reported in Table V for the full estimation period.46
6.2. The Evolution of Syndicate Relationships
Returning to Figure 4, syndicate relationships, as measured by EVC, had a modest negative effect
on issuer decisions through the 1950s. This finding is noteworthy for two reasons. First, it appears
to contradict the motivation for (U.S. v. Henry S. Morgan et al. where the U.S. Justice Department
claimed identified the syndicate as a vehicle for abuse of client relationships. Our results are
consistent with Judge Medina’s dismissal of the case, at least to the extent that collusion would
have occurred through co-management of transactions (as opposed to connections further down
the ranks of the syndicate).
The results for the first two estimation periods also speak to the economic function of un-
derwriting syndicates. Perhaps the most natural explanation for their existence would be that they
enable more efficient distribution of securities and improve risk-sharing during the distribution pro-
cess. But if issuers benefited from improved risk-sharing, the benefits surely were greater during
the early part of the sample period when underwriting was dominated by lightly capitalized bank-
ing partnerships with little geographic reach. For example, in 1950 Morgan Stanley and Kuhn,
Loeb, two of the top 3 banks by market share between 1933 and 1963, had 15 and 10 partners, re-
46It is worth keeping in mind that even as commercial banks gained traction in securities underwriting duringthe post-1990 period, they did so, in part, through acquisition of investment banks. Our relationship variables areconstructed such that the relationships maintained by the acquired bank are carried forward as relationships with theacquirer. Asker and Ljungqvist (2010) find that issuers are no more or less likely to switch banks following a mergerinvolving their relationship bank unless the merger leads to their sharing the bank with a large competitor in theirindustry.
37

INVESTMENT-BANKING RELATIONSHIPS: 1933-2007
spectively, working from a single office and each had less than $6 million in capital in 1953. First
Boston, ranked second by market share over the same period, maintained 8 offices in 1950 and held
$20 million in capital in 1953. Banks with broader geographic reach, such as Merrill Lynch with
its network of 100 retail brokerage offices in 1950 (staffed by 58 partners working with $18 mil-
lion in capital), generally were not among the top underwriters during the early part of our sample
period were. Weak syndicate connections, at least at the co-management level, appear not to have
compromised the distribution of transactions managed by the most prominent banks. However,
this does not rule out the possibility that connectedness at the management level of syndicates is
not highly correlated with a managing bank’s capacity to assemble a strong distribution team. We
simply do not observe syndicate participation below the management level in the pre-1970 data
and therefore cannot measure any differences across banks.
We believe that it is not a coincidence that the influence of syndicate connections became
statistically positive alongside the rise of institutional investing and became especially important
over the last two decades. Among other things, the concentration of ownership associated with
institutional investing provided greater scope for internalizing the benefits from investment in in-
formation production. Benveniste and Spindt (1989) demonstrate that issuers can benefit from a
well-informed investor community to the extent that their banker(s) can exploit investor relation-
ships to improve the pricing of their deals. But maintaining the investor relationships central to
this function requires individual (banker) effort that is intrinsically difficult to monitor. Pichler and
Wilhelm (2001) argue that syndicates address this problem by enabling banks to maintain opti-
mal scale for internal monitoring, and then address transaction-level scale concerns by temporarily
joining forces with one another via underwriting syndicates.
In a similar spirit, Corwin and Schultz (2005) and Morrison and Wilhelm (2008) suggest that
co-management of syndicates aligns lead managers’ incentives with those of the issuer by creating
a threat that co-managers will reveal lead-manager malfeasance.47 One might expect reputation
concerns to temper incentive conflicts between banks and their clients. However, to the extent
47Co-managers have incentive to play this monitoring role if there is a reward for doing so and Ljungqvist, Marston,and Wilhelm (2009) show that co-management opportunities opened the door to more lucrative lead-managementmandates during the last two decades.
38

INVESTMENT-BANKING RELATIONSHIPS: 1933-2007
that reputation concerns are correlated with the state of a bank’s client relationships, they were
weakening as co-management gained prominence. Banks willing to subject themselves to this sort
of monitoring would be characterized by higher values of EVC in our analysis. Thus our finding
that EVC factored more heavily in issuer decisions, especially from 2000 forward, is consistent
with this argument. But we also note that this period witnessed greater interest among issuers
for wider analyst coverage and greater market-making capacity [Corwin and Schultz (2005)] and
for preserving concurrent lending relationships as commercial banks gained entry to securities
underwriting [Drucker and Puri (2005)].
7. Conclusion
In this paper we show that over the last half of the 20th century, issuer’s grew less concerned for
the state of their relationship with a bank in deciding whether to grant it an underwriting mandate.
At the same time, issuer’s placed more emphasis on a bank’s connectedness with other banks as
evidenced by syndicate participations, especially from 2000-2007. We associate these patterns
with structural changes in financial markets around mid-century that undermined bank/client re-
lationships and required banks to develop new capacity in response to the rise of institutional
investors. We also show that issuer’s favored banks with industry-specific expertise as evidenced
by the strength of the bank’s relationships with firms within the issuer’s SIC category. This effect
is much smaller than the other two and it declined substantially post-1980.
Investment-banking advisory services are experience goods and the transactions for which they
are delivered require clients to share a good deal of strategic information with their banker. In this
setting a bank’s reputation for trustworthy behavior can give rise to a strong (relatively exclusive)
client relationship. We argue that our evidence is consistent with structural changes in financial
markets weakening reputation concerns among banks and, as a consequence, issuers’ perception
of the value of an existing bank relationship. The weakening of the influence of bank relationships
on issuer decisions was greatest immediately following the NYSE’s decision to permit public own-
ership of member firms, a decision that was triggered by the confluence of new technology and a
sharp increase in (institutional) trading activity. At the same time, turnover among key bankers
39

INVESTMENT-BANKING RELATIONSHIPS: 1933-2007
increased and we show that this had a negative bearing on issuers’ bank choices independent of
our measure of the state of a bank’s relationship with the issuer.
We argue that the rise of institutional investors also helps to explain the growing influence of
syndicate connections by placing a premium on banks’ (syndicates’) capacity for reaping benefits
for issuers from institutions’ greater incentives for (costly) information production. However, syn-
dicate connections gained their greatest influence over issuers’ bank choices during the last two
decades, well after institutional investors gained a dominant role in the marketplace. We suggest
that this too could be a reflection of diminishing confidence in banks as co-management provides
issuers with a means to better monitor the behavior of their lead bank.
Historically, investment bankers spoke of their reputation for placing clients’ interests first as
their primary asset. The prevalence of longstanding and relatively exclusive client relationships
suggests that clients perceived their bank behaving as if this were so. To the extent that this was
true, policymakers could lean more heavily on market forces to enforce good behavior. Recent
events have caused many market observers to question banks’ concerns for their reputation and
instances of behavior that conflicts with client interests certainly appear to occur with greater fre-
quency. Our study suggests that the seeds for this change in financial markets were planted and
took root decades ago. A deeper understanding of the forces that sustained and undermined repu-
tation concerns among investment banks over the last half century might improve policy responses
to future structural change in financial markets.
40

INVESTMENT-BANKING RELATIONSHIPS: 1933-2007
References
Armour, J., and D. A. Skeel, 2007, “Who Writes the Rules for Hostile Takeovers, and Why? –
The Peculiar Divergence of U.S. and U.K. Takeover Regulation,” Georgetown Law Journal, 95,
1727–1794.
Asker, J., and A. Ljungqvist, 2010, “Competition and the structure of vertical relationships in
capital markets,” Journal of Political Economy, 118, 599–647.
Benveniste, L. M., M. Singh, and W. J. Wilhelm, Jr., 1993, “The Failure of Drexel Burnham
Lambert: Evidence on the Implications for Commercial Banks,” Journal of Financial Interme-
diation, 3, 104 – 137.
Benveniste, L. M., and P. A. Spindt, 1989, “How Investment Bankers Determine the Offer Price
and Allocation of New Issues,” Journal of Financial Economics, 24, 343 – 361.
Benzoni, L., and C. Schenone, 2010, “Conflict of Interest and Certification: Long-Term Perfor-
mance and Valuation of U.S. IPOs Underwritten by Relationship Banks,” Journal of Financial
Intermediation, 19, 235–254.
Bhagat, S., M. W. Marr, and G. R. Thompson, 1985, “The Rule 415 Experiment: Equity Markets,”
Journal of Finance, XL, 1385–1401.
Bodnaruk, A., M. Massa, and A. Simonov, 2009, “Investment Banks as Insiders and the Market
for Corporate Control,” Review of Financial Studies, 22, 4989–5026.
Bonacich, P., 1972, “Factoring and Weighting Approaches to Status Scores and Clique Identifica-
tion,” Journal of Mathematical Sociology, 2, 113–120.
Calomiris, C. W., and D. M. G. Raff, 1995, “The Evolution of Market Structure, Information,
and Spreads in American Investment Banking,” in Michael D. Bordo, and Richard Sylla (ed.),
Anglo-American Financial Systems: Institutions and Markets in the Twentieth Century . pp.
103–160, Irwin, New York, NY.
Cameron, A. C., and P. Trivedi, 2008, Microeconometrics: Methods and Applications, Cambridge
University Press, New York, NY.
41

INVESTMENT-BANKING RELATIONSHIPS: 1933-2007
Carosso, V. P., 1970, Investment Banking in America: A History, Harvard University Press, Cam-
bridge, Mass.
Chen, Z., A. D. Morrison, and W. J. Wilhelm, 2013a, “Investment Bank Reputation and "Star"
Cultures,” Review of Corporate Finance Studies, forthcoming.
Chen, Z., A. D. Morrison, and W. J. Wilhelm, Jr, 2013b, “Traders vs. Relationship Managers:
Reputational Conflicts in Full-Service Investment Banks,” Working paper, McIntire School of
Commerce, University of Virginia.
Chernow, R., 1990, The House of Morgan: an Americal banking dynasty and the rise of modern
finance, Atlantic Monthly Press, New York, NY.
Cliff, M. T., and D. J. Denis, 2004, “Do Initial Public Offering Firms Purchase Analyst Coverage
with Underpricing?,” Journal of Finance, 59, 2871 – 2901.
Corwin, S. A., and P. Schultz, 2005, “The Role of IPO Underwriting Syndicates: Pricing, Infor-
mation Production, and Underwriter Competition,” Journal of Finance, 60, 443 – 486.
Denis, D. J., 1991, “Shelf Registration and the Market for Seasoned Equity Offerings,” Journal of
Business, 64, 189–212.
Drucker, S., and M. Puri, 2005, “On the Benefits of Concurrent Lending and Underpricing,” Jour-
nal of Finance, 60, 2763–2799.
Eccles, R. G., and D. B. Crane, 1988, Doing Deals: Investment Banks at Work, Harvard Business
School Press, Cambridge, MA.
Ellis, C. D., 2009, The Making of Goldman Sachs, Penguin, London.
Griffin, J. M., R. Lowery, and A. Saretto, 2013, “Complex Securities and Underwriter Reputation:
Do Reputable Underwriters Produce Better Securities?,” mimeo, Unversity of Texas, Austin,
TX.
Griffin, J. M., T. Shu, and S. Topaloglu, 2012, “Examining the Dark Side of Financial Markets: Do
Institutions Trade on Information from Investment Bank Connections?,” Review of Financial
Studies, 25, 2155–2188.
42

INVESTMENT-BANKING RELATIONSHIPS: 1933-2007
Guner, A. B., U. Malmendier, and G. Tate, 2008, “Financial Expertise of Directors,” Journal of
Financial Economics, 88, 323–354.
Hartman-Glaser, B., 2013, “Reputation and Signaling,” Working paper, Fuqua School of Business,
Duke University, NC.
Hausman, J., and D. McFadden, 1984, “Specification Tests for the Multinomial Logit Model,”
Econometrica, 52, 1219–1240.
Hayes, S. L., 1971, “Investment Banking: Power Structure in Flux,” Harvard Business Review, 49,
136 – 152.
Hayes, S. L., 1979, “The Transformation of Investment Banking,” Harvard Business Review, 57,
153–170.
Hochberg, Y. V., A. Ljungqvist, and Y. Lu, 2007, “Whom you know matters: Venture capital
networks and investment performance,” Journal of Finance, 62, 251–301.
Hochberg, Y. V., A. Ljungqvist, and Y. Lu, 2010, “Networking as a barrier to entry and the com-
petitive supply of venture capital,” Journal of Finance, 65, 829–859.
Kemmerer, D. L., 1952, “The Marketing of Securities, 1930-1952,” Journal of Economic History,
12, 454–468.
Krigman, L., W. H. Shaw, and K. L. Womack, 2001, “Why Do Firms Switch Underwriters?,”
Journal of Financial Economics, 60, 245 – 284.
Ljungqvist, A., 2007, “IPO Underpricing,” in B. Espen Eckbo (ed.), Handbook of Empirical Cor-
porate Finance, Elsevier/North-Holland, New York, NY.
Ljungqvist, A., F. Marston, and W. J. Wilhelm, Jr., 2009, “Scaling the hierarchy: How and why
investment banks compete for syndicate co-management appointments,” Review of Financial
Studies, 22, 3977–4007.
Ljungqvist, A., and W. J. Wilhelm, Jr., 2005, “Does Prospect Theory Explain IPO Market Behav-
ior?,” Journal of Finance, 60, 1759–1790.
43

INVESTMENT-BANKING RELATIONSHIPS: 1933-2007
Ljungqvist, A. P., F. Marston, and W. J. Wilhelm, Jr., 2006, “Competing for Securities Underwrit-
ing Mandates: Banking Relationships and Analyst Recommendations,” Journal of Finance, 61,
301–340.
McFadden, D., 1973, “Conditional Logit Analysis of Qualitative Choice Behavior,” in P. Zarembka
(ed.), Frontiers in Econometrics . chap. 4, pp. 105–142, Academic Press, New York.
Medina, H. R., 1954 [1975], Corrected Opinion of Harold R. Medina, Arno Press, New York, NY.
Morrison, A. D., and W. J. Wilhelm, Jr, 2004, “Partnership Firms, Reputation and Human Capital,”
American Economic Review, 94, 1682 – 1692.
Morrison, A. D., and W. J. Wilhelm, Jr., 2007, Investment Banking: Institutions, Politics and Law,
Oxford University Press, Oxford, UK.
Morrison, A. D., and W. J. Wilhelm, Jr., 2008, “The Demise of Investment Banking Partnerships:
Theory and Evidence,” Journal of Finance, 63, 311–350.
Perkins, E. J., 1999, Wall Street to Main Street: Charles Merrill and Middle Class Investors,
Cambridge University Press, Cambridge, U.K.
Pichler, P., and W. J. Wilhelm, Jr., 2001, “A Theory of the Syndicate: Form Follows Function,”
Journal of Finance, 56, 2237 – 64.
Podolny, J. M., 1993, “A Status-Based Model of Market Competition,” American Journal of Soci-
ology, 98, 829–872.
Reich, C., 1983, Financier: The Biography of André Meyer, William Morrow & Co., New York,
NY.
Schenone, C., 2004, “The Effect of Banking Relationships on the Firm’s IPO Underpricing,” Jour-
nal of Finance, 59, 2903–2958.
Seligman, J., 1982, The Transformation of Wall Street: A History of the Securities and Exchange
Commission and Modern Corporate Finance, Houghton Mifflin Company, Boston, Mass.
Skeel, Jr., D. A., 2001, Debt’s Dominion, Princeton University Press, Princeton, NJ.
Sobel, R. M., 1986, Salomon Brothers, Salomon Brothers, New York.
44

INVESTMENT-BANKING RELATIONSHIPS: 1933-2007
Thackray, J., 1971, “Investment Banking Breaks Formation,” Corporate Financing, pp. 19–24,
61–64.
Thackray, J., 1972, “Why Your Investment Banker is Switching Firms,” Corporate Financing, pp.
25–29, 86–87, 97–100.
Winton, A., and V. Yerramilli, 2011, “Lender Moral Hazard and Reputation in Originate-to-
Distribute Markets,” Working paper, Carlson School of Management, University of Minnesota.
Yasuda, A., 2005, “Do bank relationships affect the firm’s underwriter choice in the corporate-bond
underwriting market?,” Journal of Finance, 60, 1259–1292.
Yasuda, A., 2007, “Bank relationships and underwriter competition: Evidence from Japan,” Jour-
nal of Financial Economics, 86, 369–404.
45

INVESTMENT-BANKING RELATIONSHIPS: 1933-2007
8. APPENDIX
8.1. Eigenvector Centrality
Eigenvector centrality measures the quality as well as the volume of a bank’s relationships. It is
defined recursively: a bank’s eigenvector centrality is the sum of its ties to other banks, weighted
by their respective centralities. For a bank i, write M (i) for the set of banks connected to bank i
via co-membership of a syndicate, and let λ be a proportionality factor. We define the eigenvector
centrality ei of bank i as follows:
ei =1λ
∑j∈M(i)
e j. (1)
We can rewrite equation (1) as follows. Write A for the symmetric matrix whose (i, j)th element Ai j
is 1 if bank i and j have a relationship, and zero otherwise; A is often referred to as an undirected
adjacency matrix. Then
ei =1λ
N
∑j=1
Ai je j, (2)
where N is the total number of banks in the network. Write
e = [e1,e2, ...,eN ]′
for the N×1 vector of bank centrality scores. Then equation (2) can be written as follows:
λe = Ae.
That is, any set e1, e2, . . . , eN of solutions to equation (1) corresponds to an eigenvector of the
adjacency matrix A. When we require centrality scores to be non-negative, the Perron-Frobenius
theorem implies that λ must be the highest eigenvalue of A, and, hence, that e must be the corre-
sponding eigenvector.
46

INVESTMENT-BANKING RELATIONSHIPS: 1933-2007
8.2. Top 30 Banks by Decade
Table A.I reports the 30 banks entering the issuer’s choice set for each estimation period. Banks
are ranked according to their share of the total dollar value of securities issued during the decade
in question.
47

Figure 1. Bank-Firm Relationship Exclusivity. The figure reports an annual measure of a bank’s average relationship strength among firms for which the bank managed a deal during the preceding 10 years. Relationship strength is the bank’s share of proceeds raised by a firm during the 10-year rolling window. The average relationship strength among the top 30 banks is calculated using the average relationship strength for each of the 30 banks in the issuer’s choice set for a given year used in the econometric analysis.
40.00%
50.00%
60.00%
70.00%
80.00%
90.00%
100.00%
1944 1949 1954 1959 1964 1969 1974 1979 1984 1989 1994 1999 2004 2009
Top 30 Banks Goldman Sachs Merrill Lynch Morgan Stanley
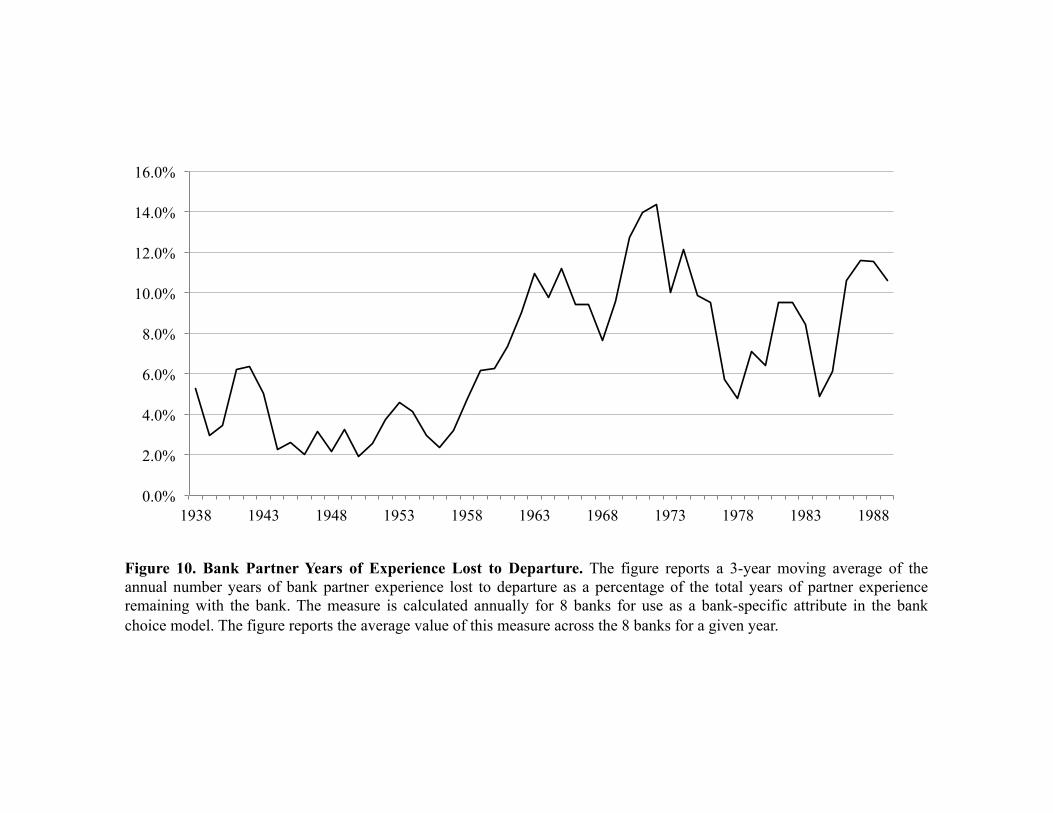
Figure 10. Bank Partner Years of Experience Lost to Departure. The figure reports a 3-year moving average of the annual number years of bank partner experience lost to departure as a percentage of the total years of partner experience remaining with the bank. The measure is calculated annually for 8 banks for use as a bank-specific attribute in the bank choice model. The figure reports the average value of this measure across the 8 banks for a given year.
0.0%
2.0%
4.0%
6.0%
8.0%
10.0%
12.0%
14.0%
16.0%
1938 1943 1948 1953 1958 1963 1968 1973 1978 1983 1988

Figure 2. Exclusivity of Bank-Firm Relationships within SIC Categories. The figure reports the fraction of banks with multiple clients within a four-digit SIC category, conditional on a bank having at least one client in the industry category. A bank is identified as having a client in an SIC category in a given year if it managed at least one deal for the client during the preceding 10 years. Equity and debt relationships are reported separately. “All” includes preferred stock deals in addition to debt and equity.
0.00%
5.00%
10.00%
15.00%
20.00%
25.00%
30.00%
35.00%
40.00%
1944 1949 1954 1959 1964 1969 1974 1979 1984 1989 1994 1999 2004
All Equity Debt

Figure 3. Relationship between EVC and Underwriting Volume. The figure plots banks’ eigenvector centrality (EVC) against their underwriting volume for the time periods 1950-1955 and 2000-2005. Underwriting volume is the total proceeds managed by the bank ($m) during the time period. EVC is measured for each bank using syndicate data for every transaction during the 5-year time period and normalized to a 0-100 scale.
0.0
5.0
10.0
15.0
20.0
25.0
30.0
35.0
40.0
45.0
50.0
$0 $5 $10 $15 $20 0.0
5.0
10.0
15.0
20.0
25.0
$0 $50 $100 $150 $200
Morgan Stanley
Morgan Stanley
Lehman
First Boston
Merrill Lynch
Goldman Sachs
Merrill Lynch First
Boston
Goldman Sachs
JP Morgan
Citicorp BofA
1950-1955 2000-2005
Halsey Stuart

ASCLogit NLogit
RelStr
EVC
RelStrSIC
Figure 4. Estimated Coefficients and Confidence Intervals. This figure plots the estimatedcoefficients and confidence intervals for bank-specific attributes from the ASCLogit and Nlogit specifications of the bank choice model reported in Table V. For the ASCLogit results *** and **indicate that the coefficient estimate is statistically different from the preceding decade's coefficient atthe 1% and 5% levels.
0.025
0.030
0.035
0.040
0.045
'40s '50s '60s '70s '80s '90s '00s
***
***
***
0.025
0.030
0.035
0.040
0.045
'40s '50s '60s '70s '80s '90s '00s
-0.045
0.005
0.055
0.105
0.155
'40s '50s '60s '70s '80s '90s '00s
***
-0.045
0.005
0.055
0.105
0.155
'40s '50s '60s '70s '80s '90s '00s
0.002
0.007
0.012
0.017
'40s '50s '60s '70s '80s '90s '00s
***
*** **
0.002
0.007
0.012
0.017
'40s '50s '60s '70s '80s '90s '00s

Figure 5. Choice Probability Elasticities With Respect To RelStr. During each estimation period we calculate choice probability elasticities with respect to RelStr for each bank in the choice set for each transaction. Elasticities are pooled across transactions and banks and then plotted against RelStr which ranges in value from 0-100.
1943 - 1949 1950 - 1959 1960 - 1969
1970 - 1979 1980 - 1989 1990 - 1999
2000 - 2007

Figure 6. Choice Probability Elasticities With Respect To EVC. During each estimation period we calculate choice probability elasticities with respect to EVC for each bank in the choice set for each transaction. Elasticities are pooled across transactions and banks and then plotted against EVC which ranges in value from 0-100.
1943 -1949 1950 - 1959
1970 - 1979 1980 - 1989 1990 - 1999
2000 - 2007
1960 - 1969

Figure 7. Timeline of Events

Figure 8. Number of Partners. This figure plots the number of partners on an annual basis for the 8-bank subsample. Goldman Sachs, Lehman, Morgan Stanley, and Salomon comprise the “wholesale” bank group in the nested logit analysis. Dean Witter, EF Hutton, Merrill Lynch, and Smith are assigned to the “retail” bank group. Series’ that end before 1989 reflect the point at which the bank changed its reporting convention for the NYSE member firm directories.
Merrill Lynch
Salomon
Lehman
Smith Barney
EF Hutton
Dean Witter
Goldman Sachs
Morgan Stanley

Figure 9. 3-Year Moving Average Percentage Change in Partner Tenure. Partner tenure is measured as the number of years served as a partner entering the current year. The percentage change is calculated annually and used to calculate the average percentage change for the preceding 3 years. The figure reports the average of this 3-year moving average calculated for each of the 8 banks.
-10.00%
-8.00%
-6.00%
-4.00%
-2.00%
0.00%
2.00%
4.00%
6.00%
8.00%
10.00%
1937 1942 1947 1952 1957 1962 1967 1972 1977 1982 1987

Number of Deals
Proceeds ($m)
Number of Deals
Proceeds ($m)
Total 19,888 $808,989 43,414 $5,241,142
Morgan Stanley 2.12% 14.16% Goldman Sachs 7.96% 13.01%First Boston 2.78% 8.02% Morgan Stanley 6.15% 11.87%Kuhn, Loeb 1.92% 6.23% Merrill Lynch 7.53% 9.91%Halsey, Stuart 3.61% 6.07% First Boston 5.93% 8.38%Lehman Brothers 3.35% 5.96% Citicorp 3.95% 6.89%Dillon Read 1.37% 5.10% J. P. Morgan 3.94% 6.27%Blyth 3.20% 4.78% Lehman Brothers 4.83% 5.68%Goldman Sachs 2.66% 4.12% Salomon Brothers 4.51% 5.29%Salomon Brothers 3.94% 3.86% Drexel 2.58% 4.01%Kidder Peabody 4.29% 2.99% Bank of America 3.90% 3.67%Smith Barney 1.43% 2.69% Bear Stearns 1.81% 1.72%Eastman Dillon 2.23% 2.63% Donaldson, Lufkin & Jenrette 1.80% 1.71%Harriman Ripley 1.08% 2.25% Deutsche Bank 1.91% 1.68%Merrill Lynch 1.38% 2.00% Smith Barney 1.64% 1.15%White Weld 1.85% 1.99% Paine Webber 2.27% 1.14%Glore Forgan 1.27% 1.49% UBS 1.37% 1.09%Paine Webber 1.84% 1.48% Kidder Peabody 1.83% 0.90%Lazard Freres 0.31% 0.98% Chase Manhattan Bank 1.08% 0.89%Drexel 0.57% 0.92% Dillon Read 0.88% 0.75%Dean Witter 1.32% 0.80% Barclays Bank 0.33% 0.58%F. Eberstadt 0.82% 0.59% Wachovia 0.53% 0.53%Mellon Securities 0.20% 0.56% Bank One 0.47% 0.48%R. W. Pressprich 0.68% 0.56% Lazard Freres 0.40% 0.46%A. G. Becker 1.04% 0.54% Alex. Brown 1.31% 0.44%Loeb Rhoades 0.61% 0.53% Prudential-Bache Securities 0.88% 0.37%Hayden Stone 0.70% 0.52% 1st Nat'L Bank Of Chicago 1.17% 0.36%Allen & Co. 0.70% 0.49% NationsBank 0.70% 0.34%Brown Brothers Harriman 0.19% 0.45% Montgomery Securities 0.86% 0.31%Bear Stearns 0.70% 0.38% Dean Witter 0.79% 0.30%Shields & Co. 0.59% 0.33% Blyth 0.24% 0.30%
Totals for top 30 banks 48.75% 83.47% 73.55% 90.48%
Table ITop 30 Banks by Market Share for 1933-1969 and 1970-2007
This table reports the percentage of deals and the percentage of proceeds managed by the top 30 banks by marketshare for the final sample of 63,302 deals described in section 2. Dollar amounts and all calculations reflect 1996dollars. Deal credit is apportioned equally to all bookrunners. The top 30 banks reported here generally will notcorrespond with the 30 banks appearing in the issuer's choice set for any given year in the econometric analysis.Issuer choice sets include the top 30 banks (by proceeds) for the decade in which a transaction occurs.
1933-1969 1970-2007

No Prior Relationship
Prior Relationship
No Prior Relationship
Prior Relationship
No Prior Relationship
Prior Relationship
No Prior Relationship
Prior Relationship
No Prior Relationship
Prior Relationship
No Prior Relationship
Prior Relationship
No Prior Relationship
Prior Relationship
612 (73%)
230 (27%)
259 (21%)
958 (79%)
810 (37%)
1,354 (63%)
1,256 (48%)
1,346 (52%)
4,830 (47%)
5,481 (53%)
4,647 (37%)
7,927 (63%)
1,681 (43%)
2,186 (57%)
Equity88
(46%)105
(54%)56
(33%)116
(67%)415
(57%)309
(43%)724
(68%)337
(32%)1,444 (57%)
1,107 (43%)
2,420 (58%)
1,770 (42%)
854 (52%)
804 (48%)
Debt98
(19%)418
(81%)193
(22%)807
(81%)387
(28%)1,012 (72%)
524 (35%)
970 (65%)
3,037 (42%)
4,142 (58%)
1,873 (24%)
5,985 (76%)
550 (29%)
1,315 (71%)
Preferred44
(33%)89
(67%)10
(22%)35
(78%)8
(20%)33
(80%)8
(17%)39
(83%)349
(60%)232
(40%)354
(67%)172
(33%)277
(81%)67
(19%)
Total Number of Transactions
Table IIDistribution of Transactions Across Estimation Periods
1,865
133 45 41 47 581 526 344
516 1,000 1,399 1,494 7,179 7,858
3,867
193 172 724 1,061 2,551 4,190 1,658
842 1,217 2,164 2,602 10,311 12,574
This table reports the distribution of transactions used in the econometric analysis for each estimation period. We report transactions by type (Equity, Debt, Preferred) and whether or not the issuer had anexisting banking relationship. The presence of a relationship is determined by the issuer having completed a transaction during the preceding 10 years for which one of the 30 banks in its choice set served asthe bookrunner.
1943-1949 1950-1959 1960-1969 1970-1979 1980-1989 1990-1999 2000-2007

Number of
ClientsExclusive
Relationships
% of Client Deals
Managed
Number of
ClientsExclusive
Relationships
% of Client Deals
Managed
Morgan Stanley 166 53.61% 69.66% Goldman Sachs 1,284 31.15% 28.08%First Boston 262 48.47% 34.60% Morgan Stanley 1,064 28.95% 27.41%Kuhn, Loeb 157 55.41% 59.54% Merrill Lynch 1,264 30.22% 22.05%Halsey, Stuart 157 18.47% 30.79% First Boston 1,225 35.35% 22.00%Lehman Brothers 319 54.86% 47.88% Citicorp 765 21.44% 17.51%Dillon Read 117 62.39% 61.49% J. P. Morgan 783 21.71% 15.18%Blyth 331 53.78% 36.54% Lehman Brothers 971 31.00% 17.63%Goldman Sachs 319 62.38% 55.17% Salomon Brothers 706 25.50% 15.86%Salomon Brothers 147 27.21% 24.74% Drexel 585 46.67% 50.73%Kidder Peabody 446 69.28% 36.86% Bank of America 969 35.81% 13.20%Smith Barney 173 52.60% 33.82% Bear Stearns 515 37.28% 14.39%Eastman Dillon 249 69.48% 61.63% DLJ 513 45.03% 19.93%Harriman Ripley 103 33.98% 20.14% Deutsche Bank 523 30.98% 7.72%Merrill Lynch 176 47.16% 21.76% Smith Barney 424 36.32% 17.31%White Weld 226 60.62% 34.43% Paine Webber 536 45.90% 12.90%Glore Forgan 124 63.71% 37.97% UBS 376 23.67% 6.97%Paine Webber 152 57.24% 50.71% Kidder Peabody 441 45.12% 10.61%Lazard Freres 38 31.58% 47.60% Chase Manhattan Bank 277 36.10% 6.43%Drexel 75 57.33% 31.53% Dillon Read 205 45.85% 23.45%Dean Witter 146 65.07% 38.96% Barclays Bank 68 17.65% 6.96%F. Eberstadt 76 63.16% 61.58% Wachovia 132 13.64% 7.04%Mellon Securities 19 5.26% 22.79% Bank One 92 25.00% 7.47%R. W. Pressprich 64 53.13% 16.38% Lazard Freres 95 23.16% 15.30%A. G. Becker 110 63.64% 46.30% Alex. Brown 392 50.77% 28.60%Loeb Rhoades 77 67.53% 37.27% Prudential-Bache Sec. 269 40.89% 8.99%Hayden Stone 93 73.12% 35.68% 1st Nat'L Bank Chicago 316 36.08% 3.98%Allen & Co. 81 61.73% 55.81% NationsBank 194 33.51% 7.82%Brown Brothers Harriman 31 22.58% 12.56% Montgomery Securities 251 51.00% 34.97%Bear Stearns 96 66.67% 19.56% Dean Witter 221 44.80% 6.15%Shields & Co. 80 62.50% 25.32% Blyth 76 27.63% 10.07%
Mean 153.67 52.80% 38.97% Mean 517.73 33.94% 16.22%
Table IIIRelationship Exclusivity: 1933-1969 and 1970-2007
This table reports the number of client relationships and their degree of exclusivity for the top 30 banks by market share for thesample of 63,302 deals described in section 2. The number of clients is the number of distinct issuers for which a bank managed adeal during the reporting period. Exclusive relationships reflect the percentage of the bank's clients for which the bank managed allof the client's deals during the reporting period. The % of client's deals managed is the average fraction of proceeds raised by abank's clients for which the bank had management responsibility. Deal credit is apportioned equally to all bookrunners.
1933-1969 1970-2007

Not Selected Selected
Not Selected Selected
Not Selected Selected
Not Selected Selected
Not Selected Selected
Not Selected Selected
Not Selected Selected
1.14 32.79*** 1.15 40.11*** 0.68 41.28*** 0.76 28.01*** 0.95 23.04*** 1.36 19.87*** 1.12 17.70(1.41) (40.71) (1.28) (40.11) (1.16) (44.23) (1.29) (41.01) (1.40) (38.28) (1.47) (33.23) (1.37) (31.84)
13.61 44.24 18.69 51.46*** 10.00 43.77*** 13.80 43.50 20.08 43.82*** 26.36 45.33 17.77 46.67(9.17) (36.63) (9.96) (35.03) (9.74) (42.55) (11.98) (42.75) (14.19) (40.87) (15.95) (35.75) (11.10) (34.29)
12.14 12.49 13.34 14.48*** 13.99 16.63*** 14.31 18.72*** 12.56 16.98*** 11.68 15.21*** 8.95 15.66***
(0.91) (10.52) (0.56) (9.70) (0.56) (8.66) (0.52) (5.97) (0.65) (7.50) (0.71) (6.00) (1.33) (3.95)
15.71 9.29 15.75 8.29 15.62 12.13*** 15.72 9.20 15.72 9.15 15.72 9.22 8.95 15.66(8.62) (7.18) (8.60) (6.84) (8.65) (8.01) (8.61) (7.48) (8.61) (7.58) (8.60) (7.96) (1.33) (3.95)
Number of Transactions
1950-1959
69.50
Table IV
Summary Statistics for Bank Relationship VariablesThis table reports summary statistics for the primary explanatory variables used in the econometric analysis. Mean values are reported by estimation period and for banks selected tomanage transactions and for those that were not. RelStr is a bank's share of an issuer's transactions (fraction of proceeds) executed in the decade preceding the transaction at hand.For each issuer in a given year, this variable is fixed at the level of a given bank in the choice set (even if the issuer carries out multiple transactions within the year). RelStrSIC isthe bank's share of proceeds managed for all firms in the issuer's SIC category that executed transactions during the decade preceding the issuer's transaction. For each bank in thechoice set, this variable takes a fixed value for all transactions executed by firms in a given 4-digit SIC category in a given year. EVC measures a bank's connectedness with otherbanks during the decade preceding an issuer's transaction. For each bank in the choice set, this variable takes a fixed value in a given year. A bank's rank (1-30) is measured bymarket share of proceeds during the estimation period and is provided here for comparison purposes. The log of transaction value and the number of transactions brought to marketby the issuer since 1933, appear as transaction-specific variables in the ASCLogit and NLogit specifications (along with an indicator for equity deals). Standard deviations arereported in parentheses. *** indicates a statistically significant difference in means for banks selected and not selected at the 1% level.
RelStrSIC
RelStr
1980-1989 1990-1999 2000-20071943-1949
(8.66)
1960-1969 1970-1979
EVC
Bank's Rank within the Issuer's Choice Set
842
(130.00)
11.78(14.66)
1,217
(105.00)
6.10
2,164
75.60(158.00)
10.02(17.51)
66.70
2,602
138.90(206.00)
6.21(15.92)
10,311
104.60(218.00)
5.17(10.67)
134.20(266.00)
16.11(33.28)
(212.00)
38.37(101.22)
12,574
Transaction Value ($m)
Transactions to Date (from 1933)
3,867
140.10

Estimation Period RelStr EVC RelStrSIC Transactions χ2(n) ll
1943-49 CLogit 0.0385*** -0.0050 0.0139*** 842 1,601(3) -2,063(0.001) (0.003) (0.001)
ASCLogit 0.0337*** -0.0263* 0.0134*** 842 2,432(119) -1,647(0.002) (0.014) (0.002)
NLogit 0.0296*** -0.0118*** 0.0096*** 842 248(9) -1,944(0.003) (0.003) (0.002)
1950-59 CLogit 0.0496*** 0.0015 0.0097*** 1,217 3,037(3) -2,621(0.001) (0.004) (0.001)
ASCLogit 0.0380*** -0.0073 0.0105*** 1,217 4,322(119) -1,978(0.001) (0.013) (0.001)
NLogit 0.0272*** -0.0057*** 0.0033*** 1217 370(9) -2,420(0.002) (0.003) (0.001)
1960-69 CLogit 0.0492*** 0.0216*** 0.0082*** 2,164 5,557(3) -4,582(0.001) (0.003) (0.001)
ASCLogit 0.0442*** 0.016 0.0061*** 2,164 6,704(119) -4,008(0.001) (0.013) (0.001)
NLogit 0.0432*** 0.0125*** 0.0071*** 2,164 672(9) -4,503(0.002) (0.004) (0.001)
1970-79 CLogit 0.0386*** 0.0688*** 0.0101*** 2,607 4,756(3) -6,502(0.001) (0.003) (0.001)
ASCLogit 0.0337*** 0.0421*** 0.0094*** 2,607 6,169(119) -5,796(0.001) (0.015) (0.001)
NLogit 0.0366*** 0.0330*** 0.0100*** 2,602 564(9) -6,281(0.002) (0.005) (0.001)
1980-89 CLogit 0.0337*** 0.0460*** -0.0058*** 10,373 13,183(3) -28,857(0.000) (0.002) (0.002)
ASCLogit 0.0328*** 0.0179*** 0.0031*** 10,373 19,065(119) -25,916(0.002) (0.006) (0.000)
NLogit 0.0333*** 0.0238*** 0.0045*** 10,311 1,855(9) -27,672(0.001) (0.002) (0.000)
1990-99 CLogit 0.0341*** 0.0556*** 0.0056*** 12,941 14,053(3) -38,098(0.000) (0.002) (0.000)
ASCLogit 0.0298*** 0.1197*** 0.0029*** 12,941 23,486(119) -33,382(0.000) (0.005) (0.000)
NLogit 0.0307*** 0.0258*** 0.0043*** 12,574 1,767(9) -34,641(0.001) (0.002) (0.000)
2000-07 CLogit 0.0313*** 0.1659*** 0.0056*** 5,664 12,554(3) -19,417(0.001) (0.004) (0.000)
ASCLogit 0.0296*** 0.1312*** 0.0030*** 5,664 18,091(119) -16,649(0.001) (0.015) (0.001)
NLogit 0.0299*** 0.0960*** 0.0061*** 3,867 747(9) -9,889(0.002) (0.008) (0.001)
Table VBank Choice Model
This table reports coefficients estimated for 3 specifications of the bank choice model: conditional logit (CLogit), alternative specific conditonallogit (ASCLogit), and Nested Logit (NLogit). The issuer's choice is conditional on 3 bank-specific attributes: RelStr is the bank's share of theissuer's proceeds raised during the preceding decade; EVC is the bank's eigenvector centrality measure; RelStrSIC is the bank's share ofproceeds raised by other firms in the issuer's 4-digit SIC category during the preceding decade. The ASCLogit specification estimates(unreported) coeeficients for 3 transaction-specific variables (log dollar value of transaction, issuer's number of transactions from 1933, and anequity issue indicator variable) interacted with 29 individual bank indicators (with the 30th bank serving as the base). The NLogit specificationestimates (unreported) coefficients for the 3 transaction-specific variables for the first and second nests (with the third nest serving as the base).Standard errors are reported in parentheses. ***, **, and * indicate statistical significance at the 1%, 5%, and 10% levels. For each regressionwe report the log likelihood (ll) value and a χ2 test statistic for goodness of fit with (n) degrees of freedom. There is a smaller number oftransactions for the NLogit specification during the last four estimation periods because it does not admit cases where the issuer selected morethan one bank. In these cases the log likelihood value and χ2 test statistic are not directly comparable those reported for the CLogit andASCLogit specifications.

Bankers Directorships Director YearsAverage Years per
Director> 15 Years
Service Before 1935 After 1949Blyth 6 10 68 7 3 4 3Dillon Read 3 2 33 17 0 2 2Drexel 2 2 22 11 0 0 2Eastman Dillon 3 4 30 8 0 0 2First Boston 2 3 33 11 2 1 2Glore Forgan 5 6 60 10 2 2 6Goldman Sachs 9 34 592 17 21 1 25Harriman Ripley 5 6 58 10 0 1 5Harris Hall 1 1 4 4 0 0 0Kuhn Loeb 6 10 146 15 3 8 10Kidder Peabody 3 4 36 9 0 2 0Lehman 14 53 788 15 22 0 35Morgan Stanley 2 2 11 6 0 0 1Smith Barney 9 8 102 13 0 3 3Stone & Webster 1 2 17 9 0 2 0Union Securities 5 9 55 6 0 0 8White Weld 7 6 70 12 3 5 4
Total 83 162 2,125 56Average 5 10 125 13
Table VIBank Directorships: 1935-1949
This table reports summary information about banker participation on client boards of directors for the 17 defendant banks in U.S. v. Henry S.Morgan et al. The data are from trial records stored with the Harold R. Medina Papers housed at the Mudd Library, Princeton University. Foreach bank, we reoprt the number of individual bankers who served as directors between 1935 and 1949, the number of clients for which eachbank provided a director, the total number of years served by banker directors across the clients, the average number of years served by eachbanker in his directorships, and the number of clients for which a banker served for at least 15 years. We also identify cases in which adirectorship was identified as beginning before 1935 (without a specific date) and cases in which the banker rmained as a director at the end ofthe reporting period (usually year-end 1949).

Estimation Period RelStr EVC RelStrSIC Tenure Experience Transactions Banks χ2(n) ll
1943-49 0.032*** -0.008 0.006*** -3.448* 242 6 39 (7) -235(0.008) (0.006) (0.003) (1.84)
0.030*** -0.006 0.004** -0.070 57 (7) -234(0.008) (0.004) (0.002) (0.627)
1950-59 0.055*** -0.020** -0.002 -5.004*** 511 7 86 (7) -491(0.009) (0.009) (0.002) (1.939)
0.052*** -0.010 -0.000 7.724*** 85 (7) -484(0.009) (0.008) (0.002) (2.102)
1960-69 0.046*** 0.025*** 0.006*** 1.914** 823 7 107 (7) -747(0.006) (0.006) (0.002) (0.855)
0.045*** 0.020*** 0.006*** -0.752 106 (7) -749(0.005) (0.005) (0.001) (0.612)
1970-79 0.032*** 0.027*** 0.007*** 0.845** 1,364 8 222 (7) -1,942(0.003) (0.006) (0.001) (0.416)
0.032*** 0.031*** 0.006*** -2.111*** 228 (7) -1930(0.002) (0.006) (0.001) (0.444)
1980-89 0.027*** 0.124*** 0.002*** -1.063*** 2,556 8 395 (7) -3,998(0.002) (0.013) (0.001) (0.303)
0.028*** 0.134*** 0.002*** 0.678** 390 (7) -4002(0.002) (0.015) (0.001) (0.309)
Table VIIBank Choice Model with Changes in Partner Tenure and Experience
This table reports coefficients estimated for the nested logit (NLogit) specification of the bank choice model for a subset of 8 banks. For nesting purposes, weidentify E.F. Hutton, Dean Witter, Merrill Lynch, and Smith Barney as retail banks and Goldman Sachs, Lehman Bros., Morgan Stanley, and Salomon Bros. aswholesale banks. E.F. Hutton and Dean Witter are excluded from the 1943-1949 estimation period because they were not among the top 30 banks by dollarmarket share. E.F. Hutton also does not appear in the 1950-1959 and 1960-1969 periods. The issuer's choice is conditional on 4 bank-specific attributes: RelStr is the bank's share of the issuer's proceeds raised during the preceding decade; EVC is the bank's eigenvector centrality measure; RelStrSIC is the bank's share ofproceeds raised by other firms in the issuer's 4-digit SIC category during the preceding decade. Tenure is the 3-year moving average of the percentage change inthe average tenure of a bank's partners during the year of the transaction. Experience is the 3-year moving average of partner years of experience lost annuallyto departure as a percentage of remaining partner years of experience during the year of the transaction. The NLogit specification estimates (unreported)coefficients for the 3 transaction-specific variables for the retail nest (with the institutional nest serving as the base). Standard errors are reported in parentheses.***, **, and * indicate statistical significance at the 1%, 5%, and 10% levels. For each regression we report the log likelihood (ll) value and a χ2 test statistic forgoodness of fit with (n) degrees of freedom.

1940-1949Market Share 1950-1959
Market Share 1960-1969
Market Share 1970-1979
Market Share
Morgan Stanley & Co. 14.37% Morgan Stanley & Co. 18.18% Morgan Stanley & Co. 10.09% Morgan Stanley & Co. 19.55%Halsey, Stuart & Co. 13.17% First Boston 9.47% First Boston 8.53% Goldman, Sachs & Co. 10.38%Kuhn, Loeb & Co. 9.57% Halsey, Stuart & Co. 8.04% Lehman Bros. 7.69% Salomon Bros. 9.42%First Boston 7.33% Blyth & Co. 5.69% Goldman, Sachs & Co. 5.22% Merrill Lynch 7.58%Dillon, Read & Co. 6.14% Lehman Bros. 5.52% Dillon, Read & Co. 5.07% First Boston 7.26%Harriman Ripley & Co. 4.80% Salomon Bros. 4.80% Blyth & Co. 5.01% Lehman Bros. 6.69%Blyth & Co. 4.43% Dillon, Read & Co. 4.75% Kuhn, Loeb & Co. 4.40% Smith Barney 4.73%Salomon Bros. 3.57% Harriman Ripley & Co. 4.10% Kidder, Peabody 4.02% Blyth & Co. 4.12%Lehman Bros. 3.44% Eastman, Dillon & Co. 3.72% Salomon Bros. 3.66% Kuhn, Loeb & Co. 3.89%Goldman, Sachs & Co. 2.53% Goldman, Sachs & Co. 3.56% Smith Barney 3.24% Paine Webber 2.89%Kidder, Peabody 2.45% Kuhn, Loeb & Co. 3.32% Eastman, Dillon & Co. 3.08% Kidder, Peabody 2.74%Mellon Securities 2.44% Smith Barney 3.20% White, Weld & Co. 2.81% White, Weld & Co. 2.46%Glore Forgan 2.02% Kidder, Peabody 2.08% Halsey, Stuart & Co. 2.68% Lazard Freres & Co. 2.31%Smith Barney 1.37% Merrill Lynch 1.99% Merrill Lynch 2.64% Dillon, Read & Co. 2.05%Harris, Hall & Co. 1.13% Glore Forgan 1.68% Paine Webber 2.08% Halsey, Stuart & Co. 1.77%Eastman, Dillon & Co. 1.10% White, Weld & Co. 1.60% Drexel 1.44% E. F. Hutton & Co. 1.05%Merrill Lynch 0.99% Paine Webber 1.27% Lazard Freres & Co. 1.37% Bache & Co. 0.89%White, Weld & Co. 0.99% Lazard Freres & Co. 0.81% Glore Forgan 1.36% Drexel 0.83%Union Securities Co. 0.79% F. Eberstadt & Co. 0.77% Dean Witter & Co. 1.24% Dean Witter & Co. 0.79%A. G. Becker & Co. 0.76% Allen & Co. 0.68% R. W. Pressprich & Co. 0.96% Eastman, Dillon & Co. 0.70%F. Eberstadt & Co. 0.58% Shields & Co. 0.48% Carl M. Loeb, Rhoades 0.88% A. G. Becker & Co. 0.63%Drexel 0.57% Dean Witter & Co. 0.43% Harriman Ripley & Co. 0.74% Carl M. Loeb, Rhoades 0.60%Paine Webber 0.50% Union Securities Co. 0.43% Bear, Stearns & Co. 0.61% Stone & Webster 0.34%Paul H. Davis & Co. 0.47% Drexel 0.42% Hayden, Stone & Co. 0.59% Bear, Stearns & Co. 0.32%Allen & Co. 0.47% A. G. Becker & Co. 0.40% F. Eberstadt & Co. 0.57% Allen & Co. 0.27%Lee Higginson & Co. 0.45% Wertheim & Co. 0.37% Du Pont 0.56% Reynolds Securities Inc. 0.27%F. S. Moseley & Co. 0.41% Carl M. Loeb, Rhoades 0.35% Hornblower & Weeks 0.55% Hornblower & Weeks 0.27%Shields & Co. 0.41% Hallgarten & Co. 0.33% Shearson, Hammill & Co. 0.54% First Mid-America Corp. 0.21%Alex. Brown & Sons 0.38% Reynolds & Co. 0.33% A. G. Becker & Co. 0.53% Dominick & Dominick 0.17%Otis & Co. 0.35% Hornblower & Weeks 0.33% Allen & Co. 0.48% C. E. Unterberg, Towbin 0.17%
Total Value Issued ($bn) $147 $195 $403 $380
1980-1989Market Share 1990-1999
Market Share 2000-2007
Market Share
Drexel 17.79% Goldman, Sachs & Co. 15.81% J. P. Morgan & Co. 14.56%Goldman, Sachs & Co. 12.72% Morgan Stanley & Co. 13.29% Citicorp 13.99%First Boston 9.80% Merrill Lynch 13.17% Goldman, Sachs & Co. 10.12%Salomon Bros. 9.76% First Boston 8.93% Morgan Stanley & Co. 9.88%Morgan Stanley & Co. 9.49% Lehman Bros. 6.12% Bank of America 9.64%Merrill Lynch 6.41% Salomon Bros. 6.04% Merrill Lynch 8.68%Lehman Bros. 5.34% Citicorp 5.78% First Boston 6.87%Paine Webber 2.86% J. P. Morgan & Co. 4.40% Lehman Bros. 5.08%Kidder, Peabody 2.20% DLJ 3.78% Deutsche Bank,A. G. 3.23%Dillon, Read & Co. 1.66% Bear, Stearns & Co. 2.41% UBS AG 2.75%Smith Barney 1.64% Chase Manhattan Bank 2.01% Barclays Bank PLC 1.87%Citicorp 1.50% Bank of America 1.38% Wachovia Corp. 1.76%Prudential-Bache 1.14% Deutsche Bank,A. G. 1.14% Bear, Stearns & Co. 1.74%Bank Of Chicago 1.12% Smith Barney 1.11% Bank One 1.52%Deutsche Bank,A. G. 1.12% NationsBank 0.84% BNP Paribas SA 0.54%Bank of America 0.88% Alex. Brown & Sons 0.75% ABN AMRO 0.50%Bear, Stearns & Co. 0.88% Paine Webber 0.73% Fleet Robertson Stephens 0.47%Morgan Guaranty Ltd. 0.84% Montgomery Securities 0.67% Greenwich Capital 0.47%E. F. Hutton & Co. 0.82% UBS AG 0.62% SunTrust Banks 0.38%Rothschild Unterberg 0.81% Bankers Trust Co. 0.58% HSBC Holdings PLC 0.31%DLJ 0.80% Dillon, Read & Co. 0.57% CIBC Ltd 0.29%Lazard Freres & Co. 0.79% Kidder, Peabody 0.52% SG Cowen Securities 0.24%Chemical Bank 0.74% Hambrecht & Quist 0.46% Thomas Weisel Partners 0.24%Dean Witter & Co. 0.60% BA Securities Inc 0.39% SunTrust Rob. Humphrey 0.20%Alex. Brown & Sons 0.58% Robertson Stephens 0.36% Jefferies & Co Inc 0.18%J. P. Morgan & Co. 0.45% Continental Bank 0.32% Bank of New York 0.17%Allen & Co. 0.41% Chemical Bank 0.30% Tokyo-Mitsubishi 0.16%Chase Manhattan Bank 0.35% Prudential-Bache 0.29% RBC Capital Markets 0.13%Shearson/American Exp. 0.31% Lazard Freres & Co. 0.29% US Bancorp Piper Jaffray Inc0.12%First Chicago 0.27% Dean Witter & Co. 0.29% Piper Jaffray Inc 0.12%
Total Value Issued ($bn) $1,162 $2,118 $1,582
Table A.ITop 30 Banks by Decade Ranked by Dollar Value of Transactions
This table reports the top 30 banks by market share that appear as members of issuers' choice set for each estimation period.