The Value of Banking Relationships During a Financial Crisis
36
The Value of Banking Relationships During a Financial Crisis: Evidence from Failures of Japanese Banks Elijah Brewer III Federal Reserve Bank of Chicago Hesna Genay Federal Reserve Bank of Chicago William Curt Hunter Federal Reserve Bank of Chicago George G. Kaufman Loyola University Chicago and Federal Reserve Bank of Chicago March 1, 2002 This version August 26, 2002 Preliminary Draft Corresponding author: Hesna Genay, Federal Reserve Bank of Chicago, Economic Research, 230 S. LaSalle Street, Chicago, IL 60604. Phone: (312) 322-5796; fax: (312) 322-2357. [email protected] .
Transcript of The Value of Banking Relationships During a Financial Crisis

The Value of Banking Relationships During a Financial Crisis: Evidence from Failures of Japanese Banks
Elijah Brewer III
Federal Reserve Bank of Chicago
Hesna Genay Federal Reserve Bank of Chicago
William Curt Hunter Federal Reserve Bank of Chicago
George G. Kaufman Loyola University Chicago
and Federal Reserve Bank of Chicago
March 1, 2002 This version August 26, 2002
Preliminary Draft
Corresponding author: Hesna Genay, Federal Reserve Bank of Chicago, Economic Research, 230 S. LaSalle
Street, Chicago, IL 60604. Phone: (312) 322-5796; fax: (312) 322-2357. [email protected].

2
I. Introduction
Bank failures are theorized to have adverse consequences for other firms in general, and for
customers (both loan and deposit) of the failed institutions in particular. Other firms may be
adversely affected, whether customers of the failed bank or not, because the failure may signal
existing but yet unrecognized problems at other banks or ignite problems at other banks through
spillover or contagion, and foretell adverse economic conditions for the economy in the region or
nationwide. Firms that are customers of the failed institution may be relatively more adversely
affected than firms that are customers of other banks because, among other things, they may lose an
ongoing source of funding and need to incur the expense of search and providing financial and other
information about themselves to new lenders. But all firms and bank customers may not be equally
affected by bank problems and failures. The effects may be related to characteristics of the
individual firm, such as its financial condition, reliance on bank credit, or industry. A number of
recent studies have provided empirical evidence that bank problems and failures adversely affect the
market value of a bank’s corporate borrowers, both in the United States and a number of other
countries (Slovin, Sushka, and Polonchek, 1993; Yamori and Murakami, 1999; Djankov, Jindra, and
Klapper, 2001; Bae, Kang, and Lim, 2002; Ongena, Smith, and Michalsen, forthcoming). This paper
contributes to the literature both by providing evidence on the effects of bank failures on the banks’
loan customers in another country—Japan—and by examining whether the adverse effects on the
failed bank’s customers differ from those of other, noncustomers.
This study finds that, as in previous studies, the market value of customers of the failed banks
are adversely affected at the date of the failure announcements. In addition, the effects are related to
the financial characteristics of the client firms. For nonfinancial firms that have a less valuable
banking relationship, the less severe the adverse impact. However, we find that these effects are not
3
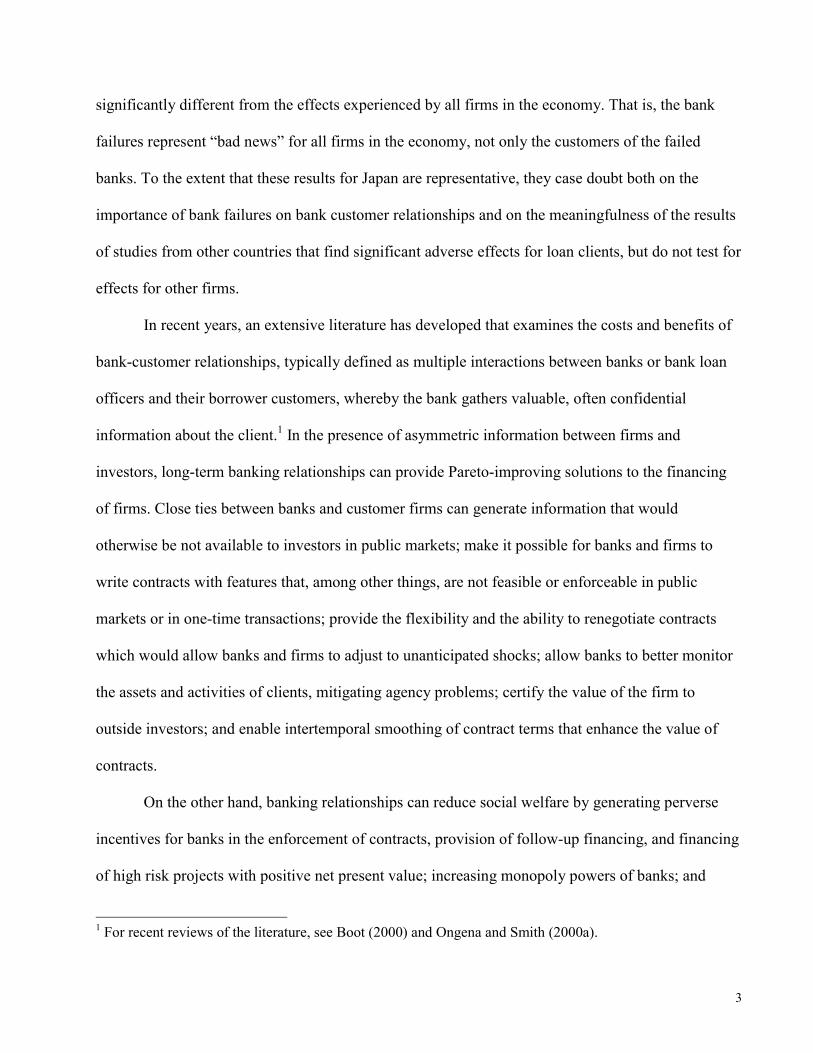
significantly different from the effects experienced by all firms in the economy. That is, the bank
failures represent “bad news” for all firms in the economy, not only the customers of the failed
banks. To the extent that these results for Japan are representative, they case doubt both on the
importance of bank failures on bank customer relationships and on the meaningfulness of the results
of studies from other countries that find significant adverse effects for loan clients, but do not test for
effects for other firms.
In recent years, an extensive literature has developed that examines the costs and benefits of
bank-customer relationships, typically defined as multiple interactions between banks or bank loan
officers and their borrower customers, whereby the bank gathers valuable, often confidential
information about the client.1 In the presence of asymmetric information between firms and
investors, long-term banking relationships can provide Pareto-improving solutions to the financing
of firms. Close ties between banks and customer firms can generate information that would
otherwise be not available to investors in public markets; make it possible for banks and firms to
write contracts with features that, among other things, are not feasible or enforceable in public
markets or in one-time transactions; provide the flexibility and the ability to renegotiate contracts
which would allow banks and firms to adjust to unanticipated shocks; allow banks to better monitor
the assets and activities of clients, mitigating agency problems; certify the value of the firm to
outside investors; and enable intertemporal smoothing of contract terms that enhance the value of
contracts.
On the other hand, banking relationships can reduce social welfare by generating perverse
incentives for banks in the enforcement of contracts, provision of follow-up financing, and financing
of high risk projects with positive net present value; increasing monopoly powers of banks; and
1 For recent reviews of the literature, see Boot (2000) and Ongena and Smith (2000a).

4
isolating both customer firms and their banks from timely market discipline and corporate
governance.
The value of banking relationships is likely to change when the banking system as a whole is
experiencing problems, particularly if there are few alternatives to bank financing. For instance,
bank failures can forcefully sever or limit valuable banking relationships. At the same time, the
value of an existing ongoing relationship with a healthy bank can be higher during a financial crisis
since firms would have limited financing options from alternative sources. On the other hand, banks
might make sub-optimal decisions during a financial crisis regarding termination of loan contracts
and allow insolvent firms continue to operate in order to reduce the reported amount of
nonperforming loans on their books or to inflate their reported capital. “Evergreening” of loans
during the savings and loan crisis in the U.S. and repeated restructuring of loans to insolvent
Japanese firms in recent years are some examples of such sub-optimal termination decisions.
Problems in the banking sector can also result in fewer profitable investments by firms that are
highly dependent on bank financing.
A number of papers provide empirical evidence on the costs and benefits of banking
relationships. James (1987), Billett et. al. (1995), and Lummer and McConnell (1989) report a
special role of banks in lowering the cost of capital for firms with limited access to alternative
sources of financing. Petersen and Rajan (1994), Berger and Udell (1995), and Cole (1998) find the
value of banking relationships to small businesses in the U.S., which typically face greater
information problems than larger firms and have limited access to public capital markets to be
particularly important. Several papers present evidence on the value and the nature of banking
relationships in other countries where banks play a greater role in financing of firms than in the
United States. Hall and Weinstein (2000), Hoshi, Kashyap, and Scharfstein (1990 and 1991), Kaplan

5
and Minton (1994), Kang and Shivdasani (1995), Morck and Nakamura (1999), Morck, Nakamura,
and Shivdasani (2000) and Weinstein and Yafeh (1998) focus on banking relationships in Japan.
Degryse and Van Cayseele (2000), Detragiache et. al. (2000), Elsas and Krahnen (1998), Foglia et.
al. (1998), and Ongena and Smith (2000b), examine banking relationships in Europe. These studies
provide evidence that banking relationship enhance firm value by generating exchange of
information that facilitates finance, provide corporate governance, enable intertemporal smoothing
of loan prices, and provide liquidity insurance to borrowers during periods of financial distress.
However, the studies also present evidence that banking relationships can, at times, involve costs, in
terms of lower growth experienced and higher interest rates paid by firms with close banking
relationships.
Several other papers focus on the effects of problems or failures of individual banks or
multiple banks on banking relationships. Chiou (1999) reports that Japanese firms that were Daiwa
Bank customers suffered negative excess returns following the announcement of Daiwa’s trading
scandal in 1995. Gibson (1995 and 1997) shows that investments at bank-dependent Japanese firms
were lower for firms with lower-rated main banks. Kang and Stulz (2000) provides evidence that
Japanese firms that were more dependent on Japanese bank loans performed relatively better when
their banks were doing well in the 1980s and more poorly when their banks were performing poorly
in the 1990s after the bubble in asset prices collapsed.
Slovin, Sushka, and Polonchek (1993) examine the stock price reactions of client firms of
Continental Illinois Bank during its period of economic insolvency leading up to its bailout by the
FDIC in 1984. They find that firms with known lending relationships with Continental Illinois
experienced significantly negative abnormal returns during the banking firm’s financial difficulties
before its resolution but significant positive returns at the announcement of the bailout by the FDIC.

6
However, the positive abnormal returns over the bailout event window were smaller than the
aggregate negative abnormal returns over the event period immediately before the bailout. As a
result, Continental loan client firms experienced significant negative abnormal returns on average as
a result of the banking firm’s financial distress. Yamori and Murakami (1999) extend Slovin,
Sushka, and Polonchek (1993) approach to the failure of a Japanese bank—Hokkaido Takushoku
Bank in 1997. The authors find that firms that listed the failed bank as their most important bank
experienced the largest negative stock market reaction at the bank failure announcement. Djankov,
Jindra, and Klapper (2001) also extend Slovin, Sushka, and Polonchek (1993) by examining the
stock market valuation effect of the insolvency of 31 banking organizations in East Asia (Indonesia,
Korea, and Thailand) on borrowing firms. They report that a bank’s insolvency announcement,
preceding liquidation, led to a significant negative stock market reaction. On the other hand,
nationalization announcements, preceding recapitalization and new management, are associated with
positive abnormal returns.
Bae, Kang, and Lim (2002) examine the durability of bank relationships in Korea. They find
that bank financial distress is associated with negative abnormal returns for client firms, and the
announcement effects are greater for the bank-dependent and financially weak firms of the weakest
banks. This suggests that the combination of bank and borrowing firms conditions determines the
impact of bad news about a bank on its customers. Ongena, Smith, and Michalsen (forthcoming)
examine impact of bank distress announcements in Norway on bank client firms. The authors find
that the impact of these announcements on bank client firms were small and temporary and did not
statistically differ from their impact on unrelated firms. The authors also find that more liquid
firms—as measured by access to unused bank funds and equity issues prior to the banking crisis—
had higher abnormal returns.

7
We add to this literature in this paper by examining the impact of the failure of three large
Japanese banks in 1997 and 1998 on the market valuation of nonfinancial firms. Following Slovin,
Sushka, and Polonchek (1993), we estimate the impact of the failure announcements on the market
valuation of the client firms of the failed banks. We extend the analysis, however, by also estimating
the impact of the failure announcements on all firms including the clients of surviving banks. Most
previous studies have not analyzed this aspect of bank financial distress.2 By also examining the
stock valuation of the failure announcements for firms that did not have relationships with the failed
institutions, we can identify any differences in the effects on clients and non-clients of the failed
banks. This is particularly important in order to verify whether any effects estimated for the failed
banks’ customers reported in the previous studies differ from those experienced by all bank
customers. In addition, we relate the estimated abnormal returns for both sets of nonfinancial firms
to variables that captures the value of banking relationships. Prior studies suggest that the value of
banking relationships should depend on firm characteristics, such as the ability to access alternative
sources of funding, profitability, and investment opportunities. The stronger the financial health of a
firm, the less severe its stock market reaction should be at the announcement of a bank failure.
Therefore, if bank failures weaken or destroy valuable banking relationships and this effect is
reflected in the abnormal returns, we should observe an inverse correlation between firm
characteristics that increase the value of banking relationships and the magnitude of the effect of the
failure announcements on the market value of firms.
2 To the best of our knowledge, Ongena, Smith, and Michalsen (forthcoming) is the only other study that
examines the impact of large bank distress on clients of other banks. Slovin, Sushka, and Polonchek (1993) examine whether the type of lending arrangement (providing a direct loan, or being the lead syndicator versus participating in another’s bank loan) determines the magnitude of the client firm’s stock market reaction at a bank’s financial distress announcement. They find that direct or lead lending relationships have a greater negative impact on abnormal returns than participating in other banks’ loans.

8
The next section of this paper describes how bank failures can potentially influence the stock
market value of bank borrowers and other firms. The third section describes the data and
methodology. The empirical results for the effects of the bank failures on their loan customers and
other firms is reported in section four. The final section summarizes the findings and offers
conclusions. The Appendix provides a brief overview of the events leading up to the three failures.
II. The Impact of the Failures
We examine the market response at the failure announcements of three important Japanese
banks in 1997 and 1998—Hokkaido Takushoku Bank on November 17, 1997, the Long-Term Credit
Bank of Japan (LTCB) on October 23, 1998, and the Nippon Credit Bank (NCB) on December 13,
1998. A defining characteristic of all these three failures was that the magnitude of bad loans and
valuation losses previously disclosed by the failed institutions had been significantly understated,
concealing the true extent of their problems. The release of this new information might call into
questions the availability of funds for client firms, especially for those experiencing financial distress
and/or those that use bank loan agreements as a major source of liquidity and certification of value.
Second, the failures might also have signaled a regulatory shift to increased probability of closure in
the future, particularly for the riskier banks (Brewer et. al., forthcoming; Spiegel and Yamori, 2000).
In either of these cases, if banking relationships enhance the value of bank clients, we would expect
clients of both announcing and surviving banks to be adversely affected by the failures.
Third, the three failures revealed a significant change in the institutional and government
support structure of Japanese financial institutions. Traditionally, weak or troubled institutions could
previous rely on implicit and explicit government support, capital injections and new loans from
financially or otherwise affiliated companies, or “rescue mergers” with a stronger institution. The
unwillingness of other banks to provide support suggests that the financial distress might extend
9
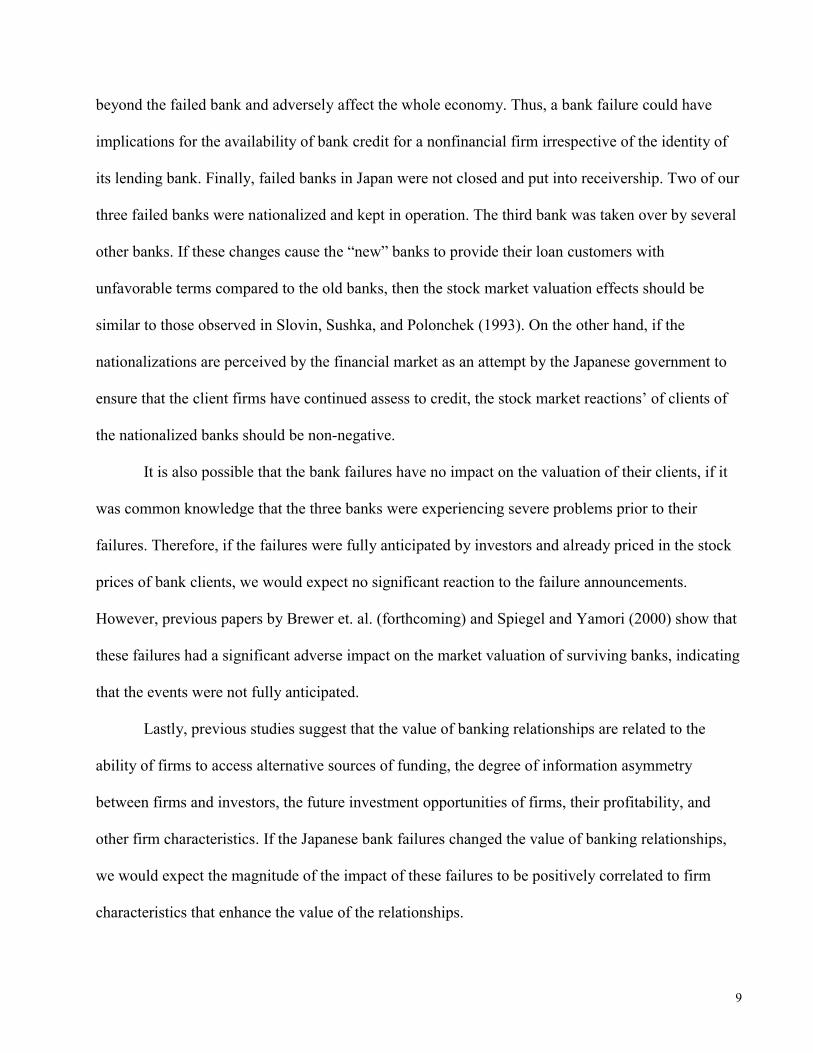
beyond the failed bank and adversely affect the whole economy. Thus, a bank failure could have
implications for the availability of bank credit for a nonfinancial firm irrespective of the identity of
its lending bank. Finally, failed banks in Japan were not closed and put into receivership. Two of our
three failed banks were nationalized and kept in operation. The third bank was taken over by several
other banks. If these changes cause the “new” banks to provide their loan customers with
unfavorable terms compared to the old banks, then the stock market valuation effects should be
similar to those observed in Slovin, Sushka, and Polonchek (1993). On the other hand, if the
nationalizations are perceived by the financial market as an attempt by the Japanese government to
ensure that the client firms have continued assess to credit, the stock market reactions’ of clients of
the nationalized banks should be non-negative.
It is also possible that the bank failures have no impact on the valuation of their clients, if it
was common knowledge that the three banks were experiencing severe problems prior to their
failures. Therefore, if the failures were fully anticipated by investors and already priced in the stock
prices of bank clients, we would expect no significant reaction to the failure announcements.
However, previous papers by Brewer et. al. (forthcoming) and Spiegel and Yamori (2000) show that
these failures had a significant adverse impact on the market valuation of surviving banks, indicating
that the events were not fully anticipated.
Lastly, previous studies suggest that the value of banking relationships are related to the
ability of firms to access alternative sources of funding, the degree of information asymmetry
between firms and investors, the future investment opportunities of firms, their profitability, and
other firm characteristics. If the Japanese bank failures changed the value of banking relationships,
we would expect the magnitude of the impact of these failures to be positively correlated to firm
characteristics that enhance the value of the relationships.
10
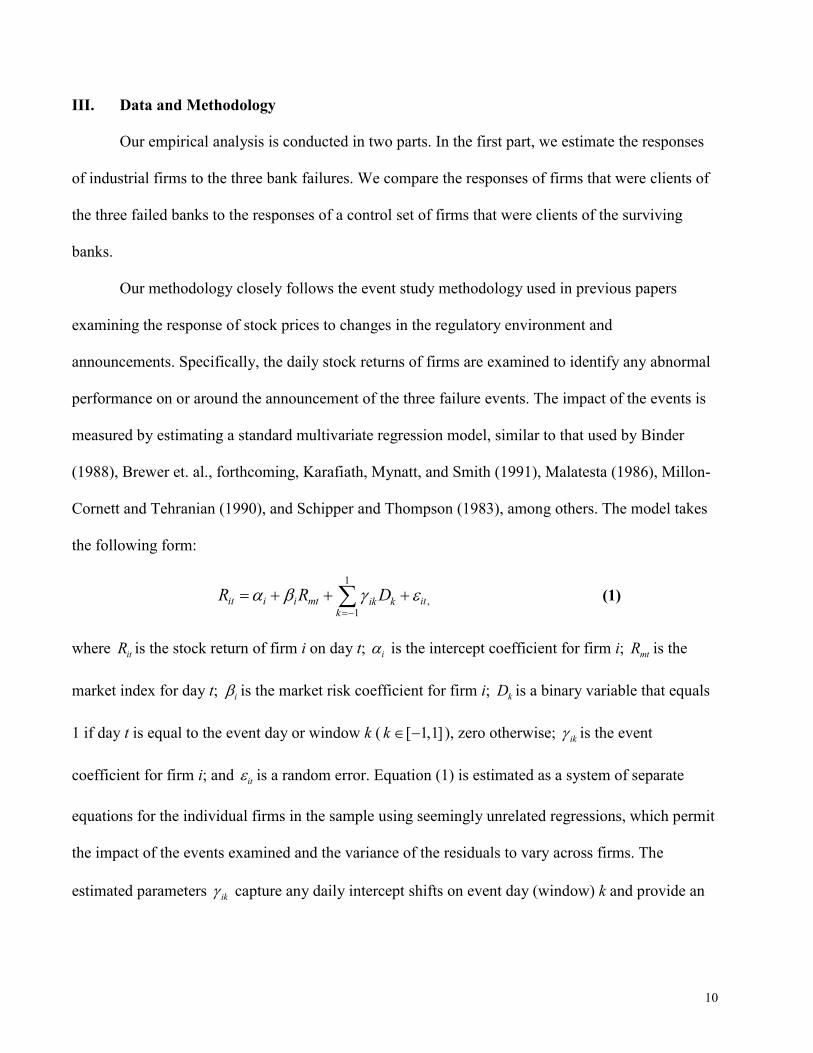
III. Data and Methodology
Our empirical analysis is conducted in two parts. In the first part, we estimate the responses
of industrial firms to the three bank failures. We compare the responses of firms that were clients of
the three failed banks to the responses of a control set of firms that were clients of the surviving
banks.
Our methodology closely follows the event study methodology used in previous papers
examining the response of stock prices to changes in the regulatory environment and
announcements. Specifically, the daily stock returns of firms are examined to identify any abnormal
performance on or around the announcement of the three failure events. The impact of the events is
measured by estimating a standard multivariate regression model, similar to that used by Binder
(1988), Brewer et. al., forthcoming, Karafiath, Mynatt, and Smith (1991), Malatesta (1986), Millon-
Cornett and Tehranian (1990), and Schipper and Thompson (1983), among others. The model takes
the following form:
1
,1
it i i mt itik kk
R R D� � � ���
� � � �� (1)
where itR is the stock return of firm i on day t; i� is the intercept coefficient for firm i; mtR is the
market index for day t; i� is the market risk coefficient for firm i; kD is a binary variable that equals
1 if day t is equal to the event day or window k ( [ 1,1]k � � ), zero otherwise; ik� is the event
coefficient for firm i; and it� is a random error. Equation (1) is estimated as a system of separate
equations for the individual firms in the sample using seemingly unrelated regressions, which permit
the impact of the events examined and the variance of the residuals to vary across firms. The
estimated parameters ik� capture any daily intercept shifts on event day (window) k and provide an

11
estimate of abnormal (excess or unexpected) returns associated with the failure announcement on
day (window) k.
The announcement dates of the three failures were obtained through a search of the Wall
Street Journal, Reuters news wire, Newscast news service, and the Knight Ridder business wire.
These include news articles from Japanese and other international news sources. All dates are
Japanese dates. If the failure announcement was made during a trading day in Japan, that date is used
as the event day [0]. If an announcement was made after the market was closed or over the weekend,
we use the next trading date as event date.3 For the Long-Term Credit Bank we used the date of the
first news stories that cited official government sources that the bank was in imminent danger of
being nationalized. Daily stock prices and returns were obtained from the University of Rhode
Island’s Pacific Basin Capital Markets Research Center (PACAP) 1999 database. Market returns are
measured by the TOPIX index, which includes seasoned shares of over 1,000 major companies (First
Section) traded on the Tokyo Stock Exchange, and were obtained from PACAP.
The values of the parameters in equation (1) are estimated daily over a sufficiently long
observation period before and after each event date to obtain meaningful results, but one short
enough not to be affected by the other events examined in the study. The length of these sample
periods—from 198 trading days before the first event date to 10 days after the last event date—
conforms closely to those used in previous studies (e.g., MacKinlay, 1997; Smirlock and Kaufold,
1987). However, because the two events in 1998 are reasonably close to one another, we use a
common estimation period for these events. To reduce the effects of specific events on subsequent
events in the common estimation period, equation (1) is modified so as to permit a shift in both the
3 Consequently, the event dates for LTCB (October 19, 1998) and NCB (December 14, 1998) differ from the
announcement dates.

12
intercept (�) and the market index coefficient (�) after the first failure in each estimation period as
follows (Binder and Norton, 1999):
1
,, ,1
it i i mt i i mt itik e k ee k
R R P PR D� � � � � ���
� � � � � �� � (1’)
where e is the number of events in 1998 (e =2), and P is a binary variable that identifies post-event
periods; i.e., P is equal to 1 after the LTCB failure, zero otherwise.
We examine the individual firms’ estimated daily abnormal returns— ik� —for each event
for two groups of firms: the clients of failed banks and the control group of the clients of surviving
banks. To ensure that the estimates of parameters in equations (1) and (1’) are based on sufficient
data, we exclude from our sample any firm that did not have daily stock returns for at least one-half
of the estimation period. Following Gibson (1995 and 1997) and Yamori and Murakami (1999), we
identify the clients of the three failed banks from the Autumn 1997 and Autumn 1998 issues of the
Japan Company Handbook (JCH), which identifies the banks used by each company. We identify
firms as clients of a failed bank if the failed bank appears anywhere on the bank list, irrespective of
its rank.4 All other firms included in the 1999 PACCAP database are identified as the clients of the
surviving banks and are grouped in the control sample. Some firms are identified as clients of both
the LTCB and NCB. Our sample for the failure of Hokkaido Takushoku Bank in 1997 includes 70
firms identified as clients of the failed bank and 1,214 firms identified as clients of surviving banks.
For the failures in 1998 the sample includes 197 firms that were clients of LTCB only, 60 firms that
4 Yamori and Murakami (1999) note that firms typically list the most important bank first. Thus, we also replicate our analysis under more conservative definitions of a client. Specifically, we identify firms as clients of a failed bank if the failed bank is among the top three banks in the list, and alternatively, if the failed bank is the first bank in the list.

13
were clients of NCB only, 29 firms that were clients of both LTCB and NCB, and 926 firms that
were clients of the surviving banks.5
If the failures of the three banks severed or limited valuable banking relationships and had
unanticipated negative implications for the value of the firms, we would expect the abnormal returns
of client firms during the event window to be negative and statistically significant. If the events
revealed no new information or were considered irrelevant by the shareholders of firms, the
abnormal returns would be statistically indistinguishable from zero. To distinguish among the two
scenarios, we test the hypothesis 10H , that the cross-sectional average of individual abnormal returns
for the clients of the failed banks is equal to zero for each event, e, i.e.,
1
,11
10
1: 0N
i eiN
H �
�
��
where 1N is the number of clients of the failed bank.
We also conduct similar tests for the clients of surviving banks in the sample to determine if
the failures had a significant impact on the stock market valuations of these firms. That is, we test
the hypothesis:
2
,12
20
1: 0N
j ejN
H �
�
��
where 2N is the number of firms that were clients of surviving banks.
5 It is possible that our samples are subject to selection bias if firms with certain characteristics, for instance
firms that are in relatively better financial condition, broke off their relationships with weak banks prior to their failure. We checked for the possibility of this type of selection bias by examining the bank lists of a random sample of firms three years prior to the failure dates. It appears that banking relationships in Japan as reported in the Japan Company Handbook are very stable. There were no instances in our random check where the identities of the banks in the list three-years prior to the failure were different from those one year prior to the failure.

14
To determine whether the abnormal returns of the failed-bank clients are the same as those of
the clients of surviving banks, we test the hypothesis that the average abnormal return for the clients
of the failed banks equals the average abnormal return of the clients of the surviving banks. That is,
we test the hypothesis:
1 2
30
1 11 2
1 1:N N
i ji j
HN N
� �
� �
�� �
In addition, we examine the cross-sectional median of abnormal returns and test the
hypothesis that the number of firms with negative abnormal returns is equal to 50 percent of each
sample against the alternative hypothesis that the number of firms with negative abnormal returns
comprise more than 50 percent of the sample. A rejection of the null hypothesis for clients of the
failed banks would be consistent with the hypothesis that the failures resulted in the severance of
valuable banking relationships. A rejection of this hypothesis for client firms of surviving banks
would be consistent with the hypothesis that the failures had negative spill-over effects on the
remainder of the economy or revealed adverse information about the surviving banks and/or their
clients.
Lastly, we test the hypothesis that the clients of the failed and surviving banks belong to
populations with the same distribution using the Mann-Whitney-Wilcoxon test. A rejection of this
hypothesis would be consistent with the notion that the failures had a different impact on the clients
of the failed banks than on the rest of the economy.
In the second part of our analysis, we examine whether the abnormal returns estimated for
the firms are related to their financial characteristics. To do this, we pool the abnormal returns for
the three-day event window [-1, +1] for each firm, [ 1,1],i��
, across all three events. Hence, the final
sample can include up to three observations for each firm: one measuring the firm’s abnormal

15
returns at the failure of announcement of Hokkaido Takushoku Bank, and two other observations for
the firm’s abnormal returns at the failure announcements of LTCB and NCB.
We then relate these abnormal returns to variables that capture the value of banking
relationships and a set of control variables as follows:
[ 1, 1], ,( ) ( )i i i i i i i i j j itj
COND X CL CL x COND CL x X DIND� � � � � � � � � �
� � � � � � � �� (2)
where iCL is a binary variable that identifies the clients of the failed banks and is equal to one if firm
i is a client of the failed bank, zero otherwise; iCOND is a variable that describes the financial
condition of firm i at the time of the event; and iX is a vector of variables that control for other
characteristics of the firms. The interaction terms (CL x COND and CL x X) are included to examine
whether the abnormal returns of clients of failed banks are more sensitive to firm characteristics than
the abnormal returns of clients of surviving banks. Six industry binary variables (DIND) are
included in equation (2) to account for unobserved industry “fixed effects.”6
We estimate equation (2) using ordinary least squares with White’s (1980) adjustment for
heteroskedasticity.7 In our model, we use firm size as measured by total assets (TA), firm age (AGE)
and future profit opportunities as measured by the ratio of market value of assets to book value of
assets (TOBQ) as control variables and five alternative measures of the financial condition of firms:
the ratio of loans to total assets (LNS/TA); the ratio of book value of equity to total assets (EQ/TA);
the average return on assets over the previous five years (ROA); the average return on equity over
6 For a discussion of the existence of “other effects” in pooled cross-sectional time-series analysis see Balestra
and Nerlove (1966). 7 The models reported in the paper assumes that the financial condition of firms are exogenously determined.
As a robustness check, we relaxed this assumption and allowed the five variables measuring firm financial condition to be determined endogenously by the other three firm characteristics. In the following discussion of the results, we report any instances where the results from this instrumental variables estimation differed from the results reported in the paper.
16
the previous five years (ROE); and a measure of liquidity—the ratio of cash and securities to total
assets (LIQ).
Asset size serves as a proxy for the potential information asymmetries faced by firms when
seeking external financing (Petersen and Rajan, 1994). Larger firms are likely to be better known
among market participants and tend to have easier access to external financing.8 Hence we would
expect stock returns of larger firms to be less adversely affected by the bank failures. We include
firm age because previous research (Petersen and Rajan, 1994) suggests that older firms that have a
more established reputation tend to have easier access to external financing and hence be less
adversely affected by bank failures. A high ratio of market to book value of assets-- the Tobin’s Q—
suggests more growth opportunities. Barclay and Smith (1997) find that firms with more growth
opportunities have greater financing choices. Hence, we expect that firms with more growth
opportunities should be less affected by the loss of a banking relationship. To allow for nonlinear as
well as linear relationships between abnormal returns and AGE and TOBQ, we also specify their
squared terms, AGE2 and TOBQ2.
The ratio of loans (both from banks and other intermediaries) to total assets captures the
extent to which firms rely on intermediated credit for external funding. Firms with a greater amount
of intermediated credit are likely to be more bank dependent and thus, less able to find new external
sources of financing. We expect that the abnormal returns should be negatively correlated with the
ratio of loans to total assets.
The capitalization ratio measures firm leverage. Higher leveraged firms are perceived as
more risky. In addition, given the adverse selection problem associated with external financing, a
8 The correlation between asset size and access to external financing is likely to be stronger in Japan where
some of the eligibility requirements for issuing corporate bonds on the capital market are based on firm size.

17
highly levered nonfinancial firm may face higher interest costs and/or other fees to replace an
existing banking relationship or obtain another external monitor after the failure of the bank with
which it has a relationship. Thus, the capitalization ratio should be positively correlated with
nonfinancial firms’ abnormal returns.
We use two profitability measures to capture firm performance: return on assets (net income
divided by book value of total assets) and return on equity (net income divided by book value of
equity), averaged over the five years prior to the failures. More profitable firms should have more
financing options. We expect that firms with greater profitability should be less negatively affected
by the loss of a banking relationship or bank financial distress in general.
The ratio of cash plus investment securities to total assets measures the firm’s liquidity or
amount of internal funds available to the firm. Firms with relatively more internal funds should be
less dependent on external financing, and, therefore, less affected by bank failures. Because the
financial condition variables are highly correlated, we specify only one at a time in estimating
equation (2).
All variables on the financial condition and other characteristics of firms were obtained from
the PACAP 1999 database and are measured as of the end of the fiscal year prior to each failure.
If the failure events had a significant impact on the stock market valuation of the firms
which was systematically related firms financial characteristics, we would expect the coefficients � ,
� , �, and � in equation (2) to be significantly different from zero. Our primary concern is the
coefficients � and � on the COND and CL x COND variables, respectively. In the empirical section,
we test the hypotheses
40 : 0H � �� �
for the clients of the failed banks, and

18
50 : 0.H � �
for the clients of the surviving banks.
To determine whether the relationship between abnormal returns and financial characteristics
of firms differed systematically across clients of failed and surviving banks, we also test the
hypothesis:
60 : 0.H � �
IV. Empirical results
Table 1 provides estimates of abnormal returns for several portfolios of bank customers at the
announcement dates of the three bank failures. Estimates reported are the mean and median of the
individual equations of each firm. Separate results are reported for bank customers that are clients of
one of the three failed banks and clients of one of the surviving banks. For the LTCB and NCB
failures, we also report results for a portfolio of bank customers that list both failed banks as their
primary banks. Thus, there are five different failed bank client portfolios (3 single failed banks and 2
multiple failed banks) and three surviving bank client portfolios. Table 1 also provides test statistics
for three hypotheses for all three failure events: 1) that the abnormal returns for the portfolio of
client firms equal to zero for each event; 2) that the portfolio abnormal returns of failed bank clients
are equal to that of surviving bank clients; and 3) that 50 percent of the failed banks’ client firms
have negative abnormal returns on and around each of the three events. The first column of table 1
reports the results of the estimated abnormal returns of individual firms for day [-1] of each event
window. The second column reports the estimates for day [0] of the event window. The third column
reports the estimates for day [+1], and the fourth column reports the results for the [-1, +1] window.
Of the 20 estimated abnormal mean returns of the failed bank clients (four event windows for
five different failed bank client portfolios), 15, or 75 percent, have the expected signs but only 8 are

19
statistically significant. Do these effects significantly different from those of clients of surviving
banks? The results in table 1 suggest that they are not. Of the 12 estimated abnormal returns of the
surviving bank clients, 9, or 75 percent, have the expected negative sign and all are statistically
significant. The statistics in the rows labeled “T-test for equality of means” test the hypothesis that
the impact of the announcements was equal across the two different client portfolios. None of the
test statistics allow us to reject this hypothesis for any of the event windows. A similar conclusion is
obtained using the “Wilcoxon” test of the hypothesis that the failed bank client firm and surviving
bank client firm samples are from populations with the same distribution. This suggests that bank
failures have meaningful adverse effects on the stock market valuation of surviving as well as failed
bank client firms.
The median abnormal return for failed bank clients over the three day [-1, +1] window was
negative for each of the five portfolios. To determine whether client firms with negative abnormal
returns statistically outnumbered those with positive returns, we computed the proportion of positive
abnormal returns minus 0.5 divided by the standard deviation of a binomial distribution (the “sign
test”). For the [-1, +1] window, the sign test indicates that the number of client firms with negative
abnormal returns exceeded those with positive returns in 4 of the 5 cases for failed bank sample of
firms. The sign test shows that the number of client firms of surviving banks with negative abnormal
returns exceeded those with positive returns in all three cases. Thus, our results suggest that bank
failures serve as bad news for all firms in the economy, not just those of failed banks. Because the
whole banking sector in Japan was experiencing financial distress during the 1990s, bank
dependence is costly for all firms regardless of the identity of their primary bank (Kang and Stulz,
2000).

20
Cross-section tests of the relationship between firms financial characteristics and abnormal returns
Failure announcements need not have equal effects on all bank client firms. Indeed, theory
suggests that the announcement effects should be related to the financial and other characteristics of
the firms. In this section we explore this relationship by examining the cross-sectional correlation
between the individual failed bank client firm abnormal returns and its financial characteristics.
Table 2 provides summary statistics for the financial and other variables that we use in estimating
the cross-section regression equation. For the Hokkaido Takushoku Bank, there appears to be no
statistically significant differences in capitalization, dependence on intermediated debt, profitability,
liquidity, and age, between firms that are clients of the failed bank and those that are clients of
surviving banks. However, client firms are smaller and have fewer future profit opportunities (as
measured by Tobin’s Q) than clients of other banks.
On the other hand, there are more significant differences between the characteristics of
clients of LTCB and NCB and clients of surviving banks. As indicated in panel B of table 2, failed
bank client firms are larger, less capitalized, more dependent on intermediated debt, are less
profitable, and less liquid. There are, however, no significant differences between failed bank client
firms and surviving bank client firms in terms of future profit opportunities and age. A comparison
of the clients of LTCB and NCB separately (“Clients of LTCB only, “Clients of NCB only,” and
“Clients of both banks”) indicates that, except for size, the significant differences persist in these
smaller client groups as well.
Regressions of abnormal returns on client firms financial characteristics
The cross-section regression results are reported in table 3.9 The five panels in the table
report the results of estimating equation (2) with one of the five alternative measures of the financial
9 Industry binary variables are not included in table 3. The results are available from the authors upon request.

21
condition of firms. In each panel, columns one and two report the coefficient estimates for client
firms of failed and surviving banks, respectively. Column three reports the significance levels for the
test that the coefficients for clients of failed and surviving banks are equal.
If bank failure adversely affects valuable relationships, we should expect variables positively
correlated with information problems, and hence bank dependence, to be negatively correlated with
abnormal returns. Furthermore, we would expect the correlation to be stronger for failed bank client
firms.
The results in table 3 are broadly consistent with the prediction that firms for which banking
relationships are more valuable suffer more at announcement from the failure of their bank. Clients
of failed banks that relied more on intermediated debt, those that were less profitable, or less
capitalized had more negative reactions to the failure announcements. For the ratio of intermediated
to total debt and return on assets, these effects were statistically significant.
Similarly, client firms of surviving banks for which banking relationships are likely to be
more valuable experienced more negative abnormal returns at announcement of the three bank
failures. In particular, firms that relied more heavily on intermediated debt, those that had lower
capital ratios, and lower profitability as measured by ROA and ROE had significantly lower
abnormal returns.
However, in none of the five models, can we reject the hypothesis that the coefficients on the
COND variables for the clients of failed banks and surviving banks are equal. Hence, the results
show no support for the prediction that the relationship between abnormal returns and financial
characteristics is stronger for the clients of failed banks.
The coefficients on the control variables (TA, AGE, TBQ) indicate that firm size is positively
and significantly correlated with the abnormal returns of the failed bank clients in all five models.

22
Hence, consistent with our predictions, larger clients suffered less from the failure of their banks.
Moreover, we can reject the hypothesis that the correlation between size and abnormal returns for
the clients of failed and surviving banks is equal in all five models. The magnitudes of the
coefficients on firm size for the two groups indicate that the abnormal returns of the failed-bank
clients are two to three times as large as those of the surviving-bank clients. These results suggest
that clients of failed banks that had greater access to external financing experienced less severe stock
market reactions to the failure announcements than the clients of surviving banks with similar
access.
The sign and magnitude of coefficients for AGE and its squared term in table 3 indicate that
older firms suffered less from the failure announcements than younger firms, consistent with our
expectations. In most cases, the coefficient on AGE is negative and significant and the coefficient on
AGE2 is positive and significant. When one calculates the marginal effect of age on abnormal
returns, the age at which the relationship between abnormal returns and age turn from negative to
positive ranges between 17 and 36 years. Hence, for young firms (less than 36 years old at most),
abnormal returns are negatively correlated with age. However, for mature firms (more than 36 years
old), abnormal returns are positively correlated with age. Since the sample mean for age is about 55
years, for most of the firms in the sample, the net impact of AGE is positive.
Firms’ future profit opportunities, as measured by TOBQ and its squared term, do not have
any statistical significance in explaining the cross-sectional variation in the abnormal returns of
failed bank clients. On the other hand, consistent with our predictions, clients of surviving banks that
had more future opportunities were less severely affected by the failure announcements, but this
effect was declining in the level of TOBQ.

23
Overall, the results in table 3 show support for the hypothesis that the abnormal returns of
firms at the announcement of the three bank failures are correlated with the financial and other
characteristics of firms. Moreover, the directions of these correlations are consistent with our
predictions. However, table 3 offers no evidence that the relationship between firm characteristics
and abnormal returns is stronger for the clients of failed banks relative to the clients of surviving
banks. Hence, the three failures had a more sever adverse impact on the valuations of all client firms
for which banking relationships are more valuable, regardless of the identity of their banks.
V. Conclusions
Bank failures are theorized to have adverse consequences for other firms, particularly if these
firms are clients of the failed institutions. A number of recent studies have provided empirical
evidence that bank problems and failures adversely affect the market value of a bank’s corporate
bank borrowers, both in the United States and a number of other countries. This paper contributes to
the literature both by providing evidence on the effects of bank failures on the banks’ loan customers
in another country—Japan—and by examining whether the adverse effects on the failed bank’s
customers differ from those on the clients of surviving banks.
We examine the stock market reaction of over 1,000 Japanese firms to the failure of
announcements of the Hokkaido Takushoku Bank in 1997, the Long-Term Credit Bank of Japan and
the Nippon Credit Bank in 1998. We find that, as in previous studies, the market value of customers
of the failed banks are adversely affected at the date of the failure announcements. In addition, the
effects are related to the financial characteristics of the client firms. Firms that have greater access to
alternative sources of funding experience a less severe adverse impact from bank failure
announcements. However, we find that these effects are not significantly different from the effects

24
experienced by all firms in the economy. That is, the bank failures represent “bad news” for all firms
in the economy, not just for the customers of the failed banks.

25
References
Bae, Kee-Hong, Jun-Koo Kang, and Chan-Woo Lim (2002) “The Value of Durable Bank Relationships: Evidence from Korean Banking Shocks” Journal of Financial Economics 64, 181–214.
Balestra, Pietro and Marc Nerlove (1966) "Pooling Cross-Section and Time-Series Data in Estimation of a
Dynamic Model: The Demand for Natural Gas" Econometrica 34, 585–612. Barclay, M. and C. Smith (1995) “The Maturity Structure of Corporate Debt” Journal of Finance 50, 609–
631. Berger, Allen and Gregory F. Udell (1995) “Relationship Lending and Lines of Credit in Small Firm Finance”
Journal of Business 68, 351–381. Billet, M. M. J. Flannery, and J.A. Garfinkel (1995) “The Effect of Lender Identity on a Borrowing Firm’s
Equity Return” Journal of Finance 50, 699–718. Binder, John J. (1988) “The Sherman Antitrust Act and the Railroad Cartels,” Journal of Law and Economics
31(2), 443–467. _____ (1998) “The Event Study Methodology Since 1969,” Review of Quantitative Finance and Accounting
11(2), 111–137. Binder, John J., and Seth W. Norton. (1999) “Regulation, Profit Variability and Beta,” Journal of Regulatory
Economics 15, 249–265. Boot, Arnoud W. (2000) “Relationship Banking: What Do We Know?” Journal of Financial Intermediation
9, 7–25. Brewer, Elijah III, Hesna Genay, William Curt Hunter, and George G. Kaufman. (forthcoming) “Does the
Japanese Stock Market Price Bank Risk? Evidence from Financial Firm Failures” Journal of Money, Credit, and Banking (forthcoming).
Chiou, Ingyu. (1999) “Daiwa Bank’s Reputational Crisis: Valuation Effects on Bank-Firm Relationships,”
manuscript, New York University. Cole, Rebel A. (1998) “The Importance of Relationships to the Availability of Credit” Journal of Banking
and Finance 22, 959–977. Degryse, Hans and Patrick Van Cayseele (2000) “Relationship Lending within a Bank-Based System:
Evidence from European Small Business Data” Journal of Financial Intermediation 9, 90–109. Detragiache, Enrica, Paolo Garella, and Luigi Guiso (2000) “Multiple versus Single Banking Relationships:
Theory and Evidence” Journal of Finance 55, 1133–1161. Djankov, Simeon, Jan Jindra, and Leora Klapper, 2001, “Corporate valuation and the resolution of bank
insolvency in East Asia, unpublished working paper, World Bank. Elsas, Ralf and Jan Pieter Krahnen (1998) “Is Relationship Lending Special? Evidence from the Credit-File
Date in Germany” Journal of Banking and Finance 22 (10–11), 1283–1316.
26
Foglia, A., S. Laviola, and P. Marullo Reedtz. (1998) “Multiple Banking Relationships and the Fragility of Corporate Borrowers,” Journal of Banking and Finance 22 (10–11), 1441–56.
Gibson, Michael S. (1995) “Can Bank Health Affect Investment? Evidence from Japan” Journal of Business
68, 281–308. _____ (1997) “More Evidence on the Link Between Bank Health and Investment in Japan” Journal of the
Japanese and International Economies 11, 296–310. Hall, Brian J. and David Weinstein (2000) “Main Banks, Creditor Concentration, and the Resolution of
Financial Distress in Japan” In Masahiko Aoki and Gary Saxonhouse, eds., Finance, Governance, and Competitiveness in Japan. New York: Oxford University Press, 64–80.
Hoshi, Takeo, Anil Kashyap, and David Scharfstein (1990) “The Role of Banks in Reducing the Costs of
Financial Distress in Japan” Journal of Financial Economics 27, 67–88. ____ (1991) “Corporate Structure, Liquidity, and Investment: Evidence from Japanese Industrial Groups.”
Quarterly Journal of Economics 106, 33–60. James, Christopher (1987) “Some Evidence on the Uniqueness of Bank Loans” Journal of Financial
Economics 19, 217–235. Kang, Jun-Koo and Anil Shivdasani (1995) “Firm Performance, Corporate Governance, and Top Executive
Turnover in Japan” Journal of Financial Economics 38, 29–58. Kang, Jun-Koo, and Rene M. Stulz. (2000) “Do Banking Shocks Affect Borrowing Firm Performance? An
Analysis of the Japanese Experience,” Journal of Business 73(1), 1–23. Kaplan, Steven N. and Bernadette Minton (1994) “Appointments of Outsiders to Japanese Corporate Boards:
Determinants and Implications for Managers” Journal of Financial Economics 36, 225–258. Karafiath, Imre, Ross Mynatt, and Kenneth L. Smith. (1991) “The Brazilian Default Announcement and the
Contagion Effect Hypothesis,” Journal of Banking and Finance 15(3), 699–716. Lummer, Scott L. and McConnell, John J. (1989) “A Further Evidence on the Bank Lending Process and the
Capital-Market Response to Bank Loan Agreements,” Journal of Financial Economics 25, 99–122. MacKinlay, A. Craig. (1997) “Event Studies in Economics and Finance,” Journal of Economic Literature
35(1), 13–39. Malatesta, Paul. (1986) “Measuring Abnormal Performance: The Event Parameter Approach Using Joint
Generalized Least Squares,” Journal of Financial and Quantitative Analysis 21(1), 27–38. Millon-Cornett, Marcia M. and Hassan Tehranian. (1990) “An Examination of the Impact of the Garn-St
Germain Depository Institutions Act of 1982 on Commercial Banks and Savings and Loan,” Journal of Finance 45(1), 95–111.
Morck, Randall and Masao Nakamura (1999) “Banks and Corporate Control in Japan” Journal of Finance 54,
319–339.

27
Morck, Randall, Masao Nakamura and Anil Shivdasani (2000) “Banks, Ownership Structure, and Firm Value in Japan” Journal of Business 73, 539–567.
Ongena, Steven and David C. Smith. (2000a) “Bank Relationships: A Review” in Performance of Financial
Institutions: Efficiency, Innovation, Regulation, Patrick T. Harker and Stavros A. Zenios (eds.). Cambridge; New York and Melbourne: Cambridge University Press, 221–258.
_____ (2000b) “What Determines the Number of Banking Relationships? Cross-Country Evidence” Journal
of Financial Intermediation 9, 26–56. Ongena, Steven, David C. Smith, and Dag Michalsen. (forthcoming) “Firms and their Distressed Banks:
Lessons from the Norwegian Banking Crisis (1988-1991).” Journal of Financial Economics. Petersen, M. and R. Rajan (1994) “The Benefits of Lending Relationships: Evidence from Small Business
Data” Journal of Finance 49, 1367–1400. Schipper, Katherine and Rex Thompson. “The Impact of Merger-Related Regulations on the Shareholders of
Acquiring Firms,” Journal of Accounting Research 21 (1983), 184–221. Slovin, Myron B., Marie E. Sushka, and John A. Polonchek, (1993), “The value of bank durability: borrowers
as bank stakeholders,” Journal of Finance 48, 247–266. Smirlock, Michael and Howard Kaufold. “Bank Foreign Lending, Mandatory Disclosure Rules, and the
Reaction of Bank Stock Prices to the Mexican Debt Crisis,” Journal of Business 60(3) (1987), 347–364.
Spiegel, Mark M. and Nobuyoshi Yamori. “The Evolution of ‘Too-Big-To-Fail’ Policy in Japan: Evidence
from Market Equity Values,” Pacific Basin working paper series, Federal Reserve Bank of San Francisco (2000).
Weinstein, David E. and Yishay Yafeh (1998) “On the Costs of a Bank-Centered Financial System: Evidence
from the Changing Main Bank Relationships in Japan” Journal of Finance 53, 635–672. Yamori, Nobuyoshi and Akinobu Murakami (1999) “Does bank relationship have an economic value? The
effect of main bank failure on client firms,” Economics Letters 65, 115–120.

28
Table 1. Estimated of abnormal returns for failed and surviving bank client firms This table reports statistics for the distribution of abnormal returns for the clients of the three failed
banks and the control group. For each firm, excess return at event date k is the coefficient ik� in the following model, estimated by seemingly unrelated regression:
1
,1
i t i i m t i ti k kk
R R D� � � �� �
� � � ��
For the 1998 failures, the above market model is expanded to allow for post-failure shifts in both the alpha and market beta coefficients. The rows labeled “Mean” report the cross-sectional average of excess returns for the appropriate sample and test whether the mean excess return is significantly different from zero. The rows labeled “Median” report the median excess returns for the relevant sample and the significance level for the one-sided sign test H0: median =0 and Ha: median < 0. The two rows labeled “Wilcoxon test” and “T-test for equality of means” report tests for the equality of the distributions of excess returns for clients of the failed banks and the clients of surviving banks. The rows labeled “Wilcoxon test” reports the z-statistic and its significance level for the hypothesis that the failed bank clients and other bank clients are from populations with the same distribution. The rows labeled “T-test for equality of means” report the t-statistic for the equality of means across the two samples and its significance level. ‘***’, ‘**’, and ‘*’ indicate statistical significance at the 1%, 5%, and 10% levels, respectively.
Panel A. Hokkaido Takushoku Bank failure (November 17, 1997)
Event windows -1 0 +1 [-1, +1]
Hokkaido Takushoku Bank client firms (N= 70) Mean 1.002** -0.733 -0.606 0.170 Median 0.517 -0.588* -0.858** -0.330
Surviving banks client firms (N= 1214) Mean 0.377*** -0.650*** -0.183 -0.115** Median 0.380 -0.629*** -0.266*** -0.034
Tests for client effects
Wilcoxon test -1.24 0.25 1.33 0.12 T-test for equality of means -1.64 -0.17 0.90 -0.57

29
Table 1. Estimated of abnormal returns for failed and surviving bank client firms (cont'd)
Panel B. LTCB failure (October 23, 1998)
Event windows -1 0 +1 [-1, +1]
LTCB client firms (N=197) Mean -2.288*** -0.471* -1.115*** -1.324*** Median -2.288*** -0.539** -1.203*** -1.156***
LTCB and NCB client firms (N=29) Mean -3.877*** 0.862 -0.159 -1.042 Median -3.502*** 0.451 -0.592 -1.744*
Surviving banks client firms (N= 926) Mean -2.142*** -0.611*** -0.913*** -1.226*** Median -2.061*** -0.728*** -1.013*** -1.185***
Tests for client effects, LTCB clients only Wilcoxon test 0.87 -1.02 1.25 0.38 T-test for equality of means 0.51 -0.59 0.43 0.85
Tests for client effects, both LTCB and NCB clients Wilcoxon test 2.23** -2.60*** -0.31 0.30 T-test for equality of means 2.53** -2.36** -1.20 -0.49
Panel C. NCB failure (December 14, 1998)
Event windows -1 0 +1 [-1, +1]
NCB client firms (N=60) Mean -0.163 0.118 -1.345*** -0.497** Median 0.279 -0.216 -0.532** -0.424**
LTCB and NCB client firms (N=29) Mean 0.460 -0.698 -1.228** -0.522 Median 0.501 -0.207 -1.328*** -0.364**
Surviving banks client firms (N=926) Mean -0.355*** -0.214 -0.454*** -0.342*** Median -0.312*** -0.212** -0.329*** -0.237***
Tests for client effects, NCB clients only Wilcoxon test -1.21 -0.25 1.78* 1.15 T-test for equality of means -0.47 -0.60 2.17** 0.78
Tests for client effects, both LTCB and NCB clients Wilcoxon test -1.79* 0.46 2.74*** 0.94 T-test for equality of means 1.40 0.61 1.35 0.64

30
Table 2. Summary statistics of financial characteristics for failed and surviving bank client firms
This table presents financial characteristics of failed and surviving bank client firms at the end of March of the each failure year. Failed bank clients are defined as firms that have Hokkaido Takushoku Bank, LTCB or NCB anywhere on the References list. Tobin’s Q is the ratio of firm market value (market value of equity plus total assets minus book value of equity) to total assets. ROA is net income divided by total assets, and ROE is net income divided by book value of equity. In the column labeled “mean,” ‘***’, ‘**’, and ‘*’ indicate statistical differences in the mean values of the variables for failed and surviving bank client firms at the 1%, 5%, and 10% levels, respectively.
Panel A. Hokkaido Takushoku Bank failure (November 17, 1997)
Mean St. Dev Min Max Total Assets (trillion yen)
All firms 0.27 0.65 0.00 11.18 Nonclients 0.27 0.67 0.00 11.18 Clients 0.14 0.18 0.01 1.04
Equity / Total Assets (%) All firms 42.40 20.01 -48.37 94.54 Nonclients 42.58 20.11 -48.37 94.54 Clients 39.34*** 18.20 2.83 77.61
Loans / TA (%) All firms 20.05 17.81 0.00 130.82 Nonclients 20.04 17.90 0.00 130.82 Clients 20.15 16.41 0.00 66.25
ROA (five-year average, %) All firms 1.19 2.31 -21.29 11.32 Nonclients 1.19 2.32 -21.29 11.32 Clients 1.03 2.05 -7.97 8.52
ROE (five-year average, %) All firms 1.88 7.24 -53.27 15.91 Nonclients 1.90 7.19 -53.27 15.91 Clients 1.45 8.11 -49.09 13.00
(Cash and Securities) / Total Assets (%) All firms 16.01 10.93 0.22 75.00 Nonclients 16.03 10.96 0.22 75.00 Clients 15.68 10.45 1.96 55.78
Tobin’s Q All firms 1.30 0.40 0.59 5.60 Nonclients 1.31 0.40 0.59 5.60 Clients 1.20*** 0.23 0.84 1.87
Age (years) All firms 55.84 16.58 9.00 116.00 Nonclients 55.91 16.70 9.00 116.00 Clients 54.74 14.31 17.00 83.00

31
Table 2. Summary statistics of financial characteristics for failed and surviving bank client firms (cont'd)
Panel B. LTCB and NCB failures (October 23, 1998 and December 14, 1998)
Mean St. Dev. Min. Max. Total Assets (trillion yen)
All firms 0.279 0.667 0.005 10.839 Nonclients 0.259 0.648 0.005 10.839 Clients 0.344* 0.719 0.005 7.025
LTCB clients only 0.386* 0.823 0.005 7.025 NCB clients only 0.231 0.378 0.012 1.892
Clients of both banks 0.290 0.418 0.032 1.904 Equity / Total Assets (%)
All firms 43.63 20.62 1.50 94.07 Nonclients 45.49 20.61 2.50 94.07 Clients 37.59*** 19.49 1.50 93.45
LTCB clients only 39.45*** 19.53 2.96 88.75 NCB clients only 34.54*** 17.64 6.27 93.45
Clients of both banks 31.22*** 21.25 1.50 82.06 Loans / TA (%)
All firms 20.12 18.37 0.00 83.41 Nonclients 17.74 17.32 0.00 78.09 Clients 27.83*** 19.56 0.00 83.41
LTCB clients only 26.51*** 18.99 0.00 83.41 NCB clients only 27.77*** 19.78 0.00 76.58
Clients of both banks 36.99*** 21.13 0.00 73.06 ROA (five-year average, %)
All firms 1.16 2.46 -32.86 10.69 Nonclients 1.24 2.57 -32.86 10.69 Clients 0.88** 2.04 -10.69 7.01
LTCB clients only 1.10 1.90 -5.45 7.01 NCB clients only 0.54 2.30 -10.69 5.29
Clients of both banks 0.08* 2.17 -5.64 5.23 ROE (five-year average, %)
All firms 1.57 7.63 -61.49 15.05 Nonclients 1.80 7.54 -61.49 15.05 Clients 0.84* 7.91 -49.39 11.21
LTCB clients only 1.57 7.05 -49.39 11.21 NCB clients only 0.77 7.28 -31.57 11.05
Clients of both banks -3.93*** 12.22 -39.96 7.22 (Cash and Securities) / Total Assets (%)
All firms 15.45 10.79 0.09 74.68 Nonclients 16.41 11.16 0.31 74.68 Clients 12.33*** 8.80 0.09 59.21
LTCB clients only 12.74*** 9.01 0.09 59.21 NCB clients only 11.39*** 7.97 1.30 46.30
Clients of both banks 11.51* 9.11 0.81 42.44

32
Table 2. Summary statistics of financial characteristics
for failed and surviving bank client firms (cont'd)
Panel B. LTCB and NCB failures (October 23, 1998 and December 14, 1998)
Mean St. Dev. Min. Max. Tobin’s Q
All firms 1.06 0.45 0.40 6.58 Nonclients 1.07 0.48 0.40 6.58 Clients 1.04 0.35 0.41 3.12
LTCB clients only 1.06 0.39 0.41 3.12 NCB clients only 0.98 0.20 0.68 1.90
Clients of both banks 1.06 0.30 0.66 1.85
Age (years) All firms 56.61 17.01 10.00 117.00 Nonclients 56.39 16.96 11.00 117.00 Clients 57.30 17.18 10.00 113.00
LTCB clients only 57.47 18.63 10.00 113.00 NCB clients only 56.32 11.40 22.00 82.00
Clients of both banks 58.17 17.30 37.00 109.00

33
Table 3. Cross-section relationship between abnormal returns and client firms’ financial characteristics
This table presents estimates of the correlation between abnormal returns and selected measures of client firms’ financial condition modeled as: [ 1, 1], ,( ) ( )i i i i i i i i j j it
j
COND X CL CL x COND CL x X DIND� � � � � � � � � �
� � � � � � � ��
where the financial condition variables (COND) employed are: 1) asset size; 2) the ratio of bank loans to total assets; 3) the ratio of book-value equity to total assets; 4) the ratio of net income to total assets (or book-value of equity); and 5) the ratio of cash plus investment security to total assets. iCL is a binary variable that identifies the clients of the failed banks and is equal to one if firm i is a client of the failed bank, zero otherwise. The X variables are age and the ratio of market value of assets to book value of assets (TOBQ). We also include the square of these variables. The coefficient estimates of COND and X for client firms of failed banks are (� + �) and (� + �), respectively. The coefficient estimates of COND and X for client firms of surviving banks are (�) and (�), respectively. The model also includes indicator variables for industries, which are not reported below. The number of observations in each regression is 3,708; of these, 3,323 relate to the clients of surviving banks and, 385 relate to the clients of failed banks. ‘***’, ‘**’, and ‘*’ indicate statistical differences in the mean values of the variables for failed and surviving bank client firms at the 1%, 5%, and 10% levels, respectively.
COND = Intermediated debt/Total assets (LOANS/TA)
Clients of Failed Banks
Clients of Surviving
Banks
Test of the Differences in Coefficients
LOANS/TA -0.0176*** -0.0142*** TA 0.3146*** 0.1157*** **
AGE -0.0095 -0.0052*** AGE2 0.0002*** 0.0001*** **
TOBQ 1.9810 1.2689*** TOBQ2 -0.3447 -0.1919***
Constant -0.9024 -0.8720*** F-Statistic 22.87***
COND = Equity capital/Total assets (EQUITY/TA)
Clients of Failed Banks
Clients of Surviving
Banks
Test of the Differences in Coefficients
CA 0.01291 0.0097*** TA 0.3618*** 0.1392*** **
AGE -0.0090 -0.0048** AGE2 0.0003*** 0.0001*** **
TOBQ 2.1479* 1.3821*** TOBQ2 -0.3892 -0.2153***
Constant -2.0346* -1.7550*** F-Statistic 20.75***

34
Table 3. Cross-section relationship between abnormal returns and client firms’ financial characteristics (cont'd)
COND = Net income/Total assets (ROA)
Clients of Failed Banks
Clients of Surviving
Banks
Test of the Differences in Coefficients
ROA 0.1214** 0.0800*** TA 0.2948*** 0.1210*** *
AGE -0.0104 -0.0070*** AGE2 0.0003*** 0.0001*** ***
TOBQ 1.3274 1.1376*** TOBQ2 -0.1761 -0.1782***
Constant -0.9929 -1.0083*** F-Statistic 20.63***
COND = Net income/Equity (ROE)
Clients of Failed Banks
Clients of Surviving
Banks
Test of the Differences in Coefficients
ROE 0.0299** 0.0296*** TA 0.2924*** 0.1107*** **
AGE -0.0119* -0.0073*** AGE2 0.0003*** 0.0001*** ***
TOBQ 1.5845 1.2113*** TOBQ2 -0.2182 -0.1825***
Constant -1.0428 -1.0343*** F-Statistic 20.55***
COND= LIQUIDITY [(CASH + SECURITIES)/TA ]
Clients of Failed Banks
Clients of Surviving
Banks
Test of the Differences in Coefficients
LIQUIDITY -0.0089 0.0086*** TA 0.2857*** 0.1143*** *
AGE -0.0124** -0.0071*** AGE2 0.0003*** 0.0001*** ***
TOBQ 1.6318 1.3150*** TOBQ2 -0.1730 -0.1937***
Constant -1.0509 -1.2649*** F-Statistic 19.79***

35
APPENDIX – THE THREE FAILURES Hokkaido Takushoku Bank (November 17, 1997)
Hokkaido Takushoku Bank was the smallest so-called “city” bank, but one of the largest 20
commercial banks in Japan, with more than ¥9.5 trillion in assets.10 On November 17, 1997, the
bank announced that, due to its difficulties in raising funds, it would transfer its operations in the
Hokkaido region in northern Japan to the North Pacific Bank. Its operations outside of Hokkaido
were eventually sold to Chuo Trust and Banking Co. The bank’s bad loans were sold to the Deposit
Insurance Corporation (DIC), and the Bank of Japan extended emergency loans to the bank during
the transition period to provide liquidity to meet deposit outflows. The problems of the bank were
well-known, and its closure followed an aborted government-sanctioned merger attempt with the
nearby Hokkaido Bank.11
Long-Term Credit Bank of Japan (October 23, 1998)
LTCB was one of the largest banks in Japan and was widely perceived to be in serious
financial trouble prior to its failure. Despite an injection of capital from the government in March
1998, its debt was downgraded several times and its share price dropped sharply. A merger attempt
with Sumitomo Trust Bank, a large bank in stronger financial condition, failed in the summer of
1998. On October 19, 1998, news reports indicated that the newly-established Financial Supervisory
Agency (FSA) had informed LTCB earlier in the day that the bank was insolvent on a market-value
basis as of the end of September, when it was last inspected.12 The reports also indicated that LTCB
was expected to be nationalized later in the week, when recently adopted banking legislation would
10 Japanese banks are generally divided into four broad categories—city, trust, long-term credit, and
regional—according to both size and type of business. Historically, the four types of banks have differed in their size, composition of assets and loans, customer base, funding sources, and regulatory requirements and treatment. Long-term credit and city banks were the larger banks and trust banks the most specialized. See Genay (1998) for a discussion of some of the differences in the operations of city, regional, long-term credit, and trust banks.
11 News articles reported that depositors began to withdraw funds from the bank after it was announced that the planned merger with Hokkaido Bank would not happen. News reports also noted that many of the large stakeholders, e.g., the life insurance companies, refused to inject additional funds into the bank’s capital base in the weeks leading up to its closure. The bank’s share price, which was ¥222 at the beginning of 1997, had dropped to ¥65 the day before the failure announcement on November 17, 1997. The day after the announcement, shareholders could only receive ¥5 per share.
12 The Financial Supervisory Agency, which assumed supervisory responsibilities for financial institutions from the Ministry of Finance, was established on June 22, 1998.

36
take effect.13 Four days later on October 23, 1998, LTCB applied for nationalization. The
government announced that it would guarantee all obligations of LTCB, the DIC would purchase the
bank's shares (last traded at ¥2), and the Bank of Japan would provide financial aid to LTCB as
necessary to maintain liquidity in financial markets. According to the FSA report, at the end of
September, the bank had total assets of ¥24 trillion and ¥160 billion in book-value capital. It also
reported ¥500 billion, or three times its book value capital, of unrealized losses on its securities
portfolio and other problem assets totaling ¥4.62 trillion, or 19 percent of total assets and roughly 30
times its capital.14
F. Nippon Credit Bank (December 14, 1998)
The semi-annual public financial statements issued by all Japanese banks on November 24,
1998 for the six months ending September 30 showed that another large long-term credit bank—the
Nippon Credit Bank (NCB), with assets of ¥7.7 trillion as of September 1998—had significant
amounts of problem loans and that its earnings had deteriorated significantly since March 1998.
However, the bank stated that it was still solvent. On December 9, 1998, it was announced that NCB
was abandoning its previously announced merger with and Chuo Trust and Banking Co. The
abandoned merger was perceived as a sign of further problems at NCB. Shortly thereafter, news
reports indicated that the FSA’s examination of the bank showed that as of March 31, 1998, contrary
to what NCB had reported, the bank had a capital deficit of ¥94.4 billion and was insolvent. On
December 12, the government urged Nippon Credit to apply for nationalization, which it did on the
next business day—December 14. The government provided assurances that the repayment of all of
NCB's obligations would be satisfied in full and on time and that the Bank of Japan would provide
loans to ensure the liquidity of the markets. The Bank injected some ¥80 billion into NCB to avoid
having it default on its liabilities.
13 A package of eight bills was approved by the parliament on October 12, 1998 aimed at resolving the bad
loans of Japanese banks and dealing with the failure of financial institutions. The legislation allowed for recapitalization of banks with public funds and created the Financial Reconstruction Commission (FRC), to, among other duties, administer nationalized insolvent institutions.
14 After the nationalization, the good assets of the bank were eventually sold to a consortium led by Ripplewood Holdings LLC in the U.S., which paid ¥1 billion for the bank and injected additional ¥120 billion in capital. The new bank also received ¥240 billion of public capital from the Financial Reconstruction Commission in March 2000.