Electroencephalography Functional Networks Reveal Global ...
Upload
trinhduongCategory
view
226download
0
130INTRODUCTION TO SLEEPELECTROENCEPHALOGRAPHY
SELIM R. BENBADIS
University of South Florida College of Medicine, Tampa, Florida
INTRODUCTION
Basic Principles
EEG records synaptic potentials from pyramidal cells. It is
critical to remember that there is no absolute voltage mea-
surement in clinical EEG. Rather, an EEG trace records
potential differences between two electrodes. By conven-
tion of the amplifiers used in clinical EEG, an upgoing
deflection indicates that input 1 (grid 1) is more negative
(or less positive) than input 2 (grid 2). This is an arbitrary
but critical rule (Figure 130.1). Thus statements like ‘‘posi-
tivity is up’’ or ‘‘negativity is up’’ make no sense unless it is
stated whether the positivity is at grid 1 or grid 2.
It should be emphasized that the way recordings are dis-
played can be modified at will with digital acquisition, and
this ‘‘post-hoc’’ reformatting is one of the major advantages
of modern digital systems.
Types of EEG in Clinical Practice
Routine EEG is typically a brief recording of 20–30 min.
The main limitation with EEG is its poor sensitivity for epi-
lepsy. The generally accepted numbers are that the yield of
a single routine EEG in epilepsy is �50% and increases
with repeated EEG recordings to reach about 80% by the
third recording [1]. For practical purposes, if a diagnosis
of epilepsy is strongly suspected clinically, and EEG confir-
mation or more precise diagnosis is needed, other options
should be used. The two options are ambulatory EEG and
prolonged EEG-video monitoring.
Ambulatory EEG is to the brain what Holter monitoring
is to the heart. Here the patient is hooked up to the EEG and
goes home with the intent of recording a seizure or an epi-
sode [2]. Ambulatory EEG can occasionally be performed
with video, and this option is now emerging.
EEG-video monitoring is the highest level of epilepsy
monitoring and the gold standard. This is the basic activity
of comprehensive epilepsy centers [3] and certainly the
starting point when drugs fail to control seizures [4].
There is no strict ‘‘cutoff’’ for when EEG-video monitoring
is indicated, but some guidelines state that referral to a spe-
cialized epilepsy center is appropriate if seizure control is
not achieved within 9 months [5]. As a general rule, pro-
longed EEG-video monitoring should be obtained on any
patient who continues to have seizures frequently (1/
week) despite antiepileptic drugs [4]. In the vast majority
of situations, this allows one to confirm the diagnosis of
epilepsy or to rectify a wrong diagnosis of epilepsy. If epi-
lepsy is confirmed, it is then usually possible to (1) deter-
mine whether it is localization-related or generalized; (2)
distinguish, among generalized epilepsies, between the
‘‘idiopathic’’ type and the symptomatic (cause known) or
cryptogenic (caused unknown); and (3) differentiate,
among localization-related epilepsies, between mesiotem-
poral and extratemporal/neocortical epilepsy. Based on
this precise classification of the epilepsy syndrome, treat-
ment options can then be examined. Invasive EEG is
Sleep: A Comprehensive Handbook, Edited by T. Lee-Chiong.Copyright # 2006 John Wiley & Sons, Inc.
989
limited to specialized surgical epilepsy centers and is
beyond the scope of this chapter (for review, see [6, 7]).
Technical Aspects
In human clinical EEG, electrodes are placed according to a
standard system known as the 10-20 system (Figure 130.2).
It uses four anatomical landmarks (nasion, inion, and the
two preauricular points) from which measurements are
made and electrodes are placed at 10% or 20% of the
distances.
There are two types of montages: bipolar and referential.
In a bipolar montage, each electrode is linked to the next
along a chain (i.e., A–B, B–C, C–D, D–E). The typical
longitudinal or anteroposterior bipolar montage is often
referred to as a ‘‘double banana.’’ Another common bipolar
montage is the transverse (from left to right across the
head). In a referential (or monopolar) montage, each elec-
trode is linked (compared) to a common reference. A help-
ful analogy is that measuring voltage fields with electrodes
is akin to measuring mountain peaks/altitudes with sur-
veyors [8] (Figure 130.3). In terms of localization, maxi-
mum voltage (altitude) is indicated by a phase reversal on
bipolar montages, or by maximum amplitude on referential
montages (Figure 130.3). Contrary to a common miscon-
ception, phase reversals are not at all indicative of an
abnormality, and in fact have nothing to do with the nature
of a voltage field (i.e., what the discharge is). Instead, phase
reversals indicate the maximum (negativity or positivity)
Polarity Convention
G1 G2 Result
− +
+ −
Figure 130.1 Polarity convention. This is an arbitrary but critical
rule. By convention of the amplifiers used in clinical EEG, an
upgoing deflection indicates that input 1 (grid 1 or G1) is more
negative (or less positive) than input 2 (grid 2 or G2). Thus state-
ments like ‘‘positivity is up’’ or ‘‘negativity is up’’ make no sense
unless it is stated whether the positivity is at grid 1 or grid 2.
10-20 system & montages
Longitudinal bipolar Transverse
(double banana) bipolar• Fp1-F7 • T3-C3• F7-T3 • C3-Cz• T3-T5 • Cz-C4• T5-O1 • C4-T4
Referential(monopolar)• Fp1-A1• F7-A1• T3-A1• T5-A1
T4C4
O2
P4
Fp2
F4 F8
T6
Fp1
F7
O1
T3
T5
F3
P3
C3 CzA1
Fz
Pz
A2
Figure 130.2 The 10–20 system of electrode placement. This
uses four anatomical landmarks (nasion, inion, and the two preauri-
cular points) from which measurements are made and electrodes
are placed at 10% or 20% of the distances. Letters refer (grossly)
to the lobe (i.e., Fp, frontopolar; F, frontal; T, temporal; P, parietal;
O, occipital). Odd-numbered electrodes are on the left, even-num-
bered electrodes on the right, and midline electrodes are designated
as ‘‘z.’’
Polarity and phase reversals
A-B
B-C
C-D
D-E
C
DB
EA
CBA ED
(a)
Referential
A-REF
B-REF
C-REF
D-REF
E-REF
C
DB
EA
CBAED
REF (b)
Figure 130.3 Measuring a voltage field is analogous to measur-
ing the altitude of a mountain. (a) On a bipolar montage, a maxi-
mum peak (voltage) is indicated by a phase reversal. (b) On a
referential montage, a maximum peak (voltage) is indicated by
the highest amplitude.
990 INTRODUCTION TO SLEEP ELECTROENCEPHALOGRAPHY
and have everything to do with the location of the discharge
(i.e., where the discharge is).
The display on EEG typically uses a ‘‘paper speed’’
(obsolete concept with digital recordings) of 3 cm/s (in
the United States), that is, 3 times faster than the PSG
‘‘paper speed’’ of 1 cm/s. By convention, in the United States,
montages are usually displayed ‘‘left over right.’’
Filters and their principles are similar to those used in
polysomnography.
In clinical neurophysiologey (e.g., EEG, PSG), wave-
forms and discharges are described and characterized by
the following parameters:
� Amplitude: how high the voltage is (in mV).
� Duration: how long the discharge is (in ms or seconds).
� Frequency: how frequently a waveform repeats itself
(in cycles per seconds or hertz). The frequency is the
reciprocal of the duration (e.g., a duration on 200 ms is
the same as a frequency 5 Hz.)
� Morphology: the shape and configuration of the dis-
charge (this is qualitative).
� Latency: the delay between an arbitrary event (e.g.,
stimulus) and another event (in ms).
� Location: where the discharge is.
� Reactivity: what affects the discharge.
ARTIFACTS
Although EEG is designed to record cerebral activity, it
also records electrical activities arising from sites other
than the brain. The recorded activity that is not of cerebral
origin is termed artifact and can be conveniently divided
into physiologic and extraphysiologic artifacts. Physiologic
artifacts are generated by the body but arise from sources
other than the brain. Extraphysiologic artifacts arise from
outside the body (i.e., equipment, environment).
Physiologic Artifacts
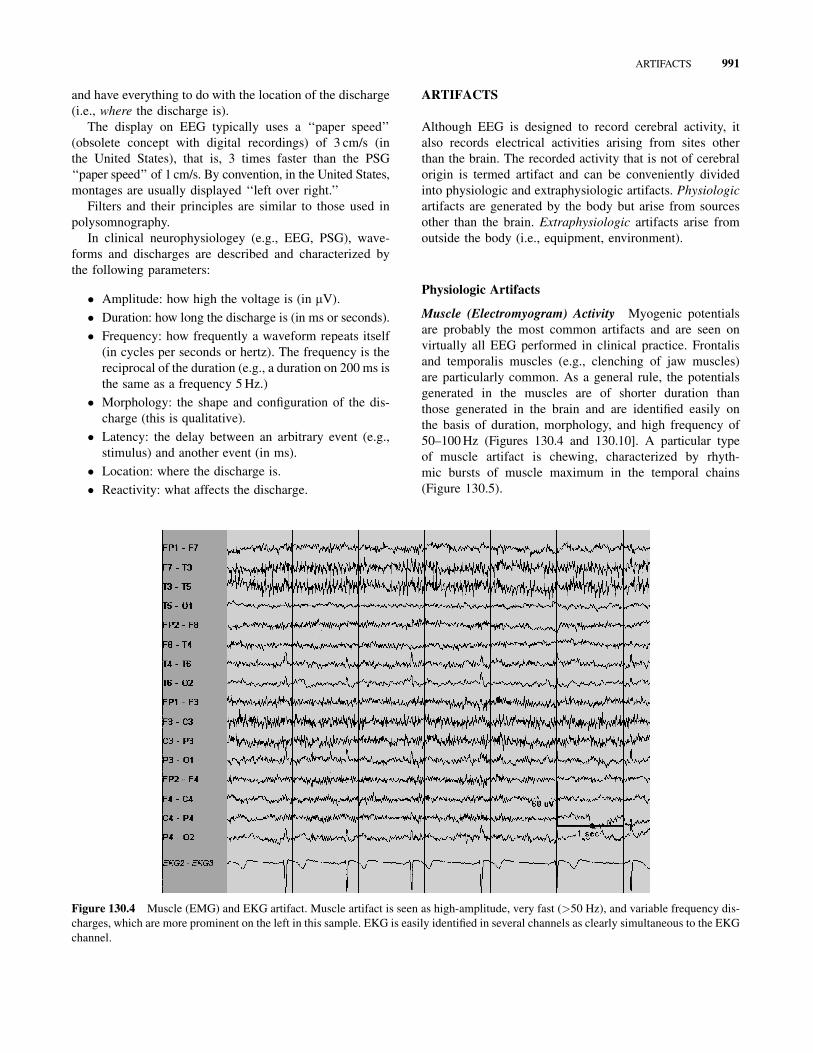
Muscle (Electromyogram) Activity Myogenic potentials
are probably the most common artifacts and are seen on
virtually all EEG performed in clinical practice. Frontalis
and temporalis muscles (e.g., clenching of jaw muscles)
are particularly common. As a general rule, the potentials
generated in the muscles are of shorter duration than
those generated in the brain and are identified easily on
the basis of duration, morphology, and high frequency of
50–100 Hz (Figures 130.4 and 130.10]. A particular type
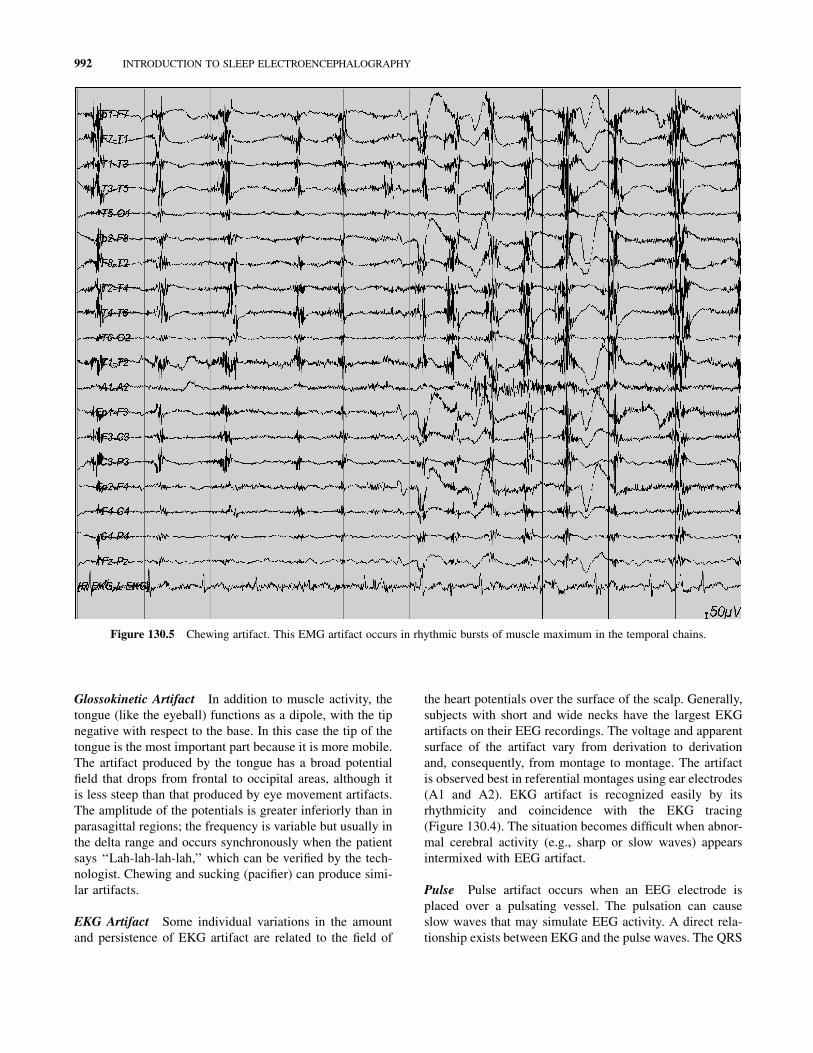
of muscle artifact is chewing, characterized by rhyth-
mic bursts of muscle maximum in the temporal chains
(Figure 130.5).
Figure 130.4 Muscle (EMG) and EKG artifact. Muscle artifact is seen as high-amplitude, very fast (>50 Hz), and variable frequency dis-
charges, which are more prominent on the left in this sample. EKG is easily identified in several channels as clearly simultaneous to the EKG
channel.
ARTIFACTS 991
Glossokinetic Artifact In addition to muscle activity, the
tongue (like the eyeball) functions as a dipole, with the tip
negative with respect to the base. In this case the tip of the
tongue is the most important part because it is more mobile.
The artifact produced by the tongue has a broad potential
field that drops from frontal to occipital areas, although it
is less steep than that produced by eye movement artifacts.
The amplitude of the potentials is greater inferiorly than in
parasagittal regions; the frequency is variable but usually in
the delta range and occurs synchronously when the patient
says ‘‘Lah-lah-lah-lah,’’ which can be verified by the tech-
nologist. Chewing and sucking (pacifier) can produce simi-
lar artifacts.
EKG Artifact Some individual variations in the amount
and persistence of EKG artifact are related to the field of
the heart potentials over the surface of the scalp. Generally,
subjects with short and wide necks have the largest EKG
artifacts on their EEG recordings. The voltage and apparent
surface of the artifact vary from derivation to derivation
and, consequently, from montage to montage. The artifact
is observed best in referential montages using ear electrodes
(A1 and A2). EKG artifact is recognized easily by its
rhythmicity and coincidence with the EKG tracing
(Figure 130.4). The situation becomes difficult when abnor-
mal cerebral activity (e.g., sharp or slow waves) appears
intermixed with EEG artifact.
Pulse Pulse artifact occurs when an EEG electrode is
placed over a pulsating vessel. The pulsation can cause
slow waves that may simulate EEG activity. A direct rela-
tionship exists between EKG and the pulse waves. The QRS
Figure 130.5 Chewing artifact. This EMG artifact occurs in rhythmic bursts of muscle maximum in the temporal chains.
992 INTRODUCTION TO SLEEP ELECTROENCEPHALOGRAPHY
complex (i.e., electrical component of the heart contraction)
happens slightly ahead of the pulse waves 200–300 msec
delay after EKG.
Eye Movements Eye movements are observed on all EEG
recordings and are useful in identifying sleep stages. The
eyeball acts as a dipole with a positive pole anteriorly (cor-
nea) and a negative pole posteriorly (retina). When the
globe rotates about its axis, it generates a large-amplitude
alternate current field, which is detectable by any electrodes
near the eye. The other source of artifacts comes from EMG
potentials from muscles in and around the orbit. Vertical
eye movements typically are observed with blinks (i.e.,
Bell’s phenomenon). A blink causes the positive pole
(i.e., cornea) to move closer to frontopolar (Fp1–Fp2)
electrodes, producing symmetric downward deflections.
During downward eye movement the positive pole (i.e.,
cornea) of the globe moves away from frontopolar electro-
des, producing an upward deflection best recorded in chan-
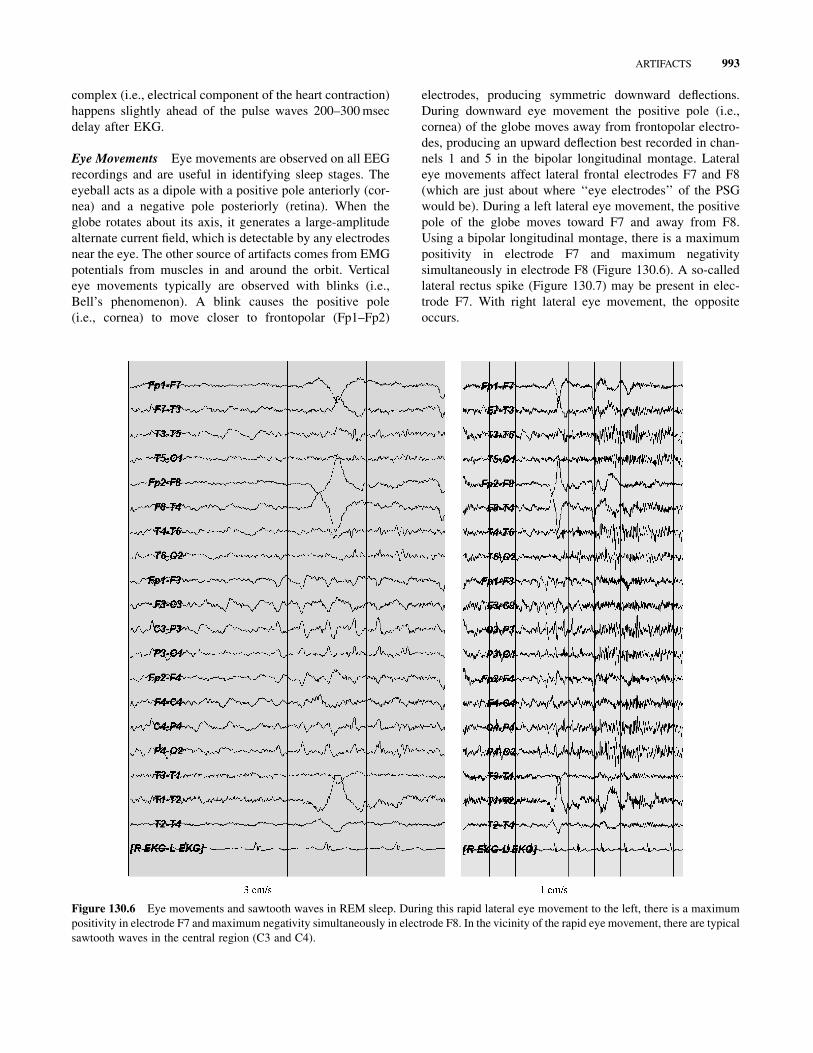
nels 1 and 5 in the bipolar longitudinal montage. Lateral
eye movements affect lateral frontal electrodes F7 and F8
(which are just about where ‘‘eye electrodes’’ of the PSG
would be). During a left lateral eye movement, the positive
pole of the globe moves toward F7 and away from F8.
Using a bipolar longitudinal montage, there is a maximum
positivity in electrode F7 and maximum negativity
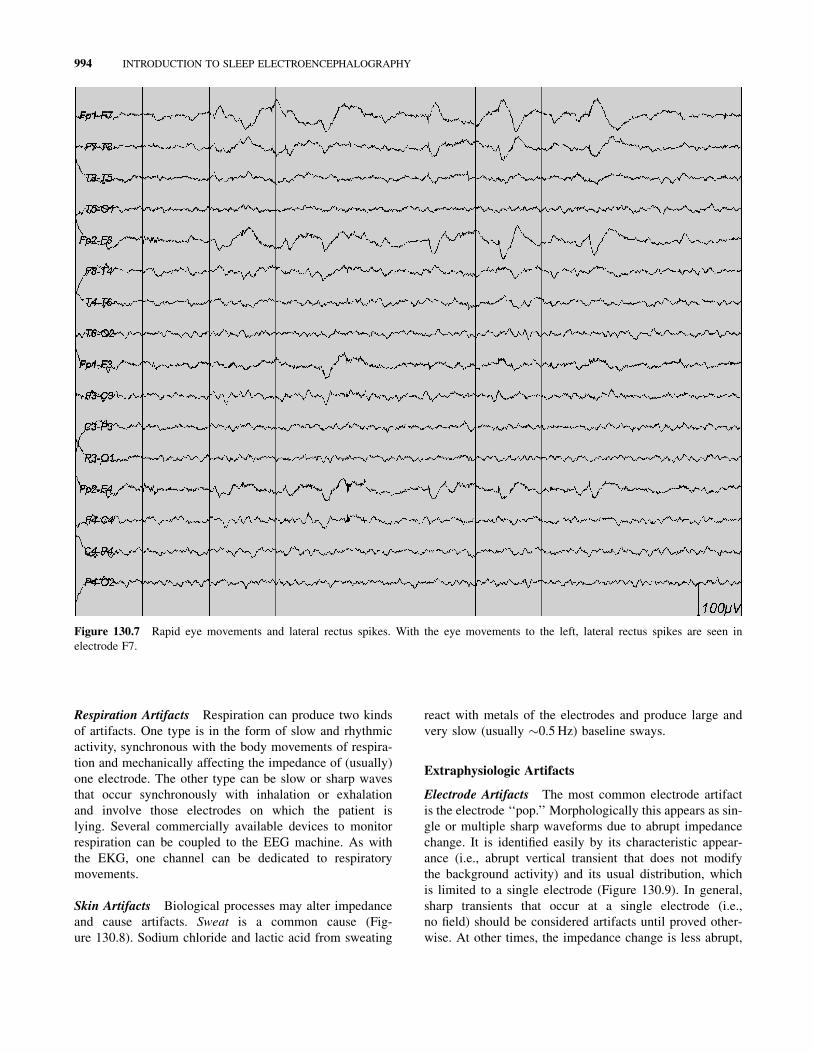
simultaneously in electrode F8 (Figure 130.6). A so-called
lateral rectus spike (Figure 130.7) may be present in elec-
trode F7. With right lateral eye movement, the opposite
occurs.
Figure 130.6 Eye movements and sawtooth waves in REM sleep. During this rapid lateral eye movement to the left, there is a maximum
positivity in electrode F7 and maximum negativity simultaneously in electrode F8. In the vicinity of the rapid eye movement, there are typical
sawtooth waves in the central region (C3 and C4).
ARTIFACTS 993
Respiration Artifacts Respiration can produce two kinds
of artifacts. One type is in the form of slow and rhythmic
activity, synchronous with the body movements of respira-
tion and mechanically affecting the impedance of (usually)
one electrode. The other type can be slow or sharp waves
that occur synchronously with inhalation or exhalation
and involve those electrodes on which the patient is
lying. Several commercially available devices to monitor
respiration can be coupled to the EEG machine. As with
the EKG, one channel can be dedicated to respiratory
movements.
Skin Artifacts Biological processes may alter impedance
and cause artifacts. Sweat is a common cause (Fig-
ure 130.8). Sodium chloride and lactic acid from sweating
react with metals of the electrodes and produce large and
very slow (usually �0.5 Hz) baseline sways.
Extraphysiologic Artifacts
Electrode Artifacts The most common electrode artifact
is the electrode ‘‘pop.’’ Morphologically this appears as sin-
gle or multiple sharp waveforms due to abrupt impedance
change. It is identified easily by its characteristic appear-
ance (i.e., abrupt vertical transient that does not modify
the background activity) and its usual distribution, which
is limited to a single electrode (Figure 130.9). In general,
sharp transients that occur at a single electrode (i.e.,
no field) should be considered artifacts until proved other-
wise. At other times, the impedance change is less abrupt,
Figure 130.7 Rapid eye movements and lateral rectus spikes. With the eye movements to the left, lateral rectus spikes are seen in
electrode F7.
994 INTRODUCTION TO SLEEP ELECTROENCEPHALOGRAPHY
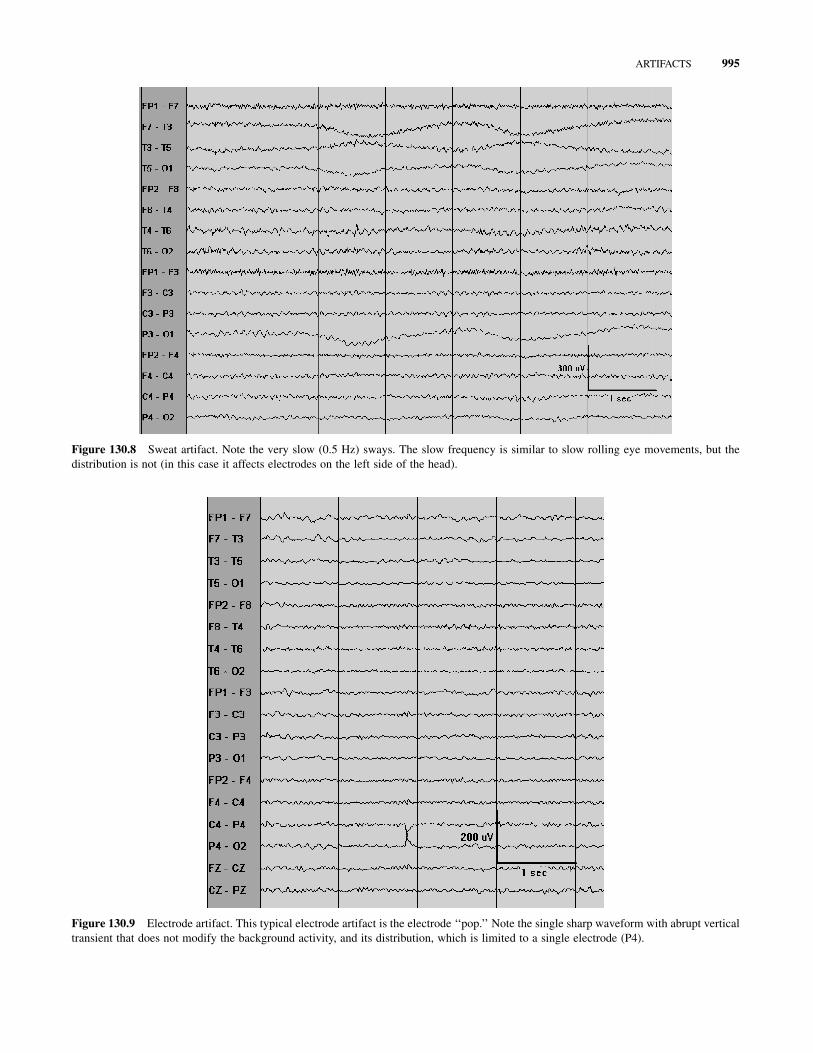
Figure 130.8 Sweat artifact. Note the very slow (0.5 Hz) sways. The slow frequency is similar to slow rolling eye movements, but the
distribution is not (in this case it affects electrodes on the left side of the head).
Figure 130.9 Electrode artifact. This typical electrode artifact is the electrode ‘‘pop.’’ Note the single sharp waveform with abrupt vertical
transient that does not modify the background activity, and its distribution, which is limited to a single electrode (P4).
ARTIFACTS 995
and the artifact may mimic a low-voltage arrhythmic delta
wave.
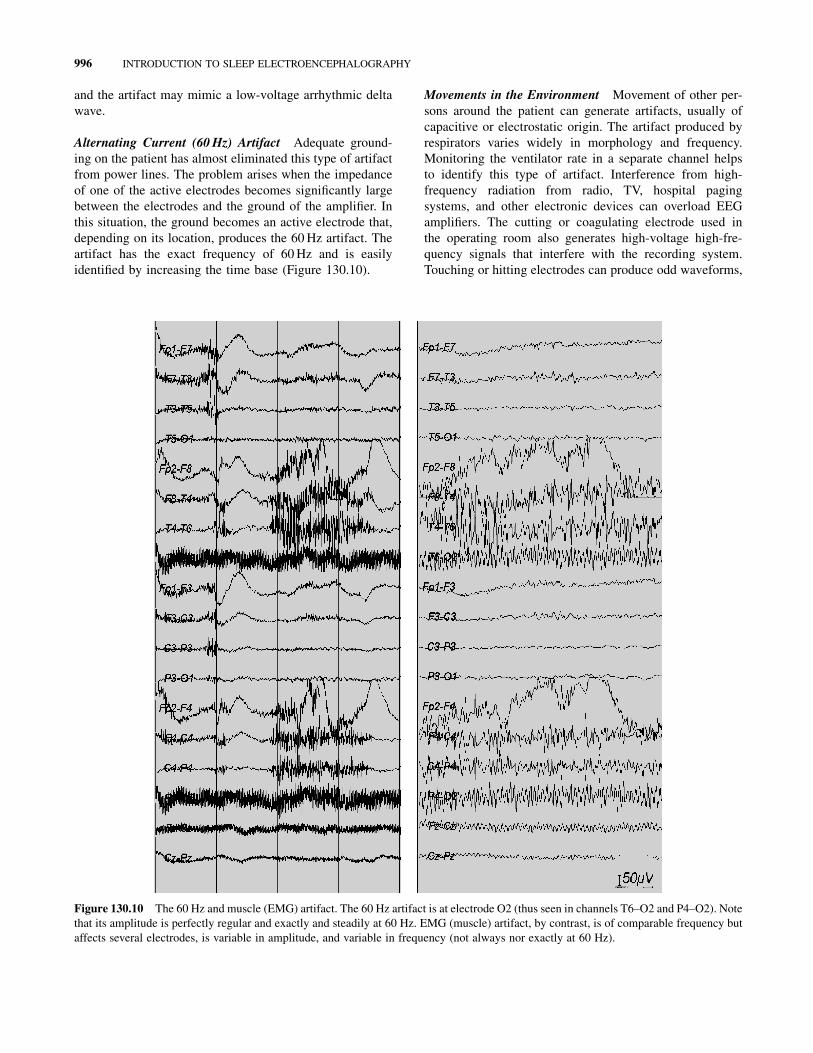
Alternating Current (60 Hz) Artifact Adequate ground-
ing on the patient has almost eliminated this type of artifact
from power lines. The problem arises when the impedance
of one of the active electrodes becomes significantly large
between the electrodes and the ground of the amplifier. In
this situation, the ground becomes an active electrode that,
depending on its location, produces the 60 Hz artifact. The
artifact has the exact frequency of 60 Hz and is easily
identified by increasing the time base (Figure 130.10).
Movements in the Environment Movement of other per-
sons around the patient can generate artifacts, usually of
capacitive or electrostatic origin. The artifact produced by
respirators varies widely in morphology and frequency.
Monitoring the ventilator rate in a separate channel helps
to identify this type of artifact. Interference from high-
frequency radiation from radio, TV, hospital paging
systems, and other electronic devices can overload EEG
amplifiers. The cutting or coagulating electrode used in
the operating room also generates high-voltage high-fre-
quency signals that interfere with the recording system.
Touching or hitting electrodes can produce odd waveforms,
Figure 130.10 The 60 Hz and muscle (EMG) artifact. The 60 Hz artifact is at electrode O2 (thus seen in channels T6–O2 and P4–O2). Note
that its amplitude is perfectly regular and exactly and steadily at 60 Hz. EMG (muscle) artifact, by contrast, is of comparable frequency but
affects several electrodes, is variable in amplitude, and variable in frequency (not always nor exactly at 60 Hz).
996 INTRODUCTION TO SLEEP ELECTROENCEPHALOGRAPHY
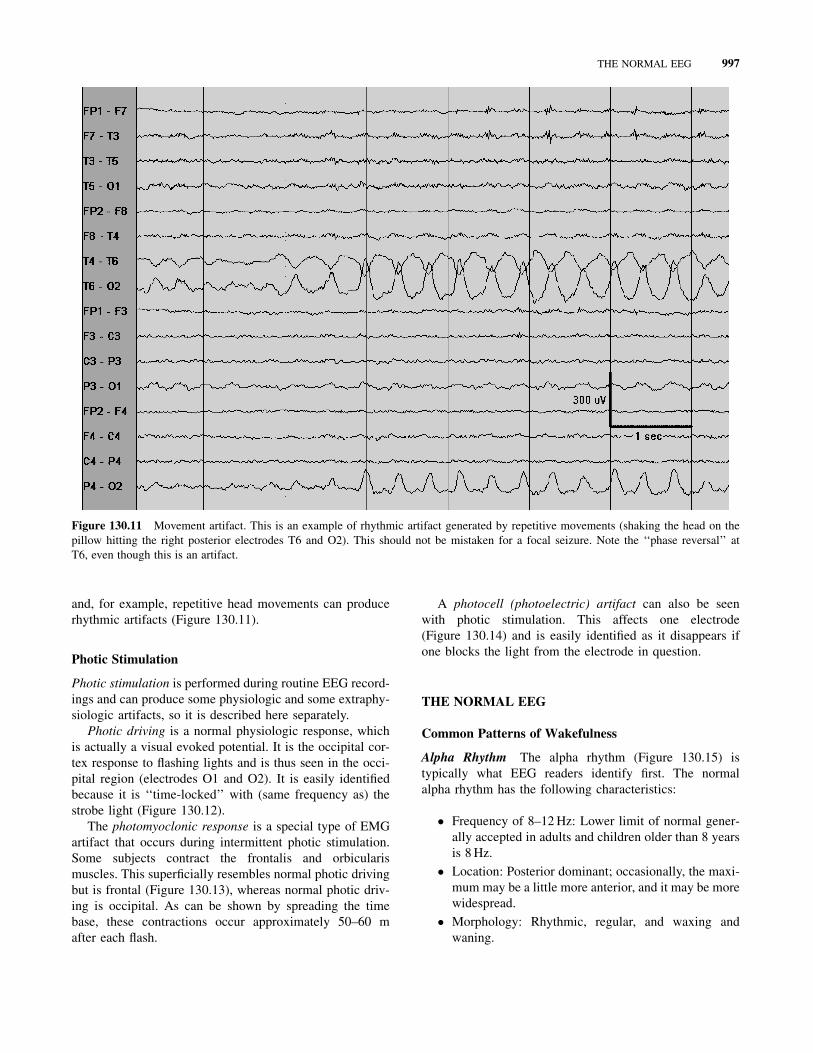
and, for example, repetitive head movements can produce
rhythmic artifacts (Figure 130.11).
Photic Stimulation
Photic stimulation is performed during routine EEG record-
ings and can produce some physiologic and some extraphy-
siologic artifacts, so it is described here separately.
Photic driving is a normal physiologic response, which
is actually a visual evoked potential. It is the occipital cor-
tex response to flashing lights and is thus seen in the occi-
pital region (electrodes O1 and O2). It is easily identified
because it is ‘‘time-locked’’ with (same frequency as) the
strobe light (Figure 130.12).
The photomyoclonic response is a special type of EMG
artifact that occurs during intermittent photic stimulation.
Some subjects contract the frontalis and orbicularis
muscles. This superficially resembles normal photic driving
but is frontal (Figure 130.13), whereas normal photic driv-
ing is occipital. As can be shown by spreading the time
base, these contractions occur approximately 50–60 m
after each flash.
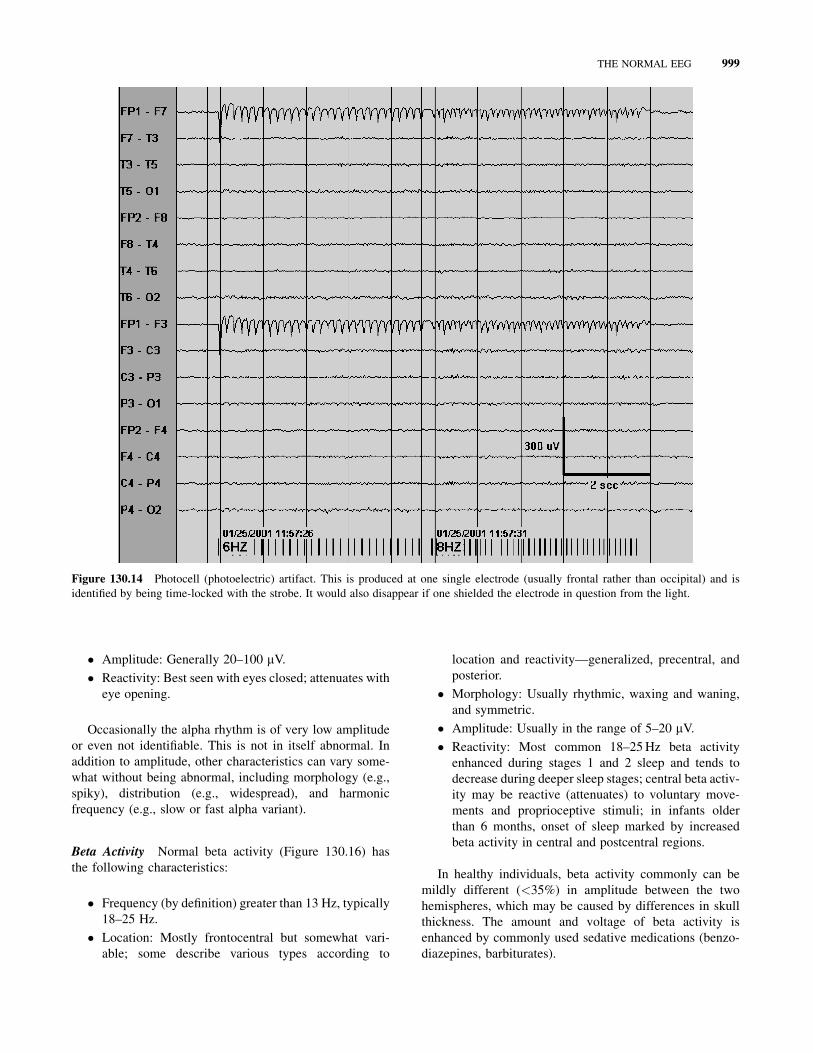
A photocell (photoelectric) artifact can also be seen
with photic stimulation. This affects one electrode
(Figure 130.14) and is easily identified as it disappears if
one blocks the light from the electrode in question.
THE NORMAL EEG
Common Patterns of Wakefulness
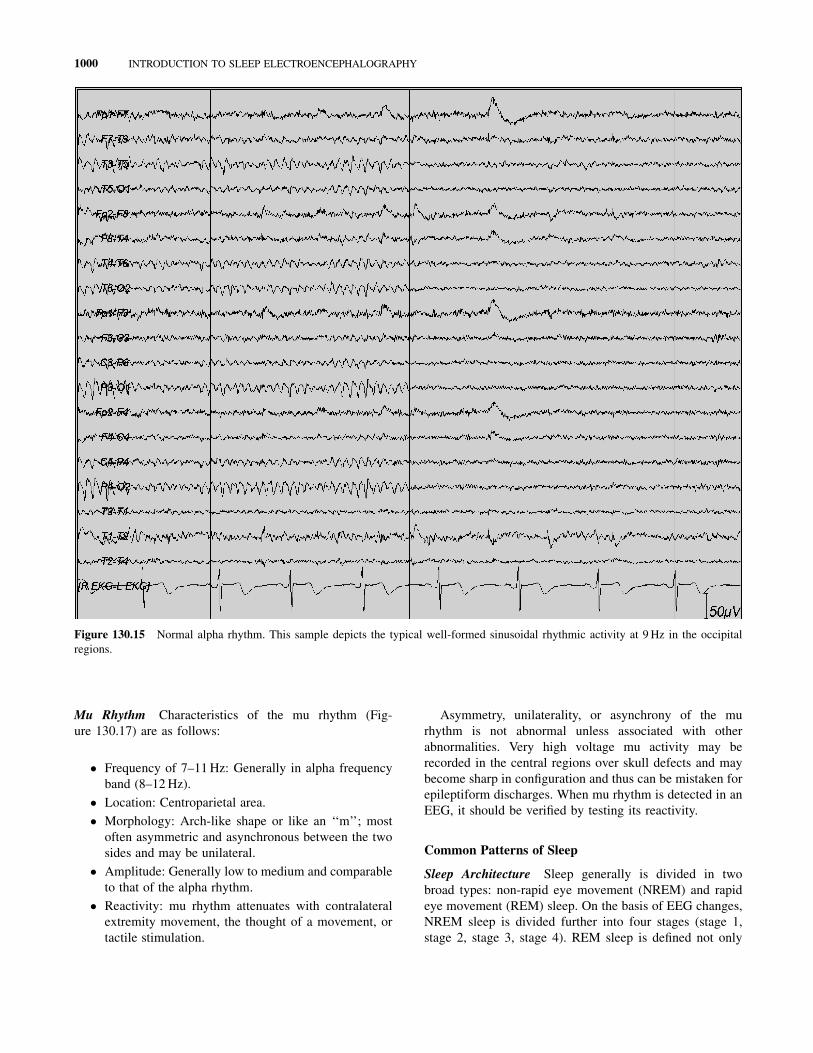
Alpha Rhythm The alpha rhythm (Figure 130.15) is
typically what EEG readers identify first. The normal
alpha rhythm has the following characteristics:
� Frequency of 8–12 Hz: Lower limit of normal gener-
ally accepted in adults and children older than 8 years
is 8 Hz.
� Location: Posterior dominant; occasionally, the maxi-
mum may be a little more anterior, and it may be more
widespread.
� Morphology: Rhythmic, regular, and waxing and
waning.
Figure 130.11 Movement artifact. This is an example of rhythmic artifact generated by repetitive movements (shaking the head on the
pillow hitting the right posterior electrodes T6 and O2). This should not be mistaken for a focal seizure. Note the ‘‘phase reversal’’ at
T6, even though this is an artifact.
THE NORMAL EEG 997
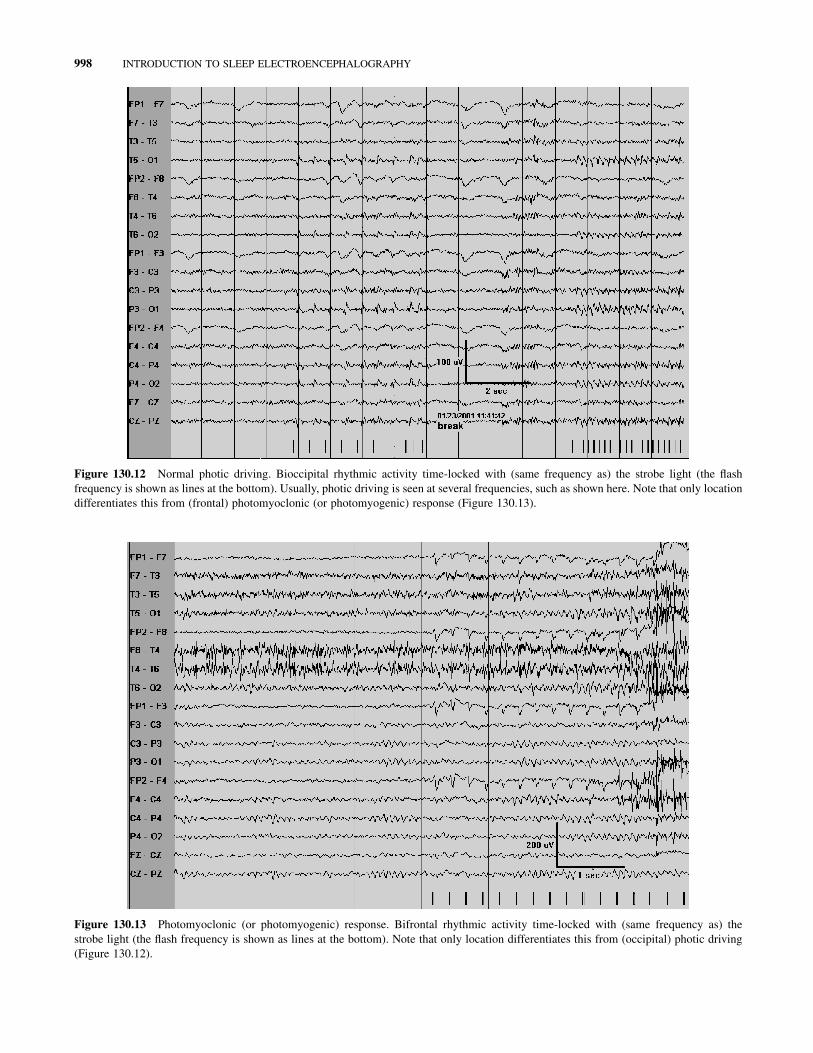
Figure 130.12 Normal photic driving. Bioccipital rhythmic activity time-locked with (same frequency as) the strobe light (the flash
frequency is shown as lines at the bottom). Usually, photic driving is seen at several frequencies, such as shown here. Note that only location
differentiates this from (frontal) photomyoclonic (or photomyogenic) response (Figure 130.13).
Figure 130.13 Photomyoclonic (or photomyogenic) response. Bifrontal rhythmic activity time-locked with (same frequency as) the
strobe light (the flash frequency is shown as lines at the bottom). Note that only location differentiates this from (occipital) photic driving
(Figure 130.12).
998 INTRODUCTION TO SLEEP ELECTROENCEPHALOGRAPHY
� Amplitude: Generally 20–100 mV.
� Reactivity: Best seen with eyes closed; attenuates with
eye opening.
Occasionally the alpha rhythm is of very low amplitude
or even not identifiable. This is not in itself abnormal. In
addition to amplitude, other characteristics can vary some-
what without being abnormal, including morphology (e.g.,
spiky), distribution (e.g., widespread), and harmonic
frequency (e.g., slow or fast alpha variant).
Beta Activity Normal beta activity (Figure 130.16) has
the following characteristics:
� Frequency (by definition) greater than 13 Hz, typically
18–25 Hz.
� Location: Mostly frontocentral but somewhat vari-
able; some describe various types according to
location and reactivity—generalized, precentral, and
posterior.
� Morphology: Usually rhythmic, waxing and waning,
and symmetric.
� Amplitude: Usually in the range of 5–20 mV.
� Reactivity: Most common 18–25 Hz beta activity
enhanced during stages 1 and 2 sleep and tends to
decrease during deeper sleep stages; central beta activ-
ity may be reactive (attenuates) to voluntary move-
ments and proprioceptive stimuli; in infants older
than 6 months, onset of sleep marked by increased
beta activity in central and postcentral regions.
In healthy individuals, beta activity commonly can be
mildly different (<35%) in amplitude between the two
hemispheres, which may be caused by differences in skull
thickness. The amount and voltage of beta activity is
enhanced by commonly used sedative medications (benzo-
diazepines, barbiturates).
Figure 130.14 Photocell (photoelectric) artifact. This is produced at one single electrode (usually frontal rather than occipital) and is
identified by being time-locked with the strobe. It would also disappear if one shielded the electrode in question from the light.
THE NORMAL EEG 999
Mu Rhythm Characteristics of the mu rhythm (Fig-
ure 130.17) are as follows:
� Frequency of 7–11 Hz: Generally in alpha frequency
band (8–12 Hz).
� Location: Centroparietal area.
� Morphology: Arch-like shape or like an ‘‘m’’; most
often asymmetric and asynchronous between the two
sides and may be unilateral.
� Amplitude: Generally low to medium and comparable
to that of the alpha rhythm.
� Reactivity: mu rhythm attenuates with contralateral
extremity movement, the thought of a movement, or
tactile stimulation.
Asymmetry, unilaterality, or asynchrony of the mu
rhythm is not abnormal unless associated with other
abnormalities. Very high voltage mu activity may be
recorded in the central regions over skull defects and may
become sharp in configuration and thus can be mistaken for
epileptiform discharges. When mu rhythm is detected in an
EEG, it should be verified by testing its reactivity.
Common Patterns of Sleep
Sleep Architecture Sleep generally is divided in two
broad types: non-rapid eye movement (NREM) and rapid
eye movement (REM) sleep. On the basis of EEG changes,
NREM sleep is divided further into four stages (stage 1,
stage 2, stage 3, stage 4). REM sleep is defined not only
Figure 130.15 Normal alpha rhythm. This sample depicts the typical well-formed sinusoidal rhythmic activity at 9 Hz in the occipital
regions.
1000 INTRODUCTION TO SLEEP ELECTROENCEPHALOGRAPHY
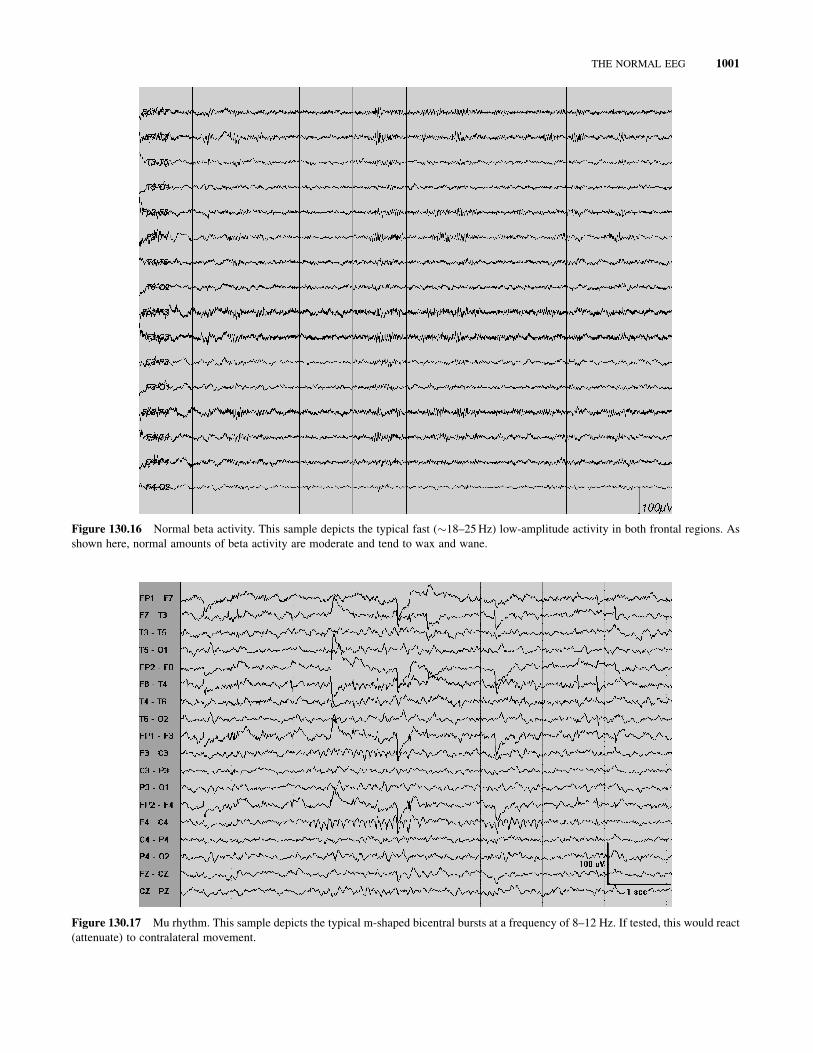
Figure 130.16 Normal beta activity. This sample depicts the typical fast (�18–25 Hz) low-amplitude activity in both frontal regions. As
shown here, normal amounts of beta activity are moderate and tend to wax and wane.
Figure 130.17 Mu rhythm. This sample depicts the typical m-shaped bicentral bursts at a frequency of 8–12 Hz. If tested, this would react
(attenuate) to contralateral movement.
THE NORMAL EEG 1001
by EEG, but also by EMG and eye movements. NREM and
REM sleep occur in alternating cycles, each lasting
approximately 90–100 minutes, with a total of 4–6 cycles.
In general, in the healthy young adult NREM sleep
accounts for 75–90% of sleep time (3–5% stage 1,
50–60% stage 2, and 10–20% stages 3 and 4). REM sleep
accounts for 10–25% of sleep time.
Total sleep time in the healthy young adult approximates
5–10 hours. In the full-term newborn, sleep cycles last
approximately 60 minutes. The newborn sleeps approxi-
mately 16–20 hours per day, with a higher proportion
(�50%) of REM sleep.
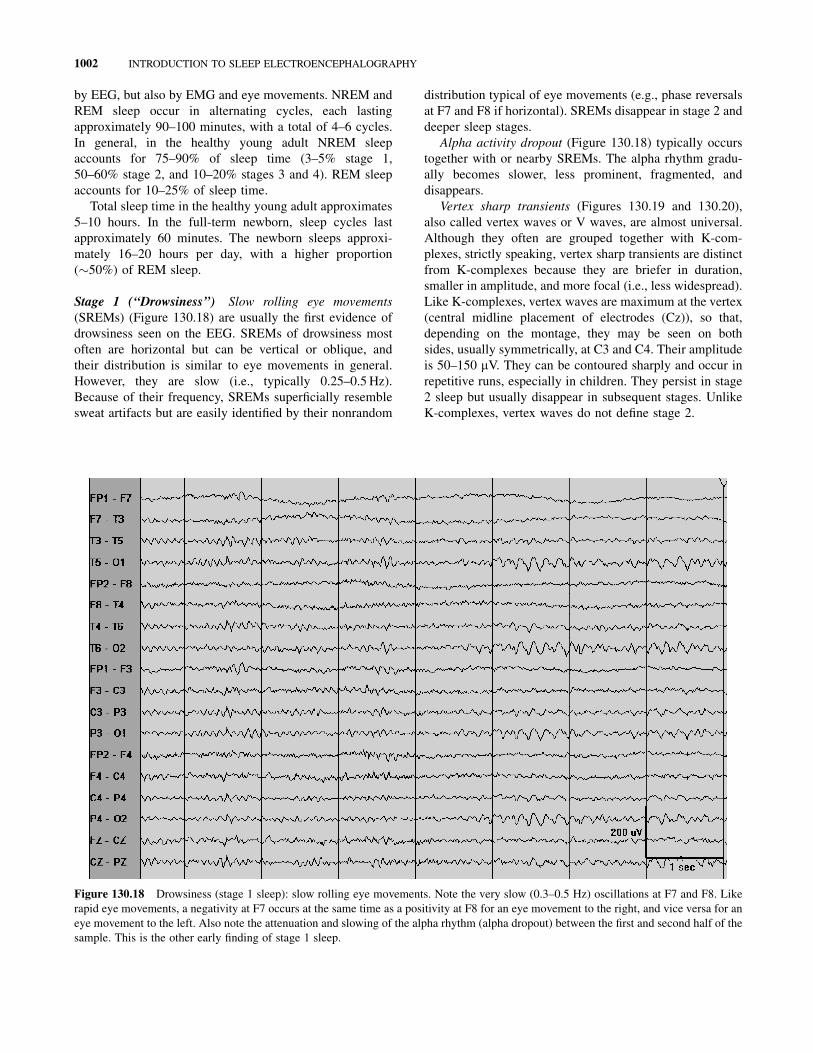
Stage 1 (‘‘Drowsiness’’) Slow rolling eye movements
(SREMs) (Figure 130.18) are usually the first evidence of
drowsiness seen on the EEG. SREMs of drowsiness most
often are horizontal but can be vertical or oblique, and
their distribution is similar to eye movements in general.
However, they are slow (i.e., typically 0.25–0.5 Hz).
Because of their frequency, SREMs superficially resemble
sweat artifacts but are easily identified by their nonrandom
distribution typical of eye movements (e.g., phase reversals
at F7 and F8 if horizontal). SREMs disappear in stage 2 and
deeper sleep stages.
Alpha activity dropout (Figure 130.18) typically occurs
together with or nearby SREMs. The alpha rhythm gradu-
ally becomes slower, less prominent, fragmented, and
disappears.
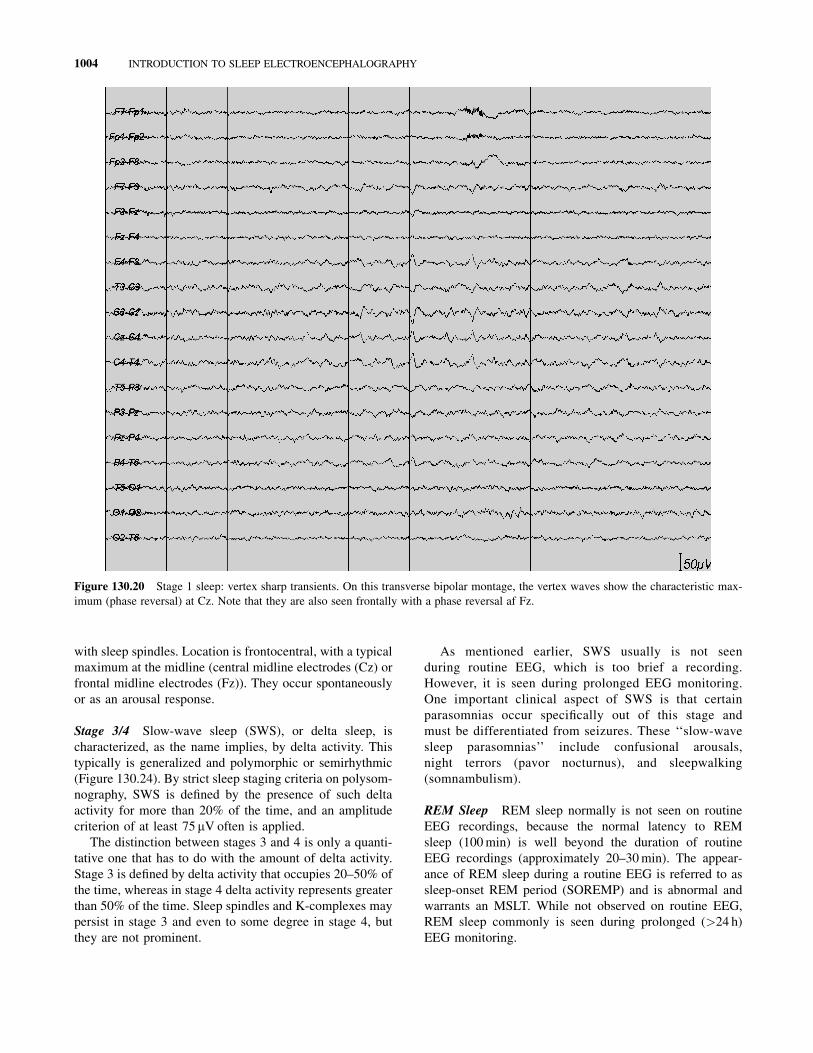
Vertex sharp transients (Figures 130.19 and 130.20),
also called vertex waves or V waves, are almost universal.
Although they often are grouped together with K-com-
plexes, strictly speaking, vertex sharp transients are distinct
from K-complexes because they are briefer in duration,
smaller in amplitude, and more focal (i.e., less widespread).
Like K-complexes, vertex waves are maximum at the vertex
(central midline placement of electrodes (Cz)), so that,
depending on the montage, they may be seen on both
sides, usually symmetrically, at C3 and C4. Their amplitude
is 50–150 mV. They can be contoured sharply and occur in
repetitive runs, especially in children. They persist in stage
2 sleep but usually disappear in subsequent stages. Unlike
K-complexes, vertex waves do not define stage 2.
Figure 130.18 Drowsiness (stage 1 sleep): slow rolling eye movements. Note the very slow (0.3–0.5 Hz) oscillations at F7 and F8. Like
rapid eye movements, a negativity at F7 occurs at the same time as a positivity at F8 for an eye movement to the right, and vice versa for an
eye movement to the left. Also note the attenuation and slowing of the alpha rhythm (alpha dropout) between the first and second half of the
sample. This is the other early finding of stage 1 sleep.
1002 INTRODUCTION TO SLEEP ELECTROENCEPHALOGRAPHY
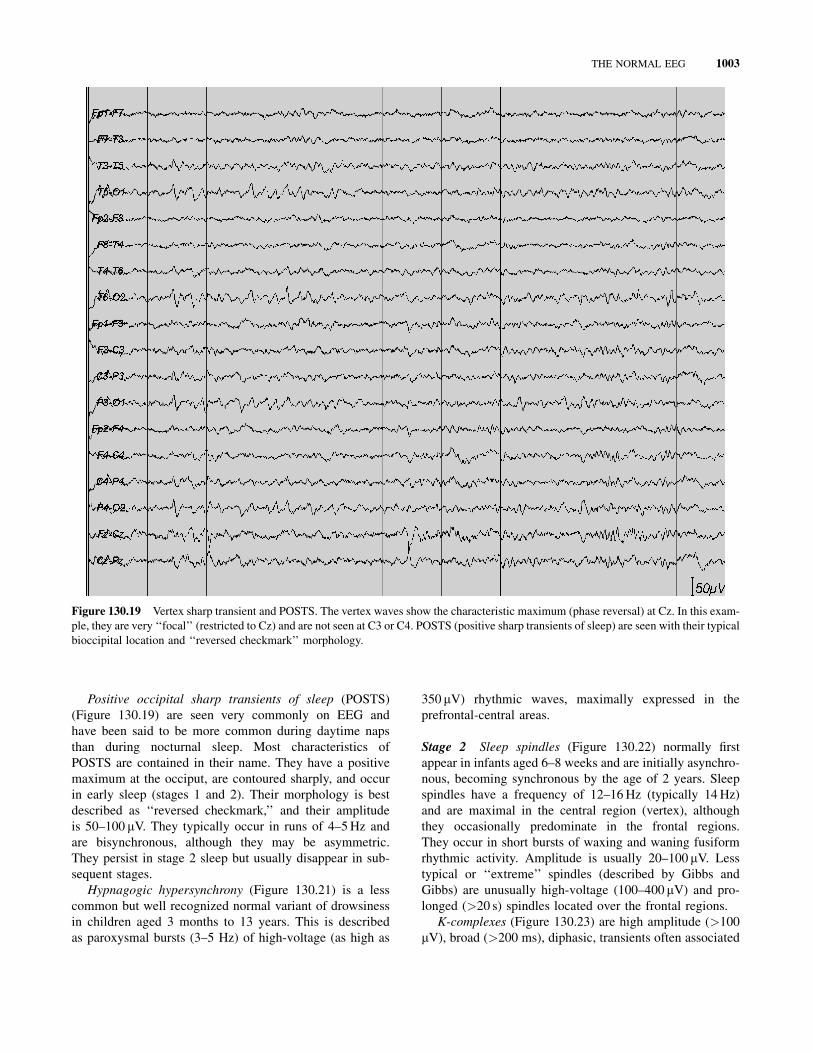
Positive occipital sharp transients of sleep (POSTS)
(Figure 130.19) are seen very commonly on EEG and
have been said to be more common during daytime naps
than during nocturnal sleep. Most characteristics of
POSTS are contained in their name. They have a positive
maximum at the occiput, are contoured sharply, and occur
in early sleep (stages 1 and 2). Their morphology is best
described as ‘‘reversed checkmark,’’ and their amplitude
is 50–100 mV. They typically occur in runs of 4–5 Hz and
are bisynchronous, although they may be asymmetric.
They persist in stage 2 sleep but usually disappear in sub-
sequent stages.
Hypnagogic hypersynchrony (Figure 130.21) is a less
common but well recognized normal variant of drowsiness
in children aged 3 months to 13 years. This is described
as paroxysmal bursts (3–5 Hz) of high-voltage (as high as
350 mV) rhythmic waves, maximally expressed in the
prefrontal-central areas.
Stage 2 Sleep spindles (Figure 130.22) normally first
appear in infants aged 6–8 weeks and are initially asynchro-
nous, becoming synchronous by the age of 2 years. Sleep
spindles have a frequency of 12–16 Hz (typically 14 Hz)
and are maximal in the central region (vertex), although
they occasionally predominate in the frontal regions.
They occur in short bursts of waxing and waning fusiform
rhythmic activity. Amplitude is usually 20–100 mV. Less
typical or ‘‘extreme’’ spindles (described by Gibbs and
Gibbs) are unusually high-voltage (100–400 mV) and pro-
longed (>20 s) spindles located over the frontal regions.
K-complexes (Figure 130.23) are high amplitude (>100
mV), broad (>200 ms), diphasic, transients often associated
Figure 130.19 Vertex sharp transient and POSTS. The vertex waves show the characteristic maximum (phase reversal) at Cz. In this exam-
ple, they are very ‘‘focal’’ (restricted to Cz) and are not seen at C3 or C4. POSTS (positive sharp transients of sleep) are seen with their typical
bioccipital location and ‘‘reversed checkmark’’ morphology.
THE NORMAL EEG 1003
with sleep spindles. Location is frontocentral, with a typical
maximum at the midline (central midline electrodes (Cz) or
frontal midline electrodes (Fz)). They occur spontaneously
or as an arousal response.
Stage 3/4 Slow-wave sleep (SWS), or delta sleep, is
characterized, as the name implies, by delta activity. This
typically is generalized and polymorphic or semirhythmic
(Figure 130.24). By strict sleep staging criteria on polysom-
nography, SWS is defined by the presence of such delta
activity for more than 20% of the time, and an amplitude
criterion of at least 75 mV often is applied.
The distinction between stages 3 and 4 is only a quanti-
tative one that has to do with the amount of delta activity.
Stage 3 is defined by delta activity that occupies 20–50% of
the time, whereas in stage 4 delta activity represents greater
than 50% of the time. Sleep spindles and K-complexes may
persist in stage 3 and even to some degree in stage 4, but
they are not prominent.
As mentioned earlier, SWS usually is not seen
during routine EEG, which is too brief a recording.
However, it is seen during prolonged EEG monitoring.
One important clinical aspect of SWS is that certain
parasomnias occur specifically out of this stage and
must be differentiated from seizures. These ‘‘slow-wave
sleep parasomnias’’ include confusional arousals,
night terrors (pavor nocturnus), and sleepwalking
(somnambulism).
REM Sleep REM sleep normally is not seen on routine
EEG recordings, because the normal latency to REM
sleep (100 min) is well beyond the duration of routine
EEG recordings (approximately 20–30 min). The appear-
ance of REM sleep during a routine EEG is referred to as
sleep-onset REM period (SOREMP) and is abnormal and
warrants an MSLT. While not observed on routine EEG,
REM sleep commonly is seen during prolonged (>24 h)
EEG monitoring.
Figure 130.20 Stage 1 sleep: vertex sharp transients. On this transverse bipolar montage, the vertex waves show the characteristic max-
imum (phase reversal) at Cz. Note that they are also seen frontally with a phase reversal af Fz.
1004 INTRODUCTION TO SLEEP ELECTROENCEPHALOGRAPHY