Electroencephalography - Kocaeli...
27
Electroencephalography The electroencephalogram (EEG) is a measure of brain waves. It is a readily available test that provides evidence of how the brain functions over time. The EEG is used in the evaluation of brain disorders. Most commonly it is used to show the type and location of the activity in the brain during a seizure. It also is used to evaluate people who are having problems associated with brain function. These problems might include confusion, coma, tumors, long-term difficulties with thinking or memory, or weakening of specific parts of the body (such as weakness associated with a stroke). An EEG is also used to determine brain death. It may be used to prove that someone on life-support equipment has no chance of recovery. Electroencephalography is the recording of electrical activity along the scalp. EEG measures voltage fluctuations resulting from ionic current flows within the neurons of the brain. In clinical contexts, EEG refers to the recording of the brain's spontaneous electrical activity over a short period of time, usually 20–40 minutes, as recorded from multiple electrodes placed on the scalp.
Transcript of Electroencephalography - Kocaeli...

Electroencephalography
The electroencephalogram (EEG) is a measure of brain waves. It is a readily available test
that provides evidence of how the brain functions over time.
The EEG is used in the evaluation of brain disorders. Most commonly it is used to show
the type and location of the activity in the brain during a seizure. It also is used to evaluate
people who are having problems associated with brain function. These problems might
include confusion, coma, tumors, long-term difficulties with thinking or memory, or
weakening of specific parts of the body (such as weakness associated with a stroke).
An EEG is also used to determine brain death. It may be used to prove that someone on
life-support equipment has no chance of recovery.
Electroencephalography is the recording of electrical activity along the scalp. EEG
measures voltage fluctuations resulting from ionic current flows within the neurons of
the brain. In clinical contexts, EEG refers to the recording of the brain's spontaneous
electrical activity over a short period of time, usually 20–40 minutes, as recorded from
multiple electrodes placed on the scalp.

Signal
Frequency range (Hz)
Amplitude range(mV)
ECG
0.01 – 300
0.05 – 3
EEG
0.1 – 100
0.001 – 1
EOG
0.1 – 10
0.001 – 0.3
EMG
50 – 3000
0.001 – 100
Frequency & Amplitude Ranges for Bioelectric Signals

Diagnostic applications generally focus on the spectral content of EEG, that is,
the type of neural oscillations that can be observed in EEG signals. In neurology,
the main diagnostic application of EEG is in the case of epilepsy, as epileptic
activity can create clear abnormalities on a standard EEG study.
A secondary clinical use of EEG is in the diagnosis of coma, encephalopathy,
and brain death. A third clinical use of EEG is for studies of sleep and sleep
disorders where recordings are typically done for one full night, sometimes more.
EEG used to be a first-line method for the diagnosis of tumors, stroke and other
focal brain disorders, but this use has decreased with the advent of anatomical
imaging techniques with high (<1 mm) spatial resolution such as MRI (magnetic
resonance imaging) and CT (computed tomography). Despite limited spatial
resolution, EEG continues to be a valuable tool for research and diagnosis,
especially when millisecond-range temporal resolution (not possible with CT or
MRI) is required.
Electroencephalography

The cerebral cortex is composed of neurons that are interconnected to each other in networks and also receive inputs from other areas of the brain. Electrical activity in the form of nerve impulses being sent and received to and from cortical neurons is always present, even during sleep. Biologically, medically and legally, the absence of cortical activity signifies death. The electrical activity you are measuring reflects both the intrinsic activity of neurons in the cerebral cortex and the information sent to it by subcortical structures and the sense receptors. This composite activity is called an electroencephalogram or EEG. An EEG electrode will mainly detect the activity in the brain region just under it. Nevertheless, the electrodes receive the activity from thousands of neurons. In fact, one square millimeter of cortex has more than 100,000 neurons. It is only when the input to a region is synchronized with electrical activity occurring at the same time that you begin to distinguish simple periodic waveforms in the EEG.
Electroencephalography
Source of EEG activity The brain's electrical charge is maintained by billions of neurons. Neurons are electrically charged (or "polarized") by membrane transport proteins that pump ions across their membranes. Neurons are constantly exchanging ions with the extracellular milieu, for example to maintain resting potential and to propagate action potentials. Ions of similar charge repel each other, and when many ions are pushed out of many neurons at the same time, they can push their neighbors, who push their neighbors, and so on, in a wave. This process is known as volume conduction. When the wave of ions reaches the electrodes on the scalp, they can push or pull electrons on the metal on the electrodes. Since metal conducts the push and pull of electrons easily, the difference in push or pull voltages between any two electrodes can be measured by a voltmeter. Recording these voltages over time gives us the EEG. The electric potential generated by single neuron is far too small to be picked up by EEG or MEG. EEG activity therefore always reflects the summation of the synchronous activity of thousands or millions of neurons that have similar spatial orientation. Scalp EEG activity shows oscillations at a variety of frequencies. Several of these oscillations have characteristic frequency ranges, spatial distributions and are associated with different states of brain functioning (e.g., waking and the various sleep stages). These oscillations represent synchronized activity over a network of neurons.
Electroencephalography

German physiologist and psychiatrist Hans Berger (1873–1941)
recorded the first human EEG in 1924. Expanding on work
previously conducted on animals by Richard Caton and others,
Berger also invented the electroencephalogram (giving the device its
name), an invention described "as one of the most surprising,
remarkable, and momentous developments in the history of clinical
neurology". His discoveries were first confirmed by British
scientists E. D. Adrian and B. H. C. Matthews in 1934 and
developed by them.
Hans Berger
Electroencephalography
The first human EEG recording obtained by Hans Berger in 1924. The upper tracing is
EEG, and the lower is a 10 Hz timing signal.

Epileptic spike and wave discharges monitored with EEG
In conventional scalp EEG, the recording is obtained by placing electrodes on the scalp
with a conductive gel or paste, usually after preparing the scalp area by light abrasion to
reduce impedance due to dead skin cells. Many systems typically use electrodes, each of
which is attached to an individual wire. Some systems use caps or nets into which
electrodes are embedded; this is particularly common when high-density arrays of
electrodes are needed.
Computer Electroencephalograph Neurovisor-BMM 40
Electroencephalography
Portable recording device for EEG

PreprocessingFeature
Extraction by FD(CEM)
Classification(Detection)
SignalAcquisition
ApplicationInterface
Brain Computer Interface
Signal Processing
Feedback
Electroencephalography

Electroencephalography

• EEG signals are created by measuring the difference in electrical currents across neuron membranes.
• Many naturally occurring signals in the human body effect EEG signals.
• Frequency analysis helps to separate the different signals.
• Electrode placement can effect signals received.
Electroencephalography

GND
GND
REF
T5
P3 PZ P4
T4T3 C4
F3 F4
F8F7
FP1 FP2
O2O1
T6
FZ
CZC3
NASION
Where to place the electrodes? • The electrodes are placed according to the international standard 10-20 system.
• The electrode position of 16 channels placed as shown in Fig. of frontal area (F3 and F4), central area (C3, Cz and C4), parietal area(P3, Pz and P4)
• The grounding electrode and referencing electrode are placed at forehead and right ear lobe respectively.
• EEG signal are digitized at 1024 samples/sec, resolution 16bit/sample.
• Signals are analog bandpass filtered between 1.5 and 100 Hz.
Electroencephalography

EEG is a difference in potential between two electrodes.
Electroencephalography

Electroencephalography
Delta waves: 1-5 Hz
Theta waves: 4-8 Hz
Alpha/Mu waves: 8-13 Hz
Beta waves: 13-30 Hz
Gamma waves: 30-100 Hz
1 second of
Characteristic EEG signals
20-200 mV
5-10 mV 10 mV
20-200 mV

Electroencephalography
Amplitude is the voltage in microvolts measured from the peak of the wave to the trough of the wave. Varies from 10 mV to 100 mV with average around 20-50 mV.
Spectrums reflect the amount of energy in a certain frequency range of EEG.
The presence of large-amplitude delta-activity may indicate infarct or other lesion.
Slow (0-4 Hz) and high (more 20 Hz) frequency bands of EEG may pick up artifacts, such as eye movements and muscle activity, and therefore should be evaluated with caution.
The presence of large amplitude spikes and waves may indicate the presence of epilepsy.

EEG is a mixture of waves at
different frequencies and
amplitudes.
Electroencephalography
At each time interval several sine-waves
at different frequencies may be present in
the signal.

Electroencephalography
Eyes opened condition
Eyes closed condition

Electrode circuit
EEG sensing
Interference
Amplifier
Filter
Electroencephalography

Electroencephalography
EEG Amplifier Circuit
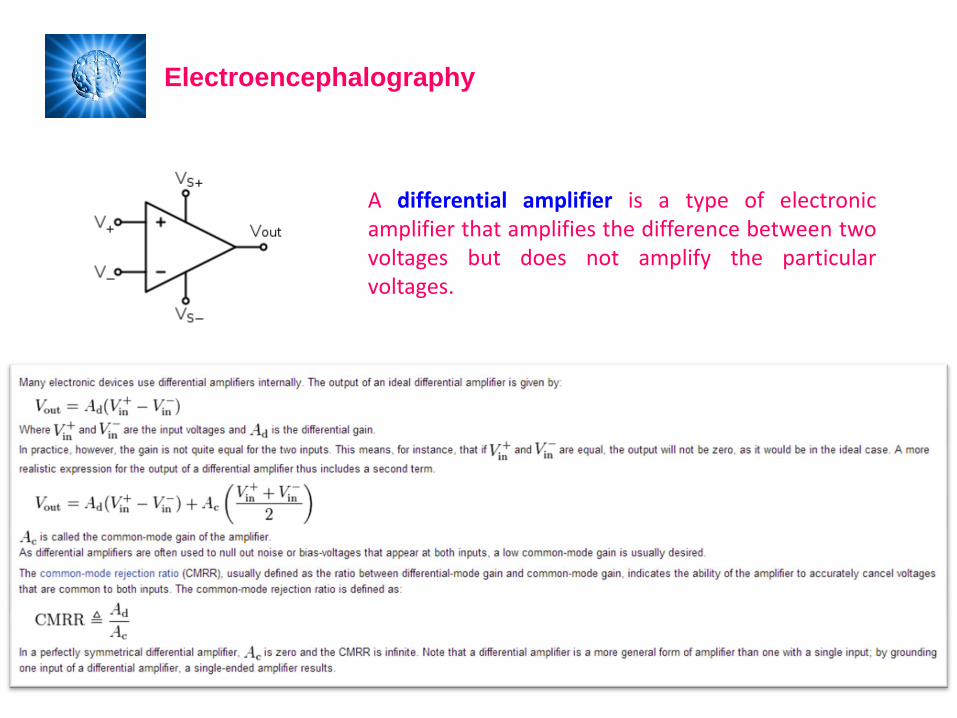
Each electrode is connected to one input of a differential amplifier (one amplifier per pair of electrodes); a common system reference electrode is connected to the other input of each differential amplifier. These amplifiers amplify the voltage between the active electrode and the reference (typically 60–100 dB of voltage gain).
Electroencephalography
A differential amplifier is a type of electronic amplifier that amplifies the difference between two voltages but does not amplify the particular voltages.

Electroencephalography
Design Block Diagram
Amplifier Schematic

Electroencephalography

Electroencephalography
Biological artifacts
Electrical signals detected along the scalp by an EEG, but that originate from non-cerebral origin are called artifacts. EEG data is almost always contaminated by such artifacts. The amplitude of artifacts can be quite large relative to the size of amplitude of the cortical signals of interest. This is one of the reasons why it takes considerable experience to correctly interpret EEGs clinically. Some of the most common types of biological artifacts include:
Eye-induced artifacts (includes eye blinks, eye movements) ECG (cardiac) artifacts EMG (muscle activation)-induced artifacts Glosso-kinetic artifacts
Environmental artifacts
In addition to artifacts generated by the body, many artifacts originate from outside the body. Movement by the patient, or even just settling of the electrodes, may cause electrode pops, spikes originating from a momentary change in the impedance of a given electrode. Poor grounding of the EEG electrodes can cause significant 50 or 60 Hz artifact, depending on the local power system's frequency. A third source of possible interference can be the presence of an IV (intravenous) drip; such devices can cause rhythmic, fast, low-voltage bursts, which may be confused for spikes.
IV drip

These types of
artifacts can be
detected by visual
inspection.
Eye blinks can be
excluded from data
analysis.
EMG should be
taken into account
during spectral
analysis.
Electroencephalography
EMG and eye blink artifacts in EEG
EMG artifact starts as low as 12 Hz and ranges to 300 Hz. Most of the spectrum lies between 30-150 Hz.
Posterior electrodes can pick up EMG from occipitalis, trapezius and supraspinal muscles.
To avoid this type of artifact one can relax or position the head properly or change slightly the position of electrode.
ECG artifacts occur from the electrodes that pick up activity from underlying pulsating blood vessels in the scalp.
EKG artifact gets more prevalent with aging.
Electroencephalography
Electroencephalography
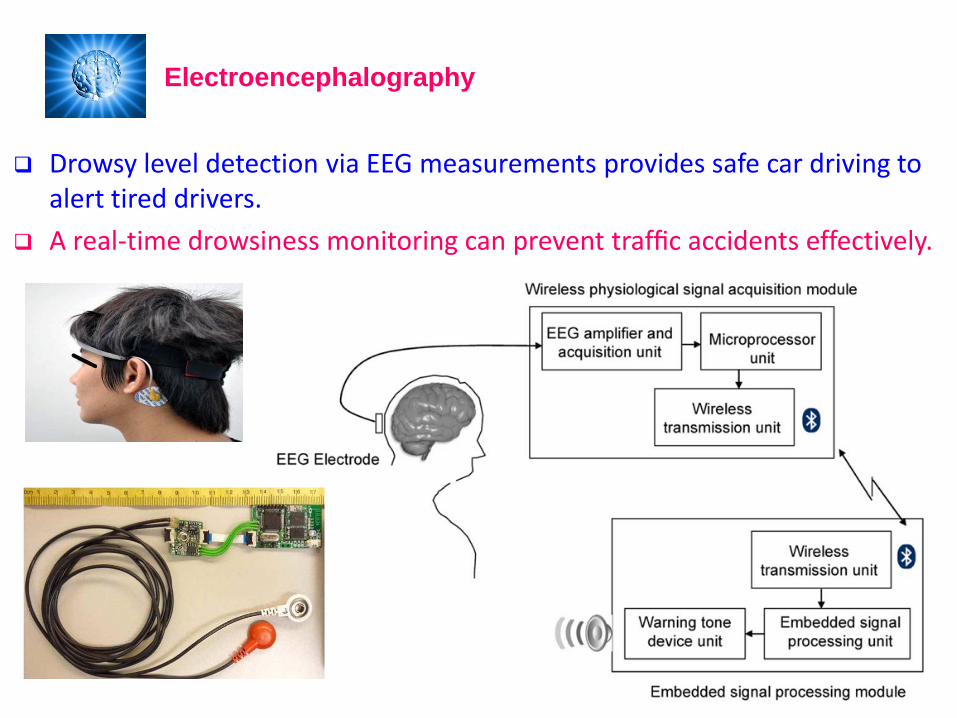
Drowsy level detection via EEG measurements provides safe car driving to alert tired drivers.
A real-time drowsiness monitoring can prevent traffic accidents effectively.

Electrocorticography (ECoG), or intracranial EEG (iEEG), is the practice of using electrodes placed directly on the exposed surface of the brain to record electrical activity from the cerebral cortex. ECoG may be performed either in the operating room during surgery (intraoperative ECoG) or outside of surgery (extraoperative ECoG). Because a craniotomy (a surgical incision into the skull) is required to implant the electrode grid, ECoG is an invasive procedure.
Electrocorticography

An electroneurogram is a method used to visualize directly recorded electrical activity of neurons in the central nervous system (brain, spinal cord) or the peripheral nervous system (nerves, ganglions). The acronym ENG is often used. An ENG is similar to an EMG, but the later is used to visualize muscular activity. An EEG is a particular type of ENG in which several electrodes are placed around the head and the general activity of the brain is recorded, without having very high resolution to distinguish between the activity of different groups of neurons. An ENG is usually obtained by placing an electrode in the neural tissue. The electrical activity generated by neurons is recorded by the electrode and transmitted to an acquisition system, which usually allows to visualize the activity of the neuron. Each vertical line in an ENG represents one neuronal action potential. Depending on the precision of the electrode used to record neural activity, an ENG can contain the activity of a single neuron to thousands of neurons. Researchers adapt the precision of their electrode to either focus on the activity of a single neuron or the general activity of a group of neurons, both strategies having their advantages.
Electroneurogram