Introduction to Sleep and Polysomnography - … · CHAPTER 11 | Introduction to Sleep and...
23
258 CHAPTER Introduction to Sleep and Polysomnography Overview of Sleep Stages and Cycles The monitoring of sleep is complex and requires a distinct skill set including a detailed knowledge of EEG, respiratory monitoring, and EKG. Expertise in only one of these areas does not confer the ability to accurately interpret the polysomnogram. Sleep is not homogeneous and is characterized by sleep stages based on electroen- cephalographic (EEG) or electrical brain wave activity, electro-oculographic (EOG) or eye movements, and electromyographic (EMG) or muscle electrical activity. 1–3 The basic termi- nology and methods involved in monitoring each of these types of activity will be discussed below. Sleep is composed of nonrapid eye movement (NREM) and rapid eye movement (REM) sleep. NREM sleep is further divided into stages 1, 2, and 3. Stages 3 and 4 sleep were recently combined into stage 3 sleep. Stages 1 and 2 are called light sleep and stage 3 is called deep or slow-wave sleep. There are usually four or five cycles of sleep, each composed of a segment of NREM sleep followed by REM sleep. Periods of wake may also interrupt sleep during the night. As the night progresses, the length of REM sleep in each cycle usu- ally increases. The hypnogram (Fig. 11-1) is a convenient method of graphically displaying the organization of sleep during the night. Each stage of sleep is characterized by a level on the vertical axis of the graph with time of night on the horizontal axis. REM sleep is often highlighted by a dark bar. Sleep monitoring was traditionally done by polygraph recording using ink-writing pens which produced tracings on paper. It was convenient to divide the night into epochs of time that correspond to the length of each paper page. The usual paper speed for sleep recording is 10 mm/s; a 30-cm page corresponds to 30 s. Each segment of time represented by one page is called an epoch; sleep is staged in epochs. Today most sleep recording is performed digitally, but the convention of scoring sleep in 30-s epochs or windows is still the standard. If there is a shift in sleep stage during a given epoch, the stage present for the majority of the time names the epoch. When the tracings used to stage sleep are obscured by artifact for more than one-half of an epoch, it is scored as movement time (MT). When an epoch of what would otherwise be considered an MT is surrounded by epochs of wake, the epoch is also scored as wake. Some sleep centers consider MT to be wake and do not tabulate it separately. Sleep Architecture Definitions The term sleep architecture describes the structure of sleep. Common terms used in sleep monitoring are listed in Table 11-1. The total monitoring time or total recording time (TRT) is also called total bedtime (TBT). This is the time duration from lights out (start of recording) to lights on (termination of recording). The total amount of sleep stages 1, 2, 3, REM, and MT James D. Geyer, MD Sachin Talathi, PhD Paul R. Carney, MD 11 Chap11.indd 258 Chap11.indd 258 7/24/2009 5:50:49 PM 7/24/2009 5:50:49 PM
-
Upload
nguyendang -
Category
Documents
-
view
228 -
download
0
Transcript of Introduction to Sleep and Polysomnography - … · CHAPTER 11 | Introduction to Sleep and...
258
C H A P T E R
Introduction to Sleep and Polysomnography
Overview of Sleep Stages and CyclesThe monitoring of sleep is complex and requires a distinct skill set including a detailed knowledge of EEG, respiratory monitoring, and EKG. Expertise in only one of these areas does not confer the ability to accurately interpret the polysomnogram.
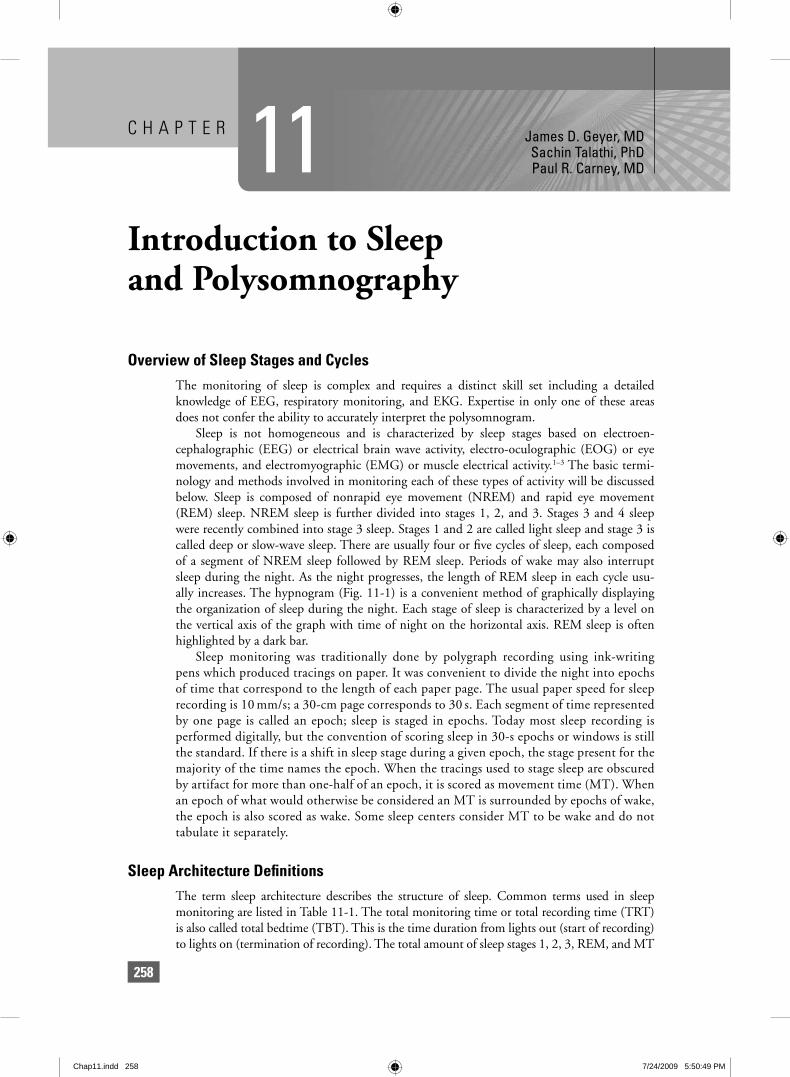
Sleep is not homogeneous and is characterized by sleep stages based on electroen-cephalographic (EEG) or electrical brain wave activity, electro-oculographic (EOG) or eye movements, and electromyographic (EMG) or muscle electrical activity.1–3 The basic termi-nology and methods involved in monitoring each of these types of activity will be discussed below. Sleep is composed of nonrapid eye movement (NREM) and rapid eye movement (REM) sleep. NREM sleep is further divided into stages 1, 2, and 3. Stages 3 and 4 sleep were recently combined into stage 3 sleep. Stages 1 and 2 are called light sleep and stage 3 is called deep or slow-wave sleep. There are usually four or fi ve cycles of sleep, each composed of a segment of NREM sleep followed by REM sleep. Periods of wake may also interrupt sleep during the night. As the night progresses, the length of REM sleep in each cycle usu-ally increases. The hypnogram (Fig. 11-1) is a convenient method of graphically displaying the organization of sleep during the night. Each stage of sleep is characterized by a level on the vertical axis of the graph with time of night on the horizontal axis. REM sleep is often highlighted by a dark bar.
Sleep monitoring was traditionally done by polygraph recording using ink-writing pens which produced tracings on paper. It was convenient to divide the night into epochs of time that correspond to the length of each paper page. The usual paper speed for sleep recording is 10 mm/s; a 30-cm page corresponds to 30 s. Each segment of time represented by one page is called an epoch; sleep is staged in epochs. Today most sleep recording is performed digitally, but the convention of scoring sleep in 30-s epochs or windows is still the standard. If there is a shift in sleep stage during a given epoch, the stage present for the majority of the time names the epoch. When the tracings used to stage sleep are obscured by artifact for more than one-half of an epoch, it is scored as movement time (MT). When an epoch of what would otherwise be considered an MT is surrounded by epochs of wake, the epoch is also scored as wake. Some sleep centers consider MT to be wake and do not tabulate it separately.
Sleep Architecture Defi nitionsThe term sleep architecture describes the structure of sleep. Common terms used in sleep monitoring are listed in Table 11-1. The total monitoring time or total recording time (TRT) is also called total bedtime (TBT). This is the time duration from lights out (start of recording) to lights on (termination of recording). The total amount of sleep stages 1, 2, 3, REM, and MT
James D. Geyer, MDSachin Talathi, PhDPaul R. Carney, MD11
Chap11.indd 258Chap11.indd 258 7/24/2009 5:50:49 PM7/24/2009 5:50:49 PM
259CHAPTER 11 | Introduction to Sleep and Polysomnography
is termed the total sleep time (TST). The time from the fi rst sleep until the fi nal awakening is called the sleep period time (SPT). SPT encompasses all sleep as well as periods of wake after sleep onset (WASO) and before the fi nal awakening. This wake time is termed the “wake after sleep onset” Therefore, SPT = TST + WASO. The time from the start of sleep monitoring (or lights out) until the fi rst epoch of sleep is called the sleep latency. The time from the fi rst epoch of sleep until the fi rst REM sleep is called the REM latency. It is useful not only to determine the total minutes of each sleep stage but also to characterize the relative proportion of time spent in each sleep stage. One can characterize stages 1 to 3 and REM as a percentage of TST (%TST). Another method is to characterize the sleep stages and WASO as a percentage of the SPT (%SPT). Sleep effi ciency (in percent) is usually defi ned as either the TST × 100/SPT or TST × 100/TBT.
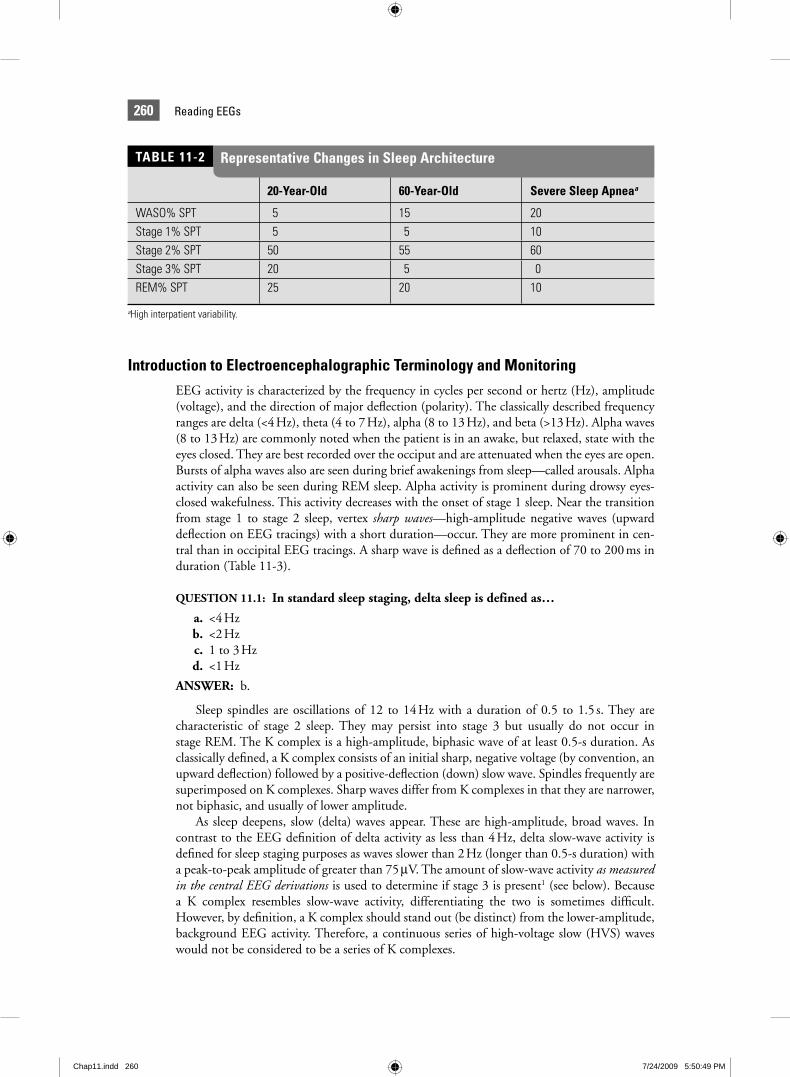
The normal range of the percentage of sleep spent in each sleep stage varies with age2,3 and is impacted by sleep disorders (Table 11-2). In adults, there is a decrease in stage 3 sleep with increasing age, while the amount of REM sleep remains fairly constant. The amounts of stage 1 sleep and WASO also increase with age. In patients with severe obstructive sleep apnea (OSA), there is often no stage 3 sleep and a reduced amount of REM sleep. Chronic insomnia (diffi culty initiating or maintaining sleep) is characterized by a long sleep latency and increased WASO. The amount of stages 3 and REM sleep is commonly decreased as well. The REM latency is also affected by sleep disorders and medications. A short REM latency (usually <70 min) is noted in some cases of sleep apnea, depression, narcolepsy, prior REM sleep deprivation, and the withdrawal of REM suppressant medications. An increased REM latency can be seen with REM suppressants (ethanol and many antidepressants), an unfamiliar or uncomfortable sleep environment, sleep apnea, and any process that disturbs the sleep quality.
FIGURE 11-1. Typical hypnogram: The various stages of sleep are represented by levels on the vertical axis; time of night is shown on the horizontal axis. In this patient, there were several sleep cycles, each composed of a segment of NREM sleep followed by REM sleep. The length of REM sleep increased toward morning.
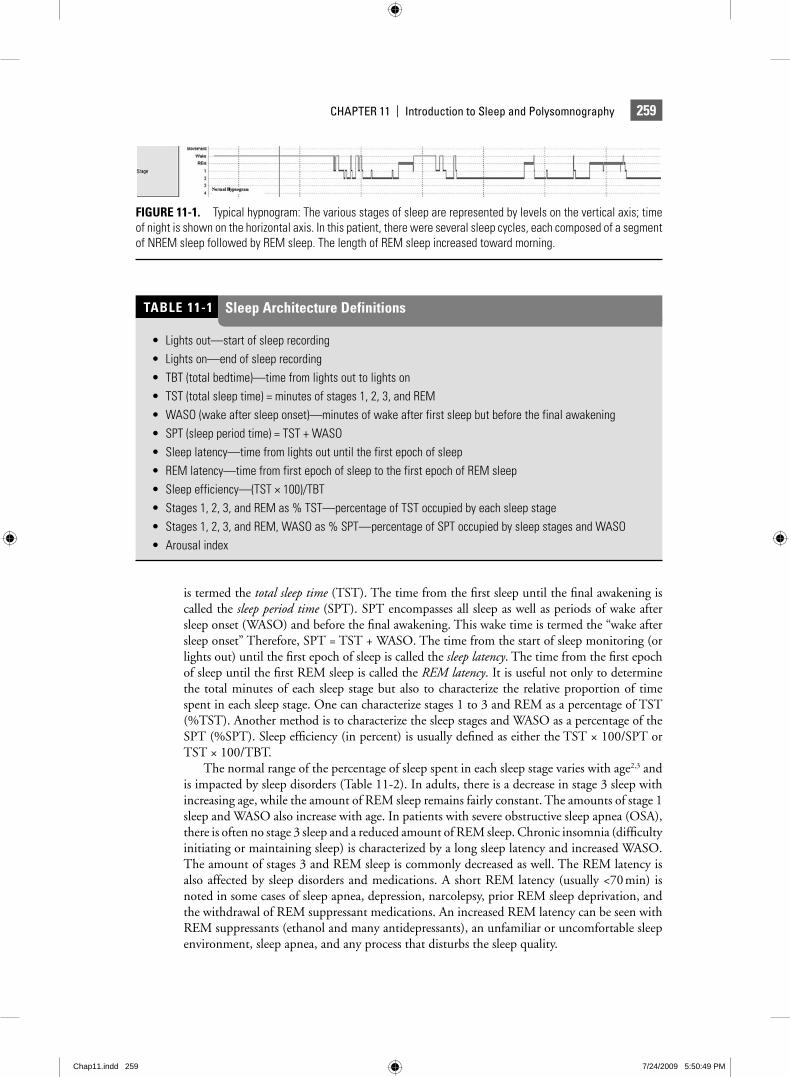
• Lights out—start of sleep recording• Lights on—end of sleep recording• TBT (total bedtime)—time from lights out to lights on• TST (total sleep time) = minutes of stages 1, 2, 3, and REM• WASO (wake after sleep onset)—minutes of wake after first sleep but before the final awakening• SPT (sleep period time) = TST + WASO• Sleep latency—time from lights out until the first epoch of sleep• REM latency—time from first epoch of sleep to the first epoch of REM sleep• Sleep efficiency—(TST × 100)/TBT• Stages 1, 2, 3, and REM as % TST—percentage of TST occupied by each sleep stage• Stages 1, 2, 3, and REM, WASO as % SPT—percentage of SPT occupied by sleep stages and WASO• Arousal index
TABLE 11-1 Sleep Architecture Definitions
Chap11.indd 259Chap11.indd 259 7/24/2009 5:50:49 PM7/24/2009 5:50:49 PM
260 Reading EEGs
Introduction to Electroencephalographic Terminology and MonitoringEEG activity is characterized by the frequency in cycles per second or hertz (Hz), amplitude (voltage), and the direction of major defl ection (polarity). The classically described frequency ranges are delta (<4 Hz), theta (4 to 7 Hz), alpha (8 to 13 Hz), and beta (>13 Hz). Alpha waves (8 to 13 Hz) are commonly noted when the patient is in an awake, but relaxed, state with the eyes closed. They are best recorded over the occiput and are attenuated when the eyes are open. Bursts of alpha waves also are seen during brief awakenings from sleep—called arousals. Alpha activity can also be seen during REM sleep. Alpha activity is prominent during drowsy eyes-closed wakefulness. This activity decreases with the onset of stage 1 sleep. Near the transition from stage 1 to stage 2 sleep, vertex sharp waves—high-amplitude negative waves (upward defl ection on EEG tracings) with a short duration—occur. They are more prominent in cen-tral than in occipital EEG tracings. A sharp wave is defi ned as a defl ection of 70 to 200 ms in duration (Table 11-3).
QUESTION 11.1: In standard sleep staging, delta sleep is defined as…
a. <4 Hz b. <2 Hz c. 1 to 3 Hz d. <1 Hz
ANSWER: b.
Sleep spindles are oscillations of 12 to 14 Hz with a duration of 0.5 to 1.5 s. They are characteristic of stage 2 sleep. They may persist into stage 3 but usually do not occur in stage REM. The K complex is a high-amplitude, biphasic wave of at least 0.5-s duration. As classically defi ned, a K complex consists of an initial sharp, negative voltage (by convention, an upward defl ection) followed by a positive-defl ection (down) slow wave. Spindles frequently are superimposed on K complexes. Sharp waves differ from K complexes in that they are narrower, not biphasic, and usually of lower amplitude.
As sleep deepens, slow (delta) waves appear. These are high-amplitude, broad waves. In contrast to the EEG defi nition of delta activity as less than 4 Hz, delta slow-wave activity is defi ned for sleep staging purposes as waves slower than 2 Hz (longer than 0.5-s duration) with a peak-to-peak amplitude of greater than 75 μV. The amount of slow-wave activity as measured in the central EEG derivations is used to determine if stage 3 is present1 (see below). Because a K complex resembles slow-wave activity, differentiating the two is sometimes diffi cult. However, by defi nition, a K complex should stand out (be distinct) from the lower-amplitude, background EEG activity. Therefore, a continuous series of high-voltage slow (HVS) waves would not be considered to be a series of K complexes.
20-Year-Old 60-Year-Old Severe Sleep Apneaa
WASO% SPT 5 15 20Stage 1% SPT 5 5 10Stage 2% SPT 50 55 60Stage 3% SPT 20 5 0REM% SPT 25 20 10
aHigh interpatient variability.
TABLE 11-2 Representative Changes in Sleep Architecture
Chap11.indd 260Chap11.indd 260 7/24/2009 5:50:49 PM7/24/2009 5:50:49 PM
261CHAPTER 11 | Introduction to Sleep and Polysomnography
Sawtooth waves (see Fig. 11-10) are notched-jagged waves of frequency in the theta range (3 to 7 Hz) that may be present during REM sleep. Although they are not part of the criteria for scoring REM sleep, their presence is a clue that REM sleep is present.
Eye Movement RecordingThe main purpose of recording eye movements is to identify REM sleep. EOG (eye movement) electrodes typically are placed at the outer corners of the eyes—at the right outer canthus (ROC) and the left outer canthus (LOC). In a common approach, two eye channels are recorded and the eye electrodes are referenced to the opposite mastoid (ROC-A1 and LOC-A2). However, some sleep centers use the same mastoid electrode as a reference (ROC-A1 and LOC-A1). To detect vertical as well as horizontal eye movements, one electrode is placed slightly above and one slightly below the eyes.4,5
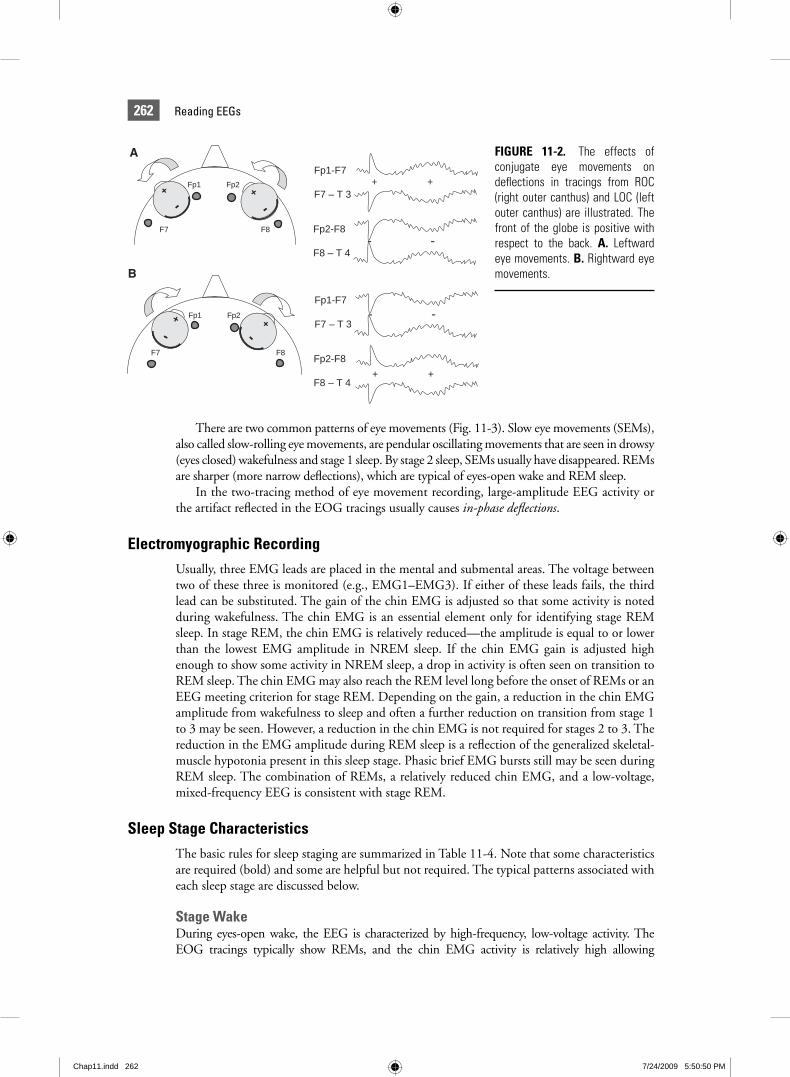
Recording of eye movements is possible because a potential difference exists across the eyeball: front positive (+), back negative (–). Eye movements are detected by EOG recording of voltage changes. When the eyes move toward an electrode, a positive voltage is recorded (Fig. 11-2). By standard convention, polygraphs are calibrated so that a negative voltage causes an upward pen defl ection (negative polarity up). Thus, eye movement toward an electrode results in a downward defl ection.4,7 Note that movement of the eyes is usually conjugate, with both the eyes moving toward one eye electrode and away from the other. If the eye channels are calibrated with the same polarity settings, eye movements produce out-of-phase defl ections in the two eye tracings (e.g., one up and one down). Figure 11-3 shows the recorded results of eye movements to the right and left (assuming both amplifi er chan-nels have negative polarity up). The same approach can be used to understand the tracings resulting from vertical eye movements. Because ROC is positioned above the eyes (and LOC below), upward eye movements are toward ROC and away from LOC. Thus, upward eye movement results in a downward defl ection in the ROC tracing and an upward defl ection in the LOC tracing.
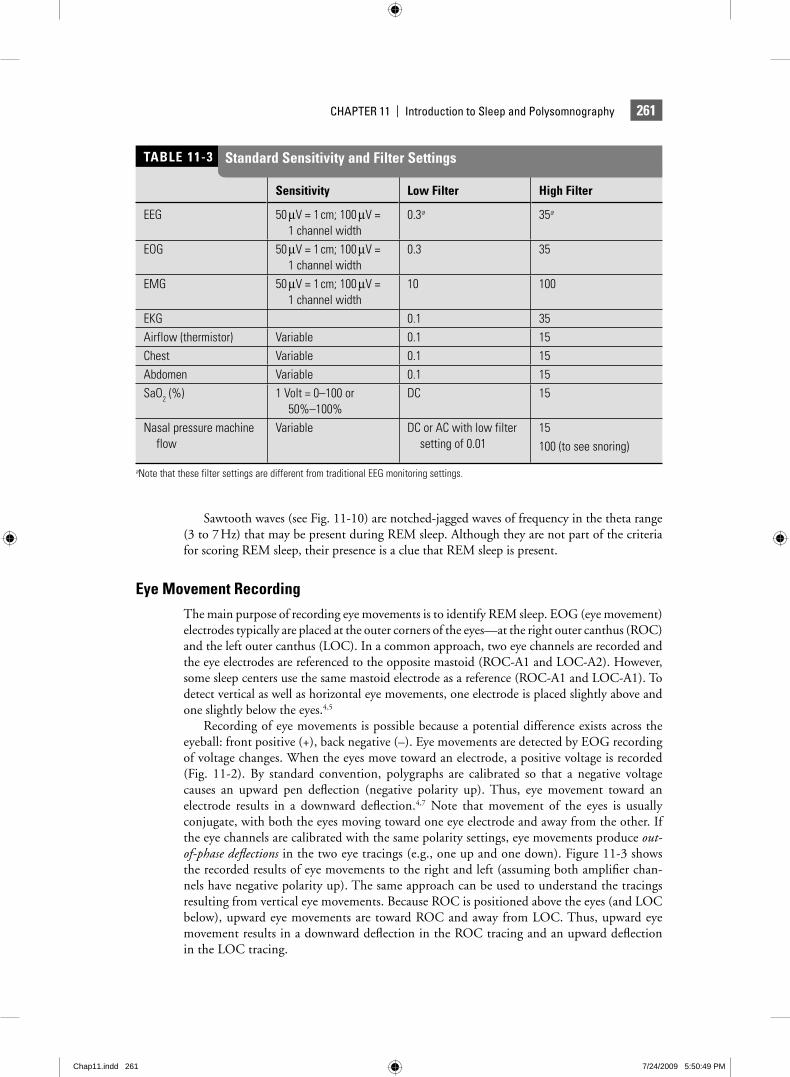
Sensitivity Low Filter High Filter
EEG 50 μV = 1 cm; 100 μV = 1 channel width
0.3a 35a
EOG 50 μV = 1 cm; 100 μV = 1 channel width
0.3 35
EMG 50 μV = 1 cm; 100 μV = 1 channel width
10 100
EKG 0.1 35Airflow (thermistor) Variable 0.1 15Chest Variable 0.1 15Abdomen Variable 0.1 15SaO2 (%) 1 Volt = 0–100 or
50%–100%DC 15
Nasal pressure machine flow
Variable DC or AC with low filter setting of 0.01
15 100 (to see snoring)
aNote that these filter settings are different from traditional EEG monitoring settings.
TABLE 11-3 Standard Sensitivity and Filter Settings
Chap11.indd 261Chap11.indd 261 7/24/2009 5:50:49 PM7/24/2009 5:50:49 PM
262 Reading EEGs
There are two common patterns of eye movements (Fig. 11-3). Slow eye movements (SEMs), also called slow-rolling eye movements, are pendular oscillating movements that are seen in drowsy (eyes closed) wakefulness and stage 1 sleep. By stage 2 sleep, SEMs usually have disappeared. REMs are sharper (more narrow defl ections), which are typical of eyes-open wake and REM sleep.
In the two-tracing method of eye movement recording, large-amplitude EEG activity or the artifact refl ected in the EOG tracings usually causes in-phase defl ections.
Electromyographic RecordingUsually, three EMG leads are placed in the mental and submental areas. The voltage between two of these three is monitored (e.g., EMG1–EMG3). If either of these leads fails, the third lead can be substituted. The gain of the chin EMG is adjusted so that some activity is noted during wakefulness. The chin EMG is an essential element only for identifying stage REM sleep. In stage REM, the chin EMG is relatively reduced—the amplitude is equal to or lower than the lowest EMG amplitude in NREM sleep. If the chin EMG gain is adjusted high enough to show some activity in NREM sleep, a drop in activity is often seen on transition to REM sleep. The chin EMG may also reach the REM level long before the onset of REMs or an EEG meeting criterion for stage REM. Depending on the gain, a reduction in the chin EMG amplitude from wakefulness to sleep and often a further reduction on transition from stage 1 to 3 may be seen. However, a reduction in the chin EMG is not required for stages 2 to 3. The reduction in the EMG amplitude during REM sleep is a refl ection of the generalized skeletal-muscle hypotonia present in this sleep stage. Phasic brief EMG bursts still may be seen during REM sleep. The combination of REMs, a relatively reduced chin EMG, and a low-voltage, mixed-frequency EEG is consistent with stage REM.
Sleep Stage CharacteristicsThe basic rules for sleep staging are summarized in Table 11-4. Note that some characteristics are required (bold) and some are helpful but not required. The typical patterns associated with each sleep stage are discussed below.
Stage WakeDuring eyes-open wake, the EEG is characterized by high-frequency, low-voltage activity. The EOG tracings typically show REMs, and the chin EMG activity is relatively high allowing
FIGURE 11-2. The effects of conjugate eye movements on defl ections in tracings from ROC (right outer canthus) and LOC (left outer canthus) are illustrated. The front of the globe is positive with respect to the back. A. Leftward eye movements. B. Rightward eye movements.
Fp1 Fp2
F7 F8
+
-+
-Fp2-F8
F8 – T 4
Fp1-F7
F7 – T 3+ +
- -
Fp1 Fp2
F7 F8
+
-+
-
Fp2-F8
F8 – T 4
Fp1-F7
F7 – T 3
+ +
- -
A
B
Chap11.indd 262Chap11.indd 262 7/24/2009 5:50:50 PM7/24/2009 5:50:50 PM

263CHAPTER 11 | Introduction to Sleep and Polysomnography
differentiation from stage REM sleep. During eyes-closed drowsy wake, the EEG is characterized by prominent alpha activity (>50% of the epoch). Both slow, scanning and more rapid irregular eye movements are usually present. The level of muscle tone is usually relatively high (Fig. 11-4).
Stage 1The stage 1 EEG is characterized by low-voltage, mixed-frequency activity (4 to 7 Hz). Stage 1 is scored when less than 50% of an epoch contains alpha waves and criteria for deeper stages of sleep are not met (Fig. 11-5). Slow-rolling eye movements often are present in the eye movement tracings, and the level of muscle tone (EMG) is equal or diminished compared to that in the awake state. Some patients do not exhibit prominent alpha activity, making the detection of sleep onset diffi cult. The ability of a patient to produce alpha waves can be deter-mined from biocalibrations at the start of the study. The patient is asked to lie quietly with eyes open and then with the eyes closed. Alpha activity usually appears with eye closure. When patients do not produce signifi cant alpha activity, differentiating wakefulness from stage 1
FIGURE 11-3. Typical patterns of eye movements are illustrated. Tracing A: SEMs are pendular and common in drowsy wake and stage 1 sleep. Tracing B: REMs are sharper (shorter duration) and seen in eyes-open wake or REM sleep.
Chap11.indd 263Chap11.indd 263 7/24/2009 5:50:50 PM7/24/2009 5:50:50 PM

264 Reading EEGs
sleep can be diffi cult. Several points are helpful. First, the presence of REMs in the absence of a reduced chin EMG usually means the patient is still awake. However, SEMs can be present during drowsy wake and stage 1 sleep. In this case, one must differentiate wake from stage 1 by the EEG. In wake, the EEG has considerable high-frequency activity. In stage 1, the EEG is mixed frequency with activity in the 4 to 7 Hz theta range. Note the slower (wider) EEG activity in Figure 11-5. Often, the easiest method to determine sleep onset in diffi cult cases is to fi nd the fi rst epoch of unequivocal sleep (usually stage 2) and work backward. The examiner can usually be confi dent of the point of sleep onset within one or two epochs.
Vertex waves are common in stage 1 sleep and are defi ned by a sharp confi guration maximal over the central derivations. Vertex waves should be easily distinguished from the background activity.
Stage 2Stage 2 sleep is characterized by the presence of one or more K complexes (Fig. 11-6) or sleep spindles (Fig. 11-7). To qualify as stage 2, an epoch also must contain less than 20% of slow (delta) wave EEG activity (<6 s of a 30-s epoch). Slow-wave activity is defi ned as waves with a frequency less than 2 Hz and a minimum peak-to-peak amplitude of more than 75 μV. Stage 2 occupies the greatest proportion of the TST and accounts for roughly 40% to 50% of sleep.
Stage
Characteristicsa,b
EEG EOG EMG
Wake (eyes open) Low-voltage, high- frequency, attenuated alpha activity
Eye blinks, REMs Relatively high
Wake (eyes closed) Low-voltage, high- frequency > 50% alpha activity
Slow-rolling eye movements
Relatively high
Stage 1 Low-amplitude, mixed- frequency <50% alpha activity No spindles, K complexes
Slow-rolling eye movements
May be lower than wake
Sharp waves near transition to stage 2
Stage 2 At least one sleep spindle or K complex <20% slow-wave activityb
May be lower than wake
Stage 3 >20% slow-wave activity
c Usually low
Stage REM Low-voltage, mixed-frequencySawtooth waves—may be present
Episodic REMs Relatively reduced (equal or lower than the lowest in NREM)
aRequired characteristics in bold.bSlow-wave activity, frequency < 2 Hz; peak-to-peak amplitude > 75 μV; >50% means slow-wave activity present in more than 50% of the epoch; REMs, rapid eye movements.cSlow waves usually seen in EOG tracings.
TABLE 11-4 Summary of Sleep Stage Characteristics
Chap11.indd 264Chap11.indd 264 7/24/2009 5:50:50 PM7/24/2009 5:50:50 PM
265CHAPTER 11 | Introduction to Sleep and Polysomnography
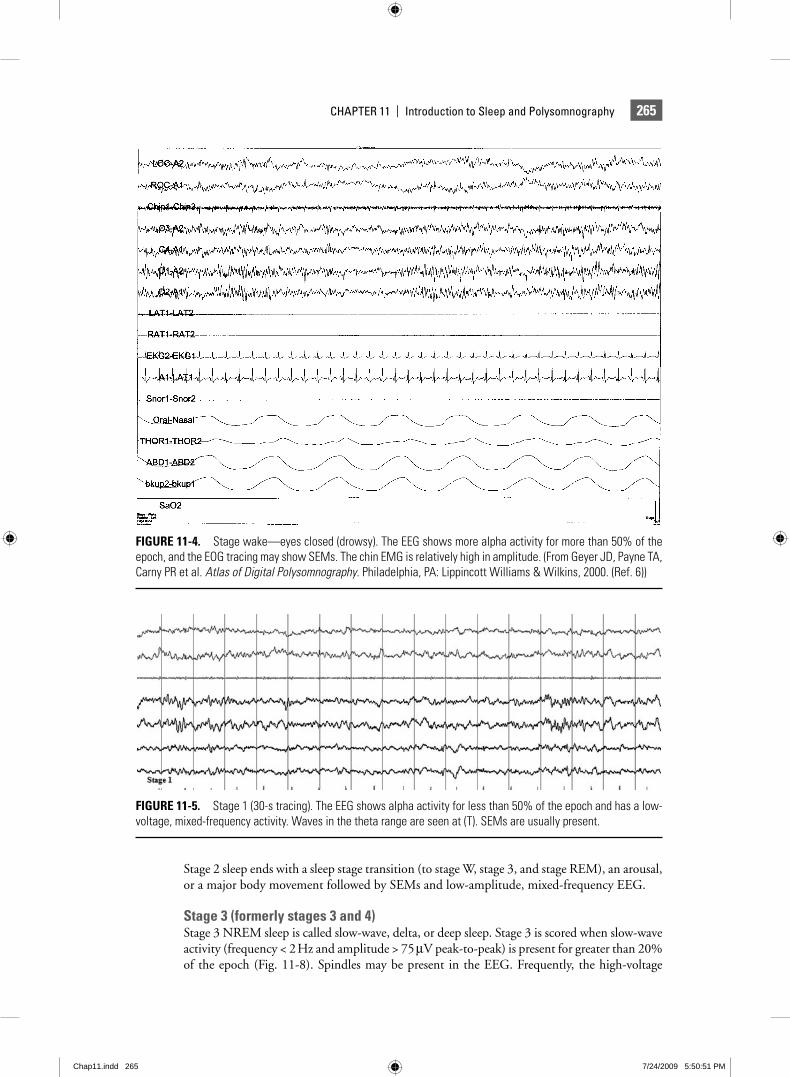
Stage 2 sleep ends with a sleep stage transition (to stage W, stage 3, and stage REM), an arousal, or a major body movement followed by SEMs and low-amplitude, mixed-frequency EEG.
Stage 3 (formerly stages 3 and 4)Stage 3 NREM sleep is called slow-wave, delta, or deep sleep. Stage 3 is scored when slow-wave activity (frequency < 2 Hz and amplitude > 75 μV peak-to-peak) is present for greater than 20% of the epoch (Fig. 11-8). Spindles may be present in the EEG. Frequently, the high-voltage
FIGURE 11-4. Stage wake—eyes closed (drowsy). The EEG shows more alpha activity for more than 50% of the epoch, and the EOG tracing may show SEMs. The chin EMG is relatively high in amplitude. (From Geyer JD, Payne TA, Carny PR et al. Atlas of Digital Polysomnography. Philadelphia, PA: Lippincott Williams & Wilkins, 2000. (Ref. 6))
FIGURE 11-5. Stage 1 (30-s tracing). The EEG shows alpha activity for less than 50% of the epoch and has a low-voltage, mixed-frequency activity. Waves in the theta range are seen at (T). SEMs are usually present.
Chap11.indd 265Chap11.indd 265 7/24/2009 5:50:51 PM7/24/2009 5:50:51 PM
266 Reading EEGs
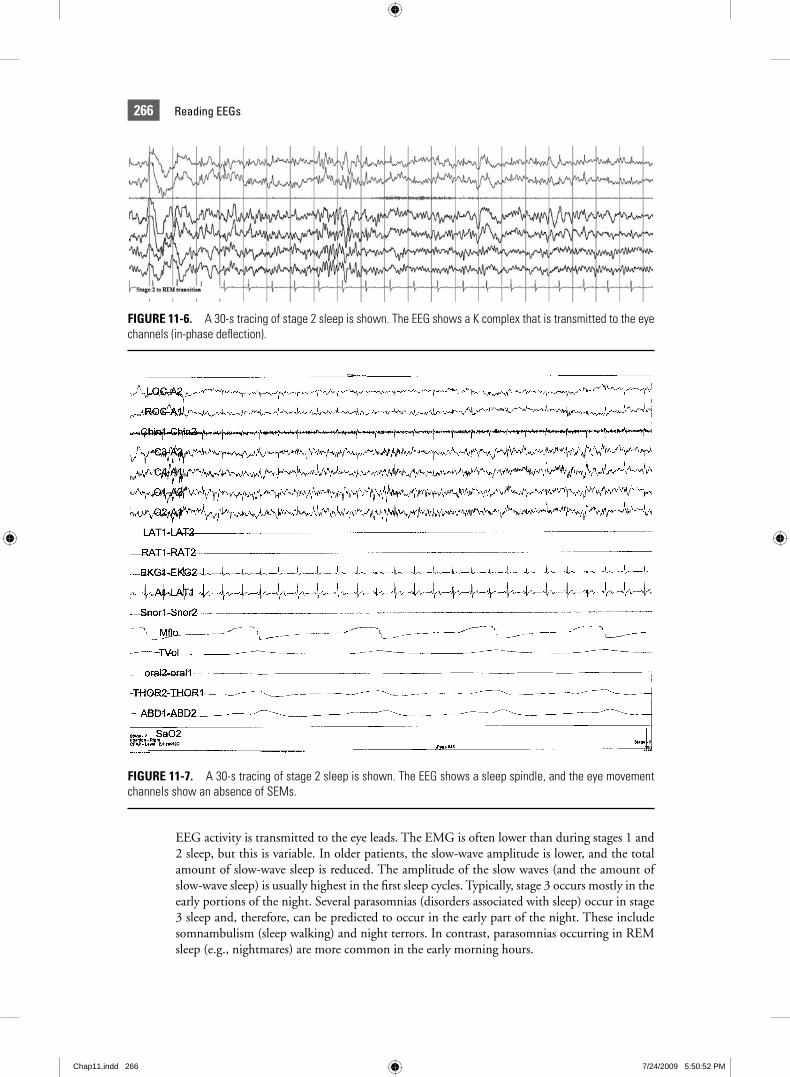
FIGURE 11-6. A 30-s tracing of stage 2 sleep is shown. The EEG shows a K complex that is transmitted to the eye channels (in-phase defl ection).
FIGURE 11-7. A 30-s tracing of stage 2 sleep is shown. The EEG shows a sleep spindle, and the eye movement channels show an absence of SEMs.
EEG activity is transmitted to the eye leads. The EMG is often lower than during stages 1 and 2 sleep, but this is variable. In older patients, the slow-wave amplitude is lower, and the total amount of slow-wave sleep is reduced. The amplitude of the slow waves (and the amount of slow-wave sleep) is usually highest in the fi rst sleep cycles. Typically, stage 3 occurs mostly in the early portions of the night. Several parasomnias (disorders associated with sleep) occur in stage 3 sleep and, therefore, can be predicted to occur in the early part of the night. These include somnambulism (sleep walking) and night terrors. In contrast, parasomnias occurring in REM sleep (e.g., nightmares) are more common in the early morning hours.
Chap11.indd 266Chap11.indd 266 7/24/2009 5:50:52 PM7/24/2009 5:50:52 PM
267CHAPTER 11 | Introduction to Sleep and Polysomnography
QUESTION 11.2: True or False. Sleep spindles are seen only during stage 2 sleep. a. True. b. False.
ANSWER: b.
EXPLANATION: Rare spindles may be seen during stage 3 sleep.
Stage REMStage REM sleep is characterized by a low-voltage, mixed-frequency EEG, the presence of episodic REMs, and a relatively low-amplitude chin EMG. Sawtooth waves (Fig. 11-9) also may occur in the EEG. There usually are three to fi ve episodes of REM sleep during the night, which tend to increase in length as the night progresses. The number of eye movements per unit time (REM density) also increases during the night. Not all epochs of REM sleep contain REMs. Epochs of sleep otherwise meeting the criteria for stage REM and contiguous with epochs of unequivocal stage REM (REMs present) are scored as stage REM (see Advanced Staging Rules). Bursts of alpha waves can occur during REM sleep, but the frequency is often 1 to 2 Hz slower than during wake.
Stage REM is associated with many unique, physiologic changes, such as widespread skel-etal-muscle hypotonia and sleep-related erections. Skeletal-muscle hypotonia is a protective mechanism to prevent the acting out of dreams. In a pathologic state known as the REM behavior disorder, muscle tone is present, and body movements and even violent behavior can occur during REM sleep.
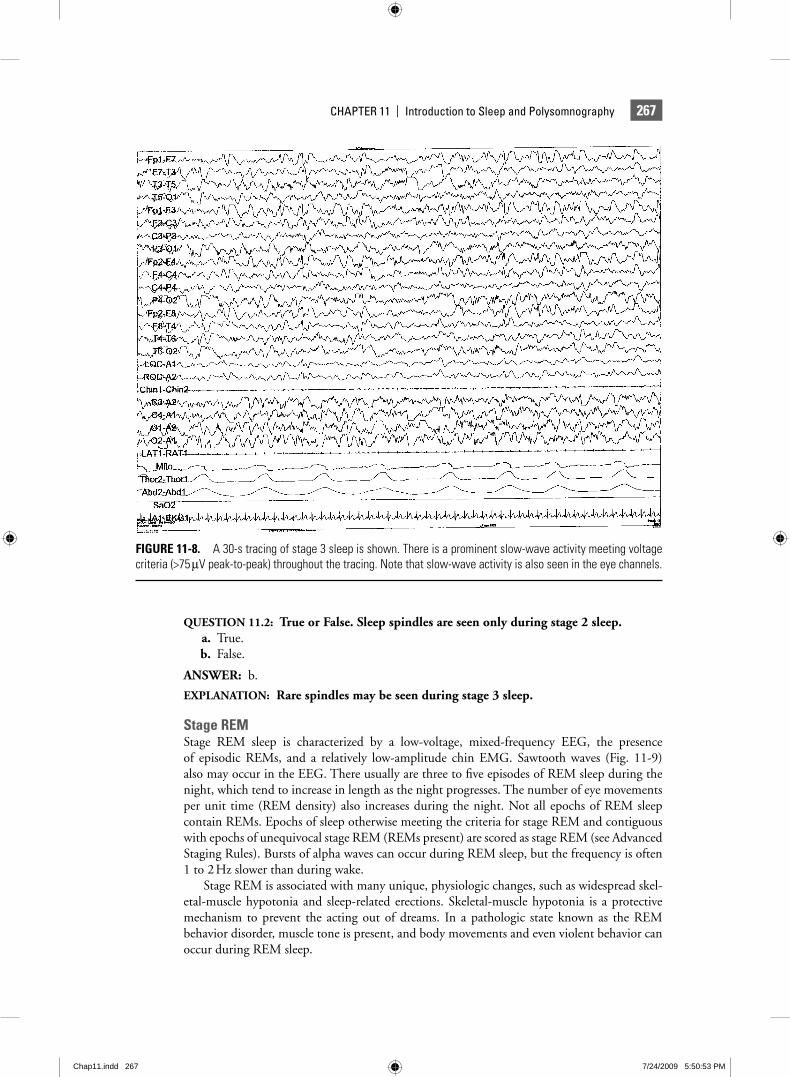
FIGURE 11-8. A 30-s tracing of stage 3 sleep is shown. There is a prominent slow-wave activity meeting voltage criteria (>75 μV peak-to-peak) throughout the tracing. Note that slow-wave activity is also seen in the eye channels.
Chap11.indd 267Chap11.indd 267 7/24/2009 5:50:53 PM7/24/2009 5:50:53 PM
268 Reading EEGs
QUESTION 11.3: In which of the following stages of sleep can an alpha rhythm arise?
1. Stage wake, eyes closed. 2. Stage 1 sleep. 3. Stage 3 sleep. 4. Stage REM sleep.
a. 1. b. 2 and 4. c. 1, 2, and 4. d. 1, 2, 3, and 4.
ANSWER: d.
ArousalsArousal from sleep denotes a transition from a state of sleep to wakefulness. Frequent arousals can cause daytime sleepiness by shortening the total amount of sleep. However, even if arous-als are brief (1 to 5 s) with a rapid return to sleep, daytime sleepiness may result, although the TST is relatively normal.8 Thus, the restorative function of sleep depends on continu-ity as well as duration. Many disorders that are associated with excessive daytime sleepiness are also associated with frequent, brief arousals. For example, patients with OSA frequently have arousals coincident with apnea/hypopnea termination. Therefore, determination of the frequency of arousals has become a standard part of the analysis of sleep architecture during sleep testing.
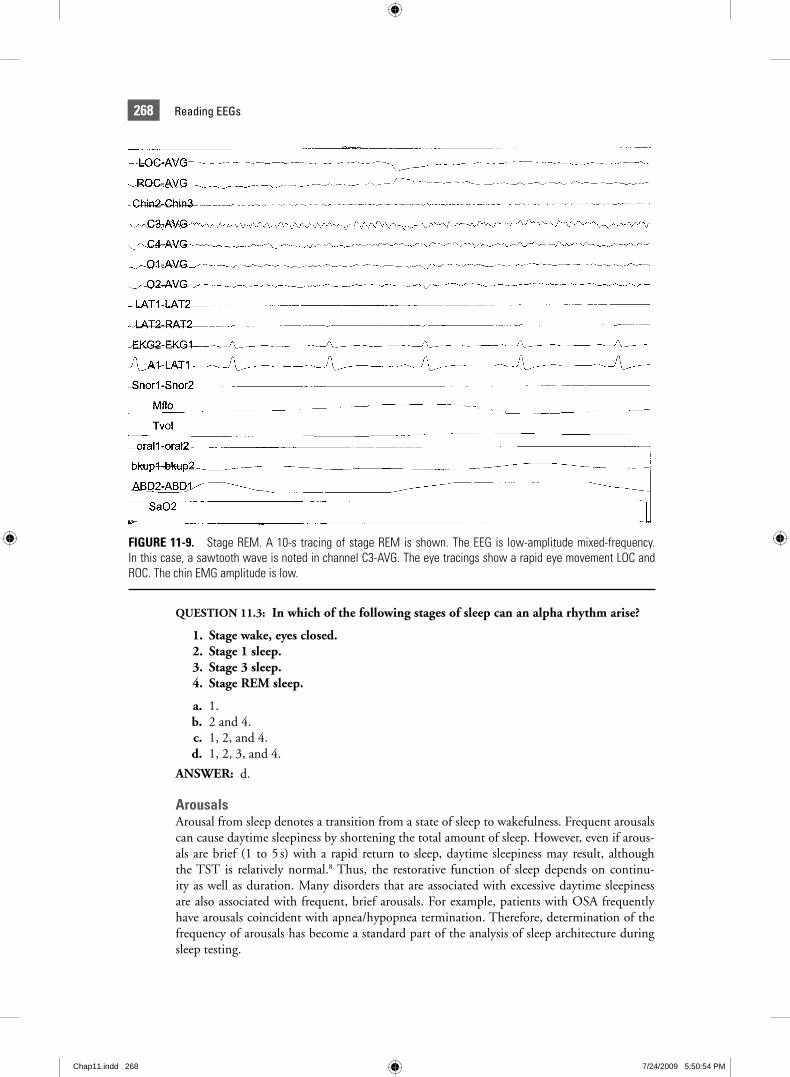
FIGURE 11-9. Stage REM. A 10-s tracing of stage REM is shown. The EEG is low-amplitude mixed-frequency. In this case, a sawtooth wave is noted in channel C3-AVG. The eye tracings show a rapid eye movement LOC and ROC. The chin EMG amplitude is low.
Chap11.indd 268Chap11.indd 268 7/24/2009 5:50:54 PM7/24/2009 5:50:54 PM

269CHAPTER 11 | Introduction to Sleep and Polysomnography
Movement arousals were defi ned in the Rechtschaffen and Kales (R&K) scoring manual1 as an increase in EMG that is accompanied by a change in the pattern on any additional channel. For EEG channels, qualifying changes included a decrease in amplitude, paroxysmal high- voltage activity, or an increase in alpha activity. Subsequently, arousals were the object of considerable research, but the criteria used to defi ne them were variable. A report from the Atlas Task Force of the American Academy of Sleep Medicine (formerly the American Sleep Disorders Association or ASDA) has become the standard defi nition.9 According to the ASDA Task Force, an arousal should be scored in NREM sleep when there is “an abrupt shift in EEG frequency, which may include theta, alpha, and/or frequencies greater than 16 Hz, but not spindles,” of 3 s or longer duration. The 3-s duration was chosen for methodological reasons; shorter arousals may also have physiologic importance. To be scored as an arousal, the shift in EEG frequency must follow at least 10 continuous seconds of any stage of sleep. Arousals in NREM sleep may occur without a concurrent increase in the submental EMG amplitude. In REM sleep, however, the required EEG changes must be accompanied by a concurrent increase in EMG amplitude for an arousal to be scored. This extra requirement was added because spontaneous bursts of alpha rhythm are a fairly common occurrence in REM (but not NREM) sleep. Note that according to the above recommendations, increases in the chin EMG in the absence of EEG changes are not considered evidence of arousal in either NREM or REM sleep. Scoring of arousal during REM does how-ever require a concurrent increase in submental EMG lasting at least 1 s. Similarly, sudden bursts of delta (slow-wave) activity in the absence of other changes do not qualify as evidence of arousal. Because cortical EEG changes must be present to meet the above defi nition, such events are also termed electrocortical arousals. Note that the above guidelines represent a consensus on events likely to be of physiologic signifi cance. The committee recognized that other EEG phenomena, such as delta bursts, also can represent evidence of arousal in certain contexts.
The frequency of arousals usually is computed as the arousal index (number of arousals per hour of sleep). Relatively little data are available to defi ne a normal range for the arousal index. Normal young adults studied after adaptation nights frequently have an arousal index of fi ve per hour or less. In one study, however, normal subjects of variable ages had a mean arousal index of 21 per hour, and the arousal index was found to increase with age.10 However, a respiratory arousal index (RAI) (arousals associated with respiratory events) as low as 10 per hour has been associated with daytime sleepiness in some individuals with the upper-airway resistance syndrome (UARS).11 While some have argued that patients with this disorder really represent the mild end of the OSA syndrome, most would agree with the concept that respira-tory arousals of suffi cient frequency can cause daytime sleepiness in the absence of frank apnea and arterial oxygen desaturation.
QUESTION 11.4: Which of the following frequency shifts does not accompany an arousal?
a. Theta b. Alpha c. Frequencies > 16 Hz d. Spindles
ANSWER: d.
Advanced Sleep Staging RulesStaging of REM sleep also requires special rules (REM rules) to defi ne the beginning and the end of REM sleep. This is necessary because REMs are episodic, and the three indicators of stage REM (EEG, EOG, and EMG) may not change to (or from) the REM-like pattern simultaneously. Rechtschaffen and Kales recommend that any section of the record that is contiguous with uneqivocal stage REM and displays a relatively low-voltage, mixed-frequency EEG be scored as stage REM regardless of whether REMs are present, providing the EMG is
Chap11.indd 269Chap11.indd 269 7/24/2009 5:50:55 PM7/24/2009 5:50:55 PM
270 Reading EEGs
at the stage REM level. To be REM-like, the EEG must not contain spindles, K complexes, or slow waves.
Atypical Sleep PatternsFour special cases in which sleep staging is made diffi cult by atypical EEG, EOG, and EMG patterns will be briefl y mentioned. In alpha sleep, prominent alpha activity persists into NREM sleep. The presence of spindles, K complexes, and slow-wave activity allows sleep stag-ing despite prominent alpha activity. Causes of the pattern include pain, psychiatric disorders, chronic pain syndromes, and any cause of nonrestorative sleep.12,13 Patients taking benzodiaz-epines may have very prominent “pseudo-spindle” activity (14 to 16 Hz rather than the usual 12 to 14 Hz).14 SEMs are usually absent by the time stable stage 2 sleep is present. However, patients on some serotonin reuptake inhibitors (fl uoxetine and others) may have prominent slow and rapid eye movements during NREM sleep.15 While a reduction in the chin EMG is required for staging REM sleep, patients with the REM sleep behavior disorder may have high chin activity during what otherwise appears to be REM sleep.16
Sleep Staging in Infants and ChildrenNewborn term infants do not have the well-developed adult EEG patterns to allow staging according to Rechtschaffen and Kales rules. The following is a brief description of terminology and sleep staging for the newborn infant according to the state determination of Anders et al.17 Infant sleep is divided into active sleep (corresponding to REM sleep), quiet sleep (corresponding to NREM sleep), and indeterminant sleep, which is often a transitional sleep stage. Behavioral observations are critical. Wakefulness is characterized by crying, quiet eyes open, and feeding. Sleep is often defi ned as sustained eye closure. Newborn infants typically have periods of sleep lasting 3 to 4 h interrupted by feeding, and total sleep in 24 h is usually 16 to 18 h. They have cycles of sleep with a 45- to 60-min periodicity with about 50% active sleep. In newborns, the presence of REM (active sleep) at sleep onset is the norm. In contrast, the adult sleep cycle is 90 to 100 min, REM occupies about 20% of sleep, and NREM sleep is noted at sleep onset.
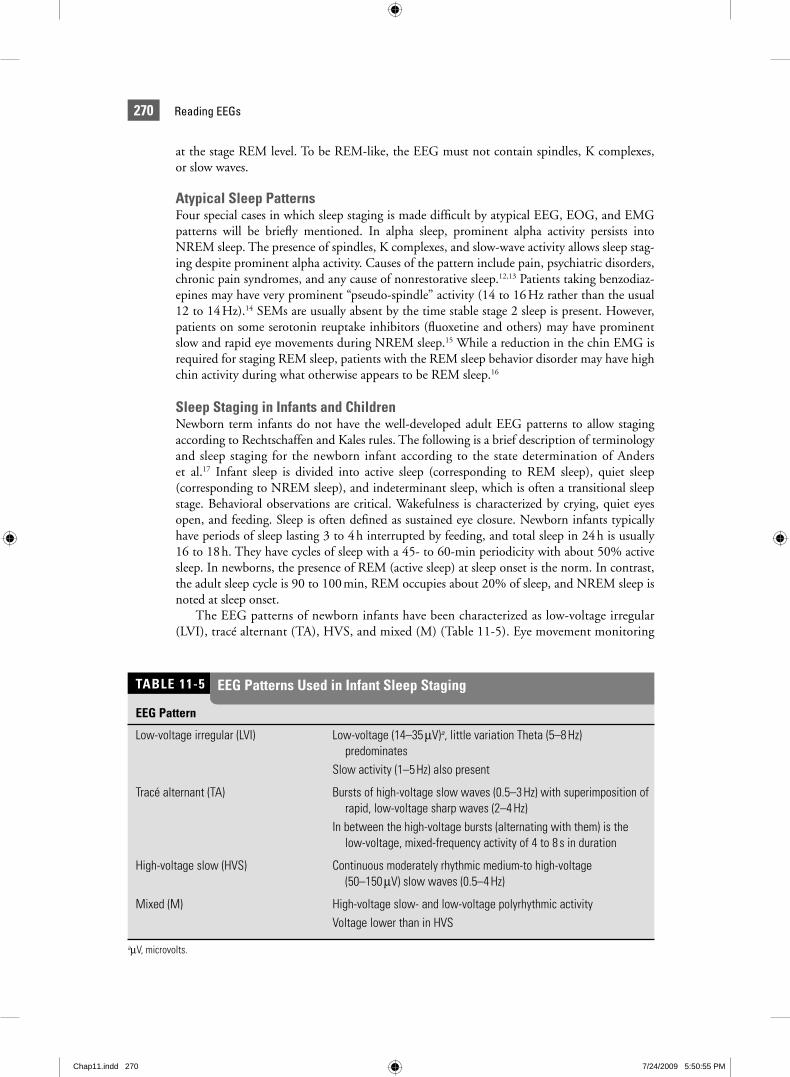
The EEG patterns of newborn infants have been characterized as low-voltage irregular (LVI), tracé alternant (TA), HVS, and mixed (M) (Table 11-5). Eye movement monitoring
EEG Pattern
Low-voltage irregular (LVI) Low-voltage (14–35 μV)a, little variation Theta (5–8 Hz) predominatesSlow activity (1–5 Hz) also present
Tracé alternant (TA) Bursts of high-voltage slow waves (0.5–3 Hz) with superimposition of rapid, low-voltage sharp waves (2–4 Hz)In between the high-voltage bursts (alternating with them) is the low-voltage, mixed-frequency activity of 4 to 8 s in duration
High-voltage slow (HVS) Continuous moderately rhythmic medium-to high-voltage (50–150 μV) slow waves (0.5–4 Hz)
Mixed (M) High-voltage slow- and low-voltage polyrhythmic activityVoltage lower than in HVS
aμV, microvolts.
TABLE 11-5 EEG Patterns Used in Infant Sleep Staging
Chap11.indd 270Chap11.indd 270 7/24/2009 5:50:55 PM7/24/2009 5:50:55 PM
271CHAPTER 11 | Introduction to Sleep and Polysomnography
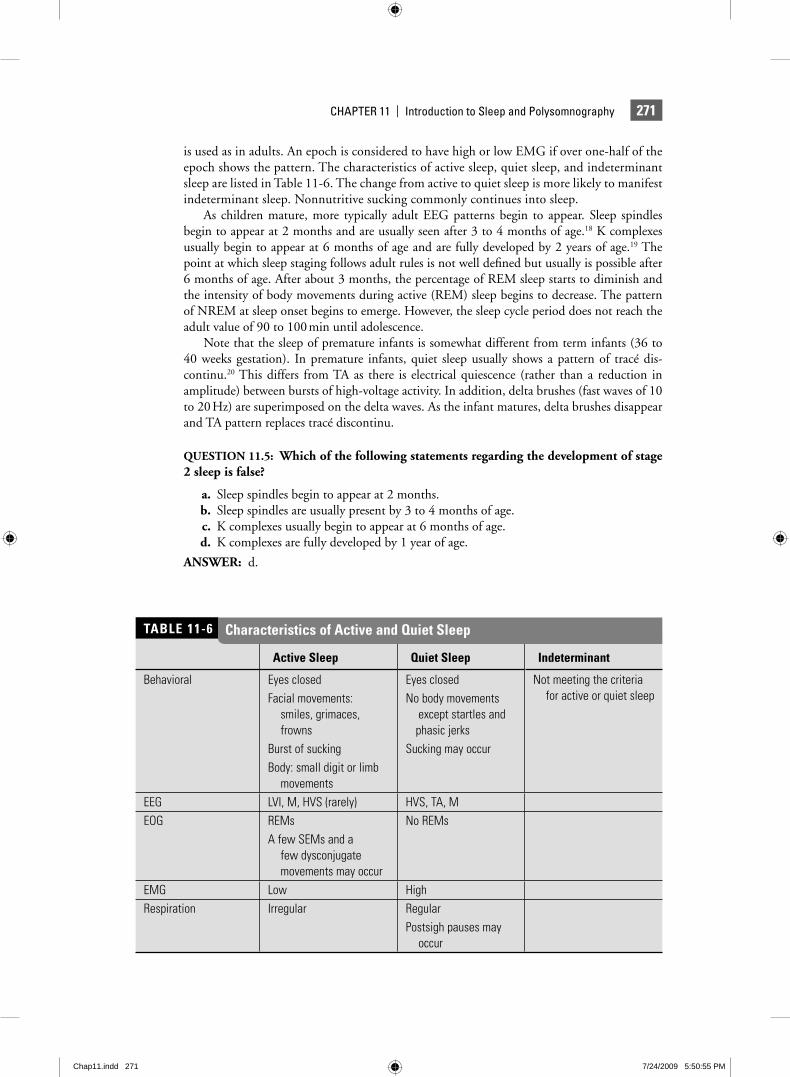
is used as in adults. An epoch is considered to have high or low EMG if over one-half of the epoch shows the pattern. The characteristics of active sleep, quiet sleep, and indeterminant sleep are listed in Table 11-6. The change from active to quiet sleep is more likely to manifest indeterminant sleep. Nonnutritive sucking commonly continues into sleep.
As children mature, more typically adult EEG patterns begin to appear. Sleep spindles begin to appear at 2 months and are usually seen after 3 to 4 months of age.18 K complexes usually begin to appear at 6 months of age and are fully developed by 2 years of age.19 The point at which sleep staging follows adult rules is not well defi ned but usually is possible after 6 months of age. After about 3 months, the percentage of REM sleep starts to diminish and the intensity of body movements during active (REM) sleep begins to decrease. The pattern of NREM at sleep onset begins to emerge. However, the sleep cycle period does not reach the adult value of 90 to 100 min until adolescence.
Note that the sleep of premature infants is somewhat different from term infants (36 to 40 weeks gestation). In premature infants, quiet sleep usually shows a pattern of tracé dis-continu.20 This differs from TA as there is electrical quiescence (rather than a reduction in amplitude) between bursts of high-voltage activity. In addition, delta brushes (fast waves of 10 to 20 Hz) are superimposed on the delta waves. As the infant matures, delta brushes disappear and TA pattern replaces tracé discontinu.
QUESTION 11.5: Which of the following statements regarding the development of stage 2 sleep is false?
a. Sleep spindles begin to appear at 2 months. b. Sleep spindles are usually present by 3 to 4 months of age. c. K complexes usually begin to appear at 6 months of age. d. K complexes are fully developed by 1 year of age.
ANSWER: d.
Active Sleep Quiet Sleep Indeterminant
Behavioral Eyes closedFacial movements: smiles, grimaces, frownsBurst of suckingBody: small digit or limb movements
Eyes closedNo body movements except startles and phasic jerksSucking may occur
Not meeting the criteria for active or quiet sleep
EEG LVI, M, HVS (rarely) HVS, TA, MEOG REMs
A few SEMs and a few dysconjugate movements may occur
No REMs
EMG Low HighRespiration Irregular Regular
Postsigh pauses may occur
Characteristics of Active and Quiet SleepTABLE 11-6
Chap11.indd 271Chap11.indd 271 7/24/2009 5:50:55 PM7/24/2009 5:50:55 PM
272 Reading EEGs
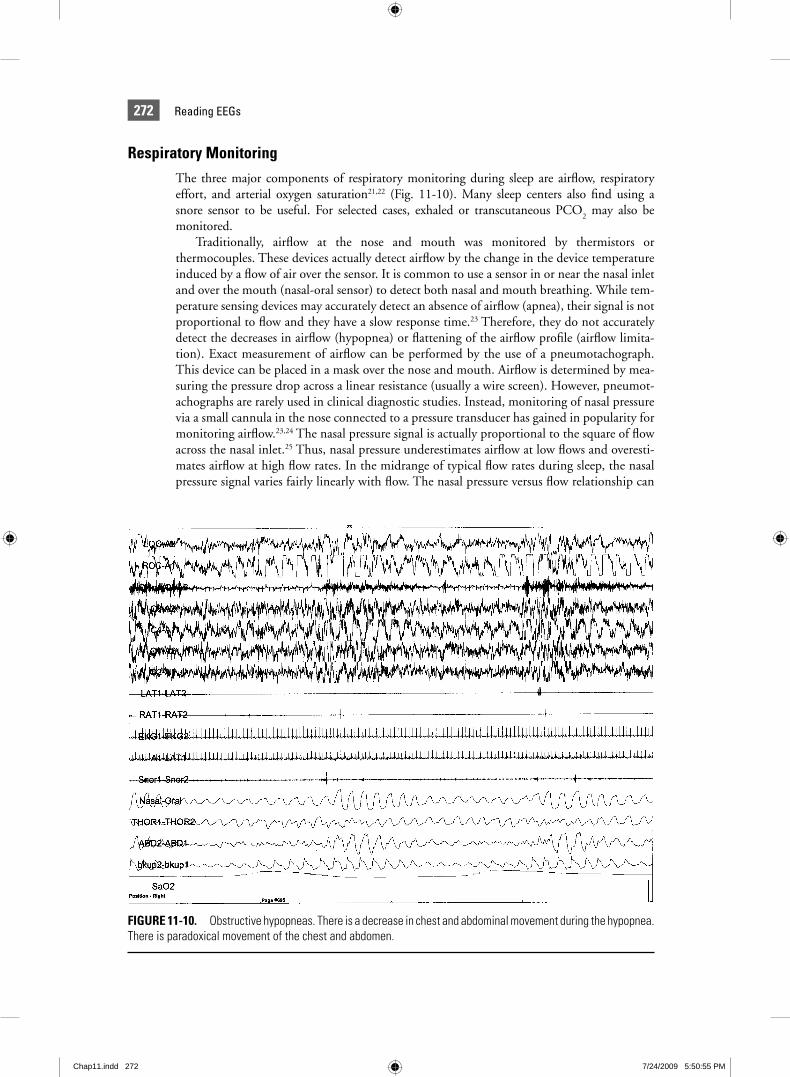
Respiratory MonitoringThe three major components of respiratory monitoring during sleep are airfl ow, respiratory effort, and arterial oxygen saturation21,22 (Fig. 11-10). Many sleep centers also fi nd using a snore sensor to be useful. For selected cases, exhaled or transcutaneous PCO
2 may also be
monitored.Traditionally, airfl ow at the nose and mouth was monitored by thermistors or
thermocouples. These devices actually detect airfl ow by the change in the device temperature induced by a fl ow of air over the sensor. It is common to use a sensor in or near the nasal inlet and over the mouth (nasal-oral sensor) to detect both nasal and mouth breathing. While tem-perature sensing devices may accurately detect an absence of airfl ow (apnea), their signal is not proportional to fl ow and they have a slow response time.23 Therefore, they do not accurately detect the decreases in airfl ow (hypopnea) or fl attening of the airfl ow profi le (airfl ow limita-tion). Exact measurement of airfl ow can be performed by the use of a pneumotachograph. This device can be placed in a mask over the nose and mouth. Airfl ow is determined by mea-suring the pressure drop across a linear resistance (usually a wire screen). However, pneumot-achographs are rarely used in clinical diagnostic studies. Instead, monitoring of nasal pressure via a small cannula in the nose connected to a pressure transducer has gained in popularity for monitoring airfl ow.23,24 The nasal pressure signal is actually proportional to the square of fl ow across the nasal inlet.25 Thus, nasal pressure underestimates airfl ow at low fl ows and overesti-mates airfl ow at high fl ow rates. In the midrange of typical fl ow rates during sleep, the nasal pressure signal varies fairly linearly with fl ow. The nasal pressure versus fl ow relationship can
FIGURE 11-10. Obstructive hypopneas. There is a decrease in chest and abdominal movement during the hypopnea. There is paradoxical movement of the chest and abdomen.
Chap11.indd 272Chap11.indd 272 7/24/2009 5:50:55 PM7/24/2009 5:50:55 PM

273CHAPTER 11 | Introduction to Sleep and Polysomnography
be completely linearized by taking the square root of the nasal pressure signal.26 However, in clinical practice, this is rarely performed. In addition to the changes in magnitude, changes in the shape of the nasal pressure signal can provide useful information. A fl attened profi le usually means that airfl ow limitation is present (constant or decreasing fl ow with an increas-ing driving pressure).23,24 The unfi ltered nasal pressure signal also can detect snoring if the frequency range of the amplifi er is adequate. The only signifi cant disadvantage of nasal pres-sure monitoring is that mouth breathing often may not be adequately detected (10% to 15% of patients). This can be easily handled by monitoring with both nasal pressure and a nasal-oral thermistor. An alternative approach to measuring fl ow is to use respiratory inductance plethysmography. The changes in the sum of the ribcage and abdomen band signals (RIPsum) can be used to estimate the changes in tidal volume.27,28 During positive-pressure titration, an airfl ow signal from the fl ow-generating device is often recorded instead of using thermistors or nasal pressure. This fl ow signal originates from a pneumotachograph or other fl ow-measuring devices inside the fl ow generator.
In pediatric polysomnography, exhaled CO2 is often monitored. Apnea usually causes an
absence of fl uctuations in this signal, although small expiratory puffs rich in CO2 can some-
times be misleading.7,22 The end-tidal PCO2 (value at the end of exhalation) is an estimate of
arterial PCO2. During long periods of hypoventilation that are common in children with sleep
apnea, the end-tidal PCO2 will be elevated (>45 mm Hg).22
Respiratory effort monitoring is necessary to classify respiratory events. A simple method of detecting respiratory effort is detecting movement of the chest and abdomen. This may be performed with belts attached to piezo-electric transducers, impedance monitoring, respira-tory-inductance plethysmography (RIP), or monitoring of the esophageal pressure (refl ecting changes in pleural or intrathoracic pressure). The surface EMG of the intercostal muscles or diaphragm can also be monitored to detect respiratory effort. Probably the most sensitive method for detecting effort is monitoring of the changes in esophageal pressure (refl ecting changes in pleural pressure) associated with inspiratory effort.24 This may be performed with esophageal balloons or small fl uid-fi lled catheters. Piezo-electric bands detect movement of the chest and abdomen as the bands are stretched and the pull on the sensors generates a signal. However, the signal does not always accurately refl ect the amount of chest/abdomen expan-sion. In RIP, changes in the inductance of coils in bands around the ribcage (RC) and abdo-men (AB) during respiratory movement are translated into voltage signals. The inductance of each coil varies with changes in the area enclosed by the bands. In general, RIP belts are more accurate in estimating the amount of chest/abdominal movement than piezo-electric belts. The sum of the two signals [RIPsum = (a × RC) + (b × AB)] can be calibrated by choosing appropriate constants: a and b. Changes in the RIPsum are estimates of changes in tidal volume.29 During upper-airway narrowing or total occlusion, the chest and abdominal bands may move paradoxically. Of note, a change in body position may alter the ability of either piezo-electric belts or RIP bands to detect the chest/abdominal movement. Changes in body position may require adjusting the band placement or amplifi er sensitivity. In addition, very obese patients may show little chest/abdominal wall movement despite considerable inspiratory effort. Thus, one must be cautious about making the diagnosis of central apnea solely on the basis of surface detection of inspiratory effort.30
Arterial oxygen saturation (Sao2) is measured during sleep studies using pulse oximetry
(fi nger or ear probes). This is often denoted as Spo2 to specify the method of Sao
2 determina-
tion. A desaturation is defi ned as a decrease in Sao2 of 4% or more from baseline. Note that
the nadir in Sao2 commonly follows apnea (hypopnea) termination by approximately 6 to 8 s
(longer in severe desaturations). This delay is secondary to circulation time and instrumental delay (the oximeter averages over several cycles before producing a reading). Various measures have been applied to assess the severity of desaturation, including computing the number of desaturations, the average minimum Sao
2 of desaturations, the time below 80%, 85%, and
Chap11.indd 273Chap11.indd 273 7/24/2009 5:50:56 PM7/24/2009 5:50:56 PM
274 Reading EEGs
90%, as well as the mean Sao2 and the minimum saturation during NREM and REM sleep.
Oximeters may vary considerably in the number of desaturations they detect and their ability to discard movement artifact. Using long averaging times may dramatically impair the detec-tion of desaturations.
Adult Respiratory Defi nitionsIn adults, apnea is defi ned as the absence of airfl ow at the mouth for 10 s or longer.21,22 If one measures the airfl ow with a very sensitive device, such as a pneumotachograph, small expira-tory puffs can sometimes be detected during an apparent apnea. In this case, there is “inspira-tory apnea.” Many sleep centers regard a severe decrease in airfl ow (to <10% of baseline) to be an apnea.
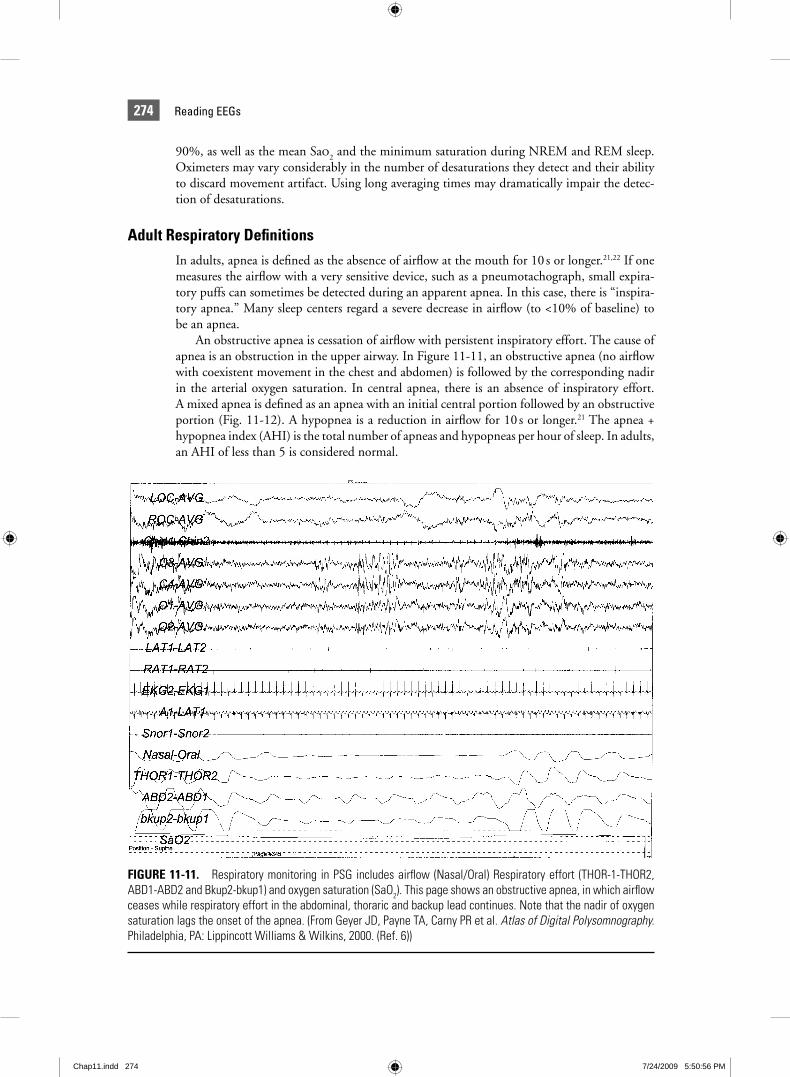
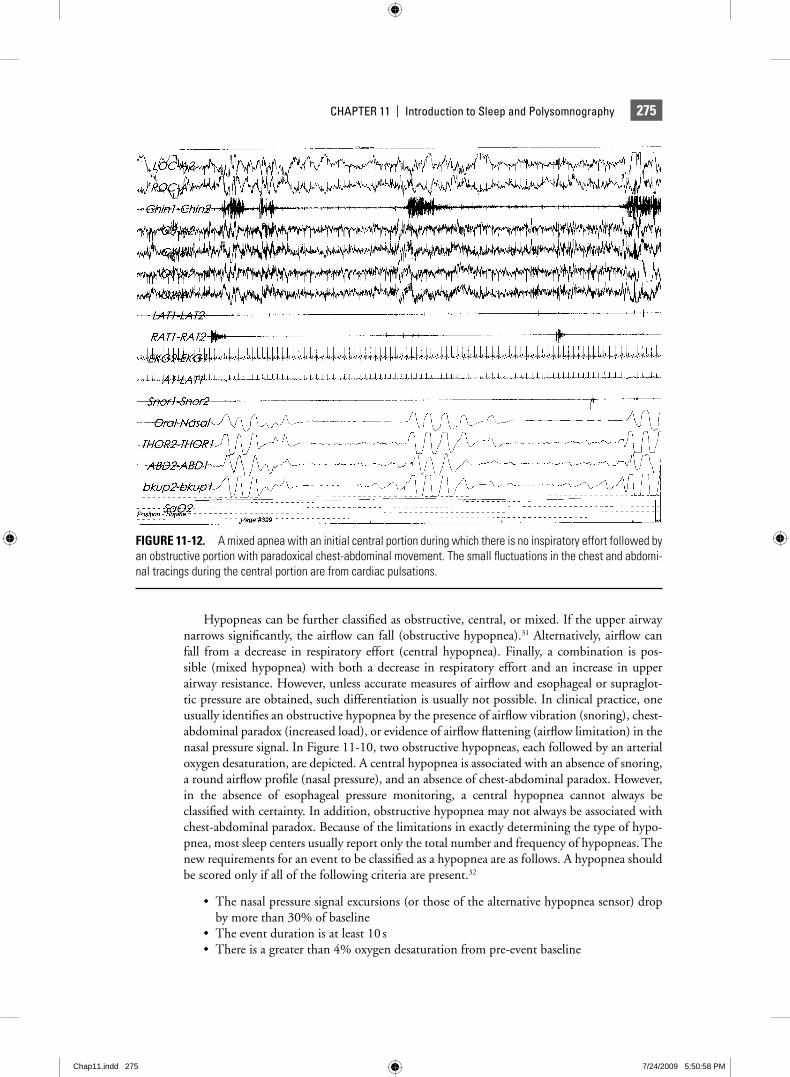
An obstructive apnea is cessation of airfl ow with persistent inspiratory effort. The cause of apnea is an obstruction in the upper airway. In Figure 11-11, an obstructive apnea (no airfl ow with coexistent movement in the chest and abdomen) is followed by the corresponding nadir in the arterial oxygen saturation. In central apnea, there is an absence of inspiratory effort. A mixed apnea is defi ned as an apnea with an initial central portion followed by an obstructive portion (Fig. 11-12). A hypopnea is a reduction in airfl ow for 10 s or longer.21 The apnea + hypopnea index (AHI) is the total number of apneas and hypopneas per hour of sleep. In adults, an AHI of less than 5 is considered normal.
FIGURE 11-11. Respiratory monitoring in PSG includes airfl ow (Nasal/Oral) Respiratory effort (THOR-1-THOR2, ABD1-ABD2 and Bkup2-bkup1) and oxygen saturation (SaO2). This page shows an obstructive apnea, in which airfl ow ceases while respiratory effort in the abdominal, thoraric and backup lead continues. Note that the nadir of oxygen saturation lags the onset of the apnea. (From Geyer JD, Payne TA, Carny PR et al. Atlas of Digital Polysomnography. Philadelphia, PA: Lippincott Williams & Wilkins, 2000. (Ref. 6))
Chap11.indd 274Chap11.indd 274 7/24/2009 5:50:56 PM7/24/2009 5:50:56 PM
275CHAPTER 11 | Introduction to Sleep and Polysomnography
Hypopneas can be further classifi ed as obstructive, central, or mixed. If the upper airway narrows signifi cantly, the airfl ow can fall (obstructive hypopnea).31 Alternatively, airfl ow can fall from a decrease in respiratory effort (central hypopnea). Finally, a combination is pos-sible (mixed hypopnea) with both a decrease in respiratory effort and an increase in upper airway resistance. However, unless accurate measures of airfl ow and esophageal or supraglot-tic pressure are obtained, such differentiation is usually not possible. In clinical practice, one usually identifi es an obstructive hypopnea by the presence of airfl ow vibration (snoring), chest- abdominal paradox (increased load), or evidence of airfl ow fl attening (airfl ow limitation) in the nasal pressure signal. In Figure 11-10, two obstructive hypopneas, each followed by an arterial oxygen desaturation, are depicted. A central hypopnea is associated with an absence of snoring, a round airfl ow profi le (nasal pressure), and an absence of chest-abdominal paradox. However, in the absence of esophageal pressure monitoring, a central hypopnea cannot always be classifi ed with certainty. In addition, obstructive hypopnea may not always be associated with chest-abdominal paradox. Because of the limitations in exactly determining the type of hypo-pnea, most sleep centers usually report only the total number and frequency of hypopneas. The new requirements for an event to be classifi ed as a hypopnea are as follows. A hypopnea should be scored only if all of the following criteria are present.32
The nasal pressure signal excursions (or those of the alternative hypopnea sensor) drop • by more than 30% of baselineThe event duration is at least 10 s• There is a greater than 4% oxygen desaturation from pre-event baseline•
FIGURE 11-12. A mixed apnea with an initial central portion during which there is no inspiratory effort followed by an obstructive portion with paradoxical chest-abdominal movement. The small fl uctuations in the chest and abdomi-nal tracings during the central portion are from cardiac pulsations.
Chap11.indd 275Chap11.indd 275 7/24/2009 5:50:58 PM7/24/2009 5:50:58 PM

276 Reading EEGs
At least 90% of the event’s duration must meet the amplitude reduction of criteria for • hypopnea
Alternatively, a hypopnea can also be scored if all of these criteria are present.
The nasal pressure signal excursions (or those of the alternative hypopnea sensor) drop • by more than 50% of baselineThe duration of the event is at least 10 s• There is a greater than 3% oxygen desaturation from preevent baseline or the event is • associated with arousalAt least 90% of the event’s duration must meet the amplitude reduction criteria for • hypopnea.
Respiratory events that do not meet criteria for either apnea or hypopnea can induce arousal from sleep. Such events have been called upper-airway resistance events (UARE), after the UARS.11 An AASM Task Force recommended that such events be called respiratory effort-related arousals (RERAs). The recommended criterion for an RERA is a respiratory event of 10 s or longer followed by an arousal that does not meet the criteria for an apnea or hypopnea but is associated with a crescendo of inspiratory effort (esophageal monitor-ing) or a fl attened waveform on nasal pressure monitoring.28 Typically, following arousal, there is a sudden drop in esophageal pressure defl ections. The exact defi nition of hypopnea that one uses will often determine whether a given event is classifi ed as a hypopnea or an RERA.
One can also detect the fl ow-limitation arousals (FLA) using an accurate measure of airfl ow, such as nasal pressure. Such events are characterized by fl ow limitation (fl attening) over several breaths followed by an arousal and sudden, but often temporary, restoration of a normal-round airfl ow profi le. One study suggested that the number of FLA per hour corresponded closely to the RERA index identifi ed by esophageal pressure monitoring.33 Some centers compute a RAI, determined as the arousals per hour associated with apnea, hypopnea, or RERA/FLA events. The AHI and respiratory disturbance index (RDI) are often used as equivalent terms. However, in some sleep centers, the RDI = AHI + RERA index, where the RERA index is the number of RERAs per hour of sleep, and RERAs are arousals associated with respiratory events not meeting the criteria for apnea or hypopnea.
One can use the AHI to grade the severity of sleep apnea. Standard levels include normal (<5), mild (5 to <15), moderate (15 to 30), and severe (>30) per hour. Many sleep centers also give separate AHI values for NREM and REM sleep and various body positions. Some patients have a much higher AHI during REM sleep or in the supine position (REM-related or postural sleep apnea). Because the AHI does not always express the severity of oxygen desaturation, one might also grade the severity of desaturation. For example, it is possible for the overall AHI to be mild, but for the patient to have quite severe desaturation during REM sleep.
QUESTION 11.6: According to the primary definition of hypopnea, all of the following are true except…
a. The nasal pressure signal excursions (or those of the alternative hypopnea sensor) drop by more than 30% of baseline.
b. The event duration is at least 10 s. c. There is a greater than 4% oxygen desaturation from preevent baseline.
d. At least 50% of the event’s duration must meet the amplitude reduction of criteria for hypopnea.
ANSWER: d.
Chap11.indd 276Chap11.indd 276 7/24/2009 5:50:59 PM7/24/2009 5:50:59 PM
277CHAPTER 11 | Introduction to Sleep and Polysomnography
Pediatric Respiratory Defi nitionsPeriodic breathing is defi ned as three or more respiratory pauses of at least 3 s in duration sepa-rated by less than 20 s of normal respiration. Periodic breathing is seen primarily in premature infants and mainly during active sleep.34 Although controversial, some feel that the presence of periodic breathing for more than 5% of TST or during quiet sleep in term infants is abnormal. Central apnea in infants is thought to be abnormal if the event is more than 20 s in duration or associated with arterial oxygen desaturation or signifi cant bradycardia.34–37
In children, a cessation of airfl ow of any duration (usually two or more respiratory cycles) is considered an apnea when the event is obstructive,34–37 i.e., the 10-s rule for adults does not apply. Of note, the respiratory rate in children (20 to 30/min) is greater than in adults (12 to 15/min). In fact, 10 s in an adult is usually the time required for two to three respiratory cycles. Obstruc-tive apnea is very uncommon in normal children. Therefore, an obstructive AHI greater than 1 is considered abnormal. In children with OSA, the predominant event during NREM sleep is obstructive hypoventilation rather than a discrete apnea or hypopnea. Obstructive hypoventila-tion is characterized by a long period of upper-airway narrowing with a stable reduction in air-fl ow and an increase in the end-tidal PCO
2. There is usually a mild decrease in the arterial oxygen
desaturation. The ribcage is not completely calcifi ed in infants and young children. Therefore, some paradoxical breathing is not necessarily abnormal. However, worsening paradox during an event would still suggest a partial airway obstruction. Nasal pressure monitoring is being used more frequently in children and periods of hypoventilation are more easily detected (reduced airfl ow with a fl attened profi le). Normative values have been published for the end-tidal PCO
2.
One paper suggested that a peak end-tidal PCO2 greater than 53 mm Hg or end-tidal PCO
2
greater than 45 mm Hg for more than 60% of TST should be considered abnormal.35
Central apnea in infants was discussed above. The signifi cance of central apnea in older children is less certain. Most do not consider central apneas following sighs (big breaths) to be abnormal. Some central apnea is probably normal in children, especially during REM sleep. In one study, up to 30% of normal children had some central apnea. Central apneas, when longer than 20 s, or those of any length associated with Sao
2 below 90% are often considered
abnormal, although a few such events have been noted in normal children.38 Therefore, most would recommend observation alone unless the events are frequent.
QUESTION 11.7: In the pediatric patient, which of the following statements regarding respiratory monitoring is false?
a. Periodic breathing is defi ned as three or more respiratory pauses of at least 3 s in dura-tion separated by less than 20 s of normal respiration.
b. The presence of periodic breathing for more than 5% of TST or during quiet sleep in term infants is abnormal.
c. Central apnea in infants is thought to be abnormal if the event is more than 10 s in duration or associated with arterial oxygen desaturation or signifi cant bradycardia.
d. In children, a cessation of airfl ow of any duration (usually two or more respiratory cycles) is considered an apnea when the event is obstructive.
ANSWER: c.
Leg Movement MonitoringThe EMG of the anterior tibial muscle (anterior lateral aspect of the calf ) of both legs is monitored to detect the leg movements (LMs).39 Two electrodes are placed on the belly of the upper portion of the muscle of each leg about 2 to 4 cm apart. A electrode loop is taped in place to provide strain relief. Usually each leg is displayed on a separate channel. However,
Chap11.indd 277Chap11.indd 277 7/24/2009 5:50:59 PM7/24/2009 5:50:59 PM
278 Reading EEGs
if the number of recording channels is limited, one can link an electrode on each leg and display both leg EMGs on a single tracing. Recording from both legs is required to accurately assess the number of movements. During biocalibration, the patient is asked to dorsifl ex and plantarfl ex the great toe of the right leg and then the left leg to determine the adequacy of the electrodes and amplifi er settings. The amplitude should be 1 cm (paper recording) or at least one half of the channel width on digital recording.
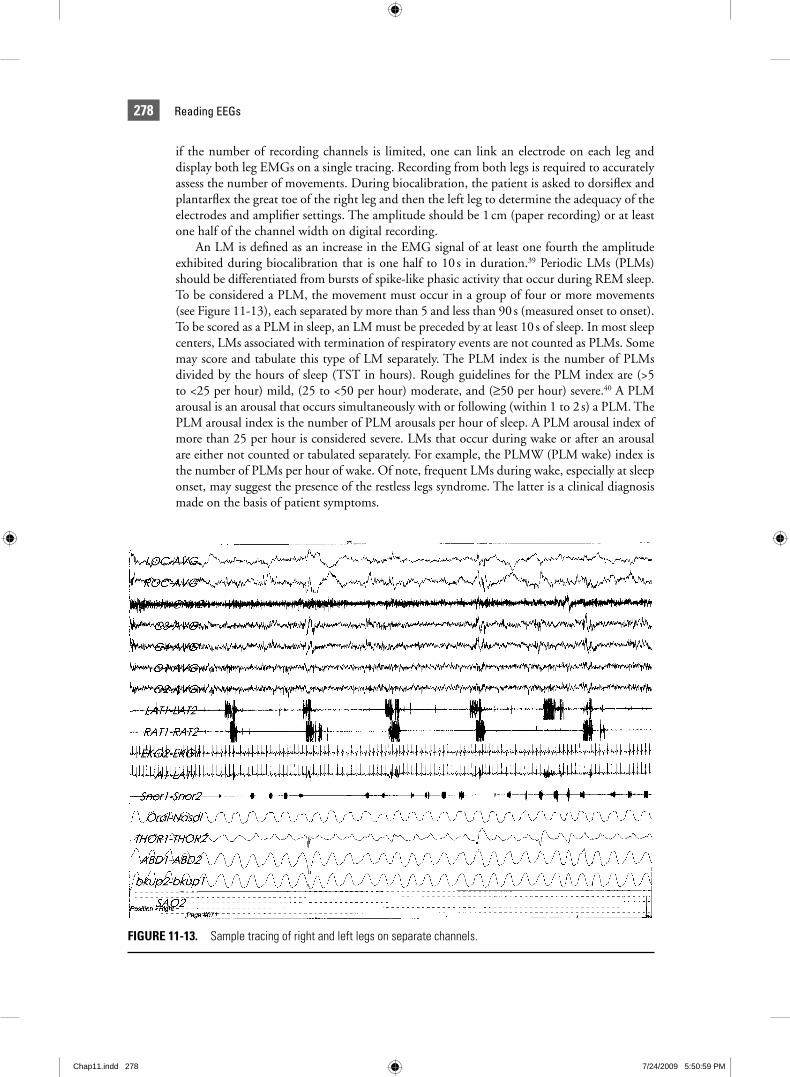
An LM is defi ned as an increase in the EMG signal of at least one fourth the amplitude exhibited during biocalibration that is one half to 10 s in duration.39 Periodic LMs (PLMs) should be differentiated from bursts of spike-like phasic activity that occur during REM sleep. To be considered a PLM, the movement must occur in a group of four or more movements (see Figure 11-13), each separated by more than 5 and less than 90 s (measured onset to onset). To be scored as a PLM in sleep, an LM must be preceded by at least 10 s of sleep. In most sleep centers, LMs associated with termination of respiratory events are not counted as PLMs. Some may score and tabulate this type of LM separately. The PLM index is the number of PLMs divided by the hours of sleep (TST in hours). Rough guidelines for the PLM index are (>5 to <25 per hour) mild, (25 to <50 per hour) moderate, and (≥50 per hour) severe.40 A PLM arousal is an arousal that occurs simultaneously with or following (within 1 to 2 s) a PLM. The PLM arousal index is the number of PLM arousals per hour of sleep. A PLM arousal index of more than 25 per hour is considered severe. LMs that occur during wake or after an arousal are either not counted or tabulated separately. For example, the PLMW (PLM wake) index is the number of PLMs per hour of wake. Of note, frequent LMs during wake, especially at sleep onset, may suggest the presence of the restless legs syndrome. The latter is a clinical diagnosis made on the basis of patient symptoms.
FIGURE 11-13. Sample tracing of right and left legs on separate channels.
Chap11.indd 278Chap11.indd 278 7/24/2009 5:50:59 PM7/24/2009 5:50:59 PM

279CHAPTER 11 | Introduction to Sleep and Polysomnography
Polysomnography, Biocalibrations, and Technical IssuesIn addition to the standard physiologic parameters monitored in polysomnography, body position (using low-light video monitoring) and treatment level (CPAP, bilevel pressure) are usually added in comments by the technologists. In most centers, a video recording is also made on traditional video tape or digitally as part of the digital recording. It is a standard prac-tice to perform amplifi er calibrations at the start of recording. In traditional paper recording, a calibration voltage signal (square wave voltage) was applied and the resulting pen defl ections, along with the sensitivity, polarity, and fi lter settings on each channel, were documented on the paper. Similarly, in digital recording, a voltage is applied, although it is often a sine-wave voltage. The impedance of the head electrodes is also checked prior to recording. An ideal impedance is greater than 5,000 Ω, although 10,000 Ω or less is acceptable. Electrodes with higher impedances should be changed.
A biocalibration procedure is performed (Table 11-7) while signals are acquired with the patient connected to the monitoring equipment.4,5 This procedure permits the checking of amplifi er settings and integrity of monitoring leads/transducers. It also provides a record of the patient’s EEG and eye movements during wakefulness with eyes closed and open. A summary of typical commands and their utility is listed in Table 11-7.
REFERENCES 1. Rechtschaffen A, Kales A, eds. A Manual of Standardized Terminology Techniques and Scoring System for Sleep
Stages of Human Sleep. Los Angeles, CA: Brain Information Service/Brain Research Institute, UCLA, 1968. 2. Williams RL, Karacan I, Hursch CJ. Electroencephalography of Human Sleep: Clinical Applications. New York:
Wiley, 1974. 3. Caraskadon MA, Rechschaffen A. Monitoring and staging human sleep. In: Kryger MH, Roth T, Dement WC,
eds. Principles and Practice of Sleep Medicine. Philadelphia, PA: WB Saunders, 2000:1197–1215. 4. Keenan SA. Polysomnographic techniques: An overview. In: Chokroverty S, ed. Sleep Disorders Medicine. Boston,
MA: Butterworth-Heinemann, 1999:151–169. 5. Butkov N. Polysomnography. In: Lee-Chiong TL, Sateia MJ, Carskadon MA, eds. Sleep Medicine. Philadelphia,
PA: Hanley and Belfus, 2002:605–637. 6. Geyer JD, Payne TA, Carny PR, et al. Atlas of Digital Polysomnography. Philadelphia, PA: Lippincott Williams &
Wilkins, 2000.
Eyes closed EEG: Alpha EEG activityEOG: Slow eye movements
Eyes open EEG: Attenuation of alpha rhythmEOG: REMs, blinks
Look right, look left, look up, look down Integrity of eye leads, polarity, amplitudeEye movements should cause out-of-phase
deflections
Grit teeth Chin EMG
Breathe in, breathe out Airflow, chest, abdomen movements adequate gain? Tracings in phase? (polarity of inspiration is usually upward)
Deep breath in, hold breath Apnea detection
Wiggle right toe, left toe Leg EMG, amplitude reference to evaluate LMs
Biocalibration ProcedureTABLE 11-7
Chap11.indd 279Chap11.indd 279 7/24/2009 5:51:00 PM7/24/2009 5:51:00 PM
280 Reading EEGs
7. Berry RB. Sleep Medicine Pearls. 2nd Ed. Philadelphia, PA: Hanley and Belfus, 2003. 8. Bonnet MH. Performance and sleepiness as a function of frequency and placement of sleep disruption.
Psychophysiology 1986;23:263–271. 9. American Sleep Disorders Association—The Atlas Task Force: EEG arousals: Scoring rules and examples. Sleep
1992;15:174–184. 10. Mathur R, Douglas NJ. Frequency of EEG arousals from nocturnal sleep in normal subjects. Sleep 1995;18:
330–333.11. Guillemenault C, Stoohs R, Clerk A, et al. A cause of excessive daytime sleepiness: The upper airway resistance
syndrome. Chest 1993;104:781–787.12. Butkov N. Atlas of clinical polysomnography, Ashland OR. Synapse Media 1996;110–112.13. Hauri P, Hawkins DR. Alpha-delta sleep. Electroencephalogr Clin Neurophysiol 1973;34:233–237.14. Johnson LC, Spinweber CL, Seidel WR, et al. Sleep spindle and delta changes during chronic use of short acting
and long acting benzodiazepine hypnotic. Electroencephalogr Clin Neurophysiol 1983;55:662–667.15. Armitage R, Trivedi M, Rush AJ. Fluoxetine and oculomotor activity during sleep in depressed patients. Neuro-
psychopharmacology 1995;12:159–165.16. Schenck CH, Bundlie SR, Patterson AL, et al. Rapid eye movement sleep behavior disorder. JAMA 1987;257:
1786–1789.17. Anders T, Emde R, Parmalee A. A Manual of Standardized Terminology, Techniques and Criteria for Scoring of
State of Sleep and Wakefulness in Newborn Infants. Los Angeles, CA: Brain Information Service, University of California Los Angeles, 1971.
18. Tanguay P, Ornitz E, Kaplan A, et al. Evolution of sleep spindles in childhood. Electroencephalogr Clin Neurophysiol 1975;38:175.
19. Metcalf D, Mondale J, Butler F. Ontogenesis of spontaneous K complexes. Psychophysiology 1971;26:49.20. Sheldon SH, Riter S, Detrojan M. Atlas of Sleep Medicine in Infants and Children. Armonk, NY: Futura, 1999.21. Block AJ, Boysen PG, Wynne JW, et al. Sleep apnea, hypopnea, and oxygen desaturation in normal subjects:
A strong male predominance. N Engl J Med 1979;330:513–517.22. Kryger MH. Monitoring respiratory and cardiac function. In: Kryger MH, Roth T, Dement WC, eds. Principles
and Practice of Sleep Medicine. Philadelphia, PA: WB Saunders, 2000:1217–1230.23. Norman RG, Ahmed MM, Walsleben JA, et al. Detection of respiratory events during NPSG: Nasal cannula/
pressure sensor versus thermistor. Sleep 1997;20:1175–1184.24. Berry RB. Nasal and esophageal pressure monitoring. In: Lee-Chiong TL, Sateia MJ, Caraskadon MA., eds. Sleep
Medicine. Philadelphia, PA: Hanley and Belfus, 2002:661–671.25. Monserrat JP, Farré R, Ballester E, et al. Evaluation of nasal prongs for estimating nasal fl ow. Am J Respir Crit Care
Med 1997;155:211–215.26. Farré R, Rigau J, Montserrat JM, et al. Relevance of linearizing nasal prongs for assessing hypopneas and fl ow
limitation during sleep. Am J Respir Crit Care Med 2001;163:494–497.27. Tobin M, Cohn MA, Sackner MA. Breathing abnormalities during sleep. Arch Intern Med 1983;143:
1221–1228.28. Iber C, Ancoli-Israel S, Chesson A, et al. The AASM Manual for the Scoring of Sleep and Associated Events: Rules,
Terminology and Technical Specifi cations. 1st Ed. Westchester, IL: American Academy of Sleep Medicine, 2007.29. Chada TS, Watson H, Birch S, et al. Validation of respiratory inductance plethysmography using different calibra-
tion procedures. Am Rev Respir Dis 1982;125:644–649.30. Redline S, Kapur VK, Sanders MH, et al. Effects of varying approaches for identifying respiratory disturbances
on sleep apnea assessment. Am J Respir Crit Care Med 2000;161:369–374.31. Redline S, Sander M. Hypopnea, a fl oating metric: Implications for prevalence, morbidity estimates, and case
fi nding. Sleep 1997;20:1209–1217.32. Meoli AL, Casey KR, Clark RW. Clinical Practice Review Committee- AASM. Hypopnea in sleep disordered
breathing in adults. Sleep 2001;24:469–470.33. Ayappa I, Norman RG, Krieger AC, et al. Non-invasive detection of respiratory effort related arousals (RERAs)
by a nasal cannula/pressure transducer system. Sleep 2000;23:763–771.34. American Thoracic Society. Standards and indication for cardiopulmonary sleep studies in children. Am J Respir
Crit Care Med 1996;153:866–878.35. Marcus CL, Omlin KJ, Basinki J, et al. Normal polysomnographic values for children and adolescents. Am Rev
Respir Dis 1992;146:1235–1239.36. American Thoracic Society. Cardiorespiratory studies in children: Establishment of normative data and polysom-
nographic predictors of morbidity. Am J Resp Crit Care Med 1999;160:1381–1387.37. Marcus CL. Sleep-disordered breathing in children—State of the art. Am J Resp Crit Care Med 2001;164:16–30.38. Weese-Mayer DE, Morrow AS, Conway LP, et al. Assessing clinical signifi cance of apnea exceeding fi fteen seconds
with event recording. J Pediatr 1990;117:568–574.39. ASDA Task Force. Recording and scoring leg movements. Sleep 1993;16:749–759.40. Diagnostic and Classifi cation Steering Committee. Thorpy MJ. Chairman. International Classifi cation of Sleep
Disorders: Diagnostic and Coding Manual. Rochester, MN: American Sleep Disorders Association, 1990:65–71.
Chap11.indd 280Chap11.indd 280 7/24/2009 5:51:00 PM7/24/2009 5:51:00 PM