Introduction to Earthquake Seismology - · PDF fileIntroduction to Earthquake Seismology...
5
Introduction to Earthquake Seismology Assignment 1 Department of Earth and Atmospheric Sciences EASA-462 Instructor: Robert B. Herrmann Office Hours: By appointment Office: O'Neil Hall 203 Email: [email protected] Particle Motion – P-waves Goals: • To become familiar with three-dimensional representations of ground motion • To identify P-wave motion • To use P-wave motion to define the direction (back azimuth) from the seismograph to the signal source Background: Seismic signals are identified by their time sequence of arrivals and also by their particle motion. The first arrival is always a P-wave, and its particle motion in an infinite medium (we will consider the free- surface effect later) is always in the direction of the ray from the source to the receiver. The motion is either a push away from the source or a pull back toward the source. Whether the first motion is a push or pull depends upon the initial motion of the P-wave generated by the source and also changes that occur upon reflections at boundaries (pP phase to be discussed later). As an introduction, we will look at actual data from three-component seismograms. We will not worry much about the free surface effect, which is that the observed ratio of vertical to horizontal (radial) motion at the free surface is not in the same proportion as the same ratio incident at the surface. If one plots the three-component particle motion in a sequence of graphs, erg., N vs E, Z vs E and Z vs N, the particle motion will generally be linear, e.g., not a big circle or ellipse. The N vs E plot will indicate the direction of wave propagation at the seismograph station, e.g., your plot will show a line through the origin. At this point we can only say that this direction is the direction if the great circle between the signal source and the station. For example if the amplitude points are (N,E) = (86,50), (0,0) and (-86, 50) then the line is in the direction of 30 or 210 degrees. To resolve the ambiguity of the direction to the earthquake source, use the vertical component motion and the rule: • If the ground moves up, the P-wave motion is a push away from the source • If the ground moves down, the P-wave motion is a pull back to the source. Thus you can tell the direction from the seismograph station back to the source. In the example above, if the first point corresponded do a downward 9negative) motion, then the source is in a direction N30E from the station. What you must do: On the work pages you will see three sets of seismogrrams from the same earthquake. The seismograms are windowed about the P-wave arrival time. The seismograph stations are SLM (St. Louis, Missouri), CHTO (Chiang-Mai, Thailand) and TKM2 (Turkmenistan?)
Transcript of Introduction to Earthquake Seismology - · PDF fileIntroduction to Earthquake Seismology...

Introduction to Earthquake Seismology
Assignment 1Department of Earth and Atmospheric Sciences EASA-462
Instructor: Robert B. Herrmann Office Hours: By appointment
Office: O'Neil Hall 203 Email: [email protected]
Particle Motion – P-waves
Goals:• To become familiar with three-dimensional representations of ground motion• To identify P-wave motion• To use P-wave motion to define the direction (back azimuth) from the seismograph to the
signal source
Background:
Seismic signals are identified by their time sequence of arrivals and also by their particle motion. The first arrival is always a P-wave, and its particle motion in an infinite medium (we will consider the free-surface effect later) is always in the direction of the ray from the source to the receiver. The motion is either a push away from the source or a pull back toward the source. Whether the first motion is a push or pull depends upon the initial motion of the P-wave generated by the source and also changes that occur upon reflections at boundaries (pP phase to be discussed later).
As an introduction, we will look at actual data from three-component seismograms. We will not worry much about the free surface effect, which is that the observed ratio of vertical to horizontal (radial) motion at the free surface is not in the same proportion as the same ratio incident at the surface.
If one plots the three-component particle motion in a sequence of graphs, erg., N vs E, Z vs E and Z vs N, the particle motion will generally be linear, e.g., not a big circle or ellipse. The N vs E plot will indicate the direction of wave propagation at the seismograph station, e.g., your plot will show a line through the origin. At this point we can only say that this direction is the direction if the great circle between the signal source and the station. For example if the amplitude points are (N,E) = (86,50), (0,0) and (-86, 50) then the line is in the direction of 30 or 210 degrees.
To resolve the ambiguity of the direction to the earthquake source, use the vertical component motion and the rule:
• If the ground moves up, the P-wave motion is a push away from the source
• If the ground moves down, the P-wave motion is a pull back to the source.
Thus you can tell the direction from the seismograph station back to the source. In the example above, if the first point corresponded do a downward 9negative) motion, then the source is in a direction N30E from the station.
What you must do:
On the work pages you will see three sets of seismogrrams from the same earthquake. The seismograms are windowed about the P-wave arrival time. The seismograph stations are SLM (St. Louis, Missouri), CHTO (Chiang-Mai, Thailand) and TKM2 (Turkmenistan?)
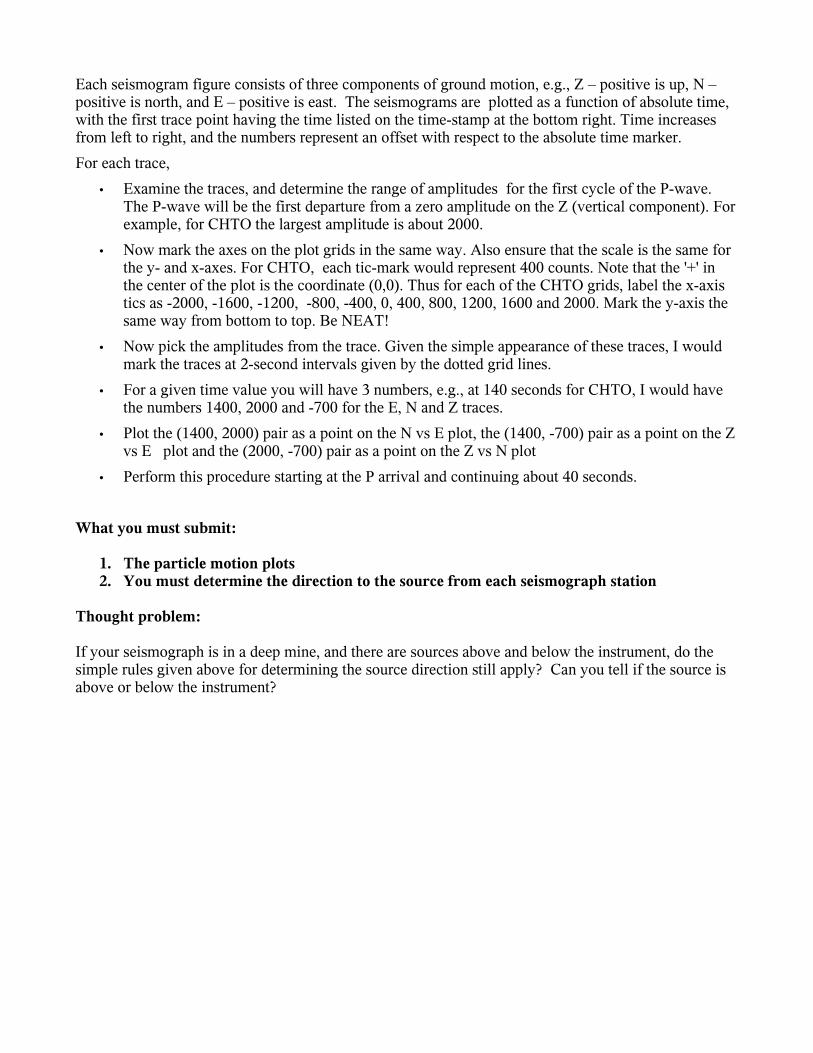
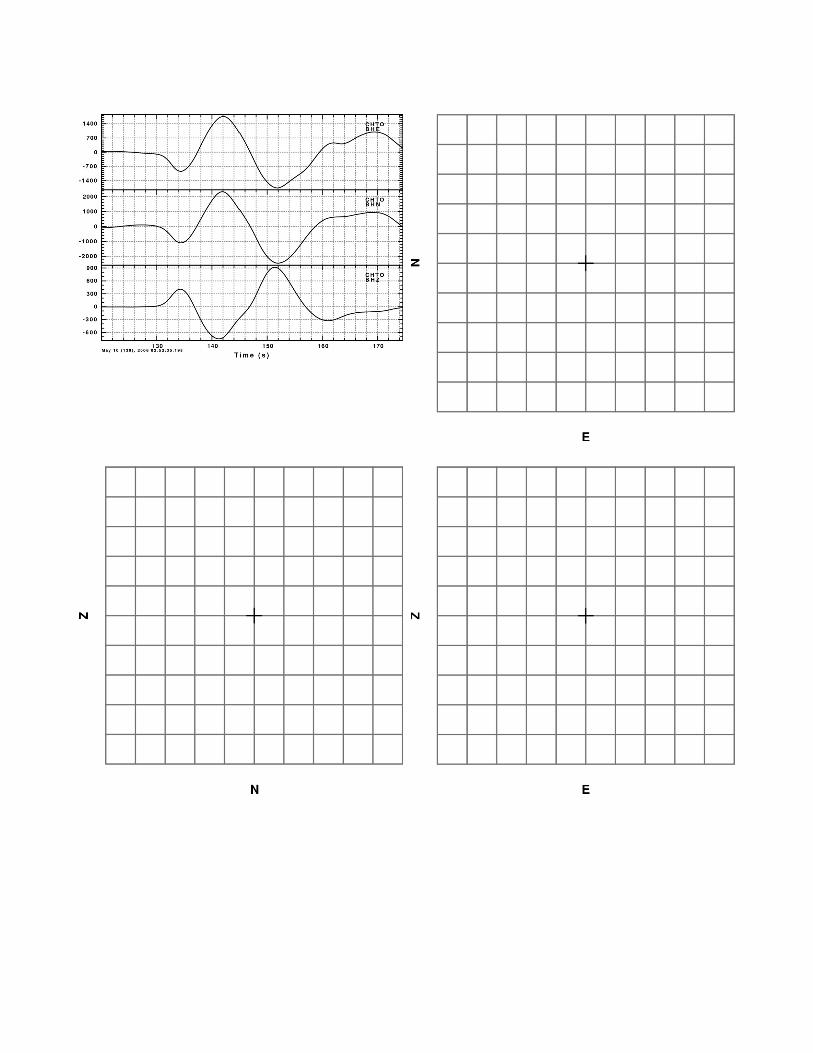
Each seismogram figure consists of three components of ground motion, e.g., Z – positive is up, N – positive is north, and E – positive is east. The seismograms are plotted as a function of absolute time, with the first trace point having the time listed on the time-stamp at the bottom right. Time increases from left to right, and the numbers represent an offset with respect to the absolute time marker.
For each trace,
• Examine the traces, and determine the range of amplitudes for the first cycle of the P-wave. The P-wave will be the first departure from a zero amplitude on the Z (vertical component). For example, for CHTO the largest amplitude is about 2000.
• Now mark the axes on the plot grids in the same way. Also ensure that the scale is the same for the y- and x-axes. For CHTO, each tic-mark would represent 400 counts. Note that the '+' in the center of the plot is the coordinate (0,0). Thus for each of the CHTO grids, label the x-axis tics as -2000, -1600, -1200, -800, -400, 0, 400, 800, 1200, 1600 and 2000. Mark the y-axis the same way from bottom to top. Be NEAT!
• Now pick the amplitudes from the trace. Given the simple appearance of these traces, I would mark the traces at 2-second intervals given by the dotted grid lines.
• For a given time value you will have 3 numbers, e.g., at 140 seconds for CHTO, I would have the numbers 1400, 2000 and -700 for the E, N and Z traces.
• Plot the (1400, 2000) pair as a point on the N vs E plot, the (1400, -700) pair as a point on the Z vs E plot and the (2000, -700) pair as a point on the Z vs N plot
• Perform this procedure starting at the P arrival and continuing about 40 seconds.
What you must submit:
1. The particle motion plots2. You must determine the direction to the source from each seismograph station
Thought problem:
If your seismograph is in a deep mine, and there are sources above and below the instrument, do the simple rules given above for determining the source direction still apply? Can you tell if the source is above or below the instrument?