Introduction General Factors of Natural Disasters in...
109
Final Report 5-1 CHAPTER 5 CHARACTERISTICS OF SEDIMENT DISASTER AND COUNTERMEASURES IN PILOT REGIONS 5.1 Introduction 5.1.1 General Factors of Natural Disasters in Indonesia The Indonesian archipelago is situated at the juncture of four tectonic plates: the Asian Plate, the Australian Plate, the Indian Ocean Plate, and the Pacific Ocean Plate. The motion of these plates induces earthquakes, tsunamis, and other calamities. Indonesia has suffered from a large number of sediment disasters on its steep mountains and hillsides, which were influenced by volcanic activity and the tropical climate (e.g. heavy rain, high humidity, temperature fluctuations). BAKORNAS PB released its findings on domestic disaster data including both natural and man-made disasters. According to the publication, 2,000 disasters occurred between 2002 and 2005, of which 10% (222 disasters) were sediment disasters. According to EM-DAT (The OFDA/CRED International Disaster Database), there were 334 natural disasters, including infectious disease, which occurred in the 100 years between 1907 and 2006, of which approximately 10% were sediment disasters. The number of people affected by disasters was approximately 21,280,000, with sediment disasters accounting for 2% of these - approx. 425,000 people. Table 5.1.1 below, shows the frequency of sediment disasters in 10-year increments since 1977, with the number of people affected. Table 5.1.1 Frequency of Disasters and Affected People in the Past Period No. of Disasters (Total) Sediment Disasters Affected People (Total) People Affected by Sediment Disaster 1977-1986 83 5% (4 disasters) 3,089,520 extremely few 1987-1996 78 8% (6 disasters) 5,784,541 1% (approx 58,000) 1997-2006 122 19% (23 disasters) 6,906,150 5% (approx 345,000) Source: EM-DAT: The OFDA/CRED International Disaster Database It is obvious from these results that the number of disasters and the number of people affected has been increasing in recent years, revealing a trend toward more serious calamity. The causes can be attributed to various factors, such as rapid social development in disaster prone areas, effects of climate change, etc. The frequency of sediment disasters and the number of people affected are shown in Figure 5.1.1 based on data from the last 100 years in EM-DAT. The data shown in Figure 5.1.2 is from various organizations showing sediment disaster-prone areas. Based on these results, the areas at high risk for sediment disaster are the following:
-
Upload
truongquynh -
Category
Documents
-
view
215 -
download
0
Transcript of Introduction General Factors of Natural Disasters in...

Final Report
5-1
CHAPTER 5 CHARACTERISTICS OF SEDIMENT DISASTER AND COUNTERMEASURES IN PILOT REGIONS
5.1 Introduction
5.1.1 General Factors of Natural Disasters in Indonesia The Indonesian archipelago is situated at the juncture of four tectonic plates: the Asian Plate, the Australian Plate, the Indian Ocean Plate, and the Pacific Ocean Plate. The motion of these plates induces earthquakes, tsunamis, and other calamities. Indonesia has suffered from a large number of sediment disasters on its steep mountains and hillsides, which were influenced by volcanic activity and the tropical climate (e.g. heavy rain, high humidity, temperature fluctuations).
BAKORNAS PB released its findings on domestic disaster data including both natural and man-made disasters. According to the publication, 2,000 disasters occurred between 2002 and 2005, of which 10% (222 disasters) were sediment disasters. According to EM-DAT (The OFDA/CRED International Disaster Database), there were 334 natural disasters, including infectious disease, which occurred in the 100 years between 1907 and 2006, of which approximately 10% were sediment disasters. The number of people affected by disasters was approximately 21,280,000, with sediment disasters accounting for 2% of these - approx. 425,000 people. Table 5.1.1 below, shows the frequency of sediment disasters in 10-year increments since 1977, with the number of people affected.
Table 5.1.1 Frequency of Disasters and Affected People in the Past
Period No. of Disasters (Total) Sediment Disasters Affected People
(Total) People Affected by Sediment Disaster
1977-1986 83 5% (4 disasters) 3,089,520 extremely few 1987-1996 78 8% (6 disasters) 5,784,541 1% (approx 58,000) 1997-2006 122 19% (23 disasters) 6,906,150 5% (approx 345,000)
Source: EM-DAT: The OFDA/CRED International Disaster Database
It is obvious from these results that the number of disasters and the number of people affected has been increasing in recent years, revealing a trend toward more serious calamity. The causes can be attributed to various factors, such as rapid social development in disaster prone areas, effects of climate change, etc. The frequency of sediment disasters and the number of people affected are shown in Figure 5.1.1 based on data from the last 100 years in EM-DAT. The data shown in Figure 5.1.2 is from various organizations showing sediment disaster-prone areas. Based on these results, the areas at high risk for sediment disaster are the following:

The Study on Natural Disaster Management in Indonesia
5-2
・North-Western part of Sumatra ・Java ・Sulawesi and Nusa Tenggara
Source: EM-DAT: The OFDA/CRED International Disaster Database
Figure 5.1.1 Location of Sediment Disasters and Affected People
Source: Departemen Pekerjaan Umum, Departemen Energi dan Sumberdaya Mineral, Badan Meteorologi
dan Geofisika, Bakosurtanal
Figure 5.1.2 Sediment Disaster-prone Areas

Final Report
5-3
KEJADIAN BENCHNA ALAM GERAKAN TANAH DI INDONESIA
0100200300400500600700800
BaliBantenBengkuluD.I.AcehD.I.Yogyakarta
DKI.JakartaIrianjayaJambiJawa BaratJawa Tengah
Jawa Timurkalimantan barat
Kalimantan Timur
KaselLampungMalukuNusa Tenggara ...
Nusa Tenggara ...
PapuaRiauSulawesi Selatan
Sulawesi Tengah
Sulawesi Utara
Sumatera Barat
Sumatera Selatan
Sumatera Utara
PROPINSI
Ban
yakn
ya,M
D
Banyaknya MD
5.1.2 Present Situation of Sediment Disasters in Indonesian Provinces According to statistics published by the Center for Volcanology and Geological Hazard Mitigation (CVG), West Java Province is by far the most disaster-affected area in terms of the occurrence of sediment disasters, followed by Central Java Province, and North Sumatra Province. East Java Province is fourth, where a large sediment disaster occurs approximately every five years, according to statistic records (Refer to Table 5.1.2) over the past 17 years.
Table 5.1.2 Statistics for Sediment Disasters in Indonesia
Source: Center for Volcanology and Geological Hazard Mitigation (CVG) (January 1990 - December 2006)
Figure 5.1.3 Sediment Disasters in Indonesia
The Study on Natural Disaster Management in Indonesia
5-4
5.2 Disaster Characteristics of Sediment Disaster and Countermeasures in Kabupaten Jember
5.2.1 Disaster Characteristics of Sediment Disaster in Kabupaten Jember 1) Sediment Disasters in the Past
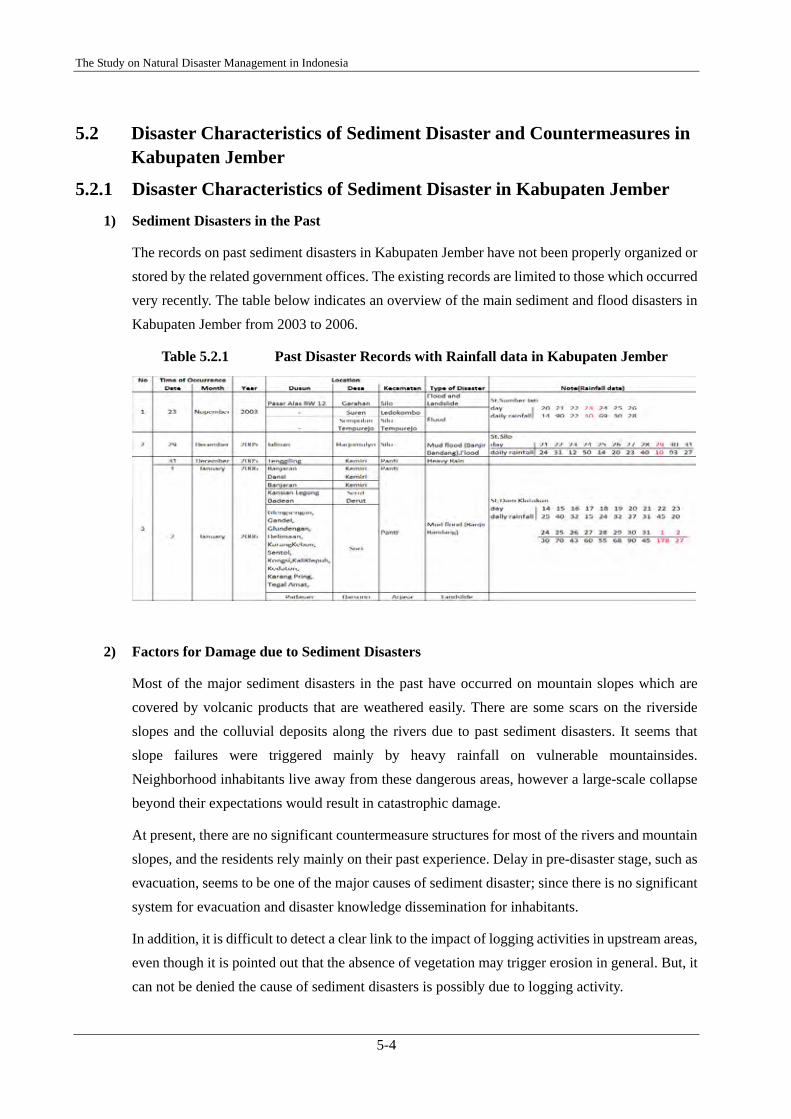
The records on past sediment disasters in Kabupaten Jember have not been properly organized or stored by the related government offices. The existing records are limited to those which occurred very recently. The table below indicates an overview of the main sediment and flood disasters in Kabupaten Jember from 2003 to 2006.
Table 5.2.1 Past Disaster Records with Rainfall data in Kabupaten Jember
2) Factors for Damage due to Sediment Disasters
Most of the major sediment disasters in the past have occurred on mountain slopes which are covered by volcanic products that are weathered easily. There are some scars on the riverside slopes and the colluvial deposits along the rivers due to past sediment disasters. It seems that slope failures were triggered mainly by heavy rainfall on vulnerable mountainsides. Neighborhood inhabitants live away from these dangerous areas, however a large-scale collapse beyond their expectations would result in catastrophic damage.
At present, there are no significant countermeasure structures for most of the rivers and mountain slopes, and the residents rely mainly on their past experience. Delay in pre-disaster stage, such as evacuation, seems to be one of the major causes of sediment disaster; since there is no significant system for evacuation and disaster knowledge dissemination for inhabitants.
In addition, it is difficult to detect a clear link to the impact of logging activities in upstream areas, even though it is pointed out that the absence of vegetation may trigger erosion in general. But, it can not be denied the cause of sediment disasters is possibly due to logging activity.

Final Report
5-5
3) Location of Rainfall Stations in Kabupaten Jember
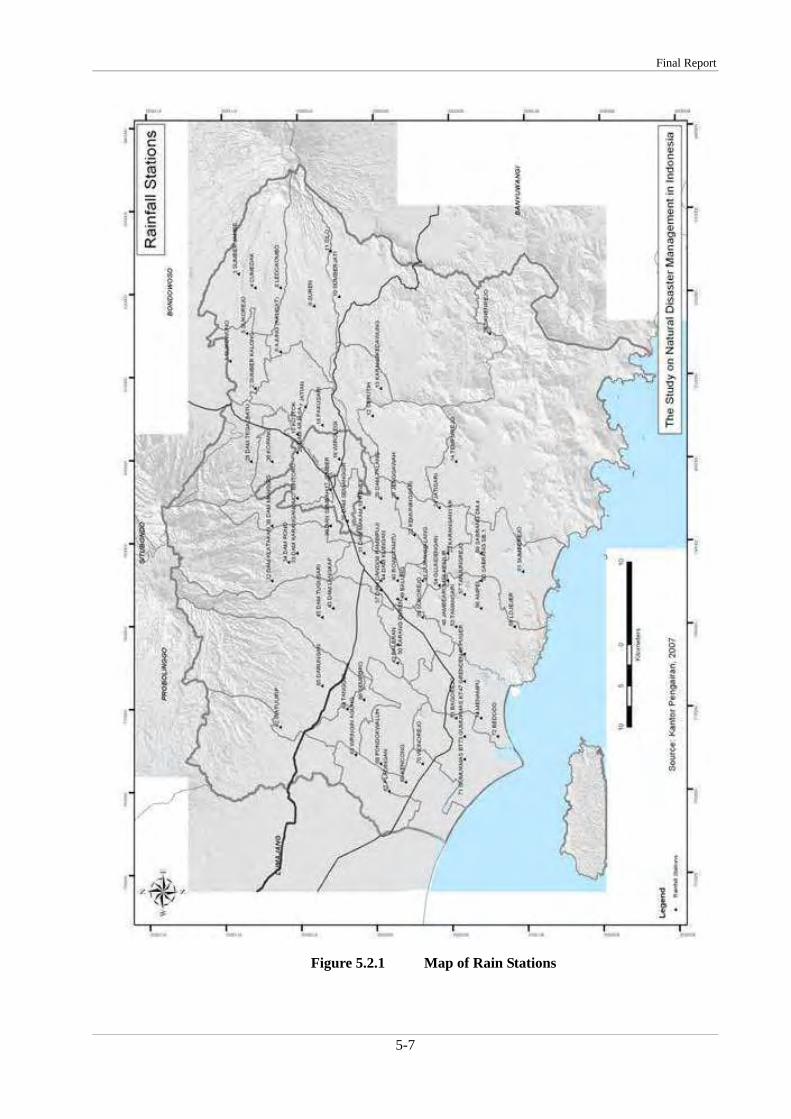
According to rainfall data obtained from the Irrigation Department, rainfall is measured daily at 74 stations (refer to Table 5.2.2 and Figure 5.2.1). Seven years of data were obtained between 1990 and 2006. The data shown below is monthly rainfall obtained from BMG, although the original source is most likely the Irrigation Department. However, the condition of the data is poor, and many measurements are missing due to equipment failure etc. The rainfall measurements are mainly used by the Irrigation Department to decide control measures for agricultural purposes. The entire area of Kabupaten Jember is approximately 3,300 km2 with one rain station located every 45 km2, so density is rather high. Also, there are independent rain stations installed at plantations upriver at Kari Putih and the Dinoyo river. However, it is unclear how this data is being managed or in what way it is being utilized.

The Study on Natural Disaster Management in Indonesia
5-6
Table 5.2.2 Location of Rain Stations
Final Report
5-7
Figure 5.2.1 Map of Rain Stations

The Study on Natural Disaster Management in Indonesia
5-8
Table 5.2.3 Average Rainfall in Kabupaten Jember (1981–2004)
Source: BMG Jakarta
Figure 5.2.2 Rain Station in Plantation Area (left); Irrigation Department Rain Station (right)

Final Report
5-9
4) Relation between rainfall and water-related disasters
A. Disasters and Daily Rainfall in Kabupaten Jember
According to the related agencies of Kabupaten Jember, the condition of record-keeping practices is poor and thus mostly only recent data is available.
On 23rd of November, ’03, a flood and landslide occurred at the Kecamatan Silo at Desa Garahan Dusan Pasar Alas RW12.
In addition, the rainfall recorded by the Sumber Jati station showed that rain continued to fall from November 20th to 26th.
Daily Rainfall at St. Sumber Jati from 20th to 26th of Nov. ‘03
Date 20 21 22 23 24 25 26 Daily Rainfall
(mm) 14 90 22 30 69 30 28
Also, on the same days, flooding was recorded at Kecamatan Silo in Desa Sempolan, Kecamatan Ledokombo in Desa Suren, as well as Kecamatan Tempurejo in Desa Tempurejo.
On 29th, December ’05, a banjir bandang (lit. mud flood) occurred at Kecamatan Silo in Desa Harjomulyo.
Daily Rainfall at St. Silo from 21st to 31st of Dec. 2005
Date 21 22 23 24 25 26 27 28 29 30 31 Daily Rainfall
(mm) 24 31 12 50 14 20 23 40 10 93 27
Similarly, due to continuous rainfall in Kecamatan Panti of Desa Kemiri on 31 December 2006, there was a mud flood (banjir banding) in Desa Kemiri on 1 January 2006. The damage was widespread, reaching Desa Serut and Desa Suci the following day.
Furthermore, rain was recorded at St. Dam Klatakan from 14 December, and continued until 2 January 2006.
Daily Rainfall at St. Dam Klatakan from 14th of Dec. 2005 to 2nd of Jan. 2006
Date 14 15 16 17 18 19 20 21 22 23 Daily Rainfall
(mm) 25 40 32 15 24 32 27 31 45 20
24 25 26 27 28 29 30 31 1 2 30 70 43 60 55 68 90 45 178 27
As the data shows, all of the sediment disasters that have occurred in Kabupaten Jember have been triggered by rainfall. In order to base evacuation alerts on rainfall data, this information should be carefully recorded.

The Study on Natural Disaster Management in Indonesia
5-10
5.2.2 Sediment Hazard Map in Kabupaten Jember 1) Indices of Hazard Map for Sediment Disaster
Based on data collected from related institutions and the main factors of those shown to have triggered sediment disasters in other studies, there are two primary causes of sediment disasters: mechanical factors, and incitant factors. Mechanical factors depend on the field conditions where a sediment disaster takes place; whereas an incitant factor is an external force which affects the area where a sediment disaster takes place. The mechanical and incitant factors of sediment disasters are summarized in the table below.
Table 5.2.4 Mechanical and Incitant Factors of Sediment Disasters
SEDIMENT DISASTER MECHANICAL FACTORS INCITANT FACTORS
Slope Failure
Geology: impact of rock strength, weathering, deterioration, cracks / fractures, direction of terrain, condition of permeable layer, looseness of surface layer, layer distribution. Features: most slope failure on steep slopes (30 degrees or more), as well as recessed slopes where rainfall can accumulate and change the shape of the slope. Vegetation: forest recognized for effect to prevent surface failure.
Rainfall: many cases of slope failure where there is intense rainfall and already moisture in the ground. Seismic/Volcanic activity: earthquakes and volcanic activity affects stress conditions inside the slope, destabilizing the ground. Groundwater: Water seepage from rain can increase water pressure in the soil and impact slope failure. Human activity: deforestation, changing the natural slope by earth cutting or filling, etc.
Debris flow
Basin geography: steep slopes, unstable mountainside, potential for surface water to accumulate, existence of groundwater or springs. River geography: vertical slope in river bed, planar and vertical grade of river channel. Unstable soil: thickness of weathered hill slope layers, thickness and amount of river bed sediment, volume and composition of sediment, sedimentation due to slope failure.
Rainfall/Snow Melt: Rapid increase of water flow or great quantity of runoff. Seismic/Volcanic activity: large amount of unstable soil produced from slope failure (mechanical); collapse of crater lake from eruption; runoff of heavy snow melt; etc.
Landslide
The greatest incidence of landslides is of the tertiary layer. The tertiary sediment layer is young with low solidity so there is little resistance to weathering. Also, the mode of weathering has characteristics, as repeated alternation between dry and wet will refine the grain or create rapid argillation. Further, the ground is composed of sandstone / mudstone, and smectite (montmorillonite) contained in the mudstone has the potential to swell, which can trigger a landslide.
Water will incite landslides. This mainly happens when rain water permeates the ground. When that water increases pressure in the pores of the soil, this decreases the soil shearing force. On the other hand, landslides can also be triggered by human activities such as cutting away the slope in the landslide zone, or even cutting or filling land in an area unrelated to the landslide zone for civil engineering purposes.
Source: GUIDELINES FOR DEVELOPMENT OF WARNING AND EVACUATION SYSTEM AGAINST SEDIMENT
DISASTERSIN DEVELOPING COUNTRIES (Infrastructure Development Institute-Japan)

Final Report
5-11
The hazard map for sediment disasters in Kabupaten Jember was created based on data and information provided from the relevant organizations of Kabupaten Jember through the discussions between the experts of the JICA study team and the counterpart members of Kabupaten Jember. The indices used for creation of hazard maps for sediment disaster are indicated in Table 5.2.5. The indices of “Slope,” “Geology,” and “Annual Rainfall” were adopted as indices of sediment hazard.
Table 5.2.5 Indices used for creation of sediment hazard maps
Hazard Indices
1) Slope (HJ4)
2) Geology (HJ5)
3) Annual Rainfall (HJ6)
The formula used for assessment of sediment hazard for Kabupaten Jember is shown below.
Hazard = HJ4 + HJ5 + HJ6
where, HJ4: Index value of slope; HJ5: Index value of geology; and HJ6: Index value of annual rainfall.
A. Slope (HJ4)
As mentioned above, many cases of sediment disaster involve slope incline as a mechanical factor. As such, Kabupaten Jember was divided into a 1 km grid, and the maximum slope measured in each grid was adopted. In general, landslides occur mainly on gentle slopes of 5-30 degrees, and slope failures occur on steep slopes of 30 degrees or more. The grid slope map was created based on a 1/25,000 topographic map of BAKOSURTANAL. The slope grades were divided into five categories between 2 and 30 degrees, and scored accordingly:
i) Score 5: 30 o or more................................<Highest Hazard> ii) Score 4: 20o - 30 o.....................................<Higher Hazard> iii) Score 3: 10o - 20 o.....................................<Moderate Hazard> iv) Score 2: 2o - 10 o ......................................<Lower Hazard> iv) Score 1: 2o or less ...................................<Lowest Hazard>

The Study on Natural Disaster Management in Indonesia
5-12
Legend
Score 5: 30 or more
Slope (degree)
Score 4: 20 - 30
Score 3: 10 -20
Score 2: 2 -10
Score 1: 2 or less
Figure 5.2.3 Hazard Index Map “Slope (HJ4)”

Final Report
5-13
Legend
Score 5: Type I
Geology (Type)
Score 3: Type II
Score 1: Type III
B. Geology (HJ5)
Geology is a significant factor in sediment disasters. Based on geological analysis, sediment hazard index map for geology was made that specifies ground conditions that are prone to disaster. Hazardous areas can be indicated based on the geology map where volcanic ash and thick latosol, grabel of old volcano foot fan and pyroclastic rock, so called volcanic products, are prominent, and scored as below:
i) Score 5 : Volcanic ash and thick latosol, grabel of old volcano foot fan, pyroclastic rock <Highest Hazard>
ii) Score 3 : Hard rock, alluvium (gravel and sand) <Moderate Hazard>
iii) Score 1 : Alluvium (sand and silt, reclaimed filler) <Lowest Hazard>
Figure 5.2.4 Hazard Index Map “Geology (HJ5)”

The Study on Natural Disaster Management in Indonesia
5-14
C. Annual Rainfall (HJ6)
Rainfall is a major incitant factor in sediment disasters. The average annual rainfall in Kabupaten Jember was used here as an index. The data used was produced by BMG (Karangploso Station of Badan Meteorologi dan Geofisika). The map received from BMG is shown in Figure 5.2.5.
Figure 5.2.5 Distribution Map of Average Annual Rainfall
The obtained data was converted to grid unit data. It is divided into five categories and scored accordingly, as follows:
i) Score 5 : 4,500 - 5,000 (mm) <Highest Hazard>
ii) Score 4 : 3,500 - 4,500 (mm) <Higher Hazard>
iii) Score 3 : 2,500 - 3,500 (mm) <Moderate Hazard>
iv) Score 2 : 1,500 - 2,500 (mm) <Lower Hazard>
v) Score 1 : 1,000 - 1,500 (mm) <Lowest Hazard>

Final Report
5-15
Legend
Score 5: 4,500 – 5,000
Annual Rainfall (mm)
Score 4: 3,500 – 4,500
Score 3: 2,500 – 3,500
Score 2: 1,500 – 2,500
Score 1: 1,000 – 1,500
Figure 5.2.6 Annual Rainfall (HJ6)
2) Sediment Hazard Map in Kabupaten Jember
The sediment disaster hazard map was evaluated as the sum of Slope (HJ4), Geology (HJ5), and Annual Rainfall (HJ6). As shown in Figure 5.2.7, the assessed hazard scores are divided into 5 classes. The highest hazard is shown in red, followed by orange. The colors yellow, green, and blue indicate lower hazard. According to this, significant hazards exist in the area covered by volcanic products on the southern slopes of Argopuro, or the mountainous area made up of tertiary layer from the western and southeastern slopes of Mt. Raung. Hazard is high in the areas (Kec. Sumberbaru, Kec. Tanggul) of the south slope of Mt. Argopuro, which is covered by volcanic product. Moreover, the mountainous area which spreads over the west slope and southeast slope (Kec.Bangsalsari, Kec.Panti) of Mt. Raung has a Tertiary layer and, similarly, a high hazard. In particular, earth-and-sand disaster hazard is high due to the following reasons at the Kali Klatakan or the Kali Putih valleys.
- Steep slope - Geology collapses easily due to volcanic products - Altitude is high on the south slope, and there is much rainfall - A deep dissection in the valley and there is much outflow of sediment

The Study on Natural Disaster Management in Indonesia
5-16
Legend
Highest Hazard: 12 – 15
Sediment Hazard (score)
Higher Hazard: 10 – 11
Moderate Hazard: 8 – 9
Lower Hazard: 6 – 7
Lowest Hazard: 3 – 5
Particularly, steep slopes, friable geology made of volcanic products, a high southern slope elevation, and heavy rain pose a high risk where sediment flow is heavy from the deep rift between the Kali Klatakan and the Kali Putih basins.
Furthermore, the central area of the Kabupaten Jember slightly to the south is considered hazardous where a terrace was formed from lava and pyroclastic products when Raung erupted. The surface of the ground is 300m at its highest point, and together with the heavy rainfall in the area, means it is also considered highly hazardous.
Figure 5.2.7 Hazard Map for Sediment Disaster in Kabupaten Jember

Final Report
5-17
5.2.3 Sediment Risk Map in Kabupaten Jember 1) Basis of Risk Map Creation for Sediment Disasters
The risk map is made from factors acquired from vulnerabilities in disaster prevention from the hazard map, taking into consideration other physical, social, economic, and environmental aspects. According to “Living with Risk” (UN/ISDR, 2004), vulnerability is defined as “the conditions determined by physical, social, economic, and environmental factors or processes, which increase the susceptibility of a community to the impact of hazards”.
The vulnerability indices are shown in Table 5.2.6. The details of vulnerability indices for “Population Density (VJ1),” “Built-up Area (VJ2),” and “Land Cover (VJ4)” are described in section of 1.6.4, CHAPTER 1, Vol.3: Supporting Report.
Table 5.2.6 Vulnerability Indices Used for Sediment Disaster
Vulnerability Indices
1) Population Density (VJ1)
2) Built-up Area (VJ2)
3) Land Cover (VJ4)
The formula used for assessment of sediment risk for Kabupaten Jember is shown below.
Risk = Hazard x Vulnerability
Risk = (HJ4 + HJ5+ HJ6) x (VJ1 + VJ2 + VJ4) (Eq. 5.1)
where, HJ4: Index value of slope; HJ5: Index value of geology; HJ6: Index value of annual rainfall; VJ1: Index value of population density; VJ2: Index value of built-up area; and VJ4: Index value of land cover.
The Study on Natural Disaster Management in Indonesia
5-18
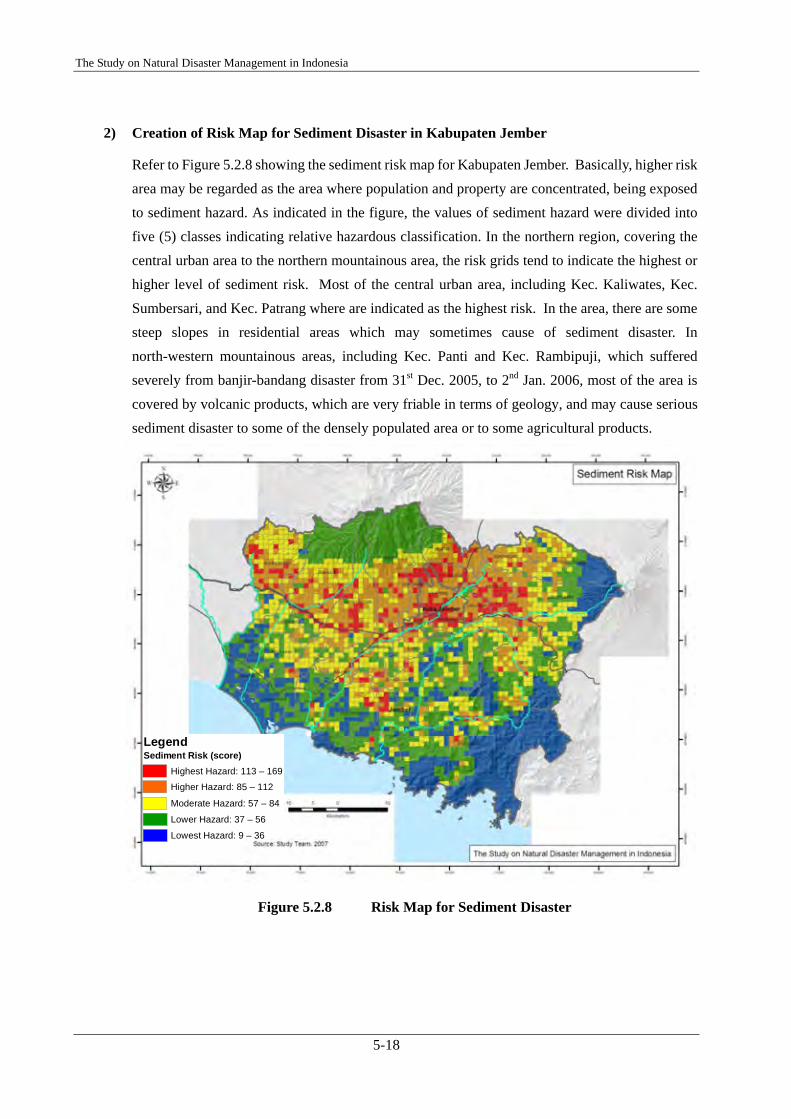
Legend
Highest Hazard: 113 – 169
Sediment Risk (score)
Higher Hazard: 85 – 112
Moderate Hazard: 57 – 84
Lower Hazard: 37 – 56
Lowest Hazard: 9 – 36
2) Creation of Risk Map for Sediment Disaster in Kabupaten Jember
Refer to Figure 5.2.8 showing the sediment risk map for Kabupaten Jember. Basically, higher risk area may be regarded as the area where population and property are concentrated, being exposed to sediment hazard. As indicated in the figure, the values of sediment hazard were divided into five (5) classes indicating relative hazardous classification. In the northern region, covering the central urban area to the northern mountainous area, the risk grids tend to indicate the highest or higher level of sediment risk. Most of the central urban area, including Kec. Kaliwates, Kec. Sumbersari, and Kec. Patrang where are indicated as the highest risk. In the area, there are some steep slopes in residential areas which may sometimes cause of sediment disaster. In north-western mountainous areas, including Kec. Panti and Kec. Rambipuji, which suffered severely from banjir-bandang disaster from 31st Dec. 2005, to 2nd Jan. 2006, most of the area is covered by volcanic products, which are very friable in terms of geology, and may cause serious sediment disaster to some of the densely populated area or to some agricultural products.
Figure 5.2.8 Risk Map for Sediment Disaster

Final Report
5-19
3) Characteristics of sediment and flood disasters
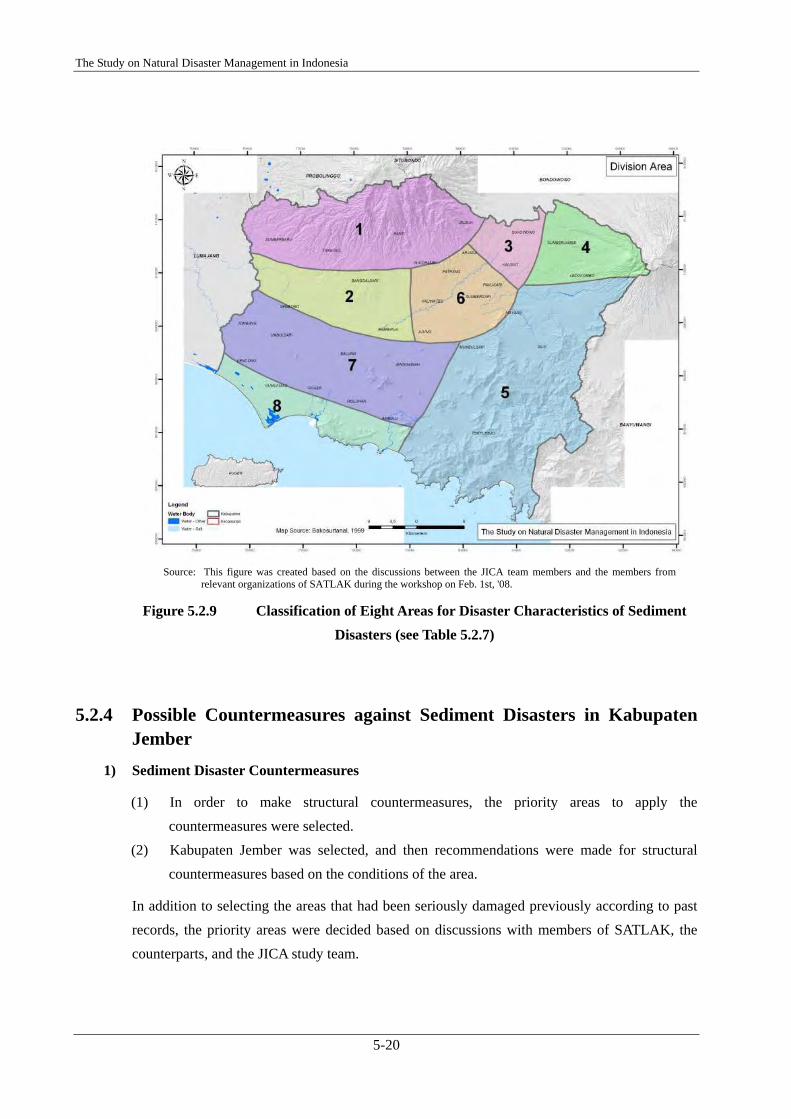
Kabupaten Jember was divided into 8 areas based on analysis (e.g. geology, land classification) and the results of reconnaissance work. These results were produced based on discussions with members of SATLAK at the workshop held on 1st Feb. ’08.
Table 5.2.7 Characteristics of Each Sediment Disaster Area
Area (Classification) Regional characteristics and sediment disaster trends
1 North-West Mountain Area
Thickly covered by Volcanic products; slopes are steep, with comparatively high erosion and collapse. Forest is dense, partly plantation. Although most is mountainous, it is densely-populated in the northwestern part and the lower part of the northeast; economic activity is also rich. It is an area in which sediment disasters tends to occur.
2 North-West Piedmont Area
It is covered by volcanic products like the northwestern mountain area, and the erosion and collapse of river channels is comparatively high. Moreover, it is densely-populated and is an area of high sediment disaster danger in Kabupaten Jember.
3 North-East Piedmont Area
It is covered by lithic tuff comparatively strong against erosion etc. also by volcanic products; geographical features: slope is not so steep, and the danger of sediment disasters is not so high.
4 North-East Mountain Area
It is covered by pyroclastic rock, and dense forest. However, felling has increased in recent years, and erosion and collapse are also increasing. There is also much sediment flow in rivers, and the sediment disaster occurrence danger along rivers is also increasing.
5 South-East Mountain Area
This area mostly covered by volcanic products and partly with tertiary rock, and there is comparatively little erosion and collapse. It is woody, with tree plantations. The occurrence frequency of sediment disaster is low.
6 Central Urbanized Area
This area is the central part of Kabupaten Jember, and is the most densely-populated area. Although part is comparatively gently-sloping, there is also a steep slope in part, and damage is also sometimes caused by sediment collapse etc..
7 Plain Field in South-West Area
This area is covered with the alluvial deposits; the terrain is flat with paddy fields. Sediment disasters hardly ever occur.
8 Estuary and Coastal Area in South-West
Almost all areas are covered with the alluvial deposit, the terrain is also flat, and there is almost no danger of sediment disasters.
The Study on Natural Disaster Management in Indonesia
5-20
Source: This figure was created based on the discussions between the JICA team members and the members from
relevant organizations of SATLAK during the workshop on Feb. 1st, '08.
Figure 5.2.9 Classification of Eight Areas for Disaster Characteristics of Sediment Disasters (see Table 5.2.7)
5.2.4 Possible Countermeasures against Sediment Disasters in Kabupaten Jember
1) Sediment Disaster Countermeasures
(1) In order to make structural countermeasures, the priority areas to apply the countermeasures were selected.
(2) Kabupaten Jember was selected, and then recommendations were made for structural countermeasures based on the conditions of the area.
In addition to selecting the areas that had been seriously damaged previously according to past records, the priority areas were decided based on discussions with members of SATLAK, the counterparts, and the JICA study team.

Final Report
5-21
A. Selection of Priority Areas that need Countermeasures
The following two areas were selected for priority countermeasures. These are designated as S1 and S2 in Figure 5.2.10.
(1) Kec. Panti; Kec. Sukorambi; Kec. Arjasa; Kec. Jelbuk; Kec. Patrang; and Kec. Kaliwates
(2) Kec. Ledokombo and Kec. Silo
Figure 5.2.10 Priority Areas for Sediment Disaster Countermeasures (S1, S2)

The Study on Natural Disaster Management in Indonesia
5-22
B. Overview of the Priority Areas
An overview of the priority areas S1 and S2 are given below in Table 5.2.7 and Table 5.2.8, respectively.
Table 5.2.8 Profile of S1 Area
Relevant Kecamatan & Desa
Kecamatan Panti Kemiri, Suci, Pakis, Serut, Panti, Glagahwero, Kemuning Lor Kecamatan Sukorambi Klungkung, Karangpring, Sukorambi, Dukuhmencek Kecamatan Arjasa Kemuning Lor, Darsono, Kamal, Arjasa, Candijati Kecamatan Jelbuk Sucopangepok, Panduman, Suger Kidul, Sukojember, Jelbuk Kecamatan Patrang Bintoro, Jumerto, Banjarsengon, Slawu, Baratan Kecamatan Kaliwates Kebongung
Population 175,448 Area 230.81 km2
Population Density 760.1 people/km2
Land Use Main land use is forestation, as well as plantations, and paddy fields.
Rivers flowing though the area
Bedadung river and the upstream tributaries such as Denoyo river, Putih river, Arjasa river, Kemiri river and Klungkung river
Characteristics of sediment disaster
The S1 area is located on the south-eastern slope of Argopuro mountain. Most of S1 area is covered by the volcanic products, and is dissected by several valleys so one can easily see the collapsed slopes and deep valleys. In the northern mountainous part of S1 area, the land collapses easily from a geological viewpoint. And then an enormous amount of sediment is produced, which may increase the occurrence of debris flow in case of heavy rainfall. A serious and unprecedented sediment disaster happened in the area due to heavy rainfall from Dec. 29th, ’06 to Jan. 1st, ’07. In the upstream areas of Denoyo river and Putih river, heavy rainfall, which was more than 200mm/day for 2 days triggered slope failures and debris flows (Banjir Bandang). The physical process caused unprecedented disaster damage in the area downstream. It is pointed out that the illegal logging in the upper mountainous area is one cause of the enormous amount of sediment discharge.

Final Report
5-23
Table 5.2.9 Profile of S2 Area
Relevant Kecamatan & Desa
Kecamatan Ledokombo Kecamatan Silo Sumbersalak Sumberjati
Population 16,422 Area 110.76km2
Population Density 148.3 people/km2
Land Use Main land use is forestation, as well as plantations and paddy fields.
Rivers flowing though the area Mayang river and the upstream tributaries of Mayan river
Characteristics of sediment disaster
S2 area is located on the western slope of Raung mountain. Most of S2 area is covered by volcanic products, and land collapses easily from a geological viewpoint. And then a large amount of sediment is produced, which may increase the occurrence of debris flows in case of heavy rainfall. It is pointed out that the illegal logging and plantation activity in the area is one of the causes of the large amount of sediment discharge in recent years. The large amount of sediment discharge, as well as river discharge, accelerated erosion rate toward the upstream torrent and the river banks of Mayang river and its tributaries. It is said that the frequency of small scale sediment disasters has been increasing since 1998, when illegal logging and plantation development started in the area.
C. Possible Countermeasures
The sediment disaster countermeasures for the S1 and S2 areas are given below.
Table 5.2.10 Possible Countermeasures for S1 and S2 Areas
Non-structural Countermeasure Structural Countermeasure
S1 Area
・ Reforestation ・ Land use limitation ・ Early warning system for fast and
appropriate evacuation ・ Community activities ・ Evacuation shelter and route
・ Guide bank (Spur dike) ・ Retaining wall ・ Slope protection works (Grating
crib works)
S2 Area
・ Reforestation ・ Land use limitation ・ Early warning system for fast and
appropriate evacuation ・ Community activities ・ Evacuation shelter and route
・ Groundsel works ・ Embankment ・ Revetment works ・ Hillside works (Forestation)
The Study on Natural Disaster Management in Indonesia
5-24
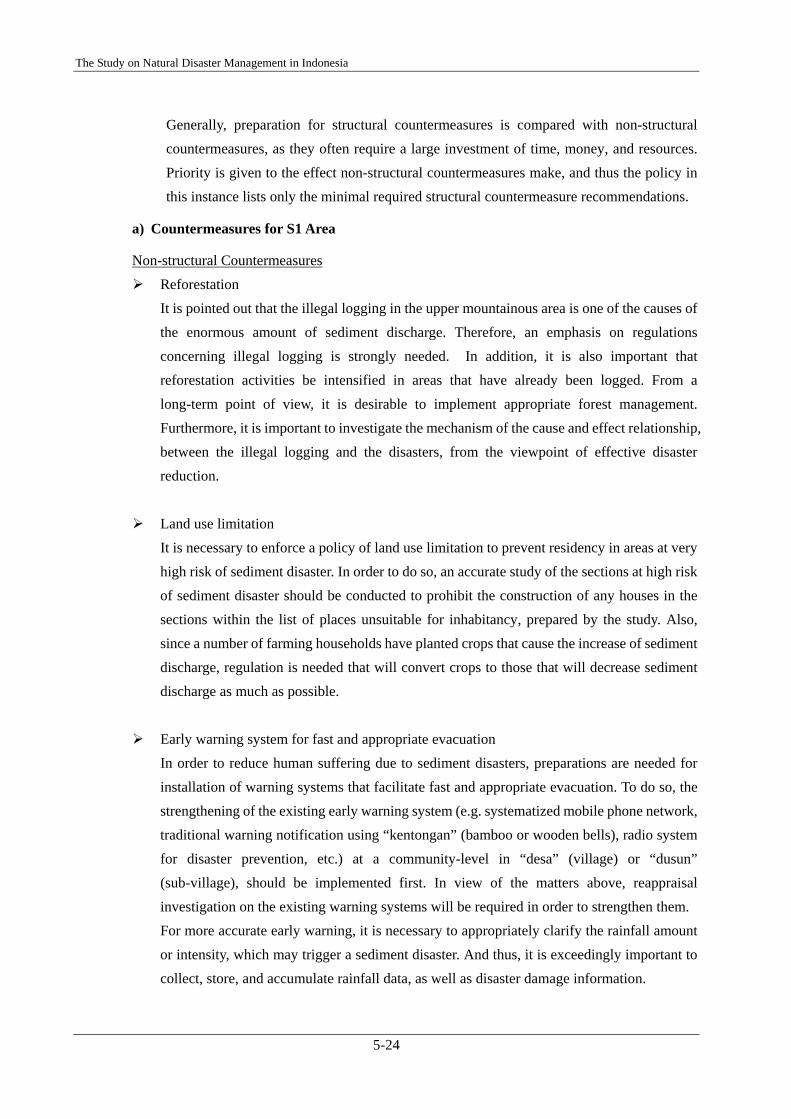
Generally, preparation for structural countermeasures is compared with non-structural countermeasures, as they often require a large investment of time, money, and resources. Priority is given to the effect non-structural countermeasures make, and thus the policy in this instance lists only the minimal required structural countermeasure recommendations.
a) Countermeasures for S1 Area
Non-structural Countermeasures Reforestation
It is pointed out that the illegal logging in the upper mountainous area is one of the causes of the enormous amount of sediment discharge. Therefore, an emphasis on regulations concerning illegal logging is strongly needed. In addition, it is also important that reforestation activities be intensified in areas that have already been logged. From a long-term point of view, it is desirable to implement appropriate forest management. Furthermore, it is important to investigate the mechanism of the cause and effect relationship, between the illegal logging and the disasters, from the viewpoint of effective disaster reduction.
Land use limitation
It is necessary to enforce a policy of land use limitation to prevent residency in areas at very high risk of sediment disaster. In order to do so, an accurate study of the sections at high risk of sediment disaster should be conducted to prohibit the construction of any houses in the sections within the list of places unsuitable for inhabitancy, prepared by the study. Also, since a number of farming households have planted crops that cause the increase of sediment discharge, regulation is needed that will convert crops to those that will decrease sediment discharge as much as possible.
Early warning system for fast and appropriate evacuation
In order to reduce human suffering due to sediment disasters, preparations are needed for installation of warning systems that facilitate fast and appropriate evacuation. To do so, the strengthening of the existing early warning system (e.g. systematized mobile phone network, traditional warning notification using “kentongan” (bamboo or wooden bells), radio system for disaster prevention, etc.) at a community-level in “desa” (village) or “dusun” (sub-village), should be implemented first. In view of the matters above, reappraisal investigation on the existing warning systems will be required in order to strengthen them. For more accurate early warning, it is necessary to appropriately clarify the rainfall amount or intensity, which may trigger a sediment disaster. And thus, it is exceedingly important to collect, store, and accumulate rainfall data, as well as disaster damage information.

Final Report
5-25
Further, mechanical equipment such as a telemeter rain gauge system, wire sensor for debris flow, and surveillance cameras are expected to be installed in the future, when there will be enough budget to provide such equipment.
Community activities
It is desirable to have prompt and accurate community level countermeasures in place prior to the occurrence of sediment disasters. As mentioned in the previous paragraph, the strengthening of the existing early warning systems (e.g. systematized mobile phone network, traditional warning notification using “kentongan” (bamboo or wooden bells), radio system for disaster prevention, etc.) at a community-level in “desa” (village) or “dusun” (sub-village), should be implemented first of all. It is also effective to carry out evacuation drills and to create a community disaster map in order to raise residents’ awareness of disaster preparedness at a community level.
Evacuation shelter and route
The public facilities (e.g. mosques, village (desa) office, sub-village (dusun) office, public schools, etc.) should be used as evacuation shelters in case of emergency. The location of such public facilities should be out of high sediment disaster hazard areas. Further, it is also important to improve the evacuation routes so that prompt evacuation action is possible. If public facilities are unable to accommodate the desirable number of evacuees, construction of new evacuation facilities should be investigated.
Structural Countermeasures Guide bank (Spur dike)
In general, guide banks (spur dike) are constructed along river banks, to protect residential areas nearby the bank and intake facilities for irrigation purposes, as well as to prevent erosion at the water collision front. Construction of longitudinal training dikes is one possible countermeasure in S1 area. The possible extension along the river bank is more or less 30 to 50 meters, with a height of 5-10 meters. It should be noted that it is necessary to investigate in more detail from the hydro-dynamic design point of view (e.g. construction site, construction process, etc.).

The Study on Natural Disaster Management in Indonesia
5-26
Retaining wall Generally, retaining walls are a structural countermeasure especially targeting steep slope areas. The construction of retaining walls aims to prevent falling rocks from the slope and prevent damage from sediment disasters. Basically, this measure aims to protect several homes.
Slope protection works (grating cribs)
Slope protection works (grating cribs) are, in general, constructed as structural countermeasures in the slope failure hazard area. It aims to fix the slope to prevent slope failure, in order to protect a residential area near the slope. The type of slope protection should be those involving greenery or planting work. It should be noted that it is necessary to investigate in more detail from the design point of view (e.g. site selection, construction process, dimensions, etc.). For possible slope failure in excess of 1 ha, priority is given to early-warning and evacuation of residents inhabiting the high risk area.
b) Countermeasure for S2 Area
Non-structural Countermeasures Reforestation
The frequency of small-scale sediment disaster is said to have increased since 1998, when illegal logging and plantation development started in the area. Consequently, strengthening regulations to curtail illegal logging is needed. In addition, it is necessary to intensify reforestation activities in illegally logged areas. In the long term, it is desirable to implement appropriate forest management. Furthermore, it is important to investigate the mechanism of the cause and effect relation between illegal logging and disasters in order to effectively reduce disasters.
Early warning system for fast and appropriate evacuation
Fundamentally, countermeasures similar to S1 area are necessary. Nevertheless, there is no necessity for wire sensors for debris flow or the installation of surveillance cameras at the present stage.
Land use limitations, community activities, and evacuation shelter and route Countermeasures similar to S1 area are necessary.
Structural Countermeasures Embankment

Final Report
5-27
Embankment works are generally constructed along river banks. In S2 area, the communities, located along riversides where there is high risk of debris flow, should be protected by embankment works in view of recent increased river and sediment discharge. The possible dimension of the embankment that may be constructed is for approximately 100 – 200 m long. It is necessary to investigate in more detail from the design point of view (e.g. site selection, construction process, dimensions, etc.).
Groundsel works
Groundsel works are supposed to be constructed along mountainous upstream rapids. The objectives are to prevent sediment discharge and to fix the riverbed. The possible dimension is about 5 to 10 m in width, avoiding concrete where possible; so it is desirable to use gabion, etc.
Revetment works
Revetment works are supposed to be constructed along streams in mountainous upstream areas in order to prevent bank erosion of mountainous streams. There installation aims to preserve cultivated lands of inhabitants in the area, and will be on a scale of 10 to 20 m in length, and about 3 to 5 m in height.
Hillside works (forestation)
Hillside works aimed to preserve devastated mountainous areas to prevent collapses, and preserve water sources. More detailed investigation is necessary from the design point of view (e.g. site selection, construction process, dimensions, etc.).

The Study on Natural Disaster Management in Indonesia
5-28
5.2.5 Capacity Development Activities 1) Capacity Development Activities for the Counterpart
A total of eight workshops were held in Jember during the project aimed at professional capacity development of the counterpart. A summary is given in Table 5.2.10.
Table 5.2.11 Outline of the Workshops
No. Date Location Participants Content of Results
1 2007.9.7 JICA office 23
The present conditions and countermeasures against sediment disasters in Japan. There were also many attendants at this first gathering and many questions. Moreover, according to the result of the questionnaire, the content was highly intelligible.
2 2007.9.20 JICA office 13 Outline of creating the HM and RM using GIS, standard rainfall for warning and evacuation, etc.
3 2008.1.28 JICA office 8 Discussion on creation method and validity of HM and RM.
4 2008.2.1 JICA office 9 Understanding the disaster characteristics of the area and discussion of countermeasures.
5 2008.2.5 JICA office 8 Selection of the priority areas to construct disaster countermeasure structures and discussion of the possible structures.
6 2008.2.12 Field 8 Method to conduct field survey and implementation of sediment disaster field survey.
7 2008.2.14 JICA office 7 Discussion on sediment countermeasures in priority areas.
8 2008.2.20 JICA office 6
Final discussion on sediment disaster countermeasures and general overview of past workshops. Platform for comments from all counterparts.

Final Report
5-29
A. Workshop on Sept. 7th 2007
There were a large number of attendees including the counterparts from the first workshop. A presentation was given on the frequent sediment disasters in Japan, located in volcanic zones, along with a comparison and likeness to the sediment disasters in Indonesia. The session generated many questions. However, without an expert on disaster prevention, the questions were limited to their knowledge on the cause of damage and countermeasures.
Figure 5.2.11 Scene from First Workshop
B. Workshop on Sept. 20th 2007
The concepts of the hazard and risk maps were presented along with an explanation of concrete methods and use of GIS to produce them. Explanation of the necessary documents for creating these maps was given, as well as estimating rainfall levels for evacuation based on previously collected records. However, the level of understanding of the trainees was not yet satisfactory.
Figure 5.2.12 Scene from Second Workshop
C. Workshop on Jan. 28th 2008
Using the completed hazard and risk maps, and checking the records of previously affected areas, selection of the priority areas for disaster countermeasures was discussed. The participants gained an understanding of the site conditions, and were able to validate the areas with high risk or hazards, in reference to the completed hazard map and previous records.

The Study on Natural Disaster Management in Indonesia
5-30
Figure 5.2.13 Scene from Third Workshop
D. Workshop on Feb. 1st 2008
The disaster characteristics of each area were discussed based on results of the survey, and the hazard and risk maps. Participants displayed limited knowledge on countermeasure construction, so Japanese case studies were presented along with preexisting structures in Indonesia.
Figure 5.2.14 Scene from Fourth Workshop

Final Report
5-31
E. Workshop on Feb. 5th 2008
The priority areas to construct disaster countermeasure structures were selected and possible structures were discussed. Selection of priority areas was carried out with a simple agreement among members, but decision on construction proved difficult due to the lack of knowledge in this area. As a result, it was difficult to reach an agreement.
Figure 5.2.15 Scene from Fifth Workshop
F. Workshop on Feb. 12th 2008
An effective survey was conducted of a disaster site and training was given on how to organize the records of recent sediment disaster sites. The method of the disaster survey was based on the Sediment Disaster Survey Manual (Draft) produced in the Project on Integrated Sediment-Related Disaster Management Project For Volcanic Areas (May 2003 to March 2006)
Figure 5.2.16 Scene from Sixth Workshop

The Study on Natural Disaster Management in Indonesia
5-32
G. Workshop on Feb. 14th 2008
Structural recommendations for the selected priority areas were discussed. The study team presented a number of possibilities in a list, and discussion was held on the viability of those options. There was still misunderstanding about the function of certain structures and so forth, so discussion could not proceed smoothly, but this should prove to have been a valuable exercise when considering sediment disasters in the future.
Figure 5.2.17 Scene from Seventh Workshop
H. Workshop on Feb. 20th 2008 This was the final workshop in Jember, and served to integrate all the work that had been done thus far. There were fewer participants this time, but these were the most vigorous participants throughout the project. There was a general understanding of the intentions of the technical transfer, and judging from the questionnaire at the end of the workshop, it was a great success.
Figure 5.2.18 Scene from Eighth Workshop

Final Report
5-33
5.2.6 Future work Although a fundamental hazard map and risk map were created, continuous information acquisition is crucial from now on to utilize these maps effectively.
Also, it is necessary to make C/P understand the creation process of these maps, the importance of data, the technique of a field survey, etc.
Moreover, the following activities are important: 1) Improving the accuracy of standard rainfall by accumulating rainfall data, or installing equipment/stations for observing hourly rainfall, and 2) Raising accuracy of the hazard and risk map to narrow down the disaster prone area, through detailed investigation of risk area. Necessary and recommended activities for raising accuracy of the maps are described below.
- Installation of self-made recording rain gauges or telemeter rain gauges, and water level observation stations
- Detailed field investigation of steep slopes or areas in danger of collapsing. - Making a topographical map with 1:10,000 or greater scale, including information on
shelter and evacuation routes, and longitudinal and cross-sectional profiles of rivers. - Proper arrangement and storage of rainfall data and disaster records

The Study on Natural Disaster Management in Indonesia
5-34
5.3 Characteristics of Sediment Disaster and Countermeasures in Kabupaten Padang Pariaman
5.3.1 Characteristics of Sediment Disasters in Kabupaten Padang Pariaman 1) Sediment Disasters in the Past
Pyroclastic flow deposits, which comprise a large part of the upland areas of northwest Kabupaten Padang Pariaman, are mostly composed of unconsolidated pumiceous sand and gravel, and relatively prone to slope failure. This area has experienced slope failure every year, although the large-scale incidence is low, small-scale collapses occur along roads and such. However, very little of the disaster records of those past incidents exist within regional organizations. The table below shows the sediment disaster records of recent years (flood records included).
Table 5.3.1 Recent History of Kabupaten Padang Pariaman
Date (DD/MM/YY) Type Profile of Damage due to Disaster
09/09/08 Sediment Kec. IV Koto Aur Malintang Nagari 3 Koto aur malinttang About 50m of trunk road slipped away
21/07/08 Sediment Kec.Sungai Limau(Padangalo) Damaged House 1
24/04/07 Flood Flood Disaster in Kec. Ulakan Tapakis and Kec. Sintoga Flooded Houses: 98
22-23/01/07 Flood
Flood Disaster in Kec. Batang Gasan, Kec. Sungai Limau, Kec. V Koto Kp. Dalam, Kec. Nan Sabaris, Kec. Ulakan Tapakis, and Kec. Batang Anai Flooded Houses: 1,506; Flooded Schools: 8
12/01/07 Flood Flood Disaster in Kec. Batang Anai, Kec. Lubuk Alung, Kec. Ulakan Tapakis, Kec. Batang Gasan, and Kec. V Koto Kp. Dalam Flooded Houses: 234; Heavily Damaged Houses: 14; etc.
08/01/07 Sediment Landslide Disaster in Kec. V Koto Timur Number of Deaths: 13; Buried Houses: 4; etc.
12/01/06 Flood
Flood Disaster in Kec. Batang Anai, Kec. Lubuk Alung, Kec. Ulakan Tapakis, Kec. Batang Gasan, Kec. Sungai Limau, Kec. VII Koto, Kec. V Koto Kampung Dalam Flooded Houses: 1,204; Heavily Damaged Houses: 4; etc.
25/04/05 Flood Flood Disaster in Kec. Batang Anai, Kec. Lubuk Alung, Kec. Ulakan Tapakis, Kec. Batang Gasan, and Kec. V Koto Kp. Dalam Flooded Houses: 340; Heavily Damaged Houses: 4; etc.
Source: Board of National Unity and Society Protection, Kabupaten Padang Pariaman
In the sediment disaster (slope collapse) which occurred on January 8, 2007, as shown in the table, 13 deaths were reported. The slope along one of the rivers about 60 m in height and about 50 m in
Final Report
5-35
width collapsed. The presumed amount of sediment collapse from field surveys and interviews was about 15,000 m3. The sediment crossed the river and advanced upon those living on the opposite shore.
2) Factors of Sediment Damage
The mechanical factors involved in a calamity are loose ground (unconsolidated pumiceous sand and gravel), and a steep slope; however the most prominent incitant factor is heavy rain.
Thanks to the high levels of humidity and rain in the region, the entire area has very good vegetation. Also, the lack of large-scale felling of trees contributes positively toward mitigation of sediment disasters. However, many sediment disasters do occur such as when traffic is cut off due to roadside slope collapse.
No less than 13 people were killed in the earth-and-sand disaster on January 18, 2007, even though there was hardly any rainfall observed in the four days leading up to and including that day. However, about one week prior, around 100 mm of continuous rainfall was recorded, and it would seem that the disaster was caused by this rainfall. The collapsed slope faces the river channel and the skirt of the slope was considerably scoured by rushing water. Therefore, it is presumed that it collapsed all at once due to the permeation of rain water and the pull of gravity.
3) Rainfall Analysis
The rainfall characteristics of Kabupaten Padang Pariaman, located on the west side of Sumatra, are given below. The rainfall data used was collected and organized by PSDA (Dinas Pengelolaan Slimber Daya Air [Water Resource Management Agency]) from the following organizations:
・ BMG: Badan Meteologi dan Geofisika (Meteorological and Geo-physical Agency) ・ PLN: Perusahaan Listrik Negara (National Electricity Company) ・ DPU:Dinas Pekerjaan Umum (Public Works Department) ・ Kimpraswil: Pemukinam Prasarana Wilayah (Region Settlements and Infrastructures) ・ Dep Pertanian Irigasi (Agriculture and Irrigation Department)

The Study on Natural Disaster Management in Indonesia
5-36
Figure 5.3.1 Rain Gauge Station Map

Final Report
5-37
Table 5.3.2 Precipitation at the Time of Disaster Occurrence

The Study on Natural Disaster Management in Indonesia
5-38
4) Relation between Rainfall and Water Related Disasters
With the exception of the disaster on January 18, 2007, rain was observed on the day of or the day previous to the day the disaster occurred. As such, the incitant factor of most sediment disasters is rainfall.
Table 5.3.3 Precipitation at the Time of Disaster Occurrence
*) The dates of the disasters are colored

Final Report
5-39
5.3.2 Sediment Hazard Map in Kabupaten Padang Pariaman 1) Indices of Hazard Map in Kabupaten Padang Pariaman
Based on data collected from related institutions and the main factors of those shown to have triggered sediment disasters in other studies, there are two primary causes for sediment disaster: mechanical factors and incitant factors. Mechanical factors depend on the field conditions where a sediment disaster takes place, whereas an incitant factor is an external force which affects the area where a sediment disaster takes place. The mechanical and incitant factors of sediment disaster are summarized in the table below.
Table 5.3.4 Mechanical and Incitant Factors of Sediment Disasters
SEDIMENT DISASTER MECHANICAL FACTORS INCITANT FACTORS
Slope Failure
Geology: impact of rock strength, weathering, deterioration, cracks / fractures, direction of terrain, condition of permeable layer, looseness of surface layer, layer distribution. Features: most slope failure on steep slopes (30 degrees or more), as well as recessed slopes where rainfall can accumulate and change the shape of the slope. Vegetation: forest recognized for effect to prevent surface failure.
Rainfall: many cases of slope failure where there is intense rainfall and already moisture in the ground. Seismic/Volcanic activity: earthquakes and volcanic activity affects stress conditions inside the slope, destabilizing the ground. Groundwater: Water seepage from rain can increase water pressure in the soil and impact slope failure. Human activity: deforestation, changing the natural slope by earth cutting or filling, etc.
Debris flow
Basin geography: steep slopes, unstable mountainside, potential for surface water to accumulate, existence of groundwater or springs. River geography: vertical slope in river bed, planar and vertical grade of river channel. Unstable soil: thickness of weathered hill slope layers, thickness and amount of river bed sediment, volume and composition of sediment, sedimentation due to slope failure.
Rainfall/Snow Melt: Rapid increase of water flow or great quantity of runoff. Seismic/Volcanic activity: large amount of unstable soil produced from slope failure (mechanical), collapse of crater lake from eruption, runoff of heavy snow melt, etc.
Landslide
The greatest incidence of landslides is of the tertiary layer. The tertiary sediment layer is young with low solidity so there is little resistance to weathering. Also, the mode of weathering has characteristics, as repeated alternation between dry and wet will refine the grain or create rapid argillation. Further, the ground is composed of sandstone / mudstone, and smectite (montmorillonite) contained in the mudstone has the potential to swell, which can trigger a landslide.
Water will incite landslides. This mainly happens when rain water permeates the ground. When that water increases pressure in the pores of the soil, this decreases the soil shearing force. On the other hand, landslides can also be triggered by human activities such as cutting away the slope in the landslide zone, or even cutting or filling land in an area seemingly unrelated to the landslide zone for civil engineering purposes.
Source: GUIDELINES FOR DEVELOPMENT OF WARNING AND EVACUATION SYSTEM AGAINST SEDIMENT
DISASTERS IN DEVELOPING COUNTRIES (Infrastructure Development Institute-Japan)

The Study on Natural Disaster Management in Indonesia
5-40
The hazard map for sediment disasters in Kabupaten Padang Pariaman was created based on data and information provided from the relevant organizations of Kabupaten Padang Pariaman and PSDA (Pengelolaan Sumber Daya Air) of West Sumatra Province; through the discussions between the experts of the JICA study team and the counterpart members of Kabupaten Padang Pariaman. The indices used for creating the hazard map for sediment disasters are indicated in Table 5.3.5. The indices of “Slope,” “Geology” and “Annual Rainfall” were adopted as indices of sediment hazard.
Table 5.3.5 Indices used for creation of sediment hazard map
Hazard Indices
1) Slope (HP4)
2) Geology (HP5)
3) Annual Rainfall (HP6)
The formula used for assessment of sediment hazard for Kabupaten Padang Pariaman is shown below.
Hazard = HP4 + HP5 + HP6
where, HP4: Index value of slope; HP5: Index value of geology; and HP6: Index value of annual rainfall.
A. Slope (HP4)
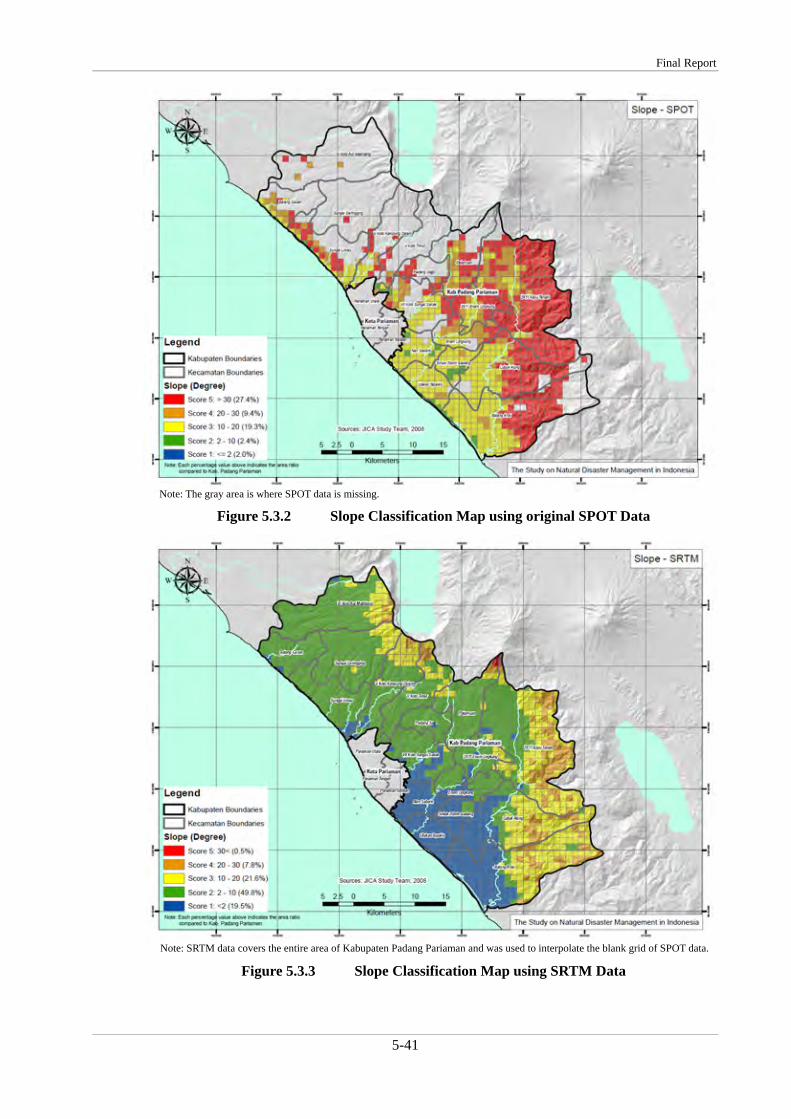
As mentioned above, many cases of sediment disaster involve slope incline as a mechanical factor. Generally, landslips take place on gentle 5 to 30 degree slopes, whereas larger landslides take place on steep inclines over 30 degrees. In addition, in Kabupaten Padang Pariaman, trying to view landslide configuration by field survey or aerial photograph was not acceptable. Based on this knowledge, SPOT data (20m resolution) and SRTM (90m resolution) data are used, and the hazard index map “slope” was created. The original SPOT data doesn’t cover the entire area of Kabupaten Padang Pariaman. So SRTM data, which covers the entire area, was used to interpolate the blank grid of SPOT data. A scoring system to assess hazard in terms of slope is applied based on the following classification.
i) Score 5 : 30 o or more <Highest Hazard>
ii) Score 4 : 20o - 30 o <Higher Hazard>
iii) Score 3 : 10o - 20 o <Moderate Hazard>
iv) Score 2 : 2o - 10 o <Lower Hazard>
v) Score 1 : 2o or less <Lowest Hazard>
Final Report
5-41
Figure 5.3.2 Slope Classification Map using original SPOT Data
Figure 5.3.3 Slope Classification Map using SRTM Data
Note: The gray area is where SPOT data is missing.
Note: SRTM data covers the entire area of Kabupaten Padang Pariaman and was used to interpolate the blank grid of SPOT data.

The Study on Natural Disaster Management in Indonesia
5-42
Figure 5.3.4 Hazard Index Map “Slope (HP4)”

Final Report
5-43
B. Geology (HP5)
Geology is a significant mechanical factor in sediment disaster. A geology map was made based on analysis that specifies which conditions are prone to disaster. Fundamentally, the hazard area can be termed as the area in which unconsolidated sediments, unconsolidated sand, gravel, and what is called pyroclastic flow sediments, such as pyroclastic flow deposit, are located. A scoring system to assess hazard in terms of geology is applied based on the following classification.
i) Score 5 : Unconsolidated sediments, unconsolidated sand, gravel and pyroclastic
flow deposit <Highest Hazard>
ii) Score 3 : Hard rock, alluvium (gravel and sand) <Moderate Hazard>
iii) Score 1 : Alluvium (sand and silt, reclaimed filler) <Lowest Hazard>
Figure 5.3.5 Geology Map

The Study on Natural Disaster Management in Indonesia
5-44
Figure 5.3.6 Hazard Index Map “Geology (HP5)”
C. Annual Rainfall (HP6)
Precipitation is a large incitant factor of sediment disasters. The data currently observed in Kabupaten Padang Pariaman and its vicinity was collected. The average annual rainfall data are used as an index. The annual rainfall was divided into five categories and scored accordingly, as follows:
i) Score 5 : 4,500 - 5,000 (mm) <Highest Hazard>
ii) Score 4 : 3,500 - 4,500 (mm) <Higher Hazard>
iii) Score 3 : 2,500 - 3,500 (mm) <Moderate Hazard>
iv) Score 2 : 1,500 - 2,500 (mm) <Lower Hazard>
v) Score 1 : 1,000 - 1,500 (mm) <Lowest Hazard>

Final Report
5-45
Figure 5.3.7 Annual Rainfall Distribution Map
Figure 5.3.8 Annual Rainfall Distribution Map (Grade) (HP6)

The Study on Natural Disaster Management in Indonesia
5-46
2) Sediment Hazard Map in Kabupaten Padang Pariaman
The sediment disaster hazard map was evaluated as the sum of Slope (HP4), Geology (HP5), and Annual Rainfall (HP6). Refer to Figure 5.3.9 showing the sediment hazard map for Kabupaten Padang Pariaman. As indicated in the figure, the values of sediment hazard were divided into five (5) classes indicating relative hazard classification. Kabupaten Padang Pariaman is widely covered by friable pyroclastic products except the coastal plains in the southwest region. In general, sediment hazard is higher in steep slope area combined with heavy rainfall. Based on the hazard assessment, almost 80% of the total area of Kabupaten Padang Pariaman can be regarded as the highest or high hazard areas in terms of sediment disaster. In particular, the north side of Kec. V Kamung Dalam, the north side of Kec.V Koto Timur, nearly the entire region of Kec. Palamuan, and the west side of 2x11 Kayu Tanam, are areas of high hazard.
Figure 5.3.9 Hazard Map for Sediment Disaster in Kabupaten Padang Pariaman

Final Report
5-47
5.3.3 Sediment Risk Map in Kabupaten Padang Pariaman 1) Basis of Creating a Risk Map for Sediment Disasters
The risk map is made by calculating vulnerability factors from the hazard map for disaster prevention, taking into consideration other physical, social, economic, and environmental aspects.
According to “Living with Risk” (UN/ISDR, 2004), vulnerability is defined as “the conditions determined by physical, social, economic, and environmental factors or processes, which increase the susceptibility of a community to the impact of hazards.”
The vulnerability indices are shown in Table 5.3.6. The details of vulnerability indices for “Population Density (VP1),” “Built-up Area (VP2),” and “Road/Rail in Steep Area (VP4)” are described in section of 1.6.4, CHAPTER 1, Vol.3: Supporting Report.
Table 5.3.6 Vulnerability Indices Used for Sediment Disasters
Vulnerability Indices
1) Population Density (VP1)
2) Built-up Area (VP2)
3) Road/Rail in Steep Area (VP4)
The formula used for assessment of sediment risk for Kabupaten Padang Pariaman is shown below.
Risk = Hazard x Vulnerability
Risk = (HP4 + HP5 + HP6) x (VP1 + VP2 + VP4) (Eq. 5.2)
where, HP4: Index value of slope; HP5: Index value of geology; HP6: Index value of annual rainfall;VP1: Index value of population density; VP2: Index value of built-up area; and VP4: Index value of road/rail in steep area.
2) Creation of Sediment Disaster Risk Map in Kabupaten Padang Pariaman
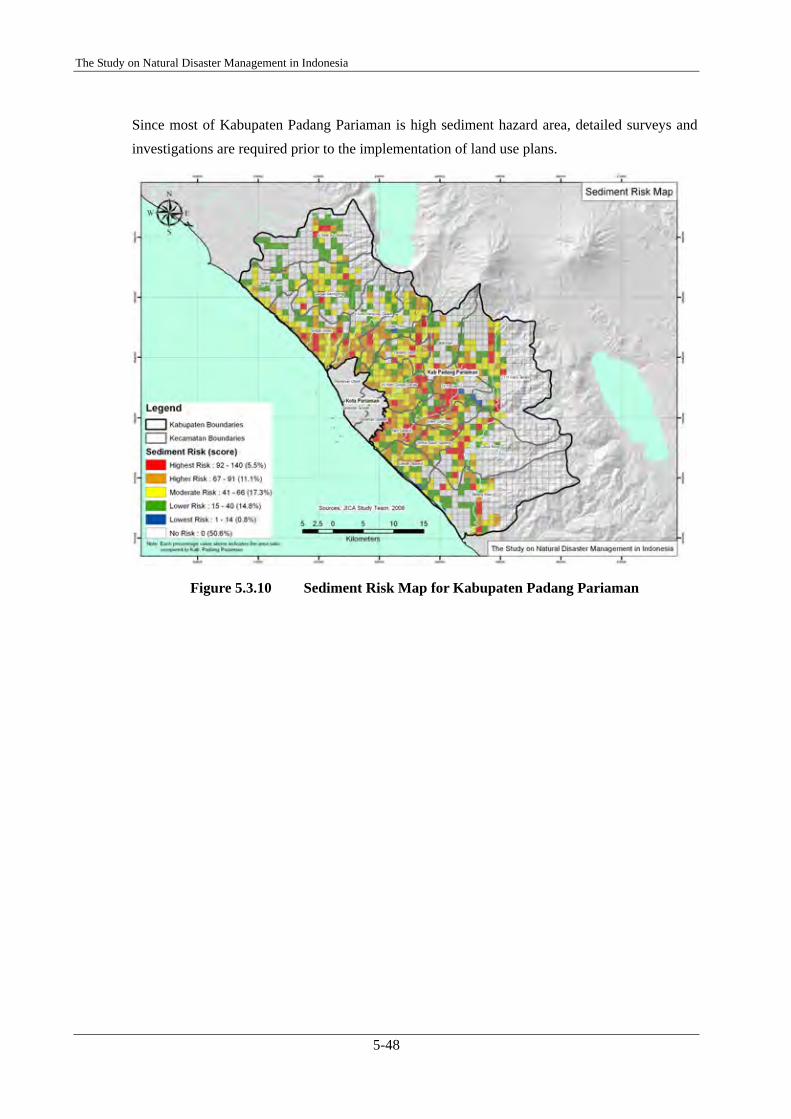
Refer to Figure 5.3.10 showing the sediment risk map for Kabupaten Padang Pariaman. The high risk grids are essentially in the area where buildings and population are concentrated. There were a number of sediment disasters along roads by steep slopes in mountainous areas or coastal terraces in the past. Even though higher sediment hazards are indicated in the eastern region of Kabupaten Padang Pariaman, risk indications in the region are not high since the vulnerability indices are not so high. Based on the risk assessment, almost 17% of the total area of Kabupaten Padang Pariaman can be regarded as the highest or high risk areas in terms of sediment disaster.
The Study on Natural Disaster Management in Indonesia
5-48
Since most of Kabupaten Padang Pariaman is high sediment hazard area, detailed surveys and investigations are required prior to the implementation of land use plans.
Figure 5.3.10 Sediment Risk Map for Kabupaten Padang Pariaman

Final Report
5-49
5.3.4 Possible Countermeasures against Sediment Disasters in Kabupaten Padang Pariaman Kabupaten Padang Pariaman requires sediment disaster countermeasures in almost all areas except the western plains. In particular, measures need to be constructed immediately along certain trunk roads located on the north side of Kec. V Koto Kampung Dalam, the north side of Kec. V Koto Timur, the whole region of Kec. Patamuan, the west side of Kec. 2 x 11 Kayu Tanam, the central part of Kec. IV Koto Aur Malintang, etc.
It is important to conduct a detailed investigation and set priorities to proceed with construction.
Moreover, part of a steep slope seen near the coast of Kec. Sungai Limau behind a house will require construction. Below are the proposed measures for sediment disaster prevention.

The Study on Natural Disaster Management in Indonesia
5-50
Table 5.3.7 Possible Countermeasures against Sediment Disaster

Final Report
5-51
5.3.5 Activities for Capacity Development A total of three workshops were held in Kabupaten Padang Pariaman during the project aimed at professional capacity development of the counterpart. A summary is given in Table 5.3.8.
Table 5.3.8 Outline of the Workshops
No. Date Place Purpose Participants
1 2008.6.11 Kabupaten Padang Pariama office
The characteristics and actual management of sediment disasters in Japan were introduced. Moreover, a questionnaire survey, which also served to gauge awareness of the counterpart’s disaster prevention measures, was conducted.
11
2 2008.7.3. Field study
The characteristics of each disaster (earthquake, tsunami, flood, sediment disaster) in Kabupaten and Kota were explained in the field based on our achievements thus far.
19
3 2008.9.8 Kota Pariama office
Procedures for creating hazard and risk maps were reviewed based on those which had been completed, along with a study of their meaning and use.
9
A. Workshop on June 11th 2008
The first workshop was held mainly for the counterparts in charge of technology at the Kabupaten Padang Pariaman office.
The person in charge of disasters (except for tsunami) introduced the characteristics of each disaster in Japan and the countermeasures against calamity, etc. using PowerPoint.
Figure 5.3.11 Photograph of the 1st workshop

The Study on Natural Disaster Management in Indonesia
5-52
B. Workshop on July 3rd 2008
Sites of past disasters were visited with the counterparts and explanation was given on the cause of the disaster, and on-site investigation methods based on previously collected data and local results. A visit was made to the site of the earth-and-sand disaster in Kec.V Koto Timur which occurred on January 8, 2007 -- comparatively one of the larger disasters in this area -- to discuss measurement and estimation methods of the amount of collapse sediment, the cause, and so forth.
Figure 5.3.12 Photograph of the 2nd workshop
C. Workshop on Sept. 8th 2008
The 3rd workshop was held after cooperating to create the hazard and risk maps in order to review the process and methods used, and to check the degree of comprehension of the counterparts.
Figure 5.3.13 Photograph of the 3rd workshop

Final Report
5-53
5.3.6 Future Suggestions Although a fundamental hazard map and risk map have been created, it is crucial to continue to acquire information from now on in order to utilize these maps effectively.
Also, it is necessary to educate the counterpart on the creation process of these maps, the importance of data, the field survey techniques, and so forth.
Moreover, the following activities are important: 1) Improvement of the accuracy of standard rainfall by accumulating rainfall data or installation of equipment/stations for observing hourly rainfall, and 2) Raising accuracy of the hazard and risk map to narrow down the disaster prone area by a detailed investigation of risk area.
Necessary and recommended activities for raising accuracy of the maps are described below:
- Installation of a self-made recording rain gauge or a telemetering rain gauge, and a water level observation station
- Detailed field investigation of steep slopes or places with a risk of collapse - Making a topographical map at a scale of 1:10,000 or greater scale including shelter and
evacuation route information, with longitudinal and cross-sectional profiles of the rivers
Furthermore, it is desirable to proceed concretely in this project together with the related departments (C/P) on topics such as the methods of making hazard and risk maps, field survey methods, places to install rain gauge stations, as well as deciding the type and how to use them, and showing residents how to make and use (and the value of) a simple rain gauge.

The Study on Natural Disaster Management in Indonesia
5-54
5.4 Disaster Characteristics of Sediment Disaster and Countermeasures in Kota Pariaman
5.4.1 Disaster Characteristics of Sediment Disaster in Kota Pariaman 1) Sediment Disasters in the past
In Kota Pariaman, most houses are located on the coastal plain. Although part of the terrain features low relief hills, there is comparatively little occurrence of sediment disaster. A record of a sediment disaster and floods in recent years is shown below.
Table 5.4.1 Recent Sediment disaster of Kota Pariaman
Date (DD/MM/YY) Type Profile of Damage due to Disaster
Flood Flood Disaster in Kec. South Pariaman Flooded Houses: 62, etc.
22/01/07
Sediment Landslide Disaster in Kec. North Pariaman Number of injuries: 3; Damaged Houses: 3; etc.
25/08/05 Flood Flood Disaster In Desa Marunggi, Desa Kampung Apar and Desa Pasir Sunur along Mangau river Damaged Houses: 94
Source: Board of National Unity and Society Protection, Kota Pariaman and National Security and Control (Occurrence) of
Pariaman City
2) Factors of Sediment Damage
The mechanical factor of sediment disasters in Kota Pariaman is the steep, terraced coastal area, and the incitant factor for all cases is rain. There does not appear to be any countermeasures put in place to prevent sediment disasters, and instead, reliance is put on post-disaster measures (e.g. repair and home relocation). At present, it is difficult to calculate the standard rainfall level for warning and evacuation, but this should be possible in the future by regularly accumulating disaster record data. Residents who live near slopes have had to rely on their past experience and intuition to take refuge. It is also fairly certain that slopes will collapse when an earthquake occurs in the future. It is desirable to conduct a detailed investigation of dangerous areas and to relocate homes, etc. accordingly.
Final Report
5-55
3) Rainfall Analysis
The rainfall characteristics of Kabupaten Padang Pariaman, located on the west side of Sumatra, are given below. The rainfall data used was collected and organized by PSDA (Dinas Pengelolaan Slimber Daya Air [Water Resource Management Agency]) from the following organizations:
・ BMG: Badan Meteologi dan Geofisika (Meteorological and Geo-physical Agency) ・ PLN: Perusahaan Listrik Negara (National Electricity Company)、
・ DPU: Dinas Pekerjaan Umum (Public Works Department) ・ Kimpraswil: Pemukinam Prasarana Wilayah (Region Settlements and Infrastructures) ・ Dep Pertanian Irigasi (Agriculture and Irrigation department)

The Study on Natural Disaster Management in Indonesia
5-56
Figure 5.4.1 Rain Gauge Station Map

Final Report
5-57
Table 5.4.2 Precipitation at the Time of Disaster Occurrence

The Study on Natural Disaster Management in Indonesia
5-58
4) Relation between Rainfall and Water Related Disaster
Almost all previous disasters occurred due to rainfall previous to or on the day of the disaster. As such, the incitant factor of most sediment disasters is rainfall.
Table 5.4.3 Precipitation at the time of disaster occurrence
*) The dates of the disasters are colored

Final Report
5-59
5.4.2 Sediment Hazard Map in Kota Pariaman 1) Indices of Hazard Map for Sediment Disaster
Based on data collected from related institutions and the main factors of those shown to have triggered sediment disasters in other studies, there are two primary causes for sediment disaster: mechanical factors and incitant factors. Mechanical factors depend on the field conditions where a sediment disaster takes place, whereas an incitant factor is an external force which affects the area where a sediment disaster takes place. The mechanical and incitant factors of sediment disaster are summarized in the table below.
Table 5.4.4 Mechanical and Incitant Factors of Sediment Disasters
SEDIMENT DISASTER MECHANICAL FACTORS INCITANT FACTORS
Slope Failure
Geology: impact of rock strength, weathering, deterioration, cracks / fractures, direction of terrain, condition of permeable layer, looseness of surface layer, layer distribution. Features: most slope failure on steep slopes (30 degrees or more), as well as recessed slopes where rainfall can accumulate and change the shape of the slope. Vegetation: forest recognized for effect to prevent surface failure.
Rainfall: many cases of slope failure where there is intense rainfall and already moisture in the ground. Seismic/Volcanic activity: earthquakes and volcanic activity affects stress conditions inside the slope, destabilizing the ground. Groundwater: Water seepage from rain can increase water pressure in the soil and impact slope failure. Human activity: deforestation, changing the natural slope by earth cutting or filling, etc.
Debris flow
Basin geography: steep slopes, unstable mountainside, potential for surface water to accumulate, existence of groundwater or springs. River geography: vertical slope in river bed, planar and vertical grade of river channel. Unstable soil: thickness of weathered hill slope layers, thickness and amount of river bed sediment, volume and composition of sediment, sedimentation due to slope failure.
Rainfall/Snow Melt: Rapid increase of water flow or great quantity of runoff. Seismic/Volcanic activity: large amount of unstable soil produced from slope failure (mechanical), collapse of crater lake from eruption, runoff of heavy snow melt, etc.
Landslide
The greatest incidence of landslides is of the tertiary layer. The tertiary sediment layer is young with low solidity so there is little resistance to weathering. Also, the mode of weathering has characteristics, as repeated alternation between dry and wet will refine the grain or create rapid argillation. Further, the ground is composed of sandstone / mudstone, and smectite (montmorillonite) contained in the mudstone has the potential to swell, which can trigger a landslide.
Water will incite landslides. This mainly happens when rain water permeates the ground. When that water increases pressure in the pores of the soil, this decreases the soil shearing force. On the other hand, landslides can also be triggered by human activities such as cutting away the slope in the landslide zone, or even cutting or filling land in an area seemingly unrelated to the landslide zone for civil engineering purposes.
Source: GUIDELINES FOR DEVELOPMENT OF WARNING AND EVACUATION SYSTEM AGAINST SEDIMENT
DISASTERS IN DEVELOPING COUNTRIES (Infrastructure Development Institute-Japan)
The Study on Natural Disaster Management in Indonesia
5-60
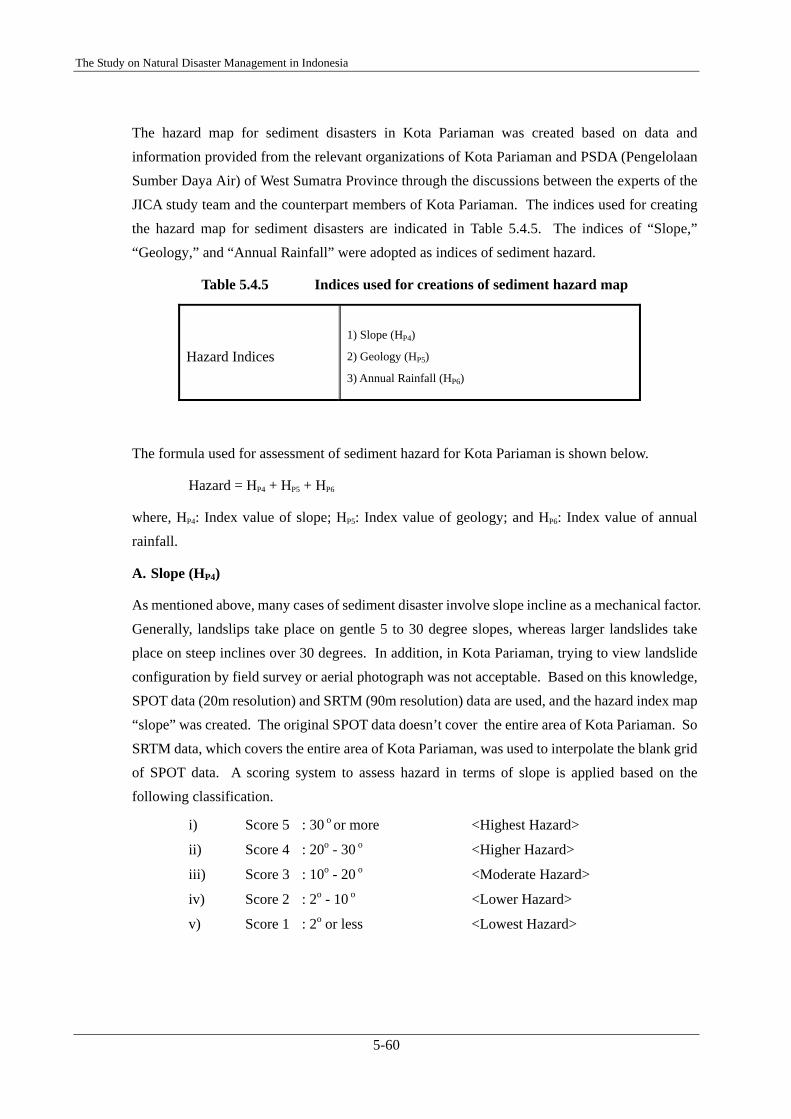
The hazard map for sediment disasters in Kota Pariaman was created based on data and information provided from the relevant organizations of Kota Pariaman and PSDA (Pengelolaan Sumber Daya Air) of West Sumatra Province through the discussions between the experts of the JICA study team and the counterpart members of Kota Pariaman. The indices used for creating the hazard map for sediment disasters are indicated in Table 5.4.5. The indices of “Slope,” “Geology,” and “Annual Rainfall” were adopted as indices of sediment hazard.
Table 5.4.5 Indices used for creations of sediment hazard map
Hazard Indices
1) Slope (HP4)
2) Geology (HP5)
3) Annual Rainfall (HP6)
The formula used for assessment of sediment hazard for Kota Pariaman is shown below.
Hazard = HP4 + HP5 + HP6
where, HP4: Index value of slope; HP5: Index value of geology; and HP6: Index value of annual rainfall.
A. Slope (HP4)
As mentioned above, many cases of sediment disaster involve slope incline as a mechanical factor. Generally, landslips take place on gentle 5 to 30 degree slopes, whereas larger landslides take place on steep inclines over 30 degrees. In addition, in Kota Pariaman, trying to view landslide configuration by field survey or aerial photograph was not acceptable. Based on this knowledge, SPOT data (20m resolution) and SRTM (90m resolution) data are used, and the hazard index map “slope” was created. The original SPOT data doesn’t cover the entire area of Kota Pariaman. So SRTM data, which covers the entire area of Kota Pariaman, was used to interpolate the blank grid of SPOT data. A scoring system to assess hazard in terms of slope is applied based on the following classification.
i) Score 5 : 30 o or more <Highest Hazard>
ii) Score 4 : 20o - 30 o <Higher Hazard>
iii) Score 3 : 10o - 20 o <Moderate Hazard>
iv) Score 2 : 2o - 10 o <Lower Hazard>
v) Score 1 : 2o or less <Lowest Hazard>

Final Report
5-61
Figure 5.4.2 Slope Classification Map using original SPOT Data
Figure 5.4.3 Slope Classification Map using SRTM Data
Note: The gray area is where SPOT data is missing.
Note: SRTM data covers the entire area of Kota Pariaman and was used to interpolate the blank grid of SPOT data.

The Study on Natural Disaster Management in Indonesia
5-62
Figure 5.4.4 Hazard Index Map “Slope (HP4)”

Final Report
5-63
B. Geology (HP5)
Geology is a significant mechanical factor in sediment disaster. A geology map was made based on analysis that specifies which conditions are prone to disaster. Fundamentally, the hazard area can be termed as the area in which unconsolidated sediments, unconsolidated sand, gravel and what is called pyroclastic flow sediments, such as pyroclastic flow deposit, are located. A scoring system to assess hazard in terms of geology is applied based on the following classification.
i) Score 5 : Unconsolidated sediments, unconsolidated sand, gravel and pyroclastic
flow deposit <Highest Hazard>
ii) Score 3 : Hard rock, alluvium (gravel and sand) <Moderate Hazard>
iii) Score 1 : Alluvium (sand and silt, reclaimed filler) <Lowest Hazard>
Figure 5.4.5 Geology Map

The Study on Natural Disaster Management in Indonesia
5-64
Figure 5.4.6 Hazard Index Map “Geology (HP5)”
C. Annual Rainfall (HP6)
Precipitation is a large incitant factor of sediment disasters. The data currently observed in Kota Pariaman and its vicinity was collected. The average annual rainfall data are used as an index. The annual rainfall was divided into five categories and scored accordingly, as follows:
i) Score 5 : 4,500 - 5,000 (mm) <Highest Hazard>
ii) Score 4 : 3,500 - 4,500 (mm) <Higher Hazard>
iii) Score 3 : 2,500 - 3,500 (mm) <Moderate Hazard>
iv) Score 2 : 1,500 - 2,500 (mm) <Lower Hazard>
v) Score 1 : 1,000 - 1,500 (mm) <Lowest Hazard>

Final Report
5-65
Figure 5.4.7 Annual Rainfall Distribution Map
Figure 5.4.8 Annual Rainfall Distribution Map (Grade) (HP6)

The Study on Natural Disaster Management in Indonesia
5-66
2) Sediment Hazard Map in Kota Pariaman
The sediment disaster hazard map was evaluated as the sum of Slope (HP4), Geology (HP5), and Annual Rainfall (HP6).
Refer to Figure 5.4.9 showing the sediment hazard map for Kota Pariaman. As indicated in the figure, the values of sediment hazard were divided into five (5) classes indicating relative hazardous classification. Similar to the geology of Kabupaten Padang Pariaman, pyroclastic products cover most of the area, especially the low relief hills on the north side of Kota Pariaman. The highest hazard can be seen in the north side of Kota Pariaman since the slope is also relatively steeper in the area. Lower hazard can be seen along the coastal line since the most of the area are very low and flat. The ratio of the highest and high hazard area to Kota Pariaman is more or less 60 %.
Figure 5.4.9 Sediment Disaster Hazard Map

Final Report
5-67
5.4.3 Sediment Risk Map in Kota Pariaman 1) Basis of Creating a Risk Map for Sediment Disasters
The vulnerability indices are shown in Table 5.4.6. The details of vulnerability indices for “Population Density (VP1),” “Built-up Area (VP2),” and “Road/Rail in Steep Area (VP4)” are described in section of 1.6.4, CHAPTER 1, Vol.3: Supporting Report.
Table 5.4.6 Vulnerability Indices Used for Sediment Disasters
Vulnerability Indices
1) Population Density (VP1)
2) Built-up Area (VP2)
3) Road/Rail in Steep Area (VP4)
The formula used for assessment of sediment risk for Kota Pariaman is shown below.
Risk = Hazard x Vulnerability
Risk = (HP4 + HP5 + HP6) x (VP1 + VP2 + VP4) (Eq. 5.3)
where, HP4: Index value of slope; HP5: Index value of geology; HP6: Index value of annual rainfall;VP1: Index value of population density; VP2: Index value of built-up area; and VP4: Index value of road/rail in steep area.
2) Creation of Sediment Risk Map in Kota Pariaman
Refer to Figure 5.4.10 showing the sediment risk map for Kota Pariaman. Some 16% of Kota Pariaman are in the area of the highest risk. Overall trend covering Kota Pariaman shows that relatively higher scores were observed in the eastern part of Kota Pariaman. There are some river sections which have been apparently eroded by river flow with no revetment works along Mangau river. The potential risk is very high in such areas. However, there are hardly cliffs with steep slope except the highest risk areas, and the probability of sediment disaster is very low. However, it should be noted that public facilities in front of small sized cliffs shall be paid attention to in case of heavy rainfall.

The Study on Natural Disaster Management in Indonesia
5-68
Figure 5.4.10 Sediment Disaster Risk Map

Final Report
5-69
5.4.4 Possible Countermeasures against Sediment Disasters in Kota Pariaman Since the Kota Pariaman is located on comparatively flatland, large-scale countermeasures for sediment disasters are not necessary. There is, however, a place where housing has been built in contact with the slope, and a countermeasure is required. Moreover, in the downstream area of Mangau River has no shore protection, so a countermeasure will need to be constructed to counteract the scouring and erosion caused by water during flooding. In addition, an outline of countermeasures for sediment disasters is shown below.
Table 5.4.7 Possible Countermeasures against Sediment Disaster
5.4.5 Activities for Capacity Development Refer to the corresponding sub-section of Kabupaten Padang Pariaman, since all the workshops in relation to flood and sediment disasters for Kabupaten Padang Pariaman and Kota Pariaman had been held at the same time.
5.4.6 Future Suggestions Refer to the corresponding sub-section of Kabupaten Padang Pariaman.

Final Report
6-1
Year DisasterType SubType Location Number
of killedNumber
of injured
Numberof
affected1953 Flood Flood 114 0 01966 Flood Flood Central, East Java 176 100 524,0001967 Flood Flood East Java 0 0 55,0001967 Flood Flood Jakarta 0 0 102,0001967 Flood Flood Ambon 0 0 7,0001967 Flood Flood Central Java 160 0 01968 Flood Flood East Java 12 0 150,0001970 Flood Flood 82 0 01976 Flood Flood East Java, Lumajang 163 20 20,0001977 Flood Flood Jakarta, East Java 10 0 260,0001977 Flood Flood Central Java 0 0 25,0001977 Flood Flood Bandung district, Java 12 0 5,0001978 Flood Flood East Java 41 0 7,0001978 Flood Flood West Achem, North Sumatra 21 0 8,0001978 Flood Flood Sumatra 0 0 200,0001978 Flood Flood Aceh 8 0 51,6001979 Flood Flood Flores Island 128 350 20,0001979 Flood Flood West Java 23 0 4,5001979 Flood Flood Borneo 13 0 6,0001980 Flood Flood Central Java 153 0 2,9461981 Flood Flood Mont Semeru 500 0 01981 Flood Flood Jogjakarta 0 0 6,0001981 Flood Flood Jarkarta 9 0 206,0001981 Flood Flood Central Java 0 0 140,0001982 Flood Flood South Borneo 0 0 25,0001982 Flood Flood Irian Jaya 0 0 12,5001982 Flood Flood South Sumatra 225 0 3,0001982 Flood Flood Central Sumatra 3 0 1,5001983 Flood Flood Banggai 11 0 2,0001983 Flood Flood Aceh, Sumatra 2 0 5,0001983 Flood Flood Java, Yogyakarta 7 17 410,4801984 Flood Flood West Java 0 0 2,7001984 Flood Flood Bandung Region (West Java) 0 0 37,5001984 Flood Flood Central, East, West Java, Jogyakarta, North Sumatar 26 0 300,0001985 Flood Flood Northern Sulawesi 21 0 3001985 Flood Flood Central and East Java, Eastern Isl. 10 0 2,0001986 Flood Flood West Java 2 0 38,0001986 Flood Flood Bengkulu, Lampung provinces (South Sumatra) 96 0 20,0001986 Flood Flood Timor province (Java) 77 0 19,0001986 Flood Flood 0 0 01987 Flood Flood Esatern Java 3 0 26,0001987 Flood Flood Bengkulu (South Sumatra) 37 0 01987 Flood Flood West Sumatra 38 84 01987 Flood Flood Esp. Polmas, Pinrang (Sulawesi) 119 0 01987 Flood Flood Aceh province (North Sumatra) 4 0 2,0001988 Flood Flood Central & West Java, Sumatra, Kalimantan 158 0 100,0001988 Flood Flood Flores IsL. 21 0 0
CHAPTER 6 DISASTER CHARACTERISTICS OF FLOOD DISASTER AND COUNTERMEASURES IN PILOT REGIONS
6.1 Introduction This chapter (CHAPTER 6) describes the characteristics of flood disaster and countermeasures in the pilot regions (Kabupaten Jember, Kabupaten Padang Pariaman and Kota Pariaman).
1) Flood Disasters in Indonesia at National Level
Indonesia has been suffered from quite a number of flood disasters which can be understood from the recent flood disaster list on the basis of the data sourced from EM-DAT: The OFDA/CRED International Disaster Database.
Table 6.1.1 Recent History of Flood Disasters in Indonesia (1/2)
Source: EM-DAT: The OFDA/CRED International Disaster Database

The Study on Natural Disaster Management in Indonesia
6-2
Year DisasterType SubType Location Number
of killedNumber
of injured
Numberof
affected1989 Flood Flood Madiun Regency (East Java) 0 0 29,0001989 Flood Flood Ambon (Malucu Isl.) 18 0 32,500
1990 Flood -- Semarang, Temanggung, Batang, Kendal, Pati, Sragen, Grobongan,Cilacap, Demak, Rembang, Banyumas municipalities (Central Java) 169 0 21,000
1990 Flood -- Bogor (Jakarta) 22 0 01991 Flood -- Kalimatan province 97 0 01991 Flood Flood Riau, Jambi, Lampung provinces (Sumatra) 15 0 240,0001992 Flood Flood Trenggalek (East Java) 57 249,378 9,330
1993 Flood Flood Northern coast from Indramayu District in West Java to Gresik Districtin East Java 59 0 259,553
1993 Flood Flood Tanggerang, Serang and Lebak districts (West Java Province) 72 0 8,0001994 Flood -- City of Bandung (West Java) 4 0 30,0001994 Flood Flood Simalungun District 8 0 01994 Flood Flood Riau Province 3 0 60,0001994 Flood -- Ngawi, Tuban, Bojonegoro, Gresick, Lamongan (Java) 33 0 187,1311995 Flood Flood Riau 3 0 3,0001995 Flood -- Java, Sumatra 47 0 26,0001995 Flood Flood Tapanuli, Labuhan districts (Northern Sumatra Province) 45 0 17,5001995 Flood Flood Bengkulu (Northern Sumatra) 27 0 2,2001995 Flood -- North Aceh Provinces 18 472 201,0001996 Flood Flood Jakarta 20 0 556,0001996 Flood -- SUlu Musi district, Lahat Regency (South Sumatra) 34 21 01996 Flood Flash Flood Banyumas, Cilacap, Kebumen, Semarang (Central Java province) 13 7 01996 Flood Flood Piddie, Utara & Blora Districts 14 0 10,0001998 Flood Flood East Kalamatan = Kalimantan Timur 4 0 100,0001999 Flood Flood Sulawesi, Java 12 0 16,000
2000 Flood Flash Flood Malaka Tengah, Malaka Barat sub-districts (Belu District, West Timor),East Timor 126 0 50,000
2000 Flood -- Aceh, Riau, Jambi (Tanah Datar, Pesisir Selatan, Taratak Telengdistricts, Sumatra Isl.) 100 21 386,000
2000 Flood Flood Phetchabun 9 0 12,500
2000 Flood Flash Flood Bitung, Bolang Mongondow, Minahasa, Manado (North Sulawesi Isl.),Taliwan, Lunyuk districts (Sumbawa Isl.), Kulonprogo (Central Java) 38 0 39,852
2001 Flood Flood Jember (East Java province, North Sulawesi), West Java Province,Banten province 0 0 10,000
2001 Flood Flood Nias Isl. (North Sumatra province) 257 4 02001 Flood Flood Sentani (Papua province) 0 0 02001 Flood Flood Sumatra Isl., Sulawesi provinces 15 0 02002 Flood -- Dempo Utara (Southern Sumatra Isl.) 21 0 402002 Flood -- Medan city (Sumatra Isl.) 13 0 2,000
2002 Flood -- Bondowoso, Sampang, Surabaya, Majokerto, Lumajang, Sidoarjo (EastJava), South Sulawasi, East Nusa Tenggara, Greater Jakarta 150 750 0
2002 Flood Flood Gomo and Amandraya sub-districts (Nias Island) 14 0 7802002 Flood Flood Sumba Isl. (East Nusa Tenggara) 19 0 02002 Flood Flood Kolaka district (Sulawesi province) 0 0 1,000
2002 Flood Flood South Aceh, Southwest Aceh, Nagan Raya, Aceh Dingkil (NanggroeAceh Darussallam province), Central Tapanuli, Nias Isl. (North 13 0 87,000
2003 Flood Flood Java, Sulawesi islands 3 0 10,0002003 Flood -- Batulayrar village (West Lombok) 0 0 230
2003 Flood -- Solok, Kapai Tabu Karambia, Sinipa Piliang, Sembilan Korong, AroEmpat Korong, Pasar Pandan Air Mati, Kel Koto Panjang 10 0 3,700
2003 Flood Flash Flood Cilacap district (Central Java) 1 0 15,0002003 Flood -- Jakarta area 3 0 33,000
2003 Flood Flash Flood Hahorok sub-district (Langkat district , North Sumatra), Banyumas,Cilacap, Kebumen districts (Central Java) 241 30 1,468
2003 Flood -- Muraro, Jambi, Tanjab Timur, Batanghari (Jambi province), IndragiriHulu, Pelalawan districts (Riau province) - Sumatra 8 0 25,000
2004 Flood -- Jakarta area 5 0 13,000
2005 Flood Flash Flood Sumatra - Aceh Tenggara District, Badar Sub-District. Villages: Jongar,Lawe Mengkudu, Lawe Penanggalan and Jambur Lak Lak. 47 18 750
2005 Flood Flash Flood Seumadam/Semadam districts (Aceh province) 28 211 12,000
2005 Flood Flash Flood Panti, Tanggul, Arjasa, Rambipuji, Kaliwates, Wuluhan, Patrang,Balung, Puger sub-districts (Jember district, Java Isl.) 79 30 7,781
2006 Flood -- Bali, Lombok, Timor Islands 11 0 0
2006 Flood -- Rembang, Demak, Semarang, Lasem, Pamotan, Sedan (Central Java), Jakarta, Kampung Melayu, Indramayu district (West Java) 19 0 10,000
2006 Flood Flash Flood Manado city (North Sulawesi province) 39 39 17,500
2006 Flood -- Bendungan, Trenggalek, Ogalan, Karangan, Tugu, Durenan, Gandu Sari(Java Isl.) 22 2 400
2006 Flood Flash Flood Sinjai, Jeneponto, Bulukumba, Bantaeng, Luwu Utara, Bone, Gowa,Sidrap, Selayar, Wajo, Soppeng (Sulawesi province) 236 56 28,505
2006 Flood -- South Borneo Island 41 0 02006 Flood Flash Flood Tanh Laut, Tanah Bumbu, Kotaburu (South Kalimantan province) 52 0 18,2502006 Flood -- North Sulawesi province 0 0 5,000
Table 6.1.2 Recent History of Flood Disasters in Indonesia (2/2)
Source: EM-DAT: The OFDA/CRED International Disaster Database

Final Report
6-3
The location and number of affected persons during past 100 years based on the EM-DAT database for Indonesia at National Level is shown in Figure 6.1.1. Further, Figure 6.1.2 shows the flood hazard area, which was prepared by the JICA study team based on the various data sources. As shown in Figure 6.1.1 and 6.1.2, numbers of flood disasters were observed in Java Island, Sumatra Island, Kalimantan Island and Sulawesi Island.
Figure 6.1.1 Location and Number of Affected Persons by Flood
Figure 6.1.2 Flood Hazard Area
Source: EM-DAT: The OFDA/CRED International Disaster Database
Source: Departemen Pekerjaan Umum, Departemen Energi dan Sumberdaya Mineral, Badan Meteorologi dan Geofisika and Bakosurtanal
Affected Persons
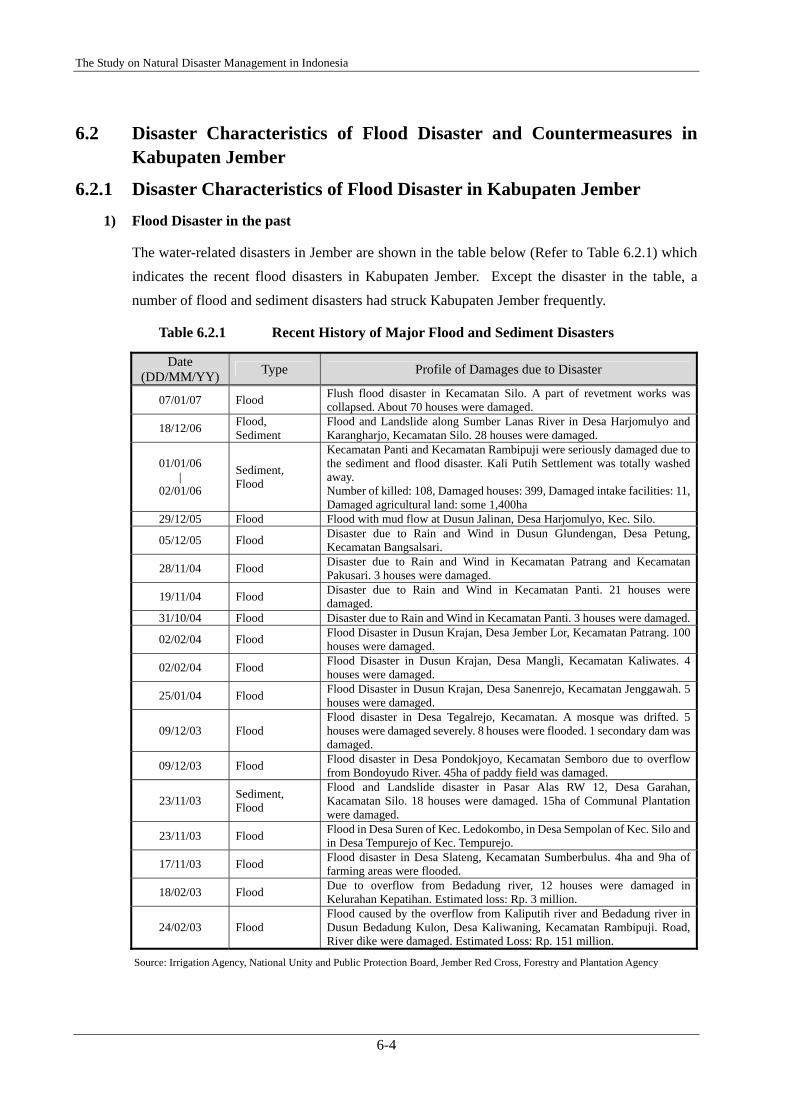
The Study on Natural Disaster Management in Indonesia
6-4
6.2 Disaster Characteristics of Flood Disaster and Countermeasures in Kabupaten Jember
6.2.1 Disaster Characteristics of Flood Disaster in Kabupaten Jember 1) Flood Disaster in the past
The water-related disasters in Jember are shown in the table below (Refer to Table 6.2.1) which indicates the recent flood disasters in Kabupaten Jember. Except the disaster in the table, a number of flood and sediment disasters had struck Kabupaten Jember frequently.
Table 6.2.1 Recent History of Major Flood and Sediment Disasters
Date (DD/MM/YY) Type Profile of Damages due to Disaster
07/01/07 Flood Flush flood disaster in Kecamatan Silo. A part of revetment works was collapsed. About 70 houses were damaged.
18/12/06 Flood, Sediment
Flood and Landslide along Sumber Lanas River in Desa Harjomulyo and Karangharjo, Kecamatan Silo. 28 houses were damaged.
01/01/06 |
02/01/06
Sediment, Flood
Kecamatan Panti and Kecamatan Rambipuji were seriously damaged due to the sediment and flood disaster. Kali Putih Settlement was totally washed away. Number of killed: 108, Damaged houses: 399, Damaged intake facilities: 11, Damaged agricultural land: some 1,400ha
29/12/05 Flood Flood with mud flow at Dusun Jalinan, Desa Harjomulyo, Kec. Silo.
05/12/05 Flood Disaster due to Rain and Wind in Dusun Glundengan, Desa Petung, Kecamatan Bangsalsari.
28/11/04 Flood Disaster due to Rain and Wind in Kecamatan Patrang and Kecamatan Pakusari. 3 houses were damaged.
19/11/04 Flood Disaster due to Rain and Wind in Kecamatan Panti. 21 houses were damaged.
31/10/04 Flood Disaster due to Rain and Wind in Kecamatan Panti. 3 houses were damaged.
02/02/04 Flood Flood Disaster in Dusun Krajan, Desa Jember Lor, Kecamatan Patrang. 100 houses were damaged.
02/02/04 Flood Flood Disaster in Dusun Krajan, Desa Mangli, Kecamatan Kaliwates. 4 houses were damaged.
25/01/04 Flood Flood Disaster in Dusun Krajan, Desa Sanenrejo, Kecamatan Jenggawah. 5 houses were damaged.
09/12/03 Flood Flood disaster in Desa Tegalrejo, Kecamatan. A mosque was drifted. 5 houses were damaged severely. 8 houses were flooded. 1 secondary dam was damaged.
09/12/03 Flood Flood disaster in Desa Pondokjoyo, Kecamatan Semboro due to overflow from Bondoyudo River. 45ha of paddy field was damaged.
23/11/03 Sediment, Flood
Flood and Landslide disaster in Pasar Alas RW 12, Desa Garahan, Kacamatan Silo. 18 houses were damaged. 15ha of Communal Plantation were damaged.
23/11/03 Flood Flood in Desa Suren of Kec. Ledokombo, in Desa Sempolan of Kec. Silo and in Desa Tempurejo of Kec. Tempurejo.
17/11/03 Flood Flood disaster in Desa Slateng, Kecamatan Sumberbulus. 4ha and 9ha of farming areas were flooded.
18/02/03 Flood Due to overflow from Bedadung river, 12 houses were damaged in Kelurahan Kepatihan. Estimated loss: Rp. 3 million.
24/02/03 Flood Flood caused by the overflow from Kaliputih river and Bedadung river in Dusun Bedadung Kulon, Desa Kaliwaning, Kecamatan Rambipuji. Road, River dike were damaged. Estimated Loss: Rp. 151 million.
Source: Irrigation Agency, National Unity and Public Protection Board, Jember Red Cross, Forestry and Plantation Agency

Final Report
6-5
National Unity and Public Protection Board (BAKESBANG), which is one of the key organizations of SATLAK, publishes the natural disaster map (Refer to Figure 6.2.1) every year. For the creation of the map, immediately after the disaster National Unity and Public Protection Board dispatches the investigation team including questionnaire survey to the residents. The natural disaster map (PETA DAERAH RAWAN BENCANA in Indonesia) consists of the past disaster areas and the potential disaster areas. However, there is no information indicated in the map to distinguish between the past disaster areas and the potential disaster areas. In the map, the past disasters which were recorded as remarkable disasters are also drawn down, however the detail records (e.g. occurrence year, death toll, flood depth, flood duration, damage amount, etc.) corresponding to each disaster area are unfortunately unknown.
Figure 6.2.1 Natural Disaster Map of Kabupaten Jember

The Study on Natural Disaster Management in Indonesia
6-6
2) Main rivers in Kabupaten Jember
There are three main rivers in Kabupaten Jember which are Tanggul river, Bedadung river and Mayang river. Along the border between Kabupaten Jember and Lumajang, there flows Bondoyudo river. The profiles of the rivers are shown in Table 6.2.2.
Table 6.2.2 Main rivers in Kabupaten Jember
Figure 6.2.2 shows the watershed areas of main rivers: Bedadung river, Mayang river and Tanggul river. Since there are numbers of irrigation channels connecting one another especially covering paddy field on low lying area in south-western area of Kabupaten Jember, the exact border line of the watersheds could not be produced. Thus, Figure 6.2.2 shows the approximate watershed areas.
Figure 6.2.2 Main rivers in Kabupaten Jember
River Catchments Area Length Tanggul River 212.77 Km2 45 KmBedadung River 149.22 Km2 88 KmMayang River 649 Km2 120 KmBondoyudo River (in Kabupaten Lumajang) 1,196 Km2 110 Km
Source: Irrigation Agency of Jawa Timur Province (DPU Pengairan Propinsi Jawa Timur) (2004)
Source: This figure was created by JICA Study Team based on the 1/25,000 scale maps by BAKOSURTANAL.

Final Report
6-7
3) Factors for damages due to flood
Flood disasters are regarded to be brought down due to the following factors; 1) Climatic factor, 2) Hydro-geographical factor, 3) Socio-economic factor and 4) Countermeasure factor. It is almost impossible to control rainfall amount, which is one of the climatic factor, but the potential flood damage can be reduced by strengthening the countermeasure factor (e.g. Construction of levee, Channel improvement, Early warning system, Land use limitation, etc.), which may give some beneficially effects to the Hydro-geographical factor and the Socio-economic factor to some extent so that resilient community to flood disaster will be attained.
As for Kabupaten Jember, a number of flood events had been observed in the alluvial low-lying area which covers the central urbanized area to south-western area based on the data and information obtained from the relevant counterpart organizations. The most of the alluvial low-lying area belongs to very flat land with less than 2 degree in slope, which is used mainly for paddy rice field and built-up area, and is regarded as potential inundation area. In other words, the area can be defined as “flood plain/flood prone area”, where large amount of discharge is washed out in short time from “run-off source area” in steep sided mountains. Once the flood plain area is flooded, it may take longer time until flooded water subsided if there is no reliable drainage system.
In mountainous area in Kec. Silo, the hazard areas are shown as the recent banjir-bandang (flush flood with mud and debris) disaster on Jan. 7th, ’07. There was continuous rainfall observed at Dam Klatakan rainfall station, which is the one of the nearest rainfall stations to the disaster area, for 20 days from 14th of Dec., ’05 to 2nd of Jan., ’06 with the maximum daily rainfall of 178mm on 1st of Jan., ’06. Some 70 houses were damaged due to the disaster. Further, Kec. Panti and Kec. Rambipuji were also seriously suffered from banjir-bandang disaster from Dec. 31st, ’05 to Jan. 2nd, ’06. There was also continuous rainfall observed at Slio rainfall station for 11 days from 21st to 31st of Dec. ’05. The number of killed was 108 people and the number of damaged agricultural intake facilities was 11 due to the disaster. The one of the main causes of the disaster was excessive rainfall amount. It should be noted that the area is in steep sided mountains, thus flooded water is washed out in very short time. It was pointed out that illegal logging in upstream area was one of main causes of the banjir-bandang disasters, and it is necessary to make more detailed investigation to clarify the mechanism.
In consideration of the above, the hazard map and risk map for flood disaster in Kabupaten Jember were made based on the data or information derived or provided from the relevant organizations.

The Study on Natural Disaster Management in Indonesia
6-8
6.2.2 Flood Hazard Map for Kabupaten Jember 1) Indices of Hazard Map for Flood Disaster
In this study, simplified methodologies for the creations of hazard maps and risk maps are applied for facilitating the technology transfer to the counterpart members of Kabupaten Jember smoothly, since it is aimed at the counterpart members who are to understand the methodologies and to produce the maps based on the methods in the future. The flood hazard map for Kabupaten Jember was created based on the flood maps provided from the relevant organizations of Kabupaten Jember through the close discussions between the experts of the JICA study team and the counterpart members of Kabupaten Jember during the several workshops or meetings. In other words, the flood hazard map was derived based on the combined result of the flood maps produced by National Unity and Public Protection Board, Irrigation Agency and Irrigation Board of Lumajang. Not only the flood area maps but also the data (e.g. flood depth, flood duration time, etc.) were desired to be obtained in order to estimate more precise indication of flood hazard in Kabupaten Jember. Such information could not be reflected for the creation of the flood hazard map, since they would not be obtained unfortunately during the study team activity in Jember. Then, flood hazard map for Kabupaten Jember was tried to be derived based on the combined result of the flood maps produced by National Unity and Public Protection Board, Irrigation Agency and Irrigation Board of Lumajang. In the sections below, the flood maps drawn by National Unity and Public Protection Board, Irrigation Agency and Irrigation Board of Lumajang are shown and the method for the creation of the flood hazard map for Kabupaten Jember is explained based on the flood maps from the relevant organizations. The basics of creation of flood hazard map are described in the sections of 1.6.1 to 1.6.3, CHAPTER 1.
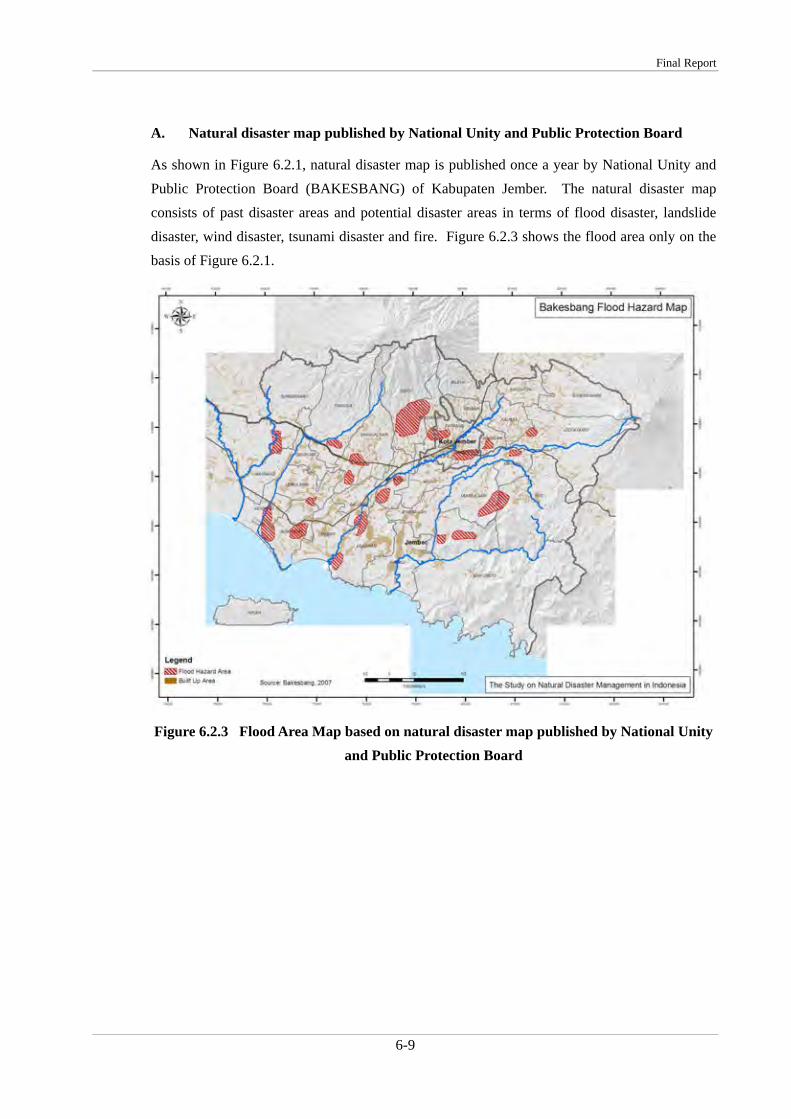
Final Report
6-9
A. Natural disaster map published by National Unity and Public Protection Board
As shown in Figure 6.2.1, natural disaster map is published once a year by National Unity and Public Protection Board (BAKESBANG) of Kabupaten Jember. The natural disaster map consists of past disaster areas and potential disaster areas in terms of flood disaster, landslide disaster, wind disaster, tsunami disaster and fire. Figure 6.2.3 shows the flood area only on the basis of Figure 6.2.1.
Figure 6.2.3 Flood Area Map based on natural disaster map published by National Unity and Public Protection Board

The Study on Natural Disaster Management in Indonesia
6-10
B. Flood Area provided by National Unity and Public Protection Board from Jan. ’07 to Jan. ’08.
In addition to the map (Figure 6.2.3) and the disaster list (Table 6.2.1), flood disaster list of Kecamatans for the period from Jan. ’07 to Jan. ’08 was provided by National Unity and Public Protection Board (BAKESBANG). Figure 6.2.4 shows the villages (“Desa” in Indonesian) which were suffered from the flood disasters from Jan. ’07 to Jan. ’08 based on the list.
Figure 6.2.4 Kecamatans which were suffered from the flood disasters from Jan. ’07 to Jan. ’08 provided by National Unity and Public Protection Board

Final Report
6-11
C. Flood area investigated by Irrigation Agency
From Irrigation Agency of Kabupaten Jember, the flood area map (Auto CAD format) was obtained which indicates the flood and sediment disaster areas for the year of 2006 in the figure below (Figure 6.2.5). In the figure, the disaster areas due to the banjir-bandang disaster in Kecamatan Panti and Kacamatan Rambipuji from the end of Dec. ’05 to the beginning of Jan. ’06 are also indicated.
Figure 6.2.5 Flood area investigated by Irrigation Agency for the year of 2006

The Study on Natural Disaster Management in Indonesia
6-12
D. Flood area map provided from Irrigation Board of Lumajang
Irrigation Board of Lumajang belongs to East Java Province and is a representative organization which supervises the Irrigation Agencies of Kabupaten Jember and Kabupaten Lumajang. A GIS formatted disaster area map was provided by Irrigation Board of Lumajang which indicates the flood potential areas and the disaster areas due to banjir-bandang disaster in Kecamatan Panti and Kacamatan Rambipuji from the end of Dec. ’05 to the beginning of Jan. ’06.
Figure 6.2.6 Flood area map provided by Irrigation Board of Lumajang

Final Report
6-13
2) Flood Hazard Map for Kabupaten Jember
The flood hazard map for Kabupaten Jember was created based on flood maps or information provided from the relevant organizations of Kabupaten Jember through the close discussions between the experts of the JICA study team and the counterpart members of Kabupaten Jember during the several workshops or meetings. In other words, the flood hazard map was derived based on the combined result of the flood maps produced by National Unity and Public Protection Board, Irrigation Agency and Irrigation Board of Lumajang. Not only the flood area maps but also the data (e.g. flood depth, flood duration time, etc.) were desired to be obtained in order to estimate more precise indication of flood hazard in Kabupaten Jember. Such information could not be reflected for the creation of the flood hazard map, since they would not be obtained unfortunately during the study team activity in Jember. Then, flood hazard map for Kabupaten Jember was tried to be derived based on the combined result of the flood maps produced by National Unity and Public Protection Board, Irrigation Agency and Irrigation Board of Lumajang.
Refer to Figure 6.2.7 showing the flood hazard map for Kabupaten Jember. In the map, “Score 3 (Moderate Hazard)” was assigned to each of the flood hazard grids not differentiating the scores of flood hazard grids from Score 1 to Score 5 just like sediment disaster or tsunami disaster.
As shown in the figure, flood hazard areas are shown along Tanggul river, Bedadung river, Mayang river and Bondoyudo river especially in the alluvial low-lying area covering the central urbanized area to south-western area of Kabupaten Jember where the main land use is for paddy field. The most of the flood hazard areas in the alluvial low-lying area had been less than 2.0 degree in slope covering the central urbanized area to south-west area of Kabupaten Jember. In other words, the area can be defined as “flood plain/flood prone area” from a technical viewpoint, where large amount of discharge is washed out in short time from “run-off source area” in steep sided mountains. Once the flood plain area is flooded, it may take longer time until flooded water subsided if there is no reliable drainage system.
In mountainous area in Kec. Silo, the hazard areas are shown as the recent banjir-bandan (flush flood with mud and debris) disaster on Jan. 7th, ’07. Some 70 houses were damaged due to the disaster. Further, Kec. Panti and Kec. Rambipuji were also seriously suffered from banjir-bandang disaster from Dec. 31st, ’05 to Jan. 2nd, ’06. The number of killed was 108 people and the number of damaged agricultural intake facilities was 11 due to the disaster. The one of the main causes of the disaster was excessive rainfall amount. It should be noted that the area is in steep sided mountains, thus flooded water is washed out in very short time.

The Study on Natural Disaster Management in Indonesia
6-14
LegendFlood Hazard (score)
Highest Hazard: N/A
Higher Hazard: N/A
Moderate Hazard: 3 (25.0%)
Lower Hazard: N/A
Lowest Hazard: N/A
No Hazard: 0 (75.0%)Note: Each percentage value in parentheses above indicates the area ratio compared to Kab. Jember.
LegendFlood Hazard (score)
Highest Hazard: N/A
Higher Hazard: N/A
Moderate Hazard: 3 (25.0%)
Lower Hazard: N/A
Lowest Hazard: N/A
No Hazard: 0 (75.0%)Note: Each percentage value in parentheses above indicates the area ratio compared to Kab. Jember.
Figure 6.2.7 Flood hazard map for Kabupaten Jember

Final Report
6-15
6.2.3 Flood Risk Map in Kabupaten Jember 1) Basis of Risk Map Creation for Flood Disaster
The basics of creation of flood risk map are described in the sections from 1.6.1 to 1.6.3, CHAPTER 1 and the indices used for creations of the flood hazard map and risk map are shown in Table 6.2.3. The details of vulnerability indices for “Population Density (VJ1)”, “Built-up Area (VJ2)” and “Vegetation/Cultivated Area (VJ5)” are described in section of 1.6.4, CHAPTER 1.
The formula used for assessment of flood risk for Kabupaten Jember is shown below.
Risk = Hazard x Vulnerability
Risk = HJ7 x (VJ1 + VJ2 + VJ5) (Eq. 6.1)
where HJ7: Index value of flood hazard, VJ1: Index value of population density, VJ2: Index value of built-up area and VJ5: Index value of vegetation/cultivated area.
Table 6.2.3 Indices used for the creations of flood hazard map and flood risk map
Hazard Index
Combined flood area based on the data or information collected from National Unity and Public Protection Board, Irrigation Agency and Irrigation Board of Lumajang (HJ7)
Vulnerability Indices 1) Population Density (VJ1) 2) Built-up Area (VJ2) 3) Vegetation/Cultivated Area (VJ5)
2) Flood Risk Map in Kabupaten Jember
Refer to Figure 6.2.8 showing the flood risk map for Kabupaten Jember. Basically, higher risk area may be regarded as the area where population and property are concentrated, being exposed to flood hazard. As shown in the figure, the values of flood risk were divided into five (5) classes indicating relative risk classification. “Red” means the highest risk and “Orange” indicates higher risk. Moderate risk is shown in “Yellow” while “Green” means lower risk. Further, “Blue” shows the lowest risk. Overall trend covering Kabupaten Jember shows that the area, where population and property are concentrated along Tanggul river, Bedadung river, Mayang river and Bondoyudo river, are indicated as the higher risk of flood disaster. Highest risk indications can be seen in Kec. Kaliwates, Kec. Sumbersari and Kec. Patrang since the Kecamatans are located in urbanized and densely populated area in flood hazard. There are also the highest risk indications in Kec. Silo and some riverine areas along Tanggul river, Bedadung river, Mayang river and

The Study on Natural Disaster Management in Indonesia
6-16
LegendFlood Risk (score)
Highest Risk: 31 – 39 (3.1%)
Higher Risk: 28 – 30 (5.3%)
Moderate Risk: 22 – 27 (7.2%)
Lower Risk: 16 – 21 (5.8%)
Lowest Risk: 1 -15 (3.4%)
No Risk: 0 (75.1%)Note: Each percentage value in parentheses above indicates the area ratio compared to Kab. Jember.
Bondoyudo river especially in the alluvial low-lying region covering the central urbanized area to south-western area of Kabupaten Jember.
Figure 6.2.8 Flood risk map for Kabupaten Jember

Final Report
6-17
6.2.4 Possible Countermeasures against Flood Disaster in Kabupaten Jember 1) Characteristics of sediment and flood disasters
There are eight (8) areas divided in order to clarify regional tendencies of disaster characteristics for sediment disaster and flood disaster. The eight area classification, which is indicated in Table 6.2.4, was based on geology, river network and land use. Figure 6.2.9 shows the boundaries of the eight areas. This table was created based on the discussions between the JICA team members and the members from relevant organizations of SATLAK during the workshop on Feb. 1st, '08.
Table 6.2.4 Characteristics of sediment and flood disasters
Area classification Tendency of flood and sediment disaster and region characteristics
1 North-West Mountain Area
Area where flood and sediment disasters frequently strike Main land use is for forestation area as well as plantation and rice field. In the area, which is especially close to "North-West Piedmont Area" and "North-Ease Piedmont Area", population density is relatively higher and economic activity is more active.
2 North-West Piedmont Area
Area where flood disaster frequently strikes and sediment disaster also occurs Main land use is for plantation and rice field. In the area, population density is relatively higher and economic activity is active.
3 North-East Piedmont Area
Area where flood or sediment disaster seldom happens Main land use is for rice field. In the area, population density is relatively higher and economic activity is active.
4 North-East Mountain Area
Area where sediment disaster strikes Main land use is for forestation area as well as plantation and rice field. In the area, population density is relatively lower.
5 South-East Mountain Area
Area where flood and sediment disasters frequently strike Main land use is for forestation area as well as plantation and rice field. In the area, population density is relatively lower.
6 Central Urbanized AreaArea where flood disaster occurs This area is the center of Kabupaten Jember, the most urbanized area with the highest population density.
7 Plain Field in South-West Area
Area where flood disaster occurs Main land use is for rice field. In the area, population density is relatively higher and economic activity is active.
8 Estruary and Coastal Area in South-Wast
Area where flood disaster occurs as well as tsunami disaster Main land use is for rice field. In the area, population density is relatively higher and economic activity is active.
Source: This table was created based on the discussions between the JICA team members and the members from relevant organizations of SATLAK during the workshop on Feb. 1st, '08.
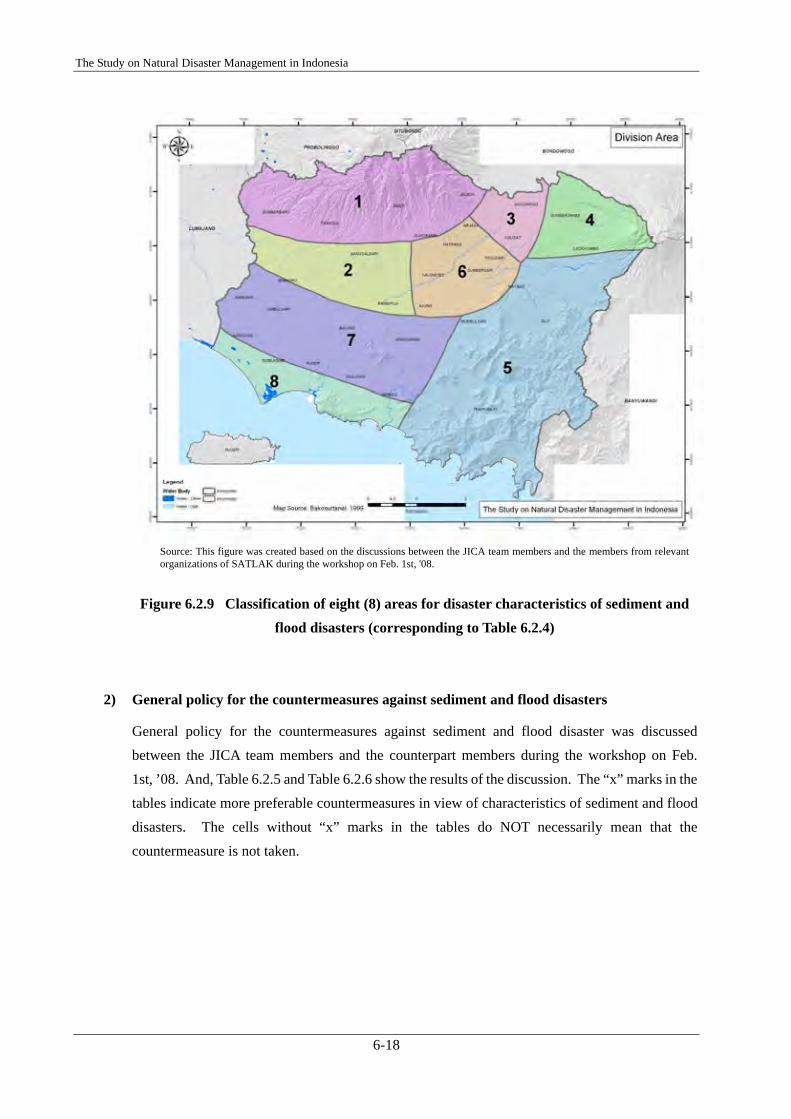
The Study on Natural Disaster Management in Indonesia
6-18
Figure 6.2.9 Classification of eight (8) areas for disaster characteristics of sediment and flood disasters (corresponding to Table 6.2.4)
2) General policy for the countermeasures against sediment and flood disasters
General policy for the countermeasures against sediment and flood disaster was discussed between the JICA team members and the counterpart members during the workshop on Feb. 1st, ’08. And, Table 6.2.5 and Table 6.2.6 show the results of the discussion. The “x” marks in the tables indicate more preferable countermeasures in view of characteristics of sediment and flood disasters. The cells without “x” marks in the tables do NOT necessarily mean that the countermeasure is not taken.
Source: This figure was created based on the discussions between the JICA team members and the members from relevant organizations of SATLAK during the workshop on Feb. 1st, '08.

Final Report
6-19
Table 6.2.5 Expected non-structural countermeasures against sediment and flood disasters
Te
nden
cy o
f Flo
od a
nd S
edim
ent D
isas
ter a
ndR
egio
n C
hara
cter
istic
sEa
rlyW
arni
ngSy
stem
Land
Use
Lim
itatio
n
Rai
nfal
lO
bser
va-
tion
Dis
char
geob
serv
a-tio
n
Haz
ard
Map
, Ris
kM
ap
Evac
uatio
n Sh
elte
r&
Rou
te
Trai
ning
& D
rill
Rad
iosy
stem
Inte
grat
edin
form
a-tio
nsy
stem
War
ning
boar
d
Wat
ersh
edM
anag
e-m
ent
Ref
ores
ta-
tion
1N
orth
-Wes
t Mou
ntai
n A
rea
Are
a w
here
floo
d an
d se
dim
ent d
isas
ters
freq
uent
ly st
rike
Mai
n la
nd u
se is
for f
ores
tatio
n ar
ea a
s wel
l as p
lant
atio
n an
d ric
efie
ld. I
n th
e ar
ea, w
hich
is e
spec
ially
clo
se to
"N
orth
-Wes
tPi
edm
ont A
rea"
and
"N
orth
-Eas
e Pi
edm
ont A
rea"
, pop
ulat
ion
dens
it y is
rela
tivel
y hi
gher
and
eco
nom
ic a
ctiv
ity is
mor
e ac
tive.
xx
xx
xx
xx
x
2N
orth
-Wes
t Pie
dmon
t Are
a
Are
a w
here
floo
d di
sast
er fr
eque
ntly
strik
es a
nd se
dim
ent d
isas
ter
also
occ
urs
Mai
n la
nd u
se is
for p
lant
atio
n an
d ric
e fie
ld. I
n th
e ar
ea, p
opul
atio
nde
nsit y
is re
lativ
ely
high
er a
nd e
cono
mic
act
ivity
is a
ctiv
e.
xx
xx
x
3N
orth
-Eas
t Pie
dmon
t Are
aA
rea
whe
re fl
ood
or se
dim
ent d
isas
ter s
eldo
m h
appe
nsM
ain
land
use
is fo
r ric
e fie
ld. I
n th
e ar
ea, p
opul
atio
n de
nsity
isre
lativ
ely
high
er a
nd e
cono
mic
act
ivity
is a
ctiv
e.x
xx
4N
orth
-Eas
t Mou
ntai
n A
rea
Are
a w
here
sedi
men
t dis
aste
r stri
kes
Mai
n la
nd u
se is
for f
ores
tatio
n ar
ea a
s wel
l as p
lant
atio
n an
d ric
efie
ld. I
n th
e ar
ea, p
opul
atio
n de
nsity
is re
lativ
ely
low
er.
xx
xx
x
5So
uth-
East
Mou
ntai
n A
rea
Are
a w
here
floo
d an
d se
dim
ent d
isas
ters
freq
uent
ly st
rike
Mai
n la
nd u
se is
for f
ores
tatio
n ar
ea a
s wel
l as p
lant
atio
n an
d ric
efie
ld. I
n th
e ar
ea, p
opul
atio
n de
nsity
is re
lativ
ely
low
er.
xx
xx
xx
xx
6C
entra
l Urb
aniz
ed A
rea
Are
a w
here
floo
d di
sast
er o
ccur
sTh
is a
rea
is th
e ce
nter
of K
abup
aten
Jem
ber,
the
mos
t urb
aniz
edar
ea w
ith th
e hi
ghes
t pop
ulat
ion
dens
ity.
xx
xx
x
7Pl
ain
Fiel
d in
Sou
th-W
est A
rea
Are
a w
here
floo
d di
sast
er o
ccur
sM
ain
land
use
is fo
r ric
e fie
ld. I
n th
e ar
ea, p
opul
atio
n de
nsity
isre
lativ
ely
high
er a
nd e
cono
mic
act
ivity
is a
ctiv
e.x
xx
xx
xx
x
8Es
truar
y an
d C
oast
al A
rea
inSo
uth-
Was
t
Are
a w
here
floo
d di
sast
er o
ccur
s as w
ell a
s tsu
nam
i dis
aste
rM
ain
land
use
is fo
r ric
e fie
ld. I
n th
e ar
ea, p
opul
atio
n de
nsity
isre
lativ
ely
high
er a
nd e
cono
mic
act
ivity
is a
ctiv
e.x
xx
xx
xx
xx
Are
a C
lass
ifica
tion

The Study on Natural Disaster Management in Indonesia
6-20
Table 6.2.6 Expected structural countermeasures against sediment and flood disasters
Te
nden
cy o
f Flo
od a
nd S
edim
ent D
isas
ter a
ndR
egio
n C
hara
cter
istic
sD
ike,
Emba
nkm
ent
Rev
etm
ent
Gat
eG
royn
e, S
pur
dyke
Inta
keD
rain
age
netw
ork
1N
orth
-Wes
t Mou
ntai
n A
rea
Are
a w
here
floo
d an
d se
dim
ent d
isas
ters
freq
uent
ly st
rike
Mai
n la
nd u
se is
for f
ores
tatio
n ar
ea a
s wel
l as p
lant
atio
n an
d ric
efie
ld. I
n th
e ar
ea, w
hich
is e
spec
ially
clo
se to
"N
orth
-Wes
tPi
edm
ont A
rea"
and
"N
orth
-Eas
e Pi
edm
ont A
rea"
, pop
ulat
ion
dens
it y is
rela
tivel
y hi
gher
and
eco
nom
ic a
ctiv
ity is
mor
e ac
tive.
x
2N
orth
-Wes
t Pie
dmon
t Are
a
Are
a w
here
floo
d di
sast
er fr
eque
ntly
strik
es a
nd se
dim
ent d
isas
ter
also
occ
urs
Mai
n la
nd u
se is
for p
lant
atio
n an
d ric
e fie
ld. I
n th
e ar
ea, p
opul
atio
nde
nsit y
is re
lativ
ely
high
er a
nd e
cono
mic
act
ivity
is a
ctiv
e.
x
3N
orth
-Eas
t Pie
dmon
t Are
aA
rea
whe
re fl
ood
or se
dim
ent d
isas
ter s
eldo
m h
appe
nsM
ain
land
use
is fo
r ric
e fie
ld. I
n th
e ar
ea, p
opul
atio
n de
nsity
isre
lativ
ely
high
er a
nd e
cono
mic
act
ivity
is a
ctiv
e.
4N
orth
-Eas
t Mou
ntai
n A
rea
Are
a w
here
sedi
men
t dis
aste
r stri
kes
Mai
n la
nd u
se is
for f
ores
tatio
n ar
ea a
s wel
l as p
lant
atio
n an
d ric
efie
ld. I
n th
e ar
ea, p
opul
atio
n de
nsity
is re
lativ
ely
low
er.
x
5So
uth-
East
Mou
ntai
n A
rea
Are
a w
here
floo
d an
d se
dim
ent d
isas
ters
freq
uent
ly st
rike
Mai
n la
nd u
se is
for f
ores
tatio
n ar
ea a
s wel
l as p
lant
atio
n an
d ric
efie
ld. I
n th
e ar
ea, p
opul
atio
n de
nsity
is re
lativ
ely
low
er.
x
6C
entra
l Urb
aniz
ed A
rea
Are
a w
here
floo
d di
sast
er o
ccur
sTh
is a
rea
is th
e ce
nter
of K
abup
aten
Jem
ber,
the
mos
t urb
aniz
edar
ea w
ith th
e hi
ghes
t pop
ulat
ion
dens
ity.
xx
7Pl
ain
Fiel
d in
Sou
th-W
est A
rea
Are
a w
here
floo
d di
sast
er o
ccur
sM
ain
land
use
is fo
r ric
e fie
ld. I
n th
e ar
ea, p
opul
atio
n de
nsity
isre
lativ
ely
high
er a
nd e
cono
mic
act
ivity
is a
ctiv
e.x
8Es
truar
y an
d C
oast
al A
rea
inSo
uth-
Was
t
Are
a w
here
floo
d di
sast
er o
ccur
s as w
ell a
s tsu
nam
i dis
aste
rM
ain
land
use
is fo
r ric
e fie
ld. I
n th
e ar
ea, p
opul
atio
n de
nsity
isre
lativ
ely
high
er a
nd e
cono
mic
act
ivity
is a
ctiv
e.x
xx
Are
a C
lass
ifica
tion

Final Report
6-21
3) Countermeasures for Prioritized Areas
(1) Areas which suffered seriously from flood and disasters
On the basis of the hazard map and risk map, two distinguished areas or prioritized areas were selected which suffered from flood disasters in the past. The one is located in the eastern mountainous region, covering Kec. Silo and Kec. Mayang. (to be referred as “F1 Area” hereinafter). The other is located in F2 Area in the map, covering Kec. Jenggawah, Kec. Ambulu, Kec. Wuluhan, Kec. Balung, Kec. Puger, Kec. Gumukmas and Kec. Kencong. “S1 Area” and “S2 Area” are selected for sediment disaster, which are explained in detail in CHAPTER 5.
The profiles of F1 Area and F2 Area are shown in Table 6.2.7 and 6.2.8, respectively. The data source for population and area is from the statistics of Kabupaten Jember in 2005.
Figure 6.2.10 Areas which suffered seriously from flood and sediment disasters

The Study on Natural Disaster Management in Indonesia
6-22
Table 6.2.7 Profile of F1 Area
Relevant Kecamatan & Desa
Kecamatan Silo
Harjomulyo, Karangharjo
Population 23,590 Area 53.46km2
Population Density 441.3 persons/km2
Land Use Main land use is for forestation area as well as plantation and paddy field.
Rivers flowing though the area
Upstream tributaries of Merawan river in Desa Harjomulyo and Desa Karangharjo
Characteristics of flood disaster
The location of F1 Area is in Desa Harjomulyo and Desa Karanharjo, Kecamatan Silo, which is located in the upstream areas of tributaries of Merawan river. It is pointed out that the illegal logging in the upper mountainous area was one of the causes of the flood disasters and the heavy rainfall triggered the flush flood with mud toward the downstream area. It is also said that the frequency of serious flood disaster with mud has been increasing since 1998, when the illegal logging and plantation development started. The insufficient discharge capacity of river such as abrupt contraction of river around a bridge structure, etc. was also the cause of flooding.
Desa Harjomulyo, which is located at upstream area of tributaries of Merawan river in the earstern part of Kabupaten Jember, suffered from the serious flood with mud in Jan. '07 and Jan. '08. A number of houses and river facilities such as dike, bridge and revetment works were seriously damaged. There have not been so serious flood disasters just like the flood disasters in Jan. ’07 and Jan. ’08.

Final Report
6-23
Table 6.2.8 Profile of F2 Area
Relevant Kecamatan & Desa
Kecamatan Jenggawah Jenggawah, Wonojati, Cangkring, Kemuningsari Kidul, Ketronegoro, Sruni and Jatisari
Kecamatan Ambulu Karanganyar, Ambulu, Pontang, Andongsari, Sumberejo and Sabrang
Kecamatan Wuluhan Glundengan, Kesilir, Tanjungrejo, Dukuhdempok Tamansari, Ampel and Lojejer
Kecamatan Balung Curahlele, Gumelar, Balung Lor, Balung Kidul, Balung Kulon, Tutul, Karangsemanging and Karangduren
Kecamatan Puger Wringingtelu, Bagon, Jambearum, Wonosari, Purwoharjo, Kasiyan, Mlokorejo, Grenden, Puger wetan, Puger Kulon, Mojosari and Mojomulyo
Kecamatan Gumukmas Tembokrejo, Purwoasri, Bagorejo, Gumukmas, Menampu, Mayangan and Kepanjen
Kecamatan Kencong Wonorejo, Kencong, Kraton, Cakru and Paseban
Population 588,788 Area 511.36km2
Population Density 1151.4 persons/km2
Land Use Main land use is for paddy field.
Rivers flowing though the area
Mayang river, Bedadung river, Tanggul river as well as irrigation channel network on the low lying fluvial plain area
Characteristics of flood disaster
F2 Area is located on the low lying fluvial plain area in the south-western of Kabupaten Jember. The main land use of the area is for paddy field. Some of the paddy field suffered from flood disasters mainly from Mayan river, Bedadung river, Tanggul river as well as flooding from irrigation channels. In the upstream areas of these rivers, the heavy rainfall triggered flooding in the downstream area. The river facility such as dike, revetment works, etc. was not enough to accommodate large amount of discharge, which resulted the flood disaster in the area.
Recently, some of the F2 Area suffered from the flood disaster in Dec. in ’07 in Kecamatan Puger (Desa Wringintelu and Desa Mlokorejo), Kecamatan Jenggawah (Desa Wonojati) and Kecamatan Ambulu (Desa Sumberejo and Desa Sabrang) due to the reasons above.

The Study on Natural Disaster Management in Indonesia
6-24
(2) Possible Countermeasures for Prioritized Areas
Based on the disaster characteristics and regional profiles indicated in the tables above, the possible countermeasures for F1 Area and F2 Area are indicated hereafter. It should be noted that the further analysis or investigation are necessary, since the following possible countermeasures are mainly based on the brief field reconnaissance in just couple of days and several discussions between the JICA study team members and the counterpart members (SATLAK) due to the limited time and resources allocated to this study. The possible countermeasures for F1 Area and F2 Area are shown in Table 6.2.9.
Table 6.2.9 Possible Countermeasures for F1 Area and F2 Area
Non-structural Countermeasure Structural Countermeasure
F1 Area
・ Reforestation ・ Land use limitation ・ Early warning system for fast and
appropriate evacuation ・ Community activities ・ Evacuation shelter and route
・ Dike ・ Revetment works ・ Reinforcement of dike and
revetment works ・ Channel excavation and
widening ・ Bridge improvement (Raising,
removal of bridge columns, etc.)
F2 Area
・ Land use limitation ・ Early warning system for fast and
appropriate evacuation ・ Community activities ・ Evacuation shelter and route
・ Normalization of river course ・ Dike ・ Revetment works ・ Reinforcement of dike and
revetment works ・ Excavation and widening of river
course ・ Flood Control Facilities
All of the countermeasures indicated in Table 6.2.9 are expected to be implemented in order to minimize flood damages. In general, it requires much more resources (e.g. budget, man-months, technology, etc.) for the implementation of structural countermeasure than that of non-structural countermeasure. Then, the implementation for the non-structural countermeasures with fewer budgets should be prioritized compared to the structural countermeasures, for the mean time. The above general policy should not impede the structural countermeasures with minimum budget which gives the significant beneficial effects from a viewpoint of disaster reduction. In the long run, the cost effective strategic planning is indispensable in view of the implementation period, construction schedule, budgeting, capacity development, project management related to structural countermeasures and non-structural countermeasures. Prior to appropriate implementation of the countermeasures including structural countermeasures and non-structural countermeasures, formulation of master plan (M/P) or feasibility study (F/S) for disaster

Final Report
6-25
reduction in terms of flood disaster as a part of Integrated River Basin Management (IRBM) are recommended to be carried out.
a) Countermeasure for F1 Area
Non-structural Countermeasure Reforestation
It is pointed out that the illegal logging in the upper mountainous area is one of the causes of the enormous amount of sediment discharge. Therefore, an emphasis on regulations concerning illegal logging is strongly needed. In addition, it is also important that reforestation activities should be intensified in areas that have already been logged. From a long-term point of view, it is desirable to implement appropriate forest management. Furthermore, it is important to investigate the mechanism of the cause and effect relation between the illegal loggings and the disasters from the viewpoint of effective disaster reduction.
Land use limitation It is necessary to enforce a policy on land use limitation to prevent residency in areas at very high risk to flood disaster. In order to do so, an accurate investigation of the sections at high risk to sediment disaster should be conducted and prohibit the construction of any houses in the sections with a prepared list of places unsuitable for inhabitancy by the investigation. Also, since a number of farming households have planted crops that cause the increase of sediment run-off in the upstream areas of tributaries of Merawan river in F1 Area, regulation is needed that will convert crops to those that will decrease flood run-off.
Early warning system for fast and appropriate evacuation In order to reduce human suffering due to flood disaster, preparations are needed for installation of warning systems that facilitate fast and appropriate evacuation. To do so, the strengthening of the existing early warning system (e.g. systematized mobile phone network, traditional warning notification by use of “kentongan (bamboo or wooden bell)”, radio system for disaster prevention, etc.) at community-level in “desa (village)” or “dusun (sub-village)” should be implemented first of all. In view of the matters above, reappraisal investigation on existing warning system will be required from the perspective of strengthening of the current system. For more accurate early warning, it is necessary to clarify the rainfall amount or intensity, which may trigger flood disaster. And, thus, it is exceedingly important to collect, to storage and to accumulate the rainfall data as well as disaster damage information. Further, the mechanical equipments such as telemeter rain gauge system is expected to be installed in the future, when there will be enough budgets to provide such machinery.
The Study on Natural Disaster Management in Indonesia
6-26
Community activities It is desirable to have prompt and accurate community level countermeasures in place prior to the occurrence of flood disasters. As mentioned in the previous paragraph, the strengthening of the existing early warning system (e.g. systematized mobile phone network, traditional warning notification by use of “kentongan (bamboo or wooden bell)”, radio system for disaster prevention, etc.) at community-level in “desa (village)” or “dusun (sub-village)” should be implemented first of all. It is also effective to carry out evacuation drills and to create a community disaster map in order to raise residents' awareness of disaster preparedness at community level. In addition, the community activities can be strengthened by the assistance from Jember Red Cross.
Evacuation shelter and route The public facilities (e.g. mosques, village (desa) office, sub-village (dusun) office, public school, etc.) should be used as evacuation shelter in case of emergency during disaster event. The locations of such public facilities should be out of high hazard area of flood disaster. Further, it is also important to improve the evacuation route so that prompt evacuation action may be possible. If public facilities (e.g. mosques, village (desa) office, sub-village (dusun) office, public school, etc.) are unable to accommodate desirable number of evacuees, the newly construction of evacuation facilities should be investigated.
Structural Countermeasure Bridge improvement
Bridge improvement (e.g. reconstruction, raising, removal of bridge columns, etc.) is required for increasing the discharge capacity around bridges, since the insufficient discharge capacity around a bridge structure, etc. was one of the causes of flooding. Based on the hand-writing rough calculations by using Manning’s formula during a field investigation, the conveyance around the bridge was estimated more or less 10m3/s to 50m3/s. The considerable flood discharge was also estimated roughly not less than 100m3/s and specific discharge of around 6m3/s by Manning’s formula and rational formula during a field investigation. The dimension of a typical bridge across a river could be 10m – 20m for length and several meters for the height depending on the site condition, river discharge, water level, etc. It is quite obvious that the detail investigation from hydraulic point of view (e.g. probable discharge, water level, etc.) is required.
Revetment works Improvement or Reinforcement of revetment works should be carried out for particularly adjacent to bridge structure in order increase the carrying capacity of the river channel in order

Final Report
6-27
to contain flood peak discharge without flooding to outside of the river channel. The particular care should be given to water collision sections in order to protect river bank not to be collapsed or eroded during flood event. The more detailed investigation from hydraulic point of view (e.g. probable flood discharge, water level, etc.) is required.
Channel excavation and widening Channel excavation and widening should be undertaken to increase the discharge capacity of the river channel in order to accommodate flood peak discharge. Especially for the sections, where river bed rising due to the flood with mud during recent flood events in Jan. ’07 and Jan. ’08, need to be excavated.
Reinforcement of revetment works Reinforcement of revetment works should be carried out not only for the section nearby bridges, but also for the sections which are judged as “insufficient strength” during flood event. The detailed investigation is necessary in order to list up sections with insufficient strength.
b) Countermeasure for F2 Area
Non-structural Countermeasure Land use limitation
The areas which have suffered from flood disaster frequently may be possibly protected by structural countermeasures such as dike, flood wall, etc. If the budget is not enough for the implementation of those countermeasures, it may be necessary to enforce a policy on land use limitation to prevent residency as well as irrigation field in the areas at very high risk to flood disaster.
Early warning system for fast and appropriate evacuation Fundamentally, countermeasures similar to F1 Area are necessary. In addition, water level observation facilities are necessary especially for Mayang river, Bedadung river, Tanggul river as well as irrigation channel networks for the purpose of flood early warning.
Community activities & Evacuation shelter and route Countermeasures similar to F1 Area are necessary.
Structural Countermeasure Normalization of river course
In general, normalization of river course has been widely undertaken to increase the flow

The Study on Natural Disaster Management in Indonesia
6-28
capacity of the natural in order to accommodate flood peak discharge and facilitate drainage functionality. River channel capacity and conveyance efficiency can be improved by several methods including increasing the river slope, or widening and deepening the channel to increase the cross-sectional area. Straightening or realigning the river channel by artificial cut-offs shortens and steepens the section, thereby increasing the flow velocity which, in turn, reduces the flood stage. Normalization of river course is one of the possible options as structural countermeasure for Mayang river, Bedadung river, Tanggul river as well as Bondoyudo river.
Dike In general, dikes are linear structures built parallel to the main river in order to prevent over bank flows. The dike construction may be necessary to protect the area which suffered from inundation frequently due to overflow from river bank of main river.
Revetment works Revetment works can be carried out for protecting the river banks, dikes from disruption. The particular care should be given to water collision sections in order to protect river bank not to be collapsed or eroded during flood event. The more detailed investigation from hydraulic point of view (e.g. probable flood discharge, water level, etc.) is required.
Reinforcement of dike and revetment works Reinforcement of revetment works should be carried out not only for the section nearby bridges, but also for the sections which are judged as “insufficient strength” during flood event. The detailed investigation is necessary in order to list up the insufficient strength sections.
Excavation and widening of river course Channel excavation and widening should be undertaken to increase the discharge capacity of the river channel in order to accommodate flood peak discharge.
Flood control facilities Flood control facilities such as pumping station, storm surge gate, flood control gate, flood control pond, etc. are necessary in cooperated with another structural countermeasures as well as non-structural countermeasures.

Final Report
6-29
4) Steps to be taken for disaster reduction in the future
There are three (3) conceptual steps for the desirable implementation of the countermeasures for not only the areas of F1 & F2 including S1 Area & S2 Area for sediment disaster (Refer to CHAPTER 5), but also the other areas in Kabupaten Jember. The final goal is realization of “Safe Kabupaten Jember against Water-Related Disasters”.
A. Step 1: Preparation for comprehensive planning
The step 1 is mainly aimed for the preparation activities for comprehensive planning including countermeasure and capacity building. The step 1 consists of the following sub-steps:
1. Establish and improvement of the system for disaster data collection and storage,
2. Analysis based on the storage data,
3. Revision and improvement of regional disaster management plan,
4. More appropriate and prompt emergency activity such as early warning, rescue, evacuation, etc.,
5. Comprehensive plan for non-structural countermeasures and improvement/strengthening of existing countermeasures, and
6. Plan for capacity building in terms of human resources, organization framework, institution, etc.
B. Step 2: Implementation especially for non-structural countermeasures
In the step 2, the non-structural countermeasures mainly are implemented as well as capacity building especially for flood control engineering and sabo engineering in cooperated with STC (Sabo Technical Center) in Jog Jakarta, academic institution and international cooperation organization. The step 2 is composed of the following sub-steps:
1. Implementation of non-structural countermeasure as well as the structural countermeasures with minimum budget,
2. Capacity building especially for flood control engineering and sabo engineering, and
3. Technical assistance from STC (Sabo Technical Center), academic institution and international cooperation organization.

The Study on Natural Disaster Management in Indonesia
6-30
Steps for Realization of“Safe Kabupaten Jember against Water-Related Disasters”
1. Establish and improvement of the system for disaster data collection and storage
2. Analysis based on the storage data
3. Revision and improvement of regional disaster management plan (Note: Revision and improvement in Steps 2 and 3, when necessary)
4. More appropriate and prompt emergency activity such as early warning, rescue, evacuation, etc.
5. Comprehensive plan for non-structural countermeasures and improvement/strengthening of existing countermeasures
6. Plan for capacity building in terms of human resources, organization framework, institution, etc.
7. Implementation of non-structural countermeasure as well as the structural countermeasures with minimum budget
8. Capacity building especially for flood control engineering and sabo engineering
12. Realization of “Safe Kabupaten Jemberagainst Water-Related Disasters”
12. Realization of “Safe Kabupaten Jemberagainst Water-Related Disasters”
Step 1 Step 2
Step 3
9. Technical assistance from STC (Sabo Technical Center), academic institution and international cooperation organization
10. Formulation of master plan (M/P) or feasibility study (F/S) for disaster reduction in terms of sediment disaster and flood disaster
11. Implementation of structural countermeasure in cooperated with non-structural countermeasure
C. Step 3: Formulation of master plan (M/P) and implementation of countermeasures with structural and non structural countermeasures
The final step 3 is for formulation of master plan (M/P) and implementation of countermeasures with structural and non structural countermeasures. The step 3 consists of the following sub-steps:
1. Formulation of master plan (M/P) or feasibility study (F/S) for disaster reduction in terms of sediment disaster and flood disaster, and
2. Implementation of structural countermeasure in cooperated with non-structural countermeasure.
Figure 6.2.11 shows the conceptual procedure for step 1, step 2 and step 3 for realization of “Safe Kabupaten Jember against Water-Related Disasters”.
Figure 6.2.11 Steps for realization of “Safe Kabupaten Jember against Water-Related Disasters”

Final Report
6-31
One of the very important procedures amongst the steps 1 to 3 is “1. Establish and improvement of the system for disaster data collection and storage”, which is the fundamental basis for regional disaster management plan. Hereinafter, the recommendatory notes on establishment and improvement of the system for disaster data collection and storage are explained.
a) Current situation in terms of disaster data management in relevant organizations
The current situation in terms of disaster data management in relevant organizations (counterpart) is summarized below.
1. There is no reliable disaster data storage system, even though there exists data collection protocol between the relevant organizations of SATLAK.
2. Thus, reliable disaster analysis is very difficult, since there is less disaster data accumulation.
3. The knowledge, which is supposed to be based on the analysis, can not be reflected into regional disaster management plan.
b) Establishment and improvement of the system for disaster data collection and storage
It is recommended that the system for disaster data collection and storage should be established and improved so that the reliable disaster data can be accumulated for the disaster analysis, which can be reflected into regional disaster management plan.
1. Establishment and improvement of the system for disaster data collection and storage
Figure 6.2.12 shows the concept scheme of the system for disaster data collection and storage. The relative organizations such as Irrigation agency, National unity agency, Red cross, Social agency and Kecamatan offices are supposed to submit the disaster data after the natural disaster event to the information and communication agency (INFOCOM) as well as the governor of Kabupaten Jember (Bupati). Irrigation agency is responsible for providing the rainfall data in case of water-related disaster for analysis purpose. For the time being, INFOCOM is responsible for disaster data collection from relevant organizations as well as storage of the data in appropriate manner instead of new agency for disaster reduction, which is expected to be established based on the Law No. 24, 2007 but has not been established yet. National Unity and Public Protection Board (BAKESBANG) may also be responsible for disaster data collection in cooperated with INFOCOM. INFOCOM should have a responsible section for disaster data management (e.g. collection, storage, accumulation, publish, etc.) with a function of “Disaster data library”. The format of the collected data may be paper-based document or electric data (e.g. document, spreadsheet, GIS, GPS, etc.) and should be standardized which may serve many utilization of the library. The function of the library should be duplicated and the other can be located at the head office of SATLAK (or BPBD). After the collection of disaster data from

The Study on Natural Disaster Management in Indonesia
6-32
relevant agencies, INFOCOM may be supposed to publish the summary report of disaster damage and report back to the relevant organizations for confirmation purpose and information sharing. INFOCOM also can inform the disaster damage to mass media such as TV, radio and newspaper. The statistics of natural disaster damages can be published annually based on the disaster data library in INFOCOM.
Figure 6.2.12 Establishment and improvement of the system for disaster data collection and storage
2. Analysis based on the storage data
Reliable analysis can be possible based on the abundant data accumulation of reliable data. Figure 6.2.13 shows a general idea regarding analysis based on the storage data in “Disaster data library”. For instance, the accumulation of disaster locations map for many years (e.g. 10 years, 20 years or more) helps the understanding of the tendency of natural disasters in a map. The combinational use of GIS (Geographical Information System) and GPS (Global Positioning System) may be useful for knowing the accurate locations of the disaster events. Another combination of GIS and application software enables the user to conduct simulation calculation for more reliable and appropriate analysis. For the use of the application software for hydrology and hydraulic analyses, the capacity development especially for flood control engineering and sabo engineering is quite
Establishment and improvement of the system for disaster data collection and storage
INFOCOM, BAKESBANG(until establishment of new agency for disaster reduction)
Kecamatan Irrigation Agency
National Unity Agency
Social Agency
Red Cross
Other related agencies
Desa Dusun
Reporting the disaster dataUnified format of disaster data (paper document, GIS or GPS data)
Database
Disaster data library
Publish the summary report of disaster damage and reporting
•Publish the summary report of disaster damage and reporting (TV, Radio, News)•Publish the annual statistics of natural disaster damages
linkage Data storage and accumulation
Paper based data
Rainfalldata
“Disaster data library” is expected to be established at “Information and Communication Agency (INFOCOM)”. The function of library should be duplicated and the other can be located at the head office of the new agency.
Governor of Kabupaten Jember

Final Report
6-33
necessary. Some of the application software can be downloaded for free of charge, but most of them without any support unfortunately. Some of the distinguished software for hydrology and hydraulic simulation analyses are disclosed by Hydrologic Engineering Center, US Army Corps of Engineers (URL: http://www.hec.usace.army.mil/). In addition, time series analysis on disaster events can also be possible based on the data derived from the database. Furthermore, with the use of rainfall data combined with the disaster damage data, an analysis on relation between rainfall and disaster event. Based on the analysis, it may be possible to obtain more appropriate threshold rainfall amount or intensity for more reliable early warning prior to water-related disasters. The knowledge described above can be reflected into revision and improvement of regional disaster management plan. Then, more appropriate and prompt emergency activity such as early warning, rescuing, evacuation, etc. can be realized.
Figure 6.2.13 Analysis based on the storage data
Analysis based on the storage data
Database
Disaster data library
linkage
Paper based data Analysis
based on the storage data
Reliable analysis is based on the abundant data accumulation of reliable data.
Spatial analysis on disaster events
Analysis on rainfall and disaster events
Based on the analysis, we may be able to obtain more reliable threshold rainfall amount for more reliable early warning.
Revision and improvement of regional disaster management plan
More appropriate and prompt emergency activity such as early warning, rescue, evacuation, etc.
Hazard Map
Risk Map
Time series analysis on disaster events D
amag
e
Year

The Study on Natural Disaster Management in Indonesia
6-34
3. Relation between rainfall and disaster event
The continuous rainfall observations have been carried out at 74 rainfall stations in Kabupaten Jember. However, the measurements are taken only for daily rainfall at all of the rainfall stations except the newly installed telemetry rainfall station in Kecamatan Mayang by BMG. Further, there are some doubts or missing data about a number of observation data, which were given to the JICA study team from the related organizations. Each observer may well be able to observe rainfall amount in accordance with the measurement guideline of rainfall measurement in proper way so that, for instance, one can be able to distinguish “missing observation” or “0mm of daily rainfall”. It is very important to measure/record reliable rainfall amount to perform reliable rainfall related analyses.
Furthermore, the condition of records on previous disasters is poor, which makes it difficult to estimate appropriately the standard rainfall amount for early warning and evacuation. However, the method for estimation of the standard rainfall amount by daily rainfall amount is described briefly hereafter. The data of “Dam Klatakan” station was taken as an example for sediment disaster event in Kecamatan Panti.
In principal, it is not possible to observe rainfall intensity exclusively from daily rainfall records, so standard rainfall will be set from only daily rainfall amount. Rainfall observation stations in the vicinity of danger zones susceptible to sediment disaster will be made representative observation stations (Note: In this case, Dam Klatakan station was taken as a representative observation station for daily rainfall). Daily rainfall and the amount over a course of two and three days would be recorded in a table when a sediment disaster occurs. Similarly, rainfall would be recorded when sediment disaster does not occur. And, compare the maximum rainfall value when there is no occurrence with the minimum value for rainfall when there is an occurrence, taking a case with a large discrepancy as the basis to set standard rainfall. The largest difference in the maximum rainfall at no occurrence and minimum rainfall upon occurrence of disaster is shown in Figure 6.2.14 and 1 day rainfall amount can be considered as the basis of the standard rainfall. Thus, generally 100mm/day prior to a disaster occurrence (occurrence probability is about two to ten years) is considered valid as a rough indicator for the standard rainfall for early warning and evacuation. In addition to the matters above, not only daily rainfall amount but also hourly rainfall amount is necessary for more reliable and prompt early warning prior to disaster occurrence. It is necessary to record the hourly rainfall and, using that data, decide upon the standard rainfall for warning and evacuation.
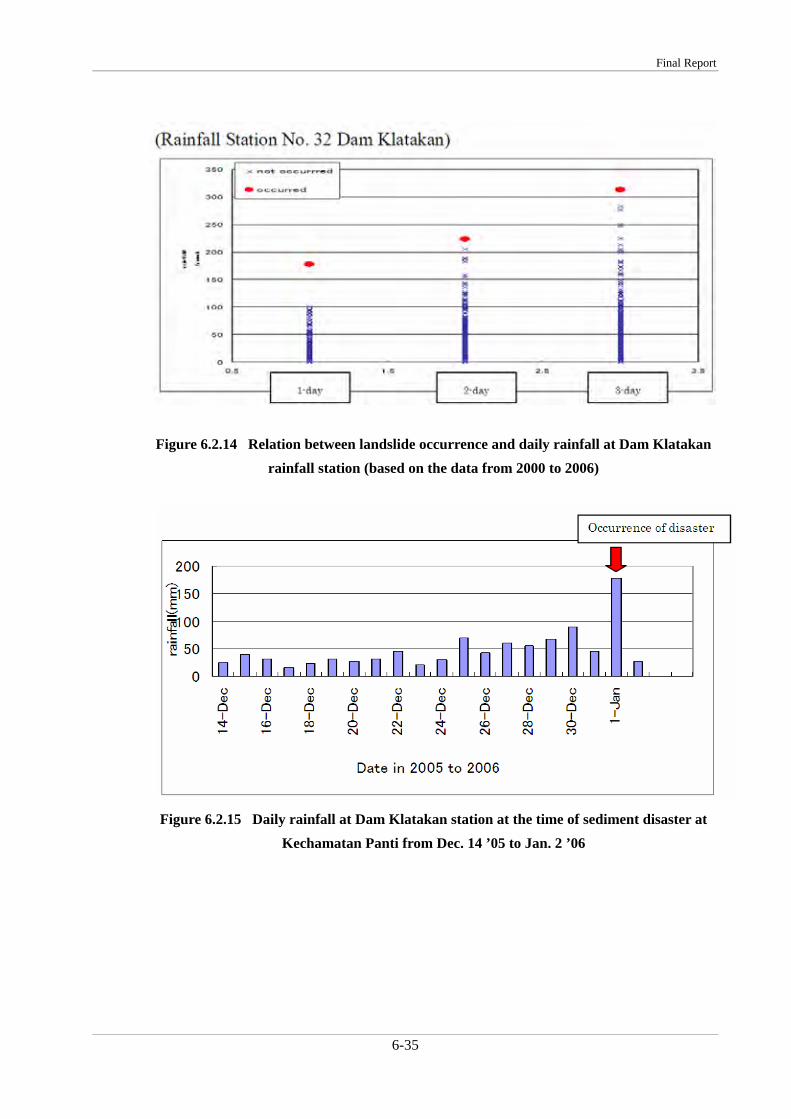
Final Report
6-35
Figure 6.2.14 Relation between landslide occurrence and daily rainfall at Dam Klatakan rainfall station (based on the data from 2000 to 2006)
Figure 6.2.15 Daily rainfall at Dam Klatakan station at the time of sediment disaster at Kechamatan Panti from Dec. 14 ’05 to Jan. 2 ’06

The Study on Natural Disaster Management in Indonesia
6-36
It is desirable to introduce hourly rainfall observation instruments at necessary locations with telemeter system. Also, for appropriate early warnings and evacuation at community level, it is necessary that each and every resident living in the at-risk zone react with sensitivity towards rainfall and the occurrence of disaster. The importance of rainfall gauges can be conveyed through community workshops. It is desirable for concerned person to make a simple handmade rainfall gauge. The picture below shows a prototype rain gauge with low cost. The item is made of bamboo and has a diameter of 10 cm and a height of 30 cm. Cut a slit in one section of the bamboo and then insert a plastic ruler, which should be readable by millimeter increments. Be sure that water will not leak through any gap between the bamboo and the ruler.
Figure 6.2.16 Handmade rainfall gauge made of bamboo

Final Report
6-37
6.2.5 Activities for Capacity Development The technical workshops for flood and sediment disasters as shown in the table below (Refer to Table 6.2.10) were held targeting at key persons from the related counterpart agencies of SATLAK, Kabupaten Jember, such as National Unity and Public Protection Board, Public Works Agency, Transportation Agency, Irrigation Agency, Agriculture Agency, Forestry and Plantation Agency as well as BMG Malang and, Irrigation Board of Lumajang.
Main objectives of the workshops are as follows: - Strengthening of capacity of formulation and update of plan, especially for hazard and
countermeasures - Strengthening of capacity of implementation of measures - Strengthening of capacity of coordination among organizations
In a series of workshops, many topics regarding prior disasters of flood and sediment disaster have been discussed with participants, for example, a basic concept of hazard, risk and countermeasures, importance of management for disaster data/information, characteristics of resent disasters, selection of prioritized disaster prone area, concrete countermeasures, etc.
Table 6.2.10 List of technical workshops for counterpart members of Kabupaten Jember
No. Date Place
No. of Participa
nts Contents
1 Sept. 7, ’07
Conference room, Study Team office, PEMKAB, Jember 26
Introduction of countermeasures in Japan The present conditions and countermeasures against flood disaster in Japan, etc.
2 Sept. 20, ’07
Conference room, Study Team office, PEMKAB, Jember 15
Briefing of creations of hazard map and risk map Outline of creating hazard map and risk map using GIS, rainfall measurement for warning and evacuation, etc.
3 Jan. 28, ’08
Conference room, Study Team office, PEMKAB, Jember 10
Discussion on hazard map and risk map Discussion on creation method and validity of hazard map and risk map, etc.
4 Feb. 1, ’08
Conference room, Study Team office, PEMKAB, Jember 9
Preparation of hazard map and risk map Understanding disaster characteristics in Kabupaten Jember and discussion of countermeasures
5 Feb. 5, ’08
Conference room, Study Team office, PEMKAB, Jember 11
Countermeasures in prioritized areas (1) Selection of the priority areas and discussion of possible countermeasures against flood disasters
6 Feb. 12, ’08
Conference room, Study Team office, PEMKAB, Jember (Field work)
10
Field Investigation Briefing of methodology to conduct field survey and implementation of sediment disaster field survey in Kecamatan Arjasa
7 Feb. 14, ’08
Conference room, Study Team office, PEMKAB, Jember 9
Countermeasures in prioritized areas (2) Discussion on flood countermeasures in prioritized areas, etc.
8 Feb. 20, ’08
Conference room, Study Team office, PEMKAB, Jember 8
Wrap Up Final discussion on flood disaster countermeasures and general overview of past workshops, etc.

The Study on Natural Disaster Management in Indonesia
6-38
Owing to these continuous workshops, the awareness of the key persons was considerably raised for reduction of prior disasters. It could be clearly confirmed from the result of questionnaire to the participants about the workshop. On the other hand, it was obvious through the discussion of the workshop that inter-organizational coordination is crucial for implementation of effective countermeasures or construction of infrastructure with the consideration of disasters. In order to plan and implement the effective countermeasures against disasters, it is necessary that more close coordination and cooperation among the organizations concerned will be enhanced through the further and positive discussion.
Figure 6.2.17 Workshop on Sep. 7th, ’07
The profile of each workshop is explained in the section 5.2.5, CHAPTER 5. A questionnaire survey was conducted for the assessment of the achievement in capacity development for the first workshop on Sept. 7, ’07. Hereinafter, the questionnaire results are explained. The questionnaire sheets were distributed asking levels of understanding and necessity of disaster reduction activity. The participants could also write down any comments on the questionnaire sheet. Sixteen (16) participants out of 23 responded the questionnaire.
The questionnaire consists of three questions as follows:
Q1: Did you understand the presentations by the lecturers?
Q2: After the lectures, what do you think about the activity for disaster reduction?
Q3: Please write down your opinion about the workshop and disaster reduction.
a) Answer results to Q1
As shown in Figure 6.2.18, most of the participants understood the presentations well.

Final Report
6-39
Figure 6.2.18 Answer results to Q1
b) Answer results to Q2
As shown in Figure 6.2.19, most of the participants thought that it was necessary to be more active for disaster reduction after this workshop.
Figure 6.2.19 Answer results to Q2
c) Comments from the participants (Answers to Q3)
As shown in Table 6.2.11, most of the participants regarded that the workshop is very good and important. The some of the valuable comments should be taken into account for the future actions. The intelligibility of the participants from the counterpart members got better each workshop and improved the level of understanding about technology transfer from JICA study team during the workshops held from Sept. 7, ’07 to Feb. 20, ’08. The series of workshops were regarded as significant, since the most of the responses from the counterpart members were positive for the disaster reduction activities after the last workshop on Feb. 20, ’08.

The Study on Natural Disaster Management in Indonesia
6-40
Table 6.2.11 Comments from the participants for Technical Workshop
Comments from the participants
1 This workshop is really important since Jember is a hazard area toward disaster; however, we still don’t have a fixed system as in Japan. From this workshop, it is expected that we will be more prepared in facing and handling disaster.
2
This workshop is very good. It is necessary to arrange the follow-up workshops amongst agencies related with disaster management in Jember routinely with fixed timetable. It also necessary to do socialization about hazard areas and evacuation towards victims. In addition, special budgets for disaster management is badly needed in Kabupaten Jember
3
This workshop is very good. However, the preparedness towards flood and landslide disaster in Japan was supposed to be explained and shown, for instance, the experience in evacuating the sick and wounded victims and also the medical treatment provided for the victims. In addition, you were supposed to explain about diseases caused by disaster so that it will be easier to mobilize the medical staffs who are needed.
4 Disaster must be handled cohesively by preventing and avoiding from the disaster itself. It can be done through counseling by applying traditional techniques and methods as well as modern way by considering the environment.
5 It would be better if we had had longer time in holding the workshop. It was necessary to arrange the seats facing to the projector.
6 Hopefully JICA Study Team can give positive and applicable contribution that is appropriate with the socio-culture condition of the society in Jember in particular and in Indonesia in general. The support of Early Warning System tools sufficiently, adjusted with the need of Kabupaten Jember is expected.
7 Disaster mitigation must be done cohesively among society, government, and professional institutions who know disaster management. Additionally, this kind of workshop needs to be improved by giving disaster management training in he near future.
8 This workshop is very good for socializing disaster management in order to minimize the victims.
9 It will be necessary to hold this kind of workshop more frequently. I agree with the disaster management and mitigation. However, is it possible to apply the disaster management because it will demand evacuation tools in doing evacuation process?
10 The workshop held by JICA is very useful since it gives contributions and ideas about disaster management, particularly in Kabupaten Jember.
11
This workshop is very good in assisting Indonesian in managing disaster. It is necessary to do socialization to community so that they can understand the importance of disaster preparedness and management and can give pro-active actions. The cooperation between JICA and SATLAK and also other relevant agencies needs to be improved.
12 Socialization about the danger of flood disaster and its prevention done by JICA Study Team is very positive; therefore, we need to develop and apply it since Jember is a hazard area.
13
I agree and support this workshop very much including the procedure in managing disaster since Jember is a potential area for disaster occurrences. Therefore, it is necessary to find the solution when disaster happens. Moreover, the most important is saving people’s lives. We hope that it can be implemented in the for of dam construction
14 This workshop should be understood by the society and government; therefore, it is necessary to conduct training involving community.
15 This workshop is very good in enhancing our knowledge, especially about the comparison of disaster management in Japan and in Indonesia. Moreover, the more important one is minimizing disaster and the loss of humans’ lives.
16 Very good