Integrated Survivability Assessment
64
Integrated Survivability Assessment by Gary L. Guzie ARL-TR-3186 April 2004 Approved for public release; distribution is unlimited.
Transcript of Integrated Survivability Assessment

Integrated Survivability Assessment
by Gary L. Guzie
ARL-TR-3186 April 2004 Approved for public release; distribution is unlimited.

NOTICES
Disclaimers
The findings in this report are not to be construed as an official Department of the Army position, unless so designated by other authorized documents. Citation of manufacturers’ or trade names does not constitute an official endorsement or approval of the use thereof. DESTRUCTION NOTICE—When this document is no longer needed, destroy it by any method that will prevent disclosure of its contents or reconstruction of the document.

Army Research Laboratory White Sands Missile Range, NM 88002-5513
ARL-TR-3186 April 2004
Integrated Survivability Assessment
Gary L. Guzie Survivability/Lethality Analysis Directorate, ARL
Approved for public release; distribution is unlimited.

REPORT DOCUMENTATION PAGE Form Approved OMB No. 0704-0188
Public reporting burden for this collection of information is estimated to average 1 hour per response, including the time for reviewing instructions, searching existing data sources, gathering and maintaining the data needed, and completing and reviewing the collection information. Send comments regarding this burden estimate or any other aspect of this collection of information, including suggestions for reducing the burden, to Department of Defense, Washington Headquarters Services, Directorate for Information Operations and Reports (0704-0188), 1215 Jefferson Davis Highway, Suite 1204, Arlington, VA 22202-4302. Respondents should be aware that notwithstanding any other provision of law, no person shall be subject to any penalty for failing to comply with a collection of information if it does not display a currently valid OMB control number. PLEASE DO NOT RETURN YOUR FORM TO THE ABOVE ADDRESS.
1. REPORT DATE (DD-MM-YYYY) April 2004
2. REPORT TYPE Final
3. DATES COVERED (From - To)
5a. CONTRACT NUMBER
5b. GRANT NUMBER
4. TITLE AND SUBTITLE Integrated Survivability Assessment
5c. PROGRAM ELEMENT NUMBER
5d. PROJECT NUMBER
5e. TASK NUMBER
6. AUTHOR(S)
Gary L. Guzie
5f. WORK UNIT NUMBER
7. PERFORMING ORGANIZATION NAME(S) AND ADDRESS(ES)
U.S. Army Research Laboratory Information & Electronic Protection Division Survivability/Lethality Analysis Directorate ATTN: AMSRL-SL-EA White Sands Missile Range, NM 88002-5513
8. PERFORMING ORGANIZATION REPORT NUMBER
ARL-TR-3186
10. SPONSOR/MONITOR'S ACRONYM(S)
9. SPONSORING/MONITORING AGENCY NAME(S) AND ADDRESS(ES)
U.S. Army Research Laboratory 2800 Powder Mill Road Adelphi, MD 20783-1145
11. SPONSOR/MONITOR'S REPORT NUMBER(S)
ARL-TR-3186 12. DISTRIBUTION/AVAILABILITY STATEMENT
Approved for public release; distribution is unlimited. 13. SUPPLEMENTARY NOTES
14. ABSTRACT
This report describes the Integrated Survivability Assessment (ISA) methodology, which provides a practical, simple process for assessing the survivability of integrated systems (systems of systems), systems, and/or subsystems with respect to the integrated threat spectrum and/or to individual threats. ISA methodology applies classical systems engineering analysis work breakdown structure processes to formulate an analysis matrix-of-matrices, which enables a roll-up aggregation of results to any analysis level desired. ISA addresses the analysis of both weapon and countermeasure effects, equivalently, as well as considers operational environment effects (natural and manmade), and for the first time, provides systems analysts with a common/unified survivability assessment integration methodology for these diverse areas. The primary enabling factor facilitating this integrated approach to survivability assessment is the employment of a common Vulnerability Risk Assessment methodology for all threat effect survivability analyses.
15. SUBJECT TERMS
survivability, vulnerability, assessment, risk analysis, effectiveness analysis
16. SECURITY CLASSIFICATION OF: 19a. NAME OF RESPONSIBLE PERSON
Gary L. Guzie a. REPORT
U b. ABSTRACT
U c. THIS PAGE
U
17. LIMITATION OF ABSTRACT
SAR
18. NUMBER OF PAGES
64 19b. TELEPHONE NUMBER (Include area code)
505-678-1820 Standard Form 298 (Rev. 8/98) Prescribed by ANSI Std. Z39.18
ii
Preface
The Integrated Survivability Assessment (ISA) methodology provides a practical, simple process for assessing the survivability of integrated systems (a.k.a., systems of systems (SoS)), systems, and/or subsystems with respect to the integrated threat spectrum and/or to individual threats. The ISA methodology applies classical systems engineering analysis work breakdown structure processes to formulate an analysis matrix-of-matrices, which enables a roll-up aggregation of results to any analysis level desired. ISA addresses the analysis of both weapon and countermeasure effects, equivalently, as well as operational environment effects (natural and manmade), and for the first time, provides systems analysts with a common/unified survivability assessment integration methodology for these diverse areas. The primary enabling factor facilitating this integrated approach to survivability assessment is the employment of a common Vulnerability Risk Assessment (VRA) methodology for all threat effect survivability analyses. This report presents a number of examples of how the ISA methodology can perform analyses based on the integrated threat spectrum and gives samples of various SoS analysis matrices. Also considered is how the general ISA process relates to lethality and traditional effectiveness analysis, as seen in analogous analysis matrices, and what the survivability characteristics are for a variety of SoS, some of whose component systems are configured in either series and parallel (offering either simultaneous and sequential redundancy).
iii
INTENTIONALLY LEFT BLANK.
Contents
Preface iii
List of Figures vii
Executive Summary 1
1. Introduction 3 1.1 Survivability Analysis Process........................................................................................6
1.2 Systems Engineering Analysis: Functional and Physical Decomposition ......................7
1.3 SoS Analysis via a Matrix-of-Matrices ...........................................................................8
1.4 MoS Metric: Vulnerability Risk......................................................................................9
1.5 Survivability Assessment Issues and Considerations....................................................16 1.5.1 Survivability at Multiple Levels........................................................................16 1.5.2 Survivability Optimization ................................................................................17 1.5.3 Survivability Robustness ...................................................................................17 1.5.4 Reliability ..........................................................................................................17 1.5.5 Spiral Development Applicability.....................................................................18
2. Integrated Threat Spectrum 18 2.1 Conventional Weapons..................................................................................................20
2.2 Nuclear Weapons ..........................................................................................................20
2.3 Chemical/Biological Weapons ......................................................................................20
2.5 Penetration Aid Countermeasures .................................................................................21
2.6 Electronic Warfare Countermeasures............................................................................21
2.7 Information Warfare Countermeasures .........................................................................21
2.8 Special Operations Forces .............................................................................................22
2.9 Operational Environments.............................................................................................22
2.10 Threat and Operational Environment Combinations.....................................................22
3. Integrated System Analysis Matrices 23 3.1 SoS: Critical Functions.................................................................................................23
v
3.2 SoS: Critical Components ............................................................................................23
3.3 System/Subsystem: Critical Functions.........................................................................24
3.4 System/Subsystem: Critical Components ....................................................................24
3.5 SoS Matrix-of-Matrices Analysis..................................................................................25
3.6 Survivability Equation...................................................................................................34
3.7 Survivability Sub-Metrics .............................................................................................39
4. Integrated Survivability Assessment Process 41
5. Lethality Analysis Matrices 46
6. Conclusions 49
7. References 50
Acronyms 51
Distribution List 53
vi
List of Figures
Figure 1. An Overview of the ISA Methodology. ..........................................................................4 Figure 2. Key Characteristics of the ISA Methodology. ................................................................5 Figure 3. Outline of the Survivability Analysis Process.................................................................6 Figure 4. Sample System Survivability Analysis Matrix................................................................8 Figure 5. Summary of the VRA Methodology. ............................................................................10 Figure 6. Explanation of the Integrated SoS Survivability Onion. ...............................................11 Figure 7. Summary of the Effectiveness and Survivability Onions..............................................12 Figure 8. Summary of the VRA Matrix. .......................................................................................13 Figure 9. The Integrated Threat Spectrum Analysis. ....................................................................14 Figure 10. Integrated Threat Spectrum VRA Matrix....................................................................16 Figure 11. A Sample of Threat Categories for Military Systems. ................................................19 Figure 12. A Generic Example of the Matrix-of-Matrices Structure of an SoS Survivability
Analysis....................................................................................................................................25 Figure 13. A Template for an Analysis Matrix Showing a Top-Level SoS versus Threat
Spectrum. .................................................................................................................................26 Figure 14. Sample Structure for a System X Matrix-of-Matrices Analysis. ................................28 Figure 15. A Template for an Analysis Matrix Using System X vs. Threat Spectrum. ...............29 Figure 16. A Template for an Analysis Matrix Showing System X vs. Conventional
Weapons...................................................................................................................................30 Figure 17. A Template for an Analysis Matrix Showing Sensor X vs. Conventional
Weapons...................................................................................................................................31 Figure 18. A Template for an Analysis Matrix Showing Weapon X vs. Conventional
Weapons...................................................................................................................................32 Figure 19. A Template for an Analysis Matrix Showing a BM/C3 X vs. Conventional
Weapons...................................................................................................................................33 Figure 20. Generic Survivability Equation. ..................................................................................35 Figure 21. Example of a Multiple System Configuration.............................................................36 Figure 22. Single System Survivability. .......................................................................................37 Figure 23. Multiple System Survivability Where Components are in Series. ..............................38 Figure 24. Multiple System Survivability Where the Components are in Parallel.......................39 Figure 25. ISA Survivability Metrics............................................................................................40 Figure 26. Outline of the Primary ISA Process. ...........................................................................41
vii
Figure 27. Example MoS Calculation...........................................................................................43 Figure 28. Example Survivability Dependence on Scenario and Timeframe...............................44 Figure 29. Example Analysis Matrix Showing Kill Chain Subsystem vs. Threat Spectrum. ......45 Figure 30. Example of an Analysis Matrix Showing Attack Weapon vs. EW CMs. ...................46 Figure 31. VRA Kill Effectiveness Assessment Matrix. ..............................................................47 Figure 32. ISA Kill Effectiveness Analysis Matrix ......................................................................48
viii

Executive Summary
The Integrated Survivability Assessment (ISA) methodology provides a straight-forward process and detailed analytical structure for assessing the integrated threat spectrum against subsystems, systems, and integrated systems (a.k.a., systems-of-systems (SoS)), taking into account any particular scenario and timeframe. ISA is a systems engineering analysis process that applies a matrix-of-matrices approach to formulate an analysis of work breakdown structure (WBS) that incorporates both physical and functional system decomposition, using a classical top-down, requirements-based approach. ISA focuses on the threat effects susceptibility of system critical functions and components (including hardware devices, software algorithms, and human operators), using various classical systems analysis techniques, such as theoretical, modeling and simulation (M&S), and test and evaluation (T&E). The flow-down analysis structure is complemented by a roll-up integration technique employed to aggregate the results of lower-level analyses into higher-level conclusions. Although this ISA methodology uses a static analysis approach, scenario and timeframe macro-dynamics are also important considerations.
The ISA methodology utilizes the Vulnerability Risk Assessment (VRA) methodology to address and analyze each threat in the integrated threat spectrum in a common and universal manner. In order to determine a common measure of survivability (MoS) metric for all threat effects, the VRA methodology considers both “hard kill” (permanent damage/destruction) weapons effects and functional “soft kill” (temporary degradation/disruption) countermeasure (CM) effects, as well as all operational environment effects, both natural and manmade,
The ISA deals with integrated analysis from both the threat and system points of view: (1) The integrated threat analysis addresses how to structure analysis for both individual and multiple (sequential and simultaneous) threat effects, covering all threats within the integrated threat spectrum; and (2) The integrated systems analysis explains how to perform analysis of individual systems (component subsystems) in order to determine SoS survivability.
Overview
This report describes the application of a matrix-of-matrices analysis WBS to the classical systems analysis process structure for SoS, as well as details how functional and physical decomposition is used to define system critical functions and components (hardware devices, software algorithms, and human operators). Furthermore, it explains the flow-down analysis approach and the complementary roll-up integration technique, addressing both scenario and timeframe macro-dynamics in a static analysis approach. Additionally, the report shows how the VRA methodology can be used to arrive at a common MoS metric (based on vulnerability risk) for all critical functions and components at all levels, using a generic multi-system, multi-threat survivability equation that combines individual survivability probabilities into a single value. It
1

also details the generic threat spectrum classes and categories needed for survivability analyses; provides generic samples of subsystem, system, and SoS matrices; and gives examples of how the ISA process applies to a generic SoS “kill chain.” Also considered is how the general ISA process relates to lethality and traditional effectiveness analysis, as seen in analogous analysis matrices. The report concludes by describing the survivability characteristics for a variety of SoS, some of whose component systems are configured in either series and parallel (offering simultaneous or sequential redundancy).
Conclusions and Recommendations
The ISA methodology provides a new and improved process to address the critical area of survivability analysis for military systems and networked SoS. It accomplishes this by employing the traditional systems analysis fields of WBS formulation, and functional and physical decomposition for survivability analysis purposes. ISA also provides a unique, user-friendly audit trail technique for tracking the status of top-level, intermediate, and lower-level survivability analysis results and their aggregated impact.
It is recommended that this new VRA-based ISA methodology be officially adopted and applied uniformly and universally to integrated survivability analysis/assessment programs that evaluate hostile threats and environmental hazards, which can affect military materiel and personnel survivability. The application of a common SoS analysis methodology, based on traditional systems engineering analysis techniques, would greatly simplify the decision-making process and enhance accuracy for both defense acquisition executives (SoS technical development) and field commanders (SoS tactical deployment).
2
1. Introduction
Increasingly, military systems are being designed as (or being transformed into) network-connected and controlled integrated systems (a.k.a., systems-of-systems (SoS)), whose critical functions are being performed by component systems and subsystems. An analysis methodology is needed that can address all system and subsystem levels and aggregate lower-level results to intermediate- and top-level conclusions for the entire SoS (1) while, if possible, providing a common/universal measure of survivability (MoS) at each and every level.
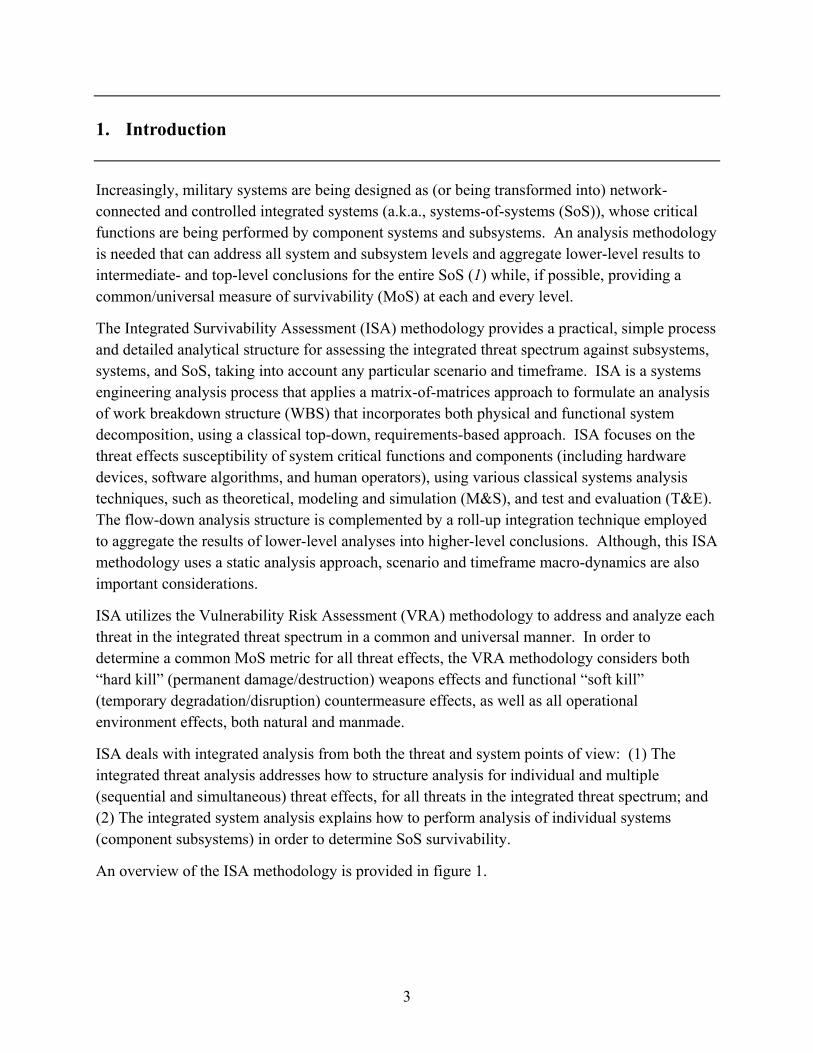
The Integrated Survivability Assessment (ISA) methodology provides a practical, simple process and detailed analytical structure for assessing the integrated threat spectrum against subsystems, systems, and SoS, taking into account any particular scenario and timeframe. ISA is a systems engineering analysis process that applies a matrix-of-matrices approach to formulate an analysis of work breakdown structure (WBS) that incorporates both physical and functional system decomposition, using a classical top-down, requirements-based approach. ISA focuses on the threat effects susceptibility of system critical functions and components (including hardware devices, software algorithms, and human operators), using various classical systems analysis techniques, such as theoretical, modeling and simulation (M&S), and test and evaluation (T&E). The flow-down analysis structure is complemented by a roll-up integration technique employed to aggregate the results of lower-level analyses into higher-level conclusions. Although, this ISA methodology uses a static analysis approach, scenario and timeframe macro-dynamics are also important considerations.
ISA utilizes the Vulnerability Risk Assessment (VRA) methodology to address and analyze each threat in the integrated threat spectrum in a common and universal manner. In order to determine a common MoS metric for all threat effects, the VRA methodology considers both “hard kill” (permanent damage/destruction) weapons effects and functional “soft kill” (temporary degradation/disruption) countermeasure effects, as well as all operational environment effects, both natural and manmade.
ISA deals with integrated analysis from both the threat and system points of view: (1) The integrated threat analysis addresses how to structure analysis for individual and multiple (sequential and simultaneous) threat effects, for all threats in the integrated threat spectrum; and (2) The integrated system analysis explains how to perform analysis of individual systems (component subsystems) in order to determine SoS survivability.
An overview of the ISA methodology is provided in figure 1.
3
System Analysis Matrix
Matrix-of-Matrices Analysis StructureSystems Engineering Analysis Process
Integrated System / Threat Analysis
Integrated SurvivabilityAssessment (ISA)
Threat Spectrum
Weapon 1
Weapon 2
Ctrmeasure 1
Ctrmeasure 2
ThreatMission Functions Components (HW/SW)Air & Missile
DefenseSensor:
Surv/AcqBtl Mgmt:
Fire ControlWeapon:Engage
Radar& GSE
BMC3& GSE
Launcher& GSE
Interceptor[ In Flight ]
X
X
X
X
X
X
X
X
X
X
---
---
---
X
X
Addresses "integrated" analysis from both the point of view and the system point of view:
(1) Integrated analysis:How to structure the analysis for- individual threat effects- multiple threat effects (sequential & simultaneous)
(2) Integrated system analysis:How to structure the analysis for - individual system [component] survivability analyses- integrated system [Sys-of-Sys] survivability analyses
ISA: systems engineering analysis methodology / processWBStructure: matrix-of-matrices principle of functional &
physical decomposition vs integrated threat spectrum => enabled by: methodology
Top-down approach: requirements-based analysisThreat effects analyses: critical functions & components
=> theoretical analysis / M&S analysis / T&E analysis=> roll-up aggregation / integration
Static analysis: scenario & timeframe dynamics consideredMeasure of Surv (MoS):
Survivability enhancement: facilitates optimization WRT avoidance P(Encounter) vs withstand P(Susceptible)
Integ Sysvs Threat Spectrum
Integ Sysvs Threat
CM 2
Integ Sysvs
Integ Sysvs OpnEvmt 3
Integ Sysvs ThreatSOFrc 4
Sys Snsrvs Threat Spectrum
Sys Snsrvs Threat
CM 2
Sys Snsrvs
Sys Snsrvs OpnEvmt 3
Sys Snsrvs ThreatSOFrc 4
Sys Wpnvs Threat Spectrum
Sys Wpnvs Threat
CM 2
Sys Wpnvs
Sys Wpnvs OpnEvmt 3
Sys Wpnvs ThreatSOFrc 4
threat
threat
Vuln Risk Asmt [VRA]
Survivability = 1 - Vuln Risk
Threat Wpn 1
Threat Wpn 1
Threat Wpn 1
Figure 1. An Overview of the ISA Methodology.
SoS analysis requires a matrix-of-matrices approach based on layered analysis, using the “effectiveness onion” approach for countermeasure (CM) functional survivability and the “survivability onion” approach for weapon physical survivability (see figs 6, 7). The Battle Management/Command and Control (BM/C2) system (a.k.a., the Battle Command (Btl Cmd) system) is the key SoS functional component, because, among other functions, it enables and provides the network-supported force multiplication. The BM/C2 plans and executes the data fusion and decision-making processes used to formulate the situational awareness/understanding (SA/SU) common operational picture; makes the engagement decisions and weapon assignments (EDWA); and integrates, coordinates, and controls the combat/engagement operations via a digitized communication network.
ISA uses a top-down, requirements-based approach that takes top-level SoS functional requirements and decomposes them (requirements flow-down) into successively lower-level requirements, allowing the process to meet the desired level of analysis detail, or resolution. The primary objective is to provide survivability and effectiveness answers to decisionmakers at all levels. This approach assures that analysis matrices cover all threat-target combinations and provide easy-to-understand, roll-up SoS results for decisionmakers. This is in contrast to the
4
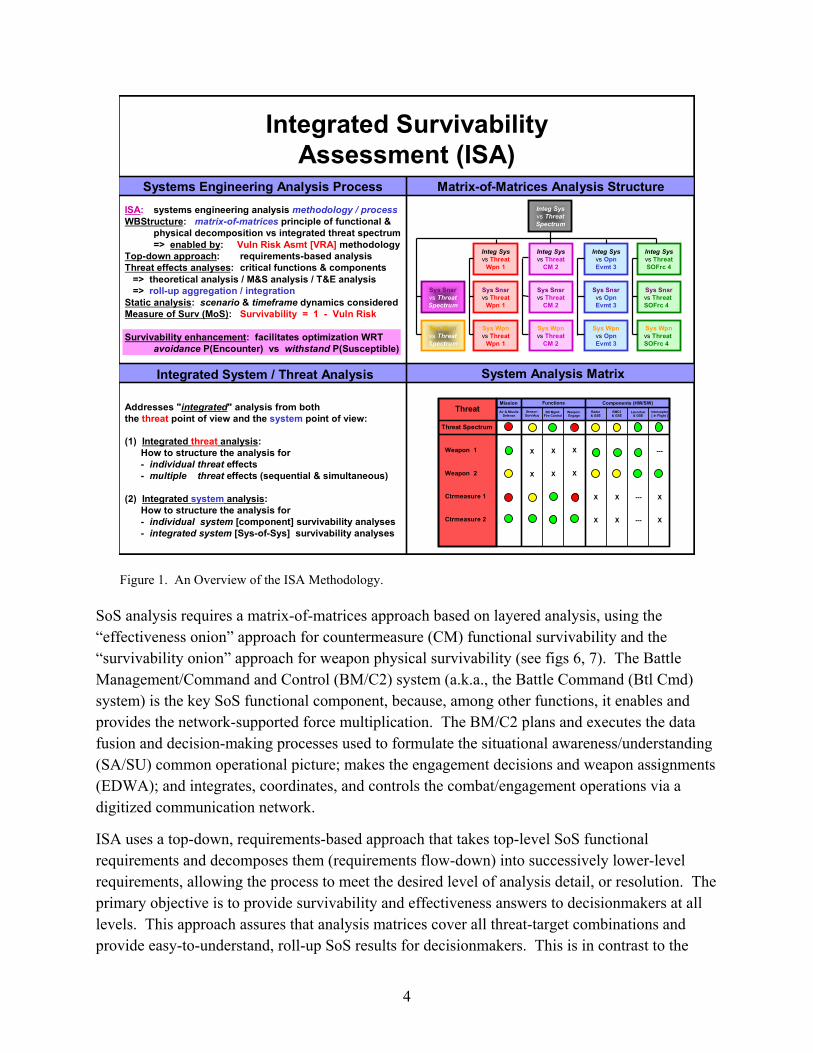
common bottom-up (capabilities-based) approaches, which take existing analytical capabilities (theoretical, M&S, T&E) and generate a growth plan to expand them to meet the desired level of analysis. In a bottom-up approach, the primary objective is to provide performance data to customers. The key characteristics of the ISA methodology are summarized in figure 2.
Methodology Type: Classical systems engineering analysis method / processDescription: Matrix-of-matrices WBStructure principle of functional &
physical decomposition vs integrated threat spectrum ( based on methodology )
Attributes: Provides top-level survivability answers for decision-makersMeasure of Surv (MoS):
( for all system/subsystem critical functions & components )where surv = operability [operate through, not operate after]
Resolution: Critical functions & components ( all system & subsystem )
Implementation: SME-conducted threat effects analyses of critical function &component perf / eff ( theoretical / M&S data / T&E data ); => roll-up aggregation / integration
Info / Data Rqmts: Threat: technical parameters, tactical probabilities System: technical parameters, tactical operation
Static or Dynamic: Static - with probability-based scenario & timeframemacro-dynamics (time-dependent) considerations
Optimization: Facilitates survivability optimization WRT avoidance P(Encounter) vs withstand P(Susceptible)
Analysis Phase: Any/all (system concept / system technology / system design)
Integrated Survivability Assessment (ISA)Methodology
vulnerability risk assessment [VRA]
Survivability = 1 - Vulnerability Risk
Figure 2. Key Characteristics of the ISA Methodology.
NOTE: With Regards To (WRT)
The Level 1 (analysis planning level) methodology consists of a structural framework for survivability analysis, set against the integrated threat spectrum. It is composed of a systems analysis matrix-of-matrices as pertains to the WBS principals of systems engineering analysis—particularly functional and physical decomposition of independent critical functions and components (i.e., hardware, software, and human operators). Level 1 implements roll-up aggregation to acquire top-level answers and uses a vulnerability risk metric as the MoS. Note that vulnerability risk is scenario and timeframe dependent and that survivability is specifically with regards to operability (i.e., operating through, not just recovering and operating after). In Level 2 (analysis execution level) methodology, subject matter experts (SMEs) elect the type of
5
analysis best suited to individual analysis tasks: theoretical (mathematical models), M&S (digital software-in-the-loop and hardware-in-the-loop models), and/or T&E (laboratory or field tests).
1.1 Survivability Analysis Process
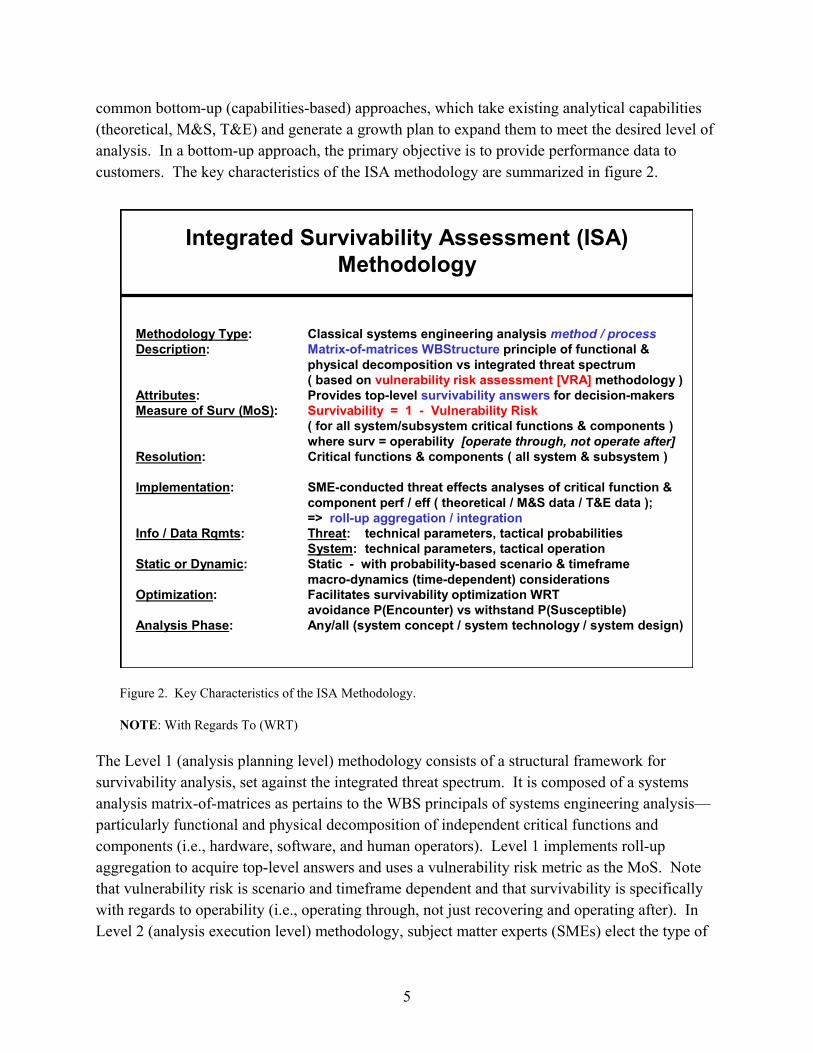
The basic survivability analysis process starts by defining and describing all system critical functions and components and then determines how each threat technique or tactic (and all likely combinations of threats and operational environments) impacts the functional performance and operational effectiveness of each critical aspect of the system. That data, when combined with threat tactical probabilities, forms the susceptibility analysis, indicating the magnitude/severity of threat effect impact. Next, the susceptibility analysis is combined with an encounter analysis (which determines the likelihood of a threat effect encounter) to arrive at the threat vulnerability risk (fig 3). Note that personnel, or soldier survivability (SSv), analysis is performed using the same method since the soldier (as system operator) is considered a critical component of the system.
ThreatDescription
Technical Design- Techniques / Effects- Devices / Sources
Tactical Operation- Tactics / Feasibility
System Description
Technical Design- Critical Functions- Critical Components
Tactical Operation- Critical Operations / TTPs
Vulnerability RiskAssessment
SusceptibilityAnalysis
TheoreticalAnalysis
- Math Models
SimulationAnalysis
- Digital (SW)- HWIL (HW)
Test DataAnalysis
- Lab Test- Field Test
PSURVIVABLE = 1 - PVULNERABLE
= 1 - PENCOUNTER
TacticalProbabilities
[ Scenario / Timeframe ]
PENCOUNTER:Likelihood ofEffect Encounter
Magnitude/ Severity of
Effect Impact
ORD:system rqmts
STAR:threat capabilities
- Offensive Threat- Def Sup Threat: - Baseline (Existing) & Reactive (Projected)- Operational Environments:
Natural & Man-Made; Friend & Foe
PENCOUNTER = PTARGET PATTACK PHIT (APPLICATION)
RD N
T
MS A (CDT approval): system concept potentialMS B (SDD approval): system technology (& growth)
potential [ ≤ Med risk ]MS C (Prod approval): system design adequacy
[ ]
Survivability AnalysisMethodology
[ Threat Effect Impact ]
PSUSCEPTIBLE
TechnicalParameters
PSUSCEPTIBLE:
Weapons & CMs
PSUSCEPTIBLE = PHA KILL / WP HIT
= PSOF KILL / CM APPLICATION
≤ Low risk
Figure 3. Outline of the Survivability Analysis Process.
6
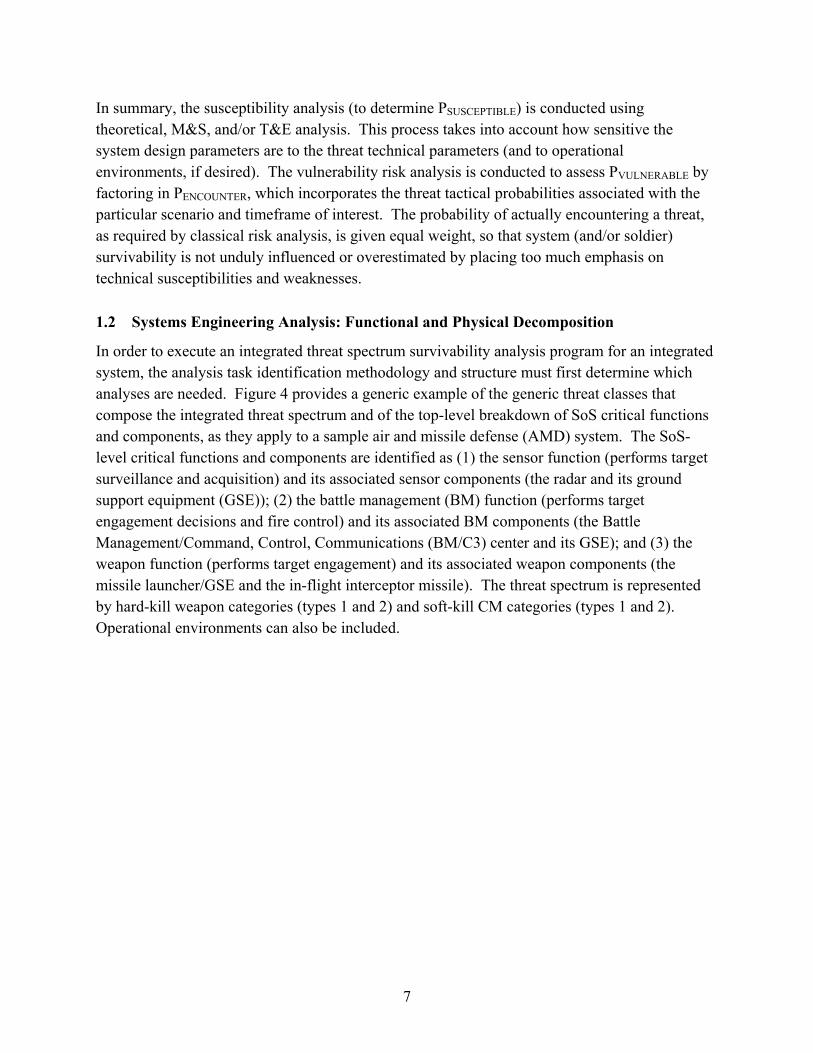
In summary, the susceptibility analysis (to determine PSUSCEPTIBLE) is conducted using theoretical, M&S, and/or T&E analysis. This process takes into account how sensitive the system design parameters are to the threat technical parameters (and to operational environments, if desired). The vulnerability risk analysis is conducted to assess PVULNERABLE by factoring in PENCOUNTER, which incorporates the threat tactical probabilities associated with the particular scenario and timeframe of interest. The probability of actually encountering a threat, as required by classical risk analysis, is given equal weight, so that system (and/or soldier) survivability is not unduly influenced or overestimated by placing too much emphasis on technical susceptibilities and weaknesses.
1.2 Systems Engineering Analysis: Functional and Physical Decomposition
In order to execute an integrated threat spectrum survivability analysis program for an integrated system, the analysis task identification methodology and structure must first determine which analyses are needed. Figure 4 provides a generic example of the generic threat classes that compose the integrated threat spectrum and of the top-level breakdown of SoS critical functions and components, as they apply to a sample air and missile defense (AMD) system. The SoS-level critical functions and components are identified as (1) the sensor function (performs target surveillance and acquisition) and its associated sensor components (the radar and its ground support equipment (GSE)); (2) the battle management (BM) function (performs target engagement decisions and fire control) and its associated BM components (the Battle Management/Command, Control, Communications (BM/C3) center and its GSE); and (3) the weapon function (performs target engagement) and its associated weapon components (the missile launcher/GSE and the in-flight interceptor missile). The threat spectrum is represented by hard-kill weapon categories (types 1 and 2) and soft-kill CM categories (types 1 and 2). Operational environments can also be included.
7

Threat Spectrum
Weapon 1
Weapon 2
Countermeasure 1
Countermeasure 2
ThreatMission Functions Components (HW/SW)Attack /Defense
Sensor:Surv/Acq
Btl Mgmt:Fire Cntrl
Weapon:Engage
Sensor& GSE
BMC3& GSE
Launcher& GSE
Weapon[In Flight]
X
X
X
X
X
X
X
X
X
X
---
---
---
X
X
SystemSurvivability Analysis
Matrix
Figure 4. Sample System Survivability Analysis Matrix.
The top-level analyses that need to be performed are identified by colored circles, showing where functions or components intersect with threat categories. The circle color applied indicates the level of vulnerability risk as determined by the VRA analysis: red indicates high to very high; yellow, medium to moderate; and green, low to very low. In order to avoid redundant analyses of threat impacts on functions and components, the circle is placed at the position indicating the primary application (e.g., with threat weapons, primarily attack system components; and with threat CMs, primarily attack system functions). An “X” at the position denotes an associated applicability to the analysis cells being addressed. The dashes indicate non-applicable system functions/components for a particular threat.
1.3 SoS Analysis via a Matrix-of-Matrices
Just as a single system can be decomposed into its critical functions and components for analysis, so can an SoS be decomposed into its respective critical functions and components for analysis using the same method. Effectively, it is just a matter of extending the definition of what comprises a system. A system is generally defined as “an interacting or interdependent group of items/components forming a unified whole, which are under the influence of related forces,
8
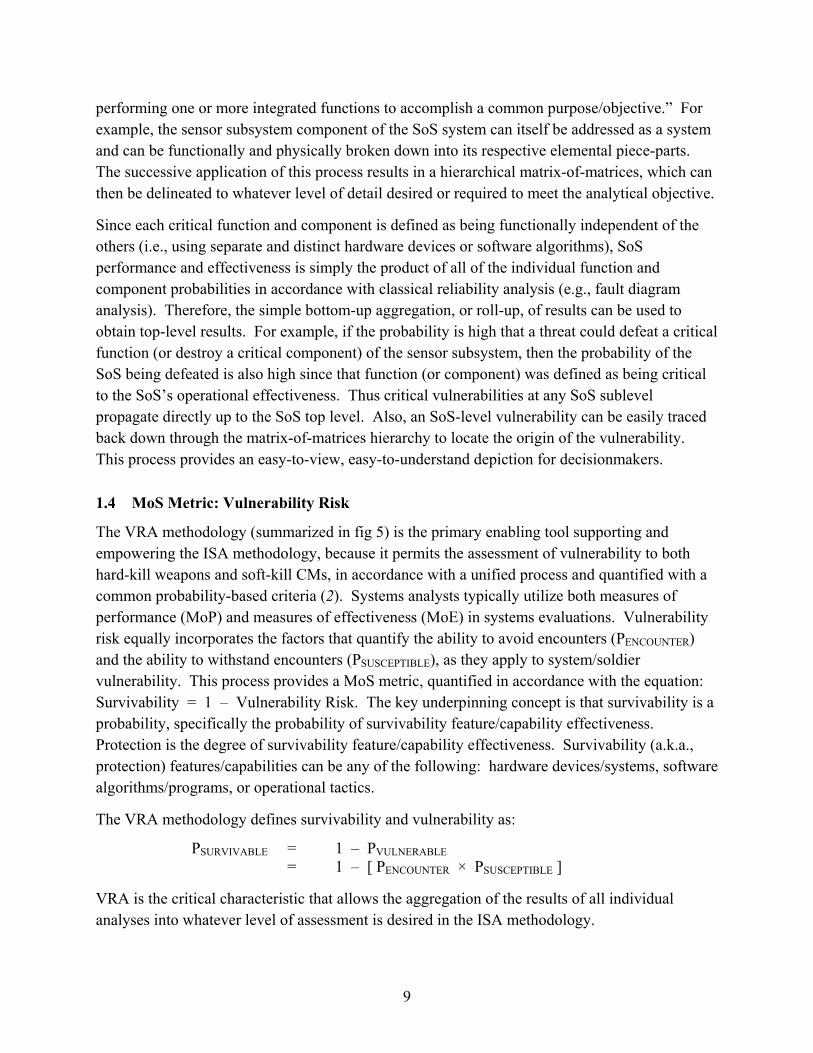
performing one or more integrated functions to accomplish a common purpose/objective.” For example, the sensor subsystem component of the SoS system can itself be addressed as a system and can be functionally and physically broken down into its respective elemental piece-parts. The successive application of this process results in a hierarchical matrix-of-matrices, which can then be delineated to whatever level of detail desired or required to meet the analytical objective.
Since each critical function and component is defined as being functionally independent of the others (i.e., using separate and distinct hardware devices or software algorithms), SoS performance and effectiveness is simply the product of all of the individual function and component probabilities in accordance with classical reliability analysis (e.g., fault diagram analysis). Therefore, the simple bottom-up aggregation, or roll-up, of results can be used to obtain top-level results. For example, if the probability is high that a threat could defeat a critical function (or destroy a critical component) of the sensor subsystem, then the probability of the SoS being defeated is also high since that function (or component) was defined as being critical to the SoS’s operational effectiveness. Thus critical vulnerabilities at any SoS sublevel propagate directly up to the SoS top level. Also, an SoS-level vulnerability can be easily traced back down through the matrix-of-matrices hierarchy to locate the origin of the vulnerability. This process provides an easy-to-view, easy-to-understand depiction for decisionmakers.
1.4 MoS Metric: Vulnerability Risk
The VRA methodology (summarized in fig 5) is the primary enabling tool supporting and empowering the ISA methodology, because it permits the assessment of vulnerability to both hard-kill weapons and soft-kill CMs, in accordance with a unified process and quantified with a common probability-based criteria (2). Systems analysts typically utilize both measures of performance (MoP) and measures of effectiveness (MoE) in systems evaluations. Vulnerability risk equally incorporates the factors that quantify the ability to avoid encounters (PENCOUNTER) and the ability to withstand encounters (PSUSCEPTIBLE), as they apply to system/soldier vulnerability. This process provides a MoS metric, quantified in accordance with the equation: Survivability = 1 – Vulnerability Risk. The key underpinning concept is that survivability is a probability, specifically the probability of survivability feature/capability effectiveness. Protection is the degree of survivability feature/capability effectiveness. Survivability (a.k.a., protection) features/capabilities can be any of the following: hardware devices/systems, software algorithms/programs, or operational tactics.
The VRA methodology defines survivability and vulnerability as:
PSURVIVABLE = 1 – PVULNERABLE = 1 – [ PENCOUNTER × PSUSCEPTIBLE ]
VRA is the critical characteristic that allows the aggregation of the results of all individual analyses into whatever level of assessment is desired in the ISA methodology.
9

PSurvivable = 1 - PVulnerable= 1 - [ PEncounter x ]
PEncounter = PTarget PAttack PHit [Application]PSusceptible [Wpn] = rdPSusceptible [ CM ] = ft
=> Optimal vulnerability risk reduction
Vulnerability Risk Matrix
System Analysis MatrixVulnerability Risk
Survivability
0 0.1 0.2 0.3 0.4 0.5 0.6 0.7 0.8 0.9 10
0.1
0.2
0.3
0.4
0.5
0.6
0.7
0.8
0.9
1
P (Encounter): 1.00P (Encounter): 0.90P (Encounter): 0.60P (Encounter): 0.40P (Encounter): 0.10
Susceptibility
Surv
ivab
ility
Vulnerability RiskAssessment (VRA)
Threat Spectrum
Weapon A
Weapon B
Ctrmeasure A
Ctrmeasure B
ThreatMission Functions Components (HW/SW)Air & Missile
DefenseSensor:Surv/Acq
Btl Mgmt:Fire Control
Weapon:Engage
Radar& GSE
BMC4& GSE
Launcher& GSE
Interceptor[ In Flight ]
X
X
X
X
X
X
X
X
X
X
---
---
---
X
X
Very HighHighMediumLowVery Low
Very Low
Low
Medium
High
Very High
Very HighHighMediumVery Low LowThreat Probability
Threat EffectSusceptibility
Vulnerability Risk
100
90
60
40
10
00 10 40 60 90 100
WeaponB
WeaponA
CtrMsrA
CtrMsrB
ARL-TR-1045: Vulnerability Risk Assessment, Jun 00
PSusceptible
PHa Kill / HitPSo Kill / Application
Figure 5. Summary of the VRA Methodology.
With regards to weapon effects (hard kill), the factor being addressed is physical survivability (critical component kill). Whereas with CM effects (soft kill), the factor under consideration is functional survivability (critical function kill). Note that all classical physical survivability analyses are exemplified by the layers in the integrated SoS survivability onion (fig 6) and are represented by pairings of the threat versus critical component analyses identified in the analysis matrices. Remember that these are the component analyses most often performed in weapon effects analyses.
10
Integrated SoSSurvivability Onion
Kill The Enemy(See-Understand-Act)
First
Pre-Emptive Kill
Pre-Emptive Encounter
Systemof Systems
AvoidDetection
Avoid KillWithstand
Hit / Application
AvoidTargeting
AvoidEngagement
AvoidHit / Application
Avoid / PreventEncounter/Exposure
IndividualSystem
(Platform)
CooperativeProtection
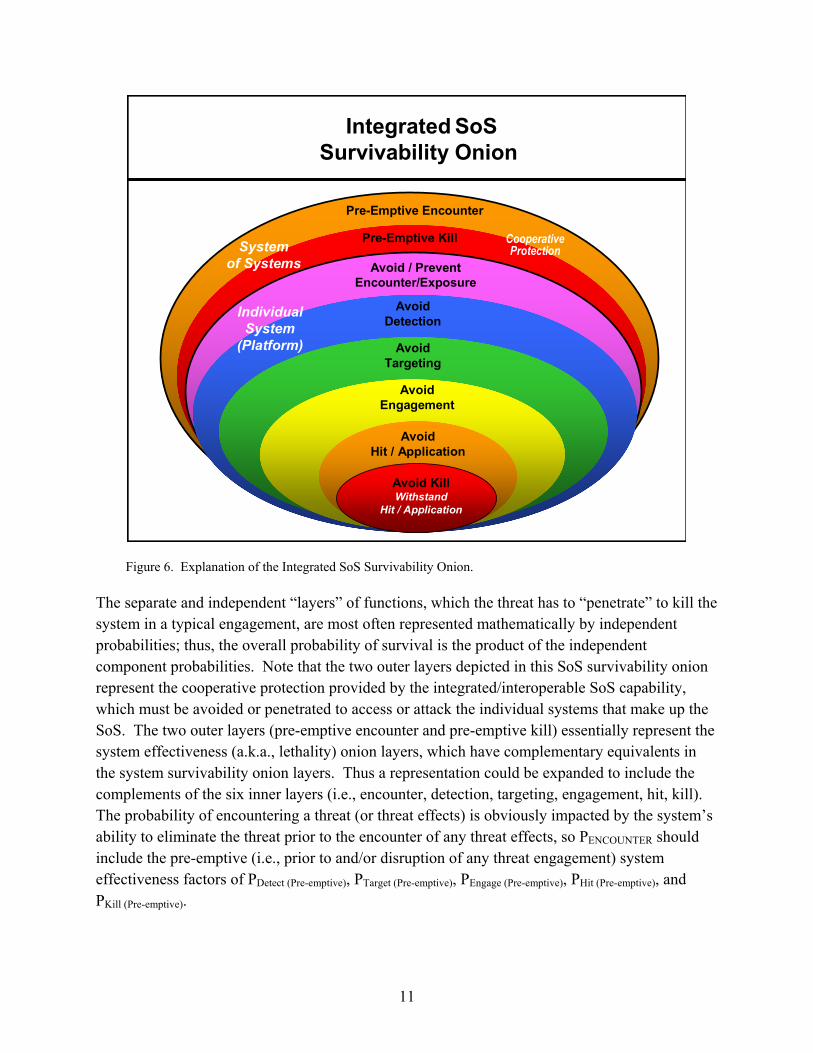
Figure 6. Explanation of the Integrated SoS Survivability Onion.
The separate and independent “layers” of functions, which the threat has to “penetrate” to kill the system in a typical engagement, are most often represented mathematically by independent probabilities; thus, the overall probability of survival is the product of the independent component probabilities. Note that the two outer layers depicted in this SoS survivability onion represent the cooperative protection provided by the integrated/interoperable SoS capability, which must be avoided or penetrated to access or attack the individual systems that make up the SoS. The two outer layers (pre-emptive encounter and pre-emptive kill) essentially represent the system effectiveness (a.k.a., lethality) onion layers, which have complementary equivalents in the system survivability onion layers. Thus a representation could be expanded to include the complements of the six inner layers (i.e., encounter, detection, targeting, engagement, hit, kill). The probability of encountering a threat (or threat effects) is obviously impacted by the system’s ability to eliminate the threat prior to the encounter of any threat effects, so PENCOUNTER should include the pre-emptive (i.e., prior to and/or disruption of any threat engagement) system effectiveness factors of PDetect (Pre-emptive), PTarget (Pre-emptive), PEngage (Pre-emptive), PHit (Pre-emptive), and PKill (Pre-emptive).
11
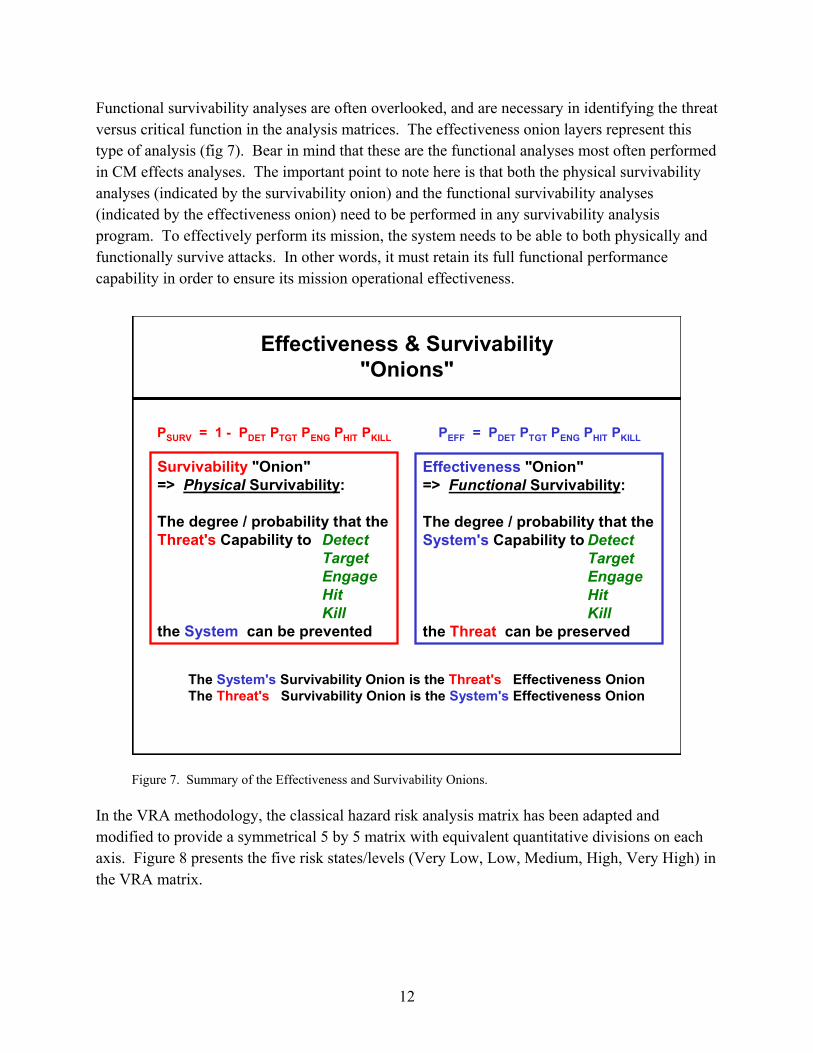
Functional survivability analyses are often overlooked, and are necessary in identifying the threat versus critical function in the analysis matrices. The effectiveness onion layers represent this type of analysis (fig 7). Bear in mind that these are the functional analyses most often performed in CM effects analyses. The important point to note here is that both the physical survivability analyses (indicated by the survivability onion) and the functional survivability analyses (indicated by the effectiveness onion) need to be performed in any survivability analysis program. To effectively perform its mission, the system needs to be able to both physically and functionally survive attacks. In other words, it must retain its full functional performance capability in order to ensure its mission operational effectiveness.
"Onion"=> Physical Survivability:
The degree / probability that theCapability to Detect
TargetEngageHitKill
the System can be prevented
Effectiveness & Survivability"Onions"
Effectiveness "Onion"=> Functional Survivability:
The degree / probability that theSystem's Capability to Detect
TargetEngageHitKill
the n be preserved
The System's Survivability Onion is the Effectiveness OnionThe Survivability Onion is the System's Effectiveness Onion
PEFF = PDET PTGT PENG PHIT PKILL
Survivability
Threat's
Threat ca
Threat'sThreat's
PSURV = 1 - PDET PTGT PENG PHIT PKILL
Figure 7. Summary of the Effectiveness and Survivability Onions.
In the VRA methodology, the classical hazard risk analysis matrix has been adapted and modified to provide a symmetrical 5 by 5 matrix with equivalent quantitative divisions on each axis. Figure 8 presents the five risk states/levels (Very Low, Low, Medium, High, Very High) in the VRA matrix.
12

Very LowNo Concern
[Accept Risk]
MediumMinor Issue
[Provide Options]
LowMinimal Concern
[Investigate Options]
Very HighCritical Issue
[Remedy Immediately]
HighMajor Issue
[Remedy ASAP]
Very LowMinimal / NoneNEGLIGIBLE
LowLimited / Insignificant
MINOR
MediumModerate
MARGINAL
HighExtensive / Significant
MAJOR
Very HighCatastrophic / Extreme
CRITICAL
Very HighVERY LIKELY
or Certain
HighLIKELY
and Probable
MediumUNCERTAINbut Possible
Very LowVERY UNLIKELY
or Improbable
LowUNLIKELY
but Possible
Threat Probability[ Likelihood of Occurrence / Encounter / Attack ]
Threat EffectSusceptibility
[ Magnitude / Severityof Threat Effect Impact ]
Threat Vulnerability Risk [Near-Term]
100
90
60
40
10
00 10 40 60 90 100
Confidence:Vuln Risk
L M H
L M HConfidence:Probability
Conf:Susc
M
L
H
[ Confidence ]:H: adequate
analysis/dataM: marginal
analysis/dataL: inadequate
analysis/data
Vulnerability RiskAssessment Matrix
Figure 8. Summary of the VRA Matrix.
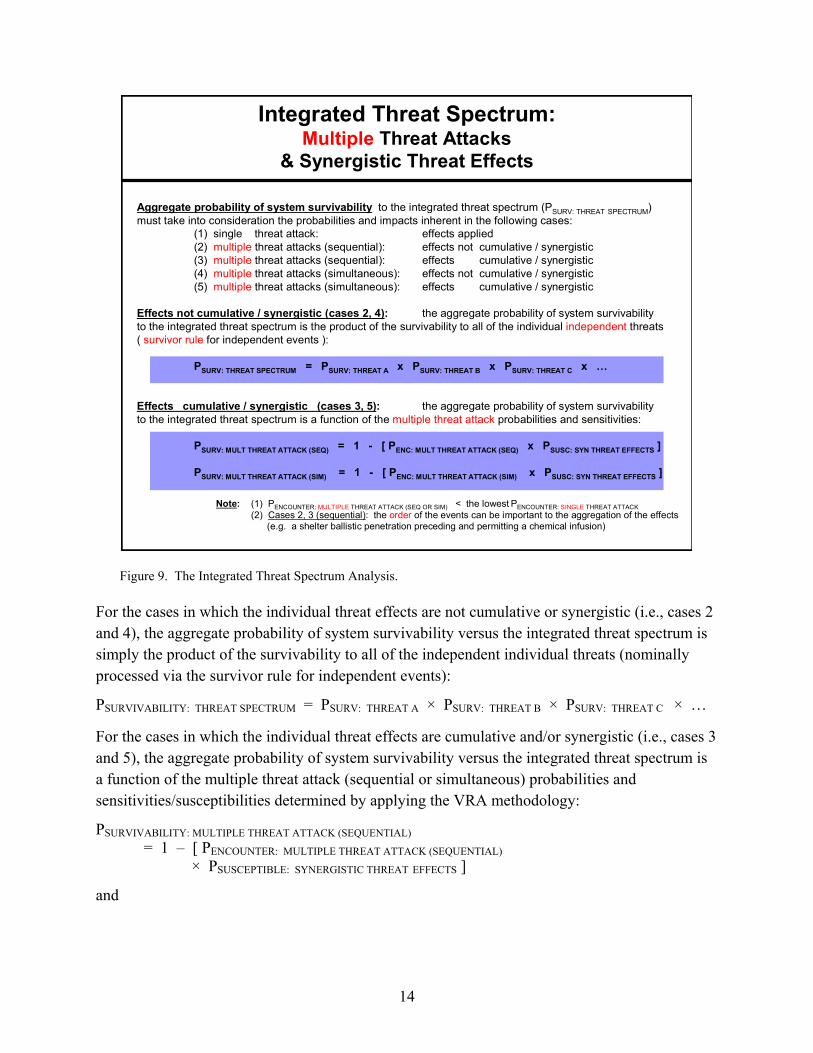
The VRA methodology applies another attribute (PSURVIVABILITY: THREAT SPECTRUM) to provide a simple and straight-forward way to determine the aggregate probability of system survivability versus the integrated threat spectrum, especially where multiple threat attacks with cumulative and/or synergistic threat effects need to be analyzed (fig 9). The five general attack/engagement cases that need to be addressed in survivability analyses are:
1. single threat attacks: effects applied 2. multiple threat attacks (sequential): effects not cumulative/synergistic 3. multiple threat attacks (sequential): effects cumulative/synergistic 4. multiple threat attacks (simultaneous): effects not cumulative/synergistic 5. multiple threat attacks (simultaneous): effects cumulative/synergistic
13
Integrated Threat Spectrum:Threat Attacks
& Synergistic Threat Effects
Aggregate probability of system survivability to the integrated threat spectrum (PSURV: THREAT SPECTRUM)must take into consideration the probabilities and impacts inherent in the following cases:
(1) single threat attack: effects applied(2) threat attacks (sequential): effects not cumulative / synergistic(3) threat attacks (sequential): effects cumulative / synergistic(4) threat attacks (simultaneous): effects not cumulative / synergistic(5) threat attacks (simultaneous): effects cumulative / synergistic
Effects not cumulative / synergistic (cases 2, 4): the aggregate probability of system survivabilityto the integrated threat spectrum is the product of the survivability to all of the individual threats( for independent events ):
PSURV: THREAT SPECTRUM = PSURV: THREAT A x PSURV: THREAT B x PSURV: THREAT C x …
Effects cumulative / synergistic (cases 3, 5): the aggregate probability of system survivabilityto the integrated threat spectrum is a function of the probabilities and sensitivities:
PSURV: MULT THREAT ATTACK (SEQ) = 1 - [ PENC: MULT THREAT ATTACK (SEQ) x PSUSC: SYN THREAT EFFECTS ]
PSURV: MULT THREAT ATTACK (SIM) = 1 - [ PENC: MULT THREAT ATTACK (SIM) x PSUSC: SYN THREAT EFFECTS ]
Note: (1) PENCOUNTER: HREAT ATTACK (SEQ OR SIM) < the lowest PENCOUNTER: REAT ATTACK(2) Cases 2, 3 (sequential): the of the events can be important to the aggregation of the effects
(e.g. a shelter ballistic penetration preceding and permitting a chemical infusion)
Multiple
multiplemultiplemultiplemultiple
independentsurvivor rule
multiple threat attack
MULTIPLE T SINGLE THorder
Figure 9. The Integrated Threat Spectrum Analysis.
For the cases in which the individual threat effects are not cumulative or synergistic (i.e., cases 2 and 4), the aggregate probability of system survivability versus the integrated threat spectrum is simply the product of the survivability to all of the independent individual threats (nominally processed via the survivor rule for independent events):
PSURVIVABILITY: THREAT SPECTRUM = PSURV: THREAT A × PSURV: THREAT B × PSURV: THREAT C × …
For the cases in which the individual threat effects are cumulative and/or synergistic (i.e., cases 3 and 5), the aggregate probability of system survivability versus the integrated threat spectrum is a function of the multiple threat attack (sequential or simultaneous) probabilities and sensitivities/susceptibilities determined by applying the VRA methodology:
PSURVIVABILITY: MULTIPLE THREAT ATTACK (SEQUENTIAL) = 1 – [ PENCOUNTER: MULTIPLE THREAT ATTACK (SEQUENTIAL)
× PSUSCEPTIBLE: SYNERGISTIC THREAT EFFECTS ]
and
14

PSURVIVABILITY: MULTIPLE THREAT ATTACK (SIMULTANEOUS) = 1 – [ PENCOUNTER: MULTIPLE THREAT ATTACK (SIMULTANEOUS)
× PSUSCEPTIBLE: SYNERGISTIC THREAT EFFECTS ]
Note that the PENCOUNTER for either a multiple, sequential threat attack or a multiple, simultaneous threat attack is usually less than the lowest PENCOUNTER for any of the individual component single threat attacks since the probability of successful attack coordination is included. Also, for cases 2 and 3 (multiple sequential threat attacks), the sequential order of the attacks/events can affect the aggregation of the effects. For example, a shelter attack by conventional weapons (resulting in ballistic penetration and perforation of the walls) that precedes an attack by chemical weapons (resulting in subsequent chemical infusion through the walls) would likely have a significantly different result than if the chemical attack preceded the conventional weapon attack. The likelihood of encounter for each individual sequence or order must, therefore, be addressed separately.
In figure 10, a generic VRA matrix depicts how all the element vulnerabilities (weapons, CMs, and operational environments) in an integrated threat spectrum would be presented. Using the matrix, one can visually assess the relative impact of hard-kill and soft-kill effects on system survivability quickly and easily from a common vantage point. Note that the analysis confidence chart in the upper-right corner provides a quick check for decisionmakers regarding the credibility of the results of each individual analysis.
15

Very LowNo Concern
[Accept Risk]
MediumMinor Issue
[Provide Options]
LowMinimal Concern
[Investigate Options]
Very HighCritical Issue
[Remedy Immediately]
HighMajor Issue
[Remedy ASAP]
Very LowMinimal / NoneNEGLIGIBLE
LowLimited / Insignificant
MINOR
MediumModerate
MARGINAL
HighExtensive / Significant
MAJOR
Very HighCatastrophic / Extreme
CRITICAL
Very HighVERY LIKELY
or Certain
HighLIKELY
and Probable
MediumUNCERTAINbut Possible
Very LowVERY UNLIKELY
or Improbable
LowUNLIKELY
but Possible
Threat Probability[ Likelihood of Occurrence / Encounter / Attack ]
Threat EffectSusceptibility
[ Magnitude / Severityof Threat Effect Impact ]
Threat Vulnerability Risk [Near-Term]
100
90
60
40
10
00 10 40 60 90 100
Confidence:Vuln Risk
L M H
L M HConfidence:Probability
Conf:Susc
M
L
H
[ Confidence ]:H: adequate
analysis/dataM: marginal
analysis/dataL: inadequate
analysis/data
Integrated Threat SpectrumVulnerability Risk Matrix
[4] SOForces
[1] Conv Wpns
[7] IW CMs
[3] Ch/Bio Wpns
[2] Nuclear Wpns
[5] Penaid CMs
[6] EW CMs
[8] EM Opn Env
[9] Nat Opn Env
8,9 1
7 2-4 5,6
Figure 10. Integrated Threat Spectrum VRA Matrix.
1.5 Survivability Assessment Issues and Considerations
1.5.1 Survivability at Multiple Levels
Survivability can be addressed at any level of conflict: war (strategic conflict), campaign (phase of military operations with a specific objective), operation (series of coordinated missions), mission (tactical objective or maneuver), battle (tactical encounter or combat scenario), and engagement (combat action). The ISA methodology construct presented here primarily addresses the mission level, assessing how scenario- or vignette-based results from lower-level encounter stages (the engagements of individual subsystem functions and components by individual threats) aggregate and progress up the matrix pyramid to SoS-level results. The same general approach can be utilized to perform a survivability assessment depicting how mission-level or operations-level results progress up their associated matrix pyramids to campaign-level results. The only difference between them is that the critical functions and components in the various matrices reflect the level of organizational structure and objectives (system and threat) involved in the analysis. Note that the ISA MoS metric used (vulnerability risk, the probability of failure/defeat) is the same at all levels and is common to all analyses.
16

1.5.2 Survivability Optimization
The ISA methodology facilitates a better understanding of survivability (or protection feature/capability trade-offs) analyses by visually depicting, at any level of detail desired, the impact of each threat on each system critical function and component, thus quantifying the contribution of various local or distributed system hardness/resistance features. Survivability enhancement options, for either threat avoidance (evade the encounter) or threat tolerance (withstand the encounter), can be selected based on whatever layer of the survivability onion threat “kill chain” has the highest system vulnerability impact. Consequently, the ISA can assist in identifying which attack effectiveness negation measures might be the best in terms of cost/benefit.
1.5.3 Survivability Robustness
System survivability robustness refers to the retention of system effectiveness under various (and, perhaps, real-time varying) potential threats and operational environment conditions and scenarios. The ISA methodology employs a probabilistic, scenario-based approach to survivability assessment. It examines the operational effectiveness of such variables and indicates how system survivability robustness varies as operational factors and conditions change and as system/threat parameters and probabilities alter.
1.5.4 Reliability
In general, survivability analyses are performed under the assumption of nominally operating systems, which allows one to isolate the stresses of environmental extremes and hostile threat effects to that system. Reliability addresses the probability of a system remaining functional and operational under normal or natural conditions (operational or environmental) and under expected extremes. Survivability deals with the probability of the system remaining functional and operational despite intentionally hostile attempts to degrade or attack it. Thus survivability theory is a subset of reliability theory, and the probability mathematics associated with the reliability of parallel and series systems applies to survivability assessment. System effectiveness is determined by the system design, as well as by the human operators, whose training, performance, and survivability are all related factors. System reliability analyses can apply system effectiveness to system survivability analyses where human-operator response accuracy and latency are major system performance drivers. In the ISA methodology, the operator is included in the system analysis matrices as a critical component, and the critical functions performed by the operator are evaluated equivalently with the critical functions performed by system hardware devices and software algorithms. (NOTE: Operational suitability consists of reliability, availability, maintainability, supportability, compatibility, interoperability, transportability, safety, human factors, and natural environment effects.)
17
1.5.5 Spiral Development Applicability
The ISA methodology equally supports both the traditional serial and the modified spiral modes in development system acquisition by enabling continuous evaluations of combat scenario probabilistic outcomes based on existing (or projected) system and threat capability levels. The ISA addresses the performance and effectiveness of system critical functions and components while under attack, as it applies to a particular scenario at a specific timeframe. Thus the process accounts for the actual (or projected) system capabilities at a particular integration phase of development, as well as assesses the associated threat capabilities at that stage. Typically, either theoretical or M&S analysis is employed to evaluate the PENCOUNTER and PSUSCEPTIBILITY sub-metrics used in the MoS metric (vulnerability risk), since test items may not be available for T&E analysis.
2. Integrated Threat Spectrum
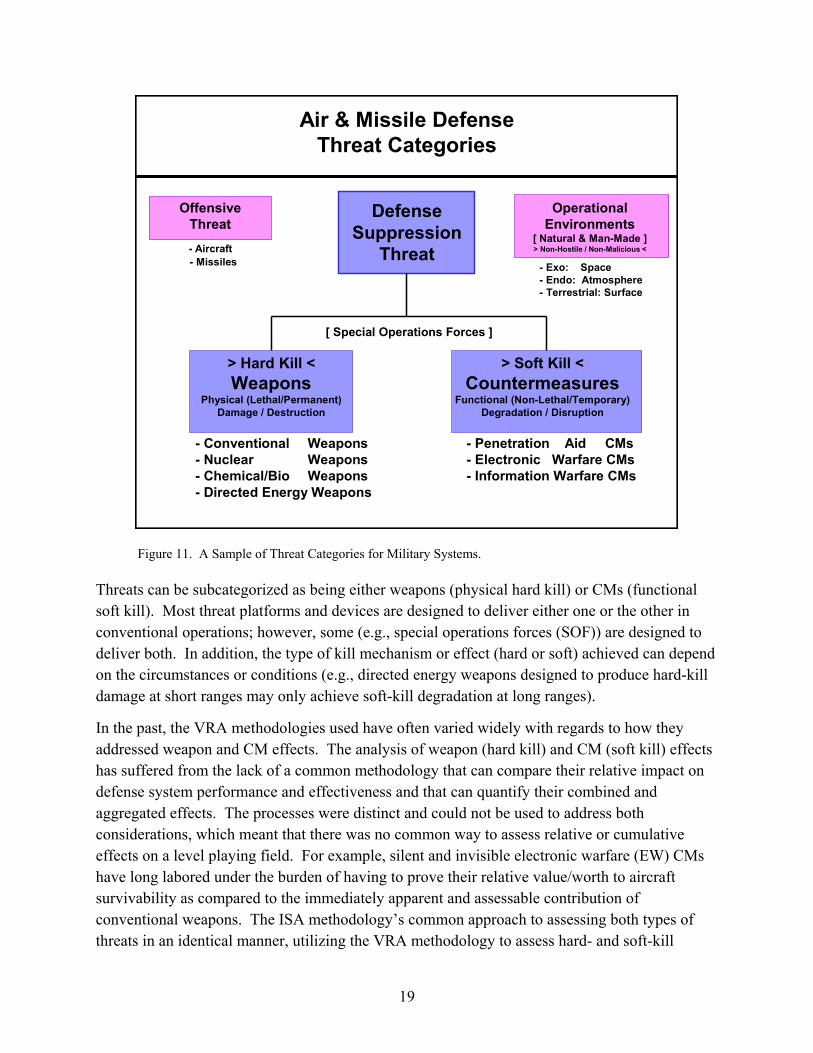
The basic survivability threats that military systems must address are often categorized as offensive threats (OTs), threats which a system is designed to defend against, and defense suppression threats (DSTs), threat techniques/tactics/devices which the enemy specifically employs to counter the effectiveness of the system’s defenses. Effectiveness analysis generally deals with the system’s performance against the OT (as represented by the effectiveness onion factors), whereas survivability analysis tends to address the system’s ability to survive and operate through intentional attacks by the DST (as represented by the survivability onion factors). The system must also be able to survive and operate through expected operational environment extremes, both natural and manmade (but unintentionally induced). Figure 11 shows an example of these threat categories, specific to an AMD system application.
18
> Soft Kill <Countermeasures
Functional (Non-Lethal/Temporary)Degradation / Disruption
- Penetration Aid CMs- Electronic Warfare CMs- Information Warfare CMs
> Hard Kill <Weapons
Physical (Lethal/Permanent)Damage / Destruction
- Conventional Weapons- Nuclear Weapons- Chemical/Bio Weapons- Directed Energy Weapons
OperationalEnvironments
[ Natural & Man-Made ]> Non-Hostile / Non-Malicious <
- Exo: Space- Endo: Atmosphere- Terrestrial: Surface
DefenseSuppression
Threat
OffensiveThreat- Aircraft- Missiles
[ Special Operations Forces ]
Air & Missile DefenseThreat Categories
Figure 11. A Sample of Threat Categories for Military Systems.
Threats can be subcategorized as being either weapons (physical hard kill) or CMs (functional soft kill). Most threat platforms and devices are designed to deliver either one or the other in conventional operations; however, some (e.g., special operations forces (SOF)) are designed to deliver both. In addition, the type of kill mechanism or effect (hard or soft) achieved can depend on the circumstances or conditions (e.g., directed energy weapons designed to produce hard-kill damage at short ranges may only achieve soft-kill degradation at long ranges).
In the past, the VRA methodologies used have often varied widely with regards to how they addressed weapon and CM effects. The analysis of weapon (hard kill) and CM (soft kill) effects has suffered from the lack of a common methodology that can compare their relative impact on defense system performance and effectiveness and that can quantify their combined and aggregated effects. The processes were distinct and could not be used to address both considerations, which meant that there was no common way to assess relative or cumulative effects on a level playing field. For example, silent and invisible electronic warfare (EW) CMs have long labored under the burden of having to prove their relative value/worth to aircraft survivability as compared to the immediately apparent and assessable contribution of conventional weapons. The ISA methodology’s common approach to assessing both types of threats in an identical manner, utilizing the VRA methodology to assess hard- and soft-kill
19

vulnerability via equivalent criteria, provides an easy and effective solution to this long-standing problem.
2.1 Conventional Weapons
Conventional weapon types can be partitioned into two generic delivery categories: “dumb” or unguided (ballistic trajectory) munitions and precision guided munitions. Precision guided munitions are typically further divided into three types: operator guided, seeker guided (“smart,” which includes terminal-guided and sensor-fused types), and seeker guided with on-board discrimination (“brilliant”). Furthermore, there are two types of munitions: kinetic energy munitions, which utilize rod/ball projectiles/penetrators (including explosively formed projectiles), and chemical energy munitions, which utilize shaped-charge jets. Conventional high-explosive warheads can be delivered by tactical/strategic ballistic missiles and guided cruise missiles, as well as by field artillery and aircraft.
The conventional weapon effects that must be addressed in survivability analyses consist of the following: damage due to blast (overpressure), shock, projectile or fragment penetration, and fire/heat.
2.2 Nuclear Weapons
Nuclear weapon types can be divided into two generic categories: atomic (fission) and hydrogen (fusion). They can be delivered by tactical/strategic ballistic missiles and guided cruise missiles, as well as by field artillery and aircraft.
The nuclear weapon effects that must be addressed in survivability analyses is comprised of the following: damage due to blast (overpressure), initial nuclear radiation upset/burnout (including α, β, γ, n total-dose accumulation, dose-rate transient flux, and lattice damage), electromagnetic pulse (EMP, including electronic latch-up and burnout), and thermal pulse (heat stress). Operation in nuclear environments typically addresses the effects of functional degradation/ disruption on sensors and communications due to electromagnetic (EM) propagation anomalies.
2.3 Chemical/Biological Weapons
Chemical (anti-personnel and materiel) and biological (anti-personnel) weapon agent types include aerosol/vapor, liquid, and solid forms. The adverse effects of both the agents themselves and the caustic decontaminants used to counteract and remove them must be addressed in the analysis of nuclear/biological/chemical contamination survivability. The agents can be delivered by tactical/strategic ballistic missiles and guided cruise missiles, as well as by field artillery and aircraft.
The chemical weapon effects that must be addressed in survivability analyses are as follows: materiel damage due to corrosion, decomposition, deformation, and property/ performance
20

alteration. The biological weapon effects that must be addressed in survivability analyses include injury, human debilitation due to incapacitation, and death induced by agents that attack human biological systems (nerves, blood, skin, sensory, etc.).
2.4. Directed Energy Weapons
Directed energy (DE) weapon types can be divided into three generic categories: radio frequency (RF)/microwave frequency high-power microwaves; infrared (IR)/visible frequency high-energy lasers; and neutral particle beam generators. The beam weapon effects are delivered by line-of-sight (including reflected) radiation and are impacted by diffraction-based beam-spreading.
The DE weapon effects that must be addressed in survivability analyses consist of damage due to heating effects and impact erosion due to EM energy or subatomic particle deposition.
2.5 Penetration Aid Countermeasures
Penetration aid CM types, which are targeted against sensors, generally include techniques which rely on passive electronic signal reflection (such as decoys, either target-associated objects or replicas), chaff, absorptive/reflective materials, and/or induced mechanical dynamics.
The penetration aid CM effects that must be addressed in survivability analyses includes the following: degradation due to true-target alteration techniques (such as evasion, signature reduction, signature obscuration, signature alteration, deception, and saturation loading) and to false-target generation techniques (such as deception and saturation loading).
2.6 Electronic Warfare Countermeasures
The EW CM types, which are targeted against sensors and communication receivers in both RF and IR CM areas, generally consist of techniques which rely on active electronic signal generation and radiation (including main-lobe and side-lobe specific techniques), such as noise jamming and deception jamming.
The EW CM effects that must be addressed in survivability analyses include the following: degradation due to true-target alteration techniques (such as signature obscuration, signature alteration, deception, and saturation loading) and to false-target generation techniques (such as deception and saturation loading).
2.7 Information Warfare Countermeasures
Information warfare (IW) CM types, which are targeted against automated information system (AIS) and embedded sensor/weapon system computers/processors), generally include (1) human-activated (real-time) intruder/insider techniques, such as information collection and false message/command or software insertion; and (2) software-activated (real-time insertion or pre-
21
planted) malicious code techniques, such as viruses, worms, trap doors, Trojan horses, and flooding (saturation loading).
The IW CM effects that must be addressed in survivability analyses are as follows: degradation due to data compromise, data corruption, and operations disruption.
2.8 Special Operations Forces
SOF weapon types typically include small arms, light artillery, smart munitions, explosives, and power severance tools. The SOF weapon effect that must be addressed in survivability analyses is damage due to any kind of the typical weapon effects.
SOF CM types consist of EW jamming of sensor or communication systems and IW attacks on C2 system computers. The SOF CM effect that must be addressed in survivability analyses is degradation due to any type of the typical CM effects.
2.9 Operational Environments
Natural operational environment types can include the following: exo-atmospheric (space), endo-atmospheric (weather), terrestrial (surface conditions), and even subterranean/submarine (subsurface) environments. The risk of natural environmental extremes, such as earthquakes, tsunamis, wildfires, and tornadoes/hurricanes, are ameliorated by their very low likelihood of occurrence.
Manmade operational environment types can consist of unintentionally or intentionally induced disturbances in the natural terrestrial, atmospheric, or space environments (e.g., excessive dust, vibration, heat, light, etc.), as well as EM environmental effects, which include EM interference, EM radiation operations, EM radiation hazards, EMP, electro-static discharge, and lightning effects.
2.10 Threat and Operational Environment Combinations
In most scenarios, multiple threat attack combinations (both simultaneous and sequential) are likely to occur. These include combinations of individual threat types (e.g., direct-fire and indirect-fire conventional weapons), as well as combinations of different threat types (e.g., conventional weapons and EW CMs). In addition, the effectiveness/impact of the threat combinations varies depending on the operational environment combinations (e.g., arctic, tropic, desert, mountain, quiescent/stormy, summer/winter, day/night, etc.). Where multiple threat attacks with cumulative and/or synergistic threat effects need to be analyzed, use the approach described previously in figure 9 to determine the aggregate probability of system survivability against the integrated threat spectrum
22

3. Integrated System Analysis Matrices
The system analysis matrices required for ISA are formulated to identify the WBS of all system-threat combinations/pairings that must be analyzed, including both individual threats and all likely threat combinations. The top-down (requirements-based, flow-down) approach starts at the SoS level and proceeds down to all subsequent system or subsystem layers consistent with the level of analysis detail desired or required.
3.1 SoS: Critical Functions
At the top level, all military combat systems with the objective of defeating or destroying adversary personnel and/or materiel assets must perform, as a minimum, three critical functional tasks:
1. Sensor functions: target surveillance and acquisition/tracking.
2. BM/Btl Cmd functions: target selection/engagement decision, weapon assignment, engagement strategy selection, and fire control (which including command, control, communication (C3)).
3. Weapon functions: target engagement and negation.
For a SoS responsible for the C3 of several semi-autonomous component systems, the SoS BM function must perform additional key tasks, such as multi-sensor data fusion, wide area SA/SU, multi-target engagement prioritization, and multi-weapon simultaneous/sequential fire control. Wide area communication network connectivity necessitates both ground and airborne low latency communication relays.
3.2 SoS: Critical Components
The critical components (including hardware devices, software algorithms, and human operators) that perform the above-mentioned, top-level functional tasks generally consist of the following:
1. Sensor system components: radar, IR/optical devices, human observers, and GSE.
2. BM/C3 system components: the tactical operations center (TOC) AIS computers/processors, decision-making process algorithms, human operators, network communication systems, and GSE.
3. Weapon system components: launchers, missiles/munitions, and GSE.
GSE typically includes power generation, platform protection, maintenance/repair, supply, transportation/deployment, supply, and heating/cooling equipment.
23
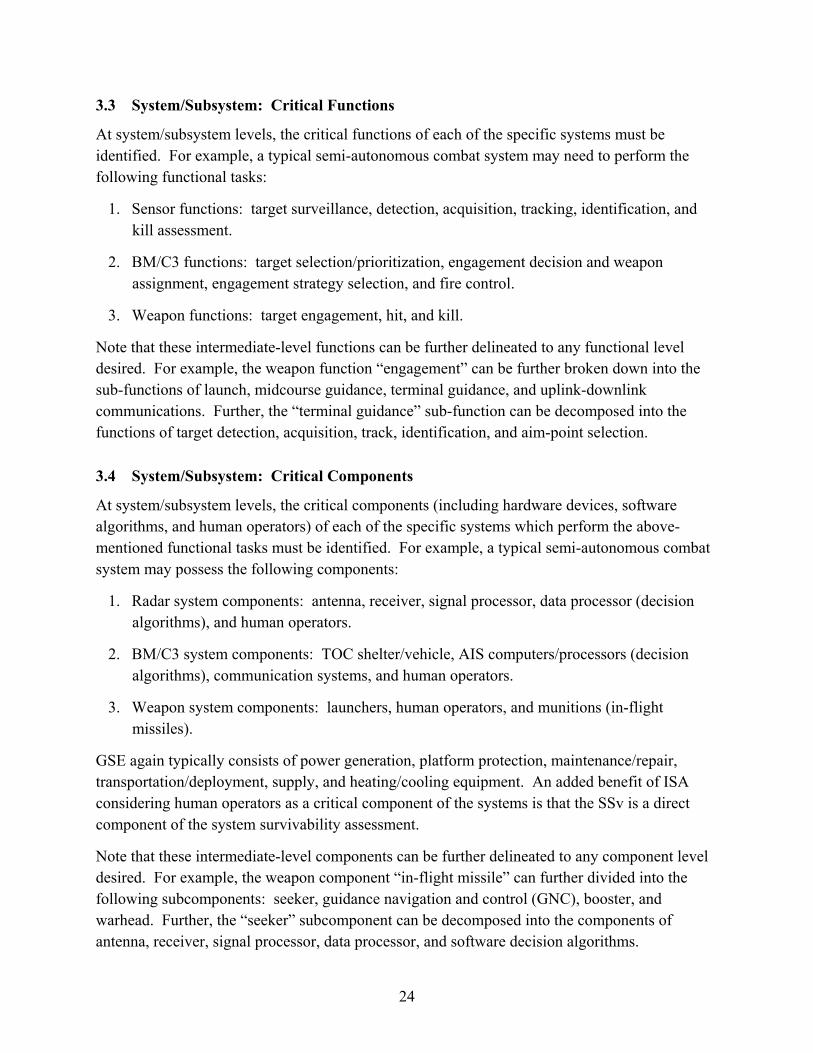
3.3 System/Subsystem: Critical Functions
At system/subsystem levels, the critical functions of each of the specific systems must be identified. For example, a typical semi-autonomous combat system may need to perform the following functional tasks:
1. Sensor functions: target surveillance, detection, acquisition, tracking, identification, and kill assessment.
2. BM/C3 functions: target selection/prioritization, engagement decision and weapon assignment, engagement strategy selection, and fire control.
3. Weapon functions: target engagement, hit, and kill.
Note that these intermediate-level functions can be further delineated to any functional level desired. For example, the weapon function “engagement” can be further broken down into the sub-functions of launch, midcourse guidance, terminal guidance, and uplink-downlink communications. Further, the “terminal guidance” sub-function can be decomposed into the functions of target detection, acquisition, track, identification, and aim-point selection.
3.4 System/Subsystem: Critical Components
At system/subsystem levels, the critical components (including hardware devices, software algorithms, and human operators) of each of the specific systems which perform the above-mentioned functional tasks must be identified. For example, a typical semi-autonomous combat system may possess the following components:
1. Radar system components: antenna, receiver, signal processor, data processor (decision algorithms), and human operators.
2. BM/C3 system components: TOC shelter/vehicle, AIS computers/processors (decision algorithms), communication systems, and human operators.
3. Weapon system components: launchers, human operators, and munitions (in-flight missiles).
GSE again typically consists of power generation, platform protection, maintenance/repair, transportation/deployment, supply, and heating/cooling equipment. An added benefit of ISA considering human operators as a critical component of the systems is that the SSv is a direct component of the system survivability assessment.
Note that these intermediate-level components can be further delineated to any component level desired. For example, the weapon component “in-flight missile” can further divided into the following subcomponents: seeker, guidance navigation and control (GNC), booster, and warhead. Further, the “seeker” subcomponent can be decomposed into the components of antenna, receiver, signal processor, data processor, and software decision algorithms.
24
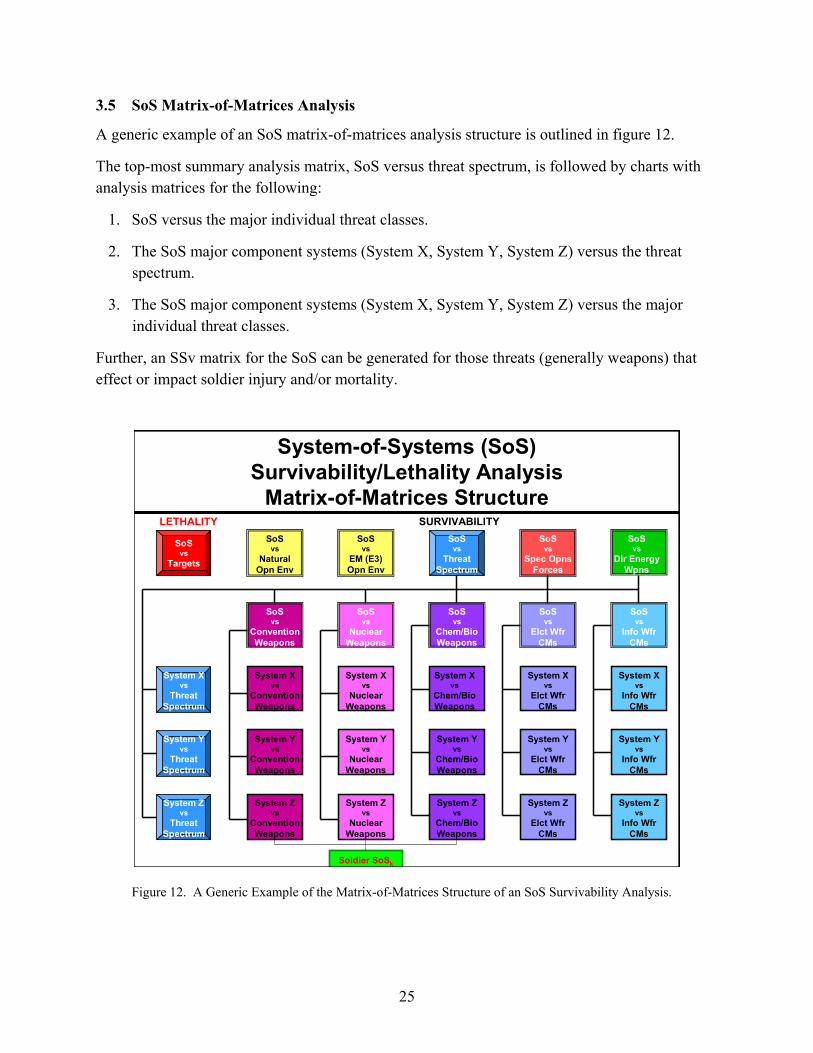
3.5 SoS Matrix-of-Matrices Analysis
A generic example of an SoS matrix-of-matrices analysis structure is outlined in figure 12.
The top-most summary analysis matrix, SoS versus threat spectrum, is followed by charts with analysis matrices for the following:
1. SoS versus the major individual threat classes.
2. The SoS major component systems (System X, System Y, System Z) versus the threat spectrum.
3. The SoS major component systems (System X, System Y, System Z) versus the major individual threat classes.
Further, an SSv matrix for the SoS can be generated for those threats (generally weapons) that effect or impact soldier injury and/or mortality.
SoSvs
EM (E3)Opn Env
SoSvs
Info WfrCMs
SoSvs
Elct WfrCMs
SoSvs
Chem/BioWeapons
SoSvs
Dir EnergyWpns
SoSvs
Spec OpnsForces
SoSvs
NuclearWeapons
SoSvs
ConventionWeapons
System Yvs
ThreatSpectrum
System Zvs
ThreatSpectrum
System Xvs
ThreatSpectrum
SoSvs
Targets
System Xvs
Info WfrCMs
System Yvs
Info WfrCMs
System Zvs
Info WfrCMs
System-of-Systems (SoS)Survivability/Lethality Analysis
Matrix-of-Matrices StructureSURVIVABILITY
System Zvs
ConventionWeapons
System Yvs
ConventionWeapons
System Xvs
ConventionWeapons
System Xvs
NuclearWeapons
System Yvs
NuclearWeapons
System Zvs
NuclearWeapons
System Xvs
Chem/BioWeapons
System Yvs
Chem/BioWeapons
System Xvs
Elct WfrCMs
System Yvs
Elct WfrCMs
System Zvs
Chem/BioWeapons
System Zvs
Elct WfrCMs
SoSvs
ThreatSpectrum
SoSvs
NaturalOpn Env
Soldier SoSk
LETHALITY
Figure 12. A Generic Example of the Matrix-of-Matrices Structure of an SoS Survivability Analysis.
25

Figure 13 provides a generic example SoS survivability analysis based on the threat spectrum. This matrix identifies the analyses required to evaluate the top-level SoS critical functions and components (systems/subsystems) versus the major individual weapon threat classes, CM threat classes, and hostile operational environment classes, for a particular scenario and timeframe.
An “O” indicates primary threat effects applicability—analyses required. (Note that damage/destruction weapon effects primarily impact components, while degradation/disruption CM effects primarily impact functions.) An “X” indicates function-to-component associated applicability—redundant analyses are not performed. The dashes indicate non-applicable system functions/components for a particular threat.
Threat Spectrum
Conventional Weapons
Nuclear Weapons
Chemical/Bio Weapons
Directed Energy Weapons
Special Opns Forces
Electronic Wfr CMs
Information Wfr CMs
EM (E3) Opn Evmts
Natural Opn Evmts
Threat
System-of-Systems (SoS)Survivability Analysis
> <Mission Functions Components (HW/SW)
FunctionA
FunctionB
FunctionC
SystemW
SystemX
SystemY
SystemZ
O
O
O
O
O
O
O
O
O
O
O
X
X
X
X
X
O
O
X
X
O
X
X
X
X
X
O
O
X
X
O
X
X
X
X
X
O
O
X
X
O
O
O
O
O
O
X
X
O
O
O
O
O
O
O
O
X
X
O
O
O
O
O
O
O
O
---
X
O
O
O
---
O
---
---
O
X
X
O
O
Attack /Defense
Threat Spectrum
Figure 13. A Template for an Analysis Matrix Showing a Top-Level SoS versus Threat Spectrum.
The top-left cell is the rolled-up aggregation result for the chart. The left column contains the rolled-up results for each row (threat class or operational environment class). The top row contains the rolled-up results for each column (system functions and components). Roll-up aggregation is based on the maximum function due to the independence and critical nature of
26

each cell (e.g., if any system critical function or component is incapacitated by a threat, then the whole system is incapacitated).
When using this template, an analyst applies color to the “O” cells to indicate the level of vulnerability risk as determined by the VRA analysis: red indicates high to very high; yellow indicates medium/moderate; and green indicates low to very low.
Figure 14 supplies a generic example of a matrix-of-matrices analysis structure for a given System X (SoS major subsystem). It is identical in structure to the SoS chart in figure 12. The top-most summary analysis matrix, System X versus threat spectrum, is followed by charts with analysis matrices for the following factors:
1. System X versus the major individual threat classes.
2. System X major component subsystems (sensors, weapons, and BM/C3) versus the threat spectrum.
3. System X major component subsystems (sensors, weapons, and BM/C3) versus the major individual threat classes.
Further, an SSv matrix for System X can be generated for those threats (generally weapons) that effect or impact soldier injury and/or mortality.
27

System Xvs
EM (E3)Opn Env
System Xvs
Info WfrCMs
System Xvs
Elct WfrCMs
System Xvs
Chem/BioWeapons
System Xvs
Dir EnergyWpns
System Xvs
Spec OpnsForces
System Xvs
NuclearWeapons
System Xvs
ConventionWeapons
Weapon Xnvs
ThreatSpectrum
BMC3 Xwvs
ThreatSpectrum
Sensor Xmvs
ThreatSpectrum
Weapon Xnvs
Targets
Sensor Xmvs
Info WfrCMs
Weapon Xnvs
Info WfrCMs
BMC3 Xwvs
Info WfrCMs
System XSurvivability/Lethality Analysis
Matrix-of-Matrices StructureSURVIVABILITY
BMC3 Xwvs
ConventionWeapons
Weapon Xnvs
ConventionWeapons
Sensor Xmvs
ConventionWeapons
Sensor Xmvs
NuclearWeapons
Weapon Xnvs
NuclearWeapons
BMC3 Xwvs
NuclearWeapons
Sensor Xmvs
Chem/BioWeapons
Weapon Xnvs
Chem/BioWeapons
Sensor Xmvs
Elct WfrCMs
Weapon Xnvs
Elct WfrCMs
BMC3 Xwvs
Chem/BioWeapons
BMC3 Xwvs
Elct WfrCMs
System Xvs
ThreatSpectrum
System Xvs
NaturalOpn Env
Soldier Xk
LETHALITY
Figure 14. Sample Structure for a System X Matrix-of-Matrices Analysis.
Figure 15 provides a generic example of the top-most summary analysis matrix, using System X versus threat spectrum. This matrix identifies the analyses required to evaluate the top-level System X critical functions and components (subsystems) versus the major individual weapon threat classes, CM threat classes, and hostile operational environment classes, for a particular scenario and timeframe.
The top-left cell is the rolled-up aggregation result for the chart. The left column contains the rolled-up results for each row (threat class and operational environment class). The top row contains the rolled-up results for each column (system functions and components). Roll-up aggregation is based on the maximum function due to the independence and critical nature of each cell (e.g., if any system critical function or component is incapacitated by a threat, then the whole system is incapacitated).
When using this template, an analyst applies color to the “O” cells to indicate the level of vulnerability risk as determined by the VRA analysis: red indicates high to very high; yellow indicates medium/moderate; and green indicates low to very low.
28

Threat Spectrum
Conventional Weapons
Nuclear Weapons
Chemical/Bio Weapons
Directed Energy Weapons
Special Opns Forces
Electronic Wfr CMs
Information Wfr CMs
EM (E3) Opn Evmts
Natural Opn Evmts
Threat
System XSurvivability Analysis
> <Mission Functions Components (HW/SW)
Sensor:Sch/Trk/ID
Btl Mgmt:FC/C3
Weapon:Egmt/Kill
Sensors& GSE
BMC3& GSE
Wpn Lchrs& GSE
Weapons[In Flight]
O
O
O
O
O
O
O
O
O
O
O
X
X
X
X
X
O
O
X
X
O
X
X
X
X
X
O
O
X
X
O
X
X
X
X
X
O
O
X
X
O
O
O
O
O
O
X
X
O
O
O
O
O
O
O
O
X
X
O
O
O
O
O
O
O
O
---
X
O
O
O
---
O
---
---
O
X
X
O
O
Attack /Defense
Threat Spectrum
Figure 15. A Template for an Analysis Matrix Using System X vs. Threat Spectrum.
With regards to the cells, an “O” indicates primary threat effects applicability—analyses required. (Note that damage/destruction weapon effects primarily impact components, while degradation/disruption CM effects primarily impact functions.) An “X” indicates function-to-component associated applicability—redundant analyses are not performed. The dashes indicate non-applicable system functions/components for a particular threat.
Figure 16 presents a generic threat class summary analysis matrix, using System X versus conventional weapons. The generic conventional-weapon threat class categories that are listed would be further expanded to include each individual conventional-weapon type to be evaluated. (The reconnaissance, surveillance, target acquisition (RSTA) threat category, generally required for conventional-weapon targeting, is included for completeness.) Threat class summary analysis matrices for other weapon threat classes or CM threat classes would be similar and, again, would list the associated individual weapon or CM categories and types.
This matrix identifies the analyses required to evaluate the top-level System X critical functions and components (subsystems) versus the conventional weapon threat class, for a particular scenario and timeframe. The top-left cell is the rolled-up aggregation result for the chart. The left column contains the rolled-up results for each row (threat category). The top row contains
29
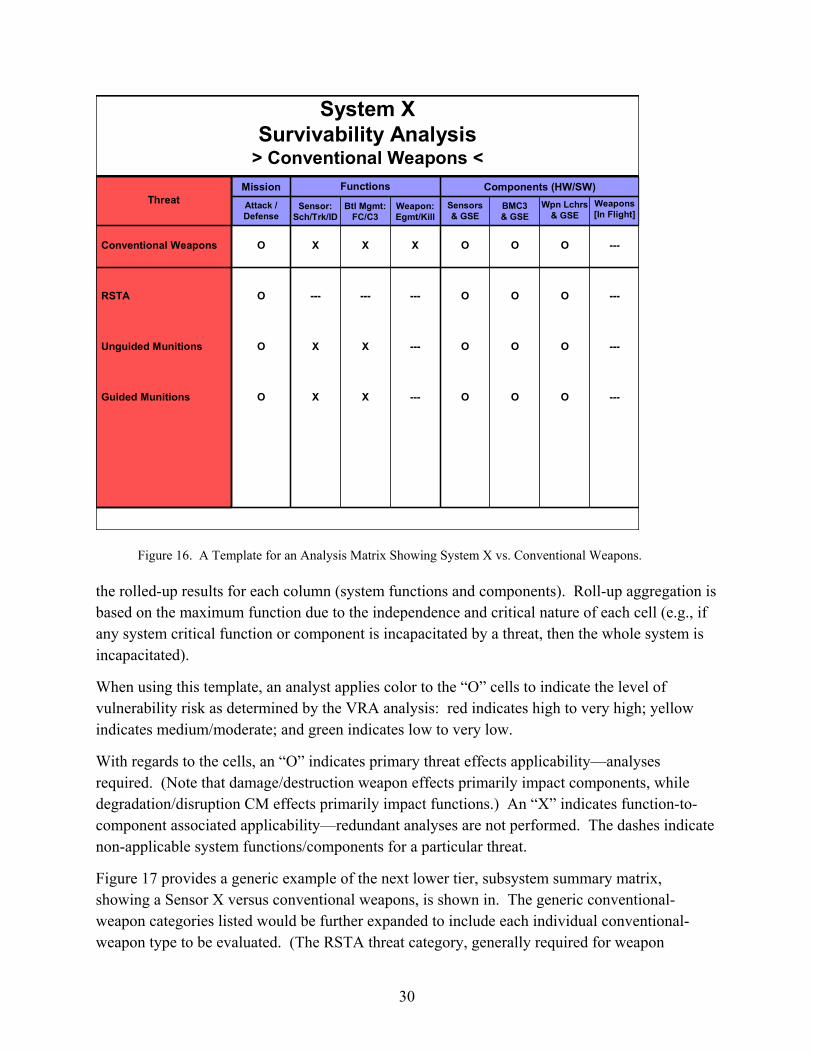
Conventional Weapons
RSTA
Unguided Munitions
Guided Munitions
Threat
System XSurvivability Analysis
> Conventional Weapons <Mission Functions Components (HW/SW)
O
O
O
O
X
---
X
X
X
---
X
X
X
---
---
---
O
O
O
O
O
O
O
O
O
O
O
O
---
---
---
---
Sensor:Sch/Trk/ID
Btl Mgmt:FC/C3
BMC3& GSE
Weapon:Egmt/Kill
Sensors& GSE
Wpn Lchrs& GSE
Attack /Defense
Weapons[In Flight]
Figure 16. A Template for an Analysis Matrix Showing System X vs. Conventional Weapons.
the rolled-up results for each column (system functions and components). Roll-up aggregation is based on the maximum function due to the independence and critical nature of each cell (e.g., if any system critical function or component is incapacitated by a threat, then the whole system is incapacitated).
When using this template, an analyst applies color to the “O” cells to indicate the level of vulnerability risk as determined by the VRA analysis: red indicates high to very high; yellow indicates medium/moderate; and green indicates low to very low.
With regards to the cells, an “O” indicates primary threat effects applicability—analyses required. (Note that damage/destruction weapon effects primarily impact components, while degradation/disruption CM effects primarily impact functions.) An “X” indicates function-to-component associated applicability—redundant analyses are not performed. The dashes indicate non-applicable system functions/components for a particular threat.
Figure 17 provides a generic example of the next lower tier, subsystem summary matrix, showing a Sensor X versus conventional weapons, is shown in. The generic conventional-weapon categories listed would be further expanded to include each individual conventional-weapon type to be evaluated. (The RSTA threat category, generally required for weapon
30
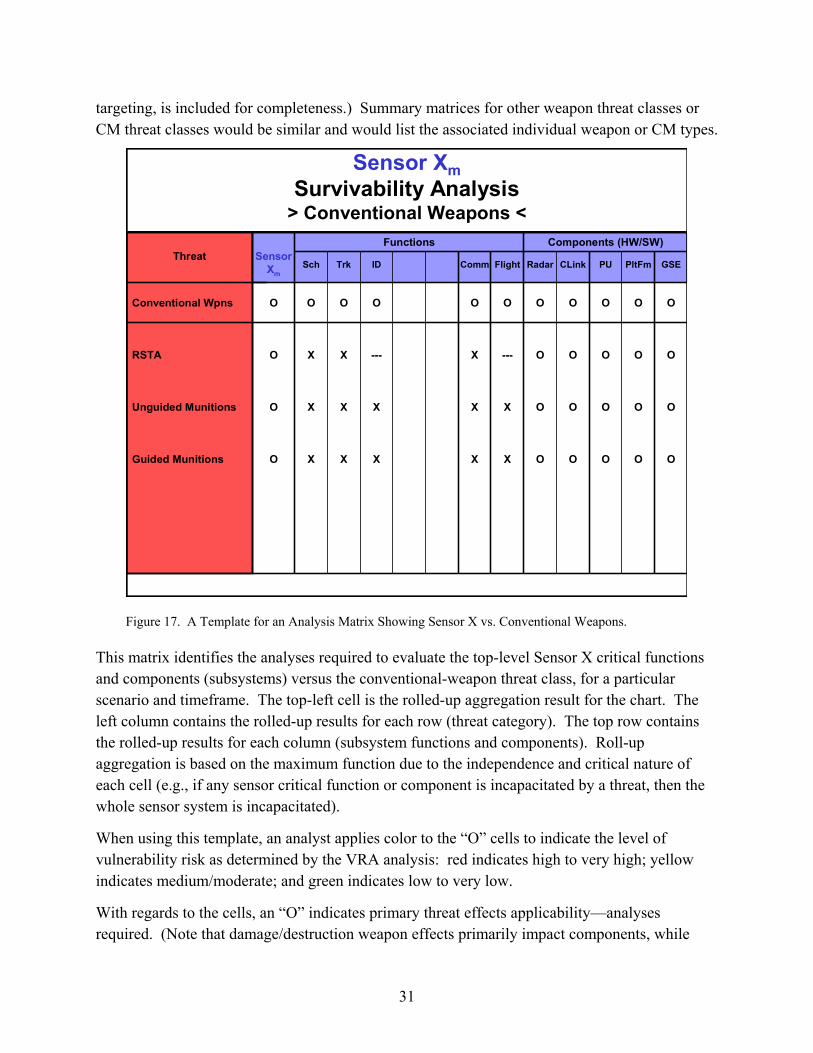
targeting, is included for completeness.) Summary matrices for other weapon threat classes or CM threat classes would be similar and would list the associated individual weapon or CM types.
Threat
Sensor XmSurvivability Analysis
> Conventional Weapons <Functions Components (HW/SW)
O
O
O
O
Conventional Wpns
RSTA
Unguided Munitions
Guided Munitions
O
X
X
X
O
X
X
X
O
---
X
X
O
X
X
X
O
---
X
X
O
O
O
O
O
O
O
O
O
O
O
O
O
O
O
O
O
O
O
O
Comm CLink PltFmPURadarIDTrkSch GSEFlightSensor
Xm
Figure 17. A Template for an Analysis Matrix Showing Sensor X vs. Conventional Weapons.
This matrix identifies the analyses required to evaluate the top-level Sensor X critical functions and components (subsystems) versus the conventional-weapon threat class, for a particular scenario and timeframe. The top-left cell is the rolled-up aggregation result for the chart. The left column contains the rolled-up results for each row (threat category). The top row contains the rolled-up results for each column (subsystem functions and components). Roll-up aggregation is based on the maximum function due to the independence and critical nature of each cell (e.g., if any sensor critical function or component is incapacitated by a threat, then the whole sensor system is incapacitated).
When using this template, an analyst applies color to the “O” cells to indicate the level of vulnerability risk as determined by the VRA analysis: red indicates high to very high; yellow indicates medium/moderate; and green indicates low to very low.
With regards to the cells, an “O” indicates primary threat effects applicability—analyses required. (Note that damage/destruction weapon effects primarily impact components, while
31
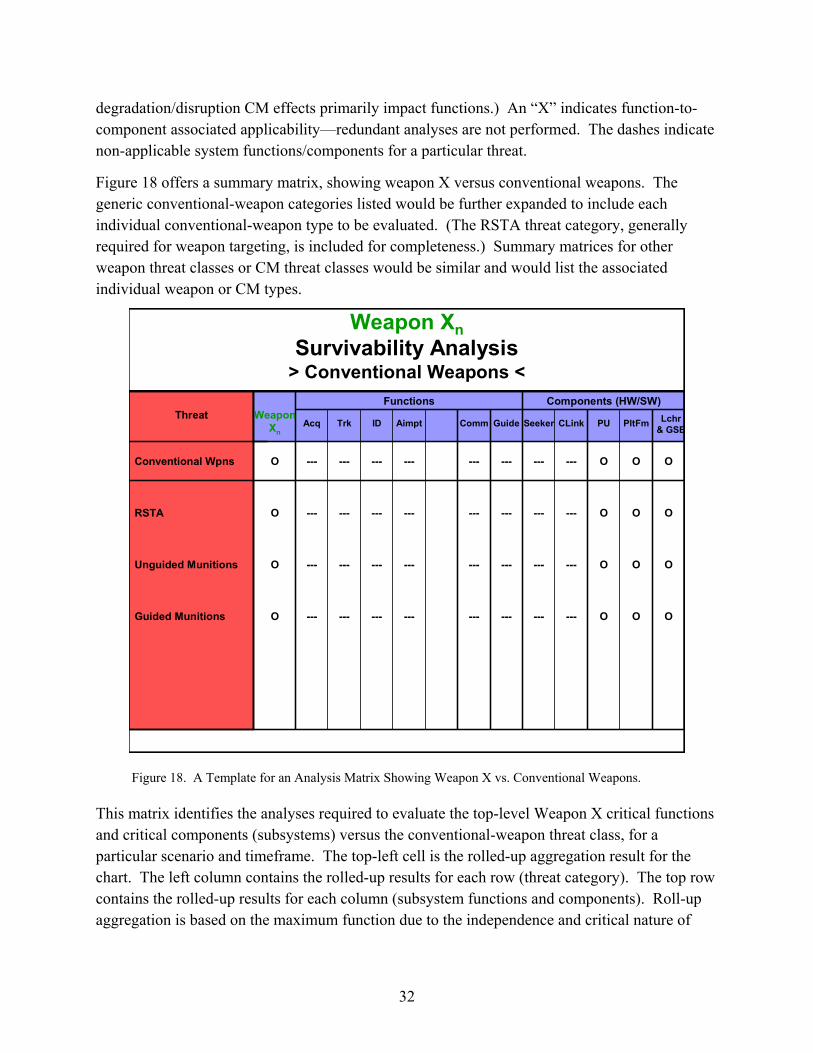
degradation/disruption CM effects primarily impact functions.) An “X” indicates function-to-component associated applicability—redundant analyses are not performed. The dashes indicate non-applicable system functions/components for a particular threat.
Figure 18 offers a summary matrix, showing weapon X versus conventional weapons. The generic conventional-weapon categories listed would be further expanded to include each individual conventional-weapon type to be evaluated. (The RSTA threat category, generally required for weapon targeting, is included for completeness.) Summary matrices for other weapon threat classes or CM threat classes would be similar and would list the associated individual weapon or CM types.
Threat
Weapon XnSurvivability Analysis
> Conventional Weapons <Functions Components (HW/SW)
Conventional Wpns
RSTA
Unguided Munitions
Guided Munitions
O
O
O
O
---
---
---
---
---
---
---
---
---
---
---
---
---
---
---
---
---
---
---
---
---
---
---
---
---
---
---
---
---
---
---
---
O
O
O
O
O
O
O
O
O
O
O
O
Guide PltFmPUSeekerCommAimptIDTrkAcq Lchr& GSECLink
WeaponXn
Figure 18. A Template for an Analysis Matrix Showing Weapon X vs. Conventional Weapons.
This matrix identifies the analyses required to evaluate the top-level Weapon X critical functions and critical components (subsystems) versus the conventional-weapon threat class, for a particular scenario and timeframe. The top-left cell is the rolled-up aggregation result for the chart. The left column contains the rolled-up results for each row (threat category). The top row contains the rolled-up results for each column (subsystem functions and components). Roll-up aggregation is based on the maximum function due to the independence and critical nature of
32
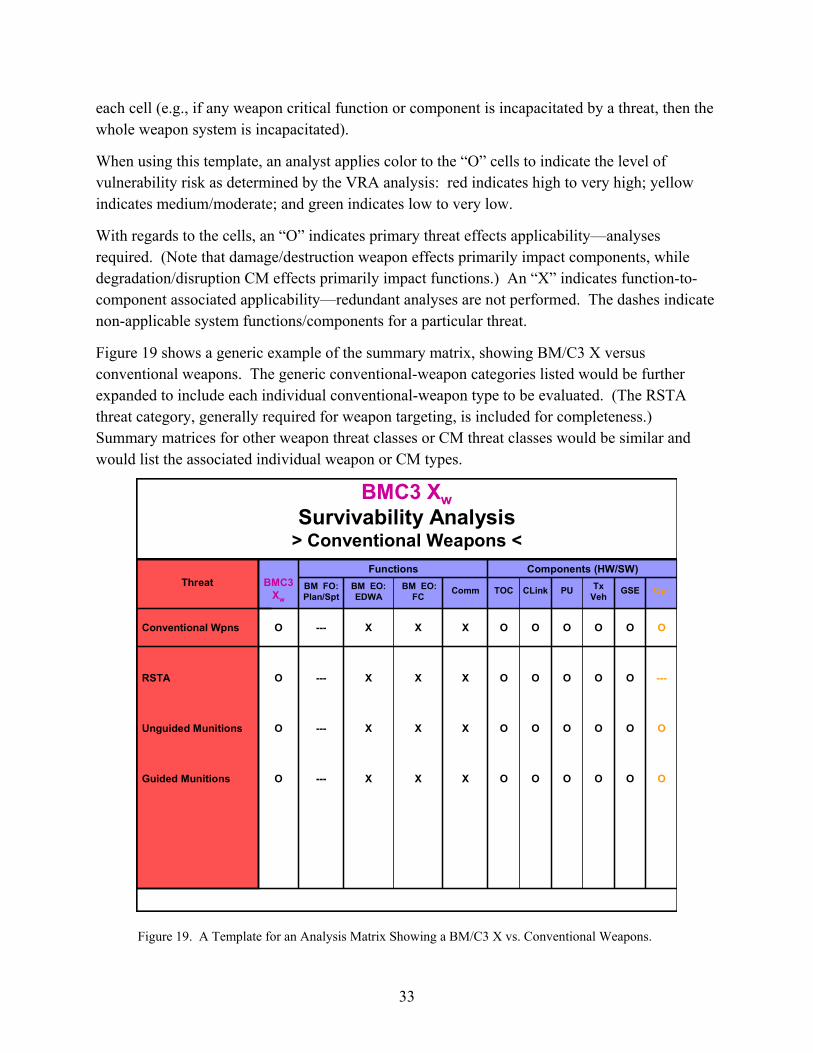
each cell (e.g., if any weapon critical function or component is incapacitated by a threat, then the whole weapon system is incapacitated).
When using this template, an analyst applies color to the “O” cells to indicate the level of vulnerability risk as determined by the VRA analysis: red indicates high to very high; yellow indicates medium/moderate; and green indicates low to very low.
With regards to the cells, an “O” indicates primary threat effects applicability—analyses required. (Note that damage/destruction weapon effects primarily impact components, while degradation/disruption CM effects primarily impact functions.) An “X” indicates function-to-component associated applicability—redundant analyses are not performed. The dashes indicate non-applicable system functions/components for a particular threat.
Figure 19 shows a generic example of the summary matrix, showing BM/C3 X versus conventional weapons. The generic conventional-weapon categories listed would be further expanded to include each individual conventional-weapon type to be evaluated. (The RSTA threat category, generally required for weapon targeting, is included for completeness.) Summary matrices for other weapon threat classes or CM threat classes would be similar and would list the associated individual weapon or CM types.
Threat
BMC3 XwSurvivability Analysis
> Conventional Weapons <
BMC3Xw
Functions Components (HW/SW)
Conventional Wpns
RSTA
Unguided Munitions
Guided Munitions
O
O
O
O
---
---
---
---
O
O
O
O
O
O
O
O
O
O
O
O
O
O
O
O
O
O
O
O
O
---
O
O
X
X
X
X
X
X
X
X
X
X
X
X
OprCommBM EO:FC
BM EO:EDWA
BM FO:Plan/Spt GSETOC PUCLink Tx
Veh
Figure 19. A Template for an Analysis Matrix Showing a BM/C3 X vs. Conventional Weapons.
33

This matrix identifies the analyses required to evaluate the top-level BM/C3 X critical functions and components (subsystems) versus the conventional-weapon threat class for a particular scenario and timeframe. The top-left cell is the rolled-up aggregation result for the chart. The left column contains the rolled-up results for each row (threat category). The top row contains the rolled-up results for each column (sub-functions and components). Roll-up aggregation is based on the maximum function due to the independence and critical nature of each cell (e.g., if any BM/C3 critical function or component is incapacitated by a threat, then the whole BM/C3 system is incapacitated).
When using this template, an analyst applies color to the “O” cells to indicate the level of vulnerability risk as determined by the VRA analysis: red indicates high to very high; yellow indicates medium/moderate; and green indicates low to very low.
With regards to the cells, an “O” indicates primary threat effects applicability—analyses required. (Note that damage/destruction weapon effects primarily impact components, while degradation/disruption CM effects primarily impact functions.) An “X” indicates function-to-component associated applicability—redundant analyses are not performed. The dashes indicate non-applicable system functions/components for a particular threat.
Note that the SSv is generated during the conduct of the system survivability assessment since the soldier is simply addressed as a system critical component (shown here as the BM/C3 system operator).
3.6 Survivability Equation
The ISA methodology, in addressing the survivability of a SoS, also allows for a generic SoS survivability equation to be derived, based on a combination of all of the performance probabilities for individual critical functions (in accordance with their defined independence) against individual threats. In this way, the probability of SoS functional survivability versus the integrated threat spectrum can be seen as the product of all the probabilities of functional survivability of all the individual critical functions versus all the individual threats (fig 20). Functional survivability can be further factored into (1) the capability to avoid the threat effects (as quantified by PENCOUNTER) and (2) the capability to withstand the threat effects (as quantified by PSUSCEPTIBLE) as defined in the VRA methodology.
34
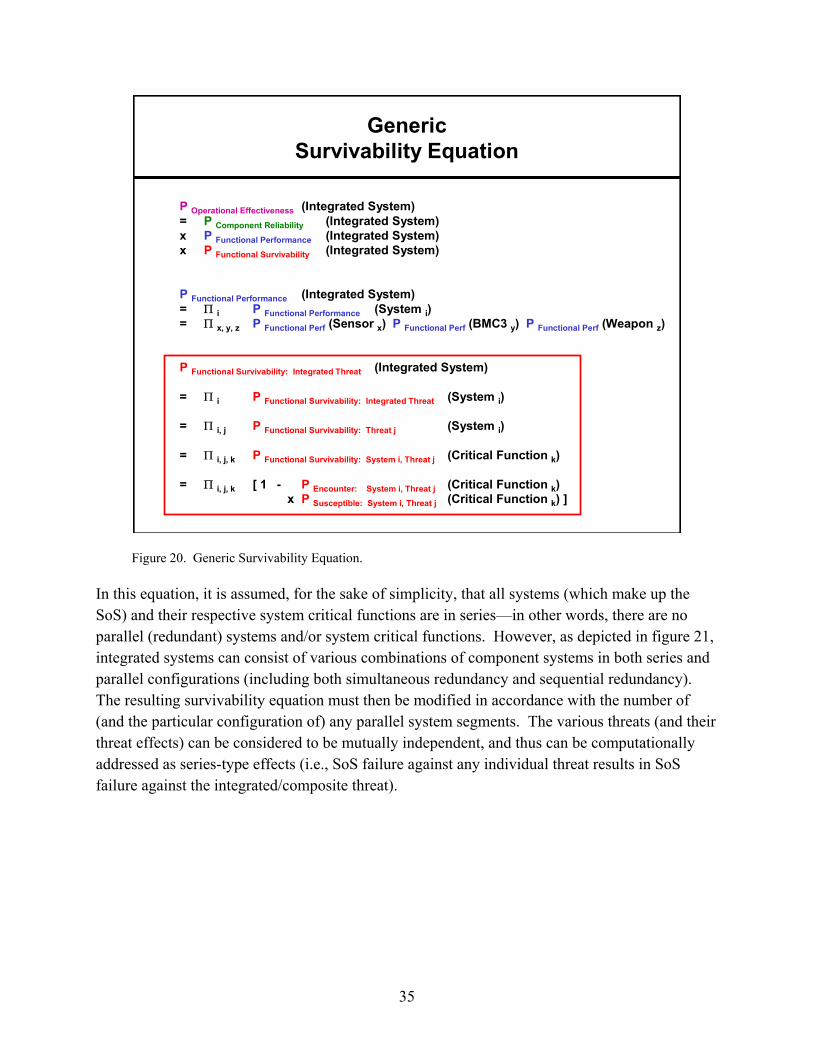
GenericSurvivability Equation
P Operational Effectiveness (Integrated System)= P Component Reliability (Integrated System)x P Functional Performance (Integrated System)x (Integrated System)
P Functional Performance (Integrated System)= Π i P Functional Performance (System i)= Π x, y, z P Functional Perf (Sensor x) P Functional Perf (BMC3 y) P Functional Perf (Weapon z)
(Integrated System)
= Π i (System i)
= Π i, j (System i)
= Π i, j, k (Critical Function k)
= Π i, j, k [ 1 - (Critical Function k)x (Critical Function k) ]
P Functional Survivability
P Functional Survivability: Integrated Threat
P Functional Survivability: Integrated Threat
P Functional Survivability: Threat j
P Functional Survivability: System i, Threat j
P Encounter: System i, Threat jP Susceptible: System i, Threat j
Figure 20. Generic Survivability Equation.
In this equation, it is assumed, for the sake of simplicity, that all systems (which make up the SoS) and their respective system critical functions are in series—in other words, there are no parallel (redundant) systems and/or system critical functions. However, as depicted in figure 21, integrated systems can consist of various combinations of component systems in both series and parallel configurations (including both simultaneous redundancy and sequential redundancy). The resulting survivability equation must then be modified in accordance with the number of (and the particular configuration of) any parallel system segments. The various threats (and their threat effects) can be considered to be mutually independent, and thus can be computationally addressed as series-type effects (i.e., SoS failure against any individual threat results in SoS failure against the integrated/composite threat).
35
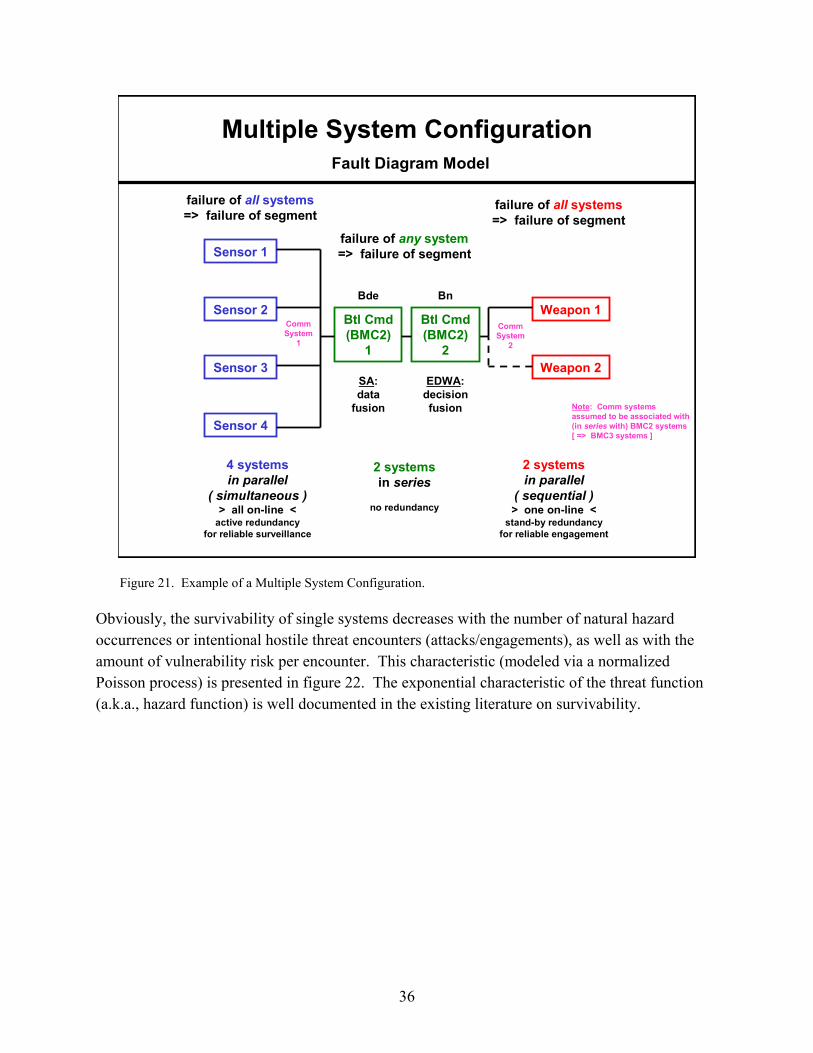
4 systemsin parallel
( simultaneous )> all on-line <
active redundancyfor reliable surveillance
Multiple System ConfigurationFault Diagram Model
Sensor 1
Sensor 2
Sensor 3
Sensor 4
Btl Cmd(BMC2)
1
2 systemsin series
no redundancy
in parallel( sequential )> one on-line <
stand-by redundancyfor reliable engagement
SA:data
fusion
failure of all systems=> failure of segment
failure of=> failure of segment
failure of any system=> failure of segment
Btl Cmd(BMC2)
2
EDWA:decisionfusion
Bde Bn
CommSystem
1
CommSystem
2
Note: Comm systems assumed to be associated with (in series with) BMC2 systems [ => BMC3 systems ]
Weapon 1
Weapon 2
2 systems
all systems
Figure 21. Example of a Multiple System Configuration.
Obviously, the survivability of single systems decreases with the number of natural hazard occurrences or intentional hostile threat encounters (attacks/engagements), as well as with the amount of vulnerability risk per encounter. This characteristic (modeled via a normalized Poisson process) is presented in figure 22. The exponential characteristic of the threat function (a.k.a., hazard function) is well documented in the existing literature on survivability.
36
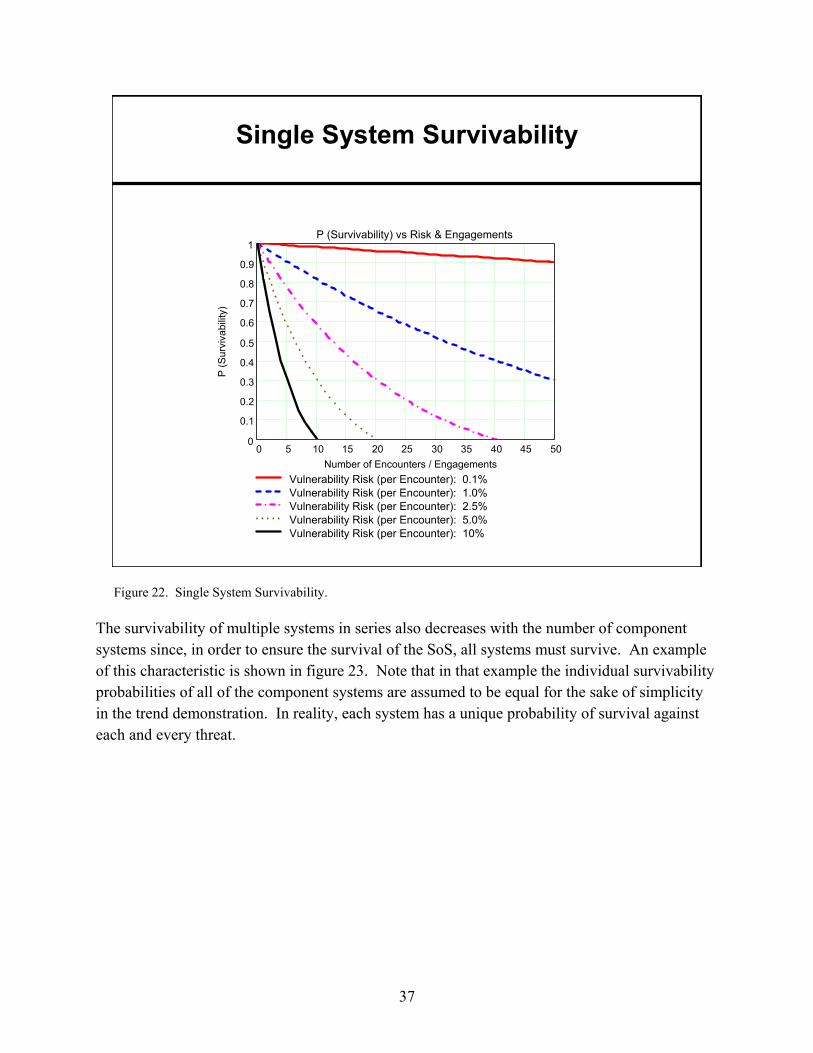
Single System Survivability
0 5 10 15 20 25 30 35 40 45 500
0.1
0.2
0.3
0.4
0.5
0.6
0.7
0.8
0.9
1
Vulnerability Risk (per Encounter): 0.1%Vulnerability Risk (per Encounter): 1.0%Vulnerability Risk (per Encounter): 2.5%Vulnerability Risk (per Encounter): 5.0%Vulnerability Risk (per Encounter): 10%
P (Survivability) vs Risk & Engagements
Number of Encounters / Engagements
P (S
urvi
vabi
lity)
Figure 22. Single System Survivability.
The survivability of multiple systems in series also decreases with the number of component systems since, in order to ensure the survival of the SoS, all systems must survive. An example of this characteristic is shown in figure 23. Note that in that example the individual survivability probabilities of all of the component systems are assumed to be equal for the sake of simplicity in the trend demonstration. In reality, each system has a unique probability of survival against each and every threat.
37
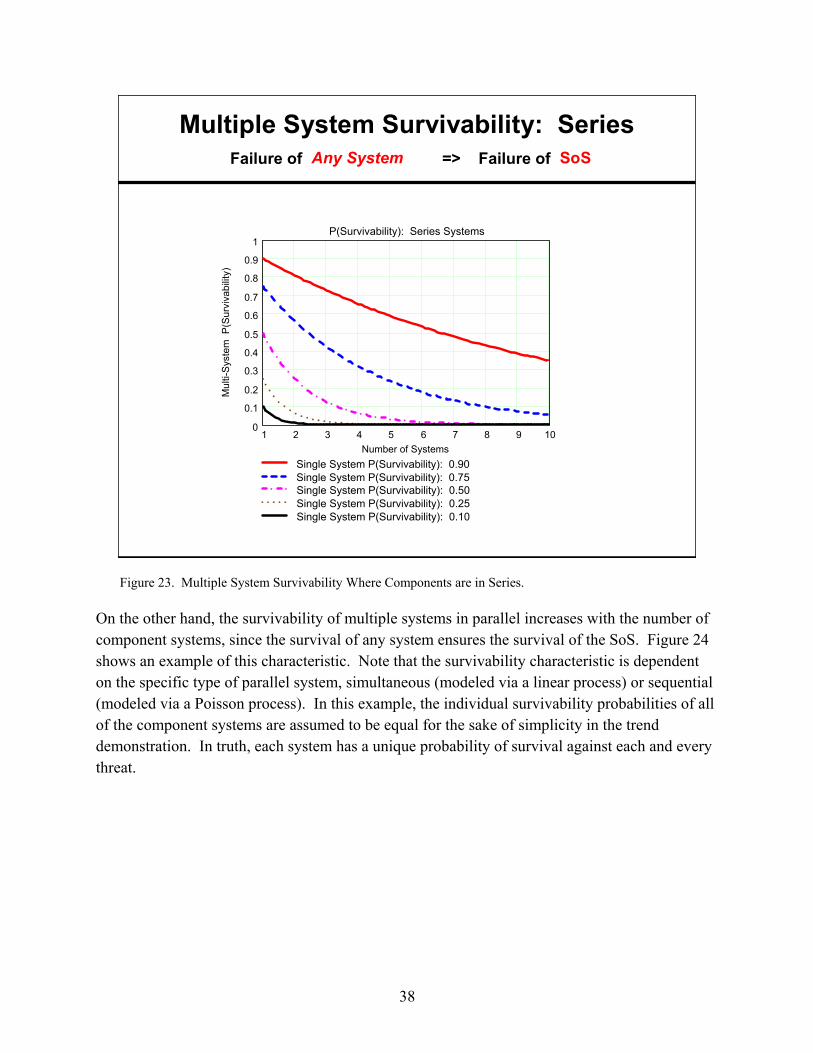
Multiple System Survivability: SeriesFailure of => Failure of
1 2 3 4 5 6 7 8 9 100
0.1
0.2
0.3
0.4
0.5
0.6
0.7
0.8
0.9
1
Single System P(Survivability): 0.90Single System P(Survivability): 0.75Single System P(Survivability): 0.50Single System P(Survivability): 0.25Single System P(Survivability): 0.10
P(Survivability): Series Systems
Number of Systems
Mul
ti-Sy
stem
P(S
urvi
vabi
lity)
Any System SoS
Figure 23. Multiple System Survivability Where Components are in Series.
On the other hand, the survivability of multiple systems in parallel increases with the number of component systems, since the survival of any system ensures the survival of the SoS. Figure 24 shows an example of this characteristic. Note that the survivability characteristic is dependent on the specific type of parallel system, simultaneous (modeled via a linear process) or sequential (modeled via a Poisson process). In this example, the individual survivability probabilities of all of the component systems are assumed to be equal for the sake of simplicity in the trend demonstration. In truth, each system has a unique probability of survival against each and every threat.
38

Sequential (Stand-By)Simultaneous (Active)
Multiple System Survivability: ParallelFailure of => Failure of
1 2 3 4 5 6 7 8 9 100
0.1
0.2
0.3
0.4
0.5
0.6
0.7
0.8
0.9
1
Kill Rate (Kills / Egmt): 1Kill Rate (Kills / Egmt): 2Kill Rate (Kills / Egmt): 3Kill Rate (Kills / Egmt): 5Kill Rate (Kills / Egmt): 10
P(Survivability): Parallel Systems (Seq)
Number of Systems
Mul
ti-Sy
stem
P(S
urvi
vabi
lity)
1 2 3 4 5 6 7 8 9 100
0.1
0.2
0.3
0.4
0.5
0.6
0.7
0.8
0.9
1
Single System P(Survivability): 0.90Single System P(Survivability): 0.75Single System P(Survivability): 0.50Single System P(Survivability): 0.25Single System P(Survivability): 0.10
P(Survivability): Parallel Systems (Sim)
Number of Systems
Mul
ti-Sy
stem
P(S
urvi
vabi
lity)
All Systems SoS
Figure 24. Multiple System Survivability Where the Components are in Parallel.
3.7 Survivability Sub-Metrics
Since it is based on critical function survivability assessment, the ISA methodology is able to provide simple, easy, and logical survivability sub-metrics for any level of system or SoS decomposition detail desired. Figure 25 provides equations for determining survivability sub-metric for a given system “i.” Thus, the probability of SoS survivability—expressed as P(ISS)—is the product of all of the probabilities of system “i” survivability—expressed as P(SiS). That, in turn, is the product of the critical-function survivability for system “i.” As a result, all of the analysis cells identified in the analysis matrices represent functional survivability analysis sub-metrics. Selection of the analysis matrix level automatically results in the selection of the analysis metric level.
For example, for a given Threat A, a SoS Sensor (Level 2; where the Integrated SoS is Level 1) survivability analysis metric is identified by the “integrated sensor function versus Threat A” cell in the SoS analysis matrix; a SoS Sensor Function (Level 3) survivability analysis metric is identified by the “integrated sensor acquisition function versus Threat A” cell in the SoS analysis matrix; and so on down to any level of decomposition detail desired. Using figure 17 as an
39
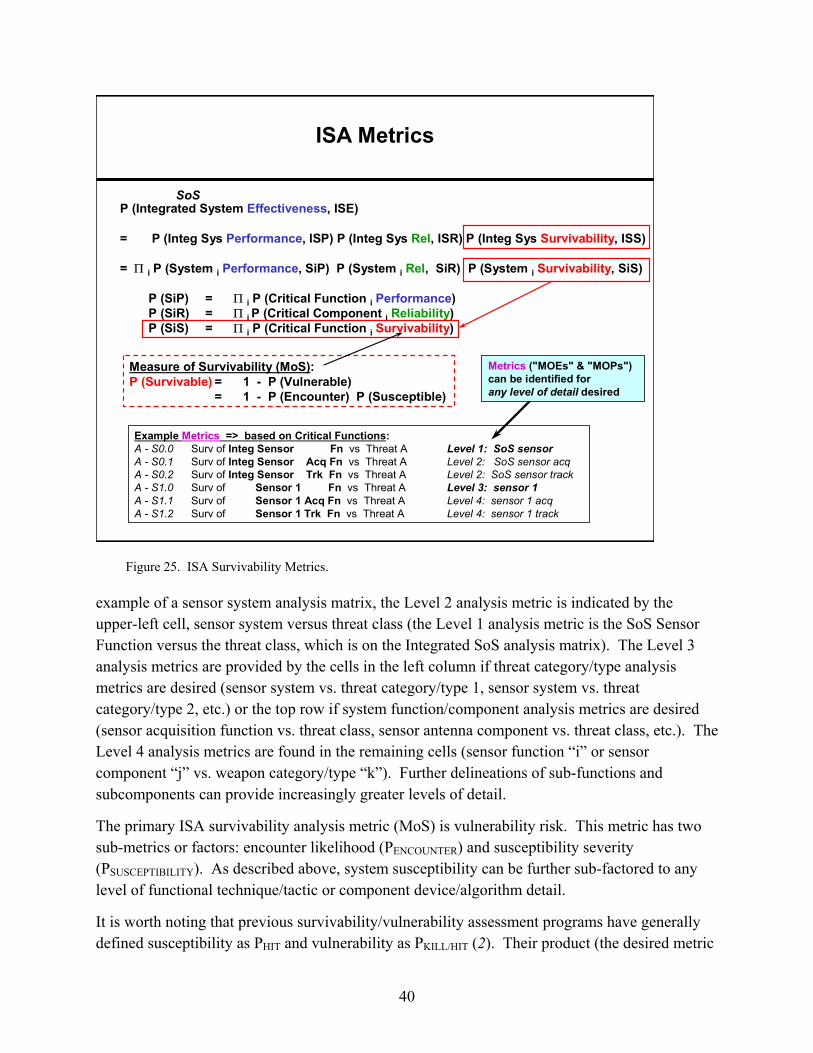
ISA Metrics
P (Integrated System Effectiveness, ISE)
= P (Integ Sys Performance, ISP) P (Integ Sys Rel, ISR) P (Integ Sys SS)
= Π i P (System i Performance, SiP) P (System i Rel, SiR) P (System i
P (SiP) = Π i P (Critical Function i Performance)P (SiR) = Π i P (Critical Component i Reliability)P (SiS) = Π i P (Critical Function i
Example Metrics => based on Critical Functions:A - S0.0 Surv of Integ Sensor Fn vs Threat A Level 1: SoS sensorA - S0.1 Surv of Integ Sensor Acq Fn vs Threat A Level 2: SoS sensor acqA - S0.2 Surv of Integ Sensor Trk Fn vs Threat A Level 2: SoS sensor trackA - S1.0 Surv of Sensor 1 Fn vs Threat A Level 3: sensor 1A - S1.1 Surv of Sensor 1 Acq Fn vs Threat A Level 4: sensor 1 acqA - S1.2 Surv of Sensor 1 Trk Fn vs Threat A Level 4: sensor 1 track
Measure of Survivability (MoS):= 1 - P (Vulnerable)= 1 - P (Encounter) P (Susceptible)
SoS
Metrics ("MOEs" & "MOPs")can be identified forany level of detail desired
Survivability, I
Survivability, SiS)
Survivability)
P (Survivable)
Figure 25. ISA Survivability Metrics.
example of a sensor system analysis matrix, the Level 2 analysis metric is indicated by the upper-left cell, sensor system versus threat class (the Level 1 analysis metric is the SoS Sensor Function versus the threat class, which is on the Integrated SoS analysis matrix). The Level 3 analysis metrics are provided by the cells in the left column if threat category/type analysis metrics are desired (sensor system vs. threat category/type 1, sensor system vs. threat category/type 2, etc.) or the top row if system function/component analysis metrics are desired (sensor acquisition function vs. threat class, sensor antenna component vs. threat class, etc.). The Level 4 analysis metrics are found in the remaining cells (sensor function “i” or sensor component “j” vs. weapon category/type “k”). Further delineations of sub-functions and subcomponents can provide increasingly greater levels of detail.
The primary ISA survivability analysis metric (MoS) is vulnerability risk. This metric has two sub-metrics or factors: encounter likelihood (PENCOUNTER) and susceptibility severity (PSUSCEPTIBILITY). As described above, system susceptibility can be further sub-factored to any level of functional technique/tactic or component device/algorithm detail.
It is worth noting that previous survivability/vulnerability assessment programs have generally defined susceptibility as PHIT and vulnerability as PKILL/HIT (2). Their product (the desired metric
40
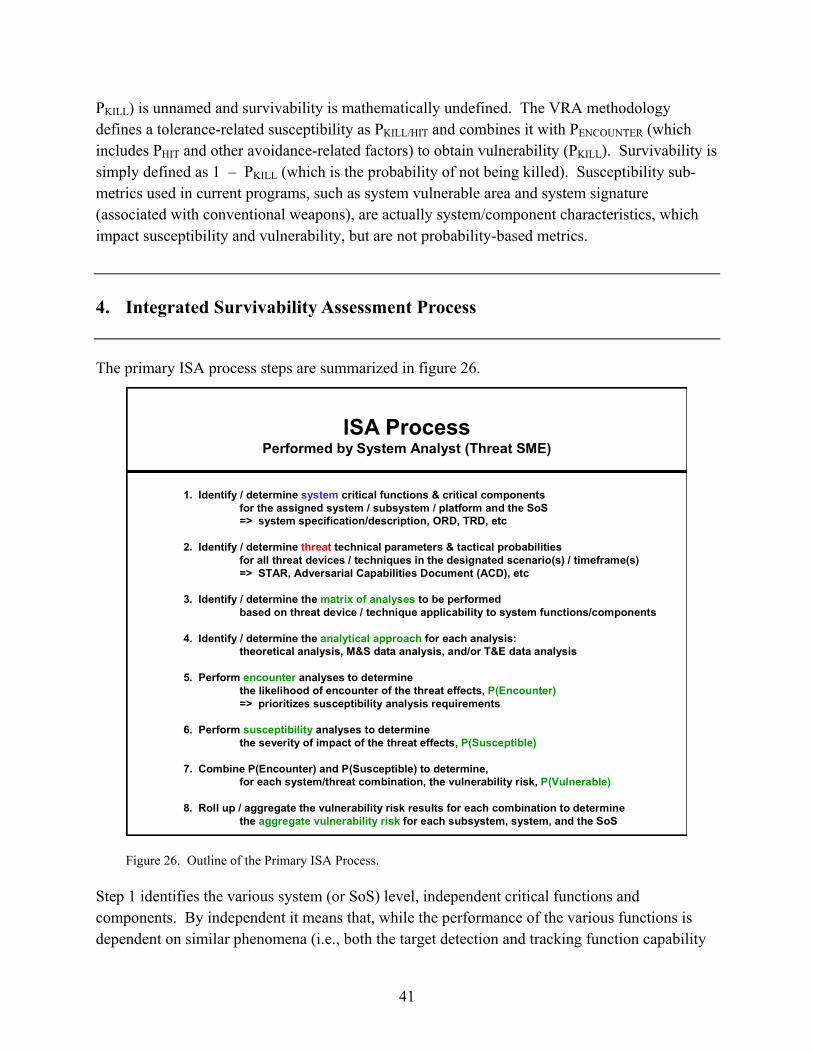
PKILL) is unnamed and survivability is mathematically undefined. The VRA methodology defines a tolerance-related susceptibility as PKILL/HIT and combines it with PENCOUNTER (which includes PHIT and other avoidance-related factors) to obtain vulnerability (PKILL). Survivability is simply defined as 1 – PKILL (which is the probability of not being killed). Susceptibility sub-metrics used in current programs, such as system vulnerable area and system signature (associated with conventional weapons), are actually system/component characteristics, which impact susceptibility and vulnerability, but are not probability-based metrics.
4. Integrated Survivability Assessment Process
The primary ISA process steps are summarized in figure 26.
ISA ProcessPerformed by System Analyst (Threat SME)
1. Identify / determine system critical functions & critical components for the assigned system / subsystem / platform and the SoS=> system specification/description, ORD, TRD, etc
2. Identify / determine technical parameters & tactical probabilitiesfor all threat devices / techniques in the designated scenario(s) / timeframe(s)=> STAR, Adversarial Capabilities Document (ACD), etc
3. Identify / determine the matrix of analyses to be performedbased on threat device / technique applicability to system functions/components
4. Identify / determine the analytical approach for each analysis:theoretical analysis, M&S data analysis, and/or T&E data analysis
5. Perform encounter analyses to determine the likelihood of encounter of the threat effects, P(Encounter)=> prioritizes susceptibility analysis requirements
6. Perform susceptibility analyses to determine the severity of impact of the threat effects, P(Susceptible)
7. Combine P(Encounter) and P(Susceptible) to determine, for each system/threat combination, the vulnerability risk, P(Vulnerable)
8. Roll up / aggregate the vulnerability risk results for each combination to determinethe aggregate vulnerability risk for each subsystem, system, and the SoS
threat
Figure 26. Outline of the Primary ISA Process.
Step 1 identifies the various system (or SoS) level, independent critical functions and components. By independent it means that, while the performance of the various functions is dependent on similar phenomena (i.e., both the target detection and tracking function capability
41

are effected by atmospheric propagation), each function must be still performed by independent hardware devices or software algorithms.
Step 2 determines the various technical parameters and tactical probabilities for threats within all designated scenarios and timeframes. This information is typically provided by the threat intelligence community.
Step 3 defines the matrix of analyses to be performed based on threat device/technique applicability to system functions and components. Normally, only functional or component analysis (not both) is required, since weapon threats primarily cause damage/destruction of components and CM threats primarily cause degradation/disruption of functions.
Step 4 delineates the analytical approach for each analysis (theoretical, M&S, and/or T&E). Theoretical analysis is necessary, as a minimum, to provide bounds for the performance predictions and to provide verification, validation, and accreditation baselines for M&S and T&E results. The appropriate level and type of M&S and T&E emulation—constructive: equipment and operator both modeled; virtual: equipment modeled, operator real; live: equipment and operator both real—depends greatly on the level of system integration being examined. At the force-on-force modeling level, the decreasing relevance of attrition-based ground force warfare and the increasing importance of preparation/shaping of the battlefield by air forces and SOF (and military operations in urban terrain) can greatly impact M&S practicality.
Step 5 performs the encounter analyses to determine the likelihood of encounter for threat effects. The PENCOUNTER analyses also serve to prioritize the susceptibility analysis requirements and to mitigate the combinatorial explosion of required analyses by indicating those cases which obviously can only result in low PVULNERABLE values.
Step 6 performs the susceptibility analyses to determine the severity of impact of the threat effects (PSUSCEPTIBLE). This step uses the analytical approaches identified in Step 4.
Step 7 combines P ENCOUNTER and P SUSCEPTIBLE to determine the vulnerability risk (P VULNERABLE) for each system/threat combination. The confidence analyses for both P ENCOUNTER and PSUSCEPTIBLE are also combined to indicate the confidence in the P VULNERABLE results based on the level of adequacy of the available data or analyses.
Step 8 aggregates the vulnerability risk results for all analyses to determine the total vulnerability risk for each subsystem, system, and the SoS. This is a straight-forward operation based on the maximum function due to the independence and critical nature of each cell (e.g., if any system critical function or component is incapacitated by a threat, then the whole system is incapacitated).
Figure 27 presents an example MoS vulnerability risk calculation, based on the VRA methodology, for a notional ground-combat weapon system versus a notional mainlobe IRCM EW CM technique. The example depicts the simple processes, definitions, and mathematics
42
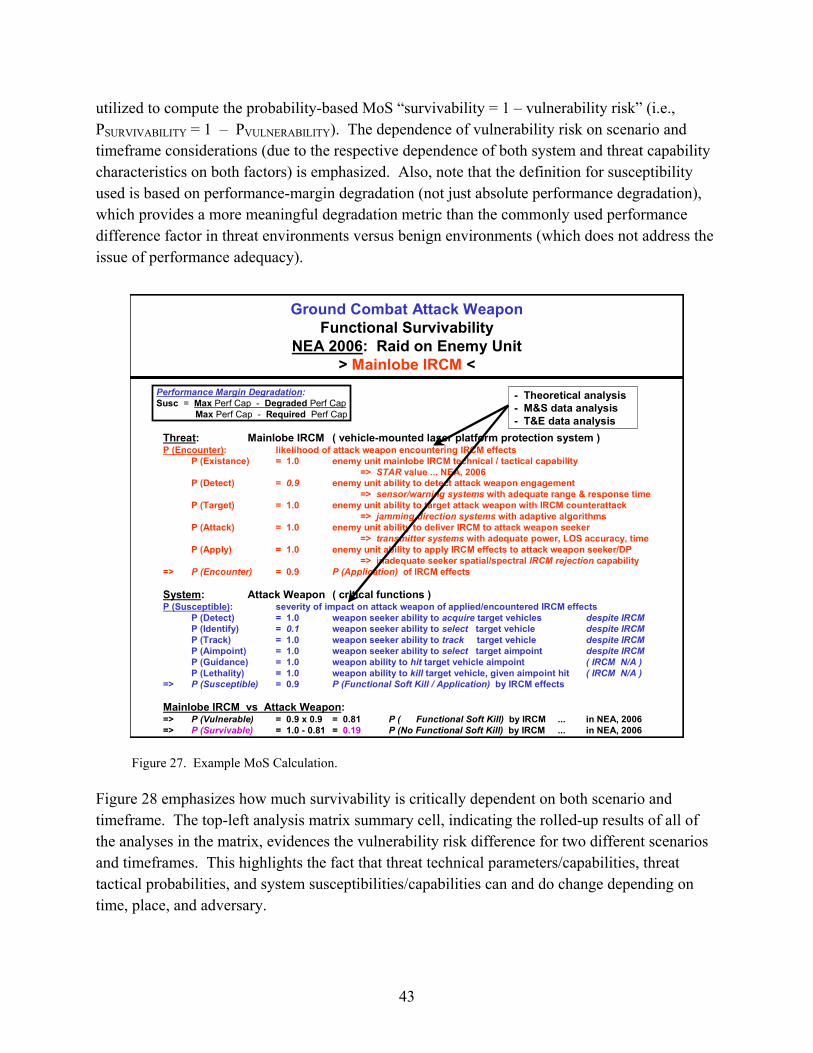
utilized to compute the probability-based MoS “survivability = 1 – vulnerability risk” (i.e., PSURVIVABILITY = 1 – PVULNERABILITY). The dependence of vulnerability risk on scenario and timeframe considerations (due to the respective dependence of both system and threat capability characteristics on both factors) is emphasized. Also, note that the definition for susceptibility used is based on performance-margin degradation (not just absolute performance degradation), which provides a more meaningful degradation metric than the commonly used performance difference factor in threat environments versus benign environments (which does not address the issue of performance adequacy).
- Theoretical analysis- M&S data analysis- T&E data analysis
Threat: Mainlobe IRCM ( vehicle-mounted laser platform protection system )P (Encounter): likelihood of attack weapon encountering IRCM effects
P (Existance) = 1.0 enemy unit mainlobe IRCM technical / tactical capability=> STAR value ... NEA, 2006
P (Detect) = 0.9 enemy unit ability to detect attack weapon engagement=> sensor/warning systems with adequate range & response time
P (Target) = 1.0 enemy unit ability to target attack weapon with IRCM counterattack=> jamming direction systems with adaptive algorithms
P (Attack) = 1.0 enemy unit ability to deliver IRCM to attack weapon seeker=> transmitter systems with adequate power, LOS accuracy, time
P (Apply) = 1.0 enemy unit ability to apply IRCM effects to attack weapon seeker/DP=> inadequate seeker spatial/spectral IRCM rejection capability
=> P (Encounter) = 0.9 P (Application) of IRCM effects
System: Attack Weapon ( critical functions )P (Susceptible): severity of impact on attack weapon of applied/encountered IRCM effects
P (Detect) = 1.0 weapon seeker ability to acquire target vehicles despite IRCMP (Identify) = 0.1 weapon seeker ability to select target vehicle despite IRCMP (Track) = 1.0 weapon seeker ability to track target vehicle despite IRCMP (Aimpoint) = 1.0 weapon seeker ability to select target aimpoint despite IRCMP (Guidance) = 1.0 weapon ability to hit target vehicle aimpoint ( IRCM N/A )P (Lethality) = 1.0 weapon ability to kill target vehicle, given aimpoint hit ( IRCM N/A )
=> P (Susceptible) = 0.9 P (Functional Soft Kill / Application) by IRCM effects
Mainlobe IRCM vs Attack Weapon:=> P (Vulnerable) = 0.9 x 0.9 = 0.81 P ( Functional Soft Kill) by IRCM ... in NEA, 2006=> P (Survivable) = 1.0 - 0.81 = 0.19 P (No Functional Soft Kill) by IRCM ... in NEA, 2006
Ground Combat Attack WeaponFunctional Survivability
NEA 2006: Raid on Enemy Unit> Mainlobe IRCM <
Performance Margin Degradation:Susc = Max Perf Cap - Degraded Perf Cap
Max Perf Cap - Required Perf Cap
Figure 27. Example MoS Calculation.
Figure 28 emphasizes how much survivability is critically dependent on both scenario and timeframe. The top-left analysis matrix summary cell, indicating the rolled-up results of all of the analyses in the matrix, evidences the vulnerability risk difference for two different scenarios and timeframes. This highlights the fact that threat technical parameters/capabilities, threat tactical probabilities, and system susceptibilities/capabilities can and do change depending on time, place, and adversary.
43

Threat Spectrum
EW CMs
IW CMs
Conv Weapons
Nucl Weapons
Ch/B Weapons
ThreatMission Functions Components (HW/SW)
Sensor:Sch/Trk/ID
Btl Cmd:FC/C3
Weapon:Engage
UAV 1& GSE
C2V& GSE
NetFires& GSE
O
O
O
O
O
O
O
O
O
X
X
X
O
O
O
X
X
X
O
O
O
X
X
X
O
X
X
O
O
O
O
X
X
O
O
O
O
X
X
O
O
O
GroundCombat
Threat Spectrum
EW CMs
IW CMs
Conv Weapons
Nucl Weapons
Ch/B Weapons
ThreatMission Functions Components (HW/SW)
Sensor:Sch/Trk/ID
Btl Cmd:FC/C3
Weapon:Engage
UAV 1& GSE
C2V& GSE
NetFires& GSE
O
O
O
O
O
O
O
O
O
X
X
X
O
O
O
X
X
X
O
O
O
X
X
X
O
X
X
O
O
O
O
X
X
O
O
O
O
X
X
O
O
O
GroundCombat
Survivability is Dependent onScenario & Timeframe
NEA 2006:High Vuln Risk
SWA 2010:Med Vuln Risk
Figure 28. Example Survivability Dependence on Scenario and Timeframe.
An example of how the ISA methodology can be applied to a notional combat system kill-chain subsystem (defined here as the smallest subsystem of a SoS capable of conducting independent combat engagement operations) is depicted in figure 29. This matrix represents the top-level summary analysis matrix for the kill-chain subsystem versus the threat spectrum. At a glance, it is easy to see that the hard-kill weapon threats were analyzed against the system critical components (note that the system critical functions performed by these components are indicated by an X) and that the soft-kill CM threats were analyzed against the system critical functions (note that the system critical components that perform these functions are indicated by an X). The only weapon threat class of concern is the nuclear weapon threat class, which causes a moderate vulnerability risk to the C2 vehicle. The CM threat class is of higher concern due to the moderate vulnerability risk of the sensor function to IW CMs and due to the high vulnerability risk of the weapon function to EW CMs, the latter of which results in the overall high vulnerability risk for the subsystem versus the threat spectrum (upper-left analysis cell).
44
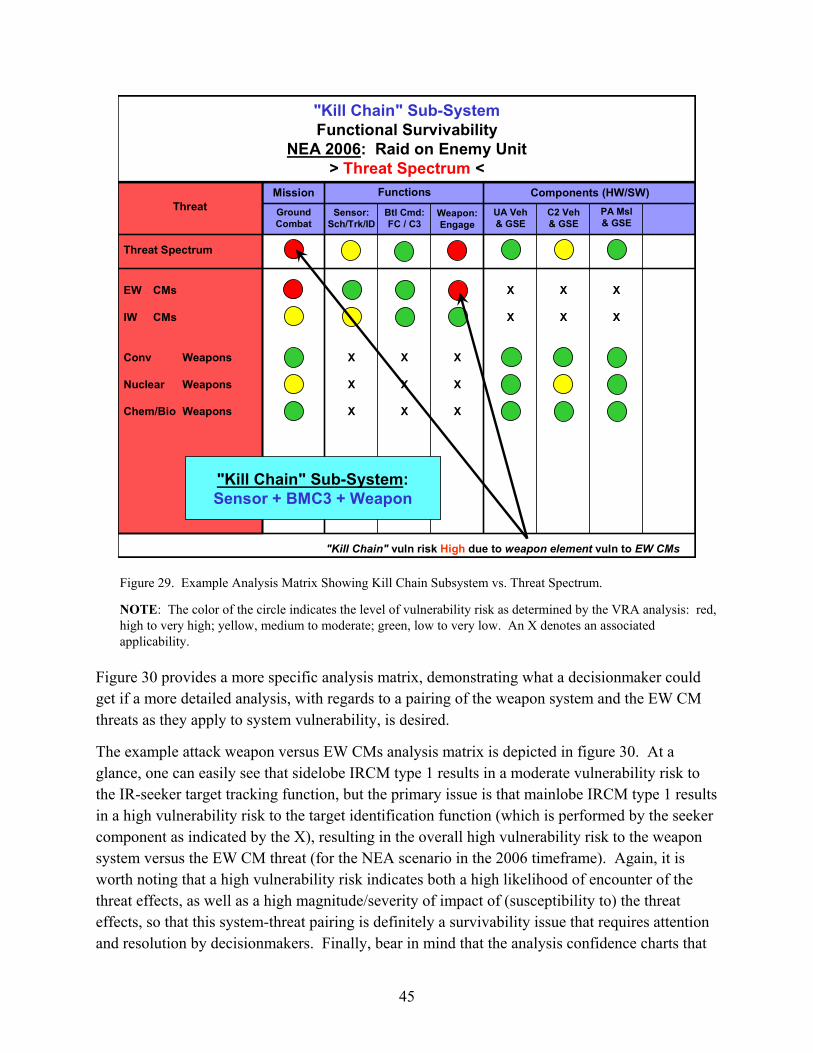
Threat Spectrum
EW CMs
IW CMs
Conv Weapons
Nuclear Weapons
Chem/Bio Weapons
ThreatMission Functions Components (HW/SW)
Sensor:Sch/Trk/ID
Btl Cmd:FC / C3
Weapon:Engage
UA Veh& GSE
C2 Veh& GSE
PA Msl& GSE
O
O
O
O
O
O
O
O
O
X
X
X
O
O
O
X
X
X
O
O
O
X
X
X
O
X
X
O
O
O
O
X
X
O
O
O
O
X
X
O
O
O
GroundCombat
"Kill Chain" Sub-SystemFunctional Survivability
NEA 2006: Raid on Enemy Unit> <
"Kill Chain" vuln risk High due to weapon element vuln to EW CMs
"Kill Chain" Sub-System:Sensor + BMC3 + Weapon
Threat Spectrum
Figure 29. Example Analysis Matrix Showing Kill Chain Subsystem vs. Threat Spectrum.
NOTE: The color of the circle indicates the level of vulnerability risk as determined by the VRA analysis: red, high to very high; yellow, medium to moderate; green, low to very low. An X denotes an associated applicability.
Figure 30 provides a more specific analysis matrix, demonstrating what a decisionmaker could get if a more detailed analysis, with regards to a pairing of the weapon system and the EW CM threats as they apply to system vulnerability, is desired.
The example attack weapon versus EW CMs analysis matrix is depicted in figure 30. At a glance, one can easily see that sidelobe IRCM type 1 results in a moderate vulnerability risk to the IR-seeker target tracking function, but the primary issue is that mainlobe IRCM type 1 results in a high vulnerability risk to the target identification function (which is performed by the seeker component as indicated by the X), resulting in the overall high vulnerability risk to the weapon system versus the EW CM threat (for the NEA scenario in the 2006 timeframe). Again, it is worth noting that a high vulnerability risk indicates both a high likelihood of encounter of the threat effects, as well as a high magnitude/severity of impact of (susceptibility to) the threat effects, so that this system-threat pairing is definitely a survivability issue that requires attention and resolution by decisionmakers. Finally, bear in mind that the analysis confidence charts that
45
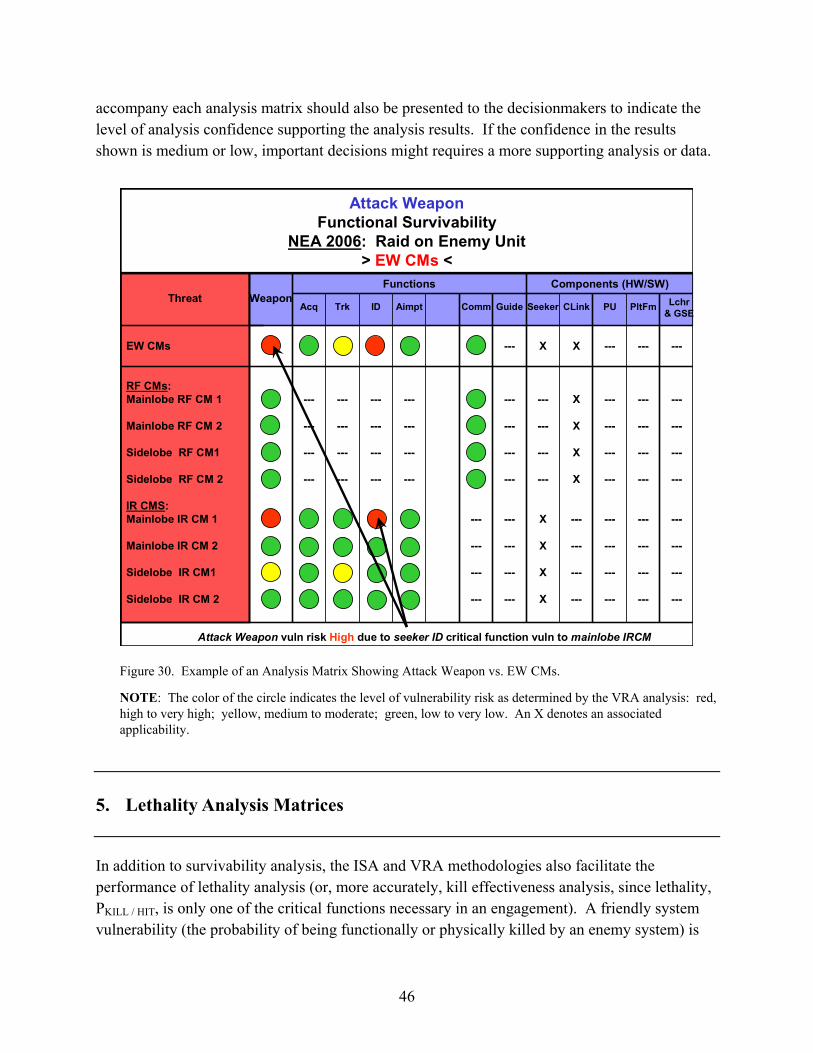
accompany each analysis matrix should also be presented to the decisionmakers to indicate the level of analysis confidence supporting the analysis results. If the confidence in the results shown is medium or low, important decisions might requires a more supporting analysis or data.
ThreatFunctions Components (HW/SW)
O
---
---
---
---
O
O
O
O
O
---
---
---
---
O
O
O
O
O
O
O
O
O
O
O
O
O
O
---
---
---
---
O
O
O
O
O
---
---
---
---
O
O
O
O
O
O
O
O
O
---
---
---
---
---
---
---
---
---
---
---
---
---
X
---
---
---
---
X
X
X
X
X
X
X
X
X
---
---
---
---
---
---
---
---
---
---
---
---
---
---
---
---
---
---
---
---
---
---
---
---
---
---
---
---
---
---
---
Guide PltFmPUSeekerCommAimptIDTrkAcq Lchr& GSECLink
Weapon
EW CMs
RF CMs:Mainlobe RF CM 1
Mainlobe RF CM 2
Sidelobe RF CM1
Sidelobe RF CM 2
IR CMS:Mainlobe IR CM 1
Mainlobe IR CM 2
Sidelobe IR CM1
Sidelobe IR CM 2
Attack WeaponFunctional Survivability
NEA 2006: Raid on Enemy Unit> <
Attack Weapon vuln risk High due to seeker ID critical function vuln to mainlobe IRCM
EW CMs
Figure 30. Example of an Analysis Matrix Showing Attack Weapon vs. EW CMs.
NOTE: The color of the circle indicates the level of vulnerability risk as determined by the VRA analysis: red, high to very high; yellow, medium to moderate; green, low to very low. An X denotes an associated applicability.
5. Lethality Analysis Matrices
In addition to survivability analysis, the ISA and VRA methodologies also facilitate the performance of lethality analysis (or, more accurately, kill effectiveness analysis, since lethality, PKILL / HIT, is only one of the critical functions necessary in an engagement). A friendly system vulnerability (the probability of being functionally or physically killed by an enemy system) is
46
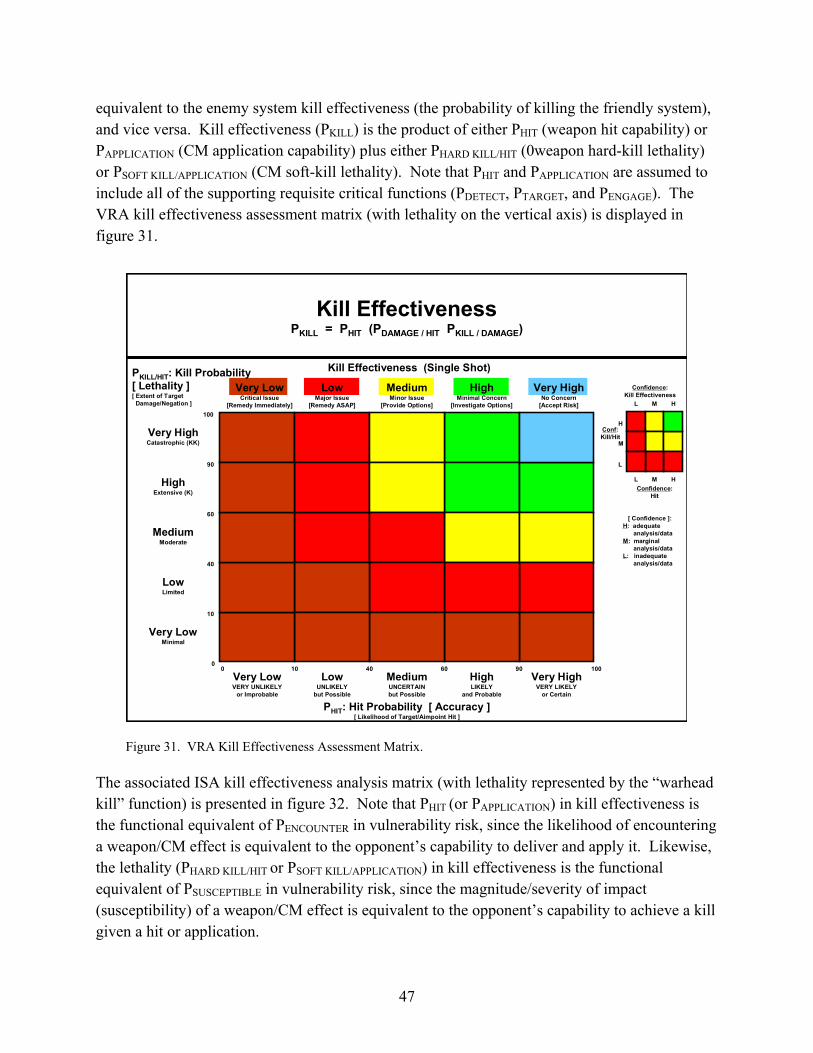
equivalent to the enemy system kill effectiveness (the probability of killing the friendly system), and vice versa. Kill effectiveness (PKILL) is the product of either PHIT (weapon hit capability) or PAPPLICATION (CM application capability) plus either PHARD KILL/HIT (0weapon hard-kill lethality) or PSOFT KILL/APPLICATION (CM soft-kill lethality). Note that PHIT and PAPPLICATION are assumed to include all of the supporting requisite critical functions (PDETECT, PTARGET, and PENGAGE). The VRA kill effectiveness assessment matrix (with lethality on the vertical axis) is displayed in figure 31.
Very HighNo Concern
[Accept Risk]
HighMinimal Concern
[Investigate Options]
MediumMinor Issue
[Provide Options]
Very LowMinimal
LowLimited
MediumModerate
HighExtensive (K)
Very HighCatastrophic (KK)
Very HighVERY LIKELY
or Certain
HighLIKELY
and Probable
MediumUNCERTAINbut Possible
Very LowVERY UNLIKELY
or Improbable
LowUNLIKELY
but Possible
PHIT: Hit Probability [ Accuracy ][ Likelihood of Target/Aimpoint Hit ]
PKILL/HIT: Kill Probability [ Lethality ][ Extent of Target
Damage/Negation ]
Very LowCritical Issue
[Remedy Immediately]
LowMajor Issue
[Remedy ASAP]
Kill Effectiveness (Single Shot)
100
90
60
40
10
00 10 40 60 90 100
Confidence:Kill Effectiveness
L M H
L M HConfidence:
Hit
Conf:Kill/Hit
M
L
H
[ Confidence ]:H: adequate
analysis/dataM: marginal
analysis/dataL: inadequate
analysis/data
Kill EffectivenessPKILL = PHIT (PDAMAGE / HIT PKILL / DAMAGE)
Figure 31. VRA Kill Effectiveness Assessment Matrix.
The associated ISA kill effectiveness analysis matrix (with lethality represented by the “warhead kill” function) is presented in figure 32. Note that PHIT (or PAPPLICATION) in kill effectiveness is the functional equivalent of PENCOUNTER in vulnerability risk, since the likelihood of encountering a weapon/CM effect is equivalent to the opponent’s capability to deliver and apply it. Likewise, the lethality (PHARD KILL/HIT or PSOFT KILL/APPLICATION) in kill effectiveness is the functional equivalent of PSUSCEPTIBLE in vulnerability risk, since the magnitude/severity of impact (susceptibility) of a weapon/CM effect is equivalent to the opponent’s capability to achieve a kill given a hit or application.
47
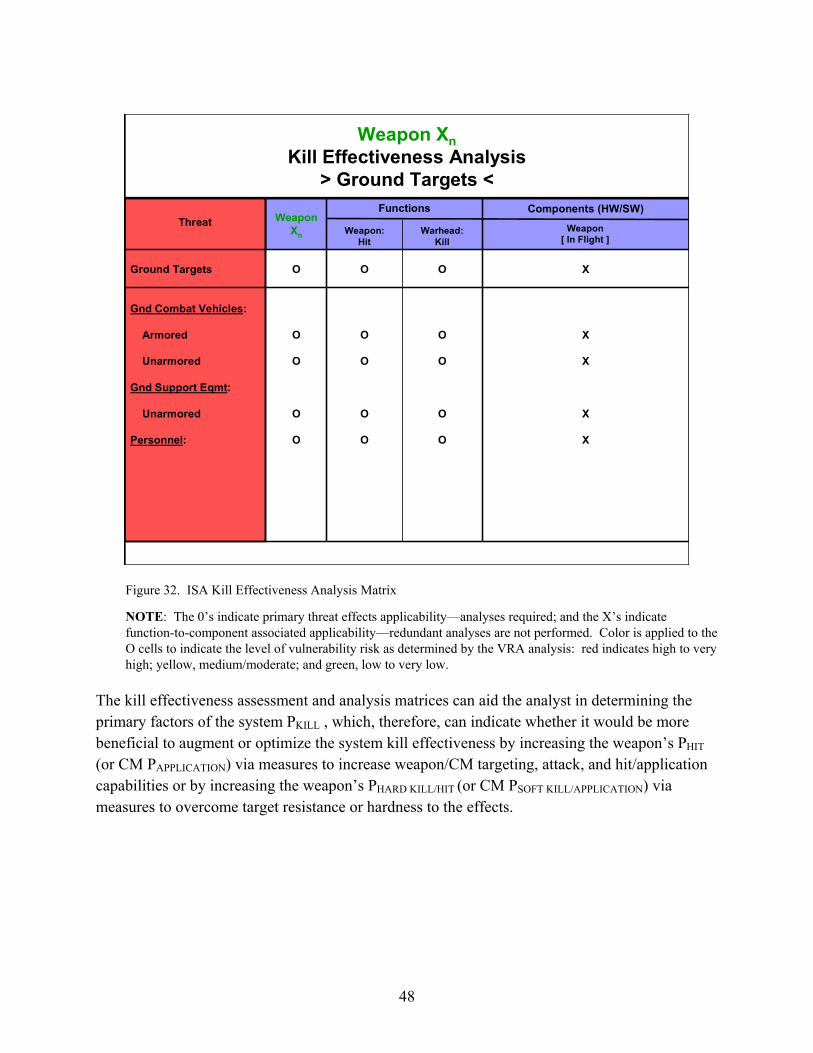
Ground Targets
Gnd Combat Vehicles:
Armored
Unarmored
Gnd Support Eqmt:
Unarmored
Personnel:
Threat
Weapon XnKill Effectiveness Analysis
> Ground Targets <Functions Components (HW/SW)
Weapon:Hit
Warhead:Kill
Weapon[ In Flight ]
O
O
O
O
O
O
O
O
O
O
O
O
O
O
O
X
X
X
X
X
WeaponXn
Figure 32. ISA Kill Effectiveness Analysis Matrix
NOTE: The 0’s indicate primary threat effects applicability—analyses required; and the X’s indicate function-to-component associated applicability—redundant analyses are not performed. Color is applied to the O cells to indicate the level of vulnerability risk as determined by the VRA analysis: red indicates high to very high; yellow, medium/moderate; and green, low to very low.
The kill effectiveness assessment and analysis matrices can aid the analyst in determining the primary factors of the system PKILL , which, therefore, can indicate whether it would be more beneficial to augment or optimize the system kill effectiveness by increasing the weapon’s PHIT
(or CM PAPPLICATION) via measures to increase weapon/CM targeting, attack, and hit/application capabilities or by increasing the weapon’s PHARD KILL/HIT (or CM PSOFT KILL/APPLICATION) via measures to overcome target resistance or hardness to the effects.
48

6. Conclusions
The ISA methodology provides a practical and simple process and analytical structure for performing integrated survivability assessment of subsystems, systems, and SoS against the integrated threat spectrum taking into account any particular scenario and timeframe. This systems engineering analysis methodology applies a matrix-of-matrices approach to formulate an analysis WBS, which follows the principles of functional and physical system decomposition to achieve a classical top-down, requirements-based analysis approach. Based upon the performance of threat effects susceptibility analysis of system critical functions and components (including hardware devices, software algorithms, and human operators), ISA utilizes the classical systems analysis techniques: theoretical, M&S, and/or T&E. The flow-down analysis approach is complemented by a roll-up integration technique employed to aggregate the results of the lower-level analyses into the higher-level conclusions. Although it employs a static analysis approach, scenario and timeframe macro-dynamics are considered. Finally, the ISA methodology also provides a unique, user-friendly audit trail technique for tracking the status of top-level and all intermediate and lower-level survivability analysis results and their aggregated impact.
ISA uses the VRA methodology to enable the process to address and analyze each threat in the integrated threat spectrum in a common manner. It is a universally applicable vulnerability assessment technique that applies to physical hard-kill weapon effects and functional soft-kill CM effects, and all operational environment effects (both natural and man-made). Furthermore, the ISA methodology allows for the computation of a common MoS metric for all threat effects.
In conclusion, the ISA methodology addresses the performance of integrated analysis from both the threat and system points of view: (1) the integrated threat analysis approach addresses how to structure the analysis for individual threat effects, as well as multiple (sequential and simultaneous) threat effects for all of the threats in the integrated threat spectrum; and (2) the integrated system analysis approach considers how to structure the analysis for individual system (component system) analyses, as well as SoS survivability analyses.
49
7. References
1. Defense Acquisition; DoD Directive 5000.1; Office of the Secretary of Defense: Washington, DC, March 1996.
2. Guzie, G.L. Vulnerability Risk Assessment; ARL-TR-1045; U.S. Army Research Laboratory/SLAD: White Sands Missile Range, NM, June 2000.
50
Acronyms
AIS automated information system
AMD air and missile defense
BM Battle Management
BM/C2 Battle Management/command and control
BM/C3 Battle Management/command, control, communications
Btl Cmd Battle Command
C3 command, control, communication
CM countermeasure
DE directed energy
DST defense suppression threat
EDWA engagement decision and weapon assignment
EM electromagnetic
EMP electromagnetic pulse
EW electronic warfare
GNC guidance navigation and control
GSE ground support equipment
IR infrared
ISA Integrated Survivability Assessment
IW information warfare
M&S modeling and simulation
MoE measure of effectiveness
MoP measure of performance
MoS measure of survivability
ORD operational requirements document
51

OT offensive threat
RSTA reconnaissance, surveillance, target acquisition
RF radio frequency
SA/SU situational awareness/situational understanding
SOF special operations forces
SoS system of systems
SME subject matter expert
SSv soldier survivability
STAR system threat assessment report
T&E test and evaluation
TOC tactical operations center
VRA Vulnerability Risk Assessment
WBS work breakdown structure
WRT with regards to
52
Distribution List
Copies US ARMY RESEARCH LABORATORY 1 ATTN: AMSRD ARL CI IS R (A SMITH) MAIL & RECORDS MGMT ADELPHI MD 20783-1197 ADMNSTR 1 DEFNS TECHL INFO CTR ATTN: DTIC OCP (ELECT CPY) (W SMITH) 8725 JOHN J KINGMAN RD STE 0944 FT BELVOIR VA 22060-6218 US ARMY RESEARCH LABORATORY 2 AMSRD ARL CI OK TL ATTN: K RAPKA 2800 POWDER MILL ROAD ADELPHI MD 20783-1197 US ARMY RESEARCH LABORATORY 1 ATTN: AMSRD MAILROOM (VAULT) R REYNA BLDG 1624 WSMR NM 88002-5513 UNDER SEC OF THE ARMY 1 DUSA OR ROOM 2E660 102 ARMY PENTAGON WASHINGTON DC 20310-0102 US ARMY EVALUATION CENTER 1 CSTE AEC SVE R BOWEN 4120 SUSQUEHANNA AVE APG MD 21005-3013 US ARMY EVALUATION CENTER 1 CSTE AEC SVE S R POLIMADEI 4120 SUSQUEHANNA AVE APG MD 21005-3013
53
54
Copies US ARMY RESEARCH LAB 1 AMSRD ARL SL DR DEITZ APG MD 21005-5068 US ARMY RESEARCH LAB 1 AMSRD ARL SL B J FRANZ APG MD 21005-5068 US ARMY RESEARCH LAB 1 AMSRD ARL SL B DR TANENBAUM APG MD 21005-5068 US ARMY RESEARCH LAB 1 AMSRD ARL SL E DR STARKS APG MD 21005-5068 US ARMY RESEARCH LAB 1 AMSRD ARL SL EA MR FLORES WSMR NM 88002-5513 US ARMY RESEARCH LAB 5 AMSRD ARL SL EA MR GUZIE WSMR NM 88002-5513 TOTAL 18