Innovative Integrated Modelling Technology
41
SPE DISTINGUISHED LECTURER SERIES is funded principally through a grant of the SPE FOUNDATION The Society gratefully acknowledges those companies that support the program by allowing their professionals to participate as Lecturers. And special thanks to The American Institute of Mining, Metallurgical, and Petroleum Engineers (AIME) for their contribution to the program.
Transcript of Innovative Integrated Modelling Technology

SPE DISTINGUISHED LECTURER SERIESis funded principally
through a grant of the
SPE FOUNDATIONThe Society gratefully acknowledges
those companies that support the programby allowing their professionals
to participate as Lecturers.
And special thanks to The American Institute of Mining, Metallurgical,and Petroleum Engineers (AIME) for their contribution to the program.

Innovative Integrated Modeling Technology
Michael LitvakMichael LitvakReservoir Engineering Advisor, BPReservoir Engineering Advisor, BP

Innovative Integrated Modeling Technology
Present Present innovative technologyinnovative technology forfor–– Static reservoir modellingStatic reservoir modelling–– Model validation with 4Model validation with 4--D seismicD seismic–– Integrated reservoir/facility modellingIntegrated reservoir/facility modelling–– Field development optimizationField development optimization
Demonstrate Demonstrate added business valueadded business value

Main Messages
Develop and apply powerful integrated Develop and apply powerful integrated modeling technologymodeling technologySave millions of dollars with the developed Save millions of dollars with the developed technology applicationstechnology applications

Details in our SPE Publications
Static Modeling and Model Validation with 4Static Modeling and Model Validation with 4--D D SeismicSeismic–– SPE 90059, SPE 84370SPE 90059, SPE 84370
Integrated Reservoir and Facility ModelingIntegrated Reservoir and Facility Modeling–– SPE 56621, SPE 48859, SPE 38885SPE 56621, SPE 48859, SPE 38885
Production Optimization and Uncertainty Production Optimization and Uncertainty Estimations Estimations –– OTC 18526, SPE 106426, SPE 90506, SPE 77643, SPE OTC 18526, SPE 106426, SPE 90506, SPE 77643, SPE
77658, SPE 9314677658, SPE 93146
Major Challenge
Very difficult discover large conventional Very difficult discover large conventional oil/gas reservoirsoil/gas reservoirs–– Improve recovery from existing fieldsImprove recovery from existing fields

Integrated Modeling Workflow

Facies Modeling Technology

Facies Modeling Technology
Facies Well Logs
Geostatistical Facies 3-D Model
Sand/Shale 3-D Volume Derived from
Seismic

Advantages of Facies Modeling Technology
Match well log/core dataMatch well log/core dataConstrain by sand/shale features derived Constrain by sand/shale features derived from seismicfrom seismicRepresent shale barriers which are below Represent shale barriers which are below seismic resolutionseismic resolutionConsistent with depositional environmentConsistent with depositional environment

Rock Property Modeling Technology

Correlations between Seismic Attributes and Rock Properties
+ >>
Rock Properties Fluid Properties
Seismic Attributes

Calibration of Correlations between Seismic Attributes and
Rock PropertiesEffective Porosity Derived from
Seismic and Well Logs
0
0.05
0.1
0.15
0.2
0.25
0.3
0.35
0 0.05 0.1 0.15 0.2 0.25 0.3 0.35
Log Effective Porosity
Effe
ctiv
e Po
rosi
ty fr
om
Seis
mic
Statistically Good Correlation Statistically Good Correlation -- Large UncertaintiesLarge Uncertainties

Rock Property Modeling TechnologyWell Logs
Facies Seismic
Seismic-Rock
Property
Effective Porosity

Advantages of Rock Property Modeling Technology
Robust Static Model => Success in Field Robust Static Model => Success in Field Development OptimizationDevelopment OptimizationMatch well dataMatch well dataConsistent with seismic and depositional Consistent with seismic and depositional environmentenvironment

Model Validation with 4-D Seismic

Model Validation with 4-D Seismic
Incorporate fluid flow barriers based on 4Incorporate fluid flow barriers based on 4--D D seismicseismicMatch fluid flow movements derived from Match fluid flow movements derived from 44--D seismicD seismicMatch measured and synthetic 4Match measured and synthetic 4--D seismicD seismic

History Matching with Fluid Flow Barriers from 4-D Seismic
BHP (PSI)
0
1000
2000
3000
4000
5000
6000
7000
5/96
11/96 5/9
711
/97 5/98
11/98 5/9
911
/99 5/00
11/00 5/0
1
NoTun Tun Obs
Fluid barriers
from 4-D seismic
Bottomhole
Pressure Match
Water Cut Match
WCT (Ratio)
00.10.20.30.40.50.60.70.8
5/96
11/9
6
5/97
11/9
7
5/98
11/9
8
5/99
11/9
9
5/00
11/0
0
5/01
NoTun Tun Obs

Matching Fluid Flow Movement from 4-D Seismic
Pre-production Oil-Water Contact
(OWC)
Original OWC New OWC
After Three Years
0
0.1
0.2
0.3
0.4
0.5
0 200 400 600 800 1000 1200 1400 1600 1800 2000
Time (Days)
Wat
er C
ut (F
ract
ion)
Water CutTrend of Water Cut
Excellent
Water Cut Match

Integrated Reservoir and Facility Modeling

Integration of Reservoir and Facility Models
Reservoir Model
Oil
Well 383-K1
Risers
Well Tubing
Well 383-K2
Pipelines
Gas-Lift Gas
Gas
Water
Oil/Gas Reservoir
Separators
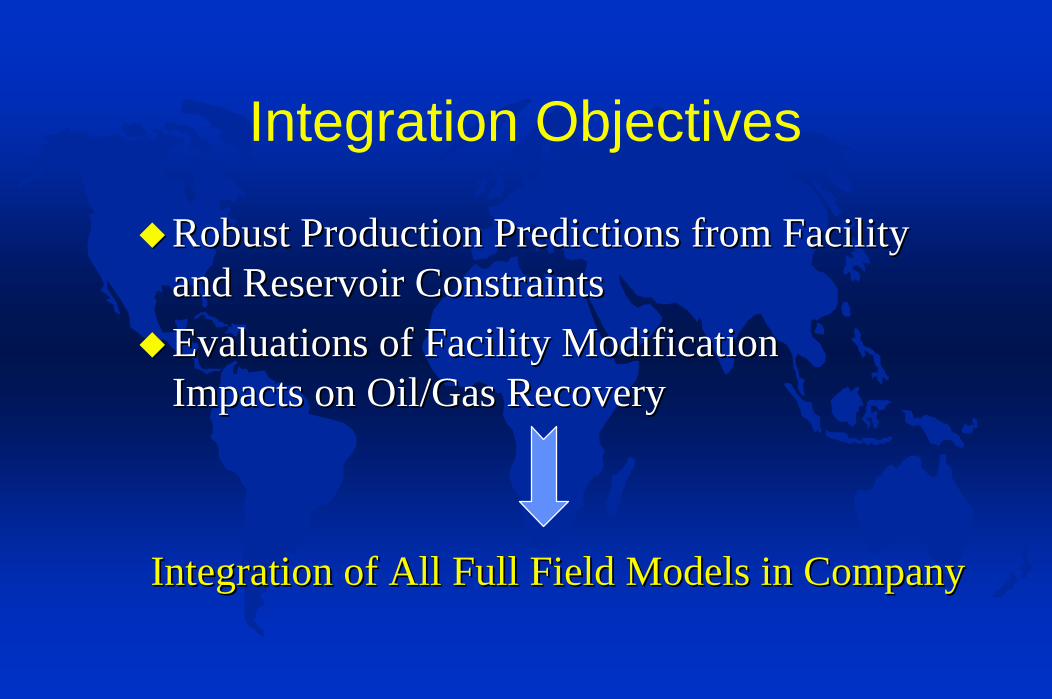
Integration Objectives
Robust Production Predictions from Facility Robust Production Predictions from Facility and Reservoir Constraintsand Reservoir ConstraintsEvaluations of Facility Modification Evaluations of Facility Modification Impacts on Oil/Gas RecoveryImpacts on Oil/Gas Recovery
Integration of All Full Field Models in CompanyIntegration of All Full Field Models in Company

Examples for Gulf of Mexico (GOM) Oil Fields in USA

GOM Example: Added Business Value with Infill Drilling
Drill infill well between best two producersDrill infill well between best two producersBase on predictions of remaining oilBase on predictions of remaining oilImpacts of fluid flow barriers derived from Impacts of fluid flow barriers derived from 44--D seismicD seismicIncrease oil reserves by Increase oil reserves by 8%8%
Remaining OilRemaining Oil

GOM Example: Impacts of Electric Submersible Pump (ESP)
on RecoveryOil Production Rate Increase
0
1500
3000
4500
6000
2477 2658 2842 3023 3207Time (days)
Oil
Rat
es (S
TB/D
)
Bottomhole Pressure Decrease
01000200030004000
2477 2658 2842 3023 3207Time (days)
BH
P (p
si)
Gas-oil Ratio Increase
0
500
1000
1500
2000
2500
2477 2658 2842 3023 3207Time (days)
GO
R (S
CF/
STB
)
Water Cut Increase
0.3
0.4
0.5
0.6
0.7
2477 2658 2842 3023 3207
Time (days)
Wat
er C
ut (f
ract
ion)
Incremental Oil Recovery: from Well Incremental Oil Recovery: from Well ~~1,000 1,000 MstbMstb, from Field , from Field ~~300 Mstb300 Mstb

Field Production Optimization

Approaches
Short Term Field Production OptimizationShort Term Field Production Optimization–– EE--Field Production Optimization System in Field Production Optimization System in
Prudhoe Bay Oil Field (Alaska, USA)Prudhoe Bay Oil Field (Alaska, USA)
Long Term Field Development PlanningLong Term Field Development Planning–– Field Development Optimization in Giant Oil Field Development Optimization in Giant Oil
FieldField

Prudhoe Bay Oil Field Background
Largest Oil Field in North AmericaLargest Oil Field in North AmericaOriginal Oil In Place ~ 24,000,000 MstbOriginal Oil In Place ~ 24,000,000 MstbProduction Start in 1977Production Start in 1977Peak Oil Production ~ 1,400 Mstb/dayPeak Oil Production ~ 1,400 Mstb/dayCurrent Production ~ 400 Mstb/dayCurrent Production ~ 400 Mstb/day>800 Wells>800 Wells

Prudhoe Bay Integrated Reservoir and Facility Model
Reservoir
Low Pressure Flowlines
High Pressure FlowlinesOil
Water
MiscibleInjectant
NGL
CentralGas
Facility
GasWell Pads Drill Sites
Separator Banks
Lean Gas

Automation and Flexibility of Surface Pipeline Network

Prudhoe Bay E-Field Production Optimization System
UserUser--Friendly Friendly system for the optimization system for the optimization ofof–– well rates and choke settingwell rates and choke setting–– well connections to headers and separator bankswell connections to headers and separator banks–– gasgas--lift rateslift rates
Maximizing field oil production matching Maximizing field oil production matching facility constraintsfacility constraints

Production Optimization System Elements
SCADAData Acquisition and
Historian System
Data PreparationProcedure
ModelTUNING OPTIMIZER
Integrated ModelRunning in Background
SETCIMUser-Friendly Interface
Simulation DisplayControl Results
Automatic Tuning Procedure
Compare simulation results with field Compare simulation results with field measurements of pressure and ratesmeasurements of pressure and ratesAdjust model parameters Adjust model parameters Identify problems in simulation models Identify problems in simulation models and/or field measurementsand/or field measurements

Well Connection Optimization

Long Term Field Development Optimization
Optimize Optimize drilling/infilldrilling/infill--drilling program drilling program water/gas injection strategy water/gas injection strategy facility modification program facility modification program
Maximizing Maximizing some economic indicatorsome economic indicatorMatching field development constraints Matching field development constraints

Field Development Optimization Procedure
Multiple Reservoir Models
Field Development Rules
Potential Field Development Options
Optimizer
Select Field Development OptionCheck Constraints
Update and Run Prediction Reservoir Models
Determine Economic Indicator/Recoverable Reserves
Converge?No
Yes
Optimum Field Development Plan

Field Development Optimization in Giant Oil Field
Optimise:Optimise:–– locationslocations of 23 new wellsof 23 new wells–– drilling scheduledrilling schedule–– water water injection strategyinjection strategy
number of water injectors, their locations and drilling number of water injectors, their locations and drilling scheduleschedulewater injection rates water injection rates
–– locations and drilling schedule of locations and drilling schedule of sidetrack wellssidetrack wellsMaximizing Maximizing Net Present ValueNet Present Value

Generation0 20 40 60 80 100 120
0.3
0.4
0.5
0.6
0.7
0.8
0.9
1
1.1
1.2
1.3
NPV Changes in Optimization ProcedureNPV Changes in Optimization Procedure
Base CaseBase Case
Optimum Optimum CaseCase
Field Development Optimization Benefits37% Increase in NPV

Field Development Optimization Benefits
0.00%
2.00%
4.00%
6.00%
8.00%
10.00%
12.00%
14.00%
16.00%
18.00%
0 1000 2000 3000 4000 5000 6000 7000Days
Rel
ativ
e In
crem
enta
l Oil
Rec
over
y (%
)
12% Additional Oil Recovery
-10
-5
0
5
10
15
0 1000 2000 3000 4000 5000 6000 7000
Time (Days)
Incr
emen
tal W
ater
Inje
ctio
n (%
)
5% Reduction in Water Injection

Drilling Time (Days from Start)500 1000 1500 2000 2500 3000
NorthCenter
NorthEast
NorthWest
SouthCenter
SouthEast
SouthWest
Proposals for Water Injection Optimization
Move Two Water Injectors from South to North
Drilling Time (Days from Start)500 1000 1500 2000 2500 3000
NorthCenter
NorthEast
NorthWest
SouthCenter
SouthEast
SouthWest
Base CaseLater Water
Injection in Five Injectors
Early Water Injection
in Five Injectors
Optimum Case

Summary
Develop and apply Develop and apply innovative innovative technologytechnology forfor–– Static reservoir modellingStatic reservoir modelling–– Model validation with 4Model validation with 4--D seismicD seismic–– Integrated reservoir/facility modellingIntegrated reservoir/facility modelling–– Field development optimizationField development optimization
Add Add significant business valuesignificant business value with with the technology applicationsthe technology applications