Initial Results of Concrete Bridge Testing at FAST · INITIAL RESULTS OF CONCRETE BRIDGE TESTING AT...
22
INITIAL RESULTS OF CONCRETE BRIDGE TESTING AT FAST Duane Otter, Brian Doe, and Muhammad Akhtar Transportation Technology Center, Inc. 55500 DOT Road Box 11130 Pueblo, CO 81001 USA [email protected] KEYWORDS: Facility for Accelerated Service Testing (FAST), concrete bridge, bridge testing, impact, and ties ABSTRACT Two new precast, prestressed concrete bridges were installed at the Facility for Accelerated Service Testing (FAST) at the Transportation Technology Center (TTC) in Pueblo, Colorado, USA, in December 2003. A variety of tests are being conducted under 39-ton axle load traffic. One bridge features three state-of-the-art (SOA) spans. The second bridge features two conventional spans. Tests underway include measurements of strain and impact in the spans and foundations, force distribution issues, and the effects of different tie types on both impact and track transition issues. Long-term performance evaluations include performance of the spans under heavy axle loads, field repairs to spans, and ballast puncture and abrasion resistance of waterproofing materials. The paper describes the two FAST ballasted deck concrete bridges, the test layouts and objectives, and results to date. Comparisons to AREMA guidelines are made where appropriate. Tonnage accumulation on the bridges at FAST as of June 2005 is over 200 million gross tons (MGT).
Transcript of Initial Results of Concrete Bridge Testing at FAST · INITIAL RESULTS OF CONCRETE BRIDGE TESTING AT...

INITIAL RESULTS OF CONCRETE BRIDGE TESTING AT FAST
Duane Otter, Brian Doe, and Muhammad Akhtar Transportation Technology Center, Inc.
55500 DOT Road Box 11130
Pueblo, CO 81001 USA
KEYWORDS: Facility for Accelerated Service Testing (FAST), concrete bridge, bridge
testing, impact, and ties
ABSTRACT
Two new precast, prestressed concrete bridges were installed at the Facility for Accelerated
Service Testing (FAST) at the Transportation Technology Center (TTC) in Pueblo, Colorado,
USA, in December 2003. A variety of tests are being conducted under 39-ton axle load traffic.
One bridge features three state-of-the-art (SOA) spans. The second bridge features two
conventional spans. Tests underway include measurements of strain and impact in the spans and
foundations, force distribution issues, and the effects of different tie types on both impact and
track transition issues. Long-term performance evaluations include performance of the spans
under heavy axle loads, field repairs to spans, and ballast puncture and abrasion resistance of
waterproofing materials.
The paper describes the two FAST ballasted deck concrete bridges, the test layouts and
objectives, and results to date. Comparisons to AREMA guidelines are made where appropriate.
Tonnage accumulation on the bridges at FAST as of June 2005 is over 200 million gross tons
(MGT).

INTRODUCTION
In December 2003, trains began rolling over two new precast, prestressed concrete test bridges
on the FAST High Tonnage Loop at TTC. The bridges were constructed in order to conduct a
variety of tests under the heavy axle load (HAL) train. These tests are jointly sponsored by the
Association of American Railroads (AAR) and the Federal Railroad Administration (FRA).
A brief summary of current test topics follows:
• Accelerated service testing of conventional and state of the art (SOA) prestressed
concrete spans
• Performance of spans under 315-kip gross rail load traffic
• Effects of different tie types on track maintenance and bridge performance
• Dynamic load increase (impact) in concrete spans and foundations
• Performance of concrete repair techniques
• Abrasion and puncture resistance of deck waterproofing materials
• Bridge approach and track geometry issues
DESIGN OF TEST BRIDGES
A team of North American railroad industry bridge experts designed the layout for the new
concrete bridges at FAST. The team included bridge engineers from each major North American
railroad as well as representatives from the American Railway Engineering and Maintenance of
Way Association (AREMA) structures committees. Two separate bridges were constructed in
order to double the number of end spans for testing. Experience suggests that end spans

encounter the highest impacts due to the effects from the transition between the approach and the
bridge span – known as the “bump at the end of the bridge.”
The first bridge is a three-span bridge and is referred to as the SOA bridge (Figure 1).
The SOA bridge spans reflect the latest in North American concrete railroad bridge designs in
short, medium, and long span lengths. This bridge features a 42-foot high-performance concrete
(HPC) double-cell box span as the center span. CN designed this center span for Cooper’s E-90
loading. The 9000 psi concrete mix used for the HPC span includes microsilica to enhance
durability. The flanking spans are a 30-foot double-cell box span, and a 15-foot slab span. Both
flanking spans are designed to the new Union Pacific Railroad (UP)-BNSF Railway (BNSF)
joint standard designs and were designed for Cooper’s E-80 loading as per the 2003 AREMA
manual (AREMA, 2003).
The second bridge is a two-span conventional concrete bridge (Figure 2) and is more
representative of the existing North American railroad concrete bridge inventory. The 24-foot
and 32-foot spans are typical short and long double-cell boxes – originally fabricated for BNSF
in 2001. These spans were designed for Cooper’s E-80 loading. The abutments for the
conventional bridge were built to allow installation of a deeper 56-foot single span at a future
date. The concrete ties on this bridge are a BNSF design.
The HAL experiment at FAST is currently operating with 315,000 pound cars – heavier
than the 286,000 pound maximum for interchange service. In light of the long-term industry
trend of increasing car loadings, the foundations for both bridges were designed to handle
Cooper’s E-100 loading, which is higher than the current AREMA bridge design load of E-80.
The HPC span in the SOA bridge was designed to accommodate Cooper’s E-90 loading. Should

the industry decide in the future to conduct research on heavier car loadings, the bridge
foundations will be suitable for evaluation of stronger concrete spans. The same design loading
(E-100) was used for the foundations of the FAST steel bridge installed in 1997.
The bridge foundations are constructed of typical materials for concrete bridges in the
western United States. Driven steel H-piles (HP 14 x 89) support precast concrete caps. The
abutment backwalls are standard UP-BNSF bolt-on designs. The spans rest on either neoprene or
elastomeric bearing pads, as supplied with the spans.
Both concrete bridges are installed on a 5-degree curve with 4 inches of superelevation –
about 500 feet from the steel bridge. The curving forces will provide an additional element of
accelerated service testing on these bridges. The approach tracks to each bridge are constructed
of continuous welded rail (CWR) on BNSF-designed concrete ties and granite ballast. Figure 3
shows the concrete bridge test location on the FAST test loop.
CONSTRUCTION OF TEST BRIDGES
The concept of a concrete test bridge at FAST has been the vision of many North American
railroad bridge engineers since the beginning of the FAST program in 1976. That vision became
a reality through tremendous support and contributions of many railroads and suppliers.
UP crews performed all the pile driving work for the foundations. UP also provided 2
spans for the SOA bridge as well as some concrete ties, steel piles, and miscellaneous materials.
Local crews from BNSF performed most of the general construction for both bridges.
BNSF provided steel piles, handrails, and miscellaneous materials. BNSF also provided
transportation for several carloads of bridge materials.

Rinker Materials contributed both of the spans for the conventional bridge as well as all the
precast foundation pieces. CN furnished the HPC span that is the centerpiece of the SOA bridge.
Figure 4 shows installation of the HPC span.
Canadian Pacific Railway (CP) bridge designers took the bridge concepts from the
advisory group and turned them into detailed drawings for fabrication and construction of the
two bridges. CP, CSX, and Norfolk Southern furnished the majority of the steel piles for the
foundations.
MEASUREMENTS
TTCI staff installed strain gages at the middle of each span on both bridges (Figure 5). Figure 6
shows the strain gage locations on a typical cross section of the bridge. The strain gages are
installed beneath the webs of the double-cell box girders. Strain gages have also been installed to
measure end-of-span shear, and axial forces in the piles. In addition, survey measurements are
used to quantify track settlement and vertical track modulus.
TEST TRAIN OPERATIONS
The FAST test train normally consists of four four-axle locomotives and approximately 80 cars,
each weighing 315,000 pounds. The train normally operates at a speed of 40 mph. The resulting
load spectrum on the bridges is heavier than would typically be experienced in revenue service.
However, any effects due to variations in train speed, variations in car length, or variations in car
weights might not be experienced. Also, the wheels of the FAST train tend to generate fewer
high-impact loads than do those in revenue service. This is primarily due to stringent wheel
maintenance practices and the limited amount of train braking at FAST. These operating
conditions should be considered when interpreting results from FAST testing.

EXPERIMENT RESULTS
While the bridges have only been in service for less than two years, over 200 MGT of HAL
traffic has been accumulated. Preliminary test results indicate several opportunities to reduce the
stress-state on concrete railroad bridges.
Effects of a Bolted Rail Joint on Bridge Spans
A bolted rail joint was intentionally installed on one of the bridge spans to accelerate the
degradation of the concrete ties, granite ballast, and concrete span. After 10 MGT of HAL train
traffic, the track in the area of the joint required tamping on a daily basis. Rate of superelevation
loss and surface loss was about 0.7 inch per MGT. The joint was maintained in track until 19
MGT in order to complete a preliminary round of measurements. The degradation was primarily
in the form of ballast breakdown. One cracked concrete tie was noted near the joint. No damage
to the span was noted.
To create the bolted joint, the rail was cut then bolted together with conventional joint
bars. There was no railhead mismatch – as is often found when a plug rail is bolted into track. In
the case of a railhead mismatch, the maintenance requirements and dynamic impact forces (see
below) are likely to be even greater. Figure 4 shows the location of the rail joint on the SOA
bridge, as well as the locations of the mid-span strain gage circuits. Figure 5 shows where the
impact strains were measured on the 15-foot slab span with the bolted joint. Figure 7 shows the
effects of the bolted rail joint as the train speed increased from 20 mph to 40 mph (64 km/h).
The joint resulted in an increase in strain around 50 percent. It is likely that the range of
maximum value impact forces would be even greater over a larger range of train speeds. The
amount of impact is similar to that measured in a concrete bridge under flat wheels (Sharma,
1994). This amount of impact is higher than that recommended in the 2003 AREMA guidelines
for design (35 percent for a 15-foot span) (AREMA, 2003). Modeling and further discussion of
impacts are covered by Fryba (Fryba, 1996).
Because the impacts over the same speed range were significantly lower on spans without
rail joints (Figure 7), removing unnecessary bolted rail joints from ballast deck or open deck
bridges should be one of the first priorities for reducing the stress-state on railroad bridges.
Without rail joints, the amount of impact measured was less than that recommended by AREMA
for design.
Removing a bolted rail joint located on a bridge is typically not more difficult than
removing a joint in open track or on ballast deck bridges. Extra procedures may be required due
to tie spacing and rail anchoring concerns on open deck bridges. Note: Extra precautions may be
required to prevent fire on bridge timbers during welding operations.
Reducing the Stress-State through Impact Reduction
One of the most commonly cited causes for undesirable vehicle dynamics at bridge ends is the
change in vertical track modulus between the embankment and the bridge deck. Typically the
bridge deck is much stiffer than the approach. To address this issue, various types of ties are
being installed on these concrete bridges in an effort to evaluate and reduce the amount of impact
force transmitted to the concrete spans.
In theory, some of these various ties should benefit the bridge in two ways: (1) Reduce
the amount of impact force transmitted from rail to bridge span, and (2) Reduce vehicle
dynamics due to a more uniform track stiffness between bridge and approaches.
The testing at FAST intends to quantify these reductions in stress-state. Numerous strain
gages on the spans and foundations at FAST are being used to evaluate and compare the impact
forces with each type of tie.
After completing a series of measurements with the standard concrete ties, a set of
concrete ties with rubber pads was installed on the SOA bridge (Figure 8). The pads are designed
to reduce the track modulus to a value comparable to that on the approach track. See Figure 9 for
a comparison of vertical track modulus with standard concrete ties and concrete ties with rubber
pads. The concrete ties with rubber pads resulted in a significant reduction in the vertical track
modulus on the bridge.
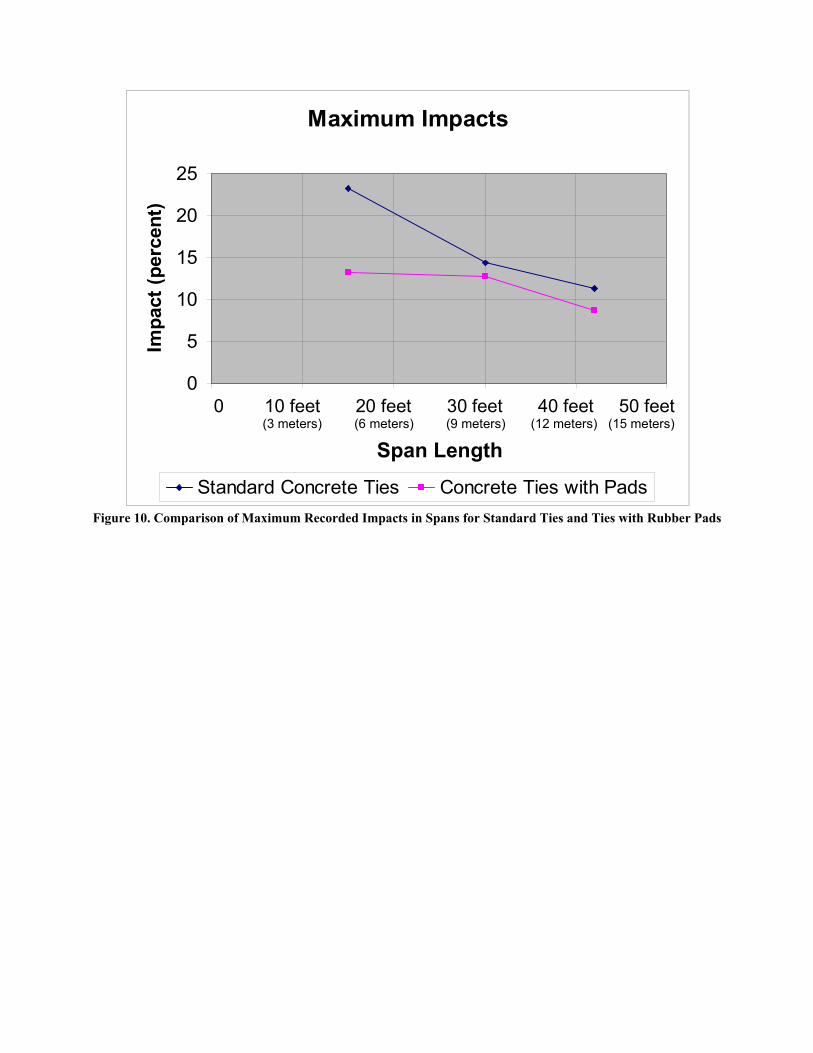
The resulting maximum recorded impacts are shown in Figure 10. These impacts were
calculated using a 2 mph low speed reference train pass. A small reduction in impacts is
achieved as the pads cushion the bridge structure to some extent. No rail joints were on the
bridge in either case. Since the installation of the ties with rubber pads, the track tamping
demand on this bridge seems to have been reduced compared to the other bridge with
conventional concrete ties. An exact comparison is not possible due to differences in rail surface
conditions and other factors.
The concrete ties with rubber pads were removed from the SOA bridge after 130 MGT of
service. On some ties, the glue was no longer holding the pads to the ties. However, the rubber
pads showed no signs of deterioration. These ties were replaced with second generation concrete
ties cast with integral rubber pads.
At the same time, timber ties with Pandrol® fasteners were installed on the conventional
concrete bridge, in place of the standard BNSF concrete ties that had been in service for 182
MGT.

Plans for future testing include similar evaluations using plastic ties, as well as the possibility of
evaluating the use of a ballast mat on the bridge deck.
Reducing the Stress-State through Better Load Distribution
Figure 6 shows a typical cross section of a FAST concrete bridge span, including locations of
strain gages. Figure 11 shows a typical strain distribution laterally across the bottom width of the
span. Note that the greatest strain is about 35 percent higher than the lowest strain. Variations in
the strain distribution across the width of the span can be caused by several things, such as
placement of track on the span, fit between spans and caps, bearing properties, and cross section
design, and of course, train operating speed on curved track.
Future research plans by TTCI call for investigating techniques at FAST to make the load
distribution more uniform. By doing so, the peak stresses in the span will be reduced, hopefully
prolonging the useful service life of the span.
Puncture and Abrasion Resistance of Deck Waterproofing Materials
A test of cold liquid applied (CLA) waterproofing membrane materials, both with and without
protection layers, is being conducted on the conventional concrete bridge. The primary objective
of this test is to evaluate the puncture and abrasion resistance of the various materials under
ballasted railroad track with heavy traffic. The test includes CLA products from three different
vendors and protection layer products from two vendors. The test plan was developed with the
help of experts from AREMA Committee 8, Subcommittee 3, in charge of bridge deck
waterproofing protection. Figure 12 shows part of the test installation during bridge construction.
Granite ballast is used on both bridges. At this early stage of testing, there are no results to report
for this long-term durability test.

In the dry climate near Pueblo, Colorado, the actual waterproofing capabilities of the
materials will not be severely tested because of the low humidity and low annual rainfall.
CONCLUSIONS AND FUTURE WORK
To accommodate increasing weight demands on railroad bridges, testing of one three-span SOA
bridge and one two-span conventional concrete bridge are being performed at FAST.
Testing indicates that under heavier (315,000 pound cars) traffic, these bridges are
performing well to date.
Testing of a bolted rail joint on one of the spans showed impact loads greater than 50
percent. Removal of bolted rail joints on bridges is an effective way to reduce the stress-state.
For bridges with bolted rail joints, a temporary speed restriction (slow order), will also
reduce the stress-state, until the joint can be removed.
Impact reduction testing shows that concrete ties with rubber pads on the bottom, resulted
in a significant decrease in vertical track modulus and a slight impact reduction. Future testing
includes the use of timber and plastic ties and possibly a ballast mat on the bridge deck.
Strain gage testing results show that variations in the strain distribution across the width
of the span vary widely (35 percent) calling for future investigations to make the load
distribution more uniform.

ACKNOWLEDGMENTS
This work was jointly funded by the Association of American Railroads and the Federal Railroad
Administration. The construction of the test bridges was made possible by the generous
donations of labor and material from the Union Pacific Railroad, BNSF Railway, CN, Canadian
Pacific Railway, Norfolk Southern Corporation, CSX, and Rinker Materials. Guidance and
direction for this research is provided by an advisory group including the bridge engineers from
each major railroad plus AREMA bridge committee chairmen, under the direction of John
Unsworth of Canadian Pacific Railway. The authors are grateful for this support.
REFERENCES
1. American Railway Engineering and Maintenance of Way Association , Manual for
Railway Engineering, Landover, Maryland USA. 2003
2. Fryba, L. “Dynamics of Railway Bridges,” Thomas Telford, London UK. 1996
3. Sharma, V. “Flat Wheel Impacts and TLV Tests on a Prestressed Concrete Bridge,” TD94-
016, Association of American Railroads, Chicago Illinois USA. September 1994.
LIST OF FIGURES Figure 1. State-of-the-Art Concrete Bridge at FAST Figure 2. Conventional Concrete Test Bridge at FAST Figure 3. Location of Concrete Test Bridges on FAST Test Loop Figure 4. Setting the High Performance Concrete (HPC) Span in the State-of-the-Art Bridge at
FAST Figure 5. Strain Gage Locations and Rail Joint Location on SOA Bridge Figure 6: Strain Gage Locations on a Typical Cross Section of the Concrete Bridges at FAST Figure 7. Effects of Bolted Rail Joint on 15-foot Span for Train Speed Increase from 20 to 40
mph Figure 8. Rubber Pads Applied to the Bottoms of Concrete Ties Figure 9. Reduction in Track Modulus Achieved by Rubber Pads on Bottoms of Concrete Ties Figure 10. Comparison of Maximum Recorded Impacts in Spans for Standard Ties and Ties with
Rubber Pads Figure 11. Strain Distribution Laterally Across Mid-Span Section of 30-Foot Span Figure 12. Installation of Waterproofing Membrane Test

HEAVY HAUL TESTING OF TWO PRECAST CONCRETE RAILROAD BRIDGES
Figure 1. State-of-the-Art Concrete Bridge at FAST
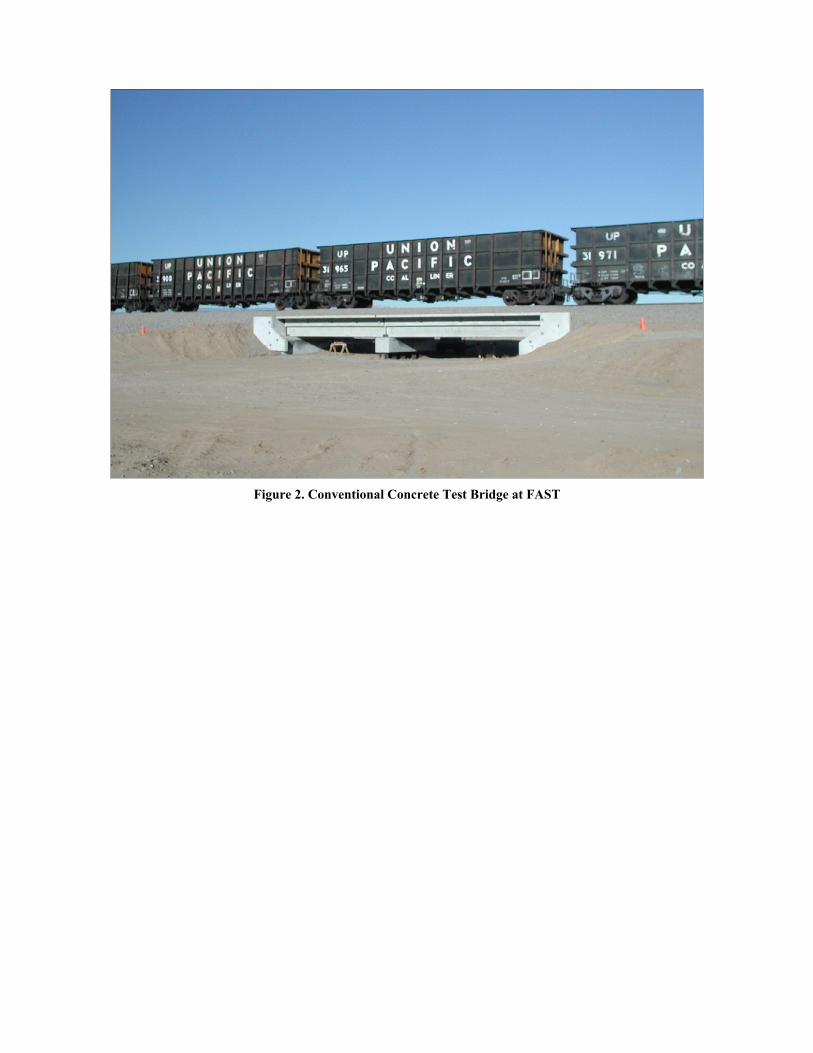
Figure 2. Conventional Concrete Test Bridge at FAST

3
373839
4 04 1
2 1
3 3 32
31 30
28 27 2 6
25
2 4 2398
7
6
5
4
36
29
3 5
High Tonnage Loop
Existing3
373839
4 04 1
2 1
3 3
32
31 30
28 272 6
25
2 4 23
98
7
6
5
4
36
29
3 5
High Tonnage Loop
Concrete Bridge Location
Steel Bridge Location
Figure 3. Location of Concrete Test Bridges on FAST Test Loop

Figure 4. Setting the High Performance Concrete (HPC) Span in the State-of-the-Art Bridge at FAST

Strain Gauges
Figure 5. Strain Gage Locations and Rail Joint Location on SOA Bridge
16" 12"
Strain Gages
16" 12"
Strain Gages
” (30 mm)” (41 mm)
Strain Gauge
Figure 6: Strain Gage Locations on a Typical Cross Section of the FAST Concrete Bridges

Bolted Rail Joint on a 15-Foot (4.57 meter) Span
15 feet 24 feet 30 feet 32 feet 42 feet (4.6 meters) (7.3 meters) (9.1 meters) (9.8 meters) (12.8 meters)
Span Length Figure 7. Effects of Bolted Rail Joint on 15-foot Span for Train Speed Increase from 20 to 40 mph
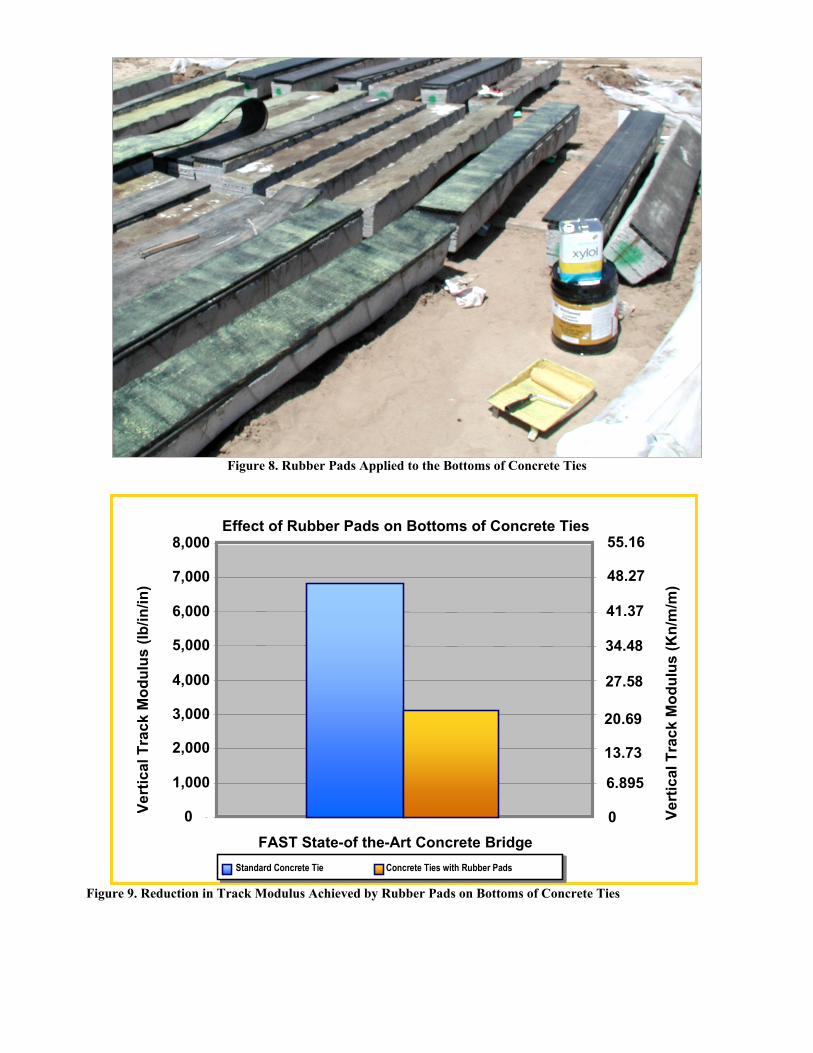
Figure 8. Rubber Pads Applied to the Bottoms of Concrete Ties
Figure 9. Reduction in Track Modulus Achieved by Rubber Pads on Bottoms of Concrete Ties
Effect of Rubber Pads on Bottoms of Concrete Ties
0
1000
2000
3000
4000
5000
6000
7000
8000
FAST State - of - Art Concrete Bridge
Vertical Track Modulus (lb/in/in)
Standard Concrete Tie Concrete Ties with Rubber Pads
Effect of Rubber Pads on Bottoms of Concrete Ties
0
1,000
2,000
3,000
4,000
5,000
6,000
7,000
8,000
FAST State-of the-Art Concrete Bridge
Vert
ical
Tra
ck M
odul
us (l
b/in
/in)
Standard Concrete Tie Concrete Ties with Rubber Pads
Vert
ical
Tra
ck M
odul
us (K
n/m
/m)
0
6.895
13.73
20.69
27.58
34.48
41.37
48.27
55.16
Maximum Impacts
0
5
10
15
20
25
0 10 20 30 40 5
Span Length (feet)
Impa
ct (p
erce
nt)
0
Standard Concrete Ties Concrete Ties with Pads
0 10 feet 20 feet 30 feet 40 feet 50 feet (3 meters) (6 meters) (9 meters) (12 meters) (15 meters)
Span Length
Figure 10. Comparison of Maximum Recorded Impacts in Spans for Standard Ties and Ties with Rubber Pads

Strain Distribution across 30 Foot Span
0
50
100
150
200
0 50 100 150 200
Gage Location (Inches from South Girder Face)
Mid
-Spa
n S
train
(M
icro
stra
in)
0 50 in 100 in 150 in 200 in (1,270 mm) (2,540mm) (3,810mm) (5,080mm)
Gage Location (from South Girder Face)
Gauge Location (from South Girder Face)
Figure 11. Strain Distribution Laterally Across Mid-Section of 30-Foot Span
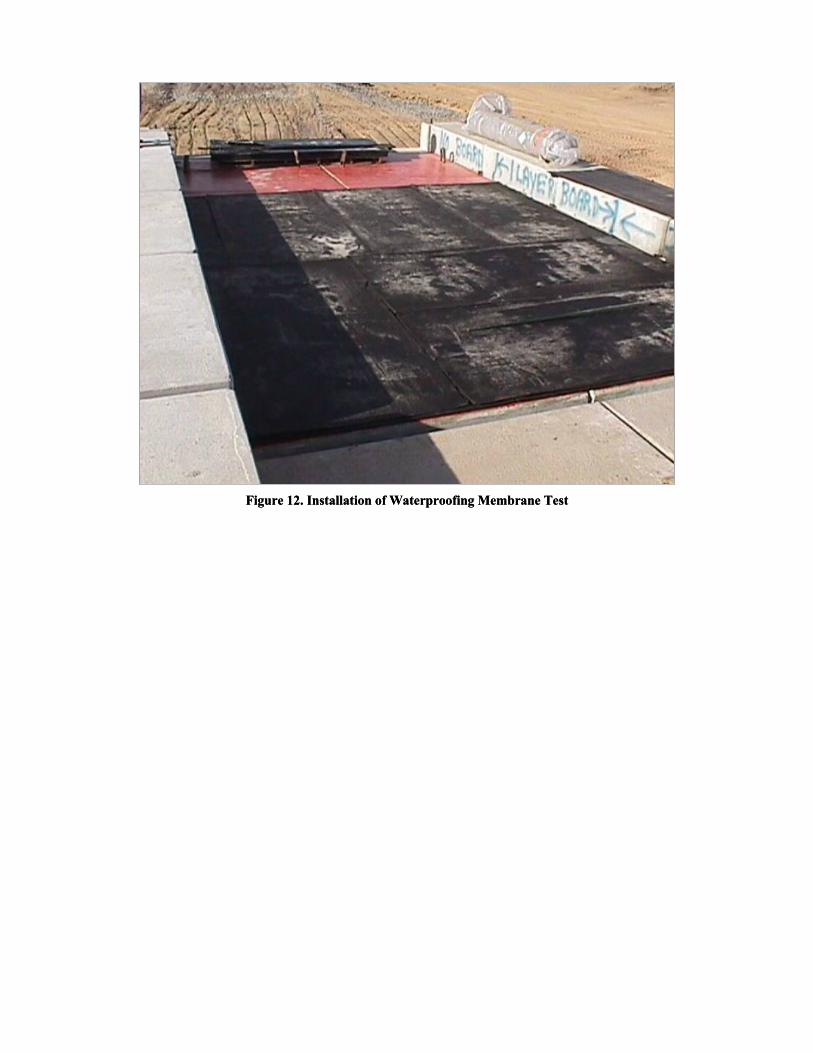
Figure 12. Installation of Waterproofing Membrane Test Figure 12. Installation of Waterproofing Membrane Test