Concrete contribution to initial shear strength of RC hollow bridge … · · 2016-05-16The...
23
Structural Engineering and Mechanics, Vol. 41, No. 1 (2012) 43-65 43 Concrete contribution to initial shear strength of RC hollow bridge columns Ick-Hyun Kim 1a , Chang-Ho Sun 1b and Myoungsu Shin 2 * University of Ulsan, Department of Civil and Environmental Engineering, 93 Daehak-ro, Nam-gu, Ulsan 680-749, South Korea Ulsan National Institute of Science and Technology (UNIST), School of Urban and Environmental Engineering, 100 Banyeon-ri, Eonyang-eup, Ulju-gun, Ulsan 689-798, South Korea (Received April 20, 2011, Revised October 4, 2011, Accepted November 23, 2011) Abstract. The primary objective of this study was to identify concrete contribution to the initial shear strength of reinforced concrete (RC) hollow columns under lateral loading. Seven large-scale RC rectangular hollow column specimens were tested under monotonic or cyclic lateral loads. The most important design parameter was column length-to-depth aspect ratio ranging between 1.5 and 3.0, and the other test variables included web area ratio, hollow section ratio, and loading history. The tests showed that the initial shear strength reduced in a linear pattern as the column aspect ratio increased, and one specimen tested under cyclic loading achieved approximately 83% of the shear strength of the companion specimen under monotonic loading. Also, several pioneering shear models proposed around the world, all of which were mainly based on tests for columns with solid sections, were reviewed and compared with the test results of this study, for their possible applications to columns with hollow sections. After all, an empirical equation was proposed for concrete contribution to the initial shear strength of RC hollow columns based on fundamental mechanics and the test results. Keywords: hollow column; shear strength; aspect ratio; displacement ductility; axial load 1. Introduction For reinforced concrete (RC) bridge construction, the use of hollow piers may introduce significant benefits in comparison to piers with solid sections. A hollow section with a larger depth and concentrated flanges carries a significantly larger sectional moment-of-inertia than solid sections with a similar area. The use of hollow bridge piers reduces the design seismic force owing to the smaller mass, so that it may guarantee a great savings in materials and equipment during the construction of such piers as well as their foundations, and may also reduce problems related to the hydration of massive concrete. Unlike columns used in building frames that are typically designed following the weak beam- strong column philosophy for seismic resistance (Paulay and Priestley 1992), bridge columns are *Corresponding author, Assistant Professor, E-mail: [email protected] a Professor b Research Professor
Transcript of Concrete contribution to initial shear strength of RC hollow bridge … · · 2016-05-16The...

Structural Engineering and Mechanics, Vol. 41, No. 1 (2012) 43-65 43
Concrete contribution to initial shear strength of RC hollow bridge columns
Ick-Hyun Kim1a, Chang-Ho Sun1b and Myoungsu Shin2*
1University of Ulsan, Department of Civil and Environmental Engineering,
93 Daehak-ro, Nam-gu, Ulsan 680-749, South Korea2Ulsan National Institute of Science and Technology (UNIST), School of Urban and Environmental
Engineering, 100 Banyeon-ri, Eonyang-eup, Ulju-gun, Ulsan 689-798, South Korea
(Received April 20, 2011, Revised October 4, 2011, Accepted November 23, 2011)
Abstract. The primary objective of this study was to identify concrete contribution to the initial shearstrength of reinforced concrete (RC) hollow columns under lateral loading. Seven large-scale RCrectangular hollow column specimens were tested under monotonic or cyclic lateral loads. The mostimportant design parameter was column length-to-depth aspect ratio ranging between 1.5 and 3.0, and theother test variables included web area ratio, hollow section ratio, and loading history. The tests showedthat the initial shear strength reduced in a linear pattern as the column aspect ratio increased, and onespecimen tested under cyclic loading achieved approximately 83% of the shear strength of the companionspecimen under monotonic loading. Also, several pioneering shear models proposed around the world, allof which were mainly based on tests for columns with solid sections, were reviewed and compared withthe test results of this study, for their possible applications to columns with hollow sections. After all, anempirical equation was proposed for concrete contribution to the initial shear strength of RC hollowcolumns based on fundamental mechanics and the test results.
Keywords: hollow column; shear strength; aspect ratio; displacement ductility; axial load
1. Introduction
For reinforced concrete (RC) bridge construction, the use of hollow piers may introduce
significant benefits in comparison to piers with solid sections. A hollow section with a larger depth
and concentrated flanges carries a significantly larger sectional moment-of-inertia than solid sections
with a similar area. The use of hollow bridge piers reduces the design seismic force owing to the
smaller mass, so that it may guarantee a great savings in materials and equipment during the
construction of such piers as well as their foundations, and may also reduce problems related to the
hydration of massive concrete.
Unlike columns used in building frames that are typically designed following the weak beam-
strong column philosophy for seismic resistance (Paulay and Priestley 1992), bridge columns are
*Corresponding author, Assistant Professor, E-mail: [email protected] Professor

44 Ick-Hyun Kim, Chang-Ho Sun and Myoungsu Shin
expected to have ductile flexural hinges at their bottoms under design-level earthquakes so as to
function as primary sources for energy dissipation (Priestley et al. 1996). Along with the
development of column hinging, brittle shear failure of bridge columns should be prevented to
avoid disastrous collapse of the superstructure. Special attention should be placed on such plastic
hinges, in that the shear strength of RC columns degrades when the flexural ductility demand
increases (ATC-6 1981). In other words, the shear performance of RC columns strongly depends on
the rate of shear strength degradation due to increasing ductility (Howser et al. 2010) as well as the
initial shear strength before the degradation, Vi, as illustrated in Fig. 1.
Differences exist between the force-resisting mechanisms of solid and hollow columns subjected
to lateral loading. The transmission of shear flow in hollow sections could be very similar to that in
thin-walled tube sections (see Fig. 2), depending on the flange slenderness ratio. Also, the relatively
Fig. 1 ATC-6 model (1981) for relationship between shear strength and ductility
Fig. 2 Shear flow in thin-walled tube sections: (a) rectangular and (b) circular sections (adapted fromHartsuijker and Welleman 2007)

Concrete contribution to initial shear strength of RC hollow bridge columns 45
small thickness between the inner and outer faces of a hollow section limits the available area of
confined concrete core, which appears related to the shear capacity of hollow columns under cyclic
loads.
Numerous studies (Ang et al. 1989, Aschheim and Moehle 1992, Wong et al. 1993, Prestley et al.
1994, Xiao and Martirossyan 1998, Kowalsky and Priestley 2000, Maekawa and An 2000, Sezen
and Moehle 2004, Howser et al. 2010) proposed analytical models for evaluating the shear strength
of RC columns under seismic forces. Recently, some researchers employed the Modified
Compression Field Theory (MCFT) to estimate the deformation capacity of RC columns (Sezen
2008, Mostafaei et al. 2009), and others used a probabilistic approach (Sasani 2007) or a neural
network based model (Yang 2007, Caglar 2009) for their shear behavior. However, all of them were
primarily based on experimental tests for columns with solid sections. Only a few studies (Yeh et
al. 2002, Mo et al. 2003, Mo et al. 2004, Cheng et al. 2005) have been conducted for the seismic
performance assessment or the earthquake-resistant design of RC hollow columns. Moreover, little
investigation was made on the initial shear strength of such columns; almost all hollow column tests
reported in the literature showed relatively ductile behaviour engaging plastic hinging mechanism,
before ultimate shear failure if any. Most of the studies (Mander et al. 1984, Yeh et al. 2001, Mo et
al. 2003) focused on evaluating the acceptability of different lateral reinforcement details on the
standpoint of sufficient ductility under cyclic lateral loading.
Given this concern, the current study investigated the initial shear strength of RC hollow bridge
columns subjected to monotonic or cyclic lateral loads. In particular, this study focused on assessing
concrete contribution to the column shear strength, by providing no transverse reinforcement and by
imposing no axial load. It should be noted that the tests were only to investigate the initial shear
strength, so that the specimens were designed to fail in shear before reaching their flexural
strengths. Thus, discussions related to the effect of ductility on the column shear strength (i.e.,
reduction in the shear strength due to increasing ductility) are solely based on comparisons of the
shear models proposed by others.
2. Descriptions for experimental program
2.1 Specimen details and test variables
Seven approximately ¼-scale rectangular hollow column specimens were tested in this study. The
specimens represented cantilever bridge piers subjected to lateral loading (see Fig. 3). The single
most important parameter of this experimental program was column length-to-depth aspect ratio (l/
h), in which l stands for the column length from the base to the loading point and h is the column
depth. The other test variables included web area ratio, hollow section ratio, and loading pattern.
The hollow section ratio was defined as the area enclosed within interior edges of a hollow section
divided by the area within exterior edges of the section. Fig. 3 illustrates plan and elevation views
of the test specimens, and Table 1 summarizes the design details and test variables.
In all specimens, exterior dimensions of the rectangular hollow column section were kept
unchanged; 900 mm wide and 600 mm deep. Also, the specimens were reinforced with the same
amount of longitudinal bars, twenty D19, in a single layer for simple construction. No transverse
reinforcement was provided in all specimens to clearly identify the column shear strength exerted
by concrete only. In the first four specimens (H40A1.5, H40A2.0, H40A2.5, and H40A3.0), all

46 Ick-Hyun Kim, Chang-Ho Sun and Myoungsu Shin
design details were identical except the column aspect ratio (l/h) varying between 1.5 and 3.0, as
shown in Table 1; the web area ratio was equal to 0.48, and the hollow section ratio was 0.4 in
these specimens. Each of the two specimens, H40A1.5WF1.8 and H60A1.5, was intended for a
direct comparison with H40A1.5; the former had the web area ratio of 0.67, and the latter had the
hollow section ratio of 0.6. The specimen H40A2.0C had completely identical design details with
H40A2.0, but was tested under reversed cyclic displacements.
The specimens were cast in their upright position, and all specimens were cast on the same day
using an identical batch. Before casting, strain gages were installed on selected longitudinal bars at
the column-footing interface. The compressive strength of concrete was 24.6 MPa, measured after
28 days since the casting, and the measured yield strength of steel for the column reinforcement
was 340 MPa.
2.2 Test setup and loading history
Fig. 4 shows a picture of the test setup. The top of the column was linked to an actuator with a
swivel connector, and the bottom was restrained by (monolithically cast with) the foundation that
was anchored to the strong floor. The specimens were statically loaded in the lateral direction at the
Fig. 3 Dimensions and reinforcing details of specimens (units: mm)

Concrete contribution to initial shear strength of RC hollow bridge columns 47
Table 1 Specimen details and test variables
Specimen H40A1.5 H40A2.0 H40A2.5 H40A3.0 H60A1.5 H40A1.5WF1.8 H40A2.0C
Exterior faces (mm) 900 × 600
Interior faces (mm) 640 × 340 740 × 440 540 × 400 640 × 340
Flange thickness (mm)
130 80 100 130
Web thickness (mm) 130 80 180 130
Gross section area, Ag (mm2)
322,400 214,400 324,000 322,400
Longitudinalreinforcement ratio
0.018 0.027 0.018 0.018
Hollow section ratio (%)
40 60 40
Web area ratio (%) 48.4 44.8 66.7 48.4
Column length, l (mm)
900 1200 1500 1800 900 900 1200
Aspect ratio, l/h 1.5 2.0 2.5 3.0 1.5 1.5 2.0
Loading pattern Monotonic loadingCyclic loading
Material strengths Concrete compressive strength: 24.6 MPa, Steel yield strength: 340 MPa
Main test variables Aspect ratioHollow section ratio
Web area ratioLoading pattern
Fig. 4 A picture of the test setup

48 Ick-Hyun Kim, Chang-Ho Sun and Myoungsu Shin
top of the column, by a hydraulic actuator with a 500 kN loading capacity and a ± 300 mm linear
stroke. No column axial load was applied to exclude any potential contribution of axial load to the
column shear strength.
Each specimen except H40A2.0C was tested under monotonic loading until it failed in shear to
show a significant strength drop larger than 20% from the maximum load. For H40A2.0C, a total of
twenty-four displacement cycles were statically applied up to 2% drift ratio as shown in Fig. 5. Two
consecutive same-drift cycles were tested to examine strength and stiffness degradations under
repeated loading.
Fig. 5 Loading history for specimen H40A2.0C
Fig. 6 Cracking damage at completion of testing
Concrete contribution to initial shear strength of RC hollow bridge columns 49
3. Summary of test results
3.1 Cracking behavior and failure mode
Fig. 6 illustrates cracking damages observed in the specimens at the completion of testing. In all
specimens, initial inclined cracks occurred at approximately 0.4 to 0.6% drift ratio, connecting to
one corner (on the opposite side of the actuator pushing the specimen) of the column base. It is
notable that the drift ratio at the onset of inclined cracks was similar in the specimens regardless of
the varying test parameters. The crack width gradually increased to result in a couple of major
inclined cracks until the specimen failed with a significant strength drop of more than 20% of the
peak load. Fig. 6 shows only one side of each specimen that had more apparent inclined cracks. In
all specimens, no indication or behavior related to typical flexural failure was found such as
concrete spalling or reinforcement buckling near the bottom of the column; only a couple of hairline
horizontal cracks were observed in the specimens with the column aspect ratio equal to or larger
than 2. Based on these and other observations discussed later, it was concluded that all specimens
failed in shear.
The angles of the major inclined cracks measured from the horizontal line ranged approximately
between 45 and 55 degrees, as shown in Fig. 7. In general, the specimen with the higher aspect
ratio showed the greater crack angle. Also, the specimen with the higher web area ratio exhibited
the greater crack angle (compare H40A1.5 vs. H40A1.5WF1.8), while the specimen with the higher
hollow section ratio had similar cracks (compare H40A1.5 vs. H60A1.5).
3.2 Overall load-displacement response
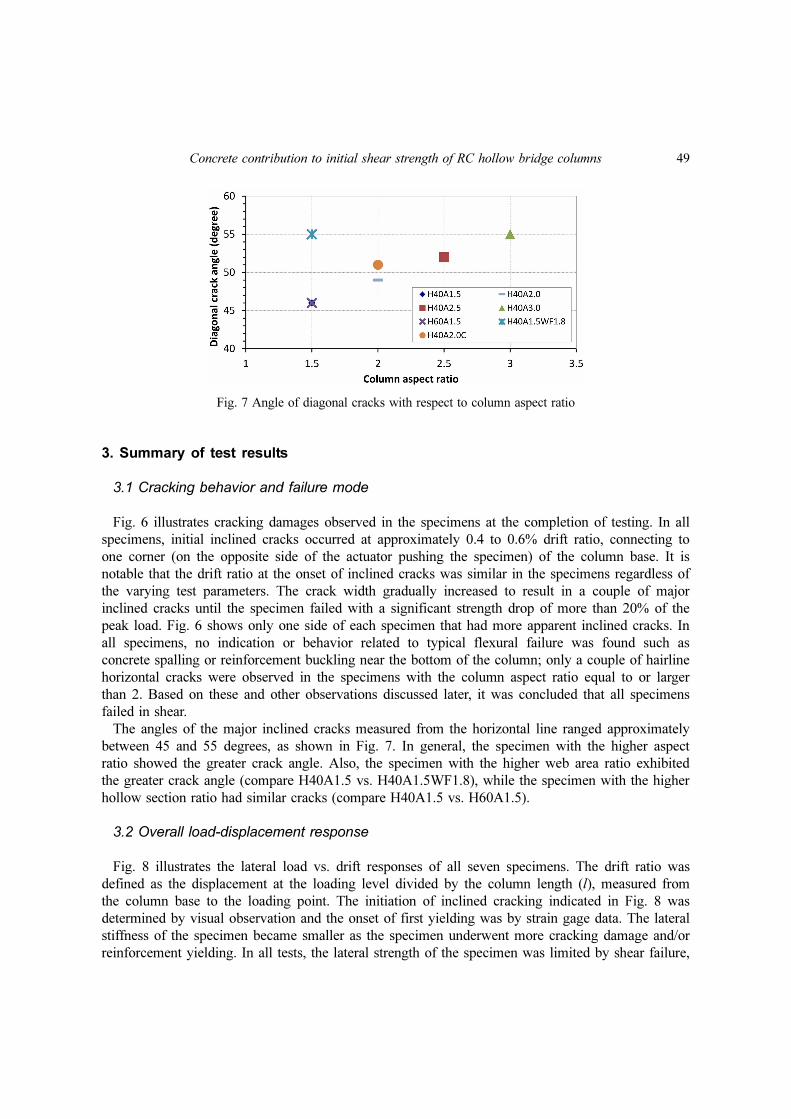
Fig. 8 illustrates the lateral load vs. drift responses of all seven specimens. The drift ratio was
defined as the displacement at the loading level divided by the column length (l), measured from
the column base to the loading point. The initiation of inclined cracking indicated in Fig. 8 was
determined by visual observation and the onset of first yielding was by strain gage data. The lateral
stiffness of the specimen became smaller as the specimen underwent more cracking damage and/or
reinforcement yielding. In all tests, the lateral strength of the specimen was limited by shear failure,
Fig. 7 Angle of diagonal cracks with respect to column aspect ratio
50 Ick-Hyun Kim, Chang-Ho Sun and Myoungsu Shin
and suddenly dropped by more than 20% of the maximum load achieved at between 0.8 and 1.4%
drift ratio. Table 2 summarizes the maximum load (Vc, exp) reached during each test, which was
considered as the shear strength of the column because all seven specimens failed ultimately due to
shear. The shear strength normalized by the gross section area (Ag) or the web area (bwd) was listed
together in Table 2. Also, the possible lateral strength of each specimen (Vc, flex) was calculated
assuming that a plastic hinge due to flexure would develop at the bottom of the column, as well as
the lateral load when the calculated yield moment occurred at the base (Vc, yield) (see the first and
second rows of Table 2). In all specimens, the measured maximum load (Vc, exp) during the test was
smaller than the calculated lateral strength (Vc, flex) based on the flexural hinging mechanism; most
specimens experienced limited yielding. This was in accordance with the conclusion that all
specimens failed due to shear with very low ductility.
Fig. 8 Load-displacement responses of specimens

Concrete contribution to initial shear strength of RC hollow bridge columns 51
Effects of the main test variables on the lateral load-drift response were analyzed in the following.
Comparing the four specimens (H40A1.5, H40A2.0, H40A2.5, and H40A3.0) with the column
aspect ratio (l/h) varied only, the specimen with the higher aspect ratio exhibited the smaller
stiffness after initial inclined cracks appeared, and ultimately reached the smaller maximum load
(Vc, exp) at the smaller drift ratio (see Fig. 8(a)). The reduction in the shear strength (Vc, exp) was
likely in part because the confinement effect of the adjacent member (i.e., footing) was lesser in
columns with higher aspect ratios (Kowalsky and Priestley 2000), and also in part because increased
normal stress due to higher bending moment interacted with shear stress against the given tensile
capacity of concrete.
The two specimens, H40A1.5 and H40A1.5WF1.8, with different web area ratios (approximately
0.48 and 0.67 respectively) but with the same gross section area (Ag), achieved similar maximum
loads (Vc, exp) in the tests. Also, the measured shear strength (Vc, exp) divided by the gross section area
(Ag) was 1.63 and 1.62 MPa in H40A1.5 and H40A1.5WF1.8 respectively, which were reasonably
close to the values estimated by some shear models proposed earlier (see Tables 2 and 4). Based on
these results, the initial shear strength of a hollow column appears to be associated more with the
gross section (Ag) than the web area (bwd).
Figs. 8(c) and 8(d) compare the lateral load-drift responses of H40A1.5 and H60A1.5, with the
hollow section ratio equal to 0.4 and 0.6, respectively. H40A1.5 (with the larger section area)
certainly had the greater maximum load (Vc, exp) at about 1.4% drift ratio, which was quite larger
than 0.9% in H60A1.5. However, Vc, exp normalized by Ag was similar to be 1.63 and 1.57 MPa in
H40A1.5 and H60A1.5 respectively (see Table 2), regardless of the hollow section ratio. This
supported the conclusion that the initial shear strength of a hollow column would be dependent
more on Ag than bwd. On the other hand, the percentage of strength drop after the maximum load
was lesser in H40A1.5. This was possibly because aggregate interlocking across inclined cracks was
less effective in H60A1.5 because of the smaller web thickness. However, more tests should be
Table 2 Measured and calculated lateral strengths and failure modes of specimens
Specimen H40A1.5 H40A2.0 H40A2.5 H40A3.0 H60A1.5 H40A1.5WF1.8 H40A2.0C
Flexural strength,Vc, flex (kN)
620 464 371 310 619 616 471
Yield strength,Vc, yield (kN)
471 338 268 224 474 463 338
Maximum load,Vc, exp (kN)
525 445 341 259 337 522 368
Vc, exp / Ag
(MPa)1.63 1.38 1.06 0.80 1.57 1.62 1.14
Vc, exp / bwd(MPa)
3.37 3.05 2.34 1.78 3.76 3.33 2.53
Vc, exp / Ae*(MPa)
2.02 1.73 1.32 1.00 1.96 2.02 1.43
Failure modeFlexure-
shearFlexure-
shearFlexure-
shearFlexure-
shearShear Flexure-shear Flexure-shear
* Ae: Effective area equal to 0.8 Ag

52 Ick-Hyun Kim, Chang-Ho Sun and Myoungsu Shin
done to reach a certain conclusion on the level of the residual strength.
In this experimental program, one specimen, H40A2.0C, was tested under reversed cyclic loading
to investigate effects of different loading histories. Fig. 8(e) compares the load-drift responses of
H40A2.0 and H40A2.0C, in which design details were exactly identical. H40A2.0C achieved the
smaller maximum load (roughly 83% of that of H40A2.0) at the smaller drift ratio. This was mostly
because H40A2.0C underwent strength and stiffness degradations due to continued increase of the
principal tensile strain after the onset of reinforcement yielding (Stevens et al. 1991).
Fig. 9 illustrates the measured shear strength (Vc, exp) normalized by the gross section area (Ag) or the
effective area (0.8 Ag for H40A2.0C only), with respect to the column aspect ratio (l/h). The normalized
shear strength (Vc, exp/Ag or Vc, exp/0.8 Ag) decreased generally in a linear proportion to the aspect ratio.
Note that, in all specimens except H40A2.0C, the gross section area, Ag, was used, while 0.8 Ag was
used as the effective area for H40A2.0C. The two different shear areas (Ag versus 0.8 Ag) were adopted
based on the findings that the shear strength of H40A2.0C was roughly 83% of that of H40A2.0.
4. Comparison of shear models with test results
Many researchers have focused on the evaluation of the shear strength of RC columns all around
the world, most of which were mainly based on tests of columns with solid sections. Some of the
pioneering studies on this subject were reviewed and compared with the test results, for their
possible applications to columns with hollow sections. The studies reviewed in this paper include
Aschheim and Moehle (1992), Prestley et al. (1994), Xiao and Martirossyan (1998), Kowalsky and
Priestley (2000), Maekawa and An (2000), Sezen and Moehle (2004), and Howser et al. (2010).
Also, two relevant design codes, ACI 318-08 (2008) for the design of new buildings and Caltrans
Seismic Design Criteria (2002) for the assessment and design of bridges, were investigated, while
other earlier design approaches such as in ATC-32 (1996), ATC-40 (1996), FEMA 273 (1997),
FEMA 356 (2000), and ASCE/SEI 41-06 (2006) essentially adopted the aforesaid methods.
Important design parameters that have been considered to affect concrete contribution to the column
shear strength in the previous studies and design codes are column aspect ratio (l/h), displacement
ductility (µ), axial load (P), longitudinal reinforcement ratio (ρl), size effect, and the effective area
resistant to shear. All equations introduced in the following are written in SI units.
Fig. 9 Experimental shear strength divided by Ag or 0.8 Ag

Concrete contribution to initial shear strength of RC hollow bridge columns 53
4.1 Aschheim and Moehle (1992)
Aschheim and Moehle (1992) proposed that concrete contribution to the shear strength of an RC
column degrades when displacement ductility demand increases. In this model, the concrete
contribution (Vc) is determined by
(1)
(2)
Here, k is the factor accounting for the aforesaid effect of increasing displacement ductility (µ). This
model was intended to evaluate the shear strength at plastic hinge zones, and was later adopted in
FEMA 273 (1997).
4.2 Original UCSD shear model
According to Priestley et al. (1994), the shear strength of RC columns is attributed to the
following three parts: contributions by concrete, transverse reinforcement, and compressive load.
They suggested that the concrete shear strength (Vc) degrades with increasing ductility as follows:
(3)
Here, the γ factor is taken as 0.29 when the displacement ductility (µ) is less than 2 and 0.10 when
µ is more than 4. The γ factor linearly decreases between µ equal to 2 and 4. They noted that the
strength degradation is primarily because aggregate interlocking reduces as cracks become wider.
Another unique feature of the original UCSD model was that the contribution of axial load on the
column shear strength was separated from the concrete contribution.
A few years later, Xiao and Martirossyan (1998) investigated the seismic performance of high-
strength concrete columns, and found that concrete shear contribution in such columns degraded
more dramatically than that predicted by the original UCSD model (1994). Based on the test results,
they proposed to modify the γ factor for the case of high-strength concrete as follows:
(4)
(5)
(6)
(7)
In this model, the initial concrete contribution (for µ close to 1) is identical (i.e., γ = 0.29) to that of
the original UCSD model. They noted, however, that the proposed equation was not calibrated for
high-strength concrete columns that underwent shear failure with µ less than 4.
Vc 0.3 kP
13.8Ag
----------------+⎝ ⎠⎛ ⎞ fc
′0.8Ag( )=
k4 µ–
3-----------; 0 k 1≤ ≤=
Vc γ fc ′
0.8Ag( )=
γ 0.29= for µ 2≤
γ 0.29 0.12 µ 2–( )–= for 2 µ≤ 4≤
γ 0.05 0.025 µ 4–( )–= for 4 µ≤ 6≤
γ 0= for µ 6≥

54 Ick-Hyun Kim, Chang-Ho Sun and Myoungsu Shin
Recently, Howser et al. (2010) also proposed modifications to the γ factor in the original UCSD
model (i.e., the effect of ductility on the concrete shear strength), based on a numerical parametric
study:
As implied above, the numerical results well agreed with Xiao and Martirossyan (1998) for small
ductilities, while adjustments were made in this model for large ductilities.
4.3 Revised UCSD shear model
Kowalsky and Priestley (2000) proposed three revisions to the earlier UCSD shear model of
Priestley et al. (1994). The revisions account for (1) the effect of column aspect ratio and (2) the
effect of longitudinal steel ratio on the concrete shear-resisting mechanism. The concrete
contribution (Vc) to the shear strength of RC columns is defined as
(8)
; (9)
(10)
; (11)
Here, the α factor accounts for the impact of column aspect ratio represented by M/VD, where D is
the diameter of a circular column. They noted that shorter columns would have better confinement
by the adjacent joints or footings. The β factor is linearly proportional to the longitudinal steel ratio
(ρl) that would affect aggregate interlocking mechanism across concrete cracks, and the γ factor
stands for the degradation of concrete shear capacity with increasing displacement ductility (µ).
4.4 Maekawa and An (2000)
Maekawa and An (2000) introduced a modification factor for the current JSCE (Japanese Society
γ 0.29= for µ 2≤
γ 0.29 0.12 µ 2–( )–= for 2 µ≤ r≤
γ 0.53 0.095r– 0.025µ–= for r µ≤ q≤
γ 0.53 0.095r– 0.025q–= for µ q≥
r 35ρt 0.011fc ′
3.8+–=
q 144ρt 0.03fc ′
4.3+ +–= for q r≥
q r= for q r<
Vc αβγ fc ′
0.8Ag( )=
α 3M
VD--------–= 1 α 1.5≤ ≤
β 0.5 20ρl 1≤+=
γ 0.29 0.04 µ 2–( )–= 0.05 γ 0.29≤ ≤

Concrete contribution to initial shear strength of RC hollow bridge columns 55
of Civil Engineers) formula for the shear strength carried by concrete (vc, JSCE), to account for the
post-yield shear capacity of RC columns. This model integrates combined effects of column aspect
ratio and displacement ductility as follows:
(12)
(13)
(14)
(15)
Here, the modification factor expressed as is limited to 1 when µ < 1 and is taken as 0
when µ > 1 + 1/k, where k is a factor accounting for the effect of column aspect ratio (a/d). It is
noted that the effect of aspect ratio is also considered in vc, JSCE.
4.5 Sezen and Moehle (2004)
Sezen and Moehle (2004) developed a comprehensive shear model for older columns having less
transverse reinforcement, compared with columns designed following current codes. In this model,
the concrete contribution (Vc) is affected by column aspect ratio (a/d), displacement ductility (µ),
and axial load (P), and varies in proportion to the inverse of the aspect ratio, as recommended in
the ASCE-ACI Committee 426 report (1973):
(16)
when when (17)
Here, the k factor decreases linearly from 1 to 0.7 for µ varying between 2 and 6. Unlike in any
other models, the k factor is also multiplied to reinforcement contribution to the shear strength of
RC columns, in that concrete damage likely leads to loss of anchorage of longitudinal and
transverse reinforcement so as to degrade the truss mechanism (Sezen and Moehle 2004). This
method was adopted in ASCE/SEI 41-06 (2006), the most recent report for the subject of the
“seismic rehabilitation of existing buildings,” which succeeded the previous editions on the same
subject, FEMA 273 (1997) and FEMA 356 (2000).
4.6 Caltrans seismic design criteria
Unlike other design codes such as ACI 318-08 (2008) and AASHTO Specifications (2002),
Caltrans Seismic Design Criteria (2002) introduced the effect of increasing displacement ductility
Vc 1 k µ 1–( )–( )vc JSCE, bwd( )=
k1
2 9 a d⁄–( )-------------------------=
vc JSCE, 0.9 fc ′( )
1 3⁄βp βn βd
a
d--- 2.0≥⎝ ⎠⎛ ⎞⋅ ⋅ ⋅=
vc JSCE, 0.6 fc ′( )
1 2⁄βp βn βd
a
d--- 2.0<⎝ ⎠⎛ ⎞⋅ ⋅ ⋅=
1 k µ 1–( )–
Vc k0.5 fc
′
a d⁄--------------- 1
P
0.5 fc ′Ag
---------------------+⎝ ⎠⎜ ⎟⎛ ⎞
0.8Ag=
k 1= µ 2 k,≤ 0.7= µ 6≥

56 Ick-Hyun Kim, Chang-Ho Sun and Myoungsu Shin
(µ) in determining concrete contribution (Vc) to the shear strength of RC columns:
(18)
; (19)
; (20)
Here, ρs is the transverse reinforcement ratio and fyh is the yield strength of transverse steel. The
correction factor for the level of axial load, F2, is the same as that of ACI 318-08, §11.3 applying to
columns not designed to resist seismic forces.
4.7 ACI 318-08 shear strength equation
For the design of new buildings based on ACI 318-08, the concrete contribution (Vc) is
determined considering column aspect ratio, longitudinal reinforcement ratio, and axial load by
(21)
(22)
Here, ρw is the longitudinal reinforcement area divided by bwd, Nu is the ultimate axial load, Vu is
the ultimate shear force, Mu is the ultimate moment, d is the effective depth of the section, and h is
the total depth of the section. The beneficial effect of compressive axial load is indirectly reflected
in Eq. (22), and the maximum moment demand, Mm, is used instead of Mu in Eq. (21) to modify the
effect of column aspect ratio, which is represented by Mm/Vud.
4.8 Comparison of various shear models
The shear models reviewed above were compared each other in terms of several major design
parameters, as summarized in Table 3. All models except for ACI 318-08 take into account the
effect of displacement ductility on the shear strength of RC columns. Also, reduction in the concrete
shear contribution due to the larger column aspect ratio is reflected in many models including the
revised UCSD model, Maekawa and An (2000), Sezen and Moehle (2004), and ACI 318-08. With
respect to the effective area resistant to shear, Maekawa and An (2000) and ACI 318-08 use the
web area (bwd) of the column section, while all other models use 80% of the gross section area (Ag)
to account for reduction in the shear effective area due to cracking and spalling damage near plastic
zones under reversed cyclic loading (Ang et al. 1989).
Fig. 10(a) compares the various shear models in terms of the impact of displacement ductility
demand for cases of the column aspect ratio equal to 2 as an example. In Figs. 10 and 11, the
longitudinal steel ratio is taken as that of the specimens in this study, and both the transverse steel
ratio and the axial load are taken as zero, in order to compare the concrete contribution only. With
regard to the effect of ductility demand, shear strength degradation initiates at the displacement
ductility of 1 in Aschheim and Moehle (1992) and Maekawa and An (2000), and at 2 in all the
Vc F1F2 fc ′
0.8Ag( ) 0.33 fc ′Ag≤=
F1 0.08ρs fyh 0.305 0.083µ–+= 0.025 F1 0.25≤ ≤
F2 1P
13.8Ag
----------------+= 1 F2 1.5≤ ≤
Vc 0.16 fc ′
17ρw
Vud
Mm
--------+⎝ ⎠⎛ ⎞bwd=
Mm Mu Nu4h d–( )
8------------------–=
Concrete contribution to initial shear strength of RC hollow bridge columns 57
others except ACI 318-08. On the other hand, the Caltrans model (2002) expects strength
degradation even when the ductility is less than 1 (i.e., before yield displacement) for columns with
minimal transverse reinforcement. The models that do not consider the aspect ratio (Ashheim and
Moehle 1992, Xiao and Martirossyan 1998, Catrans 2002), presented by dotted lines in the figures,
expect faster degradation in concrete shear strength (i.e., rapid line slopes) due to increasing
ductility in general. The strength degradation due to increasing ductility is mostly because aggregate
interlocking reduces as crack widths become wider (Priestly et al. 1994). Among the models
reviewed above, Sezen and Moehle (2004) predicts the highest residual shear strength of concrete at
high ductility demand.
Fig. 10(b) illustrates the impact of column aspect ratio for cases of the displacement ductility
equal to or less than 1. As mentioned earlier, Ashheim and Moehle (1992), Xiao and Martirossyan
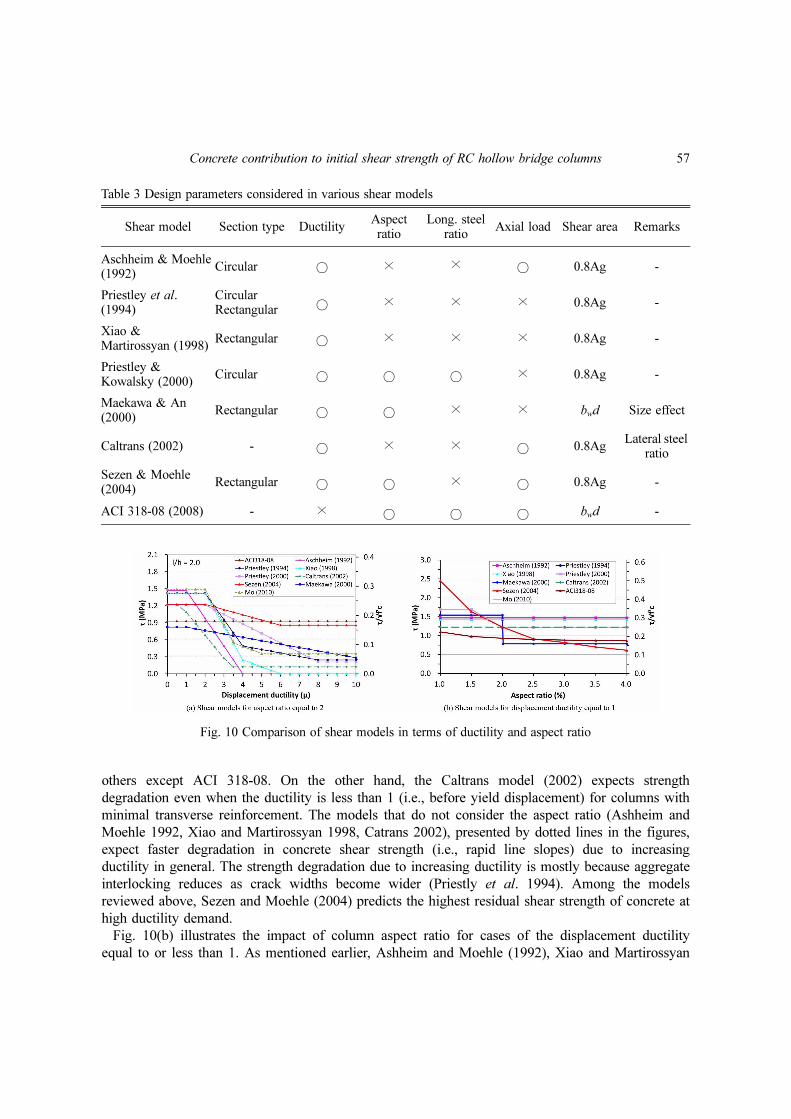
Table 3 Design parameters considered in various shear models
Shear model Section type DuctilityAspectratio
Long. steel ratio
Axial load Shear area Remarks
Aschheim & Moehle (1992)
Circular ○ × × ○ 0.8Ag -
Priestley et al.(1994)
CircularRectangular ○ × × × 0.8Ag -
Xiao & Martirossyan (1998)
Rectangular ○ × × × 0.8Ag -
Priestley & Kowalsky (2000)
Circular ○ ○ ○ × 0.8Ag -
Maekawa & An (2000)
Rectangular ○ ○ × × bwd Size effect
Caltrans (2002) - ○ × × ○ 0.8AgLateral steel
ratio
Sezen & Moehle (2004)
Rectangular ○ ○ × ○ 0.8Ag -
ACI 318-08 (2008) - × ○ ○ ○ bwd -
Fig. 10 Comparison of shear models in terms of ductility and aspect ratio
58 Ick-Hyun Kim, Chang-Ho Sun and Myoungsu Shin
(1998), Catrans Seismic Design Criteria (2002) do not take into account the effect of column aspect
ratio. In the revised UCSD model and Maekawa and An (2000), concrete shear strength do not
change for columns with the aspect ratio more than 2. ACI 318-08 shows the smallest variation in
the concrete contribution due to the aspect ratio, while Sezen and Moehle (2004) proposed the
largest change. In general, the models that do not consider the aspect ratio give higher initial shear
strengths than the other models for larger aspect ratios than approximately 2 (see Table 4 also).
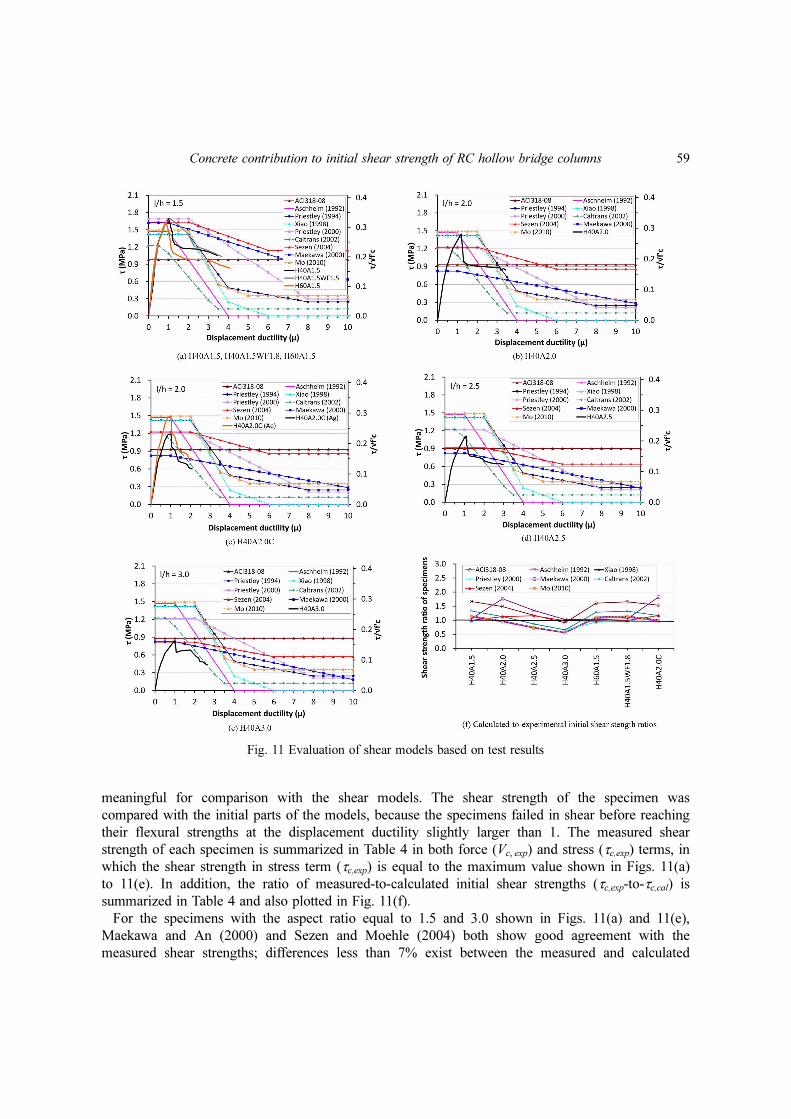
5. Evaluation of shear models based on test results
Figs. 11(a) to 11(e) compare the shear stress vs. ductility response of each specimen with the
various shear models reviewed above. Note that the test results and analytical models in this figure
were compared in stress term (i.e., MPa units). As discussed earlier, for the specimens tested under
monotonic loading, the shear stress, τ, was determined as the lateral load, V, divided by the gross
section area, Ag. On the other hand, 0.8Ag was used as the effective shear area for H40A2.0C that
was subjected to reversed cyclic loading. The two different effective shear areas (Ag versus 0.8Ag)
were used based on the findings that the shear strength of H40A2.0C was roughly 83% of that of
H40A2.0. The use of 0.8Ag for H40A2.0C was in accordance with most of the existing shear
models, which assumed that the confined concrete core would be effective under lateral cyclic
loading (Ang et al. 1989). Also, the displacement ductility, µ, of the specimen was taken equal to 1
at the yield displacement ( ) defined in Fig. 12.
Note that each figure illustrates the entire load-drift response of the specimen with the indicated
aspect ratio (l/h), whereas the maximum load (i.e., shear strength) of the specimen is most
∆y
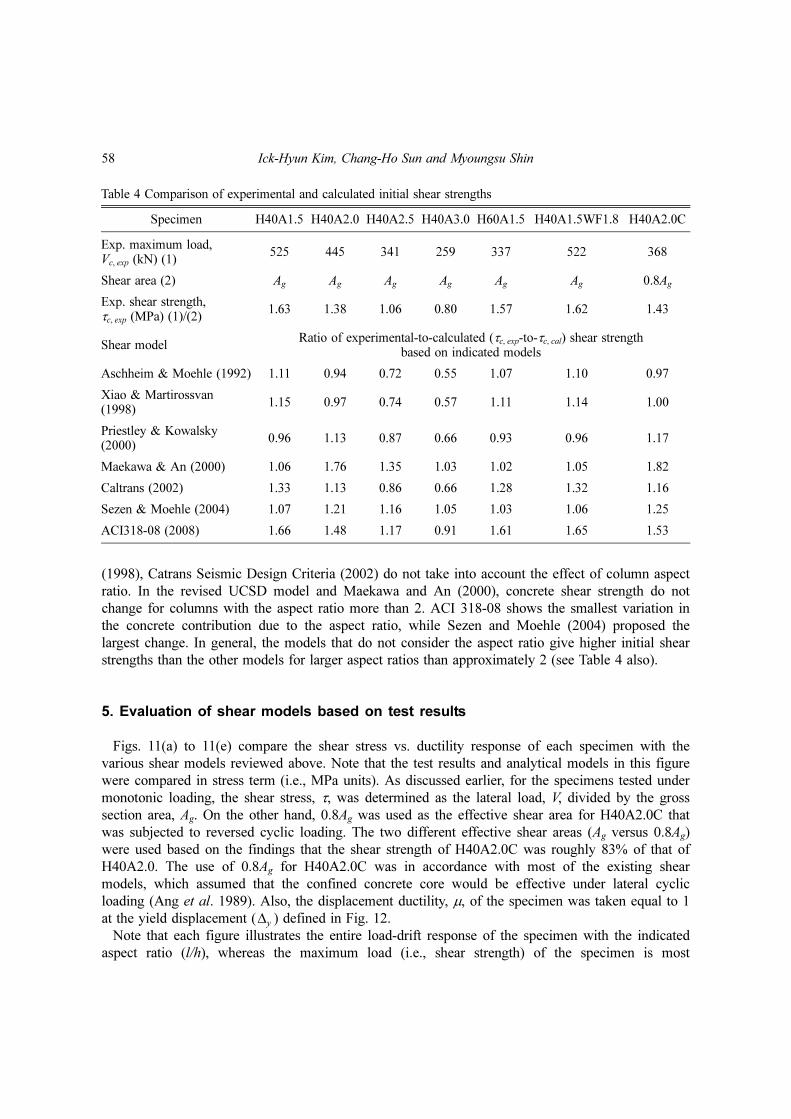
Table 4 Comparison of experimental and calculated initial shear strengths
Specimen H40A1.5 H40A2.0 H40A2.5 H40A3.0 H60A1.5 H40A1.5WF1.8 H40A2.0C
Exp. maximum load,Vc, exp (kN) (1)
525 445 341 259 337 522 368
Shear area (2) Ag Ag Ag Ag Ag Ag 0.8Ag
Exp. shear strength,τc, exp (MPa) (1)/(2)
1.63 1.38 1.06 0.80 1.57 1.62 1.43
Shear modelRatio of experimental-to-calculated (τc, exp-to-τc, cal) shear strength
based on indicated models
Aschheim & Moehle (1992) 1.11 0.94 0.72 0.55 1.07 1.10 0.97
Xiao & Martirossvan (1998)
1.15 0.97 0.74 0.57 1.11 1.14 1.00
Priestley & Kowalsky (2000)
0.96 1.13 0.87 0.66 0.93 0.96 1.17
Maekawa & An (2000) 1.06 1.76 1.35 1.03 1.02 1.05 1.82
Caltrans (2002) 1.33 1.13 0.86 0.66 1.28 1.32 1.16
Sezen & Moehle (2004) 1.07 1.21 1.16 1.05 1.03 1.06 1.25
ACI318-08 (2008) 1.66 1.48 1.17 0.91 1.61 1.65 1.53
Concrete contribution to initial shear strength of RC hollow bridge columns 59
meaningful for comparison with the shear models. The shear strength of the specimen was
compared with the initial parts of the models, because the specimens failed in shear before reaching
their flexural strengths at the displacement ductility slightly larger than 1. The measured shear
strength of each specimen is summarized in Table 4 in both force (Vc, exp) and stress (τc,exp) terms, in
which the shear strength in stress term (τc,exp) is equal to the maximum value shown in Figs. 11(a)
to 11(e). In addition, the ratio of measured-to-calculated initial shear strengths (τc,exp-to-τc,cal) is
summarized in Table 4 and also plotted in Fig. 11(f).
For the specimens with the aspect ratio equal to 1.5 and 3.0 shown in Figs. 11(a) and 11(e),
Maekawa and An (2000) and Sezen and Moehle (2004) both show good agreement with the
measured shear strengths; differences less than 7% exist between the measured and calculated
Fig. 11 Evaluation of shear models based on test results

60 Ick-Hyun Kim, Chang-Ho Sun and Myoungsu Shin
strengths (see Table 4). Note that Fig. 11(a) includes three specimens, H40A1.5, H40A1.5WF1.8,
and H60A1.5, which had the shear strength of 1.63, 1.62, and 1.57 MPa, respectively. In particular,
only the two aforesaid models give the calculated strengths larger (but very similar) than the
measured for H40A3.0. For the other specimens, Sezen and Moehle (2004) shows closer estimation
than the others as shown in Fig. 11(f). In general, the ratio of measured-to-calculated shear strengths
(τc,exp-to-τc,cal) is smaller in the specimen with the larger aspect ratio (see Fig. 11(f)).
ACI 318-08 gives quite conservative estimates (larger than roughly 150% of the measured
strength) for the specimens with the aspect ratio smaller than 2, while it gives approximately a 10%
smaller estimate for H40A3.0 with the aspect ratio of 3. The ACI 318 method would seem more
conservative than shown in Fig. 11 when the measured and calculated shear strengths are compared
in force term, because the web area (bwd) used in ACI 318-08 is smaller than even 0.8Ag for the
specimens of this study. In this sense, the 10% smaller estimate for H40A3.0 appears to be in the
conservative side. On the other hand, the ACI 318-08 method could be unconservative when high
ductility demand (more than about 4) is expected, especially for columns with large aspect ratios; in
Figs. 11(d) and 11(e), the ACI 318-08 model gives much higher shear strengths than the other shear
models.
6. Proposed model for initial concrete shear strength of hollow columns
Fig. 13 illustrates an RC column under lateral loading. It may be assumed that an element
indicated in the figure is under a uniform stress condition with the shear stress, τ, the normal stress
parallel to the column axis, σy, and the normal stress perpendicular to the column axis, σx. Then, the
principal tensile stress, σ1, may be defined from equilibrium conditions as
(23)
Here, σx can be assumed zero, which is reasonable in typical hollow columns with no confining
σ1
σx σy+
2----------------
σx σy–
2----------------⎝ ⎠⎛ ⎞
2
τ2
++=
Fig. 12 Definitions for yield displacement (∆y) and displacement ductility (µ)
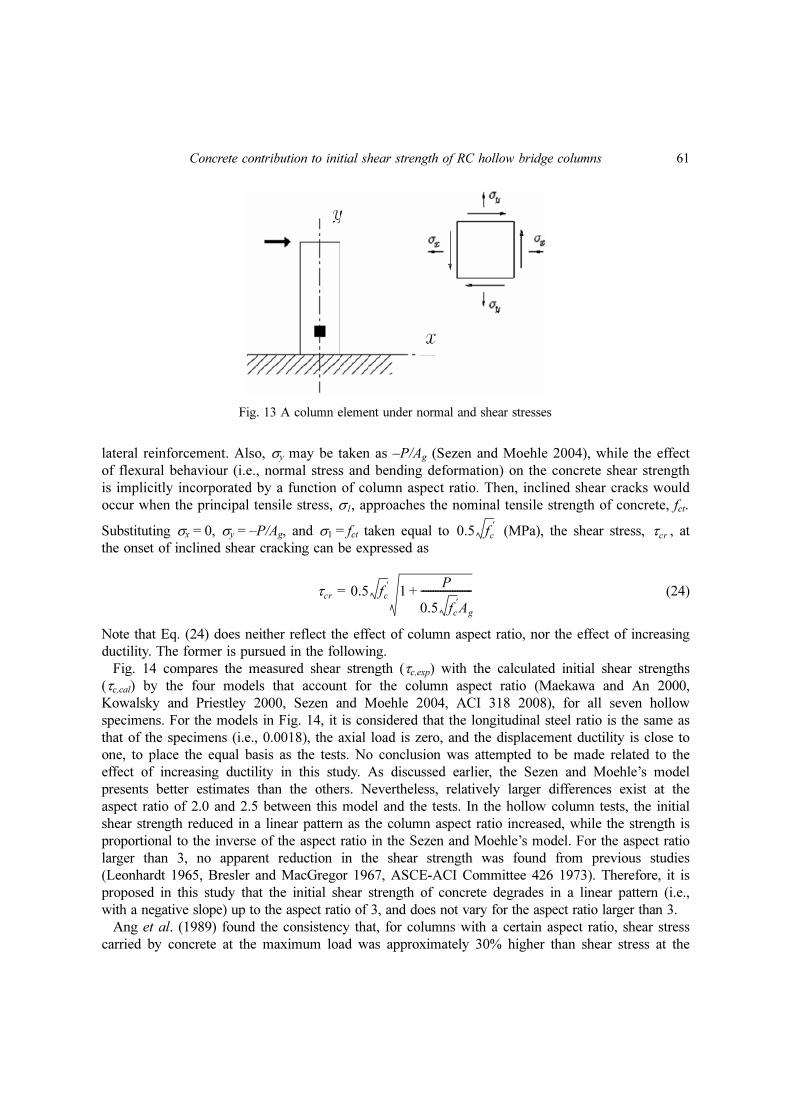
Concrete contribution to initial shear strength of RC hollow bridge columns 61
lateral reinforcement. Also, σy may be taken as –P/Ag (Sezen and Moehle 2004), while the effect
of flexural behaviour (i.e., normal stress and bending deformation) on the concrete shear strength
is implicitly incorporated by a function of column aspect ratio. Then, inclined shear cracks would
occur when the principal tensile stress, σ1, approaches the nominal tensile strength of concrete, fct.
Substituting σx = 0, σy = –P/Ag, and σ1 = fct taken equal to (MPa), the shear stress, , at
the onset of inclined shear cracking can be expressed as
(24)
Note that Eq. (24) does neither reflect the effect of column aspect ratio, nor the effect of increasing
ductility. The former is pursued in the following.
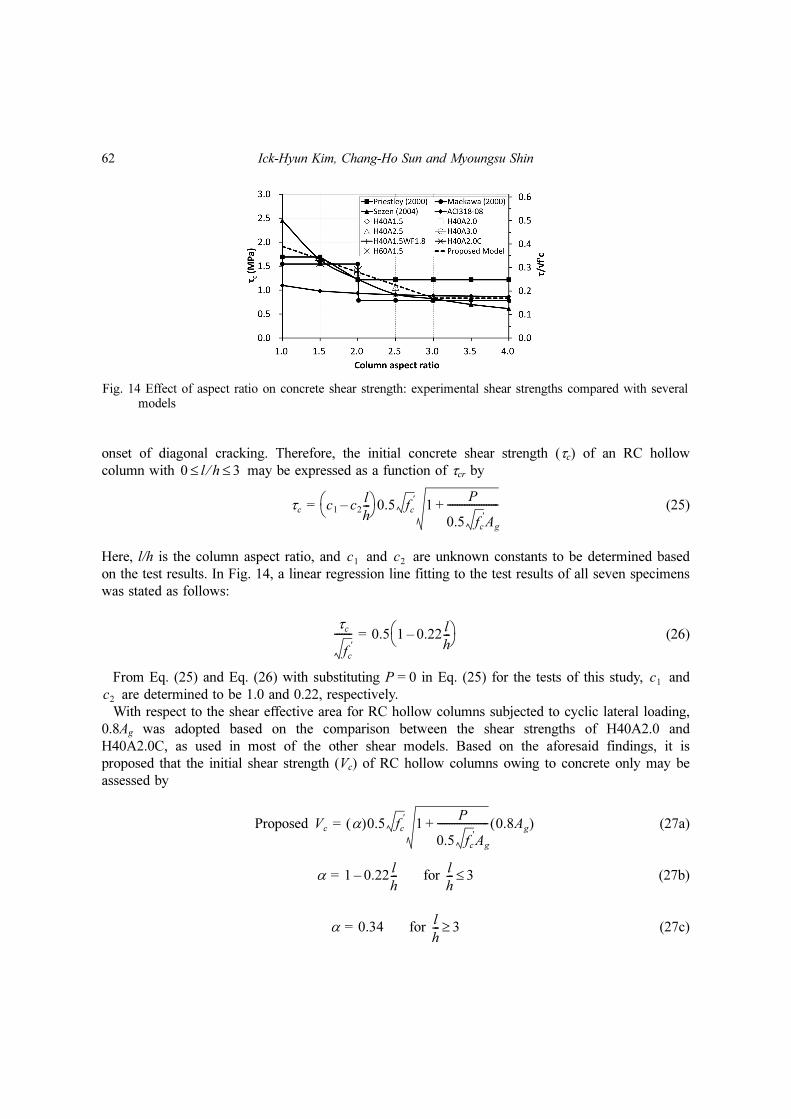
Fig. 14 compares the measured shear strength (τc,exp) with the calculated initial shear strengths
(τc,cal) by the four models that account for the column aspect ratio (Maekawa and An 2000,
Kowalsky and Priestley 2000, Sezen and Moehle 2004, ACI 318 2008), for all seven hollow
specimens. For the models in Fig. 14, it is considered that the longitudinal steel ratio is the same as
that of the specimens (i.e., 0.0018), the axial load is zero, and the displacement ductility is close to
one, to place the equal basis as the tests. No conclusion was attempted to be made related to the
effect of increasing ductility in this study. As discussed earlier, the Sezen and Moehle’s model
presents better estimates than the others. Nevertheless, relatively larger differences exist at the
aspect ratio of 2.0 and 2.5 between this model and the tests. In the hollow column tests, the initial
shear strength reduced in a linear pattern as the column aspect ratio increased, while the strength is
proportional to the inverse of the aspect ratio in the Sezen and Moehle’s model. For the aspect ratio
larger than 3, no apparent reduction in the shear strength was found from previous studies
(Leonhardt 1965, Bresler and MacGregor 1967, ASCE-ACI Committee 426 1973). Therefore, it is
proposed in this study that the initial shear strength of concrete degrades in a linear pattern (i.e.,
with a negative slope) up to the aspect ratio of 3, and does not vary for the aspect ratio larger than 3.
Ang et al. (1989) found the consistency that, for columns with a certain aspect ratio, shear stress
carried by concrete at the maximum load was approximately 30% higher than shear stress at the
0.5 fc ′
τcr
τcr 0.5 fc ′
1P
0.5 fc ′Ag
---------------------+=
Fig. 13 A column element under normal and shear stresses
62 Ick-Hyun Kim, Chang-Ho Sun and Myoungsu Shin
onset of diagonal cracking. Therefore, the initial concrete shear strength (τc) of an RC hollow
column with may be expressed as a function of τcr by
(25)
Here, l/h is the column aspect ratio, and and are unknown constants to be determined based
on the test results. In Fig. 14, a linear regression line fitting to the test results of all seven specimens
was stated as follows:
(26)
From Eq. (25) and Eq. (26) with substituting P = 0 in Eq. (25) for the tests of this study, and
are determined to be 1.0 and 0.22, respectively.
With respect to the shear effective area for RC hollow columns subjected to cyclic lateral loading,
0.8Ag was adopted based on the comparison between the shear strengths of H40A2.0 and
H40A2.0C, as used in most of the other shear models. Based on the aforesaid findings, it is
proposed that the initial shear strength (Vc) of RC hollow columns owing to concrete only may be
assessed by
Proposed (27a)
for (27b)
for (27c)
0 l≤ h 3≤⁄
τc c1 c2
l
h---–⎝ ⎠
⎛ ⎞0.5 fc ′
1P
0.5 fc ′Ag
---------------------+=
c1 c2
τc
fc ′
------- 0.5 1 0.22l
h---–⎝ ⎠
⎛ ⎞=
c1
c2
Vc α( )0.5 fc ′
1P
0.5 fc ′Ag
---------------------+ 0.8Ag( )=
α 1 0.22l
h---–=
l
h--- 3≤
α 0.34=l
h--- 3≥
Fig. 14 Effect of aspect ratio on concrete shear strength: experimental shear strengths compared with severalmodels
Concrete contribution to initial shear strength of RC hollow bridge columns 63
It should be noted, however, that the proposed effect of column aspect ratio ( ) is based on the
limited number of hollow column tests, due to the lack of available hollow column specimens that
failed in premature shear mode; almost all hollow column specimens reported in literature (Yeh et al.
2002, Mo et al. 2003, Mo et al. 2004, Cheng et al. 2005) developed relatively ductile plastic hinging
before ultimate shear failure, if any. Also, the effect of longitudinal steel ratio on the concrete shear
contribution is not explicitly embodied in the proposed model due to the lack of data. Therefore,
more test data should be solicited from the research society of earthquake-resistant design.
7. Conclusions
In this study, an experimental program was conducted for seven large-scale reinforced concrete
(RC) rectangular hollow columns subjected to monotonic or cyclic lateral loads, to identify concrete
contribution to the initial shear strength of such columns. Also, pioneering shear models proposed
around the world, all of which were mainly based on tests for columns with solid sections, were
reviewed and compared with the test results of this study. Finally, an empirical equation was
proposed for the concrete shear contribution in RC hollow columns. The findings and conclusions
drawn based on the experimental and analytical results include the following:
1. The specimen with the higher column aspect ratio generally showed the smaller stiffness after
the initiation of diagonal cracking, and ultimately reached the smaller maximum load. The
reduction in the maximum load was likely in part because the confinement effect of the footing
was lesser in columns with higher aspect ratios, and also in part because increased normal stress
due to higher bending moment interacted with shear stress against the given tensile capacity of
concrete.
2. The two specimens, H40A1.5 and H40A1.5WF1.8, with different web area ratios but with the
same gross section area, achieved similar maximum loads (i.e., shear strengths in force term).
Also, the two specimens, H40A1.5 and H60A1.5, with different hollow section ratios, had similar
maximum loads normalized by their gross section areas (i.e., shear strengths in stress term). Based
on these results, it was concluded that the shear strength of an RC hollow column is associated
more with the gross section area than the web area.
3. The specimen tested under reversed cyclic loading, H40A2.0C, achieved approximately 83% of
the shear strength of the companion specimen under monotonic loading, H40A2.0. This was
mostly because H40A2.0C underwent strength and stiffness degradations due to the crossing of
diagonal cracks under reversed cyclic loading.
4. ACI 318-08 gives quite conservative design shear strengths (larger than roughly 150% of the
measured strengths) for the specimens with the aspect ratio smaller than 2. On the other hand, the
ACI 318-08 equation could be unconservative when high ductility demand (more than about 4) is
expected, especially for columns with large aspect ratios.
5. The Sezen and Moehle’s model presents better shear strength estimates than the other models
for the seven hollow specimens of this study. In the hollow column tests, however, the initial
shear strength reduced in a linear pattern as the column aspect ratio increased, while the strength
is proportional to the inverse of the aspect ratio in the Sezen and Moehle’s model.
6. Based on the experimental and analytical results, it was proposed that the initial shear strength
of RC hollow columns owing to concrete only may be assessed by Eq. (27). It should be noted,
however, that the proposed effect of column aspect ratio is based on the limited number of hollow
α

64 Ick-Hyun Kim, Chang-Ho Sun and Myoungsu Shin
column tests, due to the lack of available hollow column specimens that showed premature shear
failure.
Acknowledgements
This research was supported by Basic Science Research Program through the National Research
Foundation of Korea (NRF) funded by the Ministry of Education, Science and Technology (Grant
No. 2011-0026780). Also, this work was supported by the 2010 Research Fund of the Ulsan
National Institute of Science and Technology (UNIST), Korea. The authors would like to
acknowledge continued support from their affiliations.
References
AASHTO (2002), LRFD Bridge Design Specifications, 2nd Edition, American Association of State Highway andTransportation Officials, Washington, D.C.
ACI Committee 318 (2008), Building Code Requirements for Reinforced Concrete (ACI 318-08) andCommentary (ACI 318R-08), American Concrete Institute, Famington Hills, Michigan.
American Society of Civil Engineers (2007), Seismic Rehabilitation of Existing Buildings, ASCE/SEI 41-06,Reston, VA.
Ang, B.G., Priestley, M.J.N. and Paulay, T. (1989), “Seismic shear strength of circular reinforced concretecolumns,” ACI Struct. J., 86(1), 45-59.
Applied Technical Council (1981), Seismic Design Guidelines for Highway Bridges, Report No. ATC-6,Berkeley, CA.
Applied Technology Council (1996), Improved Seismic Design Criteria for California Bridges: ProvisionalRecommendations, Report No. ATC-32, Redwood City, CA.
Applied Technology Council (1996), Seismic Evaluation and Retrofit Concrete Buildings, Report No. ATC-40,Redwood City, CA.
ASCE-ACI Task Committee 426 (1973), “The shear strength of reinforced concrete members,” ASCE J. Struct.Div., 99(6), 1091-1187.
Aschheim, A.M. and Moehle, J.P. (1992), “Shear strength and deformability of RC bridge columns subjected toinelastic displacements,” Technical Report No. UCB/EERC 92/04, University of California at Berkeley,Berkeley, CA.
Bresler, B. and MacGregor, J.G. (1967), “Review of concrete beams failing in shear,” ASCE J. Struct. Div., 93,343-372.
Caglar, N. (2009), “Neural network based approach for determining the shear strength of circular reinforcedconcrete columns,” Constr. Build. Mater., 23, 3225-3232.
Caltrans (2002), Caltrans Seismic Design Criteria, Version 1.3, California Department of Transportation,Sacramento, CA.
Cheng, C.T., Mo, Y.L. and Yeh, Y.K. (2005), “Evaluation of as-built, retrofitted, and repaired shear-criticalhollow bridge columns under earthquake-type loading,” ASCE J. Bridge Eng., 10(5), 520-529.
Federal Emergency Management Agency (1997), NEHRP Guidelines for the Seismic Rehabilitation of Buildings,FEMA 273, Washington, D.C.
Federal Emergency Management Agency (2000), Prestandard and Commentary for the Seismic Rehabilitation ofBuildings, FEMA 356, Washington, D.C.
Hartsuijker, C. and Welleman, J.W. (2007), Engineering Mechanics, Volume 2: Stresses, Strains, Displacements,Springer, Dordrecht, The Netherlands.
Howser, R., Laskar, A. and Mo, Y.L. (2010), “Seismic interaction of flexural ductility and shear capacity inreinforced concrete columns,” Struct. Eng. Mech., 35(5), 593-616.
Concrete contribution to initial shear strength of RC hollow bridge columns 65
Kowalsky, M.J. and Priestley, M.J.N. (2000), “Improved analytical model for shear strength of circular reinforcedconcrete columns in seismic regions,” ACI Struct. J., 97(3), 388-396.
Leonhardt, F. (1965), “Reducing the shear reinforcement in reinforced concrete beams,” Mag. Concrete Res.,17(53), 187-198.
Maekawa, K. and An, X. (2000), “Shear failure and ductility of RC columns after yielding of mainreinforcement,” Eng. Fract. Mech., 65, 335-368.
Mo, Y.L., Wong, D.C. and Maekawa, K. (2003), “Seismic performance of hollow bridge columns,” ACI Struct.J., 100(3), 337-348.
Mo, Y.L., Yeh, Y.K. and Hsieh, D.M. (2004), “Seismic retrofit of hollow rectangular bridge columns,” J.Compos. Constr., 8(1), 60-68.
Mostafaei, H., Vecchio, F.J. and Kabeyasawa, T. (2009), “Deformation capacity of reinforced concrete columns,”ACI Struct. J., 106(2), 187-195.
Paulay, T. and Priestley, M.J.N. (1992), Seismic Design of Reinforced Concrete and Masonry Buildings, JohnWiley & Sons, New York, NY.
Priestley, M.J.N., Seible, F. and Calvi, G.M. (1996), Seismic Design and Retrofit of Bridges, John Wiley & Sons,New York, NY.
Prestley, M.J.N., Verma, R. and Xiao, Y. (1994), “Seismic shear strength of reinforced concrete columns,” J.Struct. Eng., 120(8), 2310-2329.
Sasani, M. (2007), “Life-safety and near-collapse capacity models for seismic shear behavior of reinforcedconcrete columns,” ACI Struct. J., 104(1), 30-38.
Sezen, H. (2008), “Shear deformation model for reinforced concrete columns,” Struct. Eng. Mech., 28(1), 39-52.Sezen, H. and Moehle, J.P. (2004), “Shear strength model for lightly reinforced concrete columns,” J. Struct.
Eng., 130(11), 1692-1703.Stevens, N.J., Uzumeri, S.M. and Collins, M.P. (1991), “Reinforced concrete subjected to reversed cyclic shear -
experiments and constitutive model,” ACI Struct. J., 88(2), 135-146.Wong, Y.L., Paulay, T. and Priestley, M.J.N. (1993), “Response of circular reinforced concrete columns to multi-
directional seismic attack,” ACI Struct. J., 90(2), 180-191.Xiao, Y. and Martirossyan, A. (1998), “Seismic performance of high-strength concrete columns,” J. Struct. Eng.,
124(3), 241-251.Yang, K.H., Ashour, A.F. and Song, J.K. (2007), “Shear capacity of reinforced concrete beams using neural
network,” Int. J. Concrete Struct. Mater., 1(1), 63-73.Yeh, Y.K., Mo, Y.L. and Yang, C.Y. (2002), “Seismic performance of rectangular hollow bridge column,” J.
Struct. Eng., 128(1), 60-68.