Informe eTravel Benchmark Wave
37
1 eTravel Multichannel Benchmark Issue 17 September 2015
-
Upload
andres-romero-montero -
Category
Technology
-
view
632 -
download
4
Transcript of Informe eTravel Benchmark Wave
1
eTravelMultichannel Benchmark
Issue 17
September 2015
2
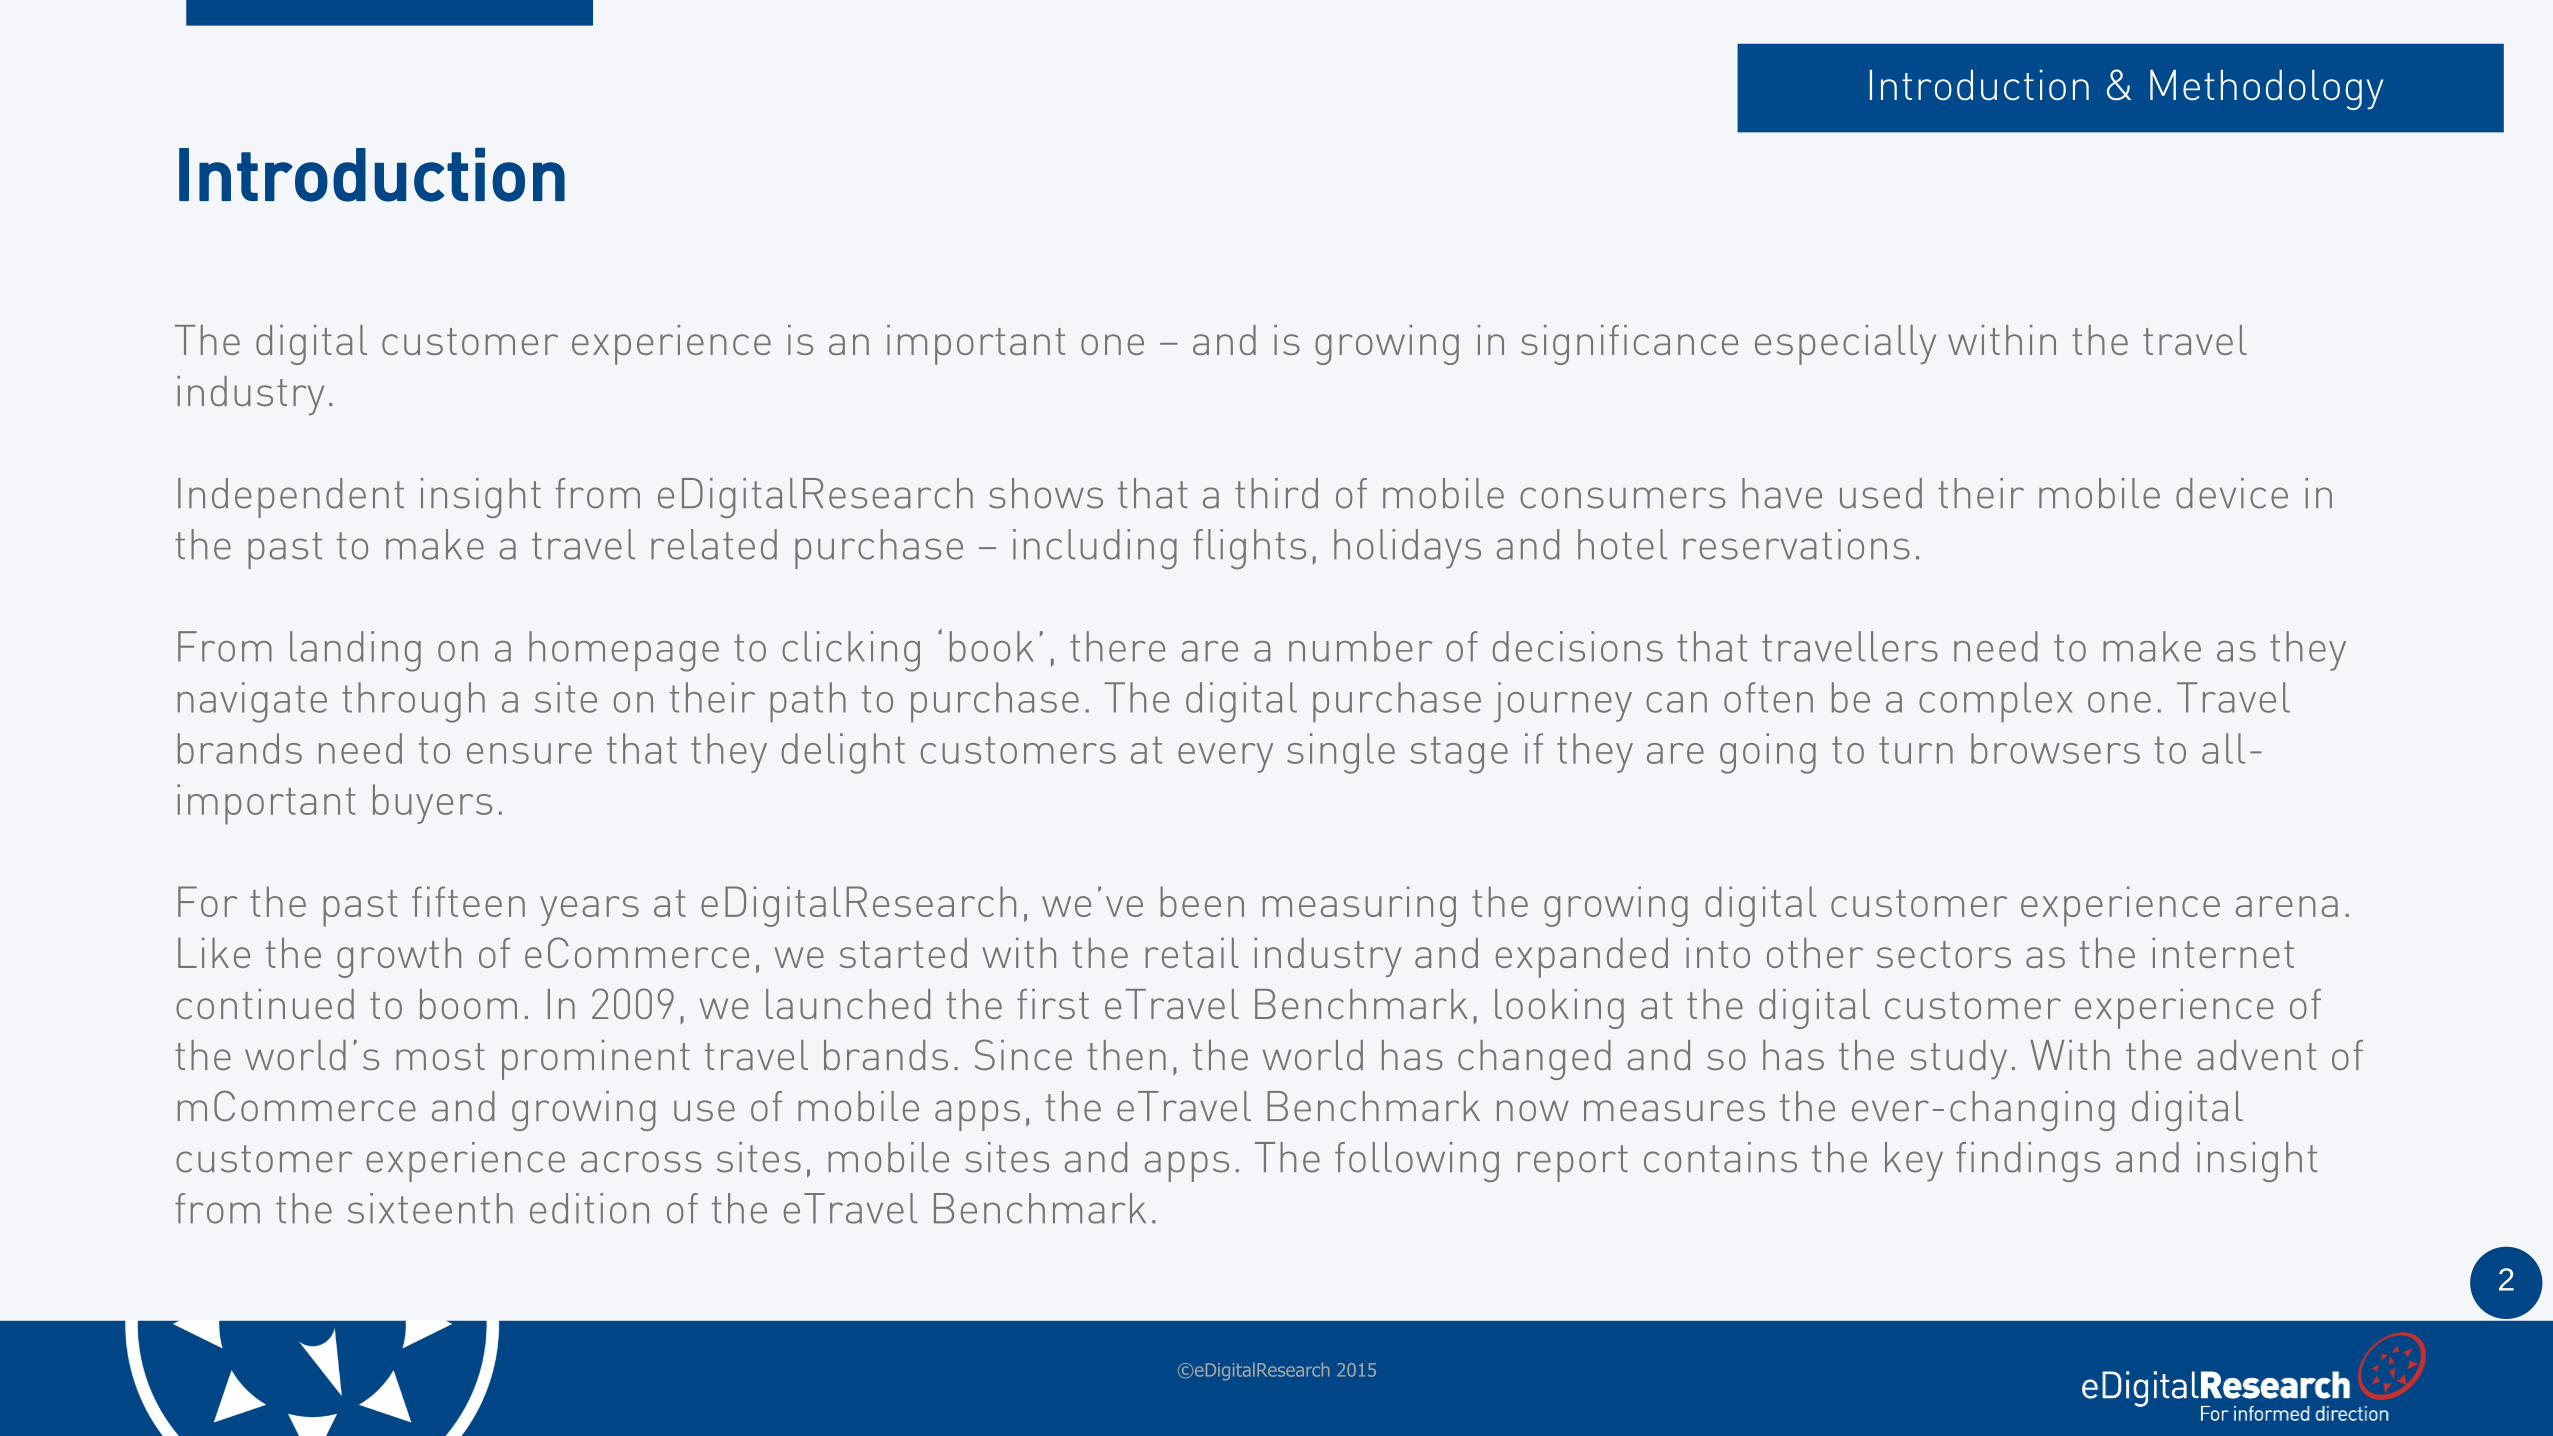
The digital customer experience is an important one – and is growing in significance especially within the travel industry.
Independent insight from eDigitalResearch shows that a third of mobile consumers have used their mobile device in the past to make a travel related purchase – including flights, holidays and hotel reservations.
From landing on a homepage to clicking ‘book’, there are a number of decisions that travellers need to make as they navigate through a site on their path to purchase. The digital purchase journey can often be a complex one. Travel brands need to ensure that they delight customers at every single stage if they are going to turn browsers to all-important buyers.
For the past fifteen years at eDigitalResearch, we’ve been measuring the growing digital customer experience arena. Like the growth of eCommerce, we started with the retail industry and expanded into other sectors as the internet continued to boom. In 2009, we launched the first eTravel Benchmark, looking at the digital customer experience of the world’s most prominent travel brands. Since then, the world has changed and so has the study. With the advent of mCommerce and growing use of mobile apps, the eTravel Benchmark now measures the ever-changing digital customer experience across sites, mobile sites and apps. The following report contains the key findings and insight from the sixteenth edition of the eTravel Benchmark.
Introduction
Introduction & Methodology
©eDigitalResearch 2015
3
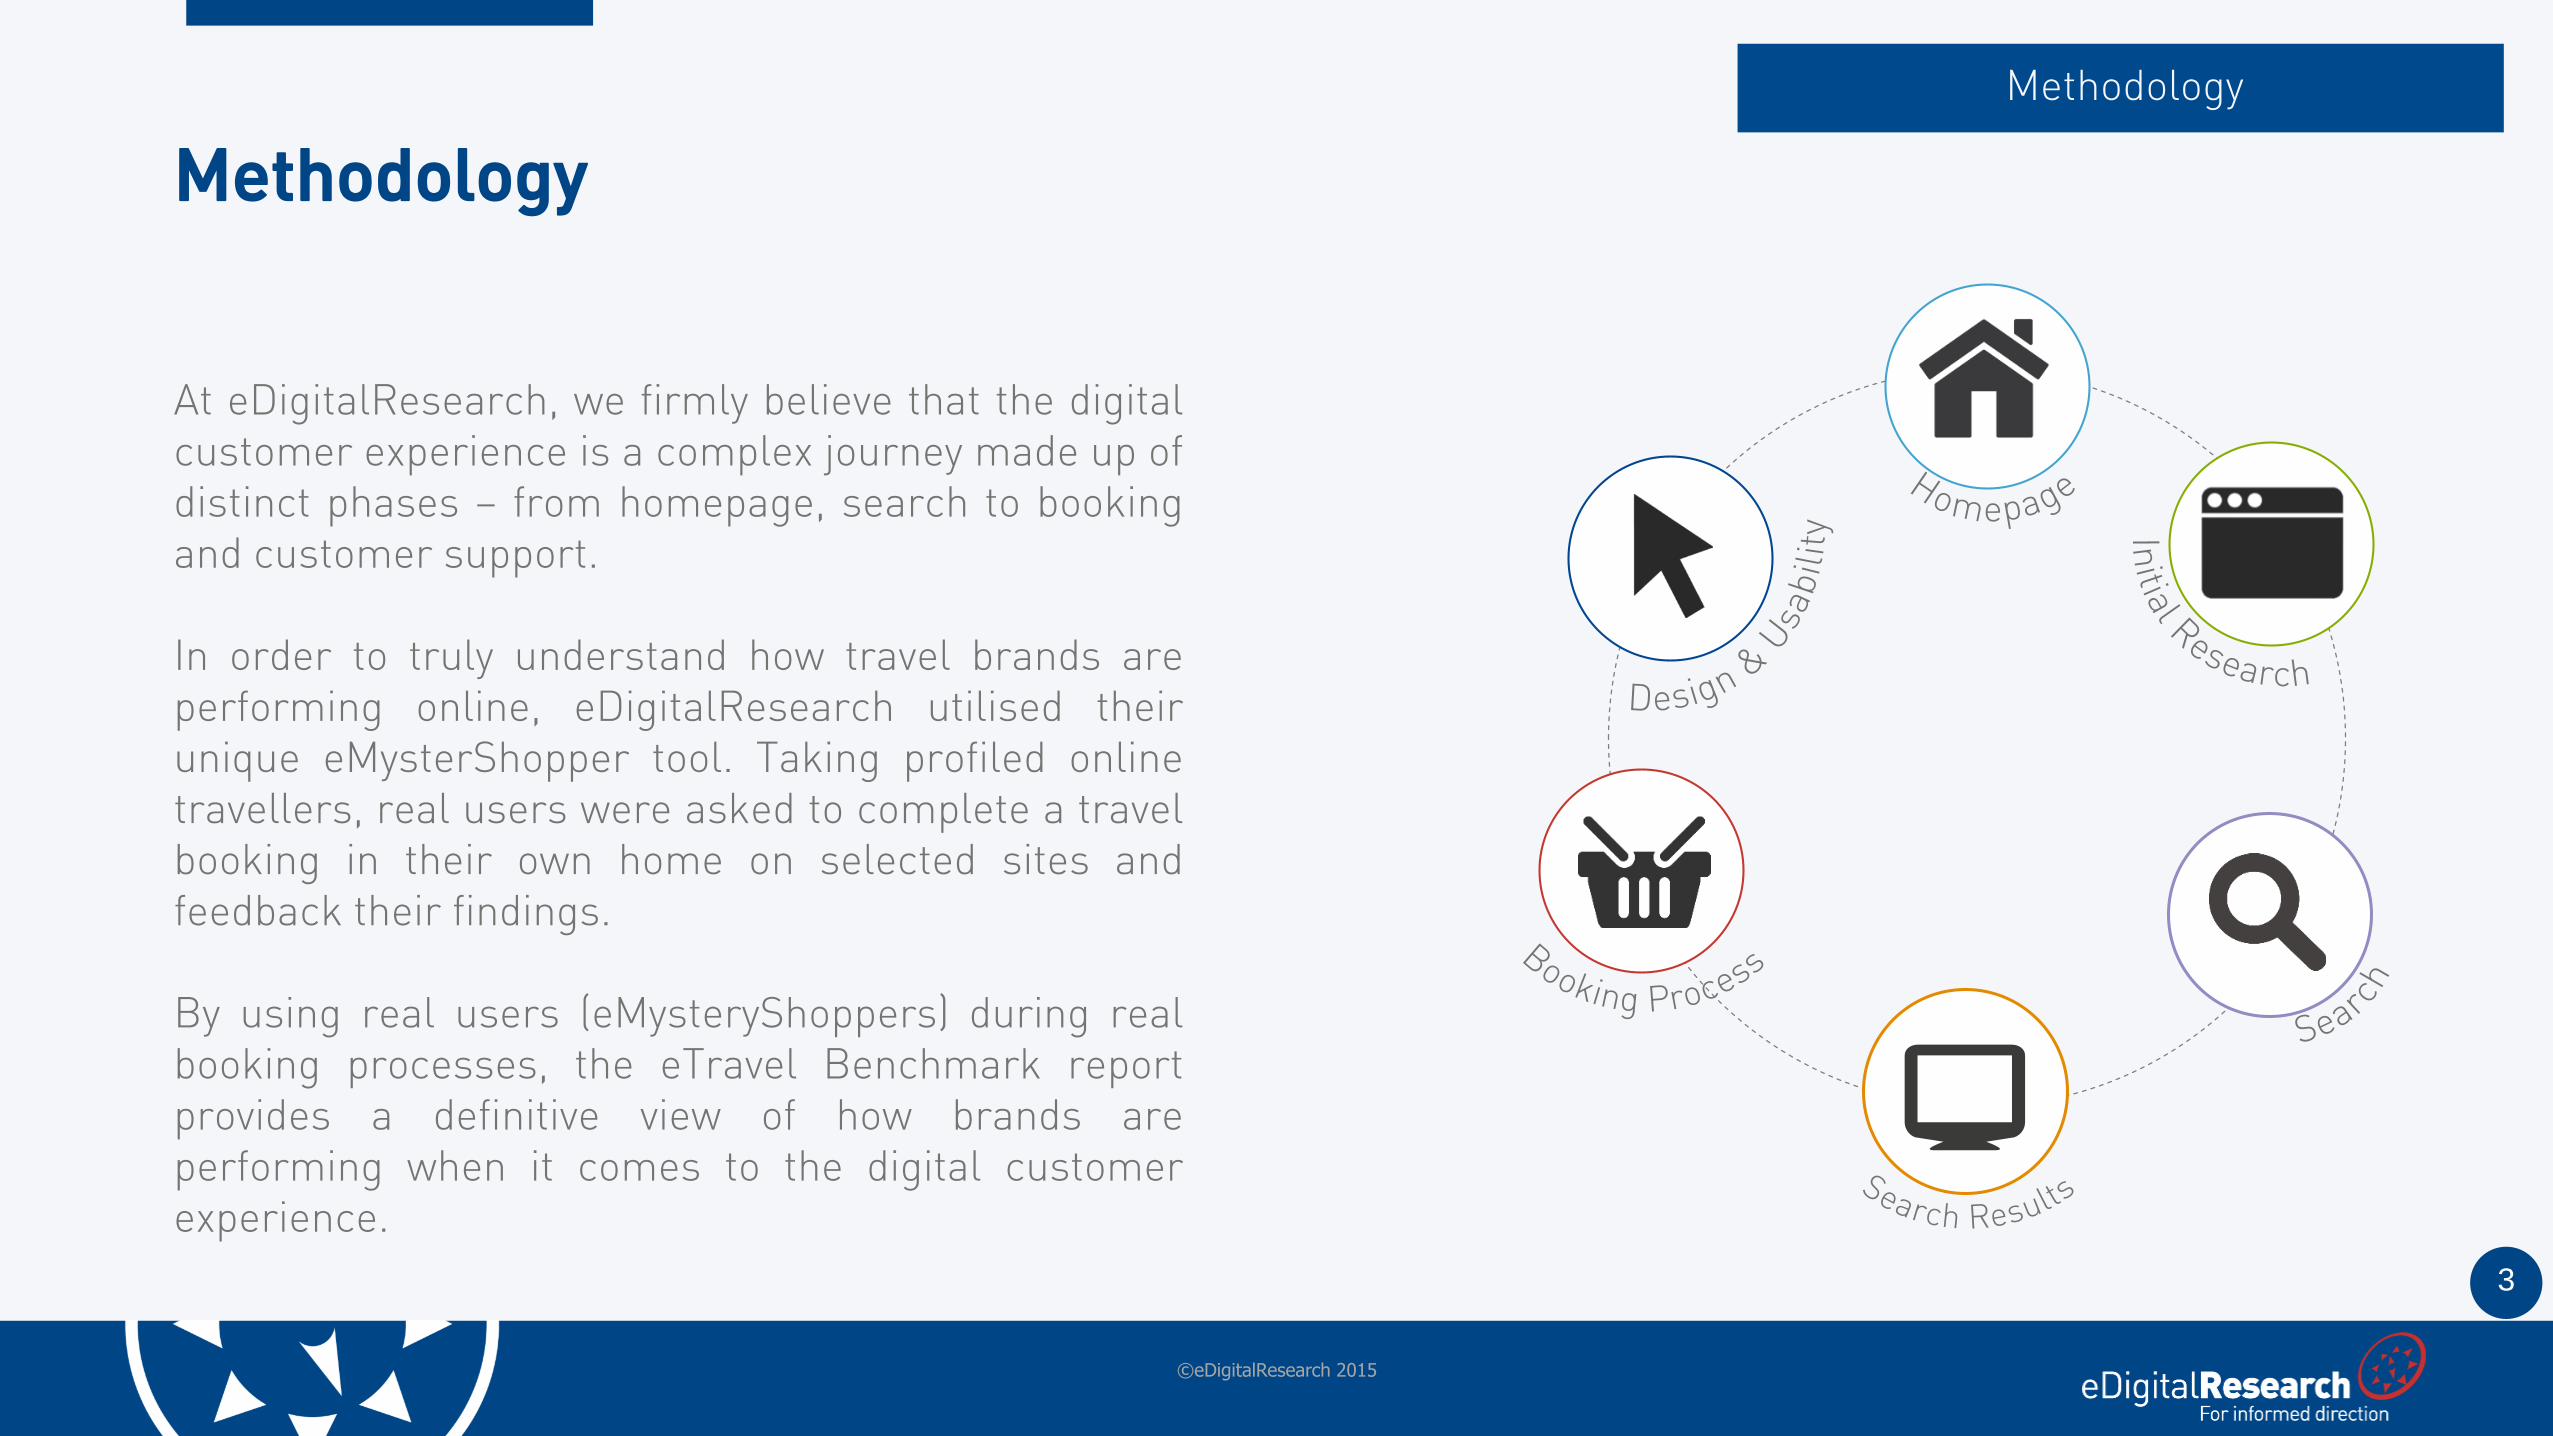
At eDigitalResearch, we firmly believe that the digitalcustomer experience is a complex journey made up ofdistinct phases – from homepage, search to bookingand customer support.
In order to truly understand how travel brands areperforming online, eDigitalResearch utilised theirunique eMysterShopper tool. Taking profiled onlinetravellers, real users were asked to complete a travelbooking in their own home on selected sites andfeedback their findings.
By using real users (eMysteryShoppers) during realbooking processes, the eTravel Benchmark reportprovides a definitive view of how brands areperforming when it comes to the digital customerexperience.
Methodology
Methodology
©eDigitalResearch 2015
4
The eTravel Benchmark includes a variety of brandsfrom the travel sector.
Brands included in the eTravel Benchmark must offerall three digital channels – web, mobile and app – andthe ability to complete a booking via each individualtouch point.
Each digital channel is reviewed by our UK widenetwork of eMysteryShoppers. It allows us to assessnot only the digital customer experience as a whole,but also measure a brand’s website, mobile and appexperience independently from one another – andprovide a comprehensive view of how and where thedigital customer experience can be improved.
Methodology
What brands do we cover?
©eDigitalResearch 2015
5
• Developments to mobile first impressions and design and usability has led to an increase in mobile site satisfaction, in some cases bringing mobile touch points higher than traditional sites
• Booking.com have once again topped the multichannel overall league table thanks to their high mobile and app scores
• For the first time TUI Group brands Thomson and First Choice appear within the eTravel Benchmark and rank second and third respectively within the multichannel league table
• As personalisation becomes increasing important within the online travel market an increasing number of brands are offering a more personalised visit for returning visitors
• An array of information available to give rich and detailed views of potential trips gives travel brands exceptional scores
Key Findings
Key Findings
©eDigitalResearch 2015
6
Insight and Results
©eDigitalResearch 2015
7
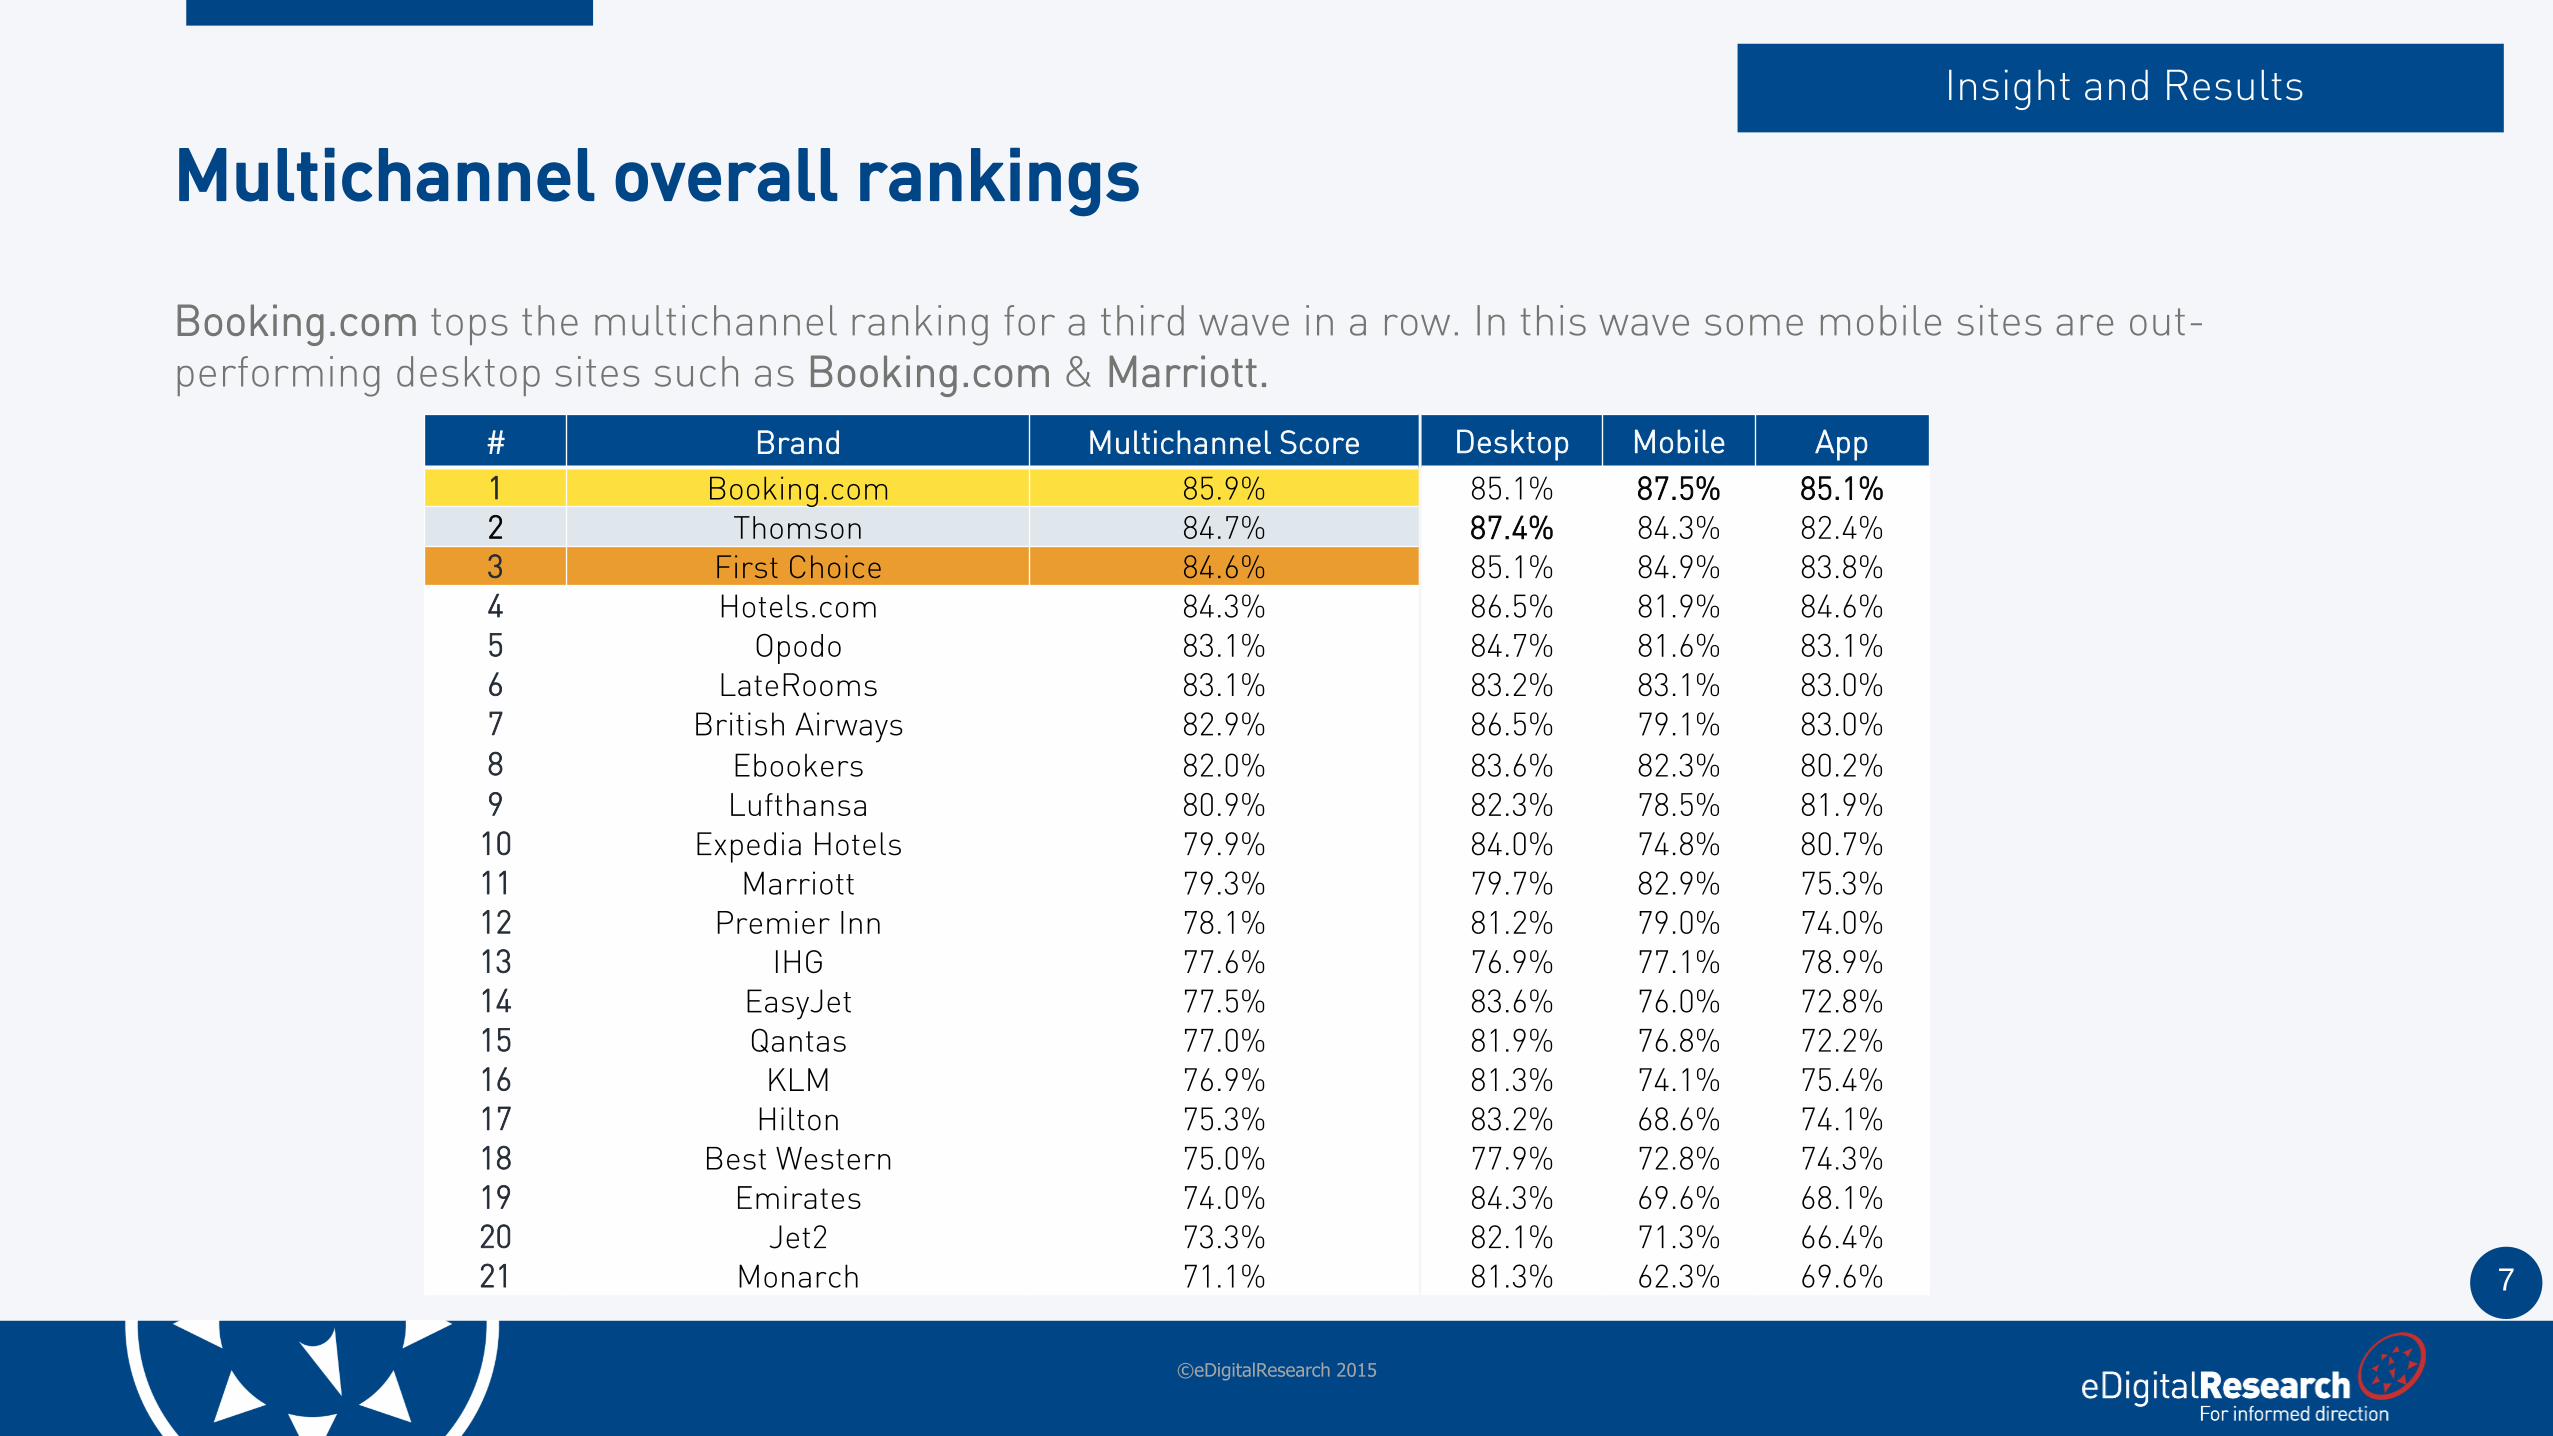
Booking.com tops the multichannel ranking for a third wave in a row. In this wave some mobile sites are out-performing desktop sites such as Booking.com & Marriott.
Multichannel overall rankings
Insight and Results
©eDigitalResearch 2015
# Brand Multichannel Score Desktop Mobile App
1 Booking.com 85.9% 85.1% 87.5% 85.1%2 Thomson 84.7% 87.4% 84.3% 82.4%3 First Choice 84.6% 85.1% 84.9% 83.8%4 Hotels.com 84.3% 86.5% 81.9% 84.6%5 Opodo 83.1% 84.7% 81.6% 83.1%6 LateRooms 83.1% 83.2% 83.1% 83.0%7 British Airways 82.9% 86.5% 79.1% 83.0%8 Ebookers 82.0% 83.6% 82.3% 80.2%9 Lufthansa 80.9% 82.3% 78.5% 81.9%
10 Expedia Hotels 79.9% 84.0% 74.8% 80.7%11 Marriott 79.3% 79.7% 82.9% 75.3%12 Premier Inn 78.1% 81.2% 79.0% 74.0%13 IHG 77.6% 76.9% 77.1% 78.9%14 EasyJet 77.5% 83.6% 76.0% 72.8%15 Qantas 77.0% 81.9% 76.8% 72.2%16 KLM 76.9% 81.3% 74.1% 75.4%17 Hilton 75.3% 83.2% 68.6% 74.1%18 Best Western 75.0% 77.9% 72.8% 74.3%19 Emirates 74.0% 84.3% 69.6% 68.1%20 Jet2 73.3% 82.1% 71.3% 66.4%21 Monarch 71.1% 81.3% 62.3% 69.6%
8
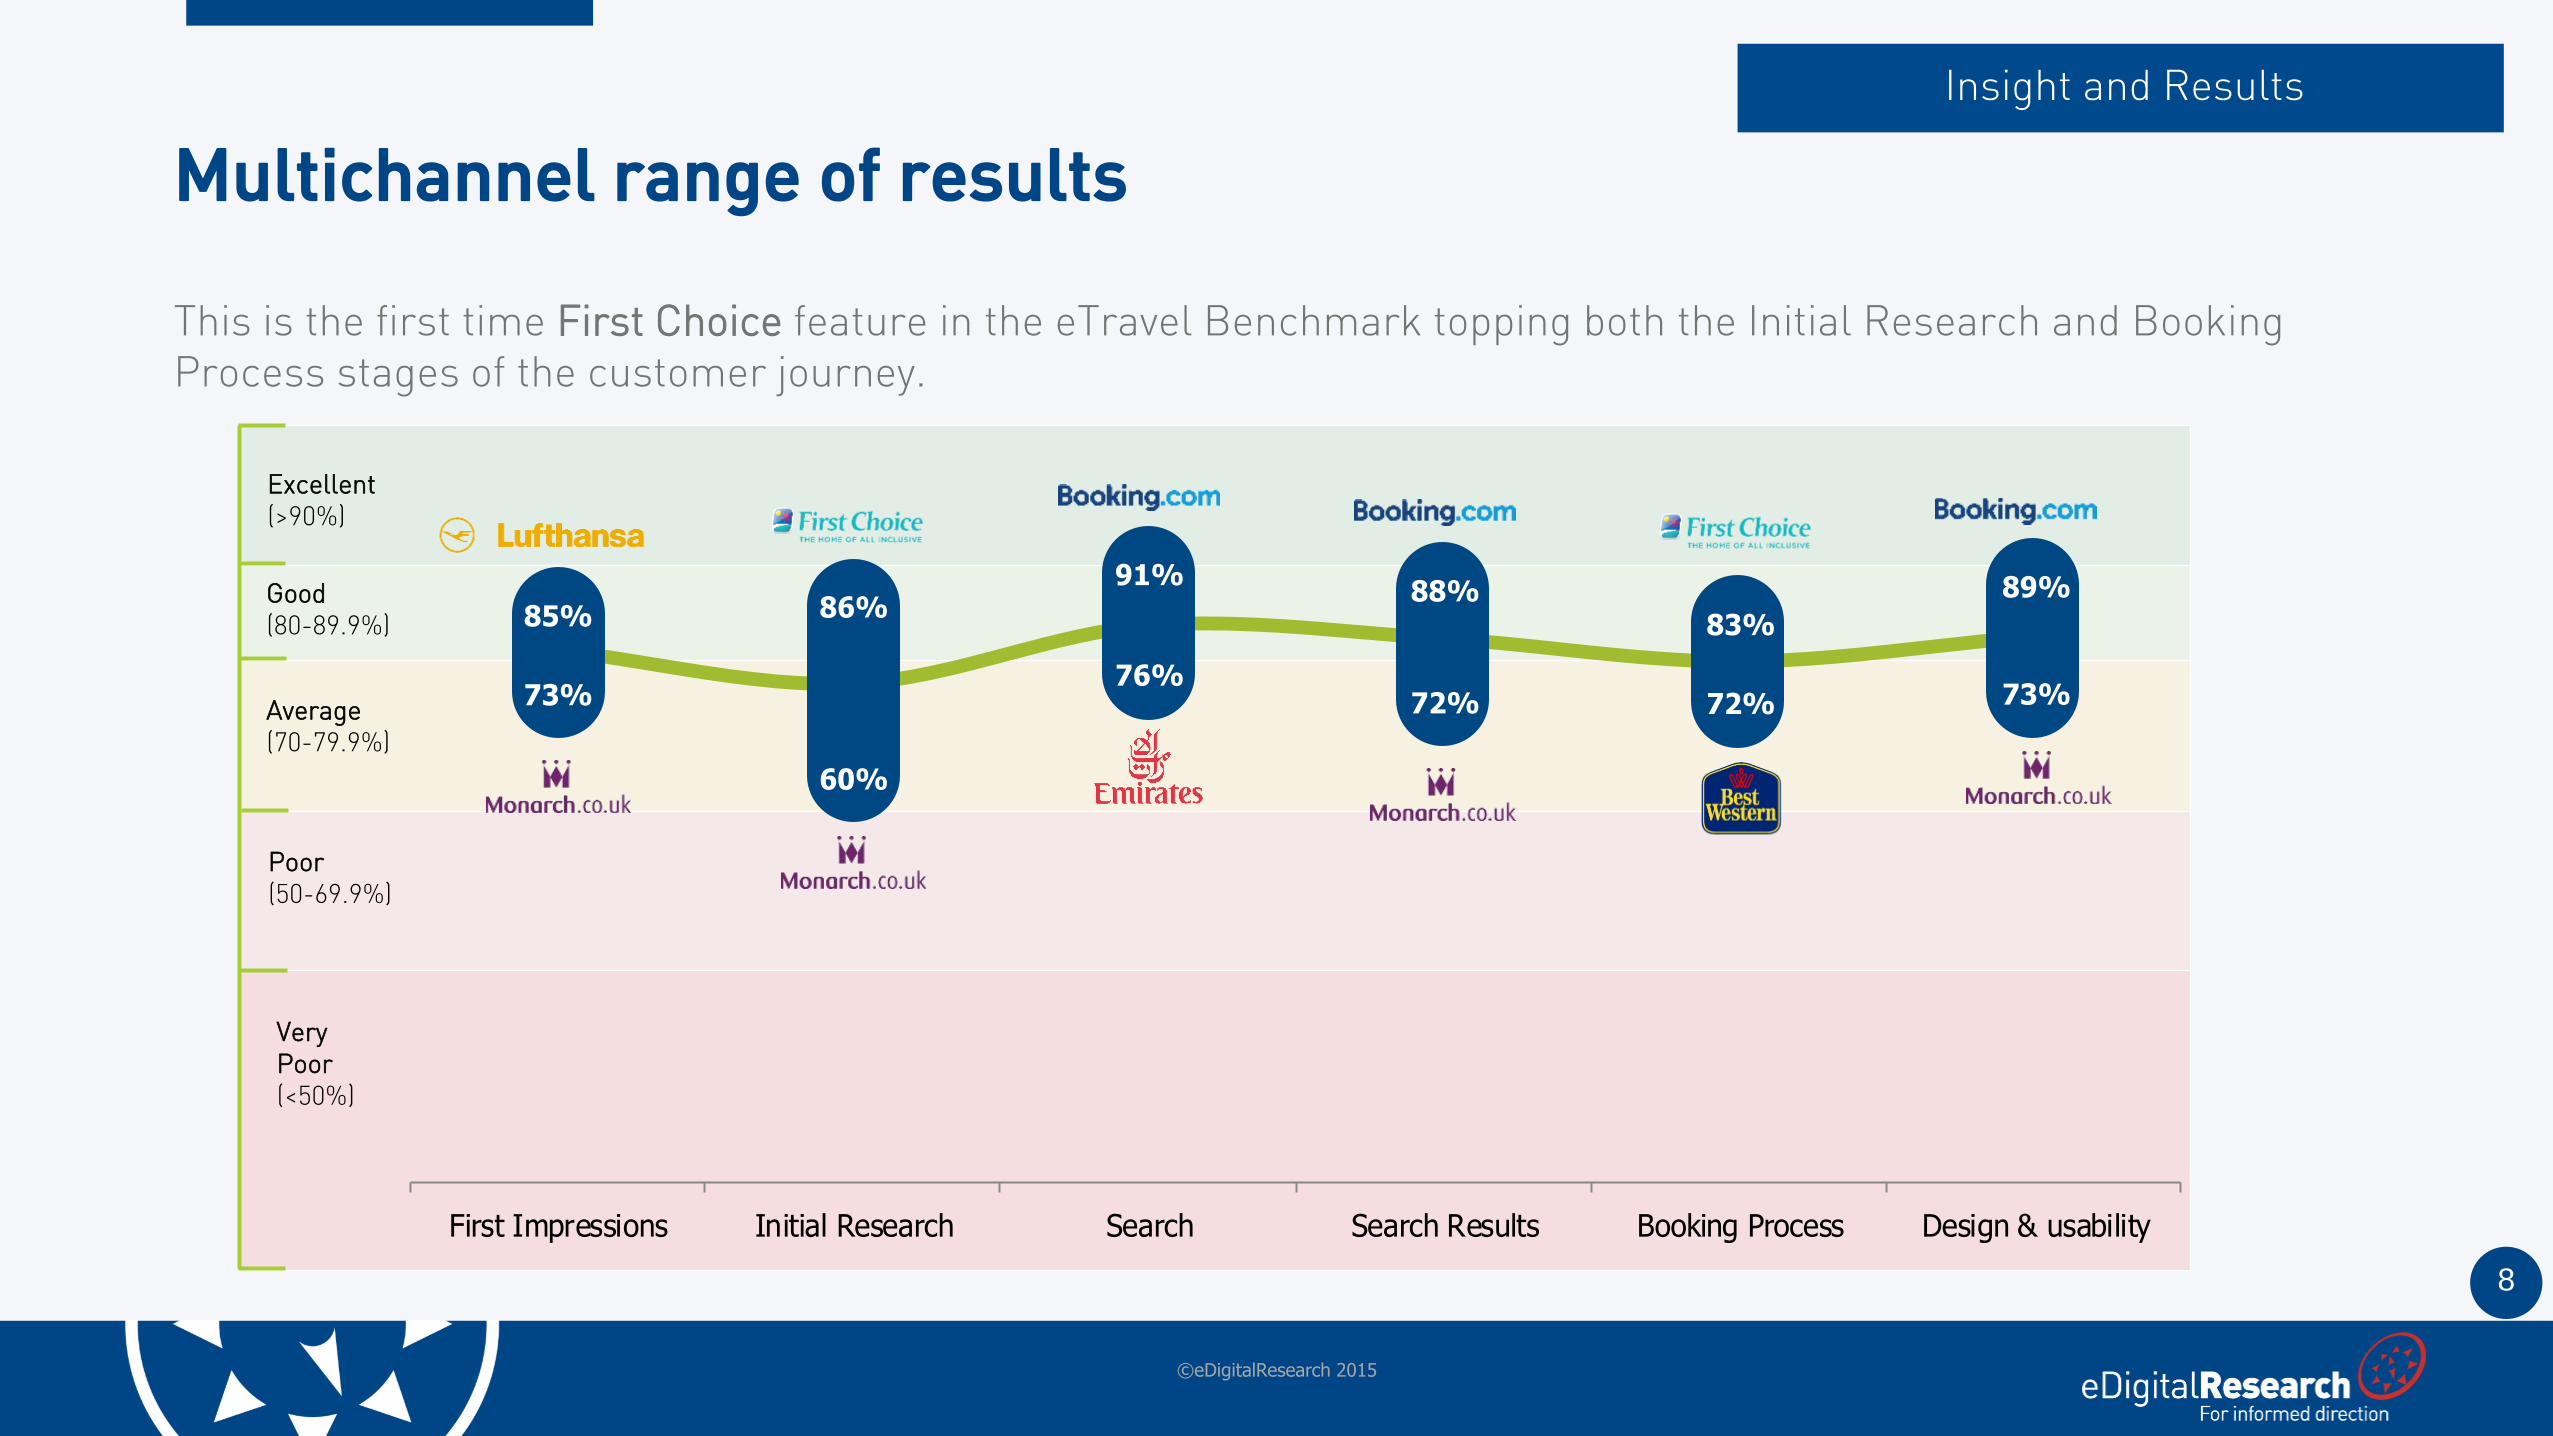
This is the first time First Choice feature in the eTravel Benchmark topping both the Initial Research and Booking Process stages of the customer journey.
Multichannel range of results
Insight and Results
©eDigitalResearch 2015
85% 86%91%
88%83%
89%
73%
60%
76%72% 72% 73%
First Impressions Initial Research Search Search Results Booking Process Design & usability
Excellent(>90%)
Good(80-89.9%)
Average(70-79.9%)
Poor(50-69.9%)
Very Poor(<50%)
9
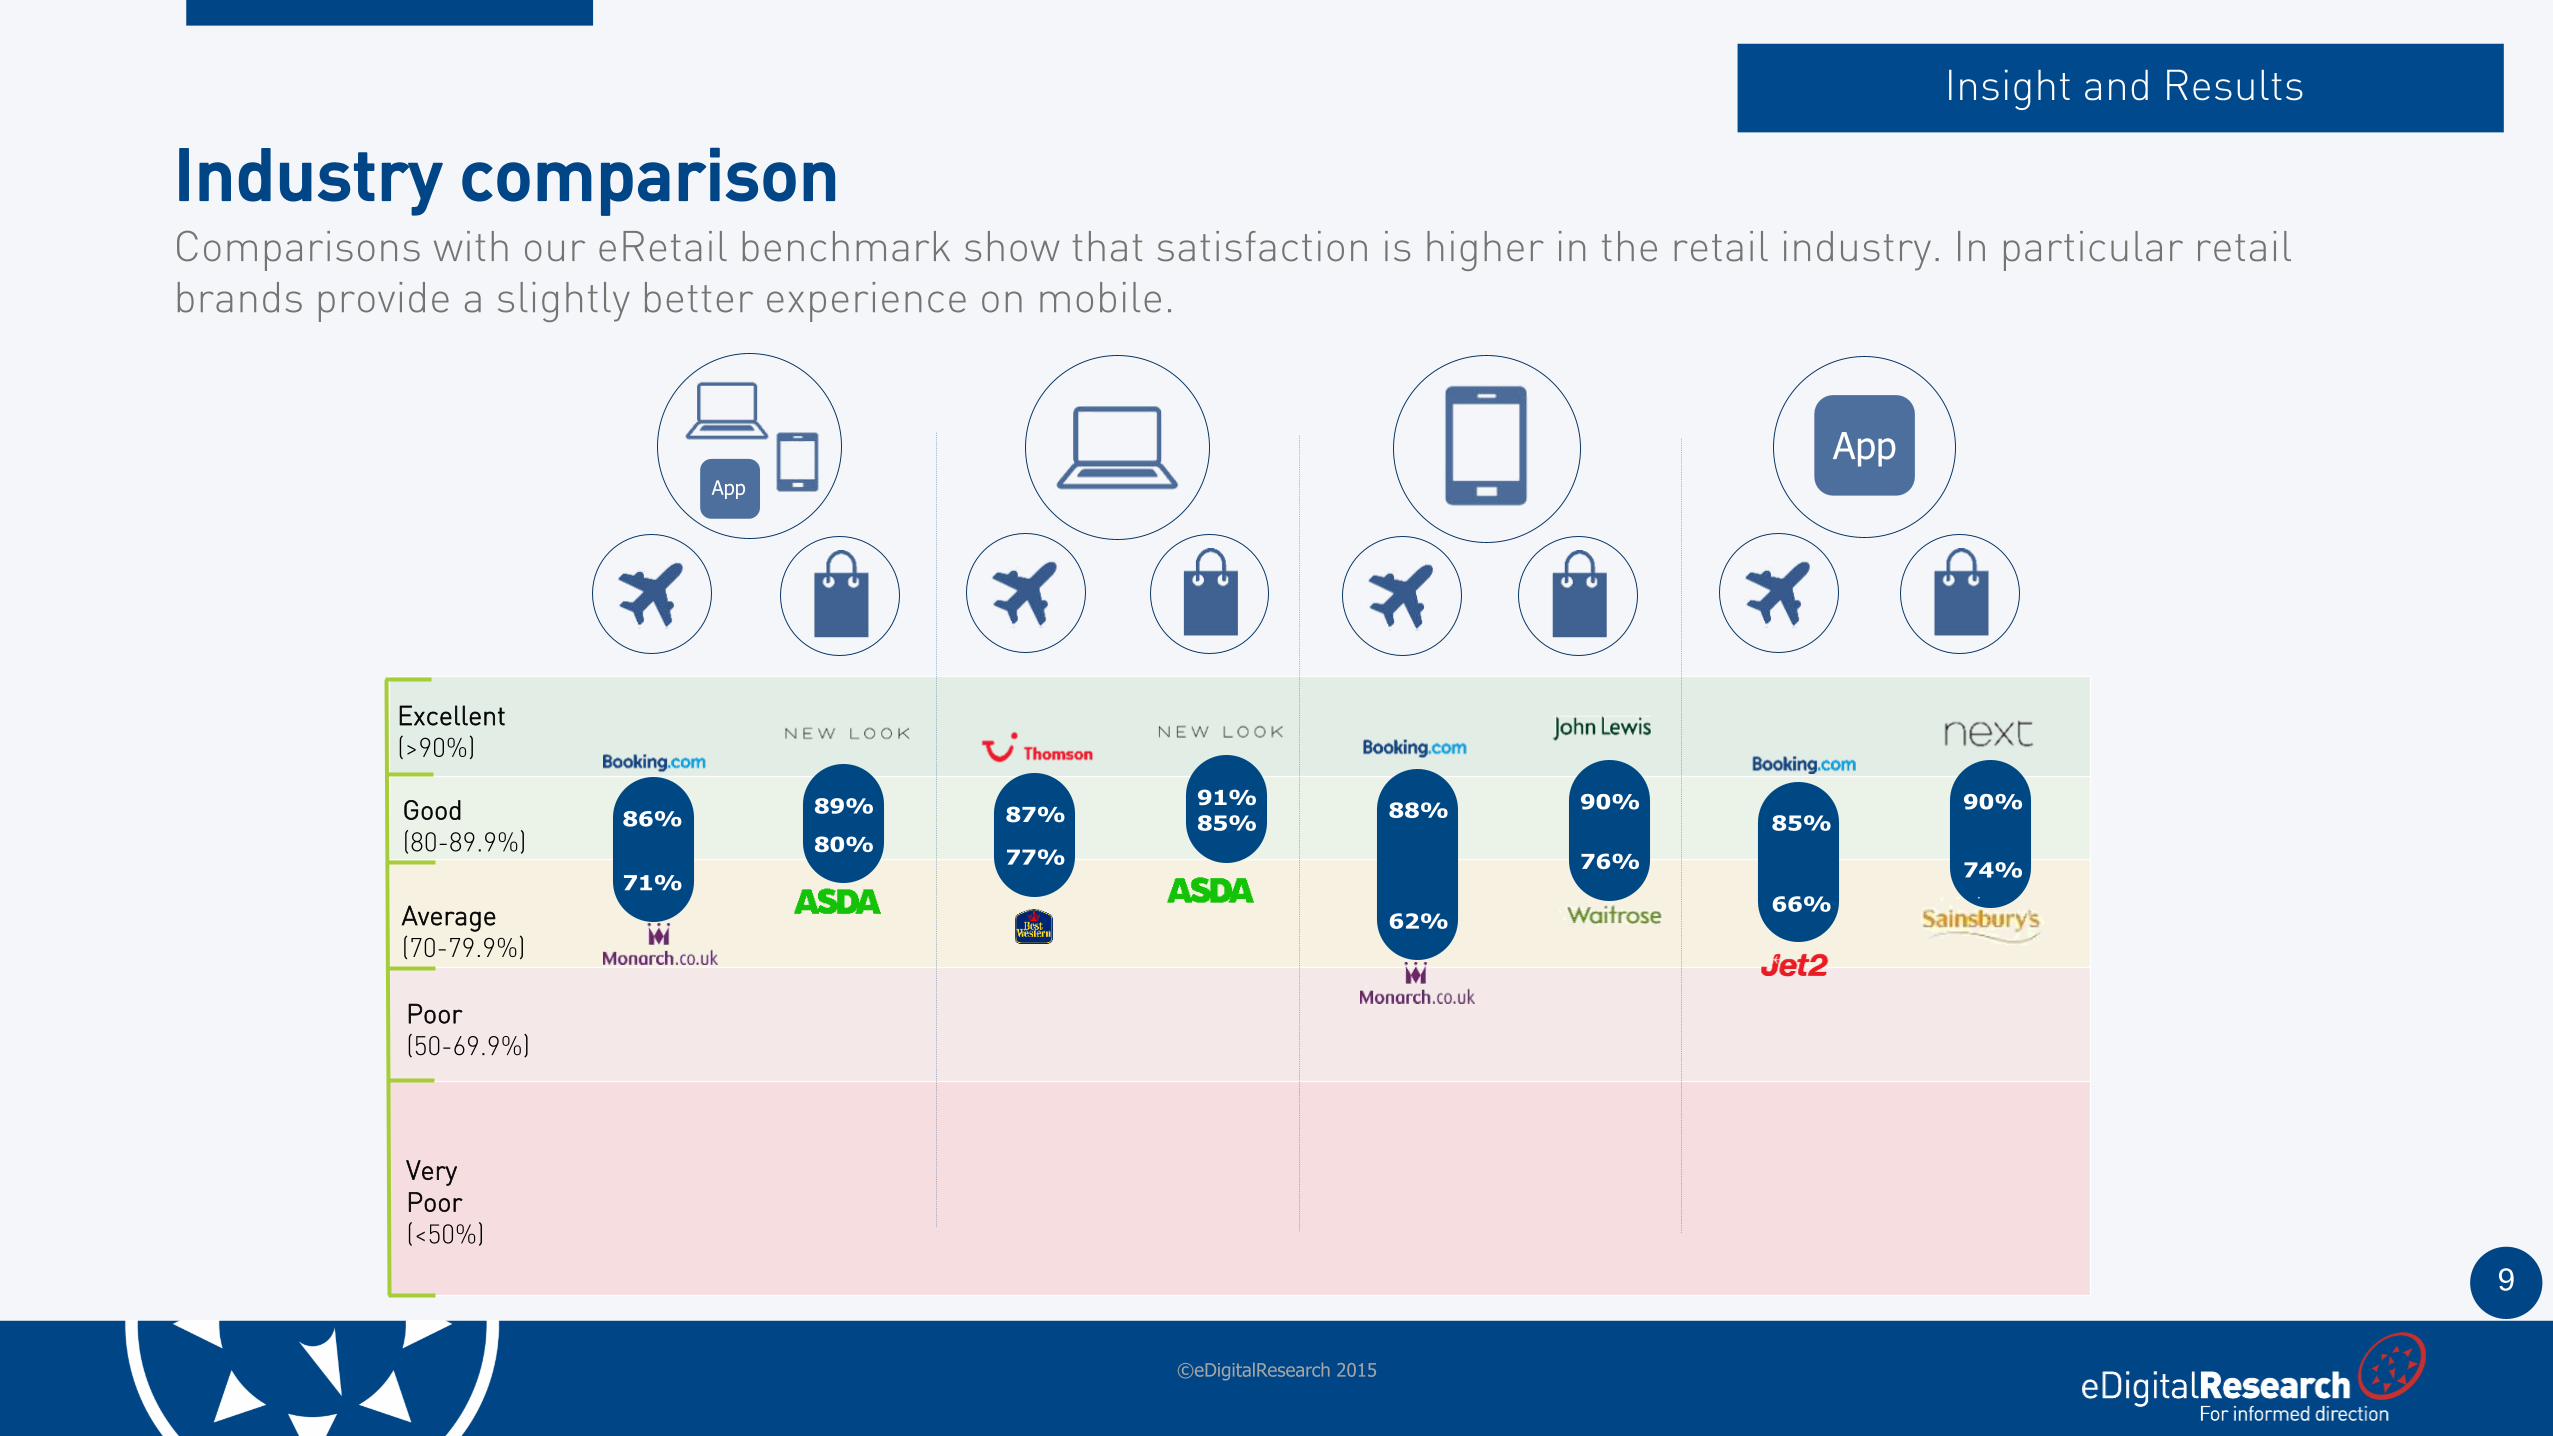
Comparisons with our eRetail benchmark show that satisfaction is higher in the retail industry. In particular retail brands provide a slightly better experience on mobile.
Industry comparison
Insight and Results
©eDigitalResearch 2015
86%89% 87%
91%88% 90%
85%90%
71%
80%77%
85%
62%
76%
66%
74%
Excellent(>90%)
Good(80-89.9%)
Average(70-79.9%)
Poor(50-69.9%)
Very Poor(<50%)
AppApp
10
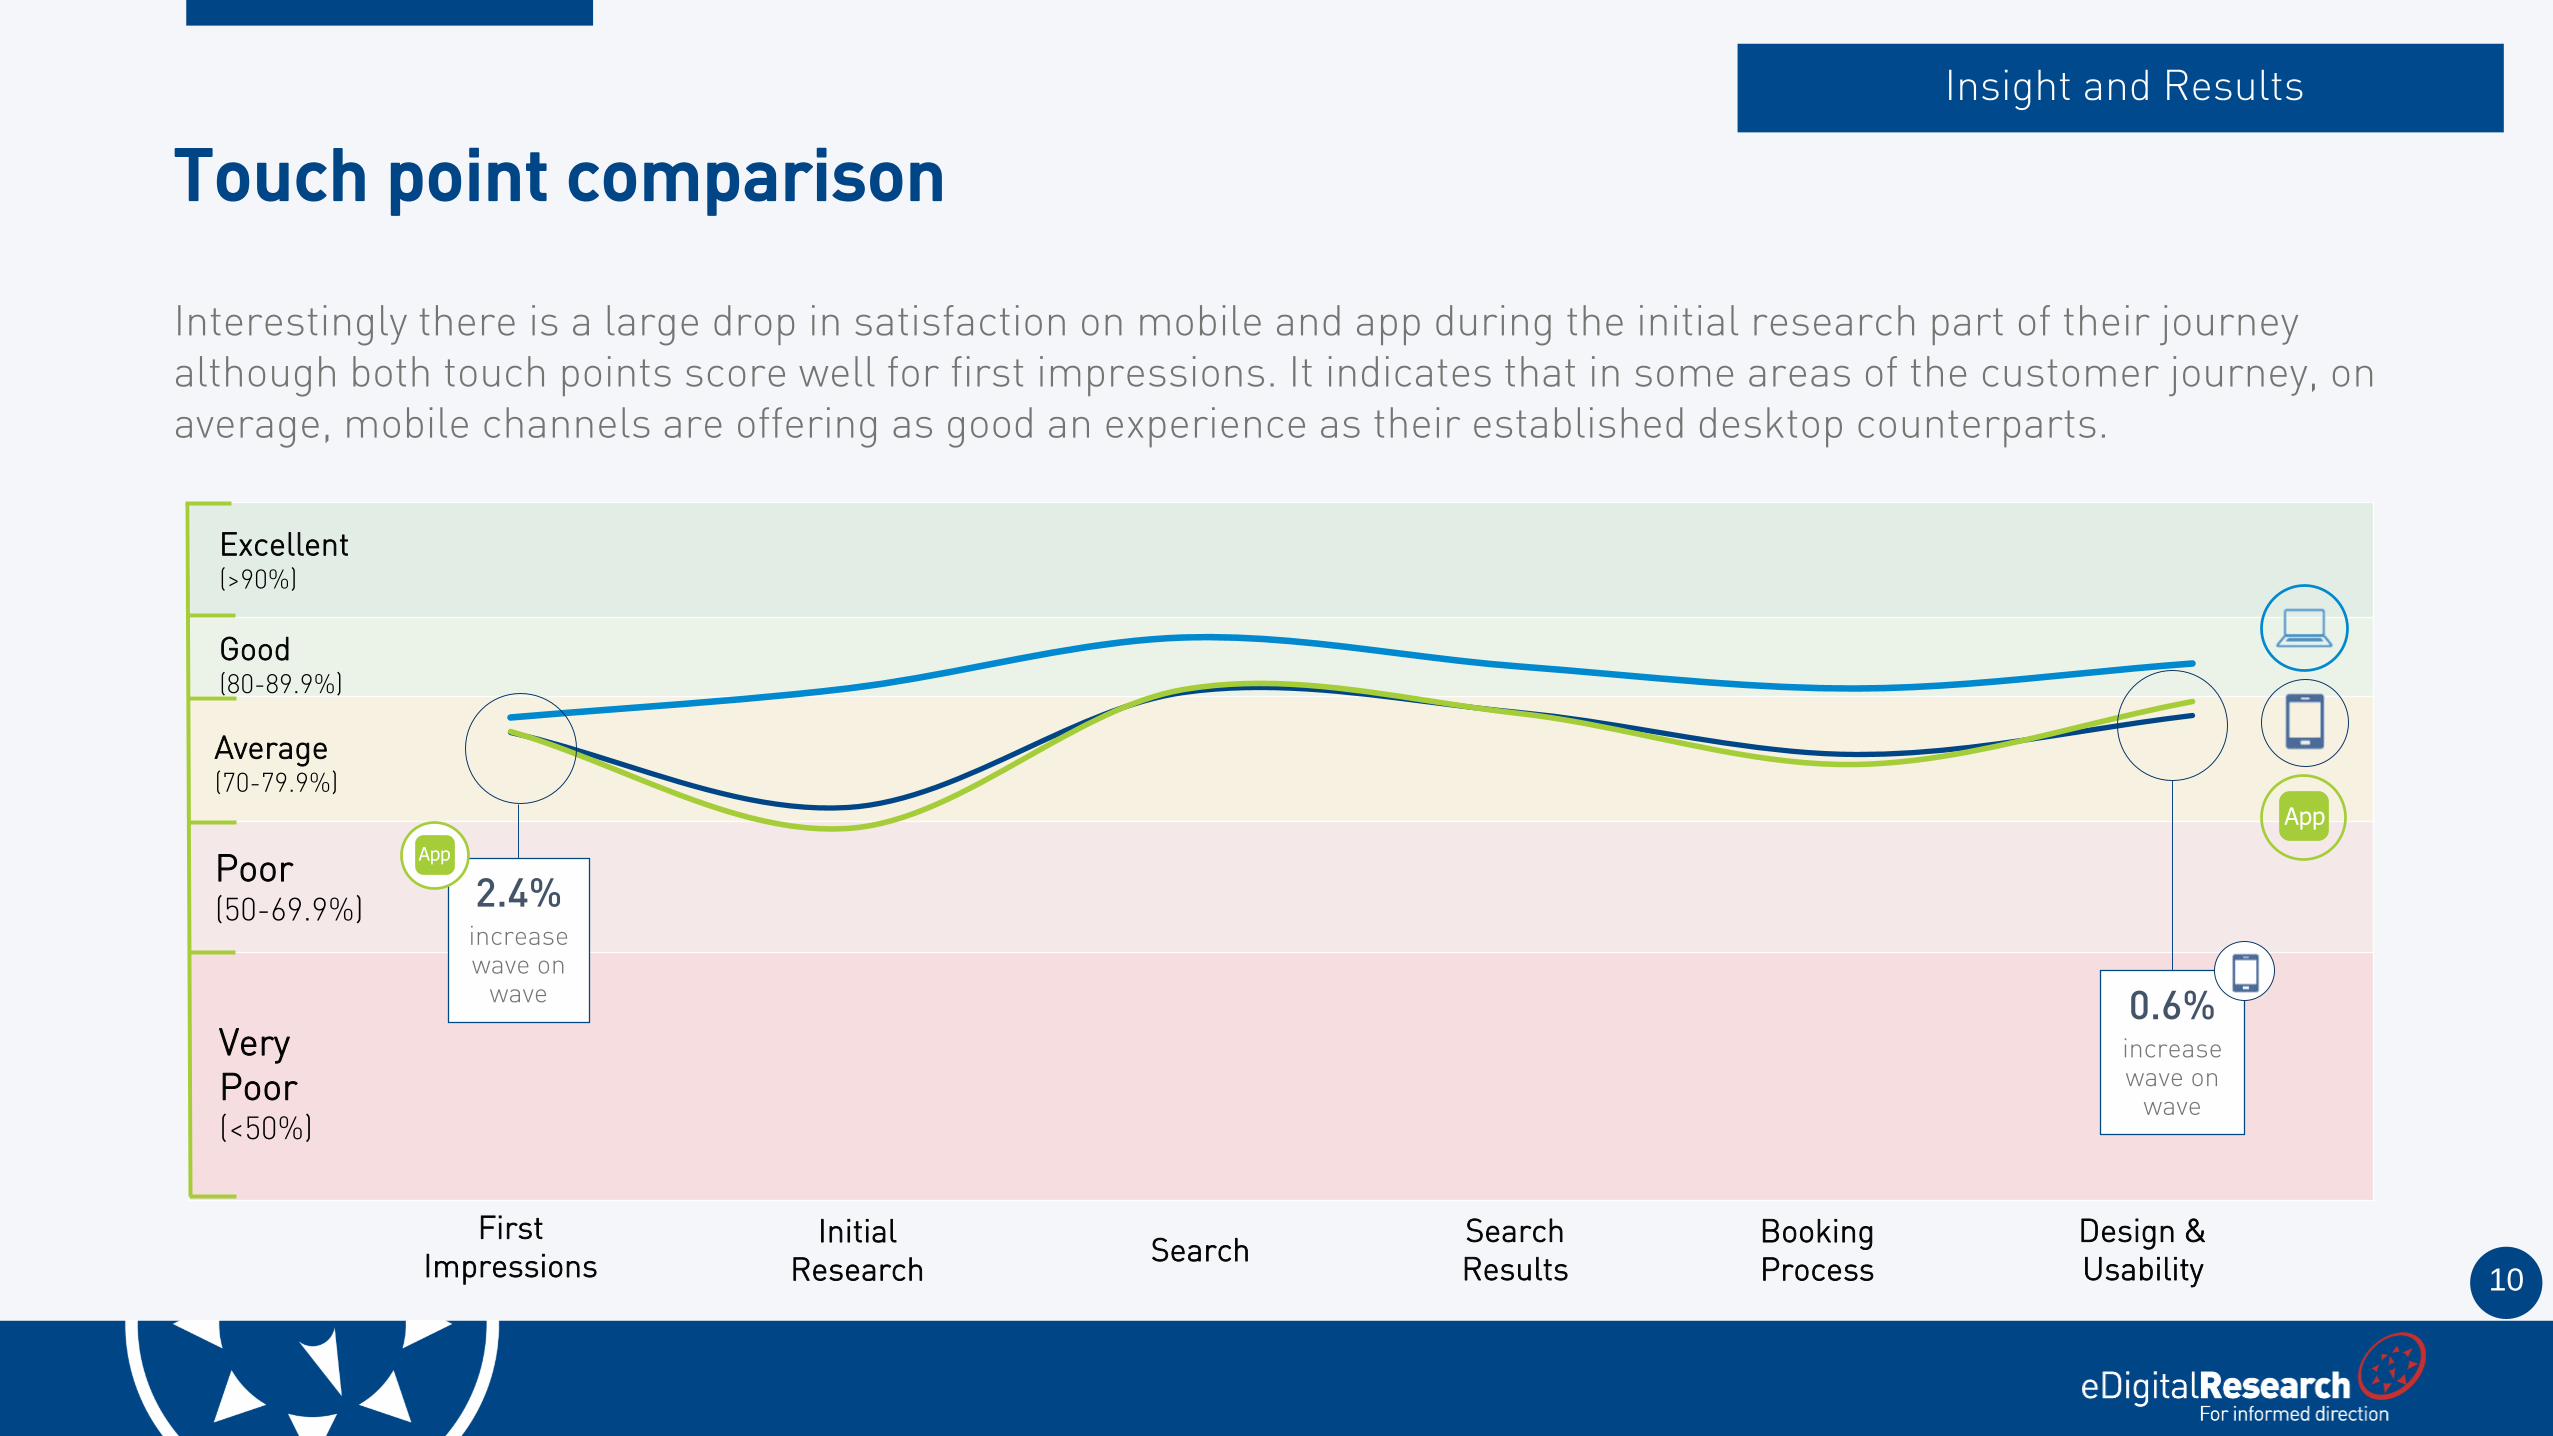
Interestingly there is a large drop in satisfaction on mobile and app during the initial research part of their journey although both touch points score well for first impressions. It indicates that in some areas of the customer journey, on average, mobile channels are offering as good an experience as their established desktop counterparts.
Touch point comparison
Insight and Results
Good(80-89.9%)
Very Poor(<50%)
Average(70-79.9%)
Poor(50-69.9%)
Excellent(>90%)
0.6% increase wave on
wave
2.4% increase wave on
wave
First Impressions Search
Search Results
Booking Process
Design & Usability
Initial Research
App
App
11
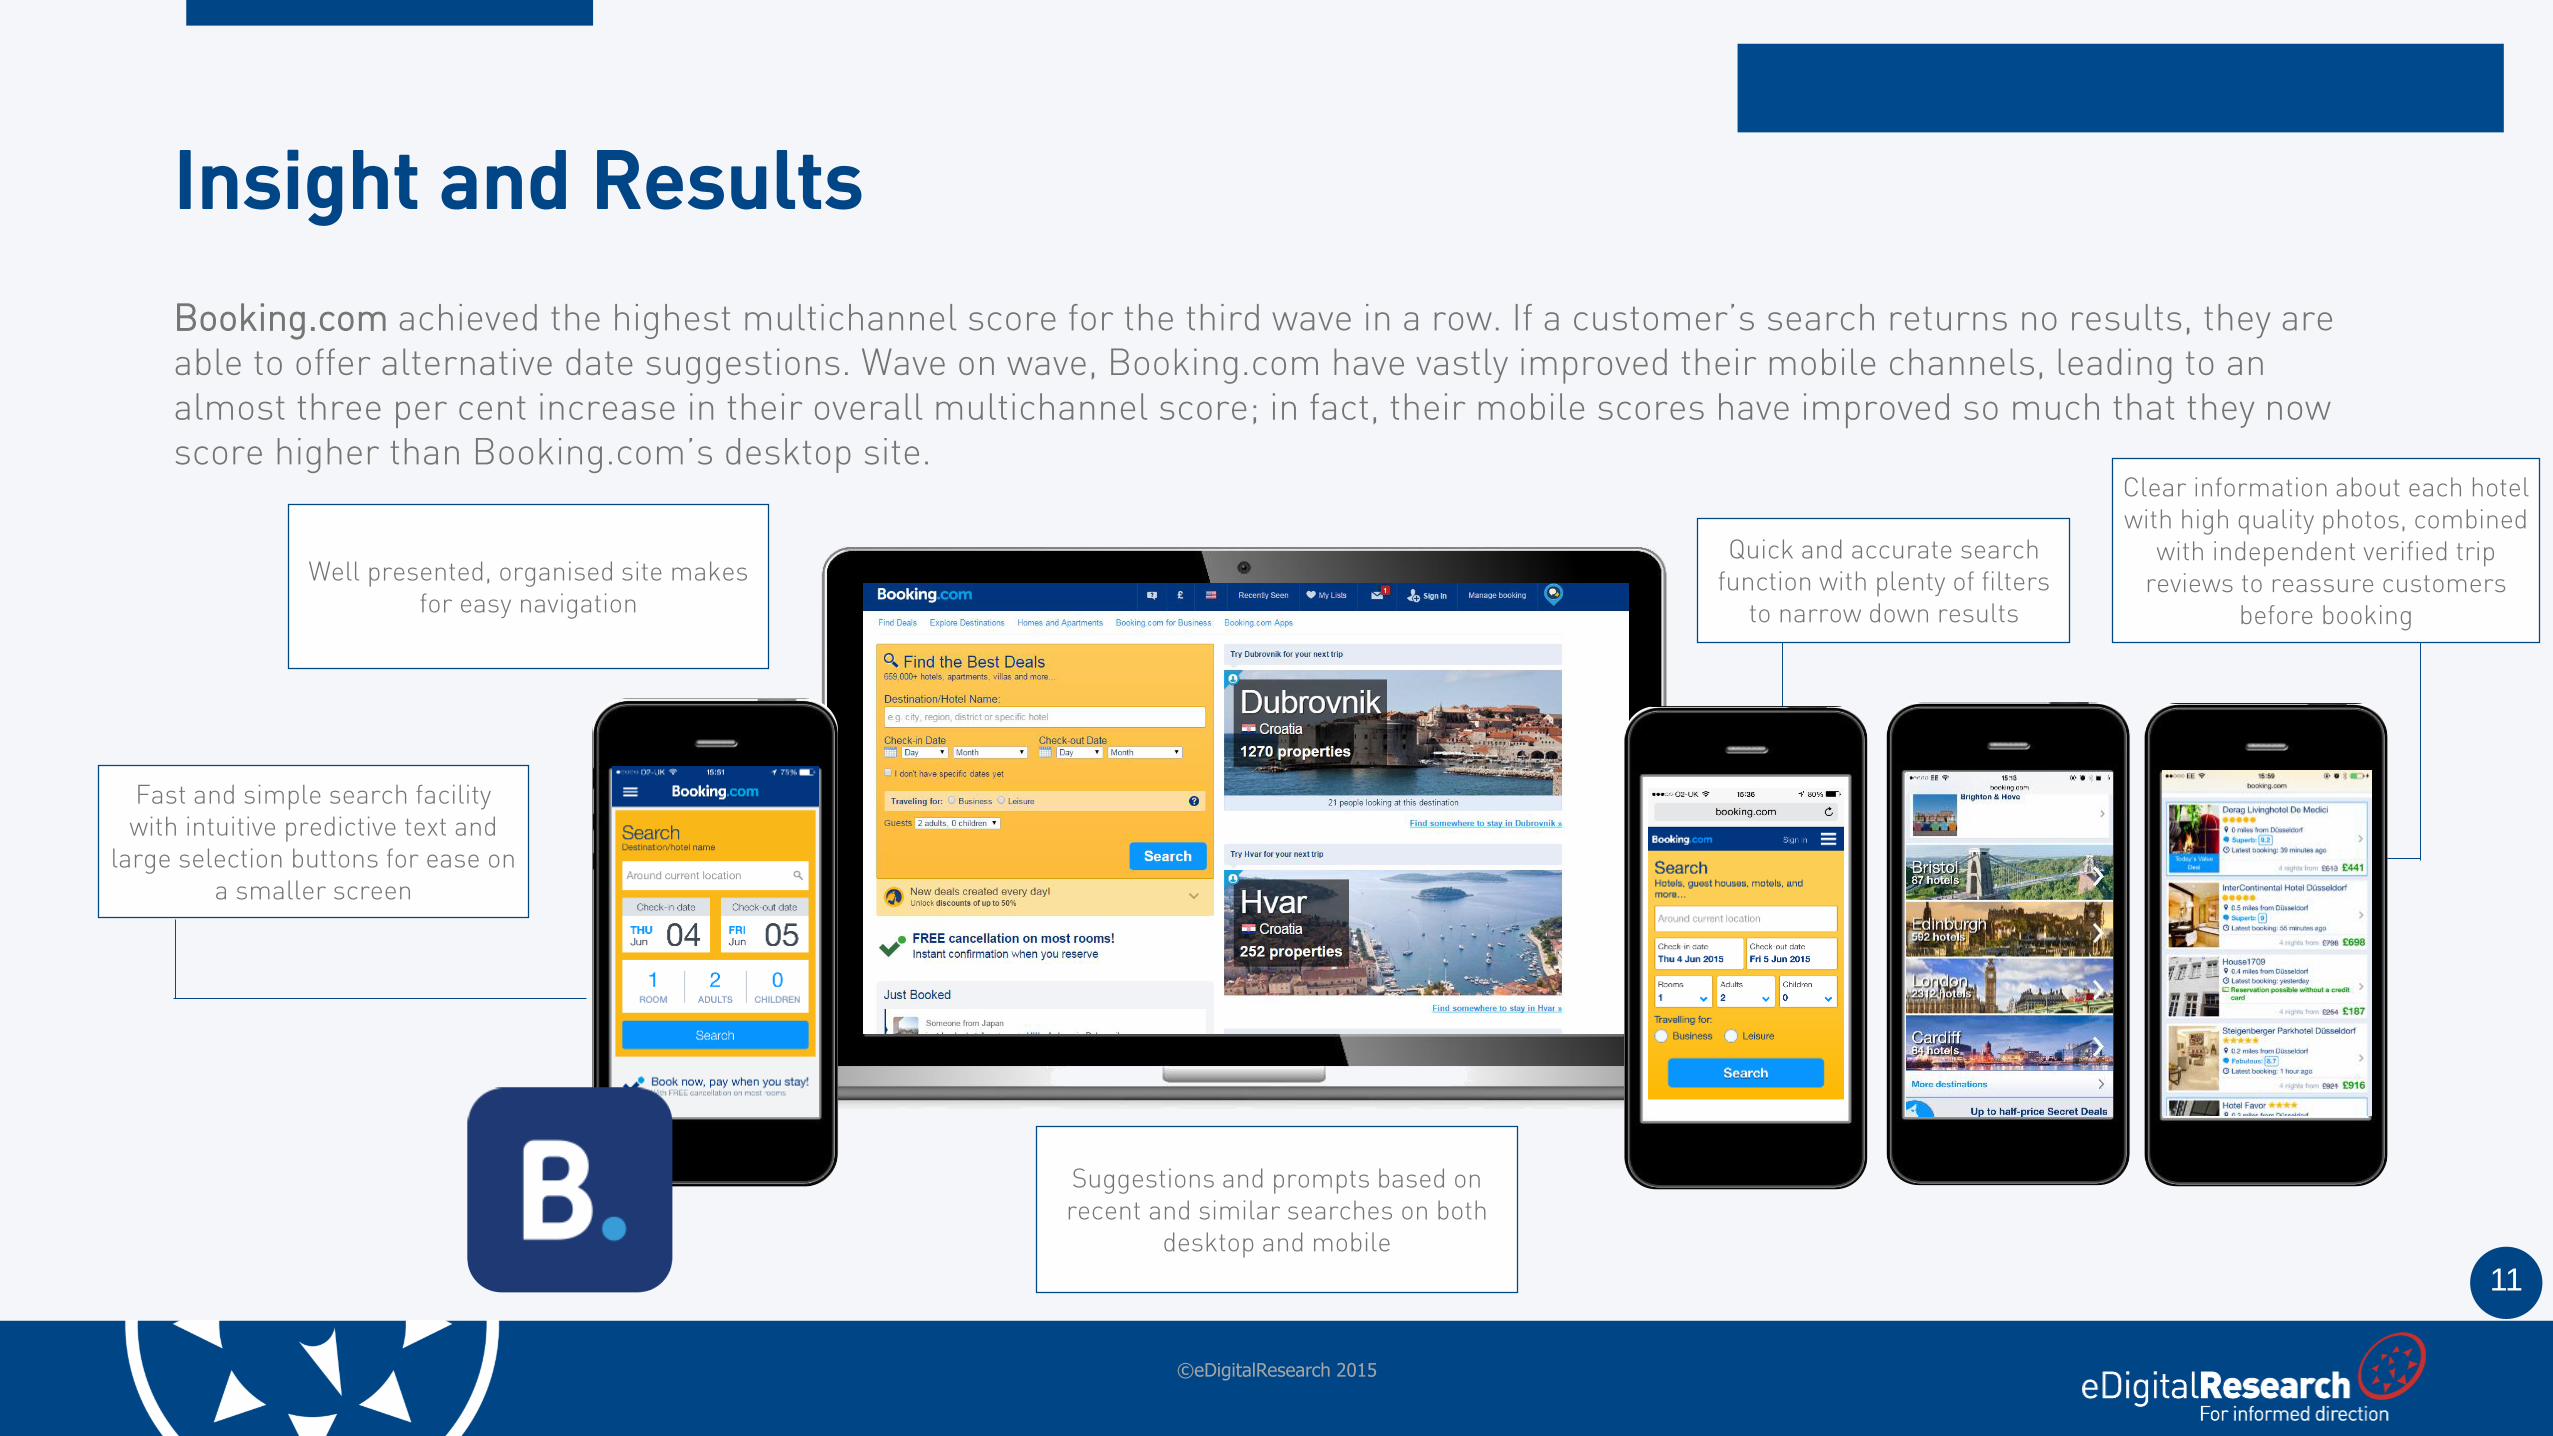
Booking.com achieved the highest multichannel score for the third wave in a row. If a customer’s search returns no results, they are able to offer alternative date suggestions. Wave on wave, Booking.com have vastly improved their mobile channels, leading to an almost three per cent increase in their overall multichannel score; in fact, their mobile scores have improved so much that they now score higher than Booking.com’s desktop site.
Insight and Results
©eDigitalResearch 2015
Suggestions and prompts based on recent and similar searches on both
desktop and mobile
Well presented, organised site makes for easy navigation
Quick and accurate search function with plenty of filters
to narrow down results
Fast and simple search facility with intuitive predictive text and
large selection buttons for ease on a smaller screen
Clear information about each hotel with high quality photos, combined
with independent verified trip reviews to reassure customers
before booking
12
Emerging Trends
©eDigitalResearch 2015
13
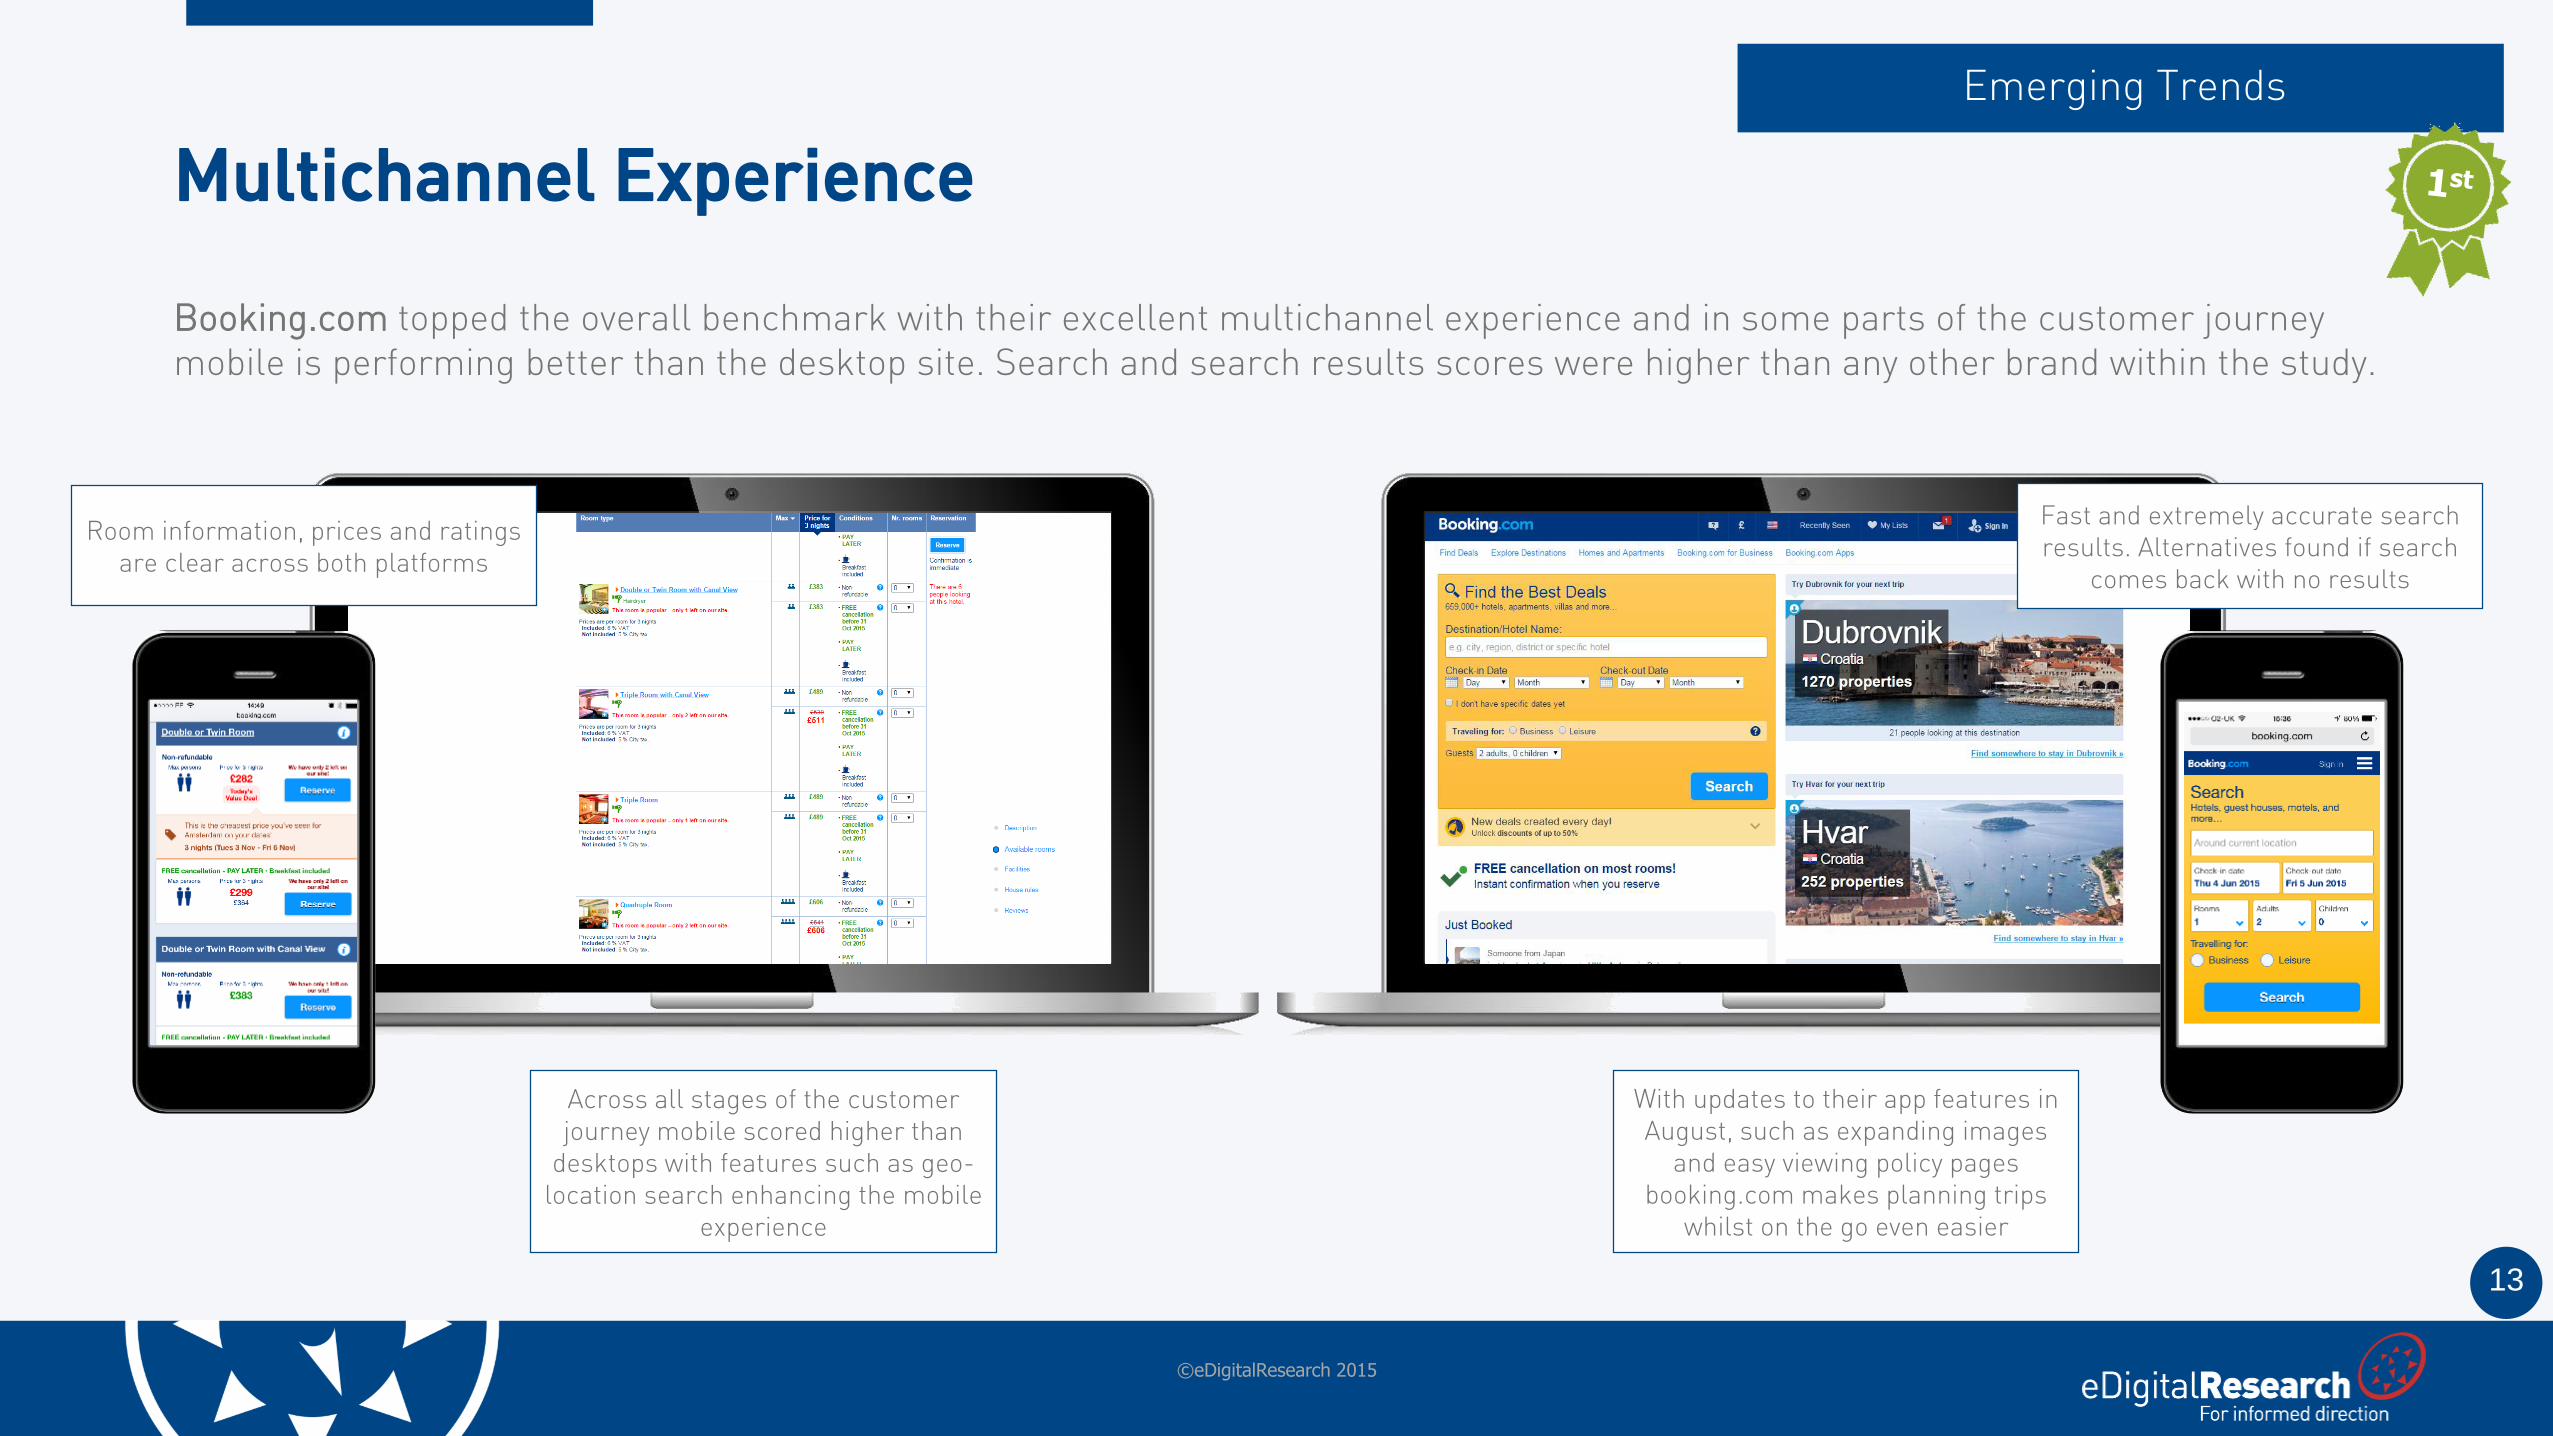
Booking.com topped the overall benchmark with their excellent multichannel experience and in some parts of the customer journey mobile is performing better than the desktop site. Search and search results scores were higher than any other brand within the study.
Multichannel Experience
Emerging Trends
©eDigitalResearch 2015
Fast and extremely accurate search results. Alternatives found if search
comes back with no results
With updates to their app features in August, such as expanding images
and easy viewing policy pages booking.com makes planning trips
whilst on the go even easier
Across all stages of the customer journey mobile scored higher than
desktops with features such as geo-location search enhancing the mobile
experience
Room information, prices and ratings are clear across both platforms
14
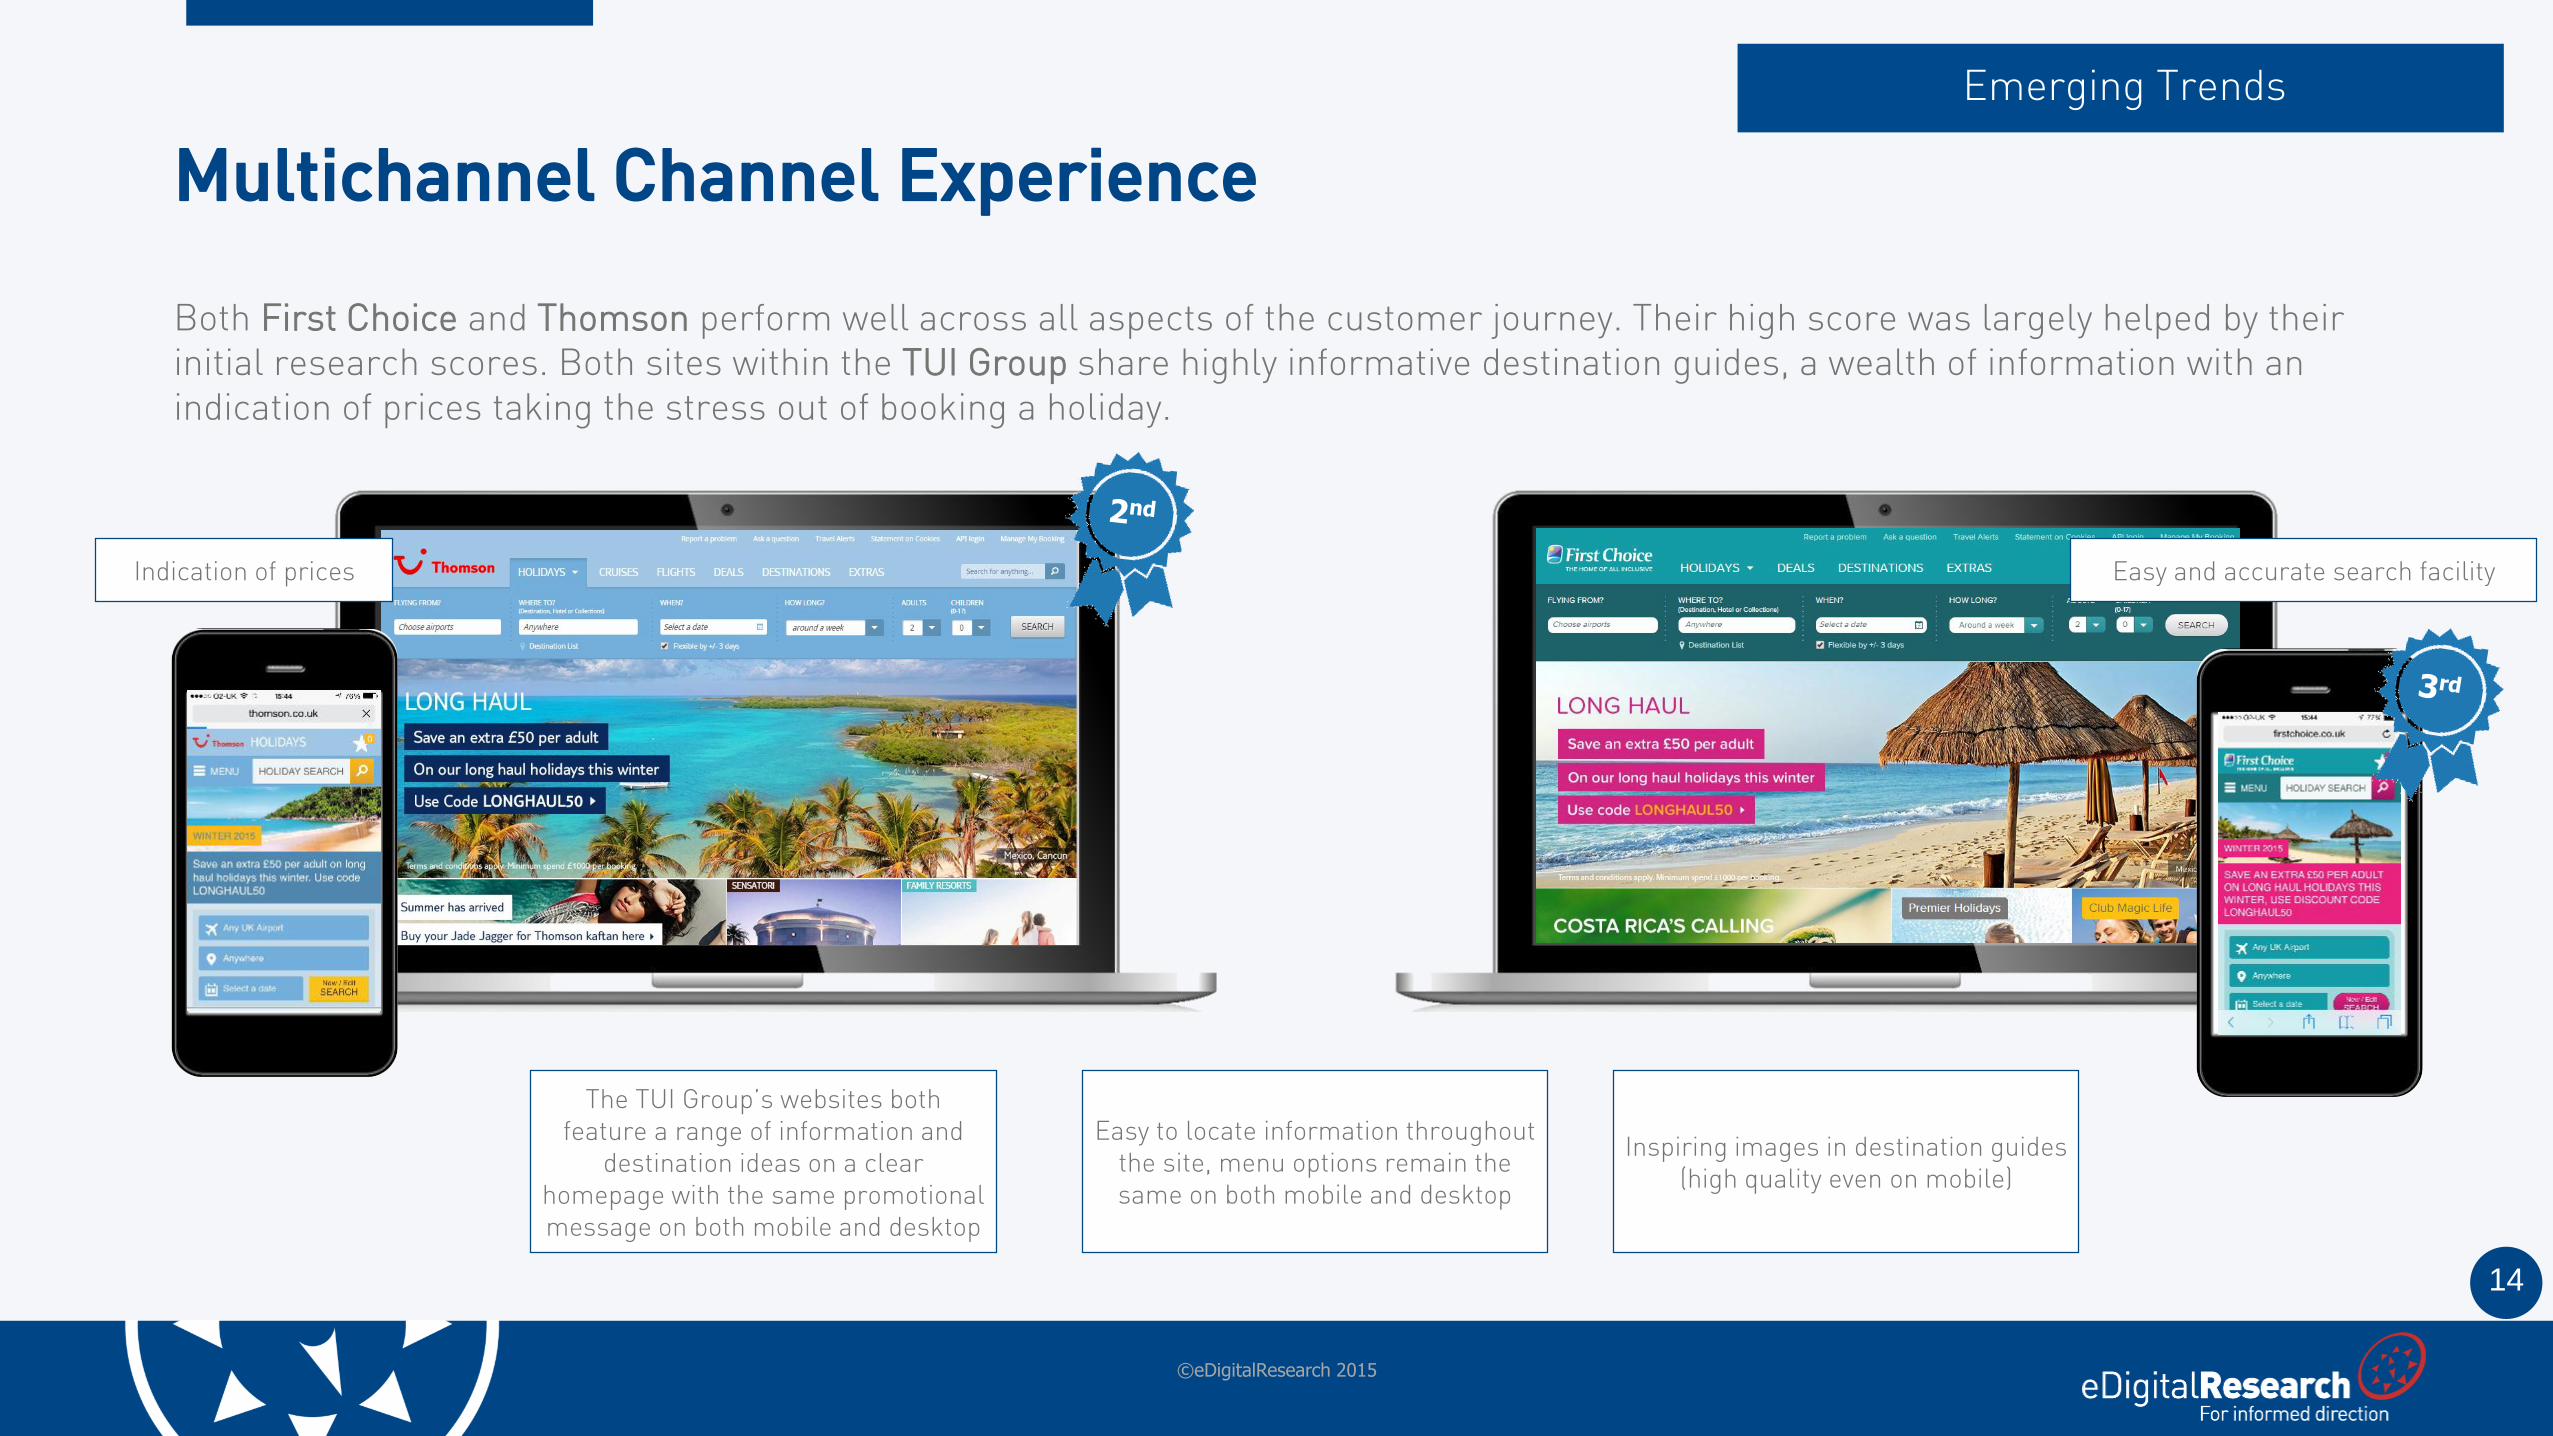
Both First Choice and Thomson perform well across all aspects of the customer journey. Their high score was largely helped by their initial research scores. Both sites within the TUI Group share highly informative destination guides, a wealth of information with an indication of prices taking the stress out of booking a holiday.
Multichannel Channel Experience
Emerging Trends
©eDigitalResearch 2015
Inspiring images in destination guides (high quality even on mobile)
The TUI Group’s websites both feature a range of information and
destination ideas on a clear homepage with the same promotional message on both mobile and desktop
Easy and accurate search facility
Easy to locate information throughout the site, menu options remain the same on both mobile and desktop
Indication of prices
15
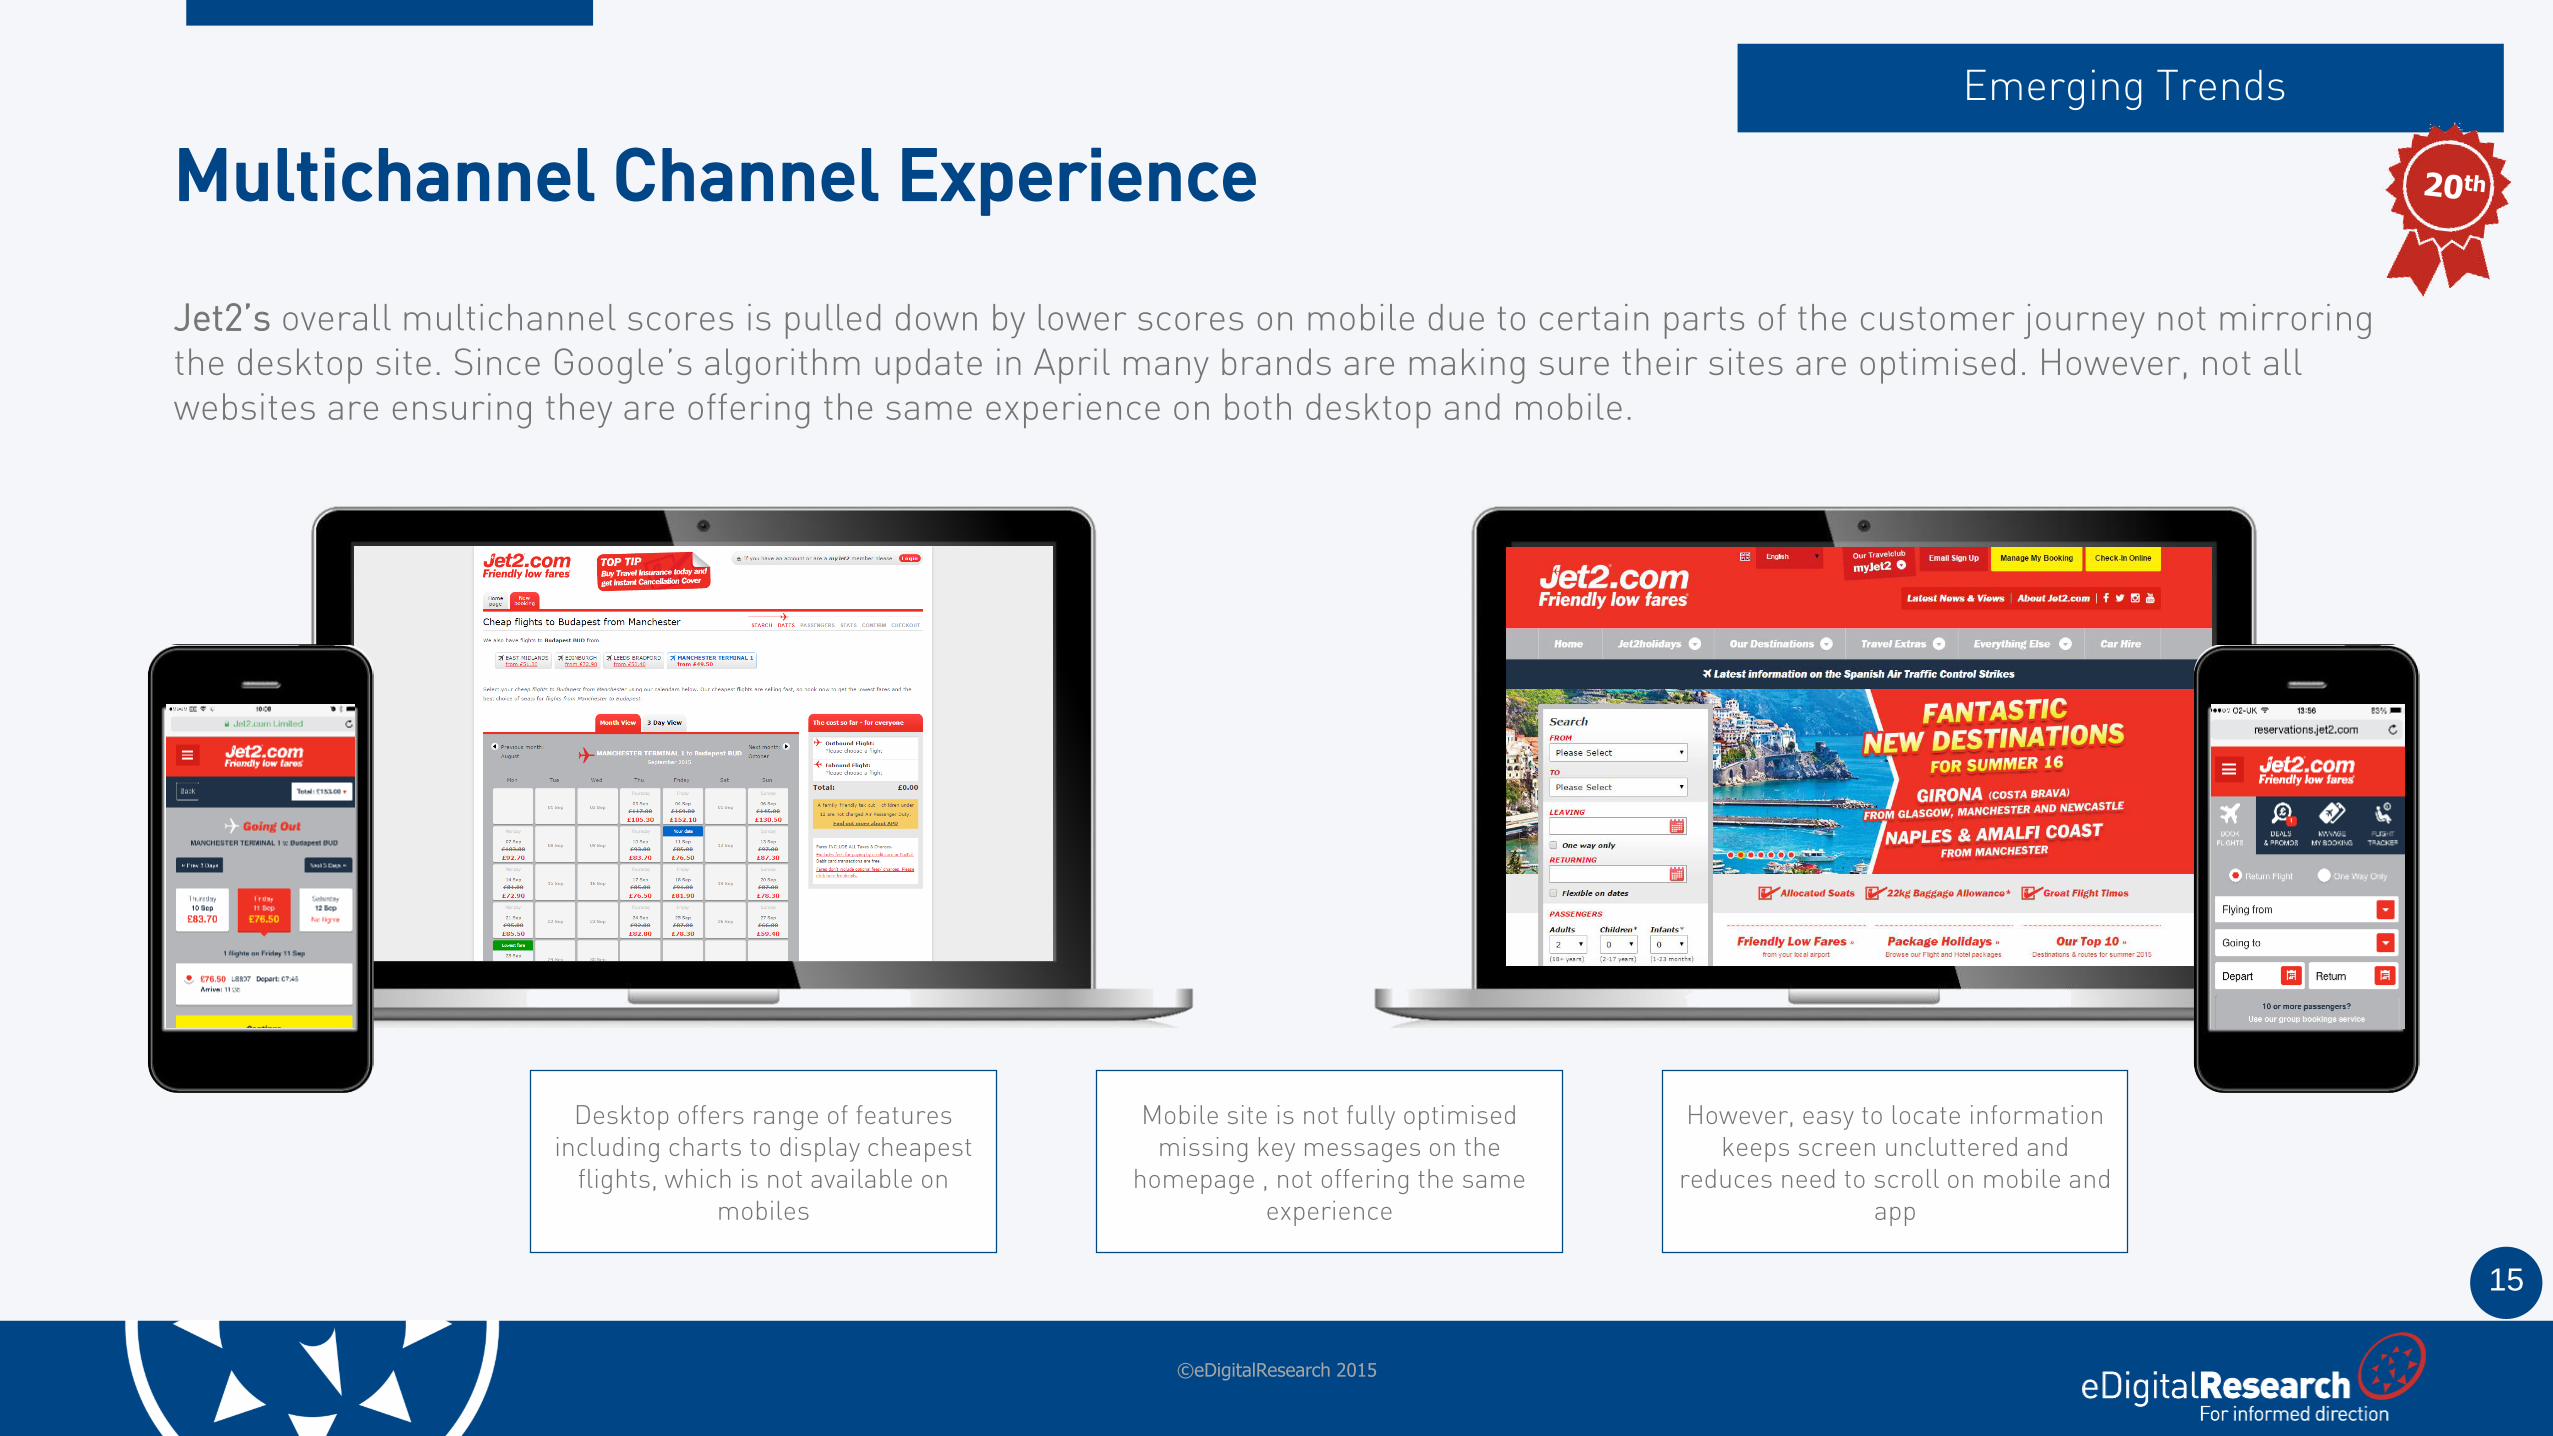
Jet2’s overall multichannel scores is pulled down by lower scores on mobile due to certain parts of the customer journey not mirroringthe desktop site. Since Google’s algorithm update in April many brands are making sure their sites are optimised. However, not all websites are ensuring they are offering the same experience on both desktop and mobile.
Multichannel Channel Experience
Emerging Trends
©eDigitalResearch 2015
Mobile site is not fully optimised missing key messages on the
homepage , not offering the same experience
Desktop offers range of features including charts to display cheapest
flights, which is not available on mobiles
However, easy to locate information keeps screen uncluttered and
reduces need to scroll on mobile and app
16
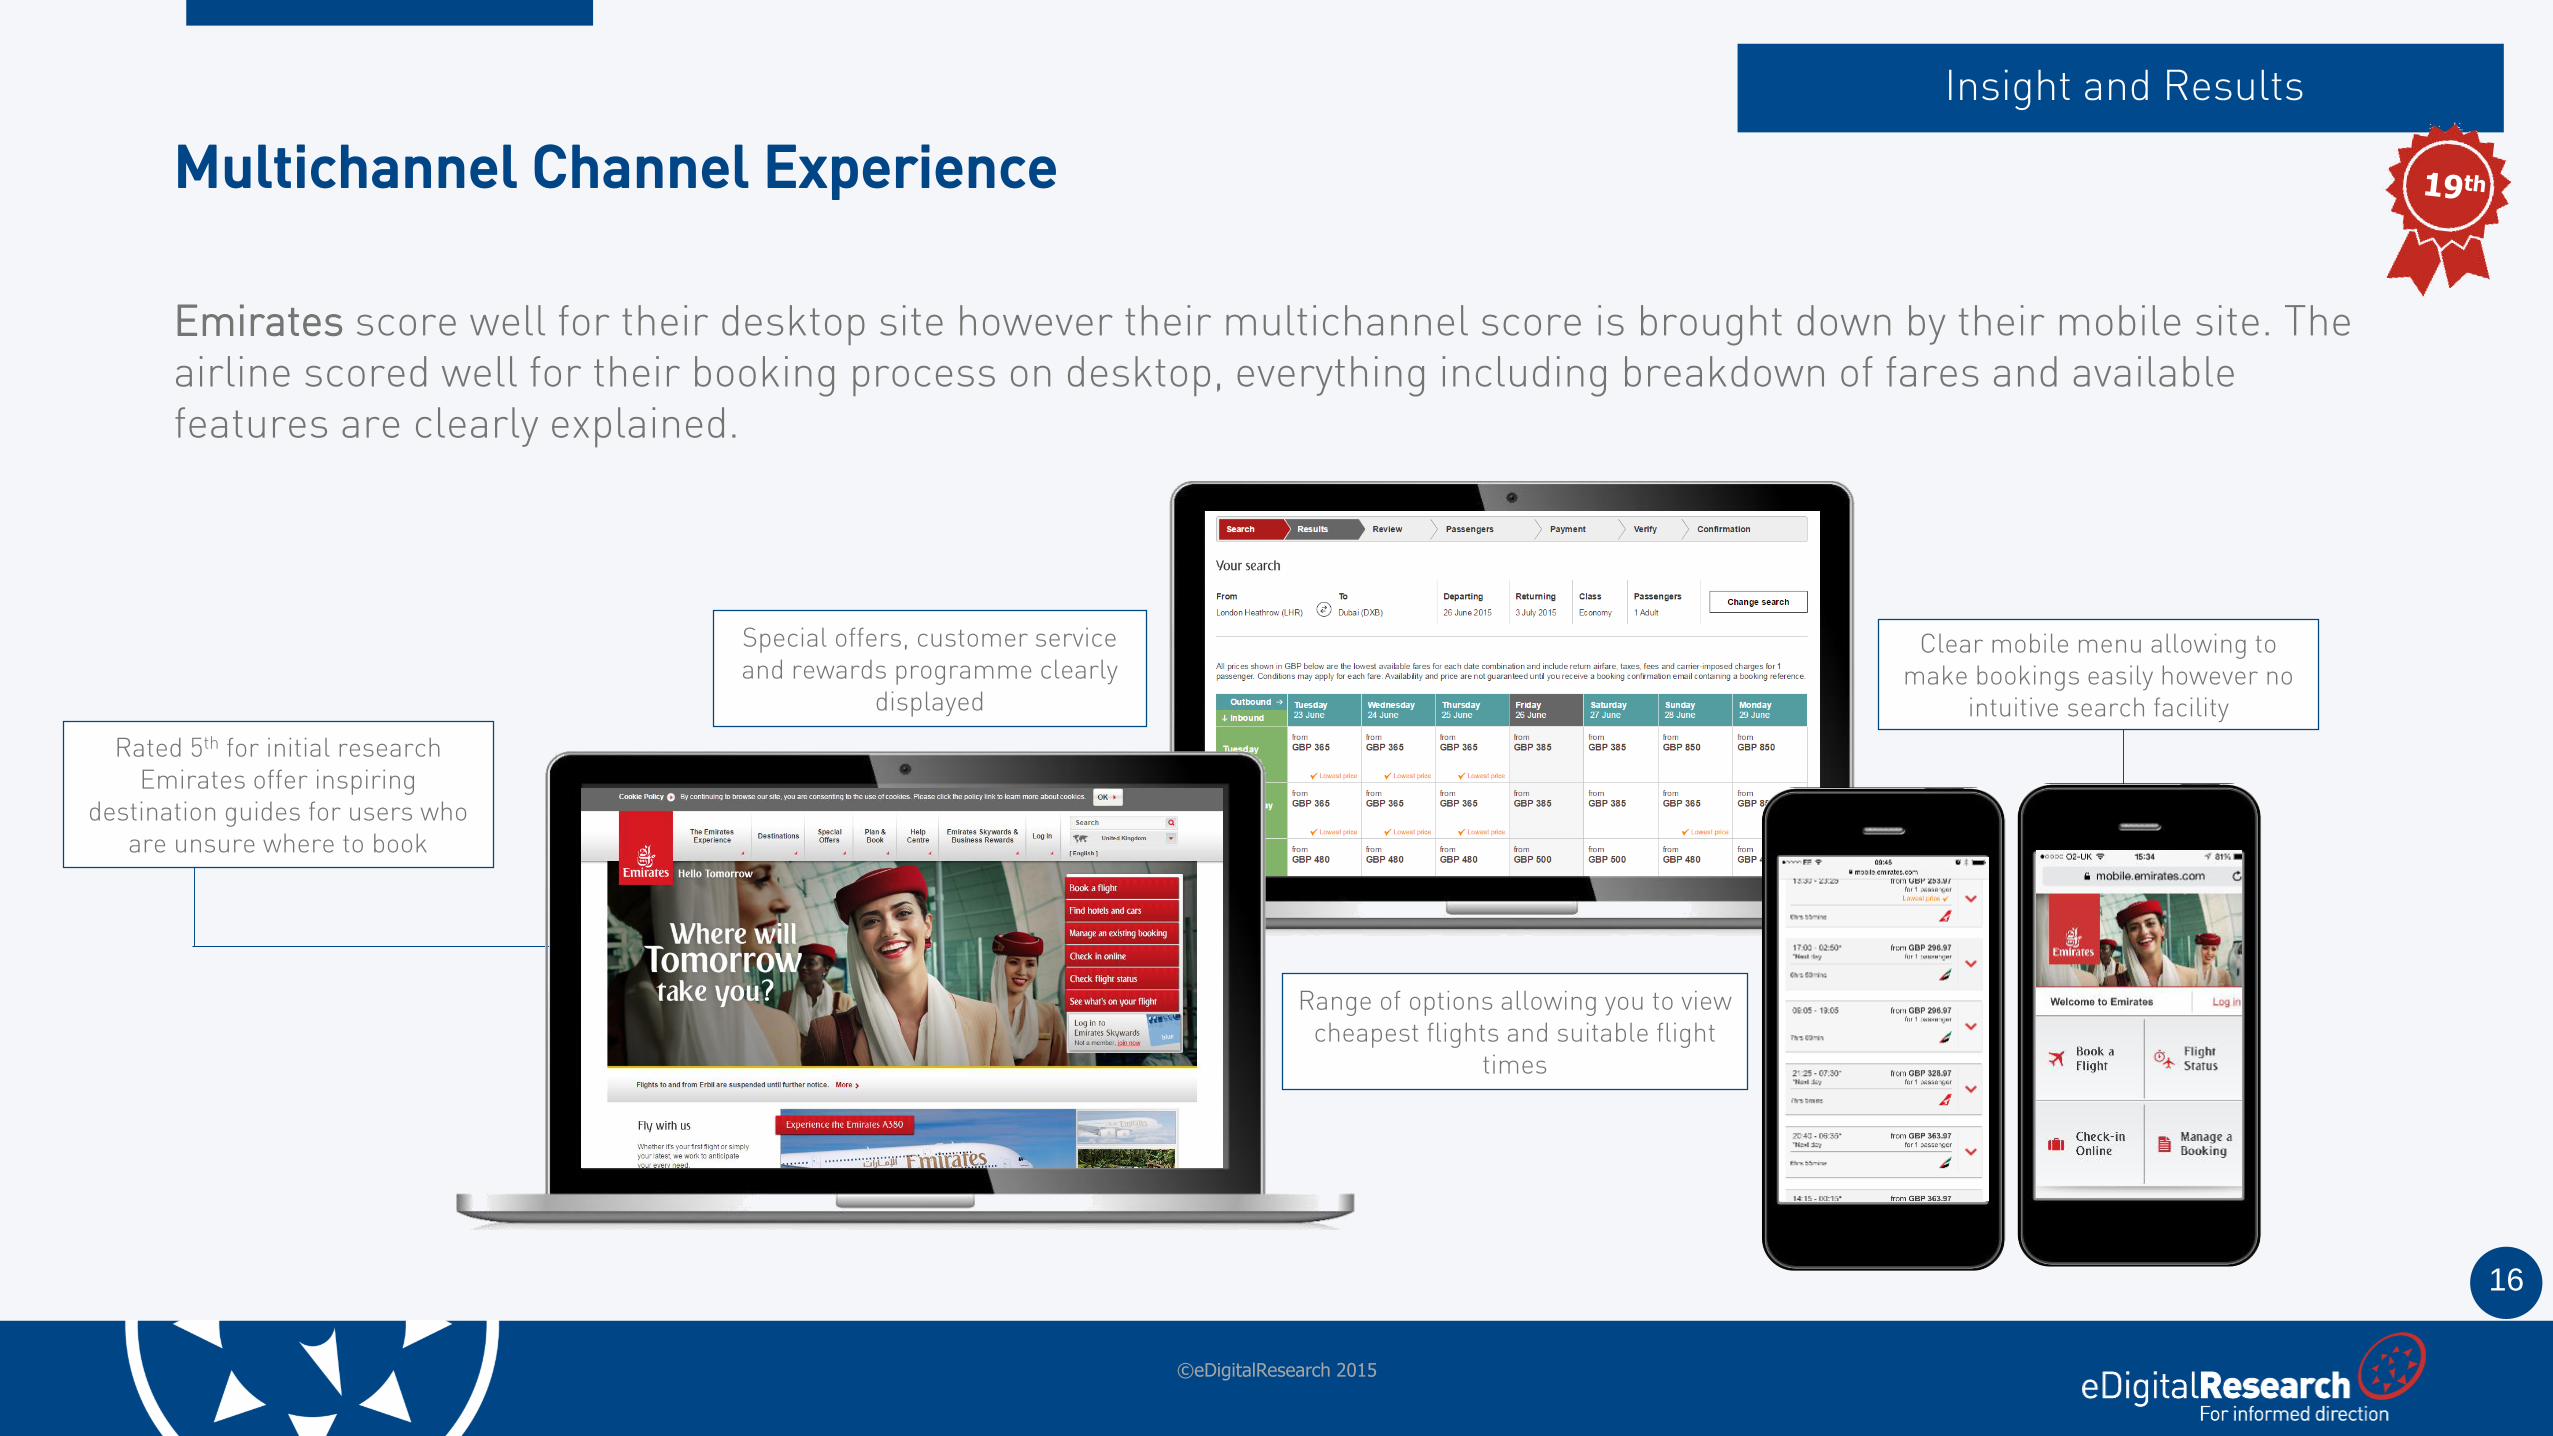
Emirates score well for their desktop site however their multichannel score is brought down by their mobile site. The airline scored well for their booking process on desktop, everything including breakdown of fares and available features are clearly explained.
Multichannel Channel Experience
Insight and Results
©eDigitalResearch 2015
Special offers, customer service and rewards programme clearly
displayed
Rated 5th for initial research Emirates offer inspiring
destination guides for users who are unsure where to book
Range of options allowing you to view cheapest flights and suitable flight
times
Clear mobile menu allowing to make bookings easily however no
intuitive search facility
17
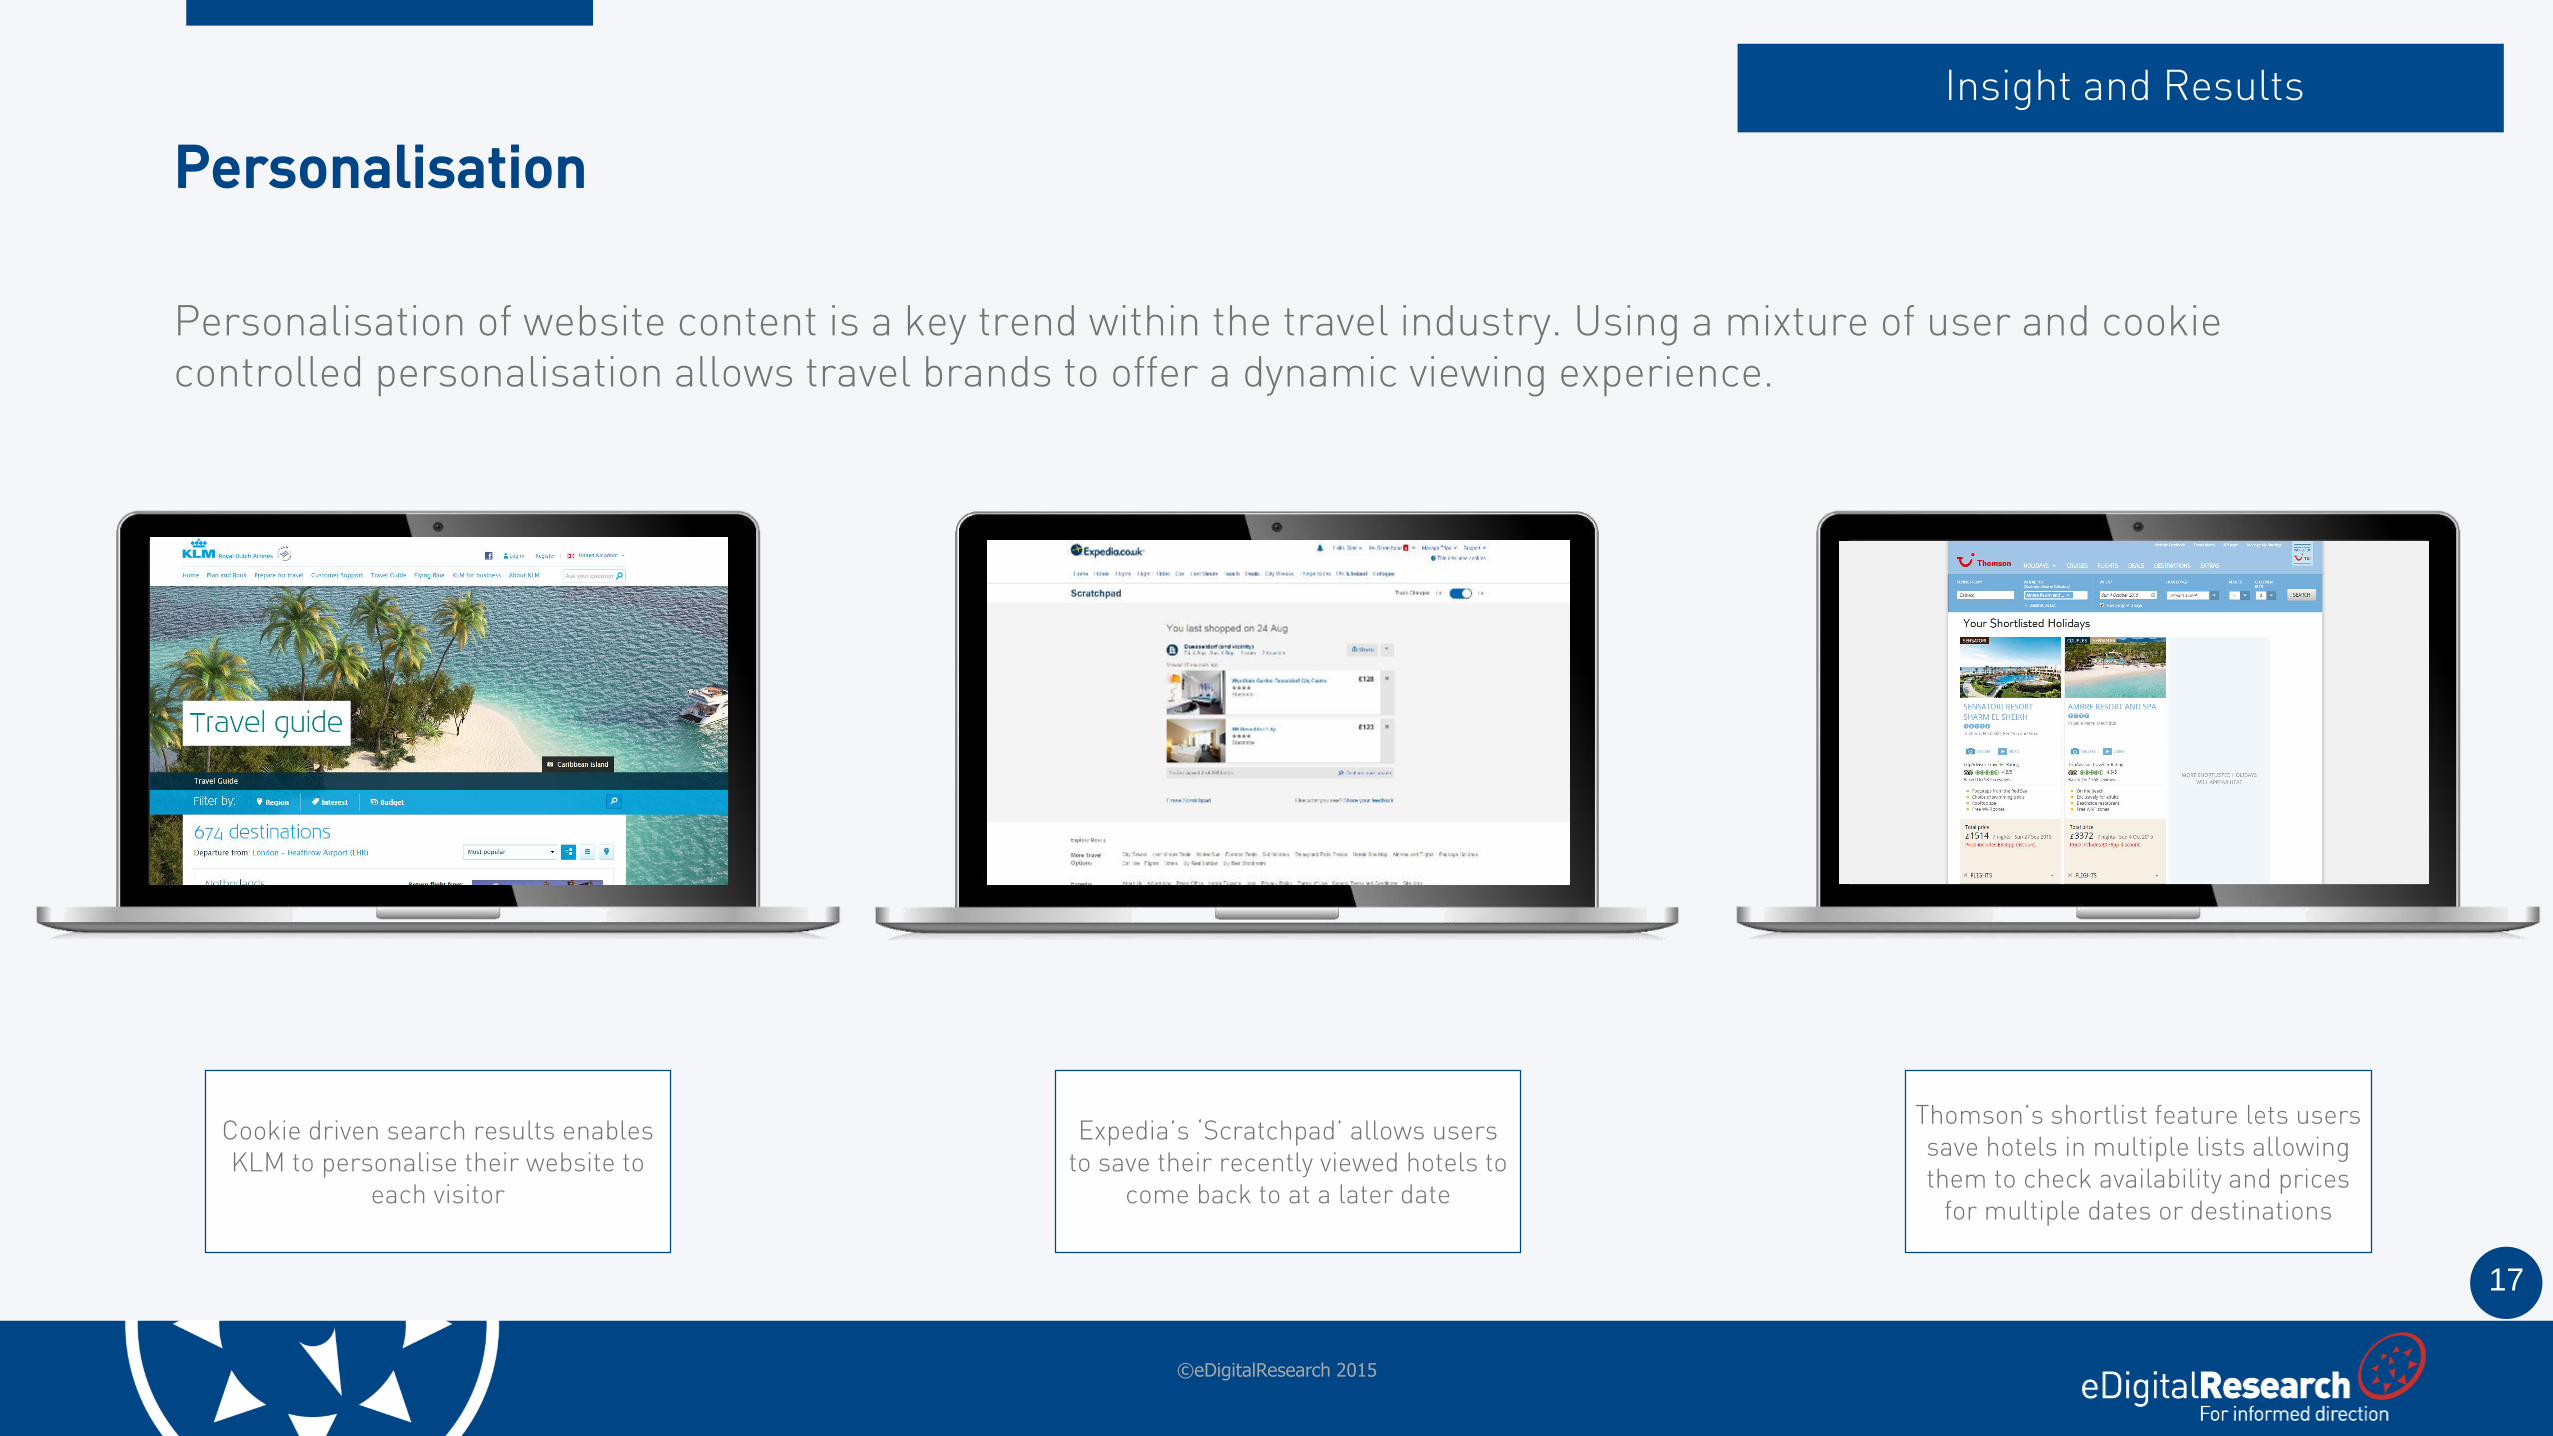
Personalisation of website content is a key trend within the travel industry. Using a mixture of user and cookie controlled personalisation allows travel brands to offer a dynamic viewing experience.
Personalisation
Insight and Results
©eDigitalResearch 2015
Thomson’s shortlist feature lets users save hotels in multiple lists allowing them to check availability and prices
for multiple dates or destinations
Cookie driven search results enables KLM to personalise their website to
each visitor
Expedia’s ‘Scratchpad’ allows users to save their recently viewed hotels to
come back to at a later date
18
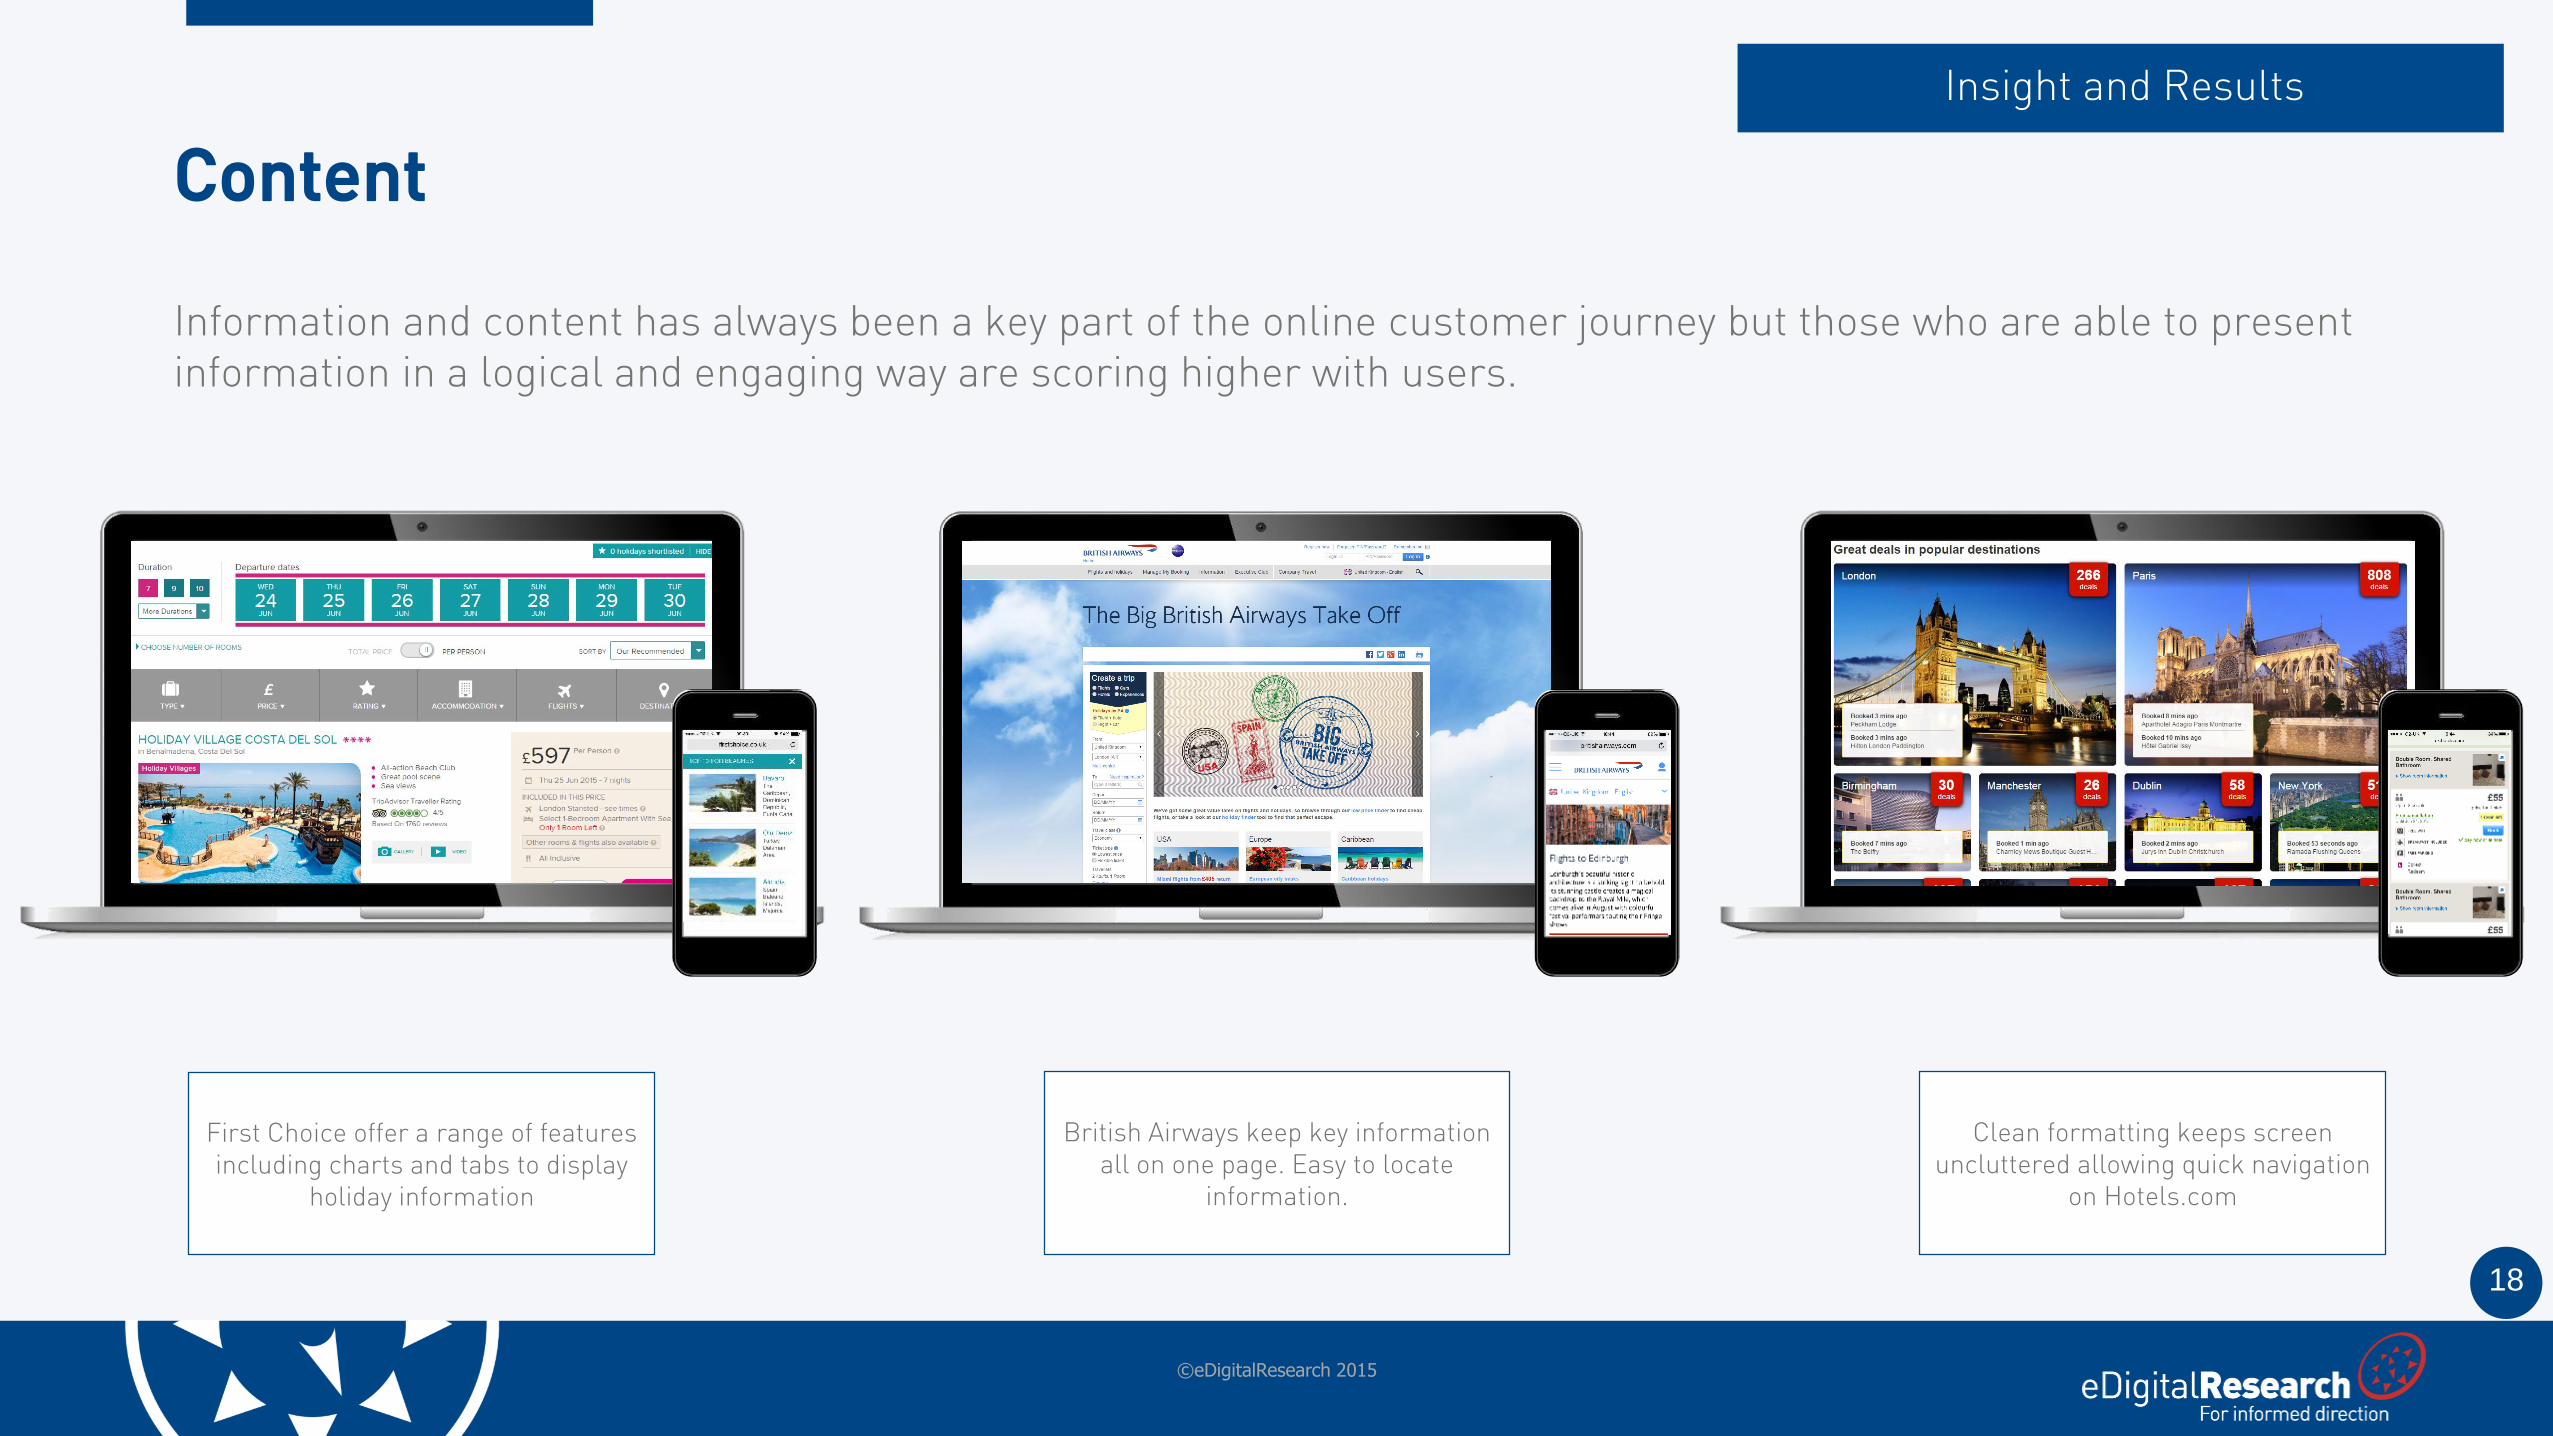
Information and content has always been a key part of the online customer journey but those who are able to present information in a logical and engaging way are scoring higher with users.
Content
Insight and Results
©eDigitalResearch 2015
Clean formatting keeps screen uncluttered allowing quick navigation
on Hotels.com
First Choice offer a range of features including charts and tabs to display
holiday information
British Airways keep key information all on one page. Easy to locate
information.
19
Customer journey results
©eDigitalResearch 2015
20
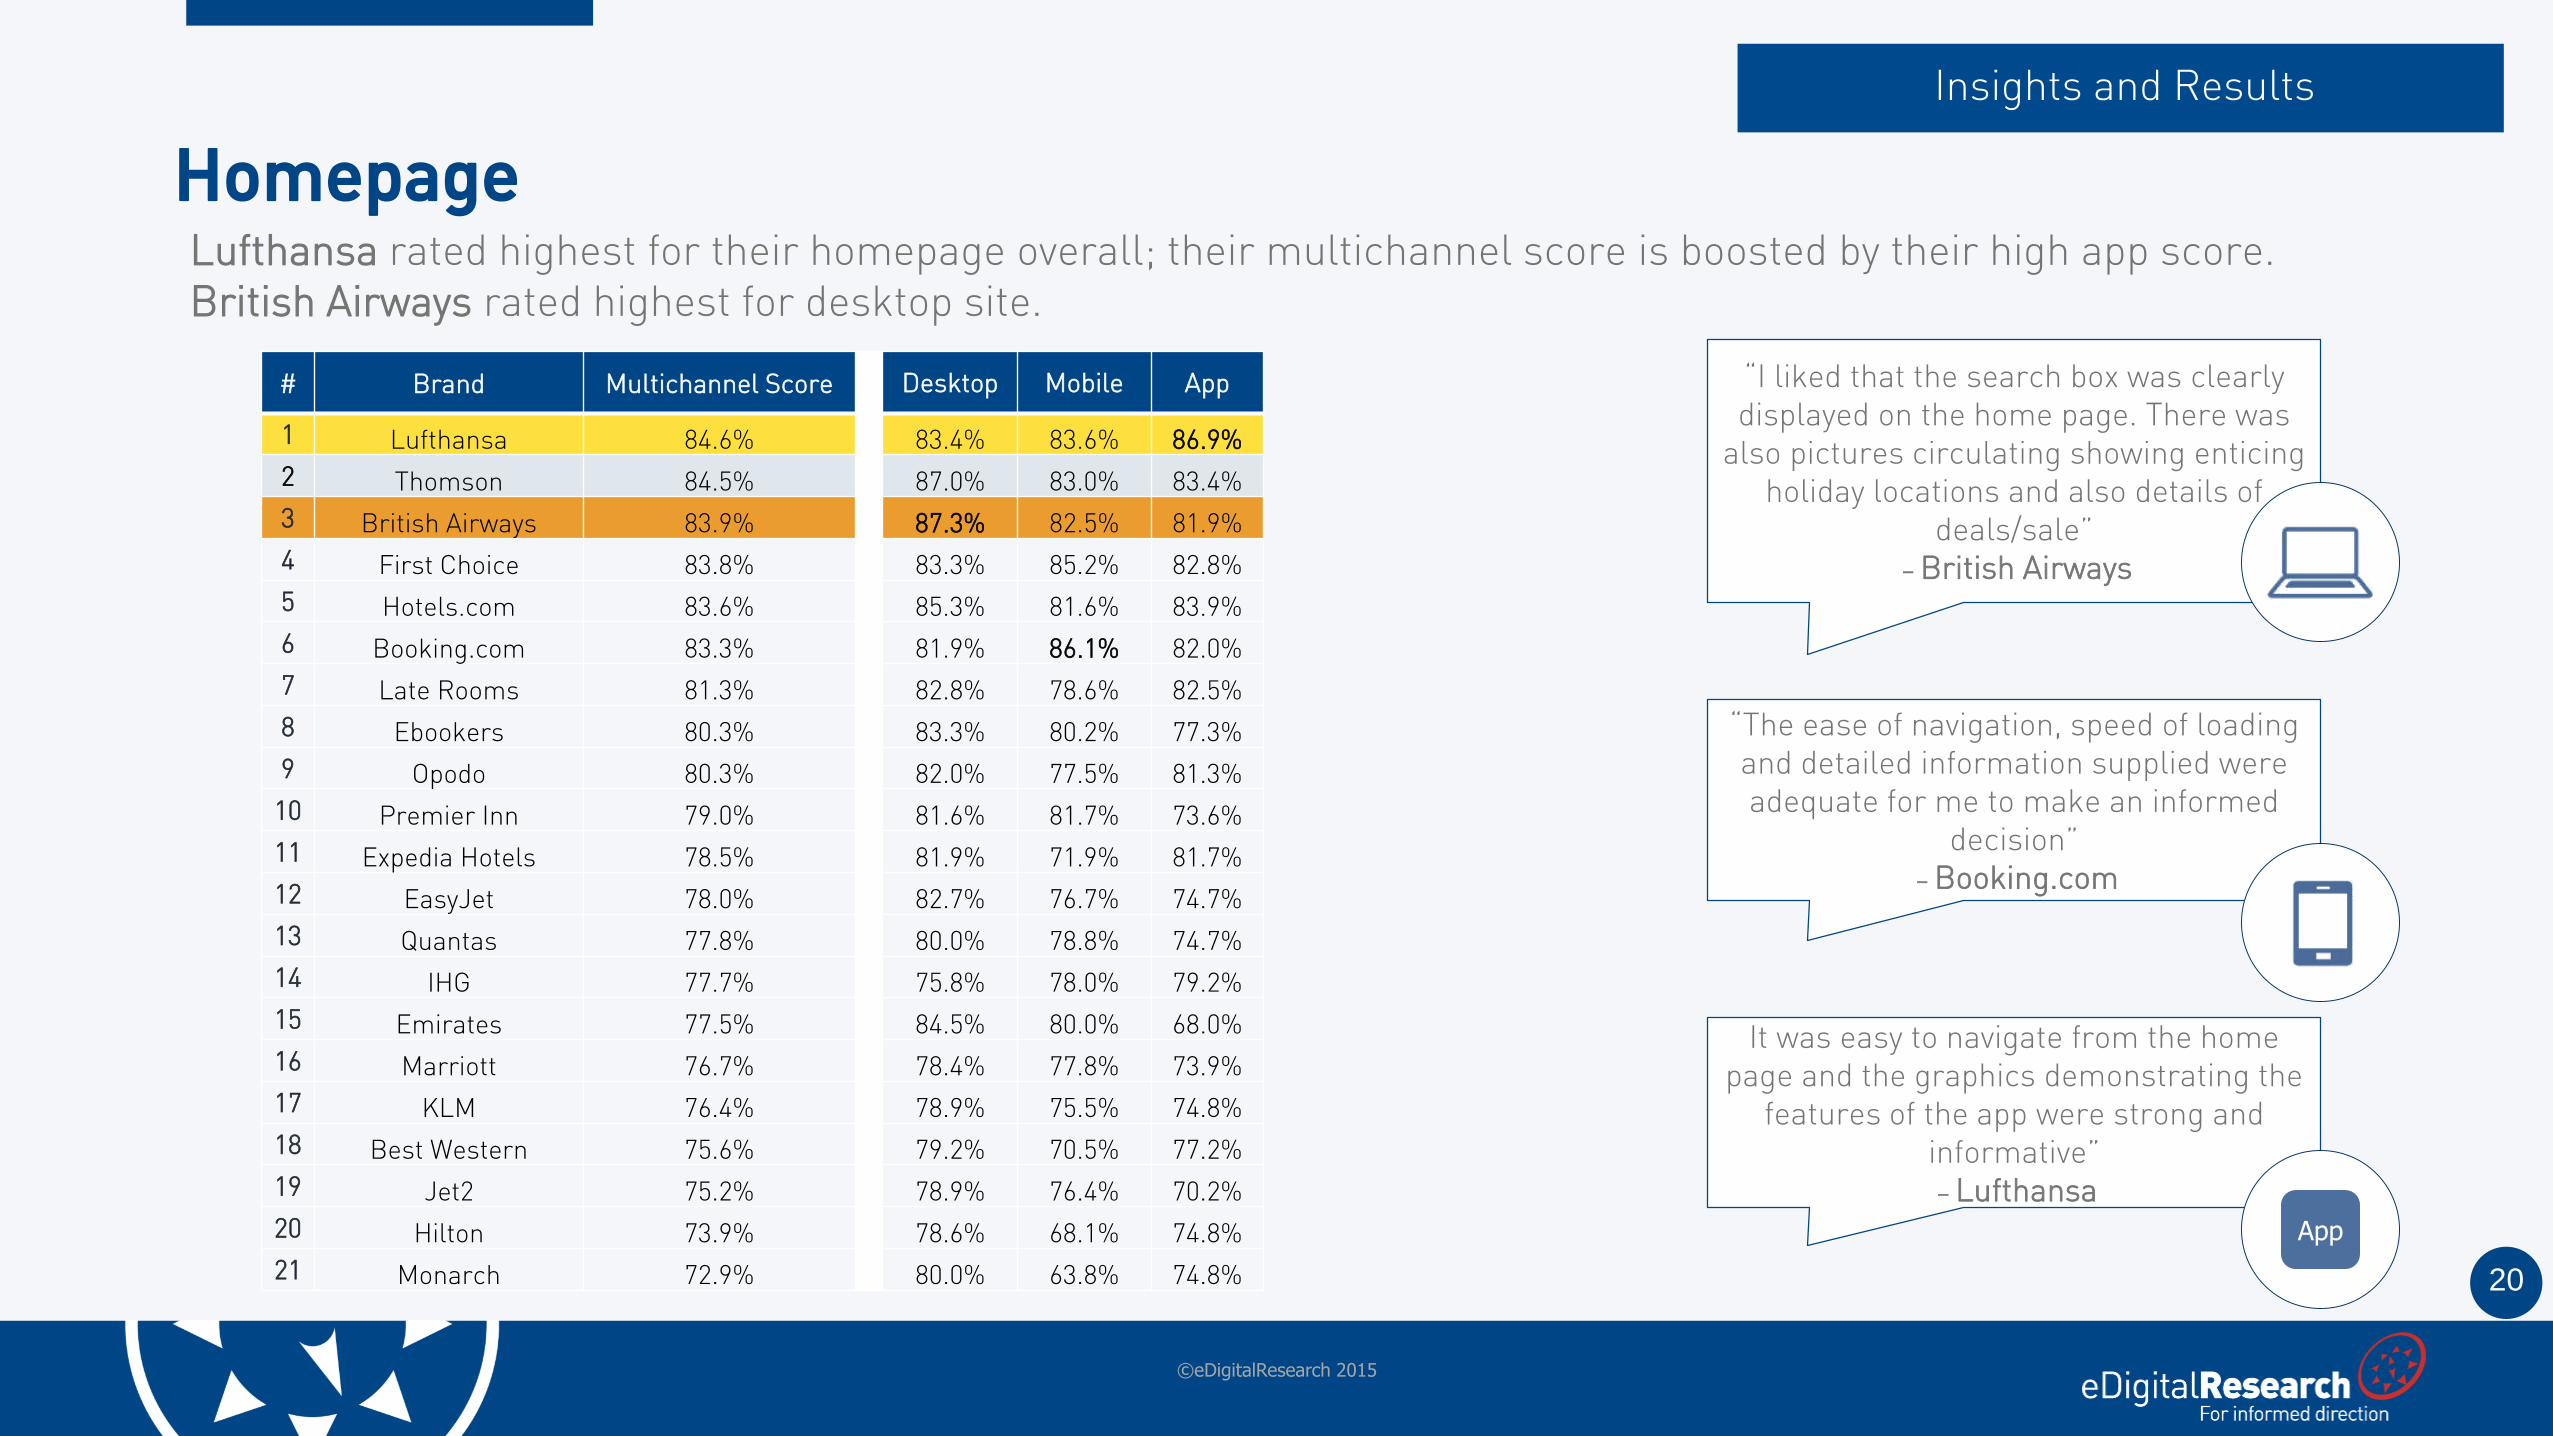
Lufthansa rated highest for their homepage overall; their multichannel score is boosted by their high app score. British Airways rated highest for desktop site.
Homepage
Insights and Results
©eDigitalResearch 2015
# Brand Multichannel Score Desktop Mobile App
1 Lufthansa 84.6% 83.4% 83.6% 86.9%
2 Thomson 84.5% 87.0% 83.0% 83.4%
3 British Airways 83.9% 87.3% 82.5% 81.9%
4 First Choice 83.8% 83.3% 85.2% 82.8%
5 Hotels.com 83.6% 85.3% 81.6% 83.9%
6 Booking.com 83.3% 81.9% 86.1% 82.0%
7 Late Rooms 81.3% 82.8% 78.6% 82.5%
8 Ebookers 80.3% 83.3% 80.2% 77.3%
9 Opodo 80.3% 82.0% 77.5% 81.3%
10 Premier Inn 79.0% 81.6% 81.7% 73.6%
11 Expedia Hotels 78.5% 81.9% 71.9% 81.7%
12 EasyJet 78.0% 82.7% 76.7% 74.7%
13 Quantas 77.8% 80.0% 78.8% 74.7%
14 IHG 77.7% 75.8% 78.0% 79.2%
15 Emirates 77.5% 84.5% 80.0% 68.0%
16 Marriott 76.7% 78.4% 77.8% 73.9%
17 KLM 76.4% 78.9% 75.5% 74.8%
18 Best Western 75.6% 79.2% 70.5% 77.2%
19 Jet2 75.2% 78.9% 76.4% 70.2%
20 Hilton 73.9% 78.6% 68.1% 74.8%
21 Monarch 72.9% 80.0% 63.8% 74.8%
“I liked that the search box was clearly displayed on the home page. There was
also pictures circulating showing enticing holiday locations and also details of
deals/sale”– British Airways
“The ease of navigation, speed of loading and detailed information supplied were adequate for me to make an informed
decision”– Booking.com
It was easy to navigate from the home page and the graphics demonstrating the
features of the app were strong and informative”– Lufthansa
App
21
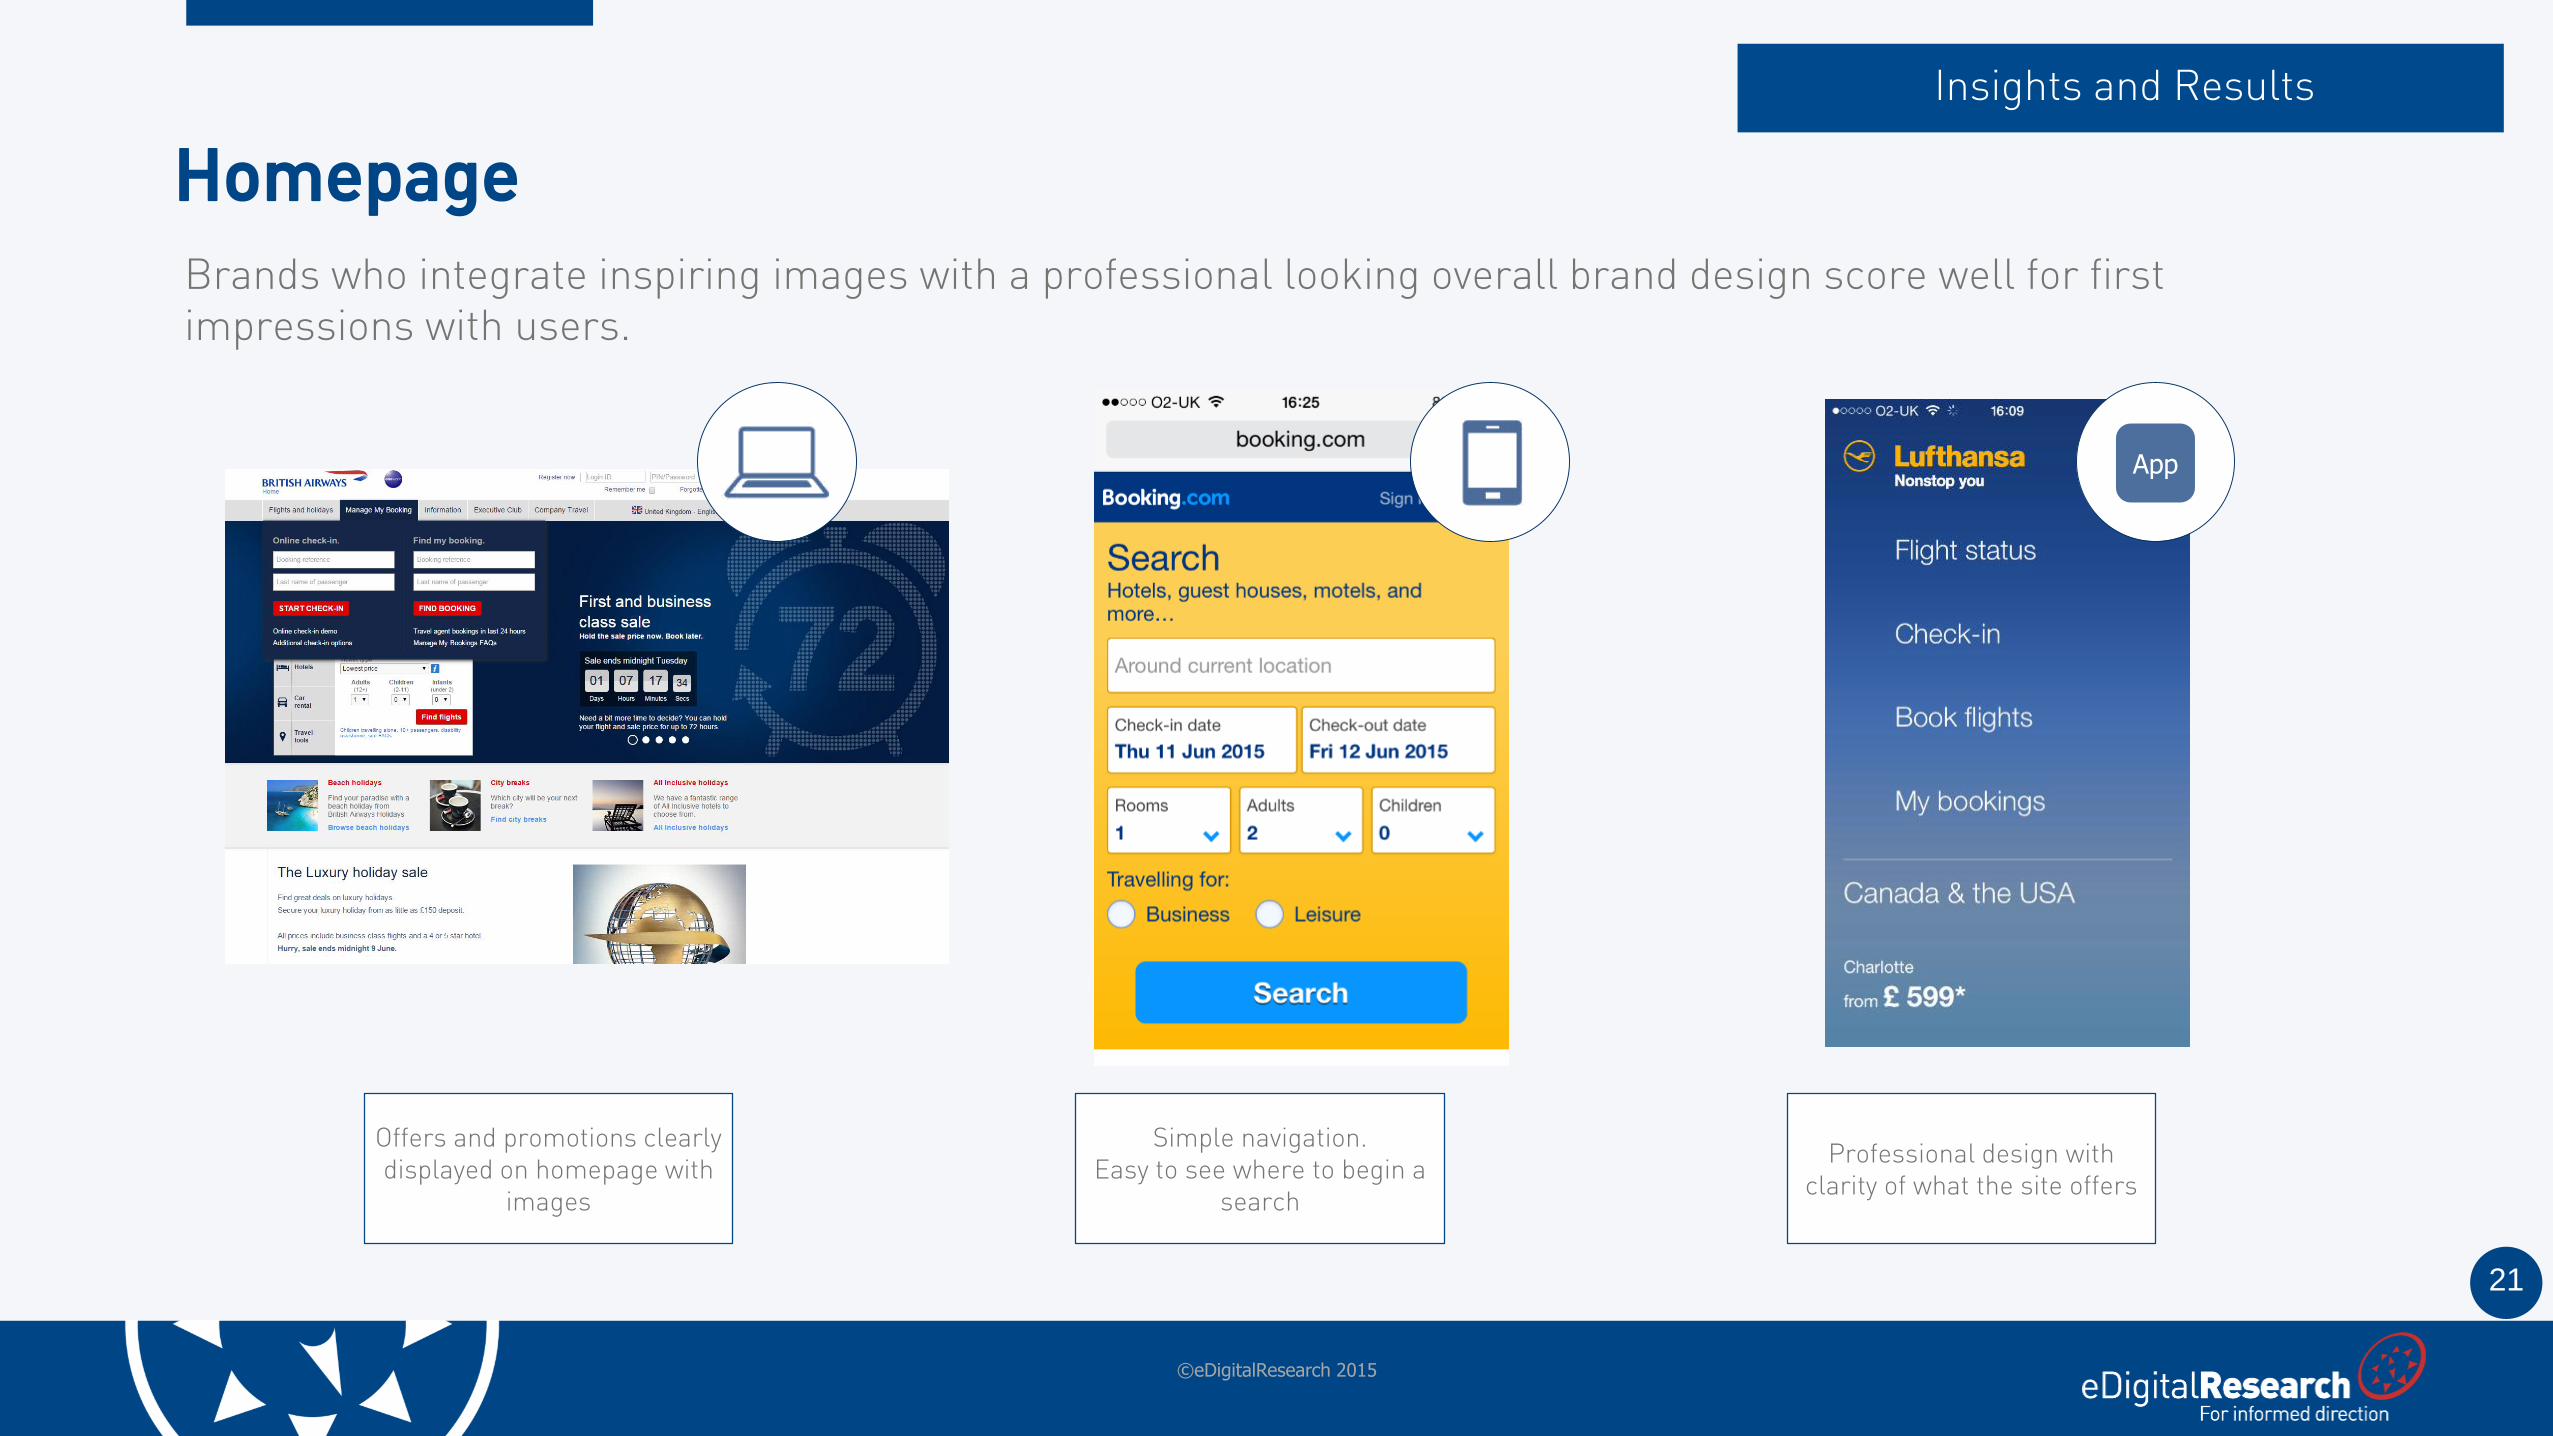
Brands who integrate inspiring images with a professional looking overall brand design score well for first impressions with users.
Homepage
Insights and Results
©eDigitalResearch 2015
Offers and promotions clearly displayed on homepage with
images
Simple navigation.Easy to see where to begin a
search
Professional design with clarity of what the site offers
App

22
First Choice top the overall league table for initial research. Thomson and Hotels.com come a close second and third respectively in the multichannel league.
Initial Research
Insights and Results
©eDigitalResearch 2015
# Brand Multichannel Score Desktop Mobile App
1 First Choice 85.9% 84.7% 85.6% 85.4%
2 Thomson 85.2% 86.7% 85.0% 84.0%
3 Hotels.com 82.9% 85.8% 80.6% 82.2%
4 Booking.com 82.5% 83.5% 84.4% 79.6%
5 Expedia Hotels 80.2% 84.0% 75.7% 81.0%
6 British Airways 79.8% 86.3% 74.7% 78.3%
7 Opodo 79.7% 83.8% 76.5% 78.9%
8 Ebookers 79.5% 84.9% 79.3% 74.4%
9 LateRooms 79.4% 80.8% 81.9% 75.3%
10 Lufthansa 76.9% 78.3% 74.9% 77.4%
11 Marriott 74.6% 76.1% 81.0% 66.8%
12 IHG 74.1% 76.5% 73.1% 72.8%
13 Best Western 71.4% 77.5% 70.0% 66.7%
14 KLM 69.3% 78.6% 73.5% 55.7%
15 Premier Inn 69.1% 75.4% 68.3% 63.5%
16 Qantas 68.9% 77.8% 65.8% 63.1%
17 EasyJet 68.8% 82.4% 65.0% 58.9%
18 Hilton 66.3% 83.5% 54.3% 61.1%
“'Destinations' link is very helpful. Extensive information available about the
places on offer. Informative text and pictures. Great for inspiring customers who are unsure of where to travel too”.
– Thomson
“The use of imagery is very good on almost every page that I clicked into -there were lots of good pictures and videos that were easy to click on and
enhanced the excitement of researching locations and checking out prices”.
– First Choice
“The app provided detailed information on holiday hotels and resorts and also
suggested interesting ideas for inspiration”
– First ChoiceApp
# Brand Multichannel Score Desktop Mobile App
1 First Choice 85.9% 84.7% 85.6% 85.4%
2 Thomson 85.2% 86.7% 85.0% 84.0%
3 Hotels.com 82.9% 85.8% 80.6% 82.2%
4 Booking.com 82.5% 83.5% 84.4% 79.6%
5 Expedia Hotels 80.2% 84.0% 75.7% 81.0%
6 British Airways 79.8% 86.3% 74.7% 78.3%
7 Opodo 79.7% 83.8% 76.5% 78.9%
8 Ebookers 79.5% 84.9% 79.3% 74.4%
9 LateRooms 79.4% 80.8% 81.9% 75.3%
10 Lufthansa 76.9% 78.3% 74.9% 77.4%
11 Marriott 74.6% 76.1% 81.0% 66.8%
12 IHG 74.1% 76.5% 73.1% 72.8%
13 Best Western 71.4% 77.5% 70.0% 66.7%
14 KLM 69.3% 78.6% 73.5% 55.7%
15 Premier Inn 69.1% 75.4% 68.3% 63.5%
16 Qantas 68.9% 77.8% 65.8% 63.1%
17 EasyJet 68.8% 82.4% 65.0% 58.9%
18 Hilton 66.3% 83.5% 54.3% 61.1%
19 Jet2 65.1% 84.0% 58.6% 52.8%
20 Emirates 62.7% 85.1% 55.3% 47.6%
21 Monarch 60.4% 81.7% 40.1% 59.4%
23
Initial Research
Insights and Results
©eDigitalResearch 2015
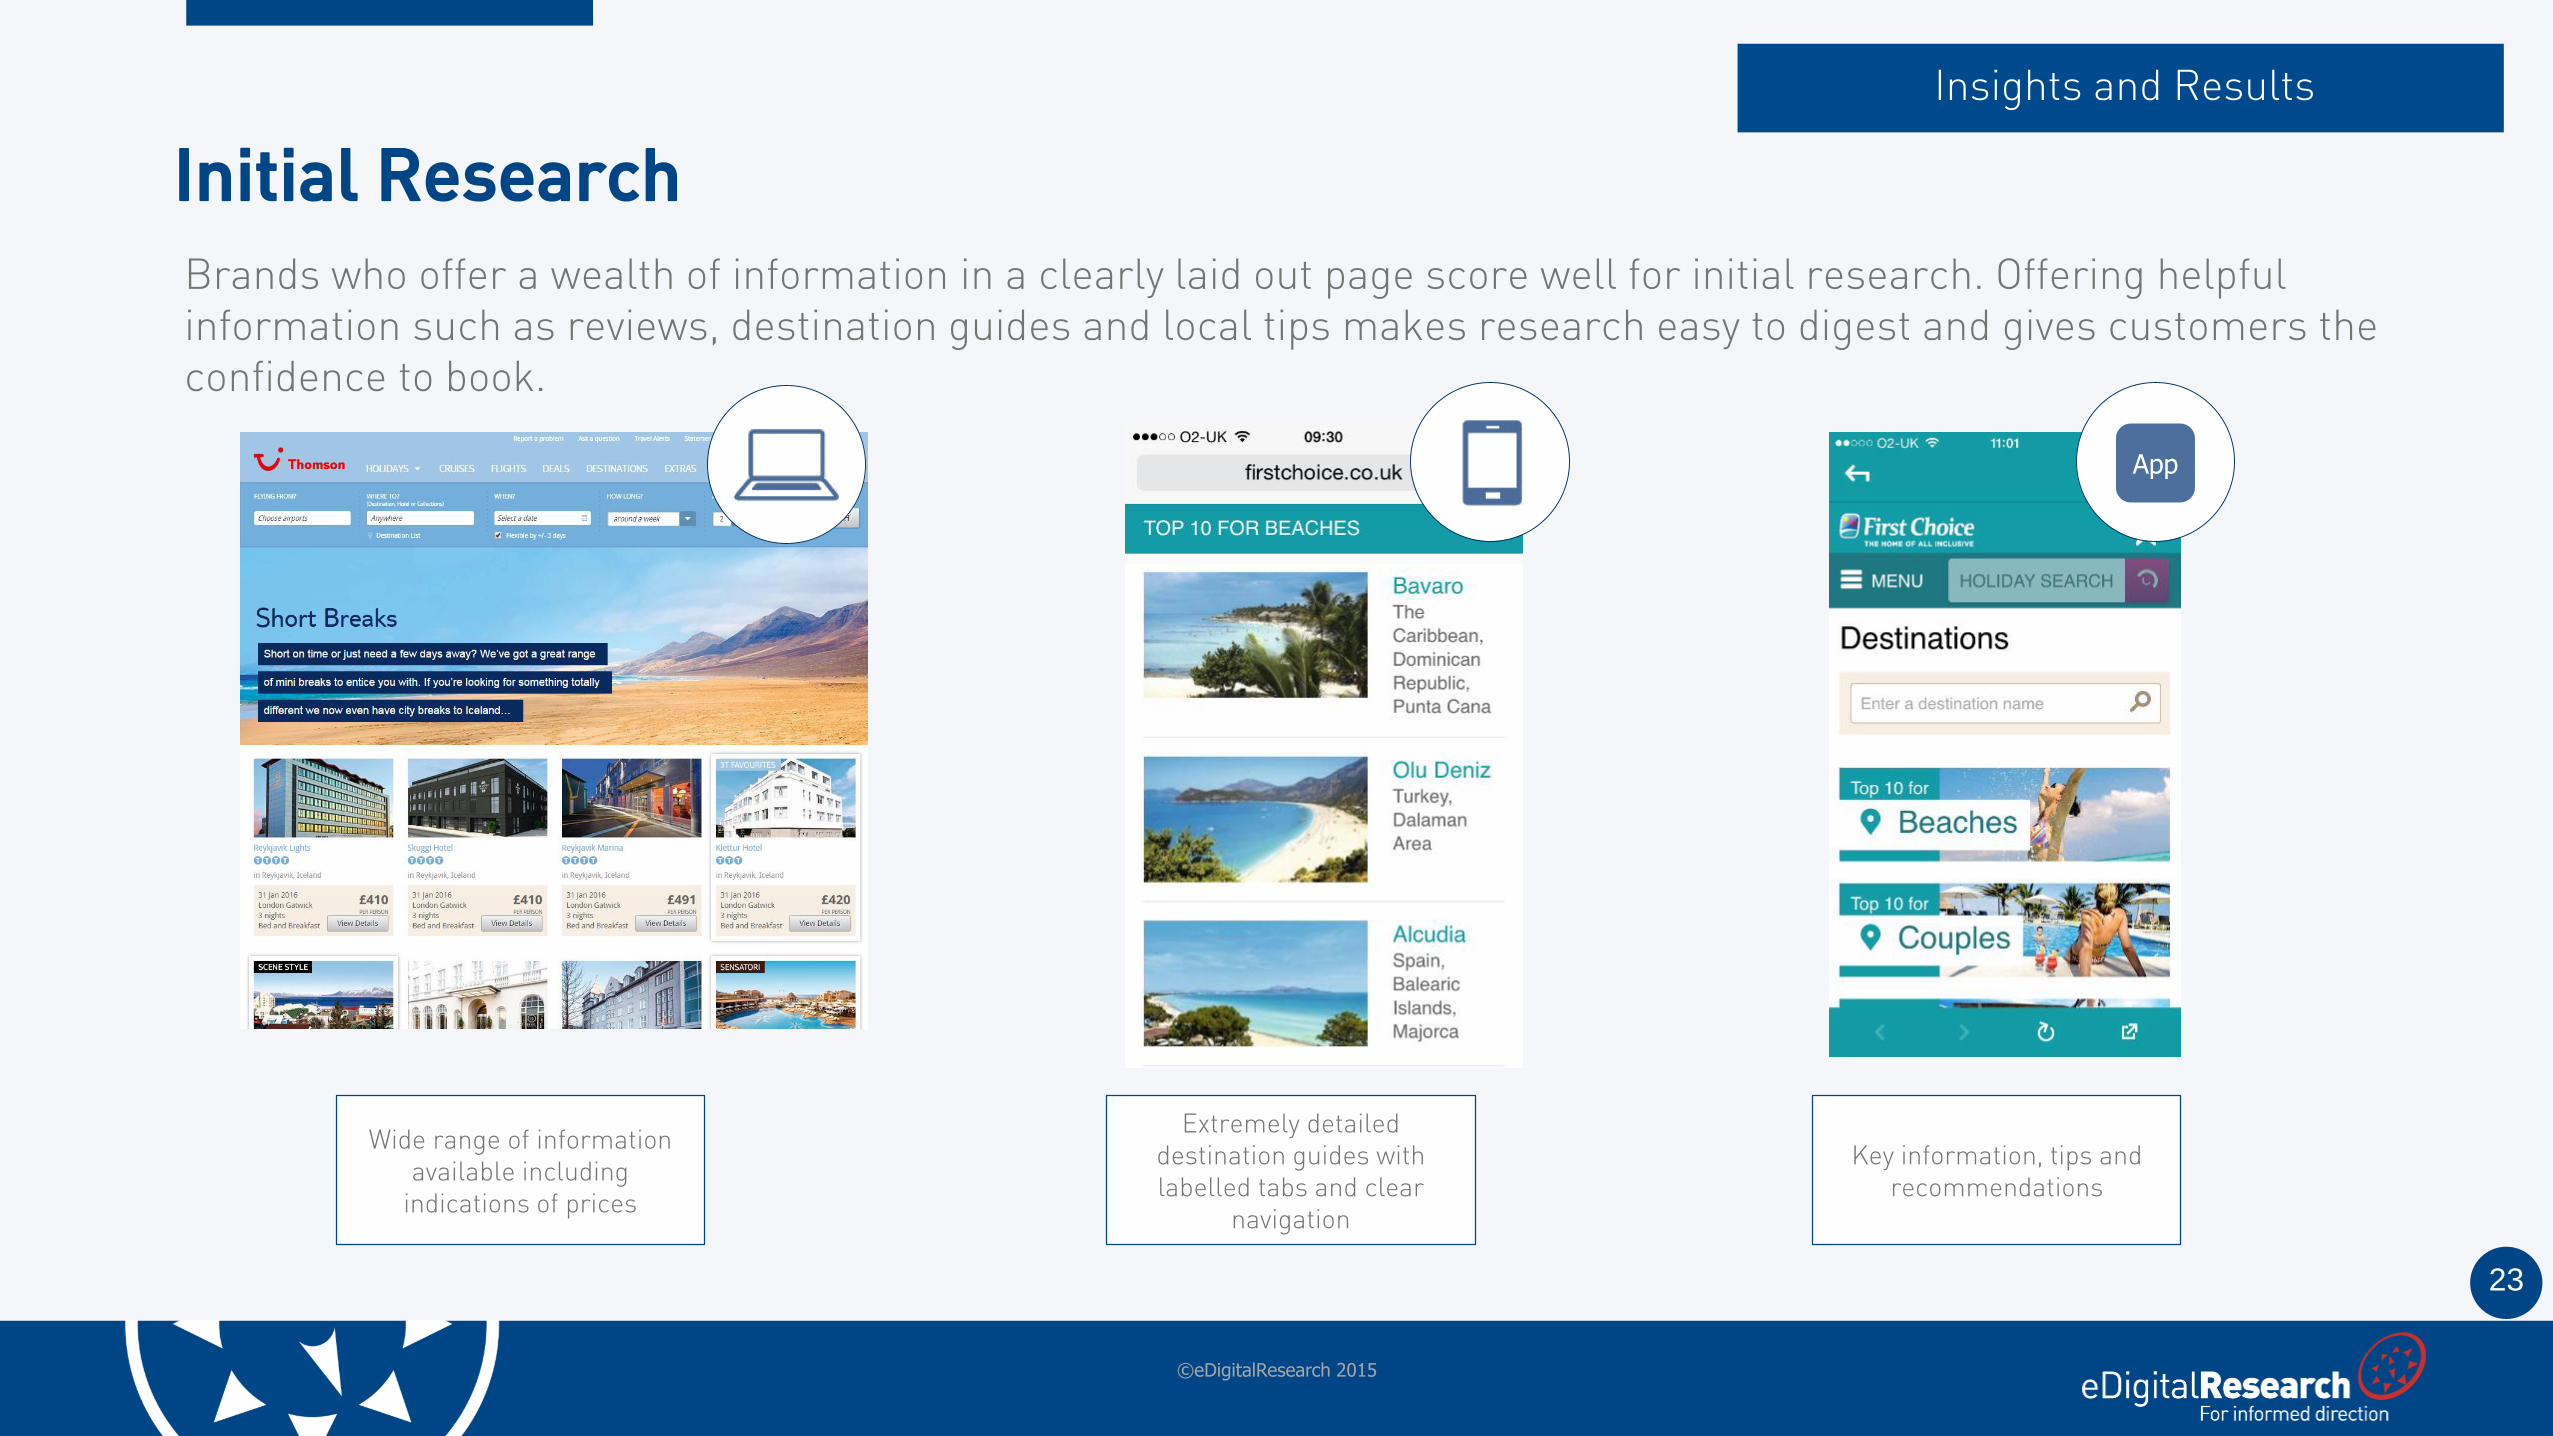
Wide range of information available including
indications of prices
Key information, tips and recommendations
Extremely detailed destination guides with labelled tabs and clear
navigation
Brands who offer a wealth of information in a clearly laid out page score well for initial research. Offering helpful information such as reviews, destination guides and local tips makes research easy to digest and gives customers the confidence to book.
App
24
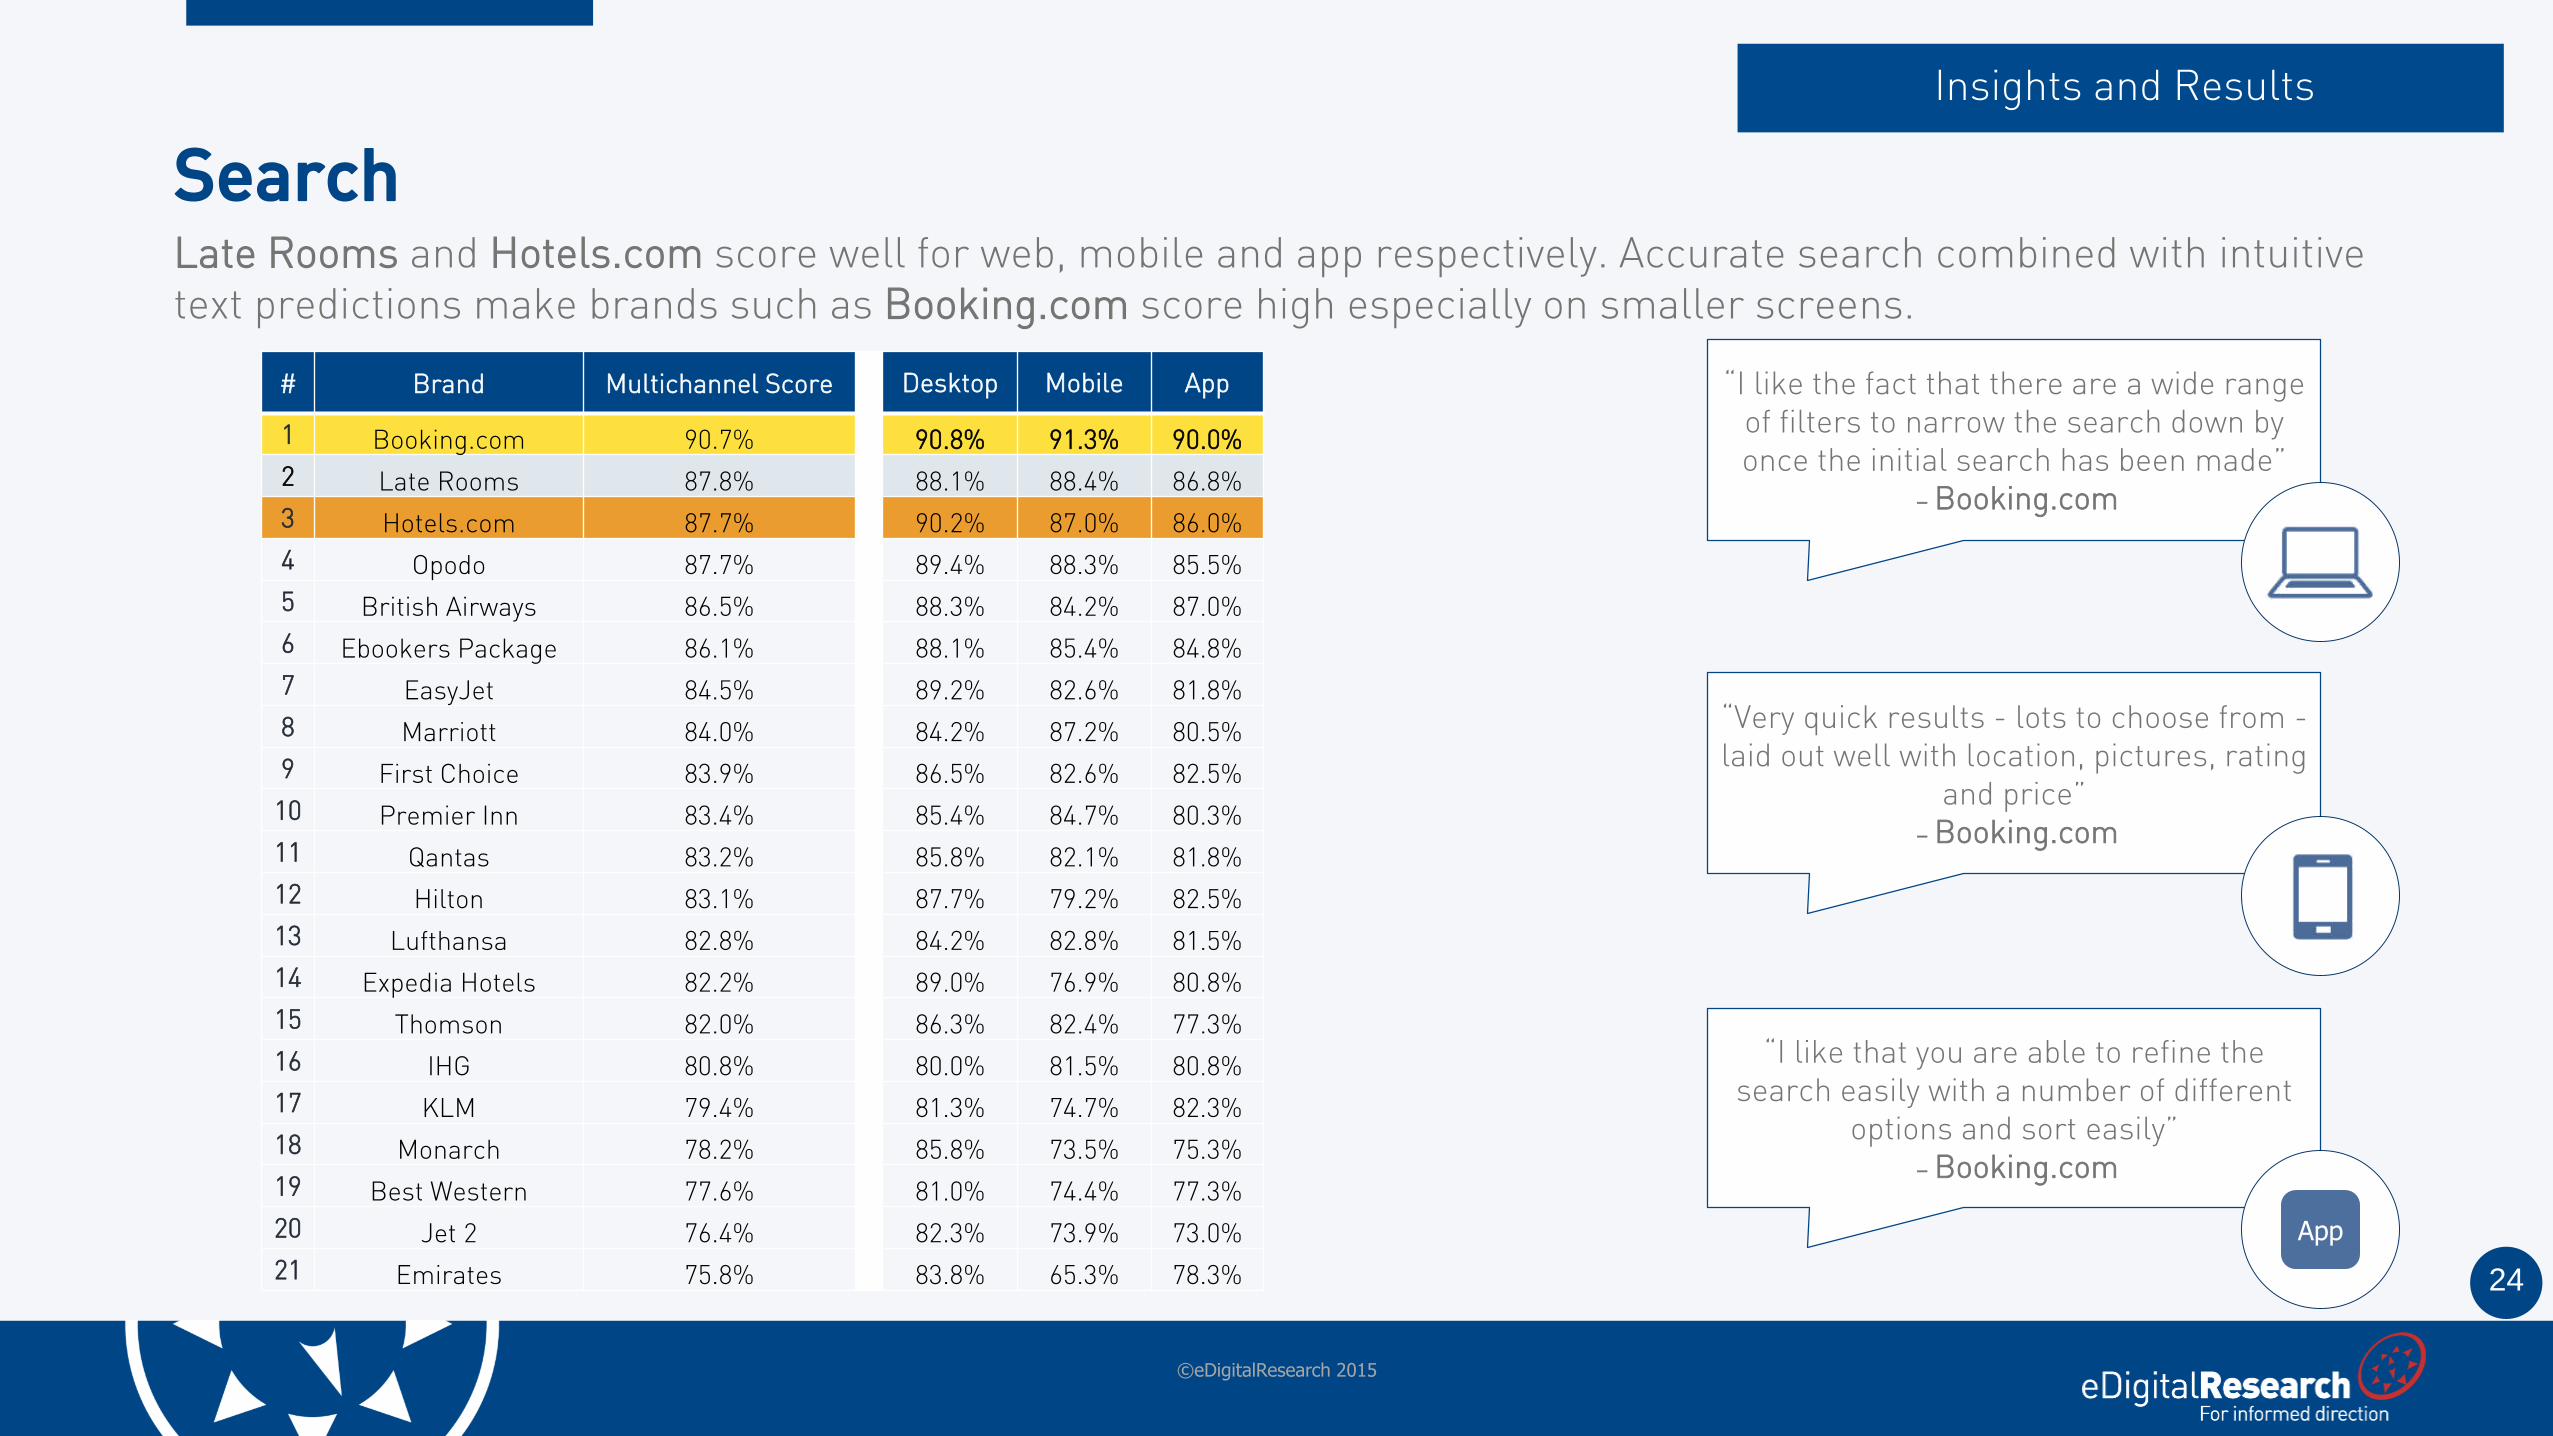
Late Rooms and Hotels.com score well for web, mobile and app respectively. Accurate search combined with intuitive text predictions make brands such as Booking.com score high especially on smaller screens.
Search
Insights and Results
©eDigitalResearch 2015
“I like the fact that there are a wide range of filters to narrow the search down by once the initial search has been made”
– Booking.com
“Very quick results - lots to choose from -laid out well with location, pictures, rating
and price”– Booking.com
“I like that you are able to refine the search easily with a number of different
options and sort easily”– Booking.com
App
# Brand Multichannel Score Desktop Mobile App
1 Booking.com 90.7% 90.8% 91.3% 90.0%
2 Late Rooms 87.8% 88.1% 88.4% 86.8%
3 Hotels.com 87.7% 90.2% 87.0% 86.0%
4 Opodo 87.7% 89.4% 88.3% 85.5%
5 British Airways 86.5% 88.3% 84.2% 87.0%
6 Ebookers Package 86.1% 88.1% 85.4% 84.8%
7 EasyJet 84.5% 89.2% 82.6% 81.8%
8 Marriott 84.0% 84.2% 87.2% 80.5%
9 First Choice 83.9% 86.5% 82.6% 82.5%
10 Premier Inn 83.4% 85.4% 84.7% 80.3%
11 Qantas 83.2% 85.8% 82.1% 81.8%
12 Hilton 83.1% 87.7% 79.2% 82.5%
13 Lufthansa 82.8% 84.2% 82.8% 81.5%
14 Expedia Hotels 82.2% 89.0% 76.9% 80.8%
15 Thomson 82.0% 86.3% 82.4% 77.3%
16 IHG 80.8% 80.0% 81.5% 80.8%
17 KLM 79.4% 81.3% 74.7% 82.3%
18 Monarch 78.2% 85.8% 73.5% 75.3%
19 Best Western 77.6% 81.0% 74.4% 77.3%
20 Jet 2 76.4% 82.3% 73.9% 73.0%
21 Emirates 75.8% 83.8% 65.3% 78.3%
25
Search
Insights and Results
©eDigitalResearch 2015
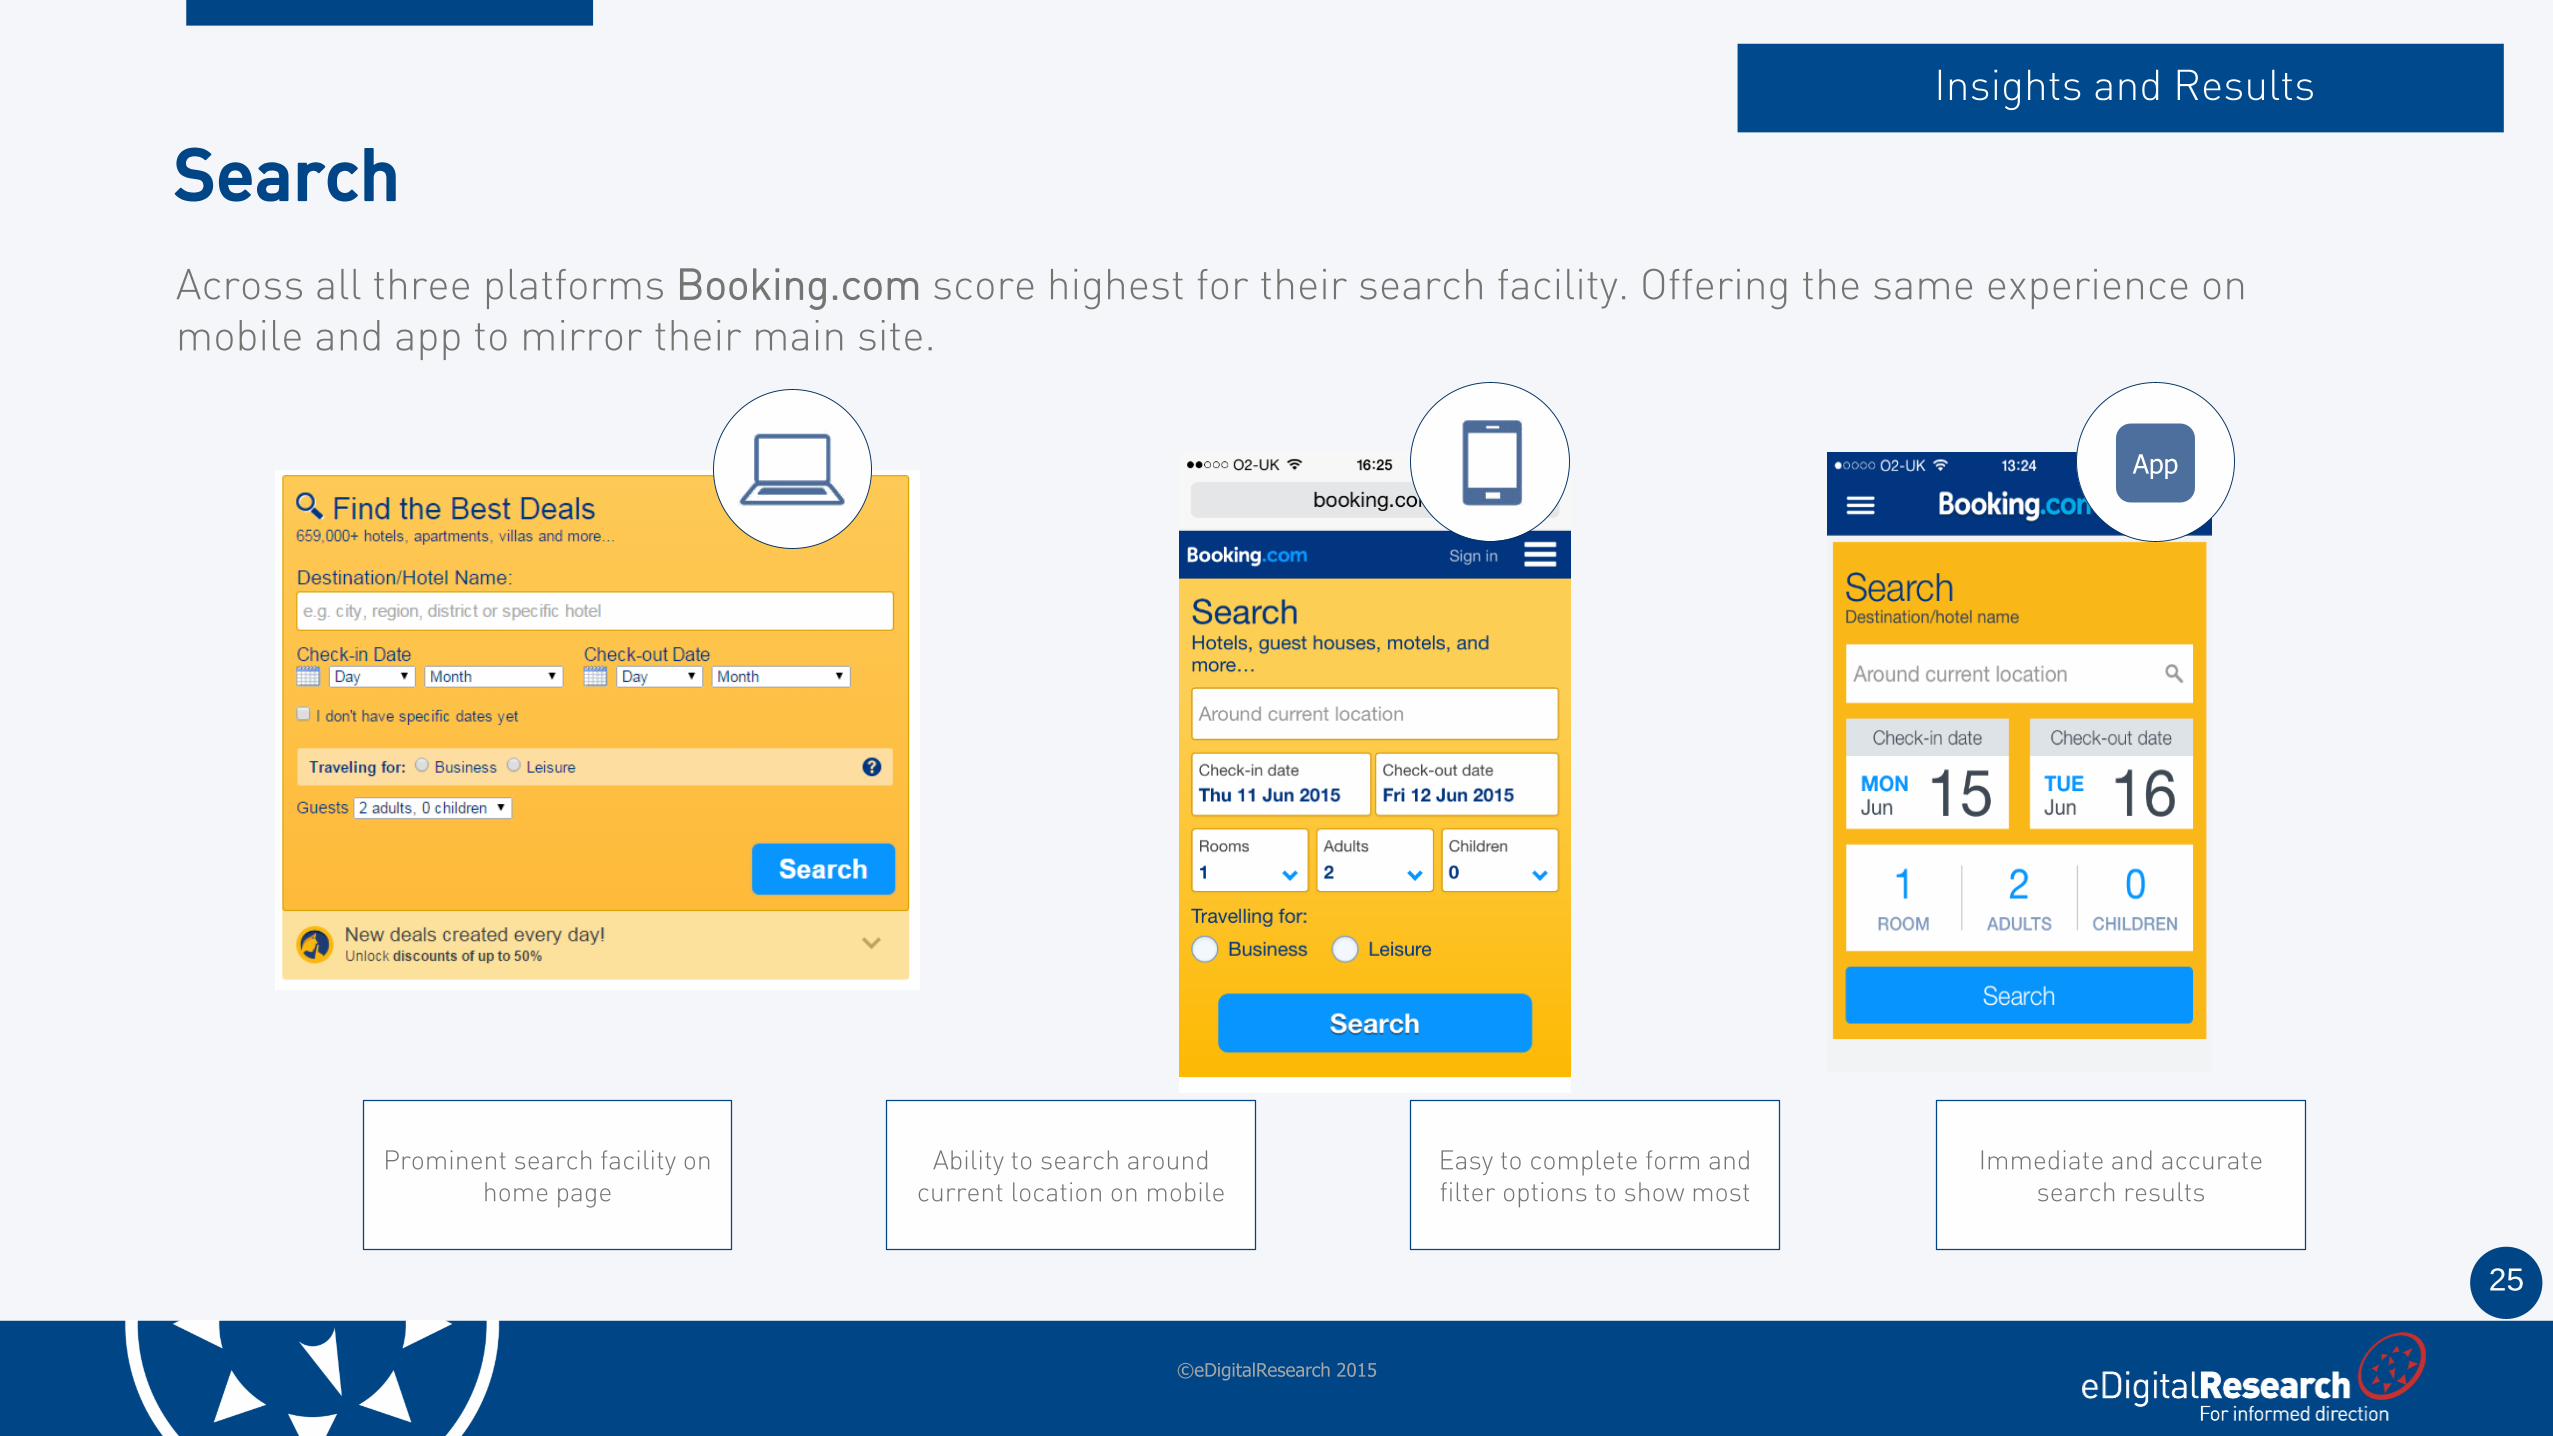
Prominent search facility on home page
Immediate and accurate search results
Easy to complete form and filter options to show most
Across all three platforms Booking.com score highest for their search facility. Offering the same experience on mobile and app to mirror their main site.
Ability to search around current location on mobile
App
26
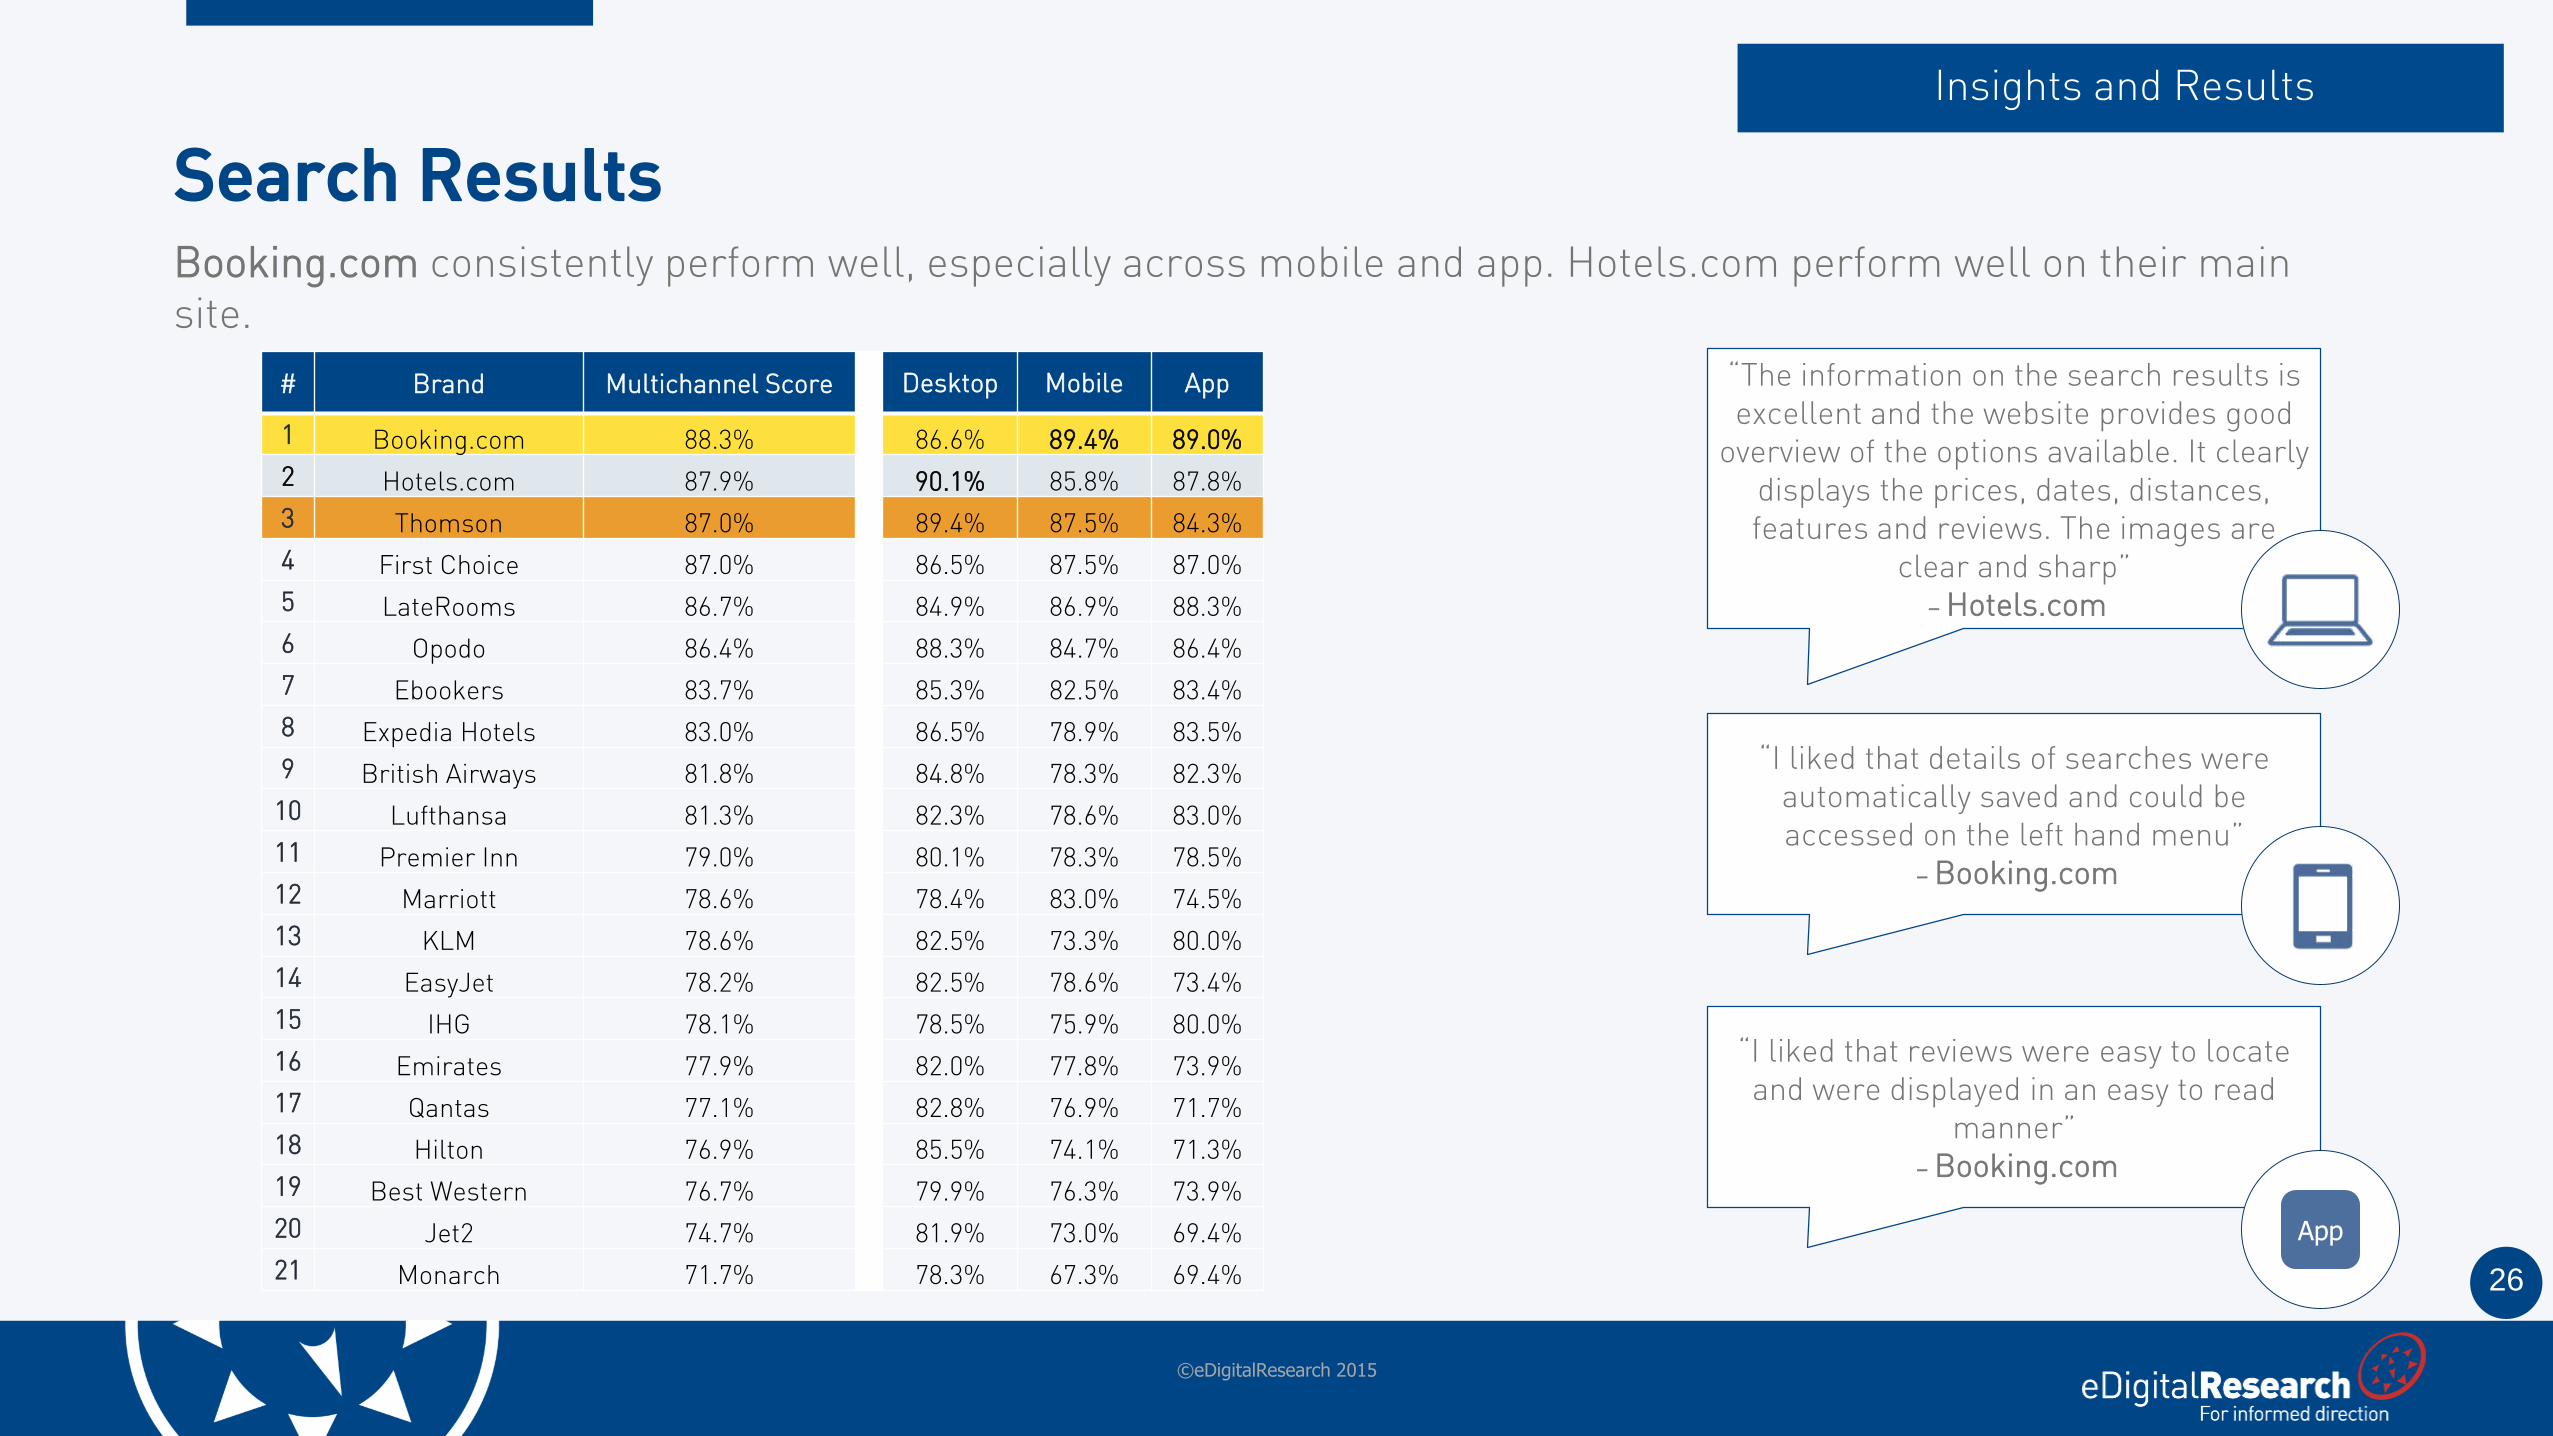
Booking.com consistently perform well, especially across mobile and app. Hotels.com perform well on their main site.
Search Results
Insights and Results
©eDigitalResearch 2015
# Brand Multichannel Score Desktop Mobile App
1 Booking.com 88.3% 86.6% 89.4% 89.0%
2 Hotels.com 87.9% 90.1% 85.8% 87.8%
3 Thomson 87.0% 89.4% 87.5% 84.3%
4 First Choice 87.0% 86.5% 87.5% 87.0%
5 LateRooms 86.7% 84.9% 86.9% 88.3%
6 Opodo 86.4% 88.3% 84.7% 86.4%
7 Ebookers 83.7% 85.3% 82.5% 83.4%
8 Expedia Hotels 83.0% 86.5% 78.9% 83.5%
9 British Airways 81.8% 84.8% 78.3% 82.3%
10 Lufthansa 81.3% 82.3% 78.6% 83.0%
11 Premier Inn 79.0% 80.1% 78.3% 78.5%
12 Marriott 78.6% 78.4% 83.0% 74.5%
13 KLM 78.6% 82.5% 73.3% 80.0%
14 EasyJet 78.2% 82.5% 78.6% 73.4%
15 IHG 78.1% 78.5% 75.9% 80.0%
16 Emirates 77.9% 82.0% 77.8% 73.9%
17 Qantas 77.1% 82.8% 76.9% 71.7%
18 Hilton 76.9% 85.5% 74.1% 71.3%
“The information on the search results is excellent and the website provides good
overview of the options available. It clearly displays the prices, dates, distances, features and reviews. The images are
clear and sharp”– Hotels.com
“I liked that details of searches were automatically saved and could be accessed on the left hand menu”
– Booking.com
“I liked that reviews were easy to locate and were displayed in an easy to read
manner”– Booking.com
App
# Brand Multichannel Score Desktop Mobile App
1 Booking.com 88.3% 86.6% 89.4% 89.0%
2 Hotels.com 87.9% 90.1% 85.8% 87.8%
3 Thomson 87.0% 89.4% 87.5% 84.3%
4 First Choice 87.0% 86.5% 87.5% 87.0%
5 LateRooms 86.7% 84.9% 86.9% 88.3%
6 Opodo 86.4% 88.3% 84.7% 86.4%
7 Ebookers 83.7% 85.3% 82.5% 83.4%
8 Expedia Hotels 83.0% 86.5% 78.9% 83.5%
9 British Airways 81.8% 84.8% 78.3% 82.3%
10 Lufthansa 81.3% 82.3% 78.6% 83.0%
11 Premier Inn 79.0% 80.1% 78.3% 78.5%
12 Marriott 78.6% 78.4% 83.0% 74.5%
13 KLM 78.6% 82.5% 73.3% 80.0%
14 EasyJet 78.2% 82.5% 78.6% 73.4%
15 IHG 78.1% 78.5% 75.9% 80.0%
16 Emirates 77.9% 82.0% 77.8% 73.9%
17 Qantas 77.1% 82.8% 76.9% 71.7%
18 Hilton 76.9% 85.5% 74.1% 71.3%
19 Best Western 76.7% 79.9% 76.3% 73.9%
20 Jet2 74.7% 81.9% 73.0% 69.4%
21 Monarch 71.7% 78.3% 67.3% 69.4%

27
Search Results
Insights and Results
©eDigitalResearch 2015
Detailed information and clear indication of prices, distance from
attractions and availability
High quality images and reviews
Detailed range of filters to refine search results
Searches automatically saved for future reference
Providing the ability to save search results and a wide range of filters help Hotels.com and Booking.com top the search results table.
App

28
Multichannel scores for booking process are lower than other areas throughout the benchmark suggesting that improvements could be made to this area of the customer journey.
Booking Process
Insights and Results
©eDigitalResearch 2015
# Brand Multichannel Score Desktop Mobile App
1 First Choice 83.3% 86.3% 83.8% 79.9%
2 Thomson 83.1% 87.5% 82.8% 79.0%
3 Booking.com 82.1% 82.1% 82.6% 81.6%
4 Ebookers 81.3% 82.5% 85.0% 76.3%
5 British Airways 80.3% 85.0% 74.0% 81.8%
6 Marriott 80.2% 80.4% 84.3% 76.0%
7 Opodo 79.6% 80.7% 79.6% 78.6%
8 Lufthansa 78.4% 84.4% 72.6% 78.0%
9 Hotels.com 78.4% 81.8% 73.9% 79.4%
10 KLM 78.3% 83.2% 72.5% 79.3%
11 Late Rooms 78.1% 78.1% 77.1% 79.3%
12 Premier Inn 77.5% 83.3% 77.3% 71.9%
13 EasyJet 77.0% 82.4% 75.5% 73.3%
14 Qantas 76.7% 82.6% 79.3% 68.1%
15 IHG 76.4% 75.4% 75.9% 77.9%
16 Hilton 75.7% 83.2% 68.3% 75.8%
17 Emirates 75.4% 86.8% 69.1% 70.3%
18 Expedia Hotels 73.7% 78.3% 72.6% 70.1%
“It worked very well allowing you to customise your holiday options without
the actual commitment to purchase until you are entirely satisfied”
– Thomson
“I liked being able to see a full summary of my whole booking, including dates,
room type, and all the hotel information, without having to click back to the hotel
screen”– Ebookers
“Everything was very straightforward. I could book easily and make the necessary adjustments. I liked the summary page, it
was clear and precise”– British Airways
App
# Brand Multichannel Score Desktop Mobile App
1 First Choice 83.3% 86.3% 83.8% 79.9%
2 Thomson 83.1% 87.5% 82.8% 79.0%
3 Booking.com 82.1% 82.1% 82.6% 81.6%
4 Ebookers Package 81.3% 82.5% 85.0% 76.3%
5 British Airways 80.3% 85.0% 74.0% 81.8%
6 Marriott 80.2% 80.4% 84.3% 76.0%
7 Opodo 79.6% 80.7% 79.6% 78.6%
8 Lufthansa 78.4% 84.4% 72.6% 78.0%
9 Hotels.com 78.4% 81.8% 73.9% 79.4%
10 KLM 78.3% 83.2% 72.5% 79.3%
11 Late Rooms 78.1% 78.1% 77.1% 79.3%
12 Premier Inn 77.5% 83.3% 77.3% 71.9%
13 EasyJet 77.0% 82.4% 75.5% 73.3%
14 Qantas 76.7% 82.6% 79.3% 68.1%
15 IHG 76.4% 75.4% 75.9% 77.9%
16 Hilton 75.7% 83.2% 68.3% 75.8%
17 Emirates 75.4% 86.8% 69.1% 70.3%
18 Expedia Hotels 73.7% 78.3% 72.6% 70.1%
19 Jet 2 73.4% 82.5% 71.0% 66.8%
20 Monarch 72.0% 80.6% 68.4% 67.0%
21 Best Western 71.6% 70.8% 72.3% 71.8%
29
Booking Process
Insights and Results
©eDigitalResearch 2015
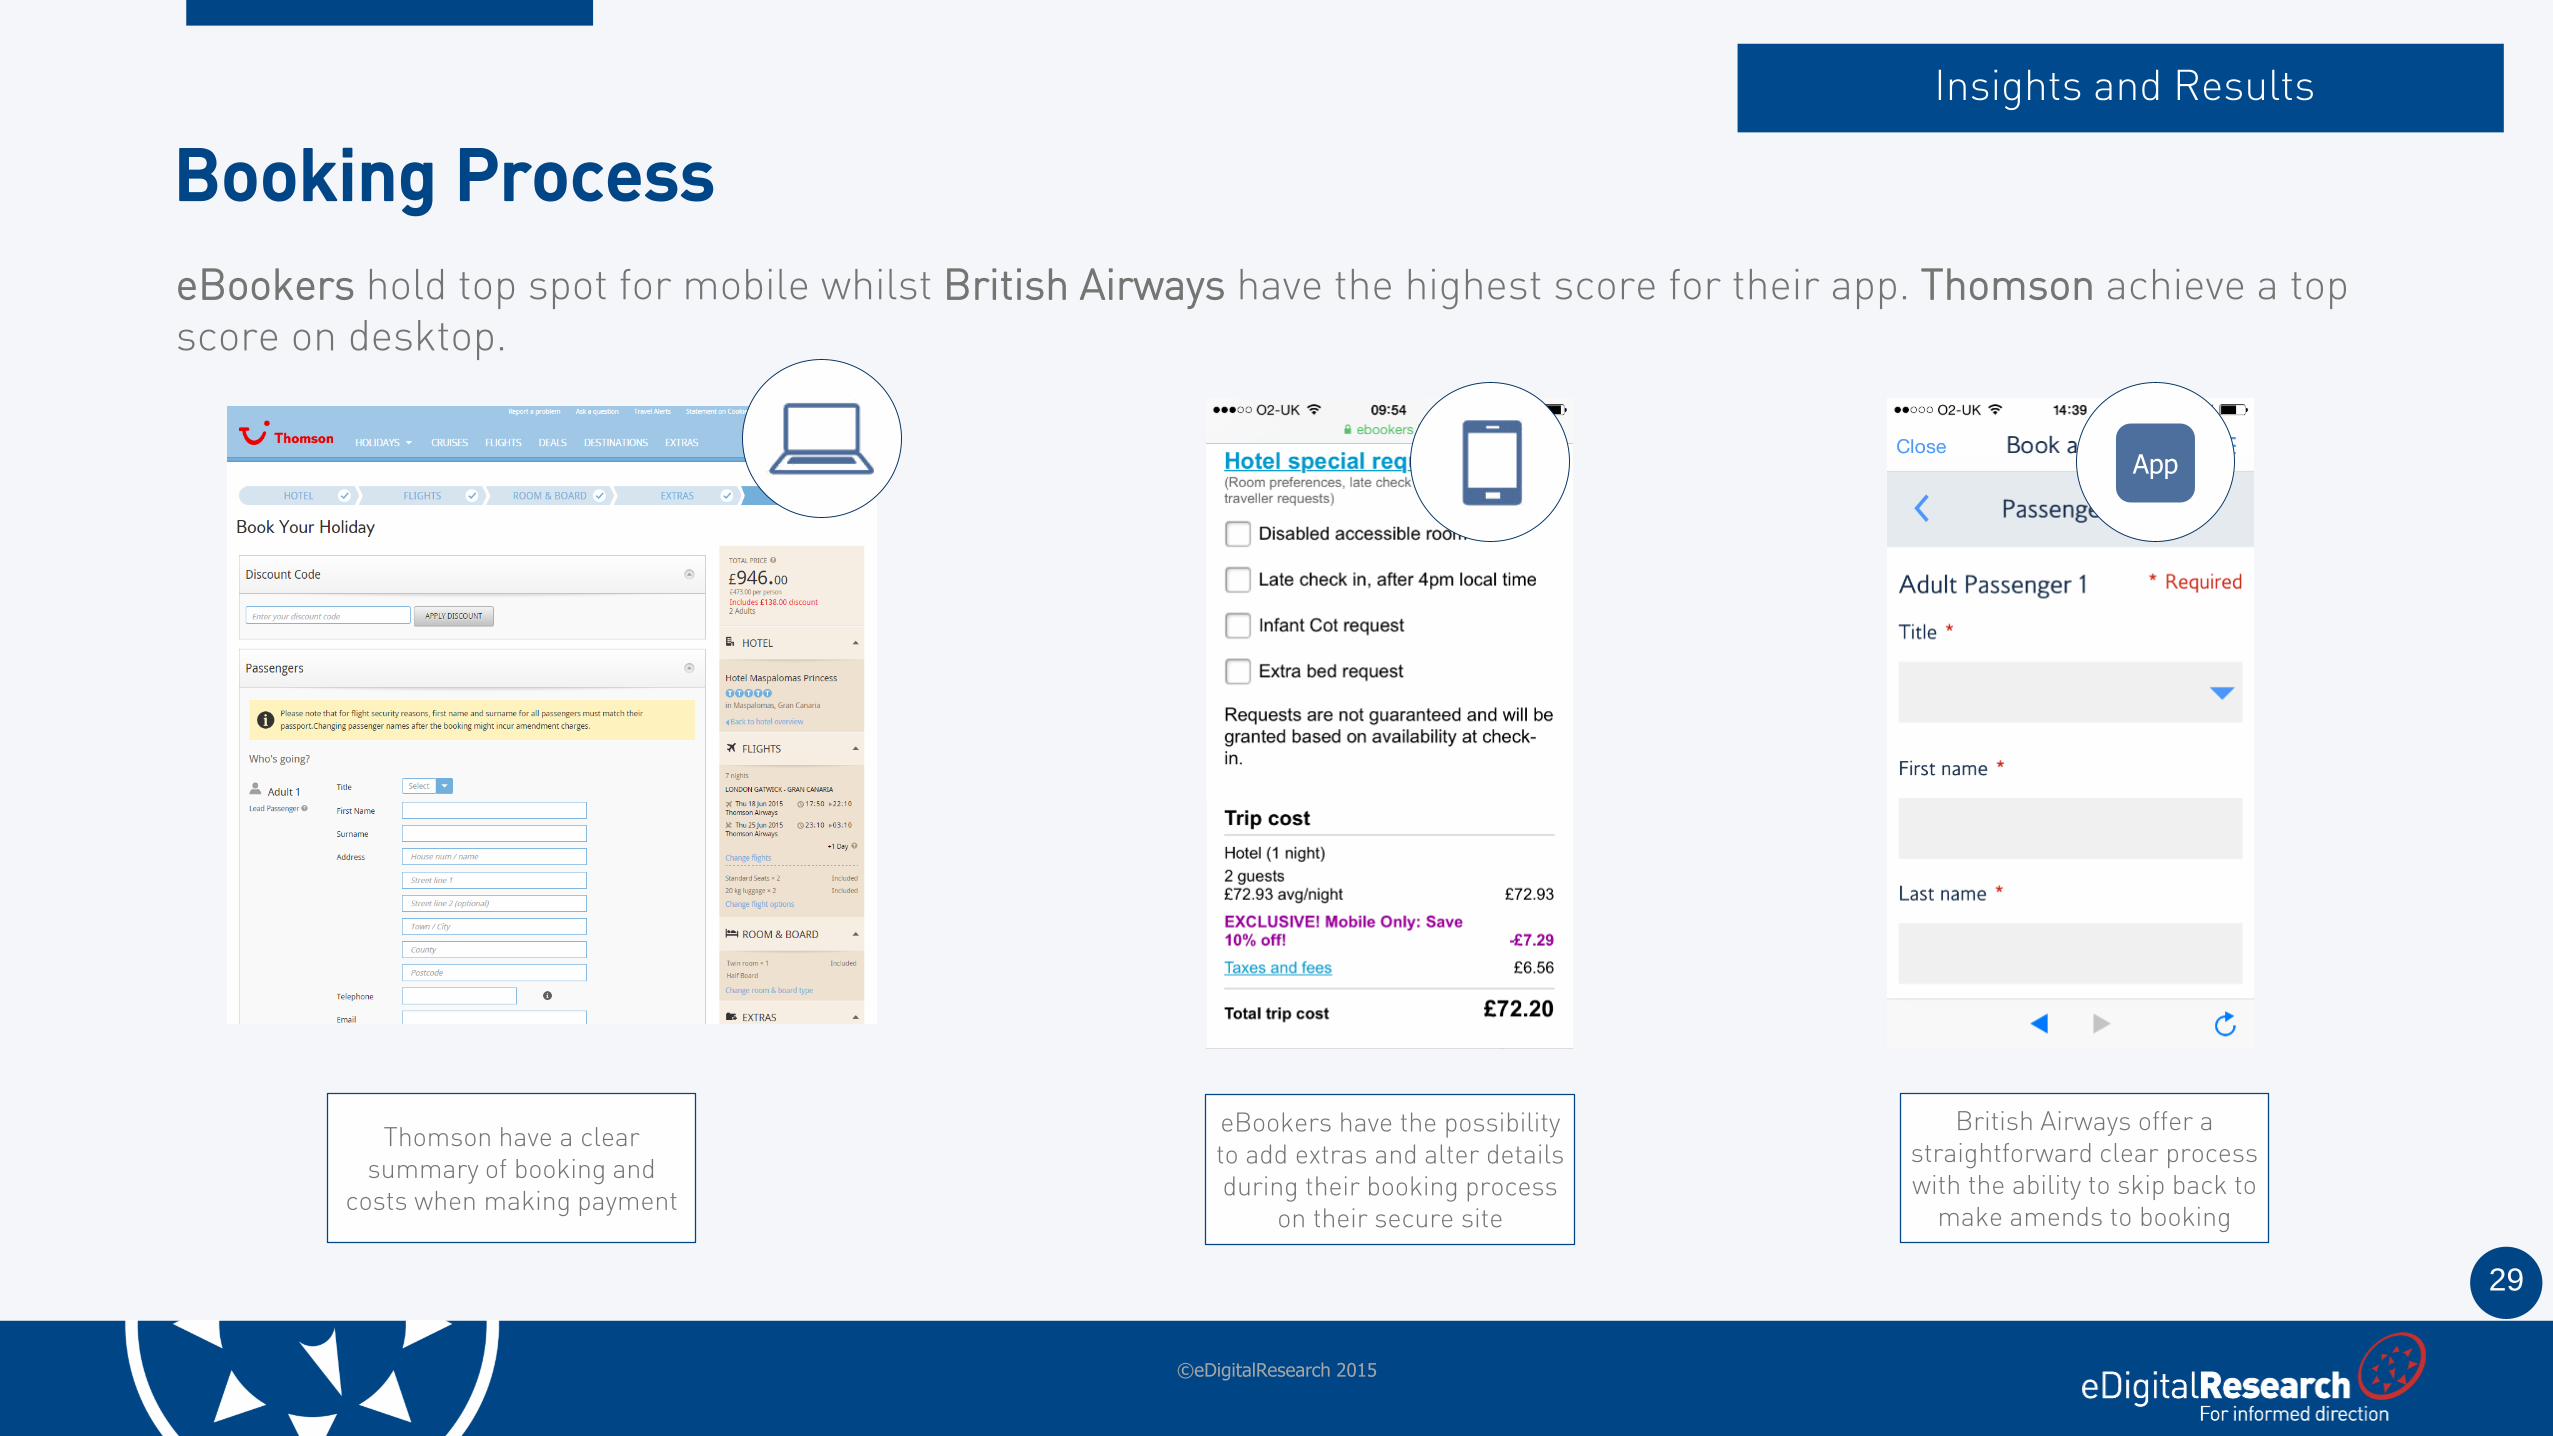
Thomson have a clear summary of booking and
costs when making payment
British Airways offer a straightforward clear process with the ability to skip back to
make amends to booking
eBookers have the possibility to add extras and alter details during their booking process
on their secure site
eBookers hold top spot for mobile whilst British Airways have the highest score for their app. Thomson achieve a top score on desktop.
App

30
Booking.com top the league table for their excellent design and usability on mobile and app.
Design and Usability
Insights and Results
©eDigitalResearch 2015
# Brand Multichannel Score Desktop Mobile App
1 Booking.com 88.9% 87.9% 91.4% 87.3%
2 Thomson 86.4% 87.7% 85.6% 85.9%
3 Hotels.com 86.0% 87.5% 83.8% 86.7%
4 LateRooms 86.0% 86.3% 87.0% 84.7%
5 First Choice 85.7% 85.0% 85.5% 86.7%
6 Opodo 85.4% 85.6% 83.6% 87.0%
7 British Airways 85.2% 88.3% 81.3% 86.1%
8 Lufthansa 82.5% 84.2% 79.7% 83.8%
9 Marriott 82.3% 81.7% 84.5% 80.6%
10 Ebookers 82.1% 79.6% 82.5% 84.2%
11 Expedia Hotels 81.2% 85.0% 73.4% 85.2%
12 Premier Inn 80.8% 81.9% 84.8% 75.6%
13 EasyJet 79.9% 84.4% 79.1% 76.4%
14 KLM 79.1% 83.5% 74.8% 78.9%
15 IHG 79.1% 76.5% 79.2% 81.6%
16 Qantas 78.2% 82.7% 78.3% 73.8%
17 Hilton 77.2% 82.1% 69.7% 79.7%
18 Best Western 76.9% 79.2% 74.1% 77.5%
“The website was stylish and professional. Information was excellent and there were
inspiring images. I found the search facility easy to use and accurate. Booking
was simple and straightforward”– British Airways
“The site was well thought out and appeared to have the same information and quality photos as the main website.
The ease of navigation and relevant results returned made the booking
process very easy and quick”– Booking.com
“There's a lot of information, mostly presented in a logical fashion. It's easy to
search and compare hotels”– Booking.com
App
# Brand Multichannel Score Desktop Mobile App
1 Booking.com 88.9% 87.9% 91.4% 87.3%
2 Thomson 86.4% 87.7% 85.6% 85.9%
3 Hotels.com 86.0% 87.5% 83.8% 86.7%
4 LateRooms 86.0% 86.3% 87.0% 84.7%
5 First Choice 85.7% 85.0% 85.5% 86.7%
6 Opodo 85.4% 85.6% 83.6% 87.0%
7 British Airways 85.2% 88.3% 81.3% 86.1%
8 Lufthansa 82.5% 84.2% 79.7% 83.8%
9 Marriott 82.3% 81.7% 84.5% 80.6%
10 Ebookers 82.1% 79.6% 82.5% 84.2%
11 Expedia Hotels 81.2% 85.0% 73.4% 85.2%
12 Premier Inn 80.8% 81.9% 84.8% 75.6%
13 EasyJet 79.9% 84.4% 79.1% 76.4%
14 KLM 79.1% 83.5% 74.8% 78.9%
15 IHG 79.1% 76.5% 79.2% 81.6%
16 Qantas 78.2% 82.7% 78.3% 73.8%
17 Hilton 77.2% 82.1% 69.7% 79.7%
18 Best Western 76.9% 79.2% 74.1% 77.5%
19 Jet2 76.5% 84.8% 76.3% 68.4%
20 Emirates 75.3% 85.2% 71.4% 69.4%
21 Monarch 73.0% 82.1% 62.7% 87.3%
31
Design and Usability
Insights and Results
©eDigitalResearch 2015
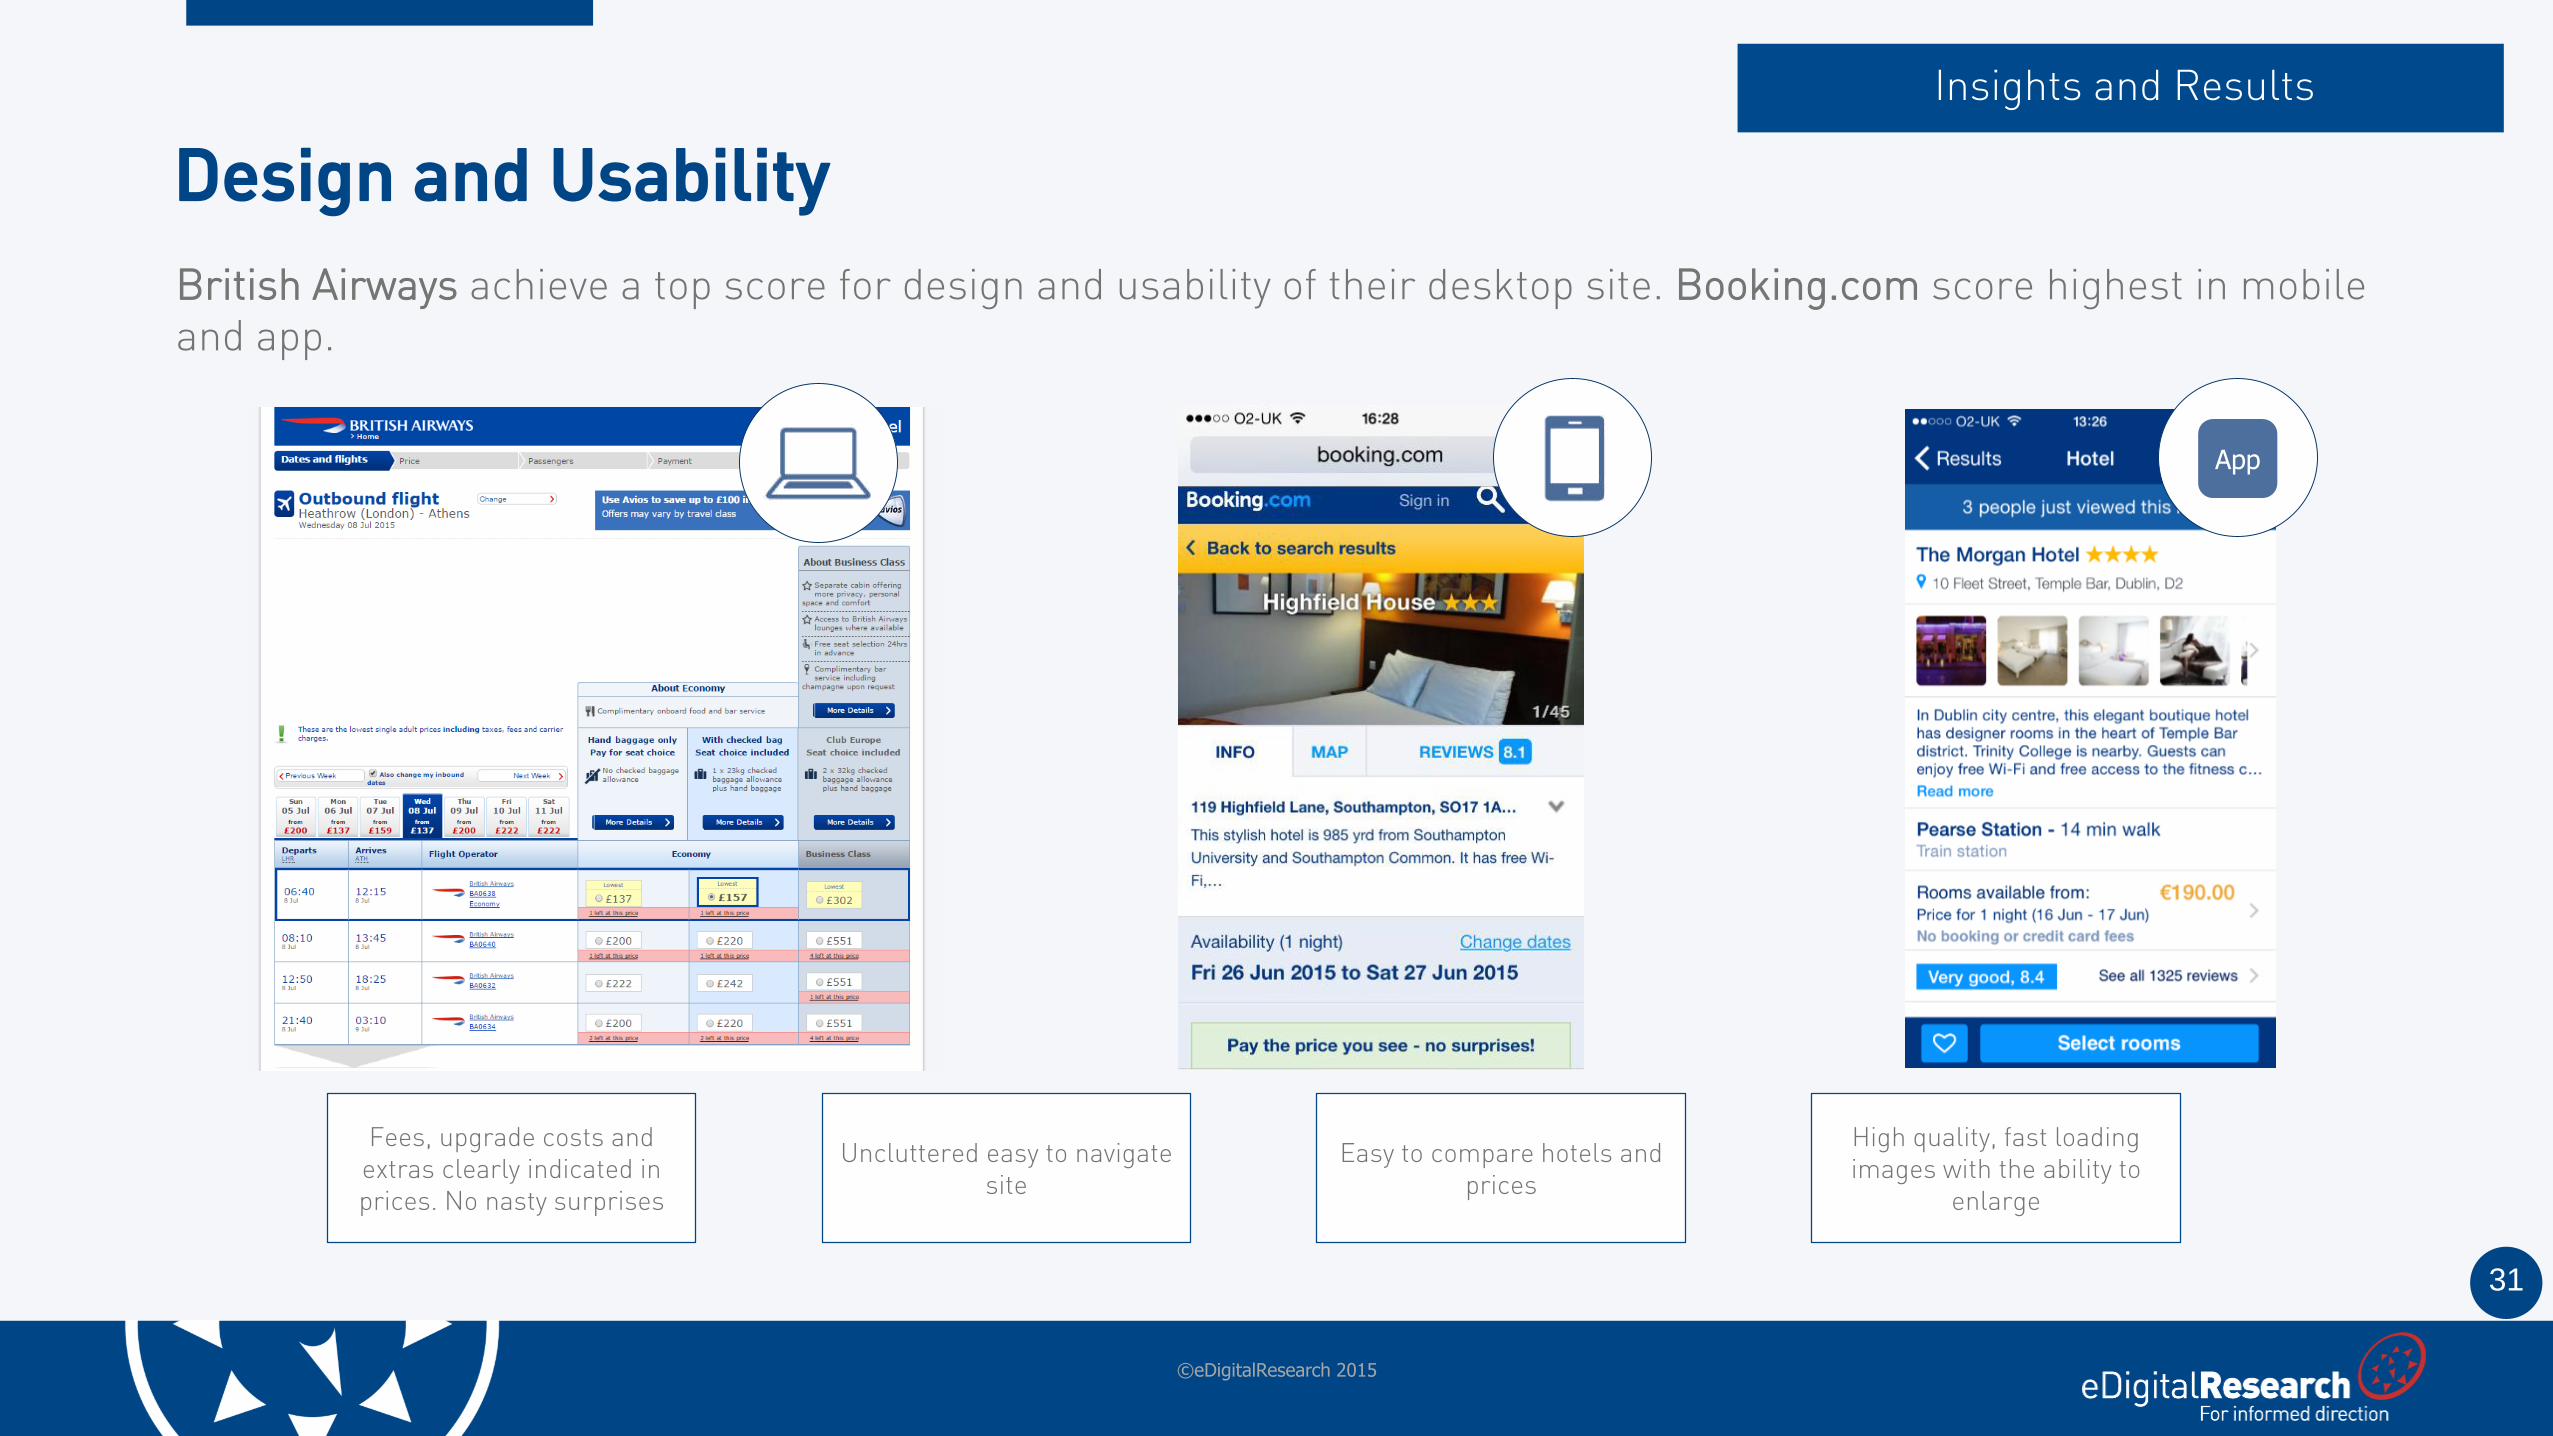
Fees, upgrade costs and extras clearly indicated in prices. No nasty surprises
Uncluttered easy to navigate site
High quality, fast loading images with the ability to
enlarge
Easy to compare hotels and prices
British Airways achieve a top score for design and usability of their desktop site. Booking.com score highest in mobile and app.
App
32
About eDigitalResearch
©eDigitalResearch 2015
33
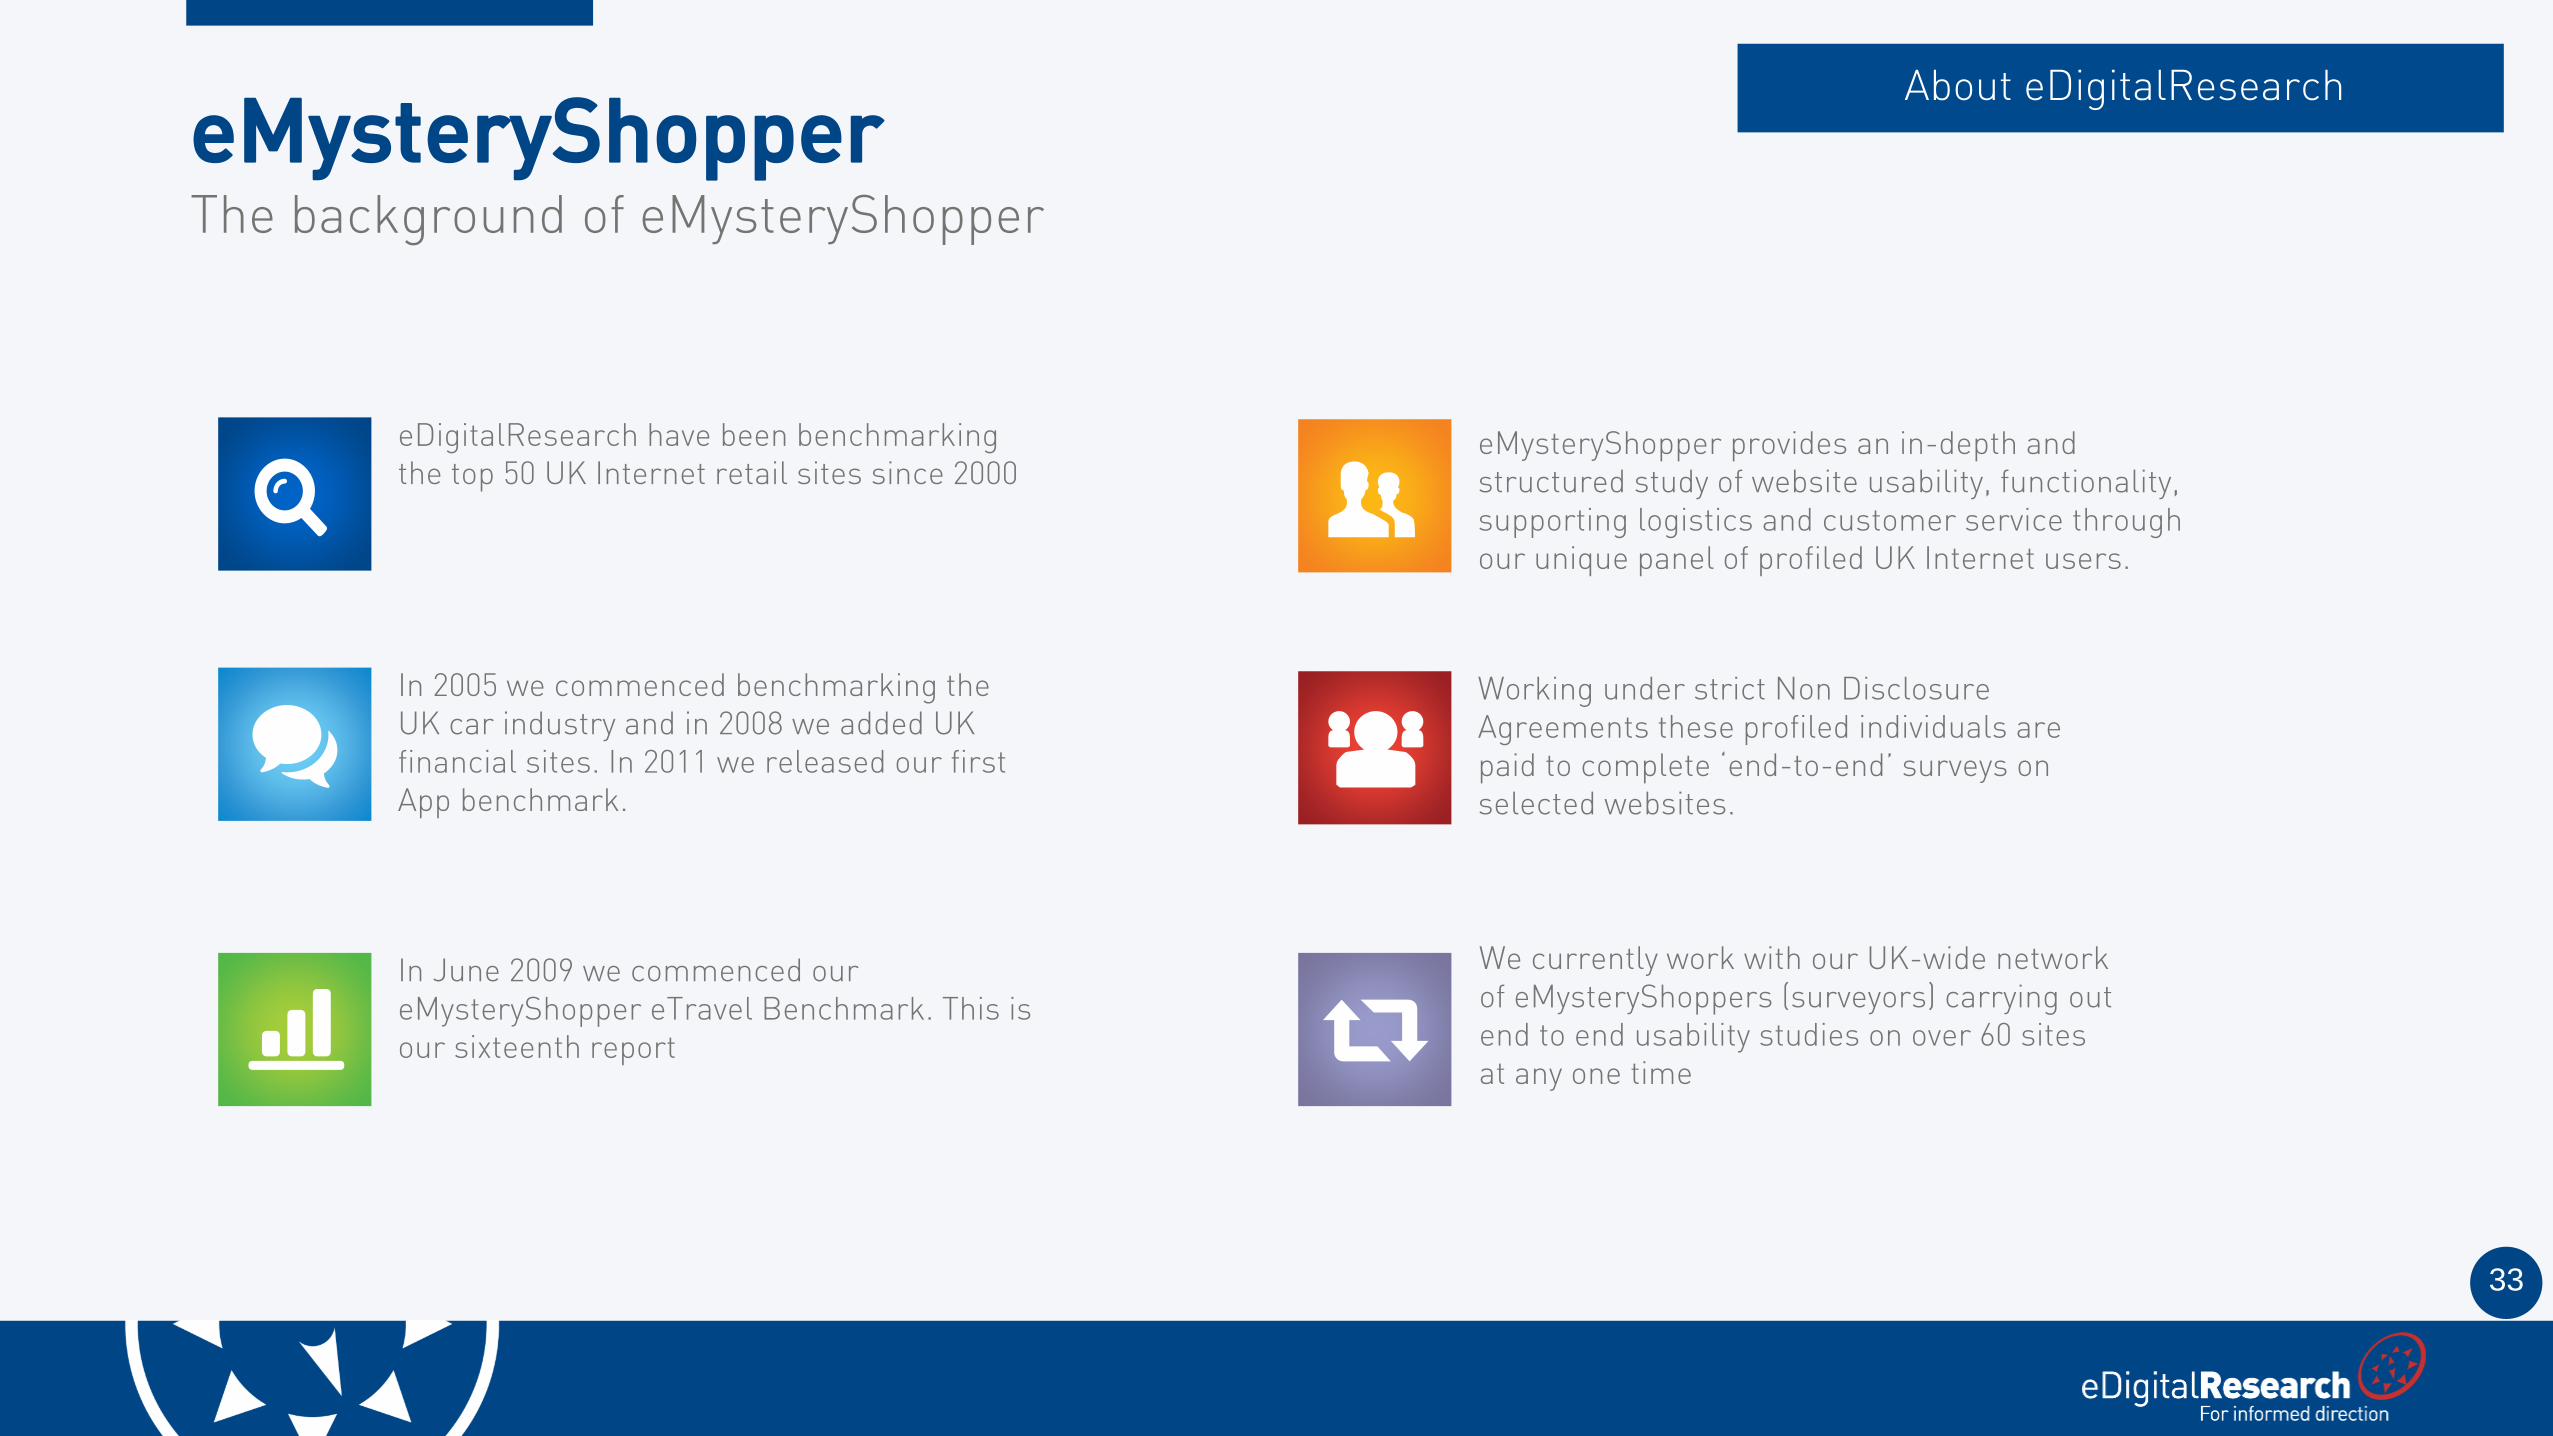
eMysteryShopperThe background of eMysteryShopper
About eDigitalResearch
eDigitalResearch have been benchmarking the top 50 UK Internet retail sites since 2000
In 2005 we commenced benchmarking the UK car industry and in 2008 we added UK financial sites. In 2011 we released our first App benchmark.
In June 2009 we commenced our eMysteryShopper eTravel Benchmark. This is our sixteenth report
eMysteryShopper provides an in-depth and structured study of website usability, functionality, supporting logistics and customer service through our unique panel of profiled UK Internet users.
Working under strict Non Disclosure Agreements these profiled individuals are paid to complete ‘end-to-end’ surveys on selected websites.
We currently work with our UK-wide network of eMysteryShoppers (surveyors) carrying out end to end usability studies on over 60 sites at any one time
34
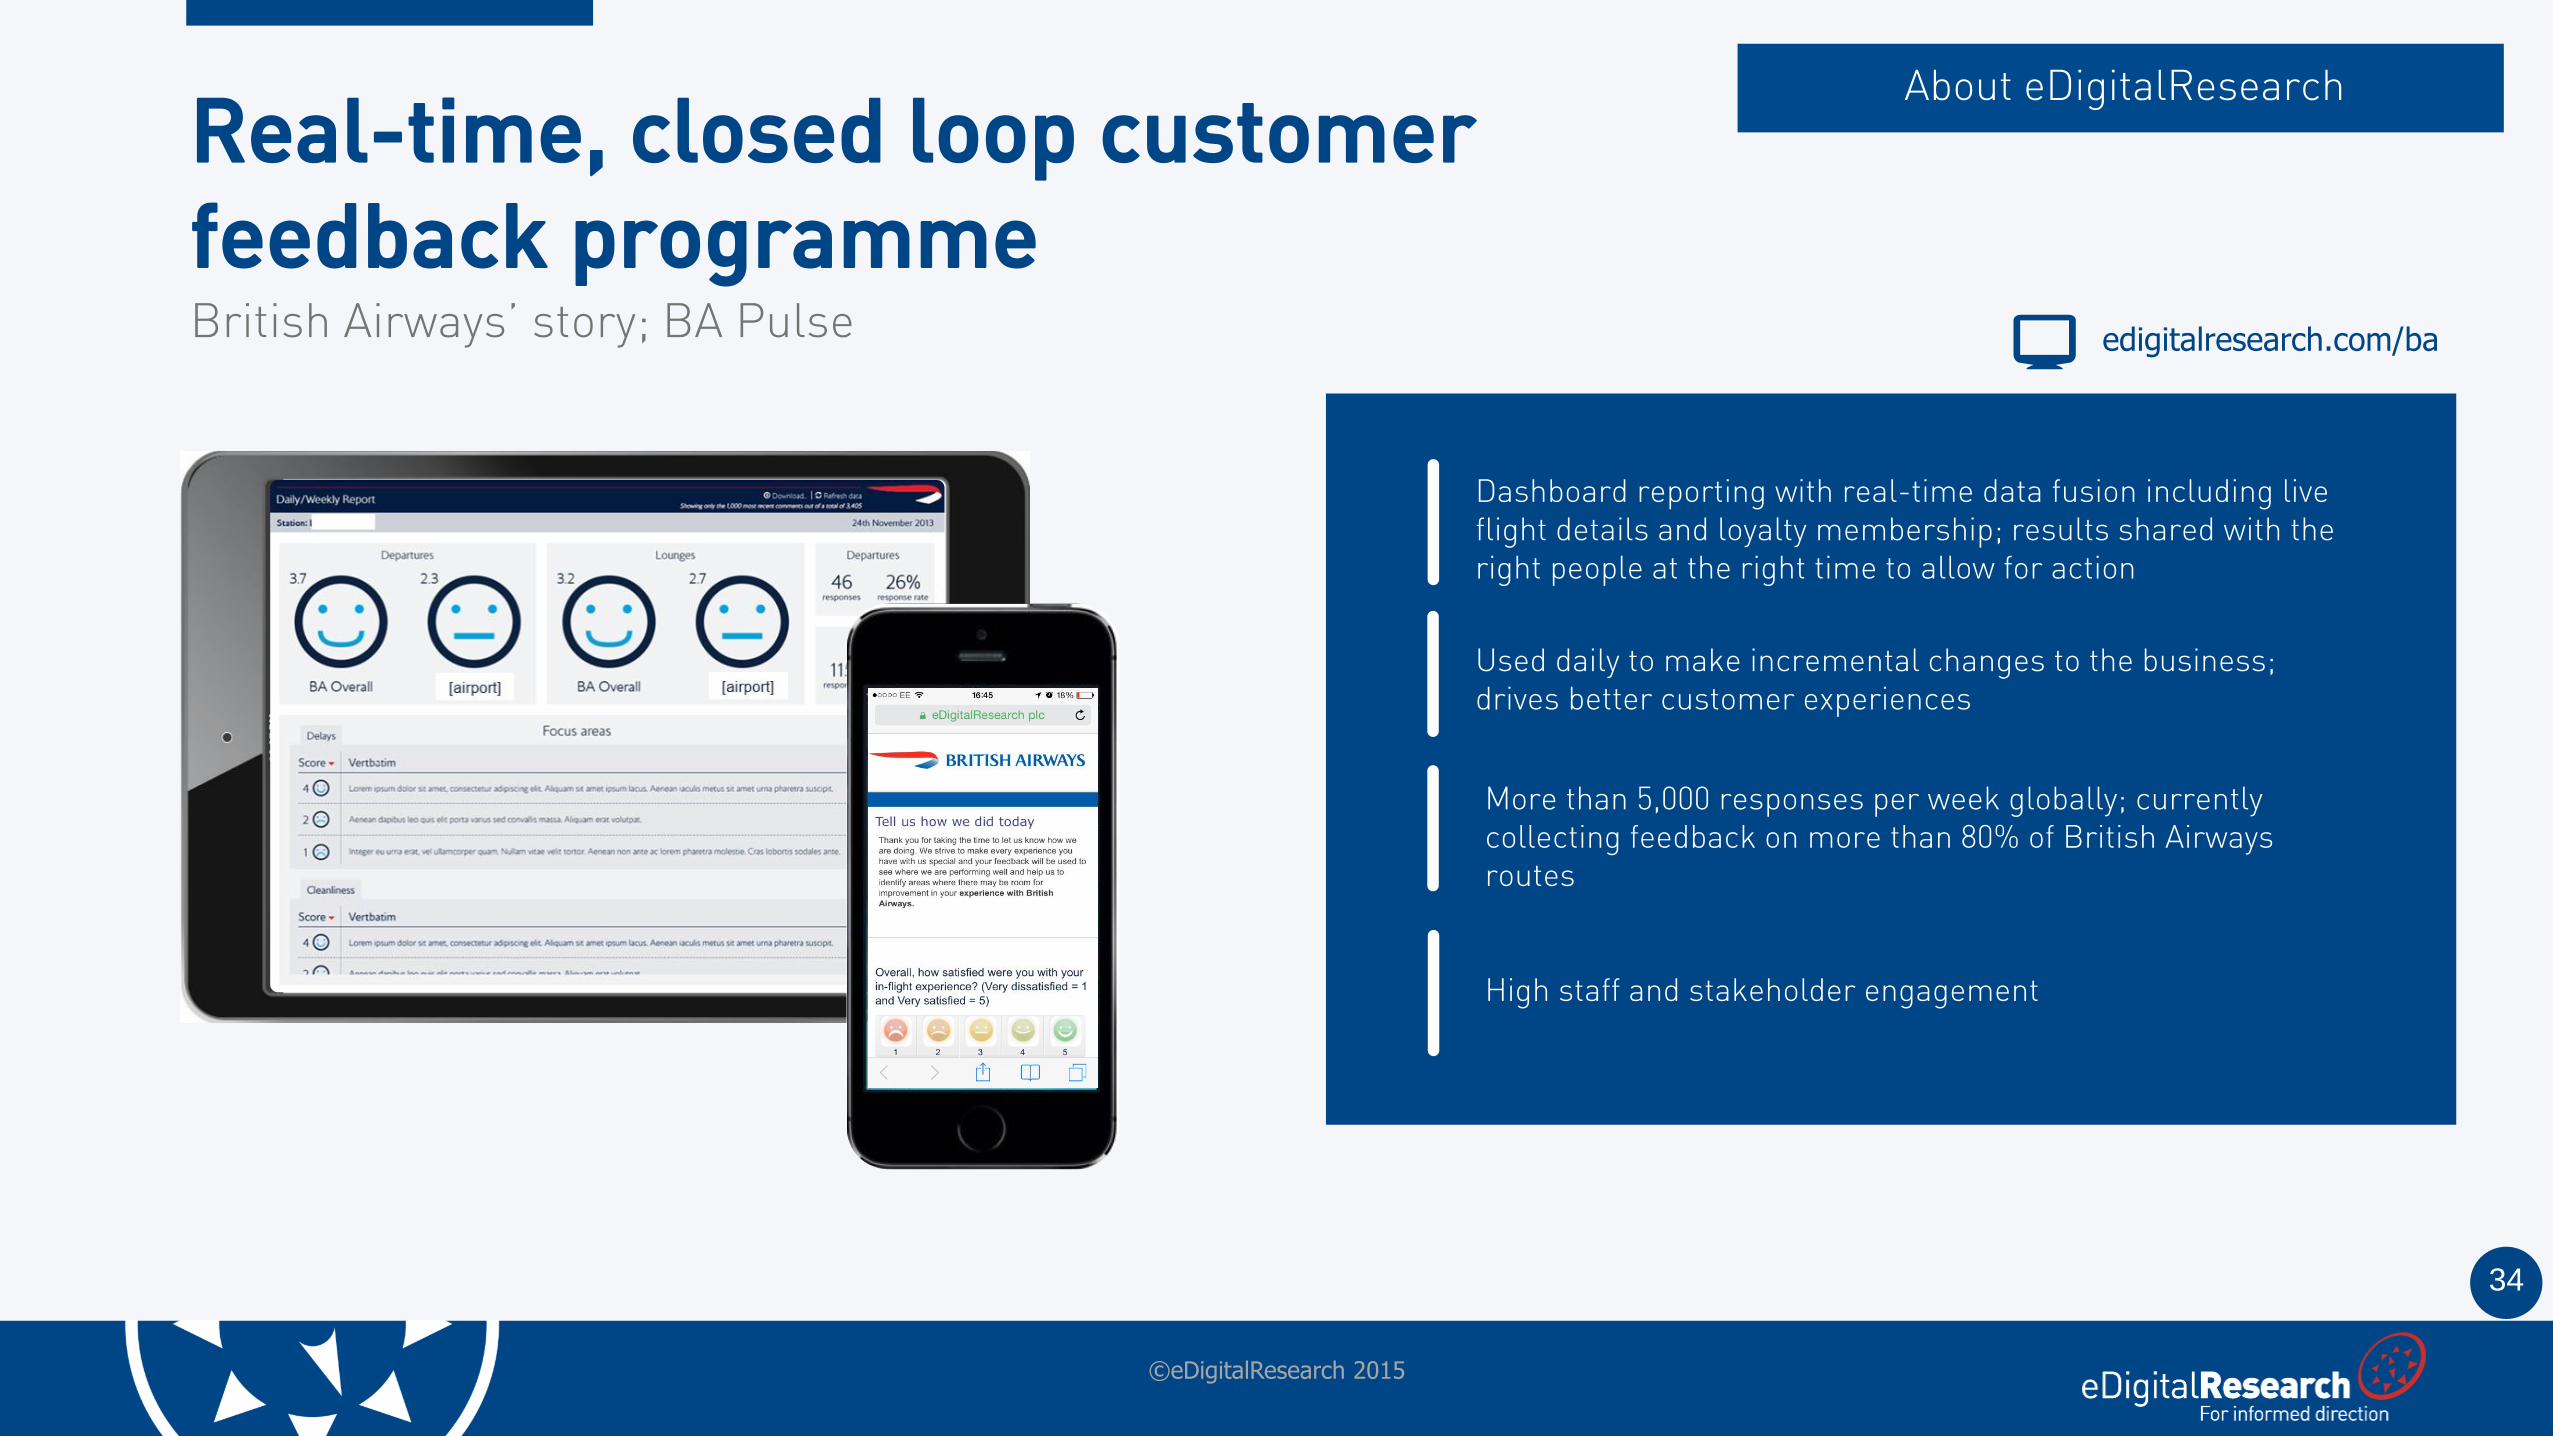
Real-time, closed loop customer feedback programmeBritish Airways’ story; BA Pulse
About eDigitalResearch
©eDigitalResearch 2015
Dashboard reporting with real-time data fusion including live flight details and loyalty membership; results shared with the right people at the right time to allow for action
High staff and stakeholder engagement
Used daily to make incremental changes to the business; drives better customer experiences
More than 5,000 responses per week globally; currently collecting feedback on more than 80% of British Airways routes
edigitalresearch.com/ba
35
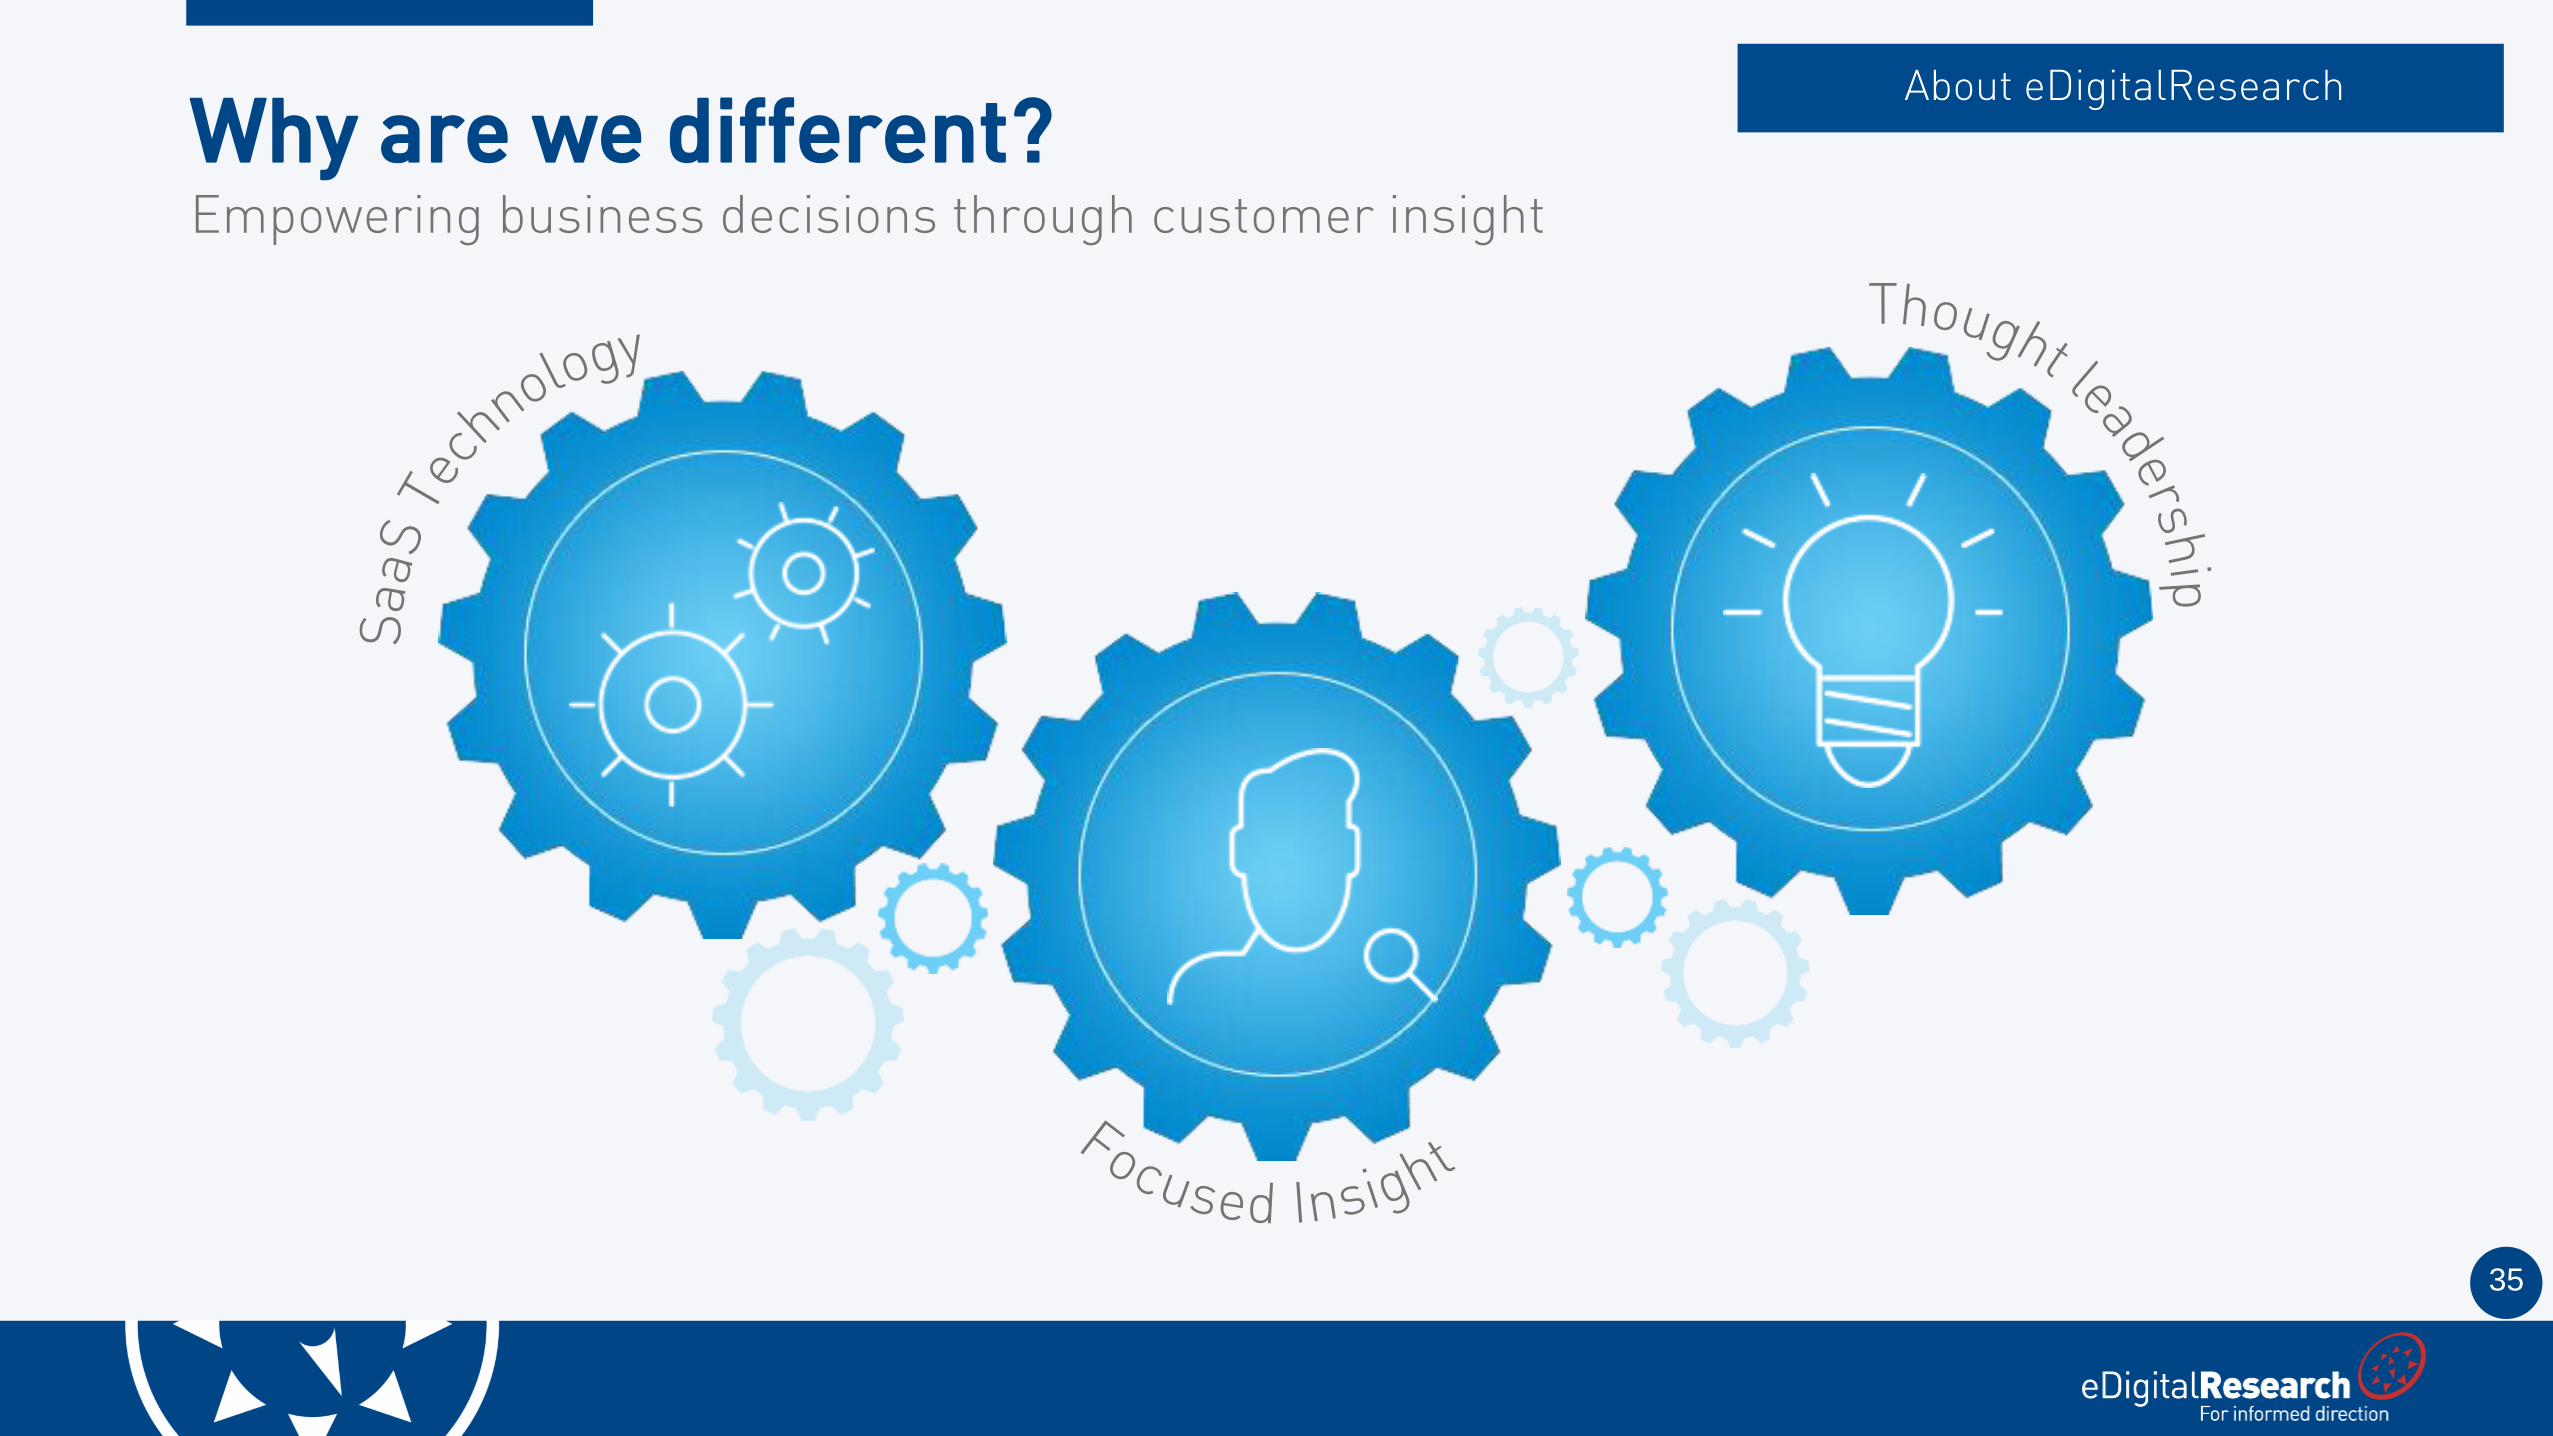
Why are we different?Empowering business decisions through customer insight
About eDigitalResearch
36
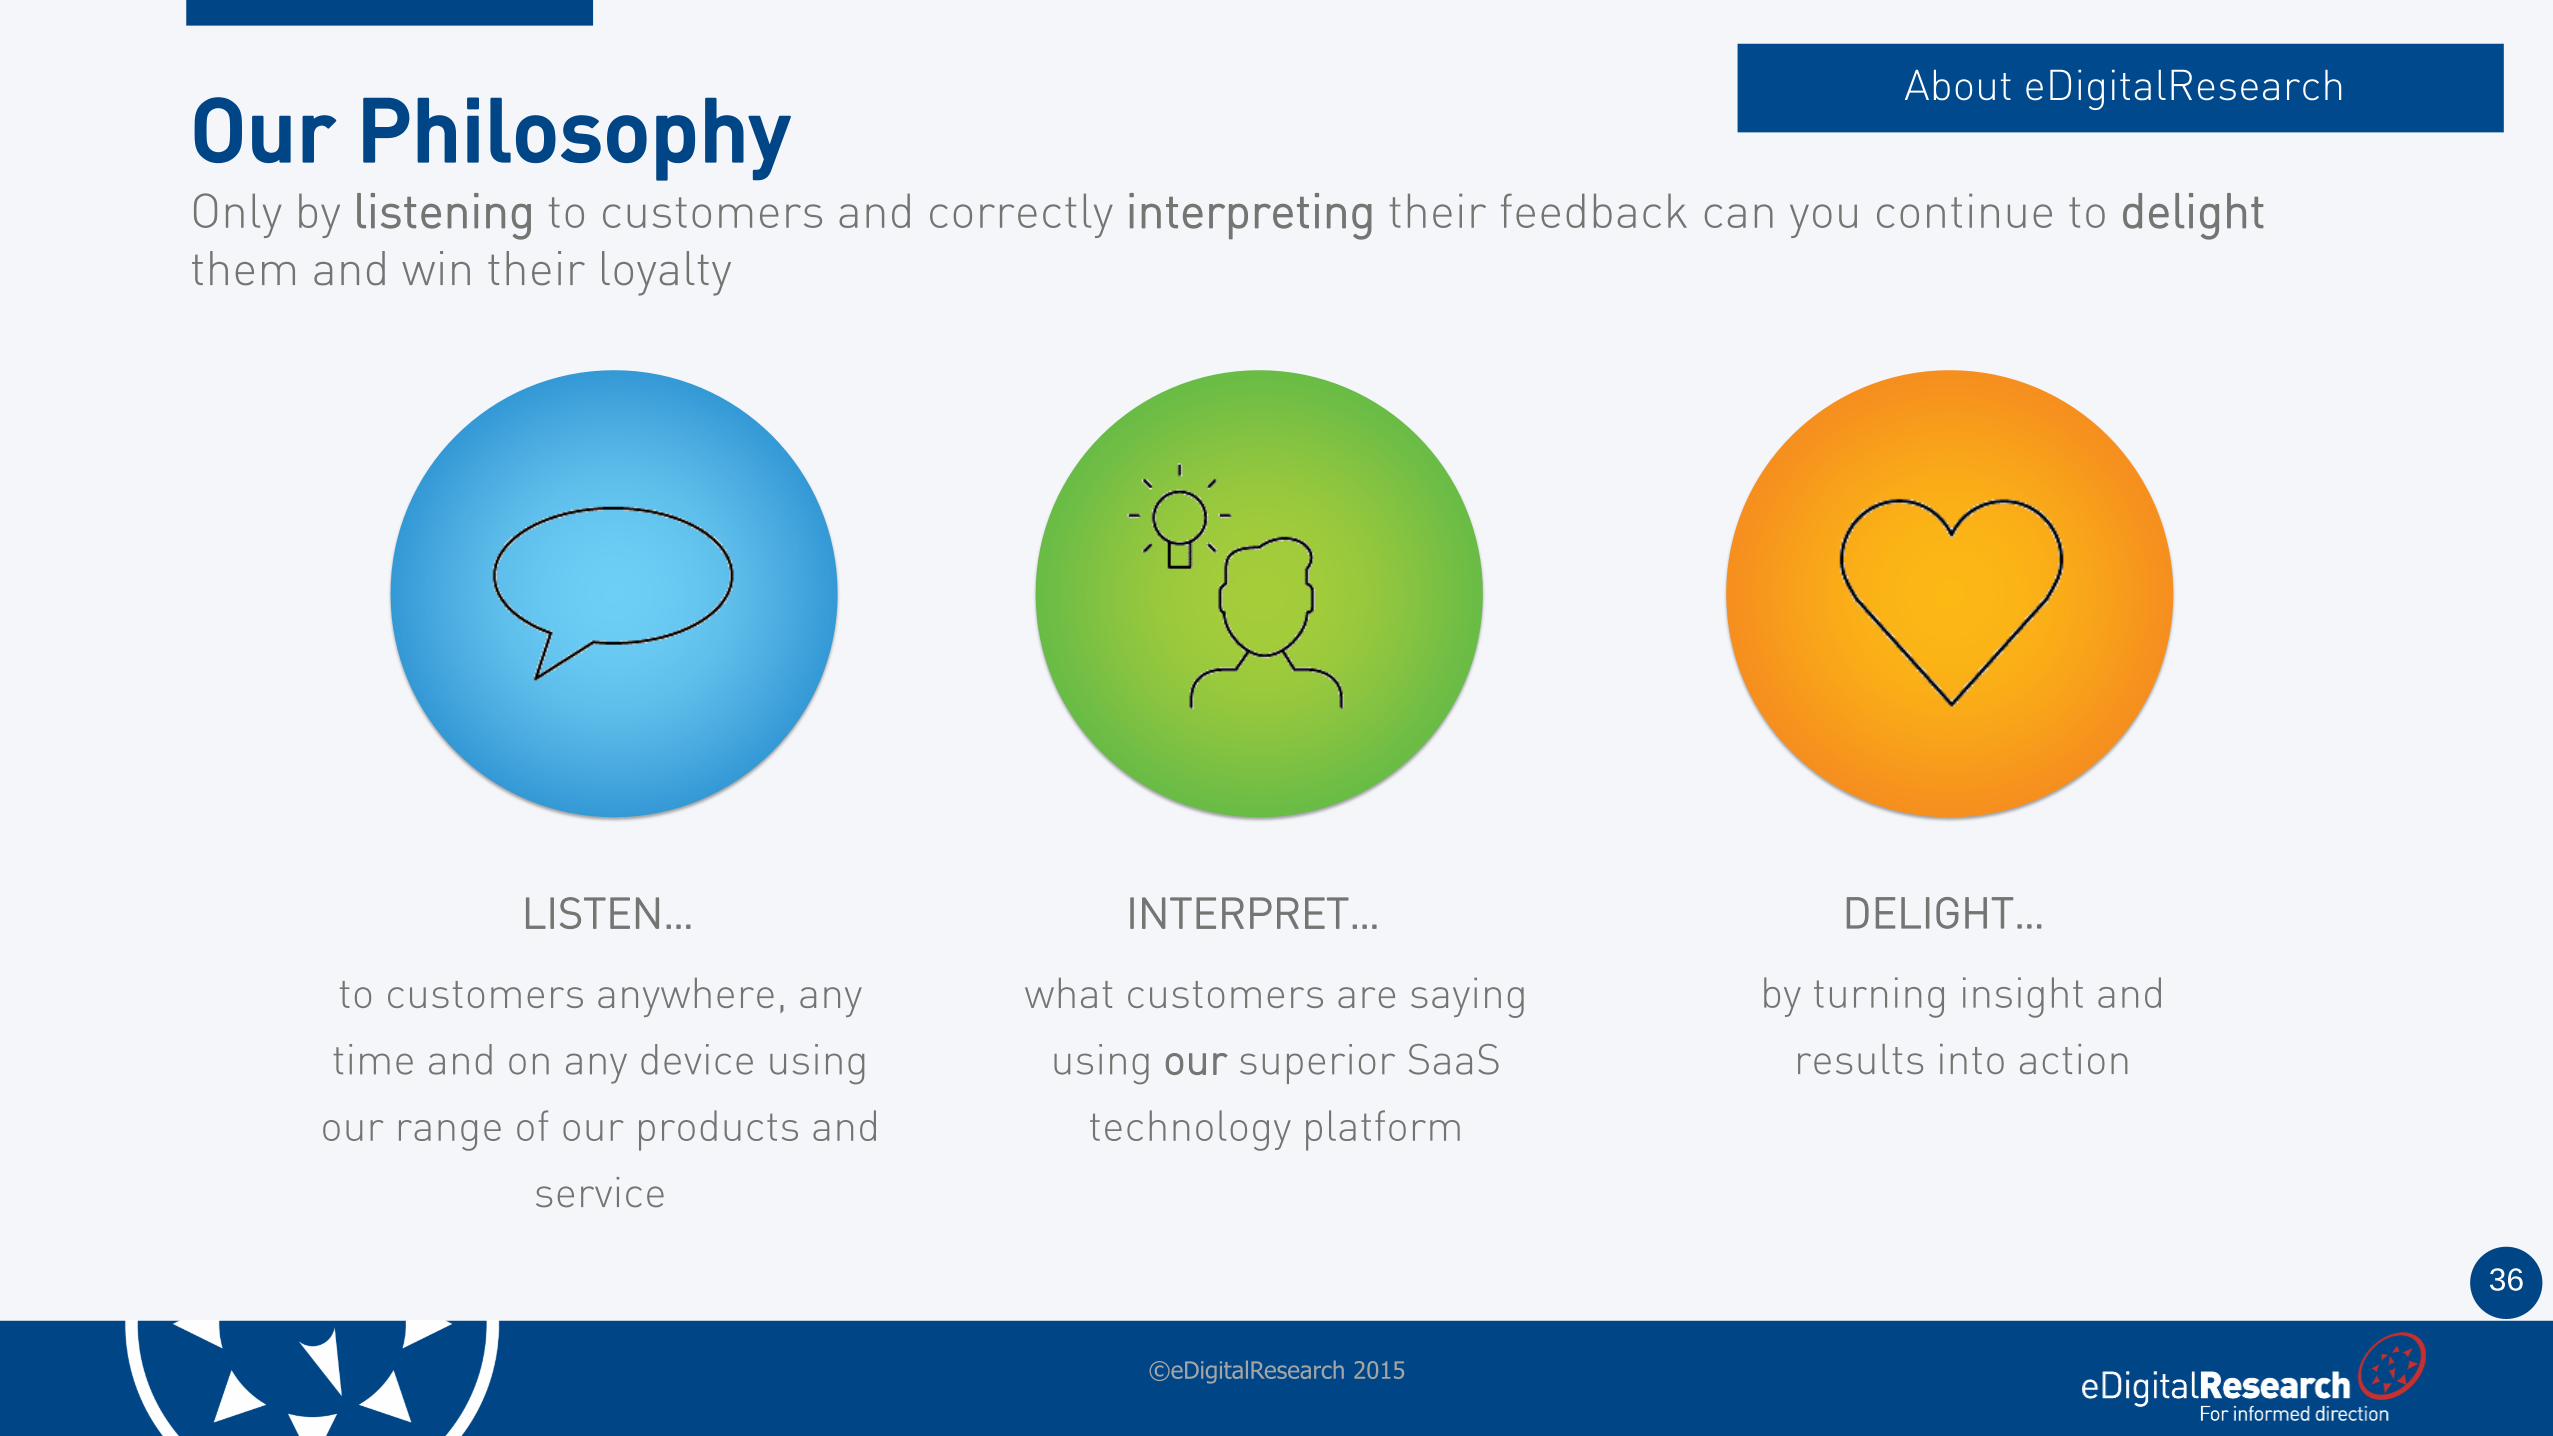
Our PhilosophyOnly by listening to customers and correctly interpreting their feedback can you continue to delightthem and win their loyalty
to customers anywhere, any
time and on any device using
our range of our products and
service
LISTEN…
what customers are saying
using our superior SaaS
technology platform
INTERPRET…
by turning insight and
results into action
DELIGHT…
About eDigitalResearch
©eDigitalResearch 2015
37
©eDigitalResearch 2015
eDigitalResearch
Vanbrugh House
Southampton
OUR EMAIL.
OUR PHONE
+44(0)1489 772920
OUR WEBSITE
Kat Hounsell, Sales and Marketing Director