Indira Gandhi Centre for Atomic Research, Kalpakkam
192
Electrochemical and Thermodynamic Investigations on Th 4+ and Cd-Th Alloys in LiCl-KCl Eutectic Melt By Gurudas Pakhui Enrolment No: CHEM02201304006 Indira Gandhi Centre for Atomic Research, Kalpakkam A thesis submitted to the Board of Studies in Chemical Sciences In partial fulfillment of requirements for the Degree of DOCTOR OF PHILOSOPHY of HOMI BHABHA NATIONAL INSTITUTE July, 2019
Transcript of Indira Gandhi Centre for Atomic Research, Kalpakkam

Electrochemical and Thermodynamic Investigations on
Th4+ and Cd-Th Alloys in LiCl-KCl Eutectic Melt
By
Gurudas Pakhui
Enrolment No: CHEM02201304006
Indira Gandhi Centre for Atomic Research, Kalpakkam
A thesis submitted to the
Board of Studies in Chemical Sciences
In partial fulfillment of requirements
for the Degree of
DOCTOR OF PHILOSOPHY
of
HOMI BHABHA NATIONAL INSTITUTE
July, 2019


iii
STATEMENT BY AUTHOR
This dissertation has been submitted in partial fulfillment of requirements for an advanced
degree at Homi Bhabha National Institute (HBNI) and is deposited in the Library to be made
available to borrowers under rules of the HBNI.
Brief quotations from this dissertation are allowable without special permission, provided that
accurate acknowledgement of source is made. Requests for permission for extended quotation
from or reproduction of this manuscript in whole or in part may be granted by the Competent
Authority of HBNI when in his or her judgment the proposed use of the material is in the
interests of scholarship. In all other instances, however, permission must be obtained from the
author.
Gurudas Pakhui

iv
DECLARATION
I, hereby declare that the investigation presented in the thesis has been carried out by me. The
work is original and has not been submitted earlier as a whole or in part for a degree /
diploma at this or any other Institution / University.
Gurudas Pakhui

v
List of Publications arising from the thesis
Journal
a. Published
1. “Electrochemical studies on the reduction behaviour of Th4+
in molten LiCl-KCl eutectic”,
Gurudas Pakhui, Manish Chandra, Suddhasattwa Ghosh, B. Prabhakara Reddy, K.
Nagarajan, Electrochim. Acta. 2015, 155, 372-382.
2. “Exchange current density of thorium in molten LiCl-KCl eutectic”, Gurudas Pakhui,
Suddhasattwa Ghosh, B. Prabhakara Reddy, Electrochim. Acta. 2016, 222, 92-99.
3. “Th4+
|Th couple in LiCl-KCl eutectic: Anodic polarization of thorium and
electrochemical impedance spectroscopy study at tungsten, cadmium and thorium
electrodes”, Gurudas Pakhui, Suddhasattwa Ghosh, B. Prabhakara Reddy, Electrochim.
Acta. 2019, 295, 354-366.
b. Communicated
1. “A thermochemical evaluation of standard electrode potential, Gibbs energy of formation
and activity coefficient of Th4+
in LiCl-KCl eutectic melt”, Gurudas Pakhui,
Suddhasattwa Ghosh, B. Prabhakara Reddy, under review in the journal Electrochimica
Acta.
c. Manuscript under preparation
1. Electromotive force measurements on Cd-Th intermetallic compounds in LiCl-KCl
eutectic melt.
Conferences
1. “Electrochemistry of Th4+
|Th couple in molten LiCl-KCl eutectic”, Gurudas Pakhui,
Suddhasattwa Ghosh, B. Prabhakara Reddy, Theme meeting on Chemistry in Nuclear
Technology (CHEMNUT), July 30-31, 2015, 32, IGCAR, Kalpakkam, India.
2. “Electrochemical and thermodynamic properties of Th and Th-Cd alloys using transient
electrochemical techniques”, Gurudas Pakhui, Suddhasattwa Ghosh, B. Prabhakara
Reddy, Symposium on thermal analysis (THERMANS), January 18-20, 2016, T040, IIT
BHU, Varanasi, India.
3. “Redox behavior of Th4+
|Th couple at tungsten and cadmium electrodes in LiCl-KCl
eutectic”, Gurudas Pakhui, Suddhasattwa Ghosh, B. Prabhakara Reddy, Symposium on
Nuclear and Radiochemistry (NUCAR), February 6-10, 2017, C-146, KIIT University,
Bhubaneswar, India.
4. “Determination of partial excess Gibbs energy of ThCl4 in LiCl-KCl eutectic using
electromotive force measurements’’, Gurudas Pakhui, Suddhasattwa Ghosh, B.

vi
Prabhakara Reddy, International Conference on Electrochemical Science & Technology
(ICONEST), August 10-12, 2017, PP-EC-23, IISc Bengaluru, India.
5. “Molten salt electromotive force measurements on Th-Cd alloys”, Gurudas Pakhui,
Suddhasattwa Ghosh, B. Prabhakara Reddy, Symposium on Nuclear and Radiochemistry
(NUCAR), January 15-19, 2019, C-27, BARC, Mumbai, India.
Gurudas Pakhui

vii
DEDICATED TO MY PARENTS

viii
ACKNOWLEDGEMENTS
It is a genuine pleasure to convey my deep sense of thanks and gratitude to all of those,
whose support and encouragement assisted me in preparing this Ph.D. thesis. My humble
acknowledgement is as follows:
I express my sincere thanks and gratitude to my research guide Dr. B. Prabhakara
Reddy, Associate Director, Metal Fuel Recycle Group, Materials Chemistry and Metal Fuel
Cycle Group, IGCAR for his invaluable guidance, inspiration and support throughout this
project.
I am extremely grateful to Dr. Suddhasattwa Ghosh, Head, Pyro-chemical Process
Studies Section, whose persistent guidance and indispensable technical support assisted me in
the completion of my Ph.D. work. I am thankful to him for his critical corrections that make
this thesis worth reading. I am grateful to Dr. K. Nagarajan, my former guide and formerly
Director, Chemistry Group, IGCAR for his continuous support, encouragement and value
addition to my thesis.
I express my sincere thanks to Dr. S. Rangarajan, Head, WSCD, BARCF and
chairman of the doctoral committee for giving me valuable ideas and suggestions during the
course of my research. I also express my sincere thanks to the members of doctoral
committee Dr. V. Jayaraman (Head, MCD), Dr. Rajesh Ganesan (Head, LMCS, MCD) and
Dr. S. Ningshen (Head, ACPS, CSTD) for their insightful suggestions for the progress of the
research work at various DC meetings. I am grateful to Dr. Manish Chandra for his support
and encouragement during the course of my research work.
I express my sincere thanks to my colleagues Mr. S. Nedumaran, Smt. Suriya Kumari
K, Mrs. Nibedita Samanta and Ms. Litun Swain, SRF for their timely help in the laboratory
works and useful discussions. I thank Dr. K. C. Pitchaiah and Mr. Ujjwal Kumar Maity for
the analytical support. I thank Dr. Raja Madhavan, Dr. Binoy Kumar Maji and Mr. Shyam
Kumar for characterization of the samples by XRD analysis.
I express my sincere gratitude to my parents and my wife Riya Maji for their constant
support and encouragement.
Gurudas Pakhui

ix
CONTENTS
Sl. No. Title Page No.
SYNOPSIS xiii
NOMENCLATURE xxvii
LIST OF FIGURES xxx
LIST OF TABLES xxxviii
CHAPTER 1 Introduction 1
1.1 Objective of present thesis 1
1.2 Electrochemical and thermodynamic studies on thorium
in molten salts: Literature survey
2
1.3 Thermodynamic studies on Cd-Th alloys: Literature
survey
6
1.4 Scope of present thesis 8
CHAPTER 2 Experimental 10
2.1 Argon atmosphere glove box set-up 10
2.2 Chemicals and preparation of electrolytes 13
2.2.1 Chemicals 13
2.2.2 Preparation and purification of LiCl-KCl eutectic melt 13
2.2.3 Preparation of LiCl-KCl-ThCl4 electrolyte 15
2.2.4 Preparation of LiCl-KCl-AgCl electrolyte 16
2.2.5 Estimation of Th, Cd and Ag in LiCl-KCl eutectic melt 16
2.3 Cd-Th alloys 17
2.3.1 Preparation of Cd-Th alloys 17
2.3.2 Phase characterization of Cd-Th alloys 19
2.4 Electrodes and cell assembly 20

x
2.4.1 Electrodes for transient electrochemical measurements 20
2.4.2 Electrodes for electromotive force measurements 21
2.5 Measurement methodology 23
2.5.1 Transient techniques and EIS study 23
2.5.2 Polarization technique 25
2.5.3 Electrochemical impedance spectroscopy 27
2.5.4 Electromotive force measurements 29
2.5.4.1 emf measurement of ThCl4 in LiCl-KCl eutectic melt 29
2.5.4.2 emf measurement of Cd-Th alloys 32
CHAPTER 3 Redox behaviour of Th4+
in LiCl-KCl eutectic melt
using transient methods
35
3.1 Cyclic voltammetry (CV) at inert tungsten electrode 35
3.2 Chronopotentiometry (CP) at inert tungsten electrode 42
3.3 Square wave voltammetry (SWV) at inert tungsten
electrode
45
3.4 Semi-integral voltammetry (SIV) 47
3.5 Estimation of diffusion coefficient of Th4+
51
3.6 Estimation of 4+
*
Th |ThE from CP and SIV 55
3.7 Anodic dissolution of Th electrode: Estimation of
theoretical equilibrium potential of Th4+
|Th couple
58
3.8 Cyclic voltammetry of Th4+
at liquid cadmium electrode:
Underpotential deposition of Th
64
3.9 Influence of CdCl2 on redox behaviour of Th4+
and
investigation of disproportionation of Th4+
65
3.10 Corrosion study of alumina crucible during
electrochemical measurement
67

xi
3.11 Conclusions 71
CHAPTER 4 Exchange current density of Th4+
|Th couple in LiCl-
KCl eutectic melt
73
4.1 Estimation of i at inert tungsten electrode 73
4.1.1 Estimation of i from polarization curves 73
4.1.2 Estimation of i at inert tungsten electrode by cyclic
voltammetry
76
4.1.3 Dependence of i on 4ThClC at inert tungsten electrode 78
4.2 Estimation of i at liquid cadmium cathode 79
4.3 Estimation of i for anodic polarization of Th electrode 80
4.4 Temperature dependence of i 81
4.5 Conclusions 83
CHAPTER 5 Anodic dissolution of Th and cathodic deposition of
Th4+
at inert tungsten and cadmium electrodes by
electrochemical impedance spectroscopy
85
5.1 Cathodic: at inert tungsten electrode 85
5.2 Cathodic: at liquid cadmium electrode 91
5.3 Anodic dissolution of Th electrode 96
5.4 Validation of complex impedance data by Kramers-
Kronig transforms
103
5.5 Reversibility of Th4+
|Th couple 111
5.6 Conclusions 113
CHAPTER 6 Thermochemical evaluation of 4+Th h|TE and
4f ThClG in
LiCl-KCl eutectic melt
115
6.1 Analysis of electromotive force data 117
6.2 Data analysis and recommendations 121

xii
6.3 Estimation of 4
.
ThCl
liq 124
6.4 Conclusions 128
CHAPTER 7 Electromotive force measurements on Cd-Th
intermetallic compounds in LiCl-KCl eutectic melt
130
7.1 Electromotive force measurements of Cd-Th
intermetallics
130
7.2 Estimation of m nf Cd ThG of Cd-Th intermetallics 132
7.3 Comparison of m nf Th CdH data with estimation using
Miedema’s model
135
7.4 Conclusions 136
CHAPTER 8 Conclusions and future outlook 138
8.1 Conclusions 138
8.2 Challenges during experimentation 139
8.3 Impact of present work 141
8.4 Future outlook 142
List of errata in journal publications 143
References 144

xiii
Homi Bhabha National Institute
SYNOPSIS OF Ph.D. THESIS
SYNOPSIS
High temperature molten salts have found applications in several industrial processes such as
Down’s process for production of sodium, Hall-Heroult process for production of aluminium,
and also in nuclear industry for the reprocessing of nuclear fuels, most notably the RIAR’s
(Russian Institute of Atomic Reactors, Dimitrovgrad) process for spent uranium-plutonium
oxide fuels and IFR (Integral Fast Reactor) process of ANL (Argonne National Laboratory)
for spent metal fuels. In all the above industrial processes, apart from purity of the melt,
electrochemical properties of ions of interest are of paramount significance. In the field of
nuclear fuel reprocessing, electrochemistry of actinides in various melts is an active area of
research where efforts have been put by several groups, sometimes in collaboration with each
other over the last five decades to investigate the redox behavior of electroactive species in
molten salts thus creating an electrochemical database of estimated properties in a particular
melt. In a similar manner, electrochemical series of LiCl-KCl eutectic melt was also
1. Name of the Student: Gurudas Pakhui
2. Name of the Constituent Institution: HBNI, IGCAR Campus
3. Enrolment No.:CHEM02201304006
4. Title of the Thesis: Electrochemical and Thermodynamic Investigations on Th4+
and Cd-Th
Alloys in LiCl-KCl Eutectic Melt
5. Board of Studies: Chemical Sciences

xiv
developed covering actinides, lanthanides, transition elements etc. These properties include
stability of various oxidation states, electron transfer reactions, standard electrode potential,
diffusion coefficient etc. In the context of pyroprocessing of spent metal fuels, redox
behavior of uranium and plutonium in LiCl-KCl eutectic melt is well known although there
are few research groups currently involved in further understanding electrode kinetic aspects
of uranium and plutonium behavior at different electrodes under different experimental
conditions. Electrochemistry of thorium in LiCl-KCl eutectic melt has also been studied in
detail in the last four decades mostly in fluoride melts in the context of molten salt reactors
and as well in chloride and chloride-fluoride melts for investigating the presence of multiple
oxidation states of thorium. There are reports available in the literature that clearly states that
both Th4+
and Th2+
exist in chloride melts. The reduction of Th4+
should be therefore a two-
step process, Th4+
to Th2+
and Th2+
to metallic Th. Although this was observed in binary
chloride melts at high temperature, it was in this perspective that the current study was taken
up in LiCl-KCl eutectic melt. Based on literature survey, it was soon realized that exhaustive
experimental work on Th4+
was required to completely understand its reduction behavior in
the eutectic melt. The present work, tries to meet this objective by focusing on
electrochemical investigations on reduction behavior of Th4+
in LiCl-KCl eutectic melt at
various working electrodes and thermodynamic investigations by electromotive force
measurements for determination of Gibbs energy of formation of Cd-Th intermetallics.
Chapter 1: Introduction
Chapter 1 describes the importance of electrochemistry of thorium species in high
temperature melts carried out in the past as part of development of molten salt reactors with
thorium fuel cycle employing fluoride based melts. Motivation and objectives of
electrochemical and thermodynamic measurements on thorium in LiCl-KCl eutectic melt
have been highlighted. One of the primary aims of present work was to elucidate the

xv
mechanism of anodic dissolution of Th and cathodic deposition of Th4+
in LiCl-KCl eutectic
melt at various working electrodes (inert tungsten, cadmium and thorium) using transient
techniques and AC impedance methods. In order to achieve this objective, an exhaustive
literature survey on electrochemical studies carried out in various alkali halide melts such as
NaCl, KCl, CsCl, LiCl-KCl, NaCl-KCl, LiF-NaF-KF, LiF-CaF2 etc. is described. This is
followed by literature survey on Cd-Th binary system and its similarity with Cd-U and Cd-Pu
has been highlighted. Phase diagram data and characterization of Cd-Th alloys, solubility
data of Th in Cd and crystallographic data of different Cd-Th intermetallics are described.
Based on literature data, scope of present work is discussed emphasizing on experimental
work necessary to address the limitations in literature data and fill the gap areas on
electrochemistry of Th4+
in LiCl-KCl eutectic melt and thermodynamics of Cd-Th alloys.
Chapter 2: Experimental
This chapter gives a brief overview of all experimental facilities, equipments, chemicals,
electrochemical cell assembly etc. used in the present work. An argon atmosphere glove box
pressure controlled between +20 to +40 mm of water column (positive wrt ambient) is first
described that was used for storage of hygroscopic LiCl-KCl eutectic mixture post
chlorination step for purification of melt [1]. The glove box was also used for the preparation
of LiCl-KCl-ThCl4 electrolyte and loading of electrodes in electrochemical cells. The
electrolyte was prepared by equilibrating Th chips with CdCl2 in chlorinated LiCl-KCl
eutectic melt, and the procedure is described in detail. Preparation of LiCl-KCl-AgCl
electrolyte used in Ag+|Ag reference electrode is also described in detail. Analytical methods
for estimating Th and Ag in electrolytes are also discussed. Subsequently, preparation and
characterization of Cd-Th alloys are described. Design, fabrication and preparation of
electrodes for transient measurements and electromotive force measurements are then
discussed. Measurement principles and methodology adopted for transient techniques,

xvi
polarization methods, electrochemical impedance spectroscopy and electromotive force
measurements for estimating 4ThCl and Gibbs energy of formation of Cd-Th alloys are
described.
Chapter 3: Redox behavior of Th4+
in LiCl-KCl eutectic melt using transient methods
Chapter 3 describes in detail the reduction of Th4+
in LiCl-KCl eutectic at inert tungsten
electrode investigated using cyclic voltammetry, chronopotentiometry, square wave
voltammetry and semi-integral voltammetry studies. This is followed up by general sections
on the estimation of diffusion coefficient and 4+
*
Th Th|
E . The existence of multiple oxidation
states of thorium is also addressed in this chapter. Temperature dependence of diffusion
coefficient using cyclic voltammetry and chronopotentiometry were respectively given by
5659ln 3.63 D
T [1]
5665ln 3.20D
T [2]
Temperature dependence of 4+
*
Th Th|
E (by chronopotentiometry) was expressed as
4+
* 3
2Th Th
-
|.Cl /Cl 3.289 1.2 10 (K)(V)E vs T
[3]
The chapter further discusses anodic dissolution of thorium electrode investigated by cyclic
voltammetry and estimation of theoretical equilibrium potential of Th4+
|Th couple. Finally,
underpotential deposition of thorium at liquid cadmium electrode is described. Formation of
intermetallics of Cd-Th is explained on the basis of features observed in cyclic
voltammograms.
Chapter 4: Exchange current density of Th4+
|Th couple in LiCl-KCl eutectic melt
This chapter deals with the estimation of exchange current density i of thorium at inert
tungsten, liq. cadmium and Th working electrodes in LiCl-KCl eutectic melt in the
temperature range of 698-798 K. Polarization experiments were carried out using DC

xvii
amperometry technique, where current was sampled at each applied cathodic potential and
were subsequently plotted logarithm of current density versus overpotential, and further
analyzing them using Tafel and Allen-Hickling methods i was estimated [4]. In all cases, a
good agreement in i from both the plot analysis methods was observed with fairly strong
temperature dependence. At inert tungsten electrode, i was found to be in the range 19-50
mA cm-2
in the temperature range 698-798 K, whereas it varied from 11-16 mA cm-2
at
cadmium electrode in the temperature range 723-773 K. For anodic dissolution of
thorium, i varied from 24-34 mA cm-2
in the temperature range 698-798 K. From the cyclic
voltammetry data discussed in Chapter 3, i of Th4+
|Th couple was estimated and compared
with that obtained from polarization methods. Concentration (4ThClx ) dependence of i was
also addressed, and it was found that although i linearly increased with 4ThClln x at any given
temperature, the variation could not be extrapolated beyond the concentration range studied.
Temperature dependence of i for cathodic and anodic cases is given by the following
expressions:
Cathodic: 3821 502
0.6ln (1 ).50 7iT
[4]
Anodic: ln (0.82 0.12066 118
3)T
i
[5]
Chapter 5: Anodic dissolution of Th and cathodic deposition of Th4+
at inert tungsten
and cadmium electrodes by electrochemical impedance spectroscopy
Chapter 5 describes electrochemical impedance spectroscopic investigations on Th4+
|Th
couple in LiCl-KCl eutectic melt at inert tungsten, liquid cadmium and Th electrodes.
Complex impedance spectra at these electrodes were recorded at different applied potentials
in the frequency range 10-5000 Hz using an AC perturbation amplitude of 10 mV and

xviii
temperature range 698-798 K. The complex impedance data were validated by Kramers-
Kronig transforms [5-7]. These were subsequently fitted to equivalent circuit consisting of
melt resistance, charge transfer resistance and constant phase element for modelling Warburg
impedance and double layer capacitance effects. The complex impedance plots recorded at
inert tungsten electrode were characterized by a flattened semi-circle at higher frequencies
and a linear region at lower frequencies at lower cathodic applied potentials. The flattened
semicircle suggested a very fast charge transfer process whereas the linear part was related to
the mass transfer of Th4+
ions or Warburg impedance. Impedance spectra recorded at lower
cathodic potentials (-0.9, -1.0 V) had a higher span of linear region that indicated the process
was controlled by mass transfer at these potentials. Impedance spectra recorded at applied
potentials -1.1 to -1.2 V had a more prominent semicircle indicating the process was mainly
kinetically controlled. Charge transfer resistance at different applied potential was estimated
from equivalent circuit fitting of complex impedance data. It was observed that variation of
ctR versus applied potential had a single minimum for inert tungsten electrode but two
minima for cadmium electrode. Each minimum point corresponded to a redox couple, and in
case of inert tungsten electrode, it was attributed to reduction of Th4+
to Th, whereas in case
of cadmium electrode, it was due to the formation of Cd11Th and Cd5Th intermetallics due to
underpotential deposition of Th. Complex impedance plots of anodic polarization of thorium
electrode were characterized by a very prominent semicircle at higher frequencies and a
comparatively smaller linear region at lower frequencies. The charge transfer process at
higher frequencies was associated with a large capacitive contribution due to continuous
accumulation of Th4+
ions near the electrode|melt interface. Mechanism of anodic dissolution
of thorium was elucidated based on impedance characteristics due to Warburg diffusion and
double layer capacitance. Heterogeneous rate constant ( )sk of Th4+
|Th couple was calculated
from ctR at inert tungsten, liq. Cd and thorium working electrodes. Temperature dependence

xix
of sk for cathodic (inert tungsten) and anodic polarization (thorium electrode) cases are given
by the following relationships:
Cathodic: 3(6.27 0.88) 10
ln (2.491 1.181)skT
[6]
Anodic: 3(6.53 0.74) 10
ln (3.939 0.992)skT
[7]
From which activation energy of charge transfer process was subsequently calculated.
Finally, the reversibility of Th4+
|Th couple was addressed by Matsuda-Ayabe criterion [8].
Chapter 6: Thermochemical evaluation of 4+Th |ThE and
4f ThClG in LiCl-KCl eutectic melt
Chapter 6 describes molten salt emf measurements on Th4+
in LiCl-KCl eutectic melt for
estimating Gibbs energy of formation of ThCl4. Primary aim of this chapter was to carry out a
thermochemical evaluation of 4+Th |ThE and
4f ThClG using statistical data fitting. In this context,
emf measurements were carried out in the temperature range 673-798 K at different
compositions of ThCl4 in the eutectic melt using the following cell configuration:
ThCl43
AgCl 4
4+ +
4
.6 10
Th|Th ||LiCl-KCl-Th || |ACl Ag g
xx
for measuring equilibrium potential 4+Th |Th
eqE between Th4+
|Th couple and Ag+|Ag reference
electrode at various 4ThClx in LiCl-KCl eutectic melt. Electromotive force data were
subsequently analyzed by the method of Roy et al. [9] and Lantelme et al. [10] for estimating
4+Th |ThE . It was then compared with those estimated from cyclic voltammetry and
chronopotentiometry measurements (discussed in Chapter 3) and data taken from literature
after critical review. From linear least squares fitting, standard expressions of temperature
dependence of 4+Th |ThE and
4f ThClG arrived at and are given by
4+
-4
2Th |Th/ V . Cl |Cl = (3.059 0.213) + (6.076 2.875) 10E vs T [8]

xx
4f ThCl (kJ/mol) (1180.44 23.62) (0.234 0.033)G T [9]
Finally, 4ThCl was estimated from
4f ThCl , .liqG as reference state obtained from various
thermochemical data compilations [11-15]. Few conclusions were drawn on the choice of
reference state data and its influence on the range of 4ThCl
Chapter 7: Electromotive force measurements on Cd-Th alloys in LiCl-KCl eutectic
melt
Chapter 7 discusses about emf measurements for on Cd-Th binary system. This work was
taken primarily because it was seen from literature survey that no thermodynamic data were
available on Cd-Th intermetallics. Electromotive force method of estimating f
G was
chosen as it was a superior method than open-circuit chronopotentiometry technique.
Following galvanic cells were constructed for determining f
G of Cd-Th intermetallics that
comprises of Th4+
|Th as ref. electrode and Cd-Th biphasic alloy as the other electrode:
1
4+
I 4
4+
II 4 11 5
4+
III 4 5
1
623
- 1Cell I (E ) : Th|Th || LiCl-KCl-ThCl + Cd
Cell II (E ) : Th|Th || LiCl-KCl-ThCl Cd + Cd
Cell III (E ) : Th|Th || LiCl-KCl
|| Cd Th Th
|| Th Th
||-ThCl Cd + CTh Thd
Cell IV
s
s s
s s
x x l
4+
IV 4 23 6 3 (E ) : Th|Th || LiCl || Th-KCl-ThCl Cd + Cd Ths s
emf of the above cell configurations represented by EI, EII, EIII and EIV was measured in the
temperature range 673-800 K. From the derived relationships among EI, EII, EIII and
EIV,11f Cd ThG
, 5f Cd ThG, 23 6f Cd ThG and
3f Cd ThG were determined. The temperature dependence
of these quantities were established and are given by
11
1
f Cd Th (J. mol-atom ) (13885.35 269.87) (9.44 0.37) G T [10]
5
1
Th
°f Cd (J. mol-atom ) (32638.69 145.98) (25.94 0.19) G T [11]
23 6
° 1
f Cd Th (J. mol-atom ) (41219.89 68.27) (33.83 0.09) G T [12]
3
° 1
f Cd Th (J. mol-atom ) (44636.91 44.92) (34.87 0.06) G T [13]

xxi
From the fitted expressions, f H of each intermetallic was derived and compared with that
calculated using Miedema model; the agreement between them was found to be reasonable
[16]. f G of Cd-Th intermetallics were also compared with that of Fe-Th, Ni-Th and Co-Th
intermetallics as the nature of those phases and crystal structures were similar [17-19]. Phase
stability of Cd-Th intermetallics was finally explained on the basis of emf measurements.
Chapter 8: Conclusions and Future Outlook
This chapter briefly discusses the major highlights of the present work, and difficulties faced
during experimental works. Possibility of employing electrochemical data of Th4+
and Cd-Th
in the separation of uranium from thorium matrix at either inert tungsten or cadmium
electrode is described. Difficulties faced during electromotive force measurements on Th-
rich Cd-Th alloys are explained. Finally, the chapter focuses on future work that can be taken
up to further understand the thermodynamics of LiCl-KCl-ThCl4 system, and influence of
various electroactive impurities on the reduction behavior of Th4+
.
Nomenclature
4+
*
Th Th|
E : Apparent standard electrode potential of Th
4+|Th couple in LiCl-KCl eutectic melt
D: Diffusion coefficient
i : Exchange current density
4ThClx : Mole fraction of ThCl4 in LiCl-KCl eutectic melt
ctR : Charge transfer resistance
sk : Heterogeneous rate constant
4+Th |Th
eqE : Equilibrium potential of Th4+
|Th couple (versus Ag+|Ag)
4+Th |ThE : Standard electrode potential of Th
4+|Th couple in LiCl-KCl eutectic melt
4f ThClG : Standard Gibbs energy of formation of ThCl4 in LiCl-KCl eutectic melt

xxii
4f ThCl , .liqG : Gibbs energy of formation of pure ThCl4 in supercooled liquid state
4ThCl : Activity coefficient of ThCl4
References
[1] D.L. Maricle, D.N. Hume, ''A new method for preparing hydroxide-free alkali chloride
melts'', J. Electrochem. Soc., 107 (1960) 354-356.
[2] L. Martinot, ''Electrochemical behaviour of tetravalent thorium in molten (Li-K)Cl
eutectic'', J. Radioanal. Nucl. Chem. Lett., 103 (1986) 357-363.
[3] L. Cassayre, J. Serp, P. Soucek, R. Malmbeck, J. Rebizant, J.P. Glatz, ''Electrochemistry
of thorium in LiCl-KCl eutectic melts'', Electrochim. Acta., 52 (2007) 7432-7437.
[4] A.J. Bard, L.R. Faulkner, ''Electrochemical Methods-Fundamentals and Applications'',
John Wiley and Sons, 1980.
[5] B.A. Boukamp, ''Kramers-Kronig test for
Windows'',accessed:April,https://www.utwente.nl/en/tnw/ims/publications/downloads/,
2018.
[6] B. Boukamp, ''A linear Kronig-Kramers transform test for immittance data validation'' J.
Electrochem. Soc., 142 (1995) 1885-1894.
[7] B.A. Boukamp, ''Electrochemical impedance spectroscopy in solid state ionics: recent
advances'', Solid State Ionics, 169 (2004) 65-73.
[8] H. Matsuda, Y. Ayabe, ''Zur Theorie der Randles -Sevcikschen Kathodenstrahl-
Polarographie'', Z. Elektrochem., 59 (1955) 494-503.
[9] J.J. Roy, L.F. Grantham, D.L. Grimmett, S.P. Fusselman, C.L. Krueger, T.S. Storvick,
''Thermodynamic Properties of U, Np, Pu, and Am in Molten LiCl-KCl Eutectic and
Liquid Cadmium'', J. Electrochem. Soc., 143 (1996) 2487-2492.
[10] F. Lantelme, Y. Berghoute, ''Electrochemical studies of LaCl3 and GdCl3 dissolved in
fused LiCl-KCl'', J. Electrochem. Soc., 146 (1999) 4137-4144.

xxiii
[11] L. Martinot, J. Bohet, G. Duyckaerts, W. Muller, ''Thermodynamic properties of
dilute solutions of ThCl4 in (Li-K)Cl and (Na-K)Cl eutectics'', Inorg. Nucl. Chem. Lett.,
13 (1977) 315-319.
[12] A. Glassner, ''The thermochemical properties of the oxides, fluorides and chlorides to
2500 K'', Argonne National Lab., ANL-5750, Lemont, 1957, pp. 201-274.
[13] J. Fuger, V.B. Parker, W.N. Hubbard, F.L. Oetting, ''The Chemical Thermodynamics
of Actinide Elements and Compounds, Part 8'', "The Actinide Halides", IAEA, Vienna,
1983.
[14] C. Bale, E. Belisle, P. Chartrand, S. Decterov, G. Eriksson, A. Gheribi, K. Hack, I.H.
Jung, Y.B. Kang, J. Melanon, A. Pelton, S. Petersen, C. Robelin, J. Sangster, P. Spencer,
M.A.V. Ende, Factsage thermochemical software and databases 2010-2016, Calphad, 54
(2016) 35-53.
[15] J. Fuger, D. Brown, ''Thermodynamics of the actinide elements. Part IV. Heats and
free energies of formation of the tetrachlorides, tetrabromides, and tetraiodides of thorium,
uranium, and neptunium'', J. Chem. Soc., Dalton Trans., 0 (1973) 428-434.
[16] A. Dębski, R. Dębski, W. Gasior, ''New features of Entall database: Comparison of
experimental and model formation enthalpies'', Archives of Metallurgy and Materials, 59
(2015) 1337-1343.
[17] W.H. Skelton, N.J. Magnani, J.F. Smith, ''Thermodynamics of formation of Th-Ni
alloys'', Metall. Mater. Trans., 1 (1970) 1833-1837.
[18] W.H. Skelton, N.J. Magnani, J.F. Smith, ''Thermodynamics of formation of Th-Co
alloys'', Metall. Mater. Trans., 2 (1971) 473-476.
[19] W.H. Skelton, N.J. Magnani, J.F. Smith,''Thermodynamics of formation of Th-Fe
alloys'', Metall. Mater. Trans., 4 (1973) 917-920.

xxiv
Publications in Refereed Journal:
a. Published
1. Gurudas Pakhui, Manish Chandra, Suddhasattwa Ghosh, B. Prabhakara Reddy, K.
Nagarajan, “Electrochemical studies on the reduction behaviour of Th4+
in molten LiCl-
KCl eutectic”, Electrochim. Acta., 155 (2015) 372-382.
2. Gurudas Pakhui, Suddhasattwa Ghosh, B. Prabhakara Reddy, “Exchange current
density of thorium in molten LiCl-KCl eutectic”, Electrochim. Acta., 222 (2016) 92-99.
3. Gurudas Pakhui, Suddhasattwa Ghosh, B. Prabhakara Reddy, “Th4+
|Th couple in LiCl-
KCl eutectic: Anodic polarization of thorium and electrochemical impedance
spectroscopy study at tungsten, cadmium and thorium electrodes”, Electrochim. Acta.,
295 (2019) 354-366.
b. To be communicated:
1. Gurudas Pakhui, Suddhasattwa Ghosh, B. Prabhakara Reddy, “Thermochemical
Evaluation of 4+
ο
Th |ThE and
4
ο
f ThClG in LiCl-KCl eutectic melt”.
2. Gurudas Pakhui, Suddhasattwa Ghosh, B. Prabhakara Reddy, “Gibbs energy of
formation of Cd-Th intermetallics by electromotive force measurements”.
Other Publications:
c. Conference/Symposium
1. Gurudas Pakhui, Suddhasattwa Ghosh, B. Prabhakara Reddy, “Electrochemical
behavior of Th4+
in molten LiCl-KCl eutectic”, Theme meeting on Recent Trends in
Materials Chemistry (RTMC), July 25-27, 2013, VIT University, Vellore, India.

xxv
2. Gurudas Pakhui, Suddhasattwa Ghosh, B. Prabhakara Reddy, “Electrochemistry of
Th4+
|Th couple in molten LiCl-KCl eutectic”, Theme meeting on Chemistry in Nuclear
Technology (CHEMNUT), July 30-31, 2015, 32, IGCAR, Kalpakkam, India.
3. Gurudas Pakhui, Suddhasattwa Ghosh, B. Prabhakara Reddy, “Electrochemical and
thermodynamic properties of Th and Th-Cd alloys using transient electrochemical
techniques”, Symposium on thermal analysis (THERMANS), January 18-20, 2016, T040,
IIT BHU, Varanasi, India.
4. Gurudas Pakhui, Suddhasattwa Ghosh, B. Prabhakara Reddy, “Redox behaviour of
Th4+
|Th couple at tungsten and cadmium electrodes in LiCl-KCl eutectic”, Symposium on
Nuclear and Radiochemistry (NUCAR), February 6-10, 2017, C-146, KIIT University,
Bhubaneswar, India.
5. Gurudas Pakhui, Suddhasattwa Ghosh, B. Prabhakara Reddy, “Determination of partial
excess Gibbs energy of ThCl4 in LiCl-KCl eutectic using electromotive force
measurements”, International Conference on Electrochemical Science & Technology
(ICONEST), August 10-12, 2017, PP-EC-23,IISc Bengaluru, India.
6. Gurudas Pakhui, Suddhasattwa Ghosh, B. Prabhakara Reddy, “Molten salt
electromotive force measurements on Th-Cd alloys”, Symposium on Nuclear and
Radiochemistry (NUCAR), January 15-19, 2019, C27, BARC, Mumbai, India.
Signature of Student:
Date:

xxvi
Doctoral Committee:
S. No. Name Designation Signature Date
1. Dr. S. Rangarajan Chairman
2. Dr. B. Prabhakara Reddy Guide & Convener
3. Dr. V. Jayaraman Member
4. Dr. Rajesh Ganesan Member
5. Dr. S. Ningshen Member

xxvii
NOMENCLATURE
T Temperature (K)
R Universal gas constant (8.314 J mol-1
K-1
)
F Faraday constant (96500 C/mol)
pci Cathodic peak current (A)
pcE Cathodic peak potential (V)
/2p p cE E
Magnitude of peak width (V)
n No of electrons transferred in redox reaction
W1/2 Peak width at half height
∆E Amplitude of square wave potential (V)
A Electrode area (cm2)
4ThClC Concentration of ThCl4 in LiCl-KCl eutectic melt (mol cm-3
)
2CdClC Concentration of CdCl2 in LiCl-KCl eutectic melt (mol cm
-3)
4+ThD Diffusion coefficient of Th
4+ in LiCl-KCl eutectic melt (cm
2 s
-1)
Ea Activation energy of Th4+
|Th couple (kJ mol-1
)
m(t) Semi-integral current (A s1/2
)
c ( )m
Limiting semi-integral current (A s1/2
)
( )E t Time dependent applied potential (V)
i Current density (mA cm-2
)
i Exchange current density (mA cm-2
)
Scan rate (mV s-1
)
Transition time (s)
η Overpotential (V)
α Charge transfer coefficient
ω Angular frequency (Hz)
Re ( )Z Real impedance (Ω)
Im ( )Z Imaginary impedance (Ω)
YQ Admittance (mho)
ctR Charge transfer resistance (Ω)

xxviii
sk Heterogeneous rate constant (cm s-1
)
4+Th |Th
appE Apparent equilibrium potential of Th4+
|Th in LiCl-KCl eutectic melt (V)
4+
*
Th |ThE
Apparent standard electrode potential of Th
4+|Th couple in LiCl-KCl
eutectic melt (V)
4+Th |Th
eqE Equilibrium potential of Th4+
|Th couple in LiCl-KCl eutectic melt (V)
4+Th h|TE
Standard electrode potential of Th4+
|Th couple in LiCl-KCl eutectic melt
(versus Cl−|Cl2) (V)
AgClE
Standard electrode potential of AgCl in LiCl-KCl eutectic melt (versus
Cl−|Cl2) (V)
4f ThCl ,liq.G
Standard Gibbs energy of formation of pure liq. ThCl4 (kJ mol-1
)
4f ThCl LiCl-KCl,G
Gibbs energy of formation of ThCl4 in LiCl-KCl eutectic melt (kJ mol-1
)
4f ThClG
Standard Gibbs energy of formation of ThCl4 in LiCl-KCl eutectic melt
(kJ mol-1
)
4ThCl
ex
G
Partial excess Gibbs energy of formation of ThCl4 in LiCl-KCl eutectic
melt (kJ mol-1
)
f AgClG Gibbs energy of formation of AgCl in LiCl-KCl eutectic melt (kJ mol-1
)
f AgClG
Standard Gibbs energy of formation of pure AgCl (kJ mol-1
)
4fus ThClH Enthalpy of fusion of pure ThCl4 (kJ mol
-1)
4ThCl ,liq .a Activity of ThCl4 in LiCl-KCl eutectic melt (kJ mol
-1)
AgCla
Activity of AgCl in LiCl-KCl eutectic melt
4 4 4ThCl ThCl ThCl
s liq., ,
Activity coefficient of ThCl4 in LiCl-KCl eutectic melt. Second and third
term refer to4ThCl in solid and liquid reference states
AgCl
Activity coefficient of AgCl in LiCl-KCl eutectic melt
4ThClx Mole fraction of ThCl4 in LiCl-KCl eutectic melt
AgClx Mole fraction of AgCl in LiCl-KCl eutectic melt
Thx Mole fraction of Th in Cd
Tha Activity of Th in Cd
Cda Activity of Cd saturated by Th

xxix
ThG
Gibbs energy of thorium in reference state of α-Th (kJ mol-1
)
ThG
Partial Gibbs energy of thorium in liq. Cd (kJ mol-1
)
m nf Cd ThG General term to express standard Gibbs energy of formation of all Cd-Th
intermetallics ( -1J mol-atom )
11f Cd ThG Standard Gibbs energy of formation of Cd11Th ( -1J mol-atom )
5f Cd ThG
Standard Gibbs energy of formation of Cd5Th ( -1J mol-atom )
23 6
°
f Cd ThG
Standard Gibbs energy of formation of Cd23Th6 (-1J mol-atom )
3
°
f Cd ThG
Standard Gibbs energy of formation of Cd3Th ( -1J mol-atom )
m nf Cd ThH
General term to express standard enthalpy of formation of all Cd-Th
intermetallics ( -1J mol-atom )
ThH Partial molar enthalpy of Th in Cd-Th intermetallic (J mol-1
)
ThS partial molar entropy of Th in Cd-Th intermetallic (J mol-1
)
CdH Partial molar enthalpy of Cd in Cd-Th intermetallic (J mol-1
)
CdS partial molar entropy of Cd in Cd-Th intermetallic (J mol-1
)
* Electronegativity
wsn Electron density at the boundary of the Wigner-Seitz atomic cell

xxx
LIST OF FIGURES
Figure No Figure caption Page
No
Figure 1.1 Graph of publications versus year on studies carried out on thorium in
molten salts across the world, Reference: Scopus database, search
words: thorium and molten, thorium and fused.
2
Figure 1.2 Cd-Th binary phase diagram given by Palenzona et al. [52] . 7
Figure 1.3 Flowchart of scope of work in current PhD thesis. 9
Figure 2.1 The layout of argon atmosphere glove box[53] . 11
Figure 2.2 Photograph of argon atmosphere glove box. 12
Figure 2.3 Chlorination set-up made of quartz vessel and teflon flanges. 14
Figure 2.4 XRD pattern of LiCl-KCl-ThCl4 electrolyte (Numbers in parenthesis
correspond to miller indices).
16
Figure 2.5 XRD pattern of (a) Th and (b) Cd metals. 18
Figure 2.6 Photographs of (a) iron vessel before and after loading with Th and Cd,
(b) Cd-Th alloy after cleaning by diamond filing.
18
Figure 2.7 Powder XRD patterns of (a) CdTh + Cd11Th, (b) Cd11Th + Cd5Th, (c)
Cd5Th + Cd23Th6, (d) Cd23Th6 + Cd3Th two-phase alloys, Step size:
0.05°, (Numbers in parenthesis correspond to miller indices).
19
Figure 2.8 Thorium electrode used in the present work. 20
Figure 2.9 Liquid cadmium electrode. 21
Figure 2.10 Electrode assembly used in emf study of ThCl4 in LiCl-KCl eutectic
melt.
22
Figure 2.11 Electrode assembly used in emf study of Cd-Th alloys. 23
Figure 2.12 Schematic of electrochemical cell assembly. 24
Figure 2.13 Photograph of top flange loaded with electrodes in electrochemical
cell.
25

xxxi
Figure 2.14 Equivalent circuit used for fitting complex impedance data for cathodic
polarization of thorium at inert tungsten and cadmium electrodes and
anodic polarization of metallic thorium electrode
29
Figure 2.15 Schematic diagram of emf cell set-up. 32
Figure 3.1 Cyclic voltammograms of blank LiCl-KCl eutectic melt and LiCl-KCl-
ThCl4 at tungsten electrode, T = 723 K, 4
5
ThCl
-310 mol c9.5 m3 C ,
A = 0.25 cm2
.
36
Figure 3.2 Cyclic voltammogram of Th4+
|Th couple at inert tungsten electrode in
LiCl-KCl eutectic melt for scan rates 3-10 mV s-1
, T = 698 K,
4
5
ThCl
-310 mol c9.5 m3 C , A = 0.25 cm2
.
36
Figure 3.3 Cyclic voltammograms of Th4+
|Th couple at inert tungsten electrode in
LiCl-KCl eutectic melt, T = 723 K,4
5 -3
ThCl 2.04 10 mol cmC ,
A = 0.25 cm2
.
37
Figure 3.4 . logpcE vs for Th4+
|Th couple at inert tungsten electrode in LiCl-KCl
eutectic melt, (a)4
5 -3
ThCl 2.04 10 mol cmC ,(b)
4
5 -3
ThCl 2.72 10 mol cmC , (c)4
5
ThCl
-310 mol c9.5 m3 C , T = 698–
803 K, A = 0.25 cm2
.
41
Figure 3.5 Variation of 1/2.pci vs of Th4+
|Th couple at inert tungsten electrode in
molten LiCl-KCl eutectic melt, (a) 4
5 -3
ThCl 2.04 10 mol cmC ,
(b)4
5 -3
ThCl 2.72 10 mol cmC , (c)4
5
ThCl
-310 mol c9.5 m3 C ,
T = 698–803 K, A = 0.25 cm2
.
42
Figure 3.6 a) Chronopotentiograms of Th4+
|Th couple at tungsten electrode in
molten LiCl-KCl eutectic melt, (b) Variation of iτ1/2
versus current
density, T = 723 K, 4
5 -3
ThCl 2.04 10 mol cmC , A = 0.25 cm2
.
43
Figure 3.7 Plot of i versus τ-1/2
, (a) 4
5 -3
ThCl 2.04 10 mol cmC ,
(b)4
5
ThCl 2.72 10C mol cm-3
, (c)4
5
ThCl
-310 mol c9.5 m3 C ,
T = 698–803 K, A = 0.25 cm2
.
45

xxxii
Figure 3.8 (a) Square wave voltammograms of Th4+
|Th couple at inert tungsten
electrode in LiCl-KCl eutectic melt, T = 723
K,4
5 -3
ThCl 2.04 10 mol cmC , f = 25 Hz, ΔE = 20, 25, 30, 35 mV,
A = 0.25 cm2. (b) Linear relationship of pci (left axis) and pcE (right
axis) versus 1/2f , T = 723 K, ΔE = 25 mV.
46
Figure 3.9 Semi-integral curve of voltammogram for Th4+
|Th couple at inert
tungsten electrode in LiCl-KCl eutectic melt, T = 723
K,4
5 -3
ThCl 2.04 10 mol cmC , A = 0.25 cm2
.
47
Figure 3.10 Logarithmic analysis of semi-integral curve of Th4+
|Th couple as per
(a) Reversible, (b) quasireversible and (c) irreversible hypothesis,
4
5 -3
ThCl 2.04 10 mol cmC , T = 723 K, A = 0.25 cm2
.
50
Figure 3.11 Variation of 4+Thln D versus 1/T for ThCl4 in LiCl-KCl eutectic melt. 54
Figure 3.12 Concentration and temperature dependence of 4+ThD of Th
4+ in LiCl-
KCl eutectic melt.
54
Figure 3.13 Logarithmic analysis of chronopotentiogram of Th4+
|Th couple for
tungsten electrode in LiCl-KCl eutectic melt,
(a)4
5 -3
ThCl 2.04 10 mol cmC , (b)4
5 -3
ThCl 2.72 10 mol cmC ,
(c)4
5
ThCl
-310 mol c9.5 m3 C , T = 698–803 K, A = 0.25 cm2
.
56
Figure 3.14 Plot of 4+
*
Th |ThE versus T (K). 58
Figure 3.15 Cyclic voltammogram of Th electrode in LiCl-KCl eutectic melt,
4
4 -3
ThCl 1.02 10 m= ol cmC , T = 773 K, Scan rate: 25 mV s-1
, A = 1.50
cm2
.
59
Figure 3.16 Cyclic voltammograms of LiCl-KCl-ThCl4 at inert tungsten and liquid
cadmium electrodes. 4
5 -3
ThCl 3.55 10 mol cmC , A = 0.25 cm2 at inert
tungsten electrode. 4
4
ThCl
-310 mol c1.0 m8 C , A = 1.48 cm2
at liquid
cadmium electrode, scan rate for both the voltammograms is 25 mV s-
1, T = 773K.
65

xxxiii
Figure 3.17 Cyclic voltammograms of LiCl-KCl-ThCl4 at liquid cadmium
electrode at various scan rates, T = 698 K, 4
4
ThCl
-310 mol c1.0 m8 C .
65
Figure 3.18 Cyclic voltammograms of LiCl-KCl-ThCl4 at inert tungsten electrode
over period of 30 h, T = 773 K.
66
Figure 3.19 Cyclic voltammogram of LiCl-KCl eutectic containing ThCl4 and
CdCl2 at inert tungsten electrode, T = 773 K,
4
4 -3
ThCl 1.08 10 mol m ,cC 2
5 -3
CdCl .20= 10 m m5 ol cC .
67
Figure 3.20 (a) Recrystallized alumina crucible before experiments, (b) LiCl-KCl-
ThCl4 electrolyte used for the present measurements before
experiment.
68
Figure 3.21 Th electrode prepared for experiment (a) before immersion in the melt,
(b) after immersion in the melt.
69
Figure 3.22 Alumina crucible after experiment (a) when Th electrode was not
immersed, (b) when Th electrode was immersed in the melt.
69
Figure 3.23 LiCl-KCl-ThCl4 electrolyte after experiment (a) when Th electrode
was not immersed and (b) when Th electrode was immersed in the
melt.
70
Figure 3.24 Cyclic voltammograms of LiCl-KCl-ThCl4 at inert tungsten electrode
over period of 30 h, T = 773 K, thorium electrode was kept immersed
into the melt during cyclic voltammetric measurements.
71
Figure 4.1 .i vs t profile for cathodic polarization of thorium at inert tungsten
electrode at various potentials, T = 773 K.
74
Figure 4.2 .i vs E profile for cathodic and anodic polarization of thorium at inert
tungsten, liq. Cd and Th electrodes at various potentials, T = 773 K.
74
Figure 4.3 Tafel plots for anodic and cathodic polarization of thorium at inert
tungsten and liquid cadmium cathodes in LiCl-KCl eutectic melt.
75
Figure 4.4 Allen-Hickling plots of anodic and cathodic polarization of thorium at
inert tungsten and liquid cadmium cathode in LiCl-KCl eutectic melt.
75

xxxiv
Figure 4.5 i versus 4
-3
ThClln (molcm )C profile for cathodic polarization data at
tungsten electrode at various temperatures. i estimated from both
polarization and cyclic voltammetric data are shown.
78
Figure 4.6 .i vs t profile for cathodic polarization of thorium at liquid Cd electrode
at various potentials, T =773 K.
80
Figure 4.7 .i vs t profile for anodic polarization of thorium electrode at various
potentials, T = 773 K.
81
Figure 4.8 ln i versus
1
Tcurve for tungsten electrode (cathodic polarization). Fits
of only polarization data and polarization+voltammetry data (Chapter
3) are shown
82
Figure 4.9 i versus
1
Tcurve for liquid cadmium (cathodic polarization) and
anodic dissolution of thorium in LiCl-KCl eutectic melt.
83
Figure 5.1 Equivalent circuit used for fitting complex impedance data for cathodic
polarization of thorium at inert tungsten and cadmium electrodes and
anodic polarization of metallic thorium electrode.
85
Figure 5.2 Nyquist plots of ThCl4 at inert tungsten electrode in LiCl-KCl eutectic
melt,4
4 -3
ThCl 1.02 10 mol cmC , T = 773 K, Frequency range of
measurement: 10 Hz to 10 kHz.
87
Figure 5.3 Nyquist plots of ThCl4 at inert tungsten electrode in LiCl-KCl eutectic
melt at 4+Th |Th
eqE versus Ag+|Ag reference,
4
4 -3
ThCl 1.02 10 mol cmC ,
T = 698-773 K. Frequency range of measurement: 10 Hz to 10 kHz.
88
Figure 5.4 Variation of ctR versus applied potential at tungsten electrode
(cathodic), 4
4 -3
ThCl 1.02 10 mol cmC , T = 773 K.
89
Figure 5.5 Nyquist plots of ThCl4 at liquid cadmium electrode in LiCl-KCl
eutectic melt,4
4 -3
ThCl 1.02 10 mol cmC , T = 773 K, Frequency range
of measurement: 10 Hz-10 kHz.
92

xxxv
Figure 5.6 Variation of ctR versus applied potential at liquid cadmium electrode
(cathodic),4
4 -3
ThCl 1.02 10 mol cmC , T = 773 K.
94
Figure 5.7 Nyquist plots of thorium electrode (anodic) in LiCl-KCl-ThCl4,
4
4 -3
ThCl 1.02 10 mol cmC , T = 698-798 K, Frequency range of
measurement: 10Hz-10 kHz.
99
Figure 5.8 Diagrammatic representation of anodic dissolution of thorium in LiCl-
KCl eutectic melt. Distinct features of complex impedance plots
include large capacitive response at higher frequencies and slope of
linear region at lower frequencies greater than 1.0. -1.435 V is the
equilibrium potential for thorium dissolution.
101
Figure 5.9 Variation of Rct versus applied potential for Th electrode (anodic),
4
4 -3
ThCl 1.02 10 mol cmC , T = 773 K.
102
Figure 5.10 Validation of complex impedance data recorded at inert tungsten
electrode using Kramers-Kronig transforms, K-K compliance fit, fit
residuals Re, Im,iandi are shown for cathodic potentials of –0.8 to -
1.57 V, T = 773 K, A = 0.25 cm2.
106
Figure 5.11 Validation of complex impedance data recorded at liquid cadmium
electrode using Kramers-Kronig transforms. K-K compliance fit and fit
residuals Re, Im,iandi are shown for cathodic potential of -0.90 to -
1.47 V, T = 773 K, A = 1.48 cm2.
109
Figure 5.12 Validation of complex impedance data recorded at metallic thorium
electrode using Kramers-Kronig transforms. K-K compliance fit and fit
residuals Re, Im,iandi are shown for anodic potentials of -1.35 to -
1.43 V, T = 773 K, A = 1.5 cm2.
110
Figure 5.13 Temperature dependence of ln sk for cathodic (inert tungsten) and
anodic (thorium) polarization cases.
112
Figure 6.1 Equilibrium potential 4 |
eq
Th ThE measured against Ag
+|Ag reference
electrode at various4ThClx and temperatures in LiCl-KCl eutectic melt.
118

xxxvi
Figure 6.2 Variation of 4+
4
-
AgCl A| gCl 2 ThClTh Thln .Cl Cl . ln|eq RT
E E x vs vs xF
(Method of Roy et al.[70,71] ) in LiCl-KCl eutectic melt.
119
Figure 6.3 Variation of 4+
4
-
AgCl Ag| Cl ThCl 2Th Thln - ln .Cl Cl
4|eq RT RT
E E x x vsF F
4ThCl.vs x (Method of Lantelme et al. [72,73] ) in LiCl-KCl eutectic
melt.
119
Figure 6.4 Temperature dependence of 4+Th h|TE in LiCl-KCl eutectic melt reported
by various authors and in the present work. 4+Th h|TE of Martinot et al.
[106] re-calculated using the method of Roy et al. and Lantelme et al.
are also shown. Individual linear fitting of electromotive force and
transient data along with the overall fit are also shown.
122
Figure 6.5 Variation of 4f ThCl , .liqG of pure ThCl4 liquid (hypothetically
supercooled) as reference state versus T taken from different
thermochemical data compilations [105 107,109,116] . 4f ThCl ,sG of
pure solid ThCl4 from Glassner [105] is also shown.
125
Figure 6.6 Variation of 4
.
ThCl
liq in LiCl-KCl eutectic melt versus T estimated from
various thermochemical compilations. The recommended linear least
square fit is also shown.
126
Figure 7.1 Emf data for cells I-IV, respective linear least square fits are also
shown.
132
Figure 7.2 Temperature dependence of m nf Cd ThG of Cd-Th intermetallics. 133
Figure 7.3 Comparison of f G as a function of Th composition for intermetallics
of Cd-Th, Fe-Th, Co-Th, Ni-Th, Cu-Th and Zn-Th systems
[32,35 37,39] .
133

xxxvii
Figure 7.4 Comparison of experimental values ofm nf Cd ThH with that of Miedema
estimation and with experimental values of Cu-Th system[32] , Ni-Th,
Co-Th, Fe-Th systems, reported by Skelton et al. [35 37] and Th-Zn
system [39] .
136
Figure 8.1 Cyclic voltammogram of LiCl-KCl-ThCl4 at inert tungsten electrode,
T = 773 K, A = 0.25 cm2.
140

xxxviii
LIST OF TABLES
Table No Table caption Page No
Table 1.1 Literature survey on electrochemical studies of thorium in
molten salts.
4
Table 1.2 Literature survey on Cd-Th system. 7
Table 2.1 Impurity analysis in chlorinated LiCl-KCl (sample weight:
475.5 mg) eutectic by ICP-AES and LiCl-KCl-ThCl4 salt by
ICP-MS technique (sample weight: 70 mg).
16
Table 2.2 Impurity analysis of Cd by ICP-OES and AAS techniques
(sample weight: 220.22 mg) [59] .
17
Table 2.3 Weight balance of Cd-Th alloys before and after equilibration 18
Table 3.1 Cathodic peak analysis of Th4+
|Th couple for
4
5 -3
ThCl 2.72 10 mol cmC in LiCl-KCl eutectic melt.
38
Table 3.2 Calculated αn value for Th4+
|Th couple by cyclic voltammetry 40
Table 3.3 n of Th4+
|Th couple calculated by squarewave voltammogram,
4
5 -3
ThCl 2.72 10 mol cmC .
46
Table 3.4 n, α, αn values for Th4+
|Th couple using reversible,
quasireversible and irreversible hypothesis in semi-integral
voltammetry.
50
Table 3.5 4+Th
D of Th4+
in LiCl-KCl eutectic melt obtained from CV,
CP, SIV, SWV.
53
Table 3.6 Estimated 4+
*
Th |ThE
of Th4+
|Th couple and comparison with
literature data.
56
Table 3.7 Estimated 4+
*
Th |ThE values at different
4ThClC . 57
Table 3.8 4+Th |Th
appE of Th dissolution in LiCl-KCl-ThCl4
(4
3
ThCl 3.86 10x ) electrolyte measured using cyclic
voltammetry at 50 mV s-1
and 100 mV s-1
.
60

xxxix
Table 3.9 Summary of calculated equilibrium potential of thorium
dissolution in LiCl-KCl eutectic melt at T = 773 K from
various literature sources. Data of Yang et al. [74] are at 772
K and 774 K. 4
3
ThCl 3.86 10x is assumed for all
calculations.
63
Table 4.1 i , Tafela , Tafelb and Allen-Hicklingb of thorium at inert tungsten
electrode in LiCl-KCl eutectic melt.
76
Table 4.2 i of Th4+
|Th couple at inert tungsten electrode from cyclic
voltammetric data (Chapter 3).
77
Table 4.3 i of Th4+
|Th couple at liquid cadmium electrode at various
temperatures
80
Table 4.4 i of thorium in LiCl-KCl eutectic melt in temperature range
698-798 K
81
Table 4.5 Fit parameters of ln i versus 1/T plot for cathodic and anodic
polarization data.
83
Table 5.1 EIS data of cathodic polarization of thorium in LiCl-KCl-
ThCl4 electrolyte at tungsten electrode,
4
4 -3
ThCl 1.02 10 mol cmC , A = 0.25 cm2.
90
Table 5.2 EIS data of cathodic polarization of thorium in liquid
cadmium, 4
4 -3
ThCl 1.02 10 mol cmC , A = 1.48 cm2.
94
Table 5.3 EIS data of anodic polarization of thorium electrode in LiCl-
KCl-ThCl4 electrolyte,4
4 -3
ThCl 1.02 10 mol cmC , A =
1.5 cm2.
102
Table 5.4 sk estimated for cathodic and anodic polarization of thorium
in LiCl-KCl eutectic melt.
111
Table 5.5 Matsuda-Ayabe criteria applied to Th4+
|Th couple for cathodic
and anodic polarization cases in LiCl-KCl eutectic melt,
10-2(1+α)
= 3.98 x 10⁻⁴
for all cases.
113

xl
Table 6.1 Literature survey on thermodynamic behaviour of ThCl4 in
LiCl-KCl eutectic melt.
116
Table 6.2 Equilibrium potential of Th4+
|Th couple measured against
Ag+|Ag reference electrode ( 3
AgCl 4.6 10x ).
118
Table 6.3 Comparison of standard electrode potential of Th4+
|Th couple
versus Cl−|Cl2 estimated in the present work with literature
data
120
Table 7.1 Electromotive force data of cells I, II, III and IV,
superscription h and c refer to measurements in heating and
cooling cycles, respectively.
131
Table 7.2 Table of thermodynamic functions for the formation of Cd-Th
intermetallics at 773 K.
134
Table 7.3 Partial molar quantities for Cd-Th intermetallics relative to α-
Th (fcc) and liquid cadmium (hcp) at 723 K.
135
Table 8.1 Electromotive force data of the cell
4+
4 3 2Th|Th || LiCl-KCl-T || Cd ThC hh l + Cd T
s s.
141

1
CHAPTER 1
Introduction
1.1 Objectives of present thesis
Investigations on thorium based systems either related to preparation and characterization of
condensed phases or electrochemistry pertaining to its redox behavior in high temperature
melts had been initiated in 1950s in several countries to address issues on nuclear power
generation using breeder reactors based on molten salts, preparation, characterization and
performance of thorium based fuels or as a general area of research involving preparation of
complex phases and measurement of their thermodynamic properties. These studies were
extended in different directions that led to preparation of standard thermochemical databases
of thermodynamic data, solution calorimetric studies on complex halides of thorium with
alkali metals, generation of phase diagrams of halides, carbides, oxides etc. In so far as redox
investigations on thorium in high temperature melts are concerned, the following graph
(Figure 1.1) generated using Scopus database will suggest the importance of such studies in
the last 7 decades.
There has been an upsurge in these investigations during the early 2000s and it continues this
day. One of the reasons for this could be a renewed interest on thorium based reactor fuels,
re-looking at thermodynamic data of thorium based molten salts and phase diagrams. The
present work on electrochemical and thermodynamic investigations on thorium in LiCl-KCl
eutectic melt was taken up to address certain issues that mainly pertained to electrochemistry
of Th4+
, electrode kinetics and thermodynamics using combination of electromotive force and
transient technique measurements. Present thesis is restricted to electrochemical
investigations and thermodynamic investigations and making certain recommendations on
specific thermodynamic data.

2
Figure 1.1 Graph of publications versus year on studies carried out on thorium in molten
salts in the span of 1929-2019 across the world, Ref.: Scopus database, search words: Th and
molten; Th and fused.
1.2 Electrochemical and thermodynamic studies on thorium in molten salts: Literature
survey
With a large body of work pertaining to studies on thorium with respect to its redox
behaviour in molten salts, the present thesis focuses on investigations of electrochemical and
thermodynamic behaviour of ThCl4 in LiCl-KCl eutectic melt and Cd-Th alloys.
Electrochemical behavior of thorium in LiCl-KCl eutectic melt has been studied exhaustively
in the last five decades by various research groups across the world.
In late 50s, Smirnov et al. [1-4], and few other groups [5-7] in recent past have studied basic
electrochemical behavior of thorium in LiCl-KCl eutectic melt. Electrochemical and
thermodynamic studies on thorium in LiCl-KCl eutectic melt was also carried out by Chiotti
et al.[8-13]. Inman et al.[14], Yang et al. [15] and Gruen et al. [16] investigated on oxidation
state of thorium in LiCl-KCl eutectic melt. There was huge debate on the stable oxidation

3
state of thorium in molten halide medium and it continues to this day. Some authors
concluded that +4 is the only stable oxidation state of thorium in molten halide medium,
while few other groups reported the existence of more than one valence states in molten
halide mediums. Smirnov et al. [1-4] and Chiotti et al. [8-10] have observed formation of
Th2+
and Th3+
ions at very high temperature and low thorium concentration and summary of
experiments are described in Table 1.1. They postulated that thorium tetrachloride would be
reduced almost quantitatively by thorium metal according to the reaction:
4 2Th( )+ThCl ( ) 2ThCl ( )s melt melt (1.1)
However it was shown by several groups [5-7, 11-16] that +4 was the only stable valence
state of thorium in LiCl-KCl eutectic melt. Attempts to prepare ThCl3 and ThCl2 were
unsuccessful by Chiotti et al. [11, 13]. They didn’t find any evidence of formation of lower
valent thorium chlorides and concluded that both ThCl3 and ThCl2 must be metastable
relative to ThCl4. Smirnov et al. [17-21] and few other groups [22-24] carried out
investigations on valence state, complexation behaviour, electrochemical and thermodynamic
properties of thorium in various chloride melts. Studies by Smirnov et al. [17-21] reported the
existence of +2 and +3 valence states of thorium along with +4, whereas, Kanashin et al.[23],
Srinivasan et al. [24] and Tumidajski et al. [25] reported +4 is the only stable valence state of
thorium in various chloride melts as discussed in Table 1.1. Smirnov et al. [20] reported that
disproportionation of ThCl2 to Th metal and ThCl4 began above 923 K which was supported
by Hayek et al. [22], who observed that ThCl2 disproportionate when heated above 943 K.
Clayton et al. [26] and Chamelot et al. [27, 28] have studied electrochemical behaviour of
thorium in alkali fluoride melts and reported +4 as the only stable valence state of thorium.
Delpech et al. [29] have studied electrochemical behaviour of ThF4 in LiCl-KCl eutectic melt
and reported +4 as the only stable valence state of thorium. There is thus little or no

4
conclusive evidence for the formation of any stable lower valent thorium chlorides other than
ThCl4 in LiCl-KCl eutectic melt.
According to Martinot et al. [5] reduction of Th4+
was quasi-reversible process. Liu et al. [6]
observed reversible behaviour of Th4+
|Th couple. They observed nucleation controlled
deposition phenomena during reduction of Th4+
at tungsten working electrode. Cassayre et al.
[7] found it difficult to conclude about the reversibility of Th4+
|Th redox couple. Different
electrochemical properties like 4+Th |Th
appE , 4+ThD and Ea of Th
4+|Th couple in LiCl-KCl eutectic
melt were estimated using transient electrochemical techniques by several groups [5-7]. A
summary of the literature reports on the electrochemical studies on thorium in molten salts is
given in Table 1.1.
Table 1.1 Literature survey on electrochemical studies of thorium in molten salts.
System Reference(s) Summary
ThCl4 in LiCl-
KCl eutectic
melt
Smirnov et al.
[1, 2]
The polarization of Mo cathode was studied in LiCl-
KCl eutectic melt containing ThCl4 at 873, 973, 1073 K
and at relatively low current density reduction of Th4+
to
Th2+
was observed. Temperature and concentration
dependence of equilibrium potential of Th4+
|Th couple
was studied.
Smirnov et al.
[3, 4]
Metallic Thorium reduces ThCl4 to ThCl2 in LiCl-KCl
eutectic melt. Reversible potential of Th4+
|Th was
estimated.
Martinot [5] Electrochemical studies of Th4+
in LiCl-KCl eutectic
melt was carried out by transient techniques in
temperature range 673-773K; reduction was observed as
single step four electrons transfer process without any
intermediate step.
Liu et al. [6] Electrochemical behavior of Th4+
was studied at
tungsten, aluminum and bismuth electrodes in LiCl-KCl
eutectic melt, using transient techniques. Valence of Th
was estimated to be +4.
Cassayre et al.
[7]
Electrochemical properties of Th in LiCl-KCl eutectic
melt was studied using transient techniques. It was
observed that +4 is the stable valance state of Th.
Chiotti et al. [8] Experimental evidence for a valence state of three for
thorium chloride was investigated by oxidation-

5
reduction reaction in molten LiCl-KCl/Zn system.
Chiotti et al.
[9],
Dock [10]
Formation of lower valent states Th2+
and Th3+
of
thorium was proved in dilute solution of ThCl4 in LiCl-
KCl eutectic melt at 973 K by reaction given in
Equation 1.1.
Standard electrode potential and activity coefficient of
ThCl4 in LiCl-KCl eutectic melt were estimated by emf
technique.
Chiotti et al.
[11],
Fuller [12]
ThCl4-Th phase diagram was established and only Th
and ThCl4 phases were detected by XRD. No evidence
was found for either ThCl2 or ThCl3.
Chiotti et al.
[13]
No evidence for presence of lower valent thorium was
found from the experiment conducted in LiCl-KCl
eutectic melt. Th4+
was observed to be the only stable
ion in the melt.
Inman et al.
[14]
Number of electron exchanged for anodic dissolution of
Th was estimated 3.7-4.5 which corresponds to a
valence of +4.
Yang et al. [15] Valence of Th was estimated to be very close to +4
using emf technique.
Gruen et al.
[16]
No evidence of formation of Th2+
in LiCl-KCl-ThCl4
melt was found. There was no weight change of Th
metal by immersing it in the melt at 773 K for 4 h.
ThCl4 in
molten alkali
chlorides MCl
(M = Li, Na,
K, Cs), NaCl-
KCl, NaBr-
KBr, NaI-KI
Smirnov et
al.[17]
Th valence was estimated to be non-integral values
between 4 and 2 at higher temperature.
Kudyakov et al.
[18]
It was established that metallic thorium interacts with
Th4+
to form Th2+
in NaCl and NaCl-KCl melt, via the
reaction given in Equation 1.1.
Temperature dependence of apparent standard electrode
potentials of Th4+
|Th and Th2+
|Th was determined.
Smirnov et al.
[19]
Complexing behaviour of Th was studied by
potentiometry technique of dilute ThCl4 and ThCl2
solutions in alkali chloride melt.
Smirnov et
al.[20]
Electrode potentials of ThCl4 measured at various
concentrations of thorium chloride in temperature range
943-1123 K using direct gravimetric method in NaCl-
KCl eutectic melt. Disproportionation of ThCl2 to Th
metal and ThCl4 begins above 923 K.
Smirnov et al.
[21]
Standard electrode potential of Th4+
|Th and Th4+
|Th2+
couples were estimated in the temperature range of 950-
1100 K in NaCl-KCl eutectic melt.
Hayek et al.
[22]
ThCl2 disproportionate to Th metal and ThCl4 at 943 K.

6
Kanashin et al.
[23]
Chronopotentiometric reduction of Th4+
to Th metal
proved existence of only +4 as stable oxidation state of
thorium in NaCl-KCl eutectic melt.
Srinivasan et al.
[24]
Standard electrode potential of Th4+
|Th in NaCl-KCl
eutectic melt was measured by emf technique in the
temperature range 943-1123 K. Analysis of emf data
indicated +4 valence state of thorium.
ThCl4 in
molten alkali
chlorides MCl
(M=Na, K,
Cs), NaCl-
KCl, NaCl-
CsCl, KCl-
CsCl
Tumidajski et
al. [25]
Standard electrode potential of Th4+
|Th was measured
by emf technique. Slope of linear regression analysis for
the concentration term against the cell potential proved a
four electron electrode reaction.
Th4+
in molten
LiF-NaF-KF
and LiF-CaF2
medium
Clayton et al.
[26]
Reduction of Th4+
in LiF-NaF-KF at 773K was
observed to be four electron transfer reversible process.
Chamelot et al.
[27]
The electrochemical behaviour of the Th4+
|Th system
was examined in molten LiF–CaF2 medium on Mo, Ni
and liq. Cd electrodes. Experimental result showed that
ThF4 was reduced in a single step exchanging 4
electrons.
Chamelot et al.
[28]
At Mo electrode, thorium ions are reduced at a potential
of around -1.6 V versus the quasi-reference electrode
(QRE) in a single step exchanging four electrons,
yielding thorium metal in LiF-CaF2 eutectic melt.
ThF4 in LiCl-
KCl eutectic
melt
Delpech et al.
[29]
Studied electrochemical behaviour of ThF4 in LiCl-KCl
eutectic melt and reported +4 as the only stable
oxidation state of thorium.
1.3. Thermodynamic studies on Cd-Th alloys: Literature survey
Thermodynamic properties like activity and partial thermodynamic properties of Th in Cd-Th
alloys are of interest to understand the stability of these alloys in order to compare with Cd-U
and Cd-Pu systems as well as binary systems of Th with some elements such as Co, Fe, Ni
etc. Thermodynamic properties of Th alloys have been investigated by various groups [30-
43]. So far there is no thermodynamic data reported on Cd-Th intermetallics. This forms one
of the objectives of the present thesis described in detail in the next section. Preparation and
characterization of different Cd-Th intermediate phases were carried out by various groups

7
[44-52] and described in Table 1.2. Phase relationship of Cd-Th system investigated by
Palenzona [52] is shown in Figure 1.2.
Table 1.2 Literature survey on Cd-Th system.
Reference(s) Summary
Bates et al. [44] Solubility of Th in liquid Cd was measured in temperature range of
599-1021 K. Established phase relations and partial phase diagram
of Cd-Th system.
Johnson et al. [45] Solubility of Th in liquid Cd was measured over a temperature
range of 598-873 K.
Brown [46] Investigated crystal structure of Cd2Th and determined its lattice
parameters.
Bruzzone et al. [47] Determined crystal structure of Cd11Th.
Dutkiewicz et al. [48,
49]
Investigated Cd-Th phase diagram of Cd-rich region.
Fornasini et al. [50] Investigated crystal structure of Cd5Th and determined its lattice
parameters.
Fornasini et al. [51] Investigated crystal structure of Cd7Th6 and determined its lattice
parameters.
Palenzona et al. [52] Characterized six intermetallics (namely, Cd11Th, Cd5Th, Cd23Th6,
Cd3Th, Cd2Th and CdTh) of Cd-Th system and investigated their
crystal structures and lattice constant values. Established Cd-Th
phase diagram.
Figure 1.2 Cd-Th binary phase diagram given by Palenzona et al.[52].

8
1.4. Scope of present thesis
Flowchart of scope of work in the present thesis is shown in Figure 1.3. Three major works
were taken up which are described below
a) Redox behaviour of Th4+
|Th couple in LiCl-KCl eutectic melt using various
electrochemical transient techniques and electrochemical impedance spectroscopy (EIS):
Different electrochemical transient techniques such as cyclic voltammetry,
chronopotentiometry, square wave voltammetry etc. were employed to estimate
electrochemical and thermodynamic properties of Th4+
|Th couple. This work is described in
detail in Chapter 3. Studies were then extended to anodic dissolution of thorium electrode for
calculating theoretical equilibrium potential of Th4+
|Th couple, and further its mechanism was
investigated by EIS, in which complex impedance data was validated by Kramers-Kronig
transforms and fitted using equivalent circuit models. Anodic dissolution of thorium and
investigations on EIS are discussed in Chapter 5. Electromotive force measurements were
also carried out in LiCl-KCl-ThCl4 for estimating 4+Th h|TE and
4f ThClG . This data was then
compared with literature data as well as those obtained from cyclic voltammetric and
chronopotentiometric measurements in the present work and suitable recommendations
on 4+Th h|TE ,
4f ThClG and 4ThClln were made. This work is discussed in Chapter 6.
b) Estimation of i of Th4+
|Th couple at inert, cadmium and thorium electrodes in LiCl-KCl
eutectic melt: i of Th4+
|Th couple was estimated at different electrodes employing cathodic
and anodic polarization using Tafel and Allen-Hickling methods. i estimated at inert tungsten
electrode was compared with that obtained from cyclic voltammograms of LiCl-KCl-ThCl4.
Conclusions were derived from studying the temperature and composition dependence of i at
various electrodes. Similar investigations were carried out at liquid cadmium electrode as
well. These investigations are described in Chapter 4.

9
c) Electromotive force measurements in LiCl-KCl-ThCl4 electrolyte for determination of
m nf Cd ThG of Cd-Th intermetallics: Electromotive force measurements were carried out for
determining m nf Cd ThG of Cd-Th intermetallics and compared with estimations using
Miedema model. This work is discussed in Chapter 7.
Figure 1.3 Flowchart of scope of work in current PhD thesis.

10
CHAPTER 2
Experimental
This chapter provides brief descriptions of experimental set-up for handling moisture
sensitive salts, preparation and purification of LiCl-KCl eutectic mixture, preparation of
LiCl-KCl-ThCl4 electrolyte and fabrication of various types of electrodes for electrochemical
studies. Preparation and characterization of Cd-Th alloys are then discussed, and followed by
description of cell assembly of electrodes for transient and electromotive force measurements.
A brief description of electrochemical methods with relevant governing equations is then
provided. The chapter concludes with derivation of governing equations for
estimating4f ThClG and
m nf Cd ThG intermetallics by electromotive force measurements.
2.1 Argon atmosphere glove box set-up
An argon atmosphere glove box operated between +20 to +40 mm of water column (wrt
ambient) installed in our radioactive laboratory was used to handle moisture sensitive LiCl
salt and high pure metals such as Th and Cd and Cd-Th alloys. A layout and photograph of
the argon atmosphere glove box used for carrying out all experiments presented in the thesis
are shown by Figs. 2.1 and 2.2, respectively [53].
Glove box set up consisted of pressure control system comprising of photohelic gauge and
normally closed solenoid valves, recirculation system comprising of purification tower
(molecular sieves + copper de-oxo catalyst) and side-channel recirculation blower, and gas
analyzer system comprising of argon sampling pump and multi-trace gas analyzer for
measuring oxygen and dew point in recirculating argon. It was supported by an independent
feed and bleed system for controlling pressure between +20 to +40 mm of water column
(positive wrt ambient).

11
Figure 2.1 The layout of argon atmosphere glove box [53].

12
Figure 2.2 Photograph of argon atmosphere glove box used for carrying out experiments.
Internal peripherals of glove box consisted of storage vessels, electrode racks, chemical
storage units, pit-type furnace and electrical feedthroughs for connecting weighing module,
stirrer unit and furnace. The furnace was controlled by PID (proportional integral derivative)
temperature controller kept outside glove box. All operations inside the glove box were
carried out by butyl-rubber gauntlets on 6-inch glove port sealed by tightly fitted over it by
neoprene o-ring. The glove box was also supported with an extension port assembly for
taking materials in and out of the glove box. Since no plutonium based materials were
handled in this box, it was not necessary to take the materials out in sealed PVC bags. The
transfer port door was always kept in sealed condition irrespective of whether any material
transfer was done. Before it was opened for any transfer in operation, the extension port was
closed and alternately pressurized and evacuated multiple times to improve purity of volume
of air locked inside the extension port. A similar procedure was followed for material transfer
out operation. At no stage during the transfer in/out operation was the argon atmosphere of
glove box was in direct contact with the ambient.

13
2.2 Chemicals and preparation of electrolytes
2.2.1 Chemicals
All chemicals used in the present measurements were of analytical grade. Anhydrous lithium
chloride (˃98%) was obtained from Sigma-Aldrich (CAS 7447-41-8) and anhydrous
potassium chloride was obtained from Alfa-Aesar (CAS 7447-40-7). CdCl2 was obtained
from Acros Organics (99%). Cadmium (>99.95 %) shots (≈ 3 mm dia.) were obtained from
Arora Matthey, Kolkata. Anhydrous AgCl was obtained from Sigma-Aldrich (>99.9%). Th
ingot (>99.5%) was obtained from BARC, Mumbai, purity of which was checked by ICP-MS,
discussed later in this chapter. It was polished by sand paper and diamond coated file and
cleaned by dilute acid and acetone before use.
2.2.2 Preparation and purification of LiCl-KCl eutectic melt
Measurements reported in this work were carried out in LiCl-KCl eutectic melt. As per the
phase diagram of LiCl-KCl binary system, the eutectic composition and temperature are
known at 58.5 mol% LiCl and 625 K, respectively. Anhydrous LiCl (Sigma-Aldrich) and
KCl (Alfa-Aesar) were mixed in eutectic ratio and vacuum dried at 420 K for about 120 h. It
was then taken in 100 g batches and loaded in recrystallized alumina crucible that was then
placed into a bottom-end closed quartz vessel with a PTFE Teflon flange. The vessel was
sealed from the top by another teflon flange with neoprene O-ring gasket. The top flange had
provision for inserting ¼ʹʹ quartz tubes through veeco couplings also made of teflon. One
veeco was used for connecting it to inlet chlorine gas line, and the other was used for the
outlet stream. The third veeco was sealed by another quartz tube closed by glass stopper in
order to use it in cases when either of the inlet and outlet tubes was choked. The outlet tube
was connected to NaOH scrubber for neutralization of excess chlorine gas. The complete set-
up was made inside a FRP fume hood having an exhaust system for chlorine. A chlorine

14
detector with an alarm system was installed near the set-up to display chlorine level near and
around the set-up. Photograph of chlorination set-up is shown in Figure 2.3.
Figure 2.3 Photograph of chlorination set-up made of quartz vessel and teflon flanges.
Presence of moisture in melt deteriorates its purity, and may lead to formation of
electroactive species such as hydroxides and oxides that may chemically react with other
chlorides. LiCl undergoes high temperature hydrolysis to form LiOH and leads to large
residual current in the potential range within which electrorefining operation is carried out. In
order to remove such impurities, HCl or chlorine gas has been used in the past to purify the
eutectic melt [54]. In pyroprocessing laboratory, purification of eutectic mixture is carried out
by chlorine gas. The process of chlorination involved heating the eutectic mixture and
melting it under argon atmosphere and bubbling chlorine gas (Specification of chlorine: as
per IS: 646-1986) at a flow rate 10-25 ml/min into it at 773 K for 1 h to drive off any residual
moisture present in the melt. The eutectic melt after chlorine bubbling was cooled to room
temperature under argon atmosphere, and then taken inside glove box and stored. In a similar
manner, several batches of chlorinated LiCl-KCl eutectic melt were prepared. Impurity
analysis in chlorinated LiCl-KCl eutectic was carried out by inductively coupled plasma
atomic emission spectrometry (ICP-AES), which is shown in Table 2.1.

15
2.2.3 Preparation of LiCl-KCl-ThCl4 electrolyte
LiCl-KCl-ThCl4 electrolyte was prepared by equilibration of cadmium chloride (CdCl2) and
thorium slices in LiCl-KCl eutectic melt at 773 K (Equation 2.1) in argon atmosphere glove
box. Standard Gibbs energy of the reaction at 773 K with ThCl4 in solid reference state is
-413.2 kJ mol-1
, when ThCl4 is in liquid reference state, Gibbs energy of reaction is -403.3 kJ
mol-1
.
2 4Th( ) 2CdCl ( ) ThCl ( ) 2Cd( .)s s s liq (2.1)
Equilibration was carried out for about 30 h at 773 K. After completion of equilibrium step,
LiCl-KCl-ThCl4 was poured into a fused silica rectangular dish and stored in glove box as
stock solution. From the stock solution prepared, dilute solutions of ThCl4 in LiCl-KCl
eutectic melt were prepared for different studies. Concentration of ThCl4 ranged from 0.3 to
1.55 wt%. LiCl-KCl-ThCl4 salt was characterized by XRD. Sample for XRD characterization
was prepared by grinding the salt in a mortar-pestle and a one-end closed capillary tube
(Borokapillaren, BGCT 1.0, I.D.: 1.0 mm, thickness: 0.01 mm) was filled with salt powder
upto 25mm height. Top of the capillary was broken and sealed with molten wax. XRD
pattern of LiCl-KCl-ThCl4 electrolyte recorded by X-ray powder diffraction (XRD) using Cu
Kα radiation (Panalytical X′Pert Pro) is shown in Figure 2.4. Bragg peaks were identified to
be LiCl, KCl and ThCl4 phases present in the salt [55, 56]. Appearance of broad peak in 2θ
region of 10-30° may be due to capillary glass used in recording XRD. Impurity analysis in
LiCl-KCl-ThCl4 salt was carried out by ICP-MS technique and values are tabulated in Table
2.1.

16
Table 2.1 Impurity analysis in chlorinated LiCl-KCl (sample weight: 475.5 mg) eutectic by
ICP-AES and LiCl-KCl-ThCl4 salt by ICP-MS technique (sample weight: 70 mg).
LiCl-KCl (μg/g) Cr Cu Fe Mo Ni Zn Sn
42
42 42
42 63 84 42
LiCl-KCl-ThCl4
(μg/g)
Mo Zr Cd Sn Pb Y La Ce U
22 1 5 14 2 ˂1 ˂1 ˂1 ˂1
Figure 2.4 XRD pattern of LiCl-KCl-ThCl4 electrolyte (Numbers in parenthesis correspond to
miller indices).
2.2.4 Preparation of LiCl-KCl-AgCl electrolyte
LiCl-KCl-AgCl electrolyte for Ag+|Ag reference electrode was prepared by dissolving 1 g of
AgCl in 100 g of chlorinated LiCl-KCl eutectic melt by bubbling Cl2 at 773 K for 3 h. The
salt was cooled to room temperature under Argon cover and stored in glove box.
2.2.5 Estimation of Th, Cd and Ag in LiCl-KCl eutectic melt
Th in LiCl-KCl-ThCl4 electrolyte was estimated using HPLC [57]. Concentration of
cadmium in the salt was estimated by inductively coupled plasma-mass spectrometry (ICP-
MS) (Spectro MS, MSS001). Cadmium was estimated to be 29 µg/g of LiCl-KCl eutectic.
Estimation of silver in LiCl-KCl-AgCl electrolyte was carried out by ICP-AES [58]. Ag
concentration in salt was estimated to be 0.89 wt%.

17
2.3 Cd-Th alloys
2.3.1 Preparation of Cd-Th alloys
Cd-Th alloys were prepared by equilibration of thin Th slices and Cd shots at 773 K for 300 h
in argon atmosphere. Impurity analysis in Th and Cd were carried out by inductively coupled
plasma optical emission spectrometry (ICP-OES), inductively coupled plasma mass
spectrometry (ICP-MS) and atomic emission spectrometry (AAS) techniques before
preparation of Cd-Th alloys. Results of impurity analysis are given in Table 2.2. Impurity
level in Th metal (Table 2.2) is similar to impurity values reported by Skelton et al. [36] for
thermodynamic studies of Co-Th alloys. XRD patterns of Th and Cd recorded by X-ray
diffraction (XRD) using Cu Kα radiation (Panalytical X′Pert Pro) are shown in Figure 2.5.
Very small intensity Bragg peak of ThO2 was appeared in XRD pattern of Th (Figure 2.5a),
due to partially oxidized Th surface. All Bragg peaks in Figure 2.5b were found to be due to
Cd phase. Stoichiometric amount of Th slices and Cd shots were loaded in recrystallized
alumina crucible which was kept inside a specially designed leak tight high pure iron vessel.
Iron vessel was then loaded into an electrochemical cell and heated to 773 K for 300 h.
Weight loss of alloys after equilibration process was ˂5wt%. This weight loss of Cd-Th
alloys was attributed to vaporization of Cd inside iron vessel during equilibration. Weight
loss during melting, after polishing of alloy surface by diamond filing for each alloy is
tabulated in Table 2.3. Pure iron vessel and a Cd-Th alloy are shown in Figure 2.6.
Table 2.2 Impurity analysis of Cd by ICP-OES and AAS techniques (sample weight: 220.22
mg) [59] and of Th by ICP-MS (sample weight: 27 mg).
Cd
Impurities Cr Cu Fe Ni Mo Sn Zn
AAS + ICP-
OES (μg/g) 11 11 11 57 45 45 91
Th Impurities Mg Al Zn Pb Ba Sr Ag U
ICP-MS (μg/g) 382 73 1382 31 117 64 1 61

18
Table 2.3 Weight balance of Cd-Th alloys before and after equilibration.
Alloy
Wt.
of Th
(g)
Wt. of
Cd
(g)
Total wt. (g) Wt.
loss
(%)
Wt. after
polishing
(g)
Final
Wt.
loss
(%)
Before
equilibration
After
equilibration
Cd+Cd11Th 0.756 4.379 5.135 4.913 4.3 4.620 5.9
Cd11Th+Cd5Th 1.895 5.205 7.100 6.800 4.2 6.400 5.9
Cd5Th+Cd23Th6 2.520 5.205 7.725 7.563 2.1 7.218 4.5
Cd23Th+Cd3Th 2.781 4.511 7.292 7.143 2.0 6.881 3.7
a b
Figure 2.5 XRD pattern of (a) Th and (b) Cd metals (Numbers in parenthesis correspond to
miller indices).
Figure 2.6 Photographs of (a) iron vessel before and after loading with Th and Cd, (b) Cd-Th
alloy after cleaning by diamond filing.

19
2.3.2 Phase characterization of Cd-Th alloys
Phase characterization of Cd-Th alloys were carried out using X-ray powder diffractometer
(M/s Inel, France) with Cu Kα radiation and XRD patterns are shown in Figure 2.7. Samples
of Cd-Th alloys for XRD characterization were prepared by making fine powder of alloys by
grinding them in mortar-pestle inside argon atmosphere glove box and then filled in one-end
closed capillary tube (Borokapillaren, BGCT 1.0, I.D.: 1.0 mm, thickness: 0.01 mm) upto
25mm height. Top of the capillary was broken and sealed with molten wax. Respective Bragg
peaks for Cd11Th, Cd5Th, Cd23Th6 and Cd3Th phases are shown in the figures [52].
a b
c d
Figure 2.7 Powder XRD patterns of (a) Cd + Cd11Th, (b) Cd11Th + Cd5Th, (c) Cd5Th +
Cd23Th6, (d) Cd23Th6 + Cd3Th two-phase alloys, Step size: 0.05° (Numbers in parenthesis
correspond to miller indices).

20
2.4 Electrodes and cell assembly
2.4.1 Electrodes for transient electrochemical measurements
1.5 mm dia. inert tungsten wire, liquid cadmium and thorium were used as working
electrodes in transient electrochemical measurements. Th electrode (shown in Figure 2.8) was
prepared by winding 0.5 mm dia. Ta (>99.95%) wire around Th slice and crimping the wire
to a SS-304L rod for electrical connections.
Figure 2.8 Thorium electrode used in the present work.
Liquid cadmium electrode was designed and fabricated in our laboratory and shown in Figure
2.9. It consisted of a SS-430 perforated basket (OD: 22 mm, ID: 19 mm, Height: 23 mm)
with an alumina crucible (OD: 16 mm, ID: 14 mm, Height: 20 mm, Tempsens Instruments
make) inside it. A 2 mm dia. SS-430 wire was welded to the perforated basket at
diametrically opposite ends. The other end of the wires was welded to a SS-304 tube (OD: 6
mm, ID: 4 mm). 1 mm dia. Mo wire (> 99.9 %) was insulated with an alumina sleeve (OD: 3
mm, ID: 2 mm, Ants Ceramics make) leaving 2-4 mm at the bottom for electrical connection
in Cadmium. The top end was sealed with a teflon plug. The top end of Mo wire was left
uninsulated for electrical connection. The cadmium pool of the electrode was prepared as
given below. About 500 mg of cadmium shots was initially taken in the alumina crucible of
the electrode assembly. The perforated basket containing the alumina crucible was then
immersed in blank LiCl-KCl eutectic at 773 K. Cadmium shots were regularly added in the

21
alumina crucible after the electrode assembly was taken out from the molten salt, which was
repeated several times until a shining cadmium surface was seen at the top of the alumina
crucible as shown in Figure 2.9. The electrode area of the cadmium surface was calculated
from the area of the annular gap between the alumina sleeve and the alumina crucible. This
was found to be 1.47 cm2.
Figure 2.9 Liquid cadmium electrode.
8 mm dia. high density graphite rod was used as a counter electrode. Ag+|Ag was used as the
reference electrode. Reference electrode was prepared using a one end closed 6.0 mm
diameter quartz tube with a thin walled bulb at the bottom. Top end of the quartz tube was
sealed by PTFE teflon plug and a high purity Ag wire ((˃99.9%, 1.5 mm diameter) was
inserted inside the quartz tube for electrical connection through the hole in the teflon plug
which was then sealed by adhesive (Araldite). This quartz tube with Ag wire was taken inside
glove box where LiCl-KCl-AgCl salt powder was loaded inside it. All potential reported in
this thesis were recorded with respect to this reference electrode.
2.4.2 Electrodes for electromotive force measurements
Th as working electrode and Ag+|Ag as reference electrode were used for galvanic cell emf
measurements on ThCl4 in LiCl-KCl eutectic melt. Photographs of electrodes used for
measurements are shown in Figure 2.10. Th and Cd-Th two-phase alloy were used as

22
electrodes for estimation of Gibbs energy of formation Cd-Th alloys by galvanic cell emf
measurements. These electrodes were prepared by loading Th metal and Cd-Th two phase
alloy into two tantalum cups (dimension: 6 mm dia. and 15 mm height) separately and these
tantalum cups were crimped with tantalum wire of 1.5 mm dia. One tantalum crucible was
loaded with 1 g of thorium slice and other with 1g of Cd-Th two-phase alloy. Tantalum wire
was insulated from electrochemical cell by alumina sleeve. Electrode assembly used in the
emf measurements is shown in Figure 2.11.
Figure 2.10 Electrode assembly used in emf study of ThCl4 in LiCl-KCl eutectic melt.

23
Figure 2.11 Electrode assembly used in emf study of Cd-Th alloys.
2.5 Measurement methodology
2.5.1 Transient techniques and EIS study
Electrochemical measurements of LiCl-KCl-ThCl4 were carried out using a three electrode
cell assembly consisted of an SS-304 electrochemical vessel and a top knife-edge flange (CF-
63, M.S. Enterprises, Secunderabad) having veeco couplings used for inserting electrodes and
thermocouple. The bottom vessel (SS-304, 2″ dia, Sch 10) consisted of a knife-edge flange
welded at the top and closed at the bottom end using a bottom-end cup (SS-304). Schematic
of the electrochemical cell assembly is shown in Figure 2.12. Vacuum degassing of the cell
was done to remove moisture inside the cell prior to electrochemical measurements. High
density graphite (1.85 g cm-3
) electrodes were loaded inside electrochemical cell through
three 1/8″ veecos and 1/4″ veecos were closed by 6 mm dia. teflon rod. Then the
electrochemical cell was placed inside a pit type resistance heating furnace and was
connected to a rotary vacuum pump. After vacuum degassing of the cell it was cooled and
taken inside glove box.

24
Figure 2.12 Schematic of electrochemical cell assembly.
Electrochemical cell was loaded with electrolyte salt, reference electrode; counter electrode
and working electrode inside argon atmosphere glove box. A K-type thermocouple (3 mm
dia., Precision Scientific, Chennai) in an alumina thermowell (OD: 6 mm, Wall thickness:1
mm, Ants Ceramics make) was used to monitor temperature of melt, the uncertainty in
temperature measurement was ±1 K. Electrochemical cell was then taken out from the glove
box and placed inside a pit-type muffle furnace. The cell was heated in a vertical furnace to
desired temperature. Temperature was controlled by a PID (proportional integral derivative)
temperature controller (make-Bonics Systems, Chennai). Argon gas was passed through a
calcium getter at 823 K before purging through electrochemical cell. A photograph of the cell
used in present is shown in Figure 2.13.

25
Figure 2.13 Photograph of electrochemical cell loaded with electrodes.
Transient electrochemical techniques like cyclic voltammetry, chronopotentiometry,
squarewave voltammetry and polarization measurements were carried out using PGSTAT
AUTOLAB302N (Eco Chemie, Netherlands) with IF030 interface. Data were processed
using GPES 4.9 software and FRA 4.9 software.
2.5.2 Polarization technique
Polarization phenomena typically results in a change in the potential of an electrode during
electrolysis. Polarization can occur in three ways: Concentration polarization, Resistance
polarization and Activation polarization. At equilibrium potential net flow of current is zero
because rate of oxidation and reduction processes of any electrochemical system are equal at
this potential. When the electrode potential is shifted to either side of equilibrium potential,
there is a net flow of current, because one of the two processes dominating the other. If the
electrochemical system is facile in kinetics (Reversible) then there is large flow of current in
negligible change of potential. For electrochemical systems with slow electrode kinetics
minimum flow of current is observed for appreciable quantity of potential change. The extra
potential applied over equilibrium potential is called overpotential (η). When applied
overpotential is due to slow electrode kinetics of the system, it is called activation
overpotential. Polarization experiments are carried out by applying overpotential in the range

26
of 0-200mV for a specific time. For each polarization scan resulting current at that specific
time is recorded. Current-overpotential relationship in polarisation study is given by Butler-
Volmer Equation 2.2 [60].
(1 )n F n F
RT RTi i e e
(2.2)
At large cathodic and anodic overpotentials (η), Butler-Volmer Equation can be simplified to
Equations 2.3 and 2.4 respectively, which are called Tafel Equations.
ln lnRT RT
i in F n F
(2.3)
ln ln(1 ) (1 )
RT RTi i
nF nF
(2.4)
Plot of η versus ln i is called Tafel Plot. Intercept and slope values are called Tafel constants.
Tafel constants Tafela and Tafelb for cathodic overpotentials are given by,
Tafel Tafelln andRT RT
a i bn F n F
Tafel constants Tafela and Tafelb for anodic overpotentials are given by,
Tafel Tafelln and(1 ) (1 )
RT RTa i b
nF nF
Good Tafel relationship is observed when electrode kinetics is sluggish and significant
activation over potential is required. For electrode reactions that are not totally irreversible
polarization data at lower overpotential values are best fitted using Allen-Hickling Equation
2.5 [60]. The slope of Equation 2.5 is represented as Allen-Hicklingb in present work.
ln ln
1nF
RT
i n Fi
RTe
(2.5)

27
Errors in the Tafel and Allen-Hickling constants were obtained from linear fit of
experimental data using Equations 2.3, 2.4 and 2.5. Error in ln i was estimated from standard
error propagation methods discussed by Taylor [61]. For example, using the expression for
Tafel constant Tafela , error in ln i is given by,
Tafelln i C a (2.6)
Where, C is a constant given by n F
RT
and
(1 )nF
RT
for cathodic and anodic polarization
data, respectively. In case of Allen-Hickling equation (Equation 2.5), error in ln i was
directly obtained from the linear fit of ln .
1nF
RT
ivs
e
profile.
Polarization measurements were carried out to estimate the exchange current density of
thorium at inert and liquid cadmium (cathodic polarization) and for thorium electrode (anodic
polarization). In all these measurements, graphite rod was chosen as the counter electrode.
Cathodic or anodic polarization of working electrode consisted of applying a constant applied
potential 1iE =1for t=30 s and recording i versus t curve. i at t=30 s was recorded against
applied potential 1iE . This procedure was repeated for other applied potentials, 2iE , 3iE ; i
versus E was then plotted to obtain the polarization curve for a particular working electrode.
It was ensured that the open-circuit potential of the working electrode remained constant for
every polarization run. This was achieved by having a waiting period between the
polarization runs or by carrying out several cyclic voltammetric runs at high scan rates to
clean the inert electrode of any electrodeposited thorium. Similar electrochemical cell as
shown in Figure 2.12 was used for polarization experiments.
2.5.3 Electrochemical impedance spectroscopy
EIS was carried out by applying various DC potentials at inert tungsten, liquid cadmium and
metallic thorium electrodes using a perturbation signal of amplitude 10 mV in the frequency

28
range 10 Hz-10 kHz. Complex impedance plots were recorded in the temperature range 698-
798 K. Complex impedance data were also validated by Kramers-Kronig transforms using
Boukamp's freely available KK-Windows program [62] based on his earlier works [63, 64].
Validation is performed by calculating the imaginary part of the impedance from
experimentally measured real part and then comparing it with experimentally measured
imaginary part. Similarly, real part of impedance can be calculated from imaginary part and
comparing it with real part that is experimentally measured. This dependence between the
real ZRe (ω) and imaginary ZIm (ω) parts of impedance are given by Kramers-Kronig
transform integrals and are given by Equation 2.7 and 2.8.
Im ImRe 2 2
0
( ) ( )2( )
xZ x ZZ R dx
x
(2.7)
Re ReRe 2 2
0
( ) ( ) ( )2( )
Z x ZZ dx
x
(2.8)
Deviation from Kramers-Kronig compliance can be examined from the plot of real and
imaginary residuals (∆Re,i and ∆Im,i) versus logarithm of angular frequency given by
Equations 2.9 and 2.10.
Re, Re
Re,
( )
| ( ) |
i i
i
i
Z Z
Z
(2.9)
Im, Im
Im,
( )
| ( ) |
i i
i
i
Z Z
Z
(2.10)
A random distribution along frequency axis and low pseudo χ2 value are indicative of
compliance of K-K transforms. Complex impedance plots were also fitted using non-linear
least squares method to an equivalent circuit model comprising of electrolyte resistance sR ,
charge transfer resistance Rct and constant phase elements Q1 and Q2 as shown in Figure 2.14.
The frequency range of fitting was 10 Hz-10 kHz for inert tungsten and 10 Hz-5 kHz for

29
liquid cadmium and thorium electrodes. Admittance Y of constant phase element is given by
the following expression [65]:
cos sin2 2
m m
Q Q
m mY Y jY
(2.11)
Figure 2.14 Equivalent circuit used for fitting complex impedance data for cathodic
polarization of thorium at inert tungsten and cadmium electrodes and anodic polarization of
metallic thorium electrode.
CPE is a general equivalent circuit component that can represent a resistor, capacitor or
Warburg diffusion based on the value of m. For 0m and 1, it represents a resistor and
capacitor, respectively whereas, it represents Warburg diffusion for 0.5m . For 1m , it
represents an inductance. EIS measurements were carried out in electrochemical cell as
shown in Figure 2.12.
2.5.4 Electromotive force measurements
2.5.4.1 emf measurement of ThCl4 in LiCl-KCl eutectic melt
Electromotive force measurement study was carried out on ThCl4 in LiCl-KCl eutectic melt
in the temperature range 673-798 K using molten salt galvanic cell. Schematic of the galvanic
cell is given in Figure 2.15. Standard electrode potential and partial molar Gibbs energy of
formation of ThCl4 in LiCl-KCl eutectic melt was calculated from emf data. Equilibrium
potential 4+
eq
Th |ThE between Th
4+|Th and Ag
+|Ag reference electrode in LiCl-KCl-ThCl4
electrolyte was measured by constructing the following galvanic cell:
4
mel 4 ef.t rTh|Th ||LiCl-KCl-ThCl A|| Ag g|

30
The half-cell reactions are given by:
4+ -
meltTh Th +4e (2.12)
+ -
refAg +e Ag (2.13)
Overall cell reaction is given by,
4ref meltTh+4 AgCl ThCl +4Ag (2.14)
Equilibrium potential 4+
eq
Th |ThE of Th
4+|Th versus Ag
+|Ag is related to Gibbs energy of
formation of ThCl4 and AgCl by Equation 2.15 and is given by,
4reaction f ThCl f AgCl4G G G
4+4 4
eq
f ThCl ,LiCl-KCl ThCl f AgCl AgClTh |Th4 ln 4 lnFE G RT a G RT a
4+ 4+4 4
eq
ThCl ThCl AgCl AgCl AgClTh |Th Th |Th4 4 ln 4 ln lnFE FE RT x FE RT x RT (2.15)
Equation 2.15 may be further simplified by substituting the value of AgCl 1 assuming ideal
behaviour of AgCl in LiCl-KCl eutectic melt, as discussed by several authors [66-69] and
incorporating negative sign within 4+
eq
Th |ThE and 4+Th |Th
E .
4+ 4+4 4
eq
AgCl AgCl ThCl ThClTh |Th Th |Th+ ln = ln ln
4 4
RT RT RTE E x E x
F F F (2.16)
Therefore, 4+Th |ThE can be estimated from the linear least squares fit of
4+
eq
AgCl AgClTh |Th+ ln
RTE E x
F
versus 4ThClln x and is extrapolated to
4ThClln 1x . This method is
based on the work of Roy et al. [70, 71]. From the linear fits at various temperatures, we can
obtain the temperature dependence in 4+Th |ThE given by
4+ 11 11Th |ThE a b T (2.17)
We can again re-write Equation 2.16 as follows,

31
4+ 4+4 4
eq
AgCl AgCl ThCl ThClTh |Th Th |Th+ ln - ln = + ln
4 4
RT RT RTE E x x E
F F F (2.18)
From linear least square fit of 4+4
eq
AgCl AgCl ThClTh |Th+ ln - ln
4
RT RTE E x x
F F
versus 4ThClx and
extrapolating to 4ThCl 0x , we can estimate 4+Th |Th
E that can be referred to be for ThCl4 at
infinite dilution in LiCl-KCl eutectic melt. Equation 2.18 is based on the work of Lantelme et
al. [72-74]. Similar to that described above, linear fits at different temperatures can be used to
estimate the temperature dependence in 4+Th |ThE given by,
4+ 21 21Th |ThE a b T (2.19)
In order to convert 4+Th |ThE versus Ag
+|Ag to Cl
-|Cl2, following expressions for
AgClE and
AgClE by Yang et al. were used [69, 75]:
-
AgCl 2 AgCl AgCl.Cl |Cl ln/ V
RTE vs E x
F
(2.20)
-4
AgCl 1.0931 + 2.924 10 (K)E T (2.21)
Choosing a hypothetical supercooled liquid ThCl4 as reference state, 4ThCl can be estimated
from following expression for partial excess Gibbs energy of ThCl4,
44 4 4
ThCl ThCl f ThCl ,LiCl-KCl f ThCl ,liq.lnex
G RT G G (2.22)

32
Figure 2.15 Schematic diagram of emf cell set-up.
2.5.4.2 emf measurements on Cd-Th alloy
Measurement of Gibbs free energy of formation of Cd11Th, Cd5Th, Cd23Th6, Cd3Th alloys
were carried out by constructing four different galvanic cells, configurations of which are
given below by cell I, II, III and IV respectively,
4+
I 11T4 hCell I (E ) : Th|Th | || Cd| LiCl-KCl-ThCl + Cd Th
s
4+
II 4 11 5Cell II (E ) : Th|Th || LiCl-KCl-ThCl Cd + Cd|| Th Ths s
4+
II 4 5 23 6ICell III (E ) : Th|Th || LiCl || Th-KCl-ThCl Cd + Cd Ths s
4+
IV 4 23 36Cell IV (E ) : Th|Th || LiCl- || TKCl-ThCl Cd + hCdh Ts s
Equilibrium reaction at cell I can be established as follows:
Reference Electrode: 4+ -
saltTh( ) Th 4es (2.23)
Working electrode: 4+ -
salt 11Th 4e 11Cd ( .) Cd Th ( .)liq liq (2.24)
Overall reaction: 11Th ( )+11Cd( .) Cd Th ( .)s liq liq (2.25)

33
11f Cd ThG of Cd11Th from α-thorium and liquid cadmium is related to cell emf, EI, Tha and ThG
by Equations 2.26 – 2.28.
Th Th Th IG G G nFE (2.26)
Th ThlnG RT a (2.27)
11f Cd Th Cd11 lnIG nFE RT a (2.28)
Saturated solution of Cd-Th system is so dilute that the solution can be assumed ideal with
respect to cadmium and Equation 2.28 can be re-written as Equation 2.29 by
replacing CdlnRT a with CdlnRT x . From solubility data of thorium in liquid cadmium
available in literature [44] was used to compute concentration of cadmium in equilibrium
with Cd11Th.
11f Cd Th Cd11 lnIG nFE RT x (2.29)
Cell reaction at equilibrium condition for Cell II can be represented as,
11 5
5 11Th ( ) + Cd Th ( ) Cd Th ( )
6 6s s s
Equation for calculation of standard Gibbs energy of formation (5
°
f ThCdG ) of Cd5Th alloy is
given by Equation 2.30, which can be derived as follows:
5 11reaction f Cd Th f Cd Th
11 5
6 6G G G
5f Cd Th Cd
11 54 ( 4 11 ln )
6 6II IFE G FE RT x
5f Cd Th Cd
6 54 4 ln
11 6II IG FE FE RT x
5f Cd Th Cd
4 6(6 5 ) ln
11 11II I
FG E E RT x (2.30)
Equilibrium reaction of cell III can be represented as follows:
5 23 6
23 5Th ( ) + Cd Th ( ) Cd Th ( )
7 7s s s
Standard Gibbs energy of formation of Th6Cd23 alloy (6 23f Th CdG ) was calculated using
Equation 2.31, which was derived as follows.

34
23 6 5reaction f Cd Th f Cd Th
5 23
7 7G G G
23 6f Cd Th Cd
5 23 4 64 (6 5 ) ln
7 7 11 11III II I
FFE G E E RT x
23 6f Cd Th Cd
7 4 1384 138 115 ln
5 77 77III II I
FG FE E E RT x
23 6f Cd Th Cd
4 138(77 138 115 ) ln
55 55III II I
FG E E E RT x (2.31)
Equilibrium reaction of cell IV is shown below.
6 23 3
3 23Th (s) + Th Cd (s) ThCd ( )
5 5s
Expression of standard Gibbs energy of formation of Cd3Th (3
°
f Cd ThG ) alloy is given by
Equation 2.32 which is derived as follows.
3 23 6reaction f Cd Th f Cd Th
23 3
5 5G G G
3f Cd Th Cd
23 3 4 1384 (77 138 115 ) ln
5 5 55 55IV III II I
FFE G E E E RT x
3f Cd Th Cd
5 4 3 4144 77 138 115 ln
23 5 55 275IV III II I
FG FE E E E RT x
3f Cd Th Cd
138 1154 5 21 3 18ln
5 23 5 23 11 55
II IIV III
E EFG E E RT x
3f Cd Th Cd
25 21 18 154 18ln
5 23 11 55
IV III II IE E E EF
G RT x
(2.32)

35
CHAPTER 3
Redox behaviour of Th4+
in LiCl-KCl eutectic melt using transient
Techniques
Results and discussions
Chapter 3 describes investigations on Th4+
|Th redox couple in LiCl-KCl eutectic melt using
variety of electrochemical transient techniques to estimate electrochemical and
thermodynamic properties of the redox couple. Theoretical equilibrium potential of Th4+
|Th
couple was estimated and compared with those measured from anodic dissolution of thorium
electrode. This is followed by investigations on redox behaviour of Th4+
at liquid cadmium
electrode and influence of CdCl2 on cyclic voltammograms of LiCl-KCl-ThCl4 at inert
tungsten electrode. The chapter concludes with simple investigations on disproportionation of
Th4+
in the eutectic melt, comparison with literature and corrosion of alumina crucible while
handling dilute solutions of ThCl4 in LiCl-KCl eutectic melt during the course of
measurements reported in this thesis.
3.1 Cyclic voltammetry (CV) at inert tungsten electrode
Cyclic voltammogram of blank LiCl-KCl eutectic melt at inert tungsten electrode at 698 K in
the potential region of -2.46 to 1.27 V is shown in Figure 3.1. Redox couples ( 'A|A ) at -2.4 V
and ( 'C|C ) at 1.26 V were due to Li+|Li and Cl
-|Cl2 couples, respectively [7]. Redox couple
( 'B|B ) at potential -1.62 V (reduction) and -1.44 V (oxidation) in cyclic voltammogram
(Figure 3.1) recorded for 9.53×10⁻⁵
mol cm-3
of ThCl4 in LiCl-KCl eutectic melt at 698 K on
tungsten electrode is due to Th4+
|Th couple. Cyclic voltammograms of ThCl4 at tungsten
electrode was recorded at scan rates 3-500 mV s-1
. Figure 3.2 shows recorded cyclic
voltammograms of ThCl4 at 723 K for scan rates 3-10 mV s-1
. A consistent cross-over of
cathodic and anodic sweep was observed at -1.563 V and -1.524 V pointing to nucleation of

36
metallic Th at tungsten electrode. However, this phenomenon was not investigated in the
thesis.
Figure 3.1 Cyclic voltammograms of blank LiCl-KCl eutectic melt and LiCl-KCl-ThCl4 at
inert tungsten electrode, T= 723 K, 4
-5 -3.53 19 0 ThCl molC cm , A= 0.25 cm2.
Figure 3.2 Cyclic voltammograms of Th4+
|Th couple at inert tungsten electrode in LiCl-KCl
eutectic melt for scan rates 3-10 mV s-1
, T= 698 K, 4
-5 -3.53 19 0 ThCl molC cm , A= 0.25 cm2.
Cyclic voltamograms of ThCl4 in LiCl-KCl eutectic melt of different ThCl4 concentrations
(2.04×10⁻⁵
, 2.72×10⁻⁵
and 9.53×10⁻⁵
mol cm-3
) were recorded at various scan rates (10-500

37
mV s-1
) at inert tungsten electrode in the temperature range of 698-803K. Cyclic
voltammograms recorded for 2.04×10⁻⁵
mol cm-3
ThCl4 at 723 K are shown in Figure 3.3. In
Figure 3.3 it is found that there is shift of cathodic peak potential by -30 mV from scan rate
10 to 300 mV s-1
. However, potential shift is quite apparent beyond 200 mV s-1
.
Figure 3.3 Cyclic voltammograms of Th4+
|Th couple at inert tungsten electrode in LiCl-KCl
eutectic melt, T= 723 K, 4
-5 -31 2.04 0ThCl molC cm , A= 0.25 cm2.
pcE and /2( )p p cE E values at various scan rates from cyclic voltammogram recorded in
temperature range 698-803 K are shown in Table 3.1. For a reversible electrochemical
system pcE and /2p p cE E for cathodic process remains constant with scan rates and for
irreversible system large cathodic shift is observed. Therefore, small variation of pcE and
/2( )p p cE E values suggests the quasireversible nature of Th4+
|Th redox couple at scan rates
10 - 200 mV s-1
[27, 76]. Quasireversible nature of Th4+
|Th couple was further confirmed by
electrochemical impedance spectroscopy study (EIS) and is discussed in Chapter 5.

38
n value for Th4+
|Th redox couple was calculated using Equation 3.1 [77], which is applicable
for a reversible system involving soluble-insoluble redox couple and tabulated in Table 3.1,
which suggest non-reversibility of the redox couple.
/2 0.7725p p
RTE E
nF (3.1)
Table 3.1 Cathodic peak analysis of Th4+
|Th couple in LiCl-KCl eutectic melt,
4
-5 -32.72 10 ThCl molC cm .
T / K Scan rate
(mV s-1
) pcE (V) /2( )p p cE E
(V)
n value using
Equation 3.1
αn value using
Equation 3.2
698
10 -1.621 -0.015 3.1 7.4
25 -1.631 -0.014 3.3 7.9
50 -1.642 -0.016 2.9 7.1
75 -1.642 -0.016 2.9 7.1
100 -1.642 -0.017 2.7 6.5
125 -1.652 -0.018 2.5 6.1
150 -1.652 -0.019 2.5 6.0
175 -1.652 -0.019 2.4 5.7
200 -1.652 -0.020 2.3 5.6
723 10 -1.591 -0.015 3.3 7.8
25 -1.601 -0.015 3.3 7.8
50 -1.611 -0.016 3.1 7.3
75 -1.621 -0.023 2.1 5.0
100 -1.621 -0.020 2.4 5.7
125 -1.621 -0.019 2.6 6.1
150 -1.621 -0.018 2.7 6.4
175 -1.621 -0.017 2.8 6.7
200 -1.621 -0.017 2.9 6.9
748 10 -1.571 -0.015 3.4 8.1
25 -1.581 -0.013 3.8 9.2
50 -1.591 -0.018 2.7 6.6
75 -1.601 -0.023 2.1 5.1
100 -1.601 -0.022 2.3 5.5
125 -1.601 -0.019 2.6 6.2
150 -1.601 -0.018 3.0 6.7
175 -1.601 -0.017 3.1 7.1
200 -1.601 -0.016 2.0 7.5
773 10 -1.551 -0.014 2.3 8.9
25 -1.561 -0.017 3.7 7.1

39
50 -1.561 -0.014 3.0 8.8
75 -1.571 -0.021 3.7 5.8
100 -1.571 -0.019 2.4 6.5
125 -1.571 -0.017 2.7 7.3
150 -1.571 -0.015 3.0 8.2
175 -1.581 -0.024 3.4 5.2
200 -1.581 -0.023 2.1 5.4
803 10 -1.521 -0.009 5.9 14.3
25 -1.531 -0.015 3.6 8.6
50 -1.531 -0.011 4.8 11.7
75 -1.541 -0.019 2.8 6.7
100 -1.541 -0.017 3.1 7.5
125 -1.541 -0.016 3.3 8.0
150 -1.541 -0.015 3.6 8.6
175 -1.551 -0.025 2.1 5.1
200 -1.551 -0.023 2.3 5.6
Equation 3.2 [78], which is applicable for an irreversible system was used to calculate n
value and tabulated in Table 3.1.
/2 1.857p p
RTE E
nF (3.2)
n value calculated using Equation 3.2, produced α ˃ 1 which is unrealistic as it should be
between 0 and 1. The observations suggested that reduction process was not completely
irreversible and Equation 3.2 is not applicable for investigating Th4+
|Th couple. n value
was also calculated using Equation 3.3 (applicable for both reversible and quasireversible
system) [79, 80].
2.303log 2
pcE RT
nF
(3.3)
n value was calculated from slope of plot of pcE versus log (Figure 3.4) for scan rates
10–400 mV s-1
in temperature range of 698–803 K for various concentrations of ThCl4 in
molten LiCl-KCl eutectic melt, which are tabulated in Table 3.2. Calculated n values using
Equation 3.3 were more realistic as compared to that obtained by Equation 3.2.

40
Table 3.2 Calculated αn value for Th4+
|Th couple by cyclic voltammetry.
4
5
ThCl 10C
(mol cm-3
)
T / K
698 723 748 773 803
2.04 2.8 2.9 3.0 2.6 2.4
2.72 2.7 2.6 2.7 3.3 3.4
9.53 2.8 - 1.9 2.3 3.0
a
b

41
c
Figure 3.4 . logpcE vs for Th4+
|Th couple at inert tungsten electrode in LiCl-KCl eutectic
melt, (a)4
-5 -32.04 10 ThCl molC cm , (b)4
-5 -32.72 10 ThCl molC cm ,
(c)4
-5 -31 9.53 0ThCl molC cm T=698–803 K, A= 0.25 cm2.
In similar manner pci was plotted against 1/2 in scan range of 10–200 mV s-1
and shown in
Figure 3.5. A linear variation was observed suggesting that reduction of Th4+
was a diffusion
controlled process. Linear least squares fits of pci against 1/2 with a fixed intercept of zero are
also shown in Figure 3.5.
a

42
b
c
Figure 3.5 Variation of 1/2.pci vs of Th4+
|Th couple at inert tungsten electrode in molten
LiCl-KCl eutectic melt, (a) 4
-5 -32.04 10 ThCl molC cm , (b)4
-5 -32.72 10 ThCl molC cm ,
(c)4
-5 -31 9.53 0ThCl molC cm , T=698–803 K, , A= 0.25 cm2.
3.2 Chronopotentiometry (CP) at inert tungsten electrode
Chronopotentiograms for 2.04×10⁻⁵
mol cm-3
ThCl4 in molten LiCl-KCl eutectic at various
current densities on W electrode at 723 K are shown in Figure 3.6a. A single plateau was
observed in the chronopotentiograms at -1.57 V corresponding to reduction of Th4+
to Th.

43
a
b
Figure 3.6 (a) Chronopotentiograms of Th4+
|Th couple at tungsten electrode in LiCl-KCl
eutectic melt, (b) Variation of iτ1/2
versus current density, T=723 K,
4
-5 -32.04 10 ThCl molC cm , A= 0.25 cm2.
Relationship between i and is given by Sand’s Equation 3.4 [60].
4+ 4+
1/2 1/2
Th Th0.5i nFAC D (3.4)
1/2i remained almost constant in current range studied as shown in Figure 3.6b suggesting
reversibility of the process at all current densities. Plot of i versus τ-1/2
is shown in the Figure
3.7 at various temperatures.

44
a
b

45
c
Figure 3.7 Plot of i versus τ-1/2
, (a) 4
-5 -32.04 10 ThCl molC cm ,
(b)4
-5 -32.72 10 ThCl molC cm , (c)4
-5 -31 9.53 0ThCl molC cm , T=698–803 K, A= 0.25 cm2.
3.3 Square wave voltammetry (SWV) at inert tungsten electrode
In Figure 3.8a, square wave voltammograms are shown for ThCl4
(4
5 -3
ThCl 2.04 10 mol cmC ) in LiCl-KCl eutectic melt at tungsten electrode at 723 K. Only
reduction peak appearing at -1.575 V was attributed to Th4+
|Th couple. n was calculated
using Equation 3.5 which is valid for a perfectly Gaussian peak [81-87] and tabulated in
Table 3.3.
1/ 2 3.52RT
WnF
(3.5)
i and pcE were plotted against f1/2
for a fixed amplitude of 25 mV at 723 K
for4
5 -3
ThCl 2.04 10 mol cmC and are shown in Figure 3.8b. Linear dependence of i versus
f1/2
and invariance of pcE versus f1/2
in both profiles suggest that reduction process was
quasireversible. It was therefore proved that reduction of Th4+
at tungsten electrode was
single step quasireversible process involving four electrons.

46
a
b
Figure 3.8 (a) Square wave voltammograms of Th4+
|Th couple at inert tungsten electrode in
LiCl-KCl eutectic melt, T= 723 K, 4
-5 -32.04 10 ThCl molC cm , f= 25 Hz, ΔE= 20, 25, 30, 35
mV, A=0.25 cm2. (b) Linear relationship of pci (left axis) and pcE (right axis) versus 1/2f ,
T=723 K, ΔE= 25 mV.
Table 3.3 n of Th4+
|Th couple calculated by squarewave voltammogram,
4
-5 -32.72 10 ThCl molC cm , A=0.25 cm2.
f / Hz ΔE / mV 723 K 748 K 773 K
W1/2 n W1/2 n W1/2 N
8 30 0.0537 4.1 0.0537 4.2 0.0537 4.4
35 0.0635 3.5 0.0586 3.9 0.0537 4.4

47
15 30 0.0586 3.7 0.0537 4.2 0.0586 4.0
35 0.0635 3.5 0.0537 4.2 0.0586 4.0
20 30 0.0586 3.7 0.0537 4.2 0.0635 3.7
35 0.0684 3.2 0.0586 3.9 0.0635 3.7
25 30 0.0586 3.7 0.0537 4.2 0.0684 3.4
35 0.0537 4.1 0.0586 3.9 0.0586 4.0
3.4 Semi-integral voltammetry (SIV)
Semi-integral of cyclic voltammetric data gives a convoluted curve similar to steady state
voltammetric curves [88, 89]. In Figure 3.9 semi-integral curve for ThCl4
(4
5 -3
ThCl 2.04 10 mol cmC ) in LiCl-KCl eutectic melt on W electrode for scan rate of 50
mV s-1
at 773 K is shown.
Figure 3.9 Semi-integral curve of voltammogram for Th4+
|Th couple at inert tungsten
electrode in LiCl-KCl eutectic melt, T=723 K, 4
-5 -32.04 10 ThCl molC cm , A=0.25 cm2.
Expression of m(t) is given by,
1/ 2
1/ 2
0
( ) 1 ( )( )
t
d i t im t d
dt t
(3.6)
For reversible deposition of an insoluble species, governing equation for relating ( )E t , ( )m t
and c ( )m is given by Equation 3.7 [90-93].

48
4+4
* cThClTh |Th
c
( )( ) ln ln
( )
m mRT RTE t E x
nF nF m
(3.7)
Plot of ln( ) ( )
.( )
c
c
sm
tm t
v Em
should yield a straight line with slope of RT/nF. Similar
equations have been derived by Oldham et al. [91] for quasireversible and irreversible
processes.
For a quasireversible process a plot of
1 / 2( ) ( ) 1 exp
( )
ln .c
nFm m t E E
RT
i t
vs E t
should
yield a straight line with a slope of RT/αnF. From slope αn value can be calculated.
For an irreversible process a plot of ln( ) ( )
( )
cm m t
i t
versus E(t) should yield a straight line
with a slope RT/αnF and αn can be calculated. Figure 3.10a shows the plots of E t versus
ln( ) ( )
( )
c
c
m m t
m
assuming reduction as reversible process. Figure 10b and 10c show the
plots assuming quasireversible and irreversible respectively. Values of n, αn, α calculated
using reversible, quasireversible and irreversible hypothesis for various concentrations of
ThCl4 in LiCl-KCl eutectic in the temperature range 698-803 K for scan rates of 10-500 mV
s-1
are shown in Table 3.4. Considering reduction process as reversible, calculated n value
decreased with increasing scan rate as shown in Table 3.4. Considering reduction process as
quasireversible it was found that αn and α values decrease with increasing scan rates. The
reduction process was found to be irreversible at higher scan rates as αn and α value
increased with increasing scan rates. So from the results shown in the Table 3.4 it was
recognized that the reduction process was quasireversible at lower scan rates (10-100 mV s-1
)
but irreversible at higher scan rates (500 mV s-1
).

49
a
b

50
c
Figure 3.10 Logarithmic analysis of semi-integral curve of Th4+
|Th couple as per (a)
Reversible, (b) quasireversible and (c )irreversible hypothesis, 4
-5 -32.04 10 ThCl molC cm ,
T=723 K, A=0.25 cm2.
Table 3.4 n, α, αn values for Th4+
|Th couple using reversible, quasireversible and
irreversible hypothesis in semi-integral voltammetry.
4
5
ThCl 10C
(mol cm-3
) T / K
Scan rate
(mV s-1
)
Reversible
process
Quasireversible
process
Irreversible
Process
n αn α αn α
2.04
723
10 3.5 1.73 0.43 1.4 0.35
50 3.5 1.45 0.36 0.86 0.22
100 3.5 1.23 0.31 0.74 0.19
500 2.9 0.83 0.21 0.54 0.14
748
10 3.8 1.86 0.47 1.04 0.26
50 4.1 1.57 0.39 0.62 0.15
100 4.1 1.30 0.33 0.69 0.17
500 3.2 1.06 0.27 0.66 0.16
773
10 3.7 1.98 0.50 1.06 0.27
50 4 1.25 0.31 0.9 0.22
100 4.1 1.52 0.38 0.88 0.22
500 2.9 0.74 0.19 0.68 0.17
803
10 3.6 2.05 0.51 1.01 0.25
50 3.7 2.02 0.51 0.97 0.24
100 3.9 1.36 0.34 0.99 0.25
500 2.7 0.89 0.22 0.76 0.19
2.72 723 10 3.5 2.49 0.62 1.27 0.32

51
50 3.5 1.66 0.42 1.22 0.31
100 3.1 1.27 0.32 0.82 0.21
500 2.1 0.97 0.29 0.57 0.14
748
10 3.5 3.06 0.77 1.47 0.37
50 3.5 1.80 0.45 1.31 0.33
100 3.4 1.35 0.34 0.84 0.21
500 2.7 1.12 0.28 0.56 0.14
773
10 3.3 1.94 0.48 1.48 0.37
50 3.3 1.81 0.45 0.93 0.23
100 3.4 1.32 0.33 0.79 0.2
500 3.3 0.97 0.24 0.71 0.18
803
10 2.7 3.01 0.75 1.25 0.32
50 3.5 2.07 0.52 1.37 0.34
100 3.7 1.75 0.44 0.98 0.24
500 3.5 1.16 0.29 0.8 0.2
9.53
748
10 4.2 1.73 0.43 0.46 0.11
50 4 1.61 0.40 0.59 0.15
100 3.7 1.61 0.40 0.54 0.14
500 2.4 0.62 0.16 0.41 0.1
773
10 4.1 2.66 0.67 0.74 0.19
50 3.8 2.64 0.66 0.43 0.11
100 3.6 1.58 0.39 0.48 0.12
500 2.2 1.29 0.32 0.43 0.11
803
10 3.5 2.04 0.51 1.08 0.27
50 3.7 1.91 0.48 0.49 0.12
100 3.1 1.69 0.42 0.48 0.12
500 2.3 1.16 0.29 0.44 0.11
3.5 Estimation of diffusion coefficient of Th4+
4+ThD of Th
4+ in LiCl-KCl eutectic melt was calculated from slope of linear fit of pci versus
1/2 obtained from cyclic voltammetry (discussed in section 3.1). Berzins-Delahay
(applicable for quasi-reversible and irreversible couples) [94, 95] and Randle–Sevic [60, 96,
97] (applicable for reversible and quasireversible systems) equations represented by
Equations 3.8 and 3.9 respectively, were used to calculate 4+ThD . Estimated 4+Th
D values at
various temperatures and three different ThCl4 concentrations are given in Table 3.5.

52
4+4
1/21/2
ThCl Th0.496pc
nFi nFAC D
RT
(3.8)
4+4
1/21/2
ThCl Th0.61pc
nFi nFAC D
RT
(3.9)
4+ThD was also estimated from chronopotentiograms using Sand’s Equation (3.4) [60]
(discussed in Section 3.2).
In square wave voltammetry pci varies linearly with 4ThClC and with f
1/2 according to Equation
3.10 [82]. This method may be extended to any electrochemical system. Diffusion coefficient
of Th4+
was estimated by squarewave voltammetry using Equation 3.10 and tabulated in
Table 3.5.
4+
4
ThThCl
1
1p
D fi nFAC
(3.10)
Here, exp2
nF E
RT
(3.11)
Semi-integral voltammetry was used to estimate 4+ThD using Equation 3.12 [98].
4+4
1/2
c ThCl Th( )m nFAC D (3.12)
Estimated 4+ThD values estimated by different techniques were in good agreement, given in
Table 3.5. 4+ThD value was found in the range of 0.26×10
-5 to 6.56×10
-5 cm
2 s
-1 in the
temperature range of 698-803 K for entire concentration range of ThCl4 used in the present
study, is in good agreement with the reported value of 0.27×10⁻⁵
cm2 s
-1 at 673 K by Martinot
[5], 2.23 ± 0.16 ×10⁻⁵
cm2 s
-1 at 723 K by Liu et al. [6] and 3.15 ± 0.2 ×10
-5 cm
2 s
-1 at 723 K
by Cassayre et al. [7] by cyclic voltammetric method.
Combined 4+Thln D obtained from CV, CP, SIV and SWV were plotted against temperature
and linear least square fit is shown in Figure 3.11. Ea for diffusion of Th4+
ion in LiCl-KCl

53
eutectic melt was calculated from slope of the plot of 4+Thln . 1/D vs T . The relationship
among 4+ThD , T and Ea is given in Arrhenius equation 3.13.
Table 3.5 4+ThD of Th
4+ in LiCl-KCl eutectic melt obtained from CV, CP, SIV, SWV.
4
5
ThCl 10C
(mol cm-3
) T/K 4+Th
510D /cm2 s
-1
CV CP SIV SWV
Using
Eq. (3.8)
Using
Eq. (3.9)
9.53 698 0.83 ± 0.02 0.38 ± 0.01 2.06 ± 0.18 1.61 ± 0.18 -
748 2.05 ± 0.01 0.64 ± 0.03 3.61 ± 0.23 3.35 ± 0.37 -
773 2.19 ± 0.01 0.85 ± 0.05 5.60 ± 0.19 - -
803 2.33 ± 0.01 1.02 ± 0.07 6.56 ± 0.23 6.16 ± 0.50 -
2.72 698 - - 1.01 ± 0.03 3.03 ±0.34 -
723 1.38 ± 0.15 0.59 ± 0.06 1.19 ± 0.03 3.86 ± 0.55 2.12 ± 0.10
748 1.49 ± 0.11 0.64 ± 0.05 1.56 ± 0.04 4.31 ± 0.26 3.04 ± 0.15
773 1.59 ± 0.06 0.84 ± 0.03 2.07 ± 0.04 5.05 ± 0.96 4.46 ± 0.14
803 1.89 ± 0.09 1.13 ± 0.06 2.62 ± 0.08 5.97 ± 0.52 -
2.04 698 0.56 ± 0.03 0.26 ± 0.01 1.17 ± 0.02 2.02 ± 0.73 -
723 0.85 ± 0.04 0.41 ± 0.02 1.47 ± 0.02 2.24 ± 0.40 2.43 ± 0.10
748 1.02 ± 0.07 0.51 ± 0.03 1.81 ± 0.03 2.63 ± 0.21 3.17 ± 0.10
773 1.33 ± 0.08 0.58 ± 0.03 2.12 ± 0.03 2.97 ± 0.67 4.15 ± 0.13
803 2.04 ± 0.14 0.82 ± 0.05 2.38 ± 0.03 4.42 ± 0.52 -
Martinot [5] 673 0.27 673
Liu et al. [6] 773 2.23 ± 0.16
Cassayre et
al. [7] 723 3.15 ± 0.15
4+ 4+Th Thexp aE
D DRT
(3.13)
Fitted equation of 4+Thln . 1/D vs T is given by,
4+Th
4755 1451ln 4.64 1.93
(K)D
T
(3.14)
From Equations 3.13 and 3.14, activation energy for Th4+
|Th couple in LiCl-KCl eutectic
melt was calculated to be 39.53±12.06 kJ mol-1
. Reported Ea for diffusion of Th4+
in LiF-

54
CaF2 using cyclic voltammetry was 55.5 kJ mol-1
by Chamelot et al.[27]. Difference may be
due to different molten salt media used by Chamelot et al. than in present work.
Concentration dependence of 4+ThD was found to be very weak in for dilute concentrations of
ThCl4 employed in present study. Figure 3.12 shows variation of diffusion coefficient with
concentration and temperature.
Figure 3.11 Variation of 4+Thln D versus 1/T for ThCl4 in LiCl-KCl eutectic melt.
Figure 3.12 Concentration and temperature dependence of 4+ThD of Th
4+ in LiCl-KCl eutectic
melt.

55
3.6 Estimation of 4+
*
Th |ThE from CP and SIV
4+
*
Th |ThE was calculated from chronopotentiograms as discussed below. Potential-time
relationship for a reversible system with the formation of an insoluble metallic species is
expressed by Equation 3.15 [60].
4+4
1/2*
ThClTh |Th( ) ln ln
RT RT tE t E x
nF nF
(3.15)
Plot of 1/2
ln . ( )t
vs E t
shown in Figure 3.13 was found to be linear. From intercept of
the plot 4+
*
Th |ThE
was evaluated for different temperatures on tungsten electrode for three
different concentrations of ThCl4 in LiCl-KCl eutectic melt. Calculated values of 4+
*
Th |ThE
are
given in the Table 3.6.
Potential data have been calculated against Cl2|Cl- reference using Equations 2.20 and 2.21
(discussed in Chapter 2).
a

56
b
c
Figure 3.13 Logarithmic analysis of chronopotentiogram of Th4+
|Th couple for tungsten
electrode in LiCl-KCl eutectic melt, (a) 4
-5 -32.04 10 ThCl molC cm ,
(b)4
-5 -32.72 10 ThCl molC cm , (c)4
-5 -31 9.53 0ThCl molC cm , T=698–803 K, A= 0.25 cm2.
Table 3.6 Estimated 4+
*
Th |ThE
of Th4+
|Th couple from CP and comparison with literature data.
4
5
ThCl 10C
(mol cm-3
) T / K 698 723 748 773 803
2.04
4+
*
Th |Th/ VE vs. Ag
+|Ag -1.477 -1.452 -1.426 -1.401 -1.376
4+
* -
2Th |Th/ V . Cl |ClE vs -2.687 -2.667 -2.645 -2.624 -2.604
2.72 4+
*
Th |Th/ VE vs. Ag
+|Ag -1.495 -1.461 -1.438 -1.410 -1.386

57
4+
* -
2Th |Th/ V . Cl |ClE vs -2.709 -2.676 -2.657 -2.633 -2.614
9.53 4+
*
Th |Th/ VE vs. Ag
+|Ag -1.477 - -1.430 -1.392 -1.371
4+
* -
2Th |Th/ V . Cl |ClE vs -2.687 - -2.649 -2.615 -2.599
Present
work
4+
*
Th |Th/ VE vs. Ag
+|Ag 32.197 0.041 1.02 0.05 10 (K)T
4+
* -
2Th |Th/ V . Cl |ClE vs 33.289 0.042 1.20 0.05 10 (K)T
Cassayre et
al. [7] 4+
* -
2Th |Th/ V . Cl |ClE vs
42.983 5.540 10 (K)T in LiCl-KCl eutectic
melt (693-823 K)
Kudyakov
et al. [18] 4+
* -
2Th |Th/ V . Cl |ClE vs
43.17 6.70 10 (K)T in molten KCl (800-962
K)
Srinivasan
et al. [24] 4+
* -
2Th |Th/ V . Cl |ClE vs
43.109 6.38 10 (K)T in molten NaCl-KCl
(943-1123 K)
4+
*
Th |ThE of Th
4+|Th couple was estimated by semi-integral curves using Equation 3.7,
applicable for reversible soluble-insoluble system [90]. Estimated 4+
*
Th |ThE data are given in
Table 3.7. 4+
*
Th |ThE values were found to be in good agreement with the values calculated by
chronopotentiometry method. 4+
*
Th |ThE
value was found to be in good agreement with the value
obtained by Cassayre et al. [7] in LiCl-KCl eutectic melt from OCP measurements,
Kudyakov et al. [18] in KCl melt and Srinivasan et al. [24] in KCl-NaCl melts.
Table 3.7 Estimated 4+
*
Th |ThE values at different
4ThClC from SIV.
4
5
ThCl
-3mol
10
cm
C T / K 698 723 748 773 803
2.04
4+
*
Th |Th/ VE vs. Ag
+|Ag -1.465 -1.418 -1.389 -1.381 -1.365
4+
* -
2Th |Th/ V . Cl |ClE vs -2.682 -2.657 -2.643 -2.601 -2.585
2.72 4+
*
Th |Th/ VE vs. Ag
+|Ag
-1.467 -1.436 -1.381 -1.371
4+
* -
2Th |Th/ V . Cl |ClE vs -2.687 -2.656 -2.602 -2.591
9.53 4+
*
Th |Th/ VE vs. Ag
+|Ag -1.477 -1.449 -1.413 -1.371
4+
* -
2Th |Th/ V . Cl |ClE vs -2.697 -2.668 -2.633 -2.591
Present 4+
*
Th |Th/ VE vs. Ag
+|Ag 32.154 0.113 (9.805 1.501) 10 (K)T

58
work 4+
* -
2Th |Th/ V . Cl |ClE vs 33.374 0.113 (9.805 1.501) 10 (K)T
Temperature dependence of 4+
*
Th |ThE estimated by both CP and SIV is shown in Figure 3.14
and linear fit of combined data in Table 3.6 and 3.7 is given by Equation 3.16
4+
* - 4
2Th |Th.Cl |Cl 3.377 0.060 10 (K)/ V 9.786 0.798E vs T
(3.16)
Figure 3.14 Plot of 4+
*
Th |ThE versus T (K).
3.7 Anodic dissolution of Th electrode: Estimation of theoretical equilibrium potential
of Th4+
|Th couple
Cyclic voltammogram of thorium electrode in the potential region -1.65 to -0.80 V at a scan
rate of 25 mV s-1
at 773 K is shown in Figure 3.15. From start potential of -1.65 V onwards,
voltammetric current decreases to zero and cuts potential axis at -1.437 V. The point of
inflection i.e. potential where voltammetric current changes its sign is called “threshold
potential”, also known as “apparent equilibrium potential” denoted by 4+
app
Th |Th1.437 VE and
represents onset of thorium dissolution corresponding to following reaction:
4+ -Th Th + 4e

59
Figure 3.15 Cyclic voltammogram of Th electrode in LiCl-KCl eutectic
melt,4
-4 -31.02 1 0ThCl molC cm , T=773 K, Scan rate: 25 mV s-1
. A= 1.50 cm2.
A small hump appears in potential region -1.437 to -1.360 V beyond which the
voltammogram shows unlimited anodic current. General features of voltammogram are
similar to that of uranium and zirconium reported earlier [99-101]. Apparent equilibrium
potential was measured from cyclic voltammograms at 50 mV s-1
and 100 mV s-1
carried out
in temperature range 698-798 K. They are given in Table 3.8, which also shows average
“apparent equilibrium potential” versus Ag+|Ag and Cl
-|Cl2 as reference. Potentials measured
against Ag+|Ag were converted to Cl
-|Cl2 using Equations 2.20 and 2.21 (discussed in
Chapter 2). Temperature dependence of 4+
app
Th |ThE (versus Ag
+|Ag and Cl
-|Cl2) is given by
Equations 3.17 and 3.18.
4+
app + 4
Th |Th( .Ag |Ag)(V) (1.983 0.054) (7.080 0.722) 10 (K)E vs T (3.17)
4+
app - 4
2Th |Th( .Cl |Cl )(V) (3.075 0.054) (5.030 0.720) 10 (K)E vs T (3.18)
4+
eq
Th |ThE can be theoretically estimated for
4
3
ThCl 3.86 10x , which is the composition of
ThCl4 used for recording cyclic voltammogram of thorium electrode shown in Figure 3.15.
Estimation of equilibrium potential for anodic dissolution of UN, PuN, NpN and (U,Pu)N in

60
LiCl-KCl eutectic from thermodynamic data has been carried out earlier by Kobayashi et al.
[102] and Shirai et al. [103-105] and a similar procedure is adopted
Table 3.8 4+
eq
Th |ThE of Th dissolution in LiCl-KCl-ThCl4 (
4
3
ThCl 3.86 10x ) electrolyte
measured using cyclic voltammetry at 50 mV s-1
and 100 mV s-1
.
Scan rate (mV s-1
) 4+
eq
Th |Th/ VE
698 K 723 K 748 K 773 K 798 K
50 -1.477 -1.468 -1.460 -1.434 -1.411
100 -1.491 -1.479 -1.469 -1.435 -1.418
Avg. (versus
Ag+|Ag)
-1.484 -1.474 -1.461 -1.435 -1.415
Avg. (versus Cl-
|Cl2) -2.718 -2.713 -2.705 -2.684 -2.699
Table 3.9 shows a comparison of theoretical equilibrium potential 4+
eq
Th |ThE estimated from
various literature sources using different thermochemical databases. Thermochemical data for
ThCl , .4f liqG have been taken from Glassner [106], Martinot et al. [107] and Fuger et al.[108]
for estimating 4ThCl .
ThCl , .4f liqG was also calculated using FactSage 6.4 software [109] using
the Equation 3.19 and data for ThCl4 (liq.) was taken from FACTPS database compiled from
Barin and Kubaschewski [110].
2 4Th( ) + 2Cl ( ) ThCl ( .)s g liq (3.19)
Yang et al. had carried out galvanic cell measurements on uranium, thorium, zirconium and
niobium in LiCl-KCl eutectic melt [15]. They had used ThCl , .4
f liqG values from Glassner's
compilation [106].
Even though Yang and Hudson measured emf at 772 K and 774 K, it is useful to compare
calculated equilibrium potential with that measured in present work at 773 K. At 772 K and
774 K, they reported4
3
ThCl 1.16 10 , ThCl , .4
-
f
1957.86 kJ molliq
G and

61
4
3
ThCl 1.21 10 ,ThCl , .4
-
f
1957.52 kJ molliq
G , respectively. 4+
eq
Th |ThE was estimated at -1.655
V and -1.654 V at 772 K and 774 K, respectively. When reference state data was taken from
Barin and Kubaschewski [110], 4ThCl was found to be in 10
-7 range that led to significantly
more negative values of 4+
eq
Th |ThE .
Martinot et al. carried out electromotive force measurements of ThCl4 in LiCl-KCl and NaCl-
KCl systems [107]. For LiCl-KCl eutectic, they reported following expressions for Gibbs
energy of formation of ThCl4 in melt and super cooled liquid as reference state:
4
-1
f ThCl ,LiCl-KCl (Jmol ) 1114000 207 (K)G T (3.20)
4
-1
f ThCl ,liq. (Jmol ) 1092000 201 (K)G T (3.21)
4+
eq
Th |ThE was estimated at -1.385 V. Electromotive force data of Martinot et al. was further
analysed by fitting method by Roy et al. that was used for estimating Gibbs energy of
formation of UCl3, PuCl3 and NpCl3 in LiCl-KCl eutectic melt [70]. The method involved
linear fitting of logarithm of mole-fraction of actinide chloride versus AgCl AgCllnRT
E E xF
at a given temperature T. Gibbs energy of formation of actinide chloride at temperature T was
given by product of intercept of linear fit (equal to standard electrode potential of actinide
chloride in LiCl-KCl eutectic) and nF . From Martinot et al. report, 3
AgCl 4.6 10x and
4f ThCl ,LiCl-KClG was found to be -977.78 kJ mol-1
at 773 K as against -953.99 kJ mol-1
reported
by the authors. 4ThCl was found to be 1.65×10
-3 and 4+
eq
Th |ThE was estimated at -1.508 V at
773 K. 4+
eq
Th |ThE was also estimated from Martinot's work using thermochemical data for ThCl4
(liq.) from Fuger et al. [108] and Barin and Kubaschewski [109, 110] using 4f ThCl ,LiCl-KClG

62
reported by Martinot and -977.78 kJ mol-1
that was obtained using method of Roy et al. [70].
4+
eq
Th |ThE was found to be in the range -1.354 to -1.503 V.
From Cassayre et al. work [7], 4+
eq
Th |ThE was estimated at -1.536 V and -1.528 V using
reference state data from Fuger et al. [108] and Barin and Kubaschewski [109, 110],
respectively.
From Table 3.9, it is clear that
a. Yang et al. [15] estimated more negative value of 4f ThCl ,LiCl-KClG at 772 K and 774 K than
those reported by Refs. [7, 107], which leads to large negative values of 4+
eq
Th |ThE .
4+
eq
Th |ThE value estimated using reference state data of Barin et al. [110] was observed to be
more negative than that estimated from the works of Cassayre et al. [7] and Martinot et
al.[107].
b. Martinot et al. [107] have reported4f ThCl ,LiCl-KClG = -953.99 kJ mol
-1 whereas it is calculated
to be -977.78 kJ mol-1
from linear fitting of emf data using the procedure by Roy et al.
[70]. Using 4
ο
f ThCl ,Liq.G reference state data from Refs. [107, 108, 110] 4+
eq
Th |ThE is
calculated in the range -1.354 to -1.508 V and his variation may be considered marginal.
c. 4+
eq
Th |ThE is estimated in the range of -1.528 to -1.559 V from the work of Cassayre et al.
using reference state data from Refs. [107, 108, 110].
d. Variation in 4+
eq
Th |ThE is found to be marginal among the works of Martinot et al. [107] and
Cassayre et al. [7] estimated using reference state data from Martinot et al. [107], Fuger
et al. [108]] and Barin et al. [110] whereas variation is quite large from reference state
data of Yang et al. [15]. The reason for this deviation is presently not known.

63
e. Therefore, average theoretical equilibrium potential is estimated only from reports of
Martinot et al. [107], Cassayre et al. [7] and it is found to be -1.469±0.076 V for
4
3
ThCl 3.86 10x which is in good agreement with that measured by cyclic voltammetry
(Table 3.9) considering variations due to experimental conditions employed in different
works, method of fitting emf data for obtaining 4f ThCl ,LiCl-KClG and source of
thermochemical data 4f ThCl ,liq.G .
Based on above analysis, it can be said that values of 4f ThCl ,liq.G from various
thermochemical data resources is the most important factor behind large deviation of
4+
eq
Th |ThE from experimental values and influences the estimation of
4ThCl (Equation 2.22,
discussed in Chapter 2).
Table 3.9 Summary of calculated equilibrium potential of thorium dissolution in LiCl-KCl
eutectic melt at T=773 K from various literature sources. Data of Yang et al. [15] are at
772 K and 774 K. 4
3
ThCl 3.86 10x is assumed for all calculations.
References 4f ThCl ,LiCl-KCl
-1(kJ mol )
G 4f ThCl , .
-1(kJ mol )
liqG
4ThCl E/ V
Yang et al.
[15]
-1036.90a
-957.86c 1.16×10
-3 -1.655
-944.33d 5.45×10
-7 -1.783
-1036.58b
-957.52c 1.21×10
-3 -1.654
-943.34d 5.51×10
-7 -1.782
Martinot et al.
[107]
-953.99
-936. 63 [107] 6.71×10⁻²
-1.385
-944.09d 0.214 -1.354
-938.99e 9.69×10
-2 -1.379
-977.78f
-936.63 [107] 1.65×10⁻³
-1.508
-944.09d 5.29×10
-3 -1.477
-938.99e 2.39×10
-3 -1.503
Cassayre et
al. [7] -987.62
-938.99e 6.80×10
-4 -1.536
-944.09d 1.14×10
-3 -1.528
-936.63 [107] 3.58×10⁻³
-1.559
Present study -972.01
-938.99e 5.56×10
-3 -1.462
-944.09d 1.23×10
-2 -1.448
-936.63 [107] 4.06×10⁻³
-1.479

64
a At T = 772 K
b At T = 774 K
c From Glassner [106]
d From Barin and Kubaschewski [109, 110]
e From Fuger et al.[108]
f Method of Roy et al. [70]
3.8 Cyclic voltammetry of Th4+
at liquid cadmium electrode: Underpotential deposition
of Th
Cyclic voltammogram of ThCl4 at liquid cadmium electrode recorded for 3.55×10⁻⁵
mol cm-3
ThCl4 in LiCl-KCl eutectic melt at 773 K is shown in Figure 3.16. Onset potential for
reduction of thorium in cadmium appears at -1.21 V, which signifies underpotential
deposition of thorium and formation of Cd-Th alloy. Cyclic voltammogram is associated with
appearance of two cathodic peaks at -1.31 V and -1.38 V which correspond to the formations
of two Cd-Th alloys, Cd11Th and Cd5Th respectively. At -1.31 V Cd11Th is in equilibrium
with Cd and at -1.38 V Cd5Th is in equilibrium with Cd11Th forming two phase alloys.
Electrochemical reactions for formation of Cd11Th and Cd5Th alloys are given by Equations
3.22 and 3.23 respectively.
4+ -
11Th + 4e 11Cd Cd Th (3.22)
11 5
5 11Th + Cd Th Cd Th
6 6 (3.23)
Cyclic voltammograms of ThCl4 at liquid cadmium cathode for different scan rates are shown
in Figure 3.17. It was observed that though two cathodic peaks were appeared at lower scan
rates but at higher scan rates only one cathodic peak appeared.

65
Figure 3.16 Cyclic voltammograms of LiCl-KCl-ThCl4 at inert tungsten and liquid cadmium
electrode,4
-5 -33.55 1 ,0ThCl mol cmC A= 0.25 cm2 at inert tungsten electrode;
4
-4 -31 1.08 0ThCl molC cm , A= 1.48 cm2
at liquid cadmium electrode, scan rate for both the
voltammograms is 25 mV s-1
, T = 773K.
Figure 3.17 Cyclic voltammograms of LiCl-KCl-ThCl4 at liquid cadmium electrode at
various scan rates. T =698, 4
4
ThCl
-310 mol c1.0 m8 C .
3.9 Influence of CdCl2 on redox behaviour of Th4+
and investigation of
disproportionation of Th4+
Qualitative analysis of cadmium in LiCl-KCl-ThCl4 was done by cyclic voltammetry at inert
tungsten electrode. Cyclic voltammogram of LiCl-KCl-ThCl4 salt (prepared by equilibration
method discussed in Chapter 2) recorded at inert tungsten electrode over a period of 30 h are

66
shown in Figure 3.18. The voltammograms were found to be reproducible and similar to what
is already described in Figure 3.3. No additional peak is appeared for Cd2+
|Cd couple. Figure
3.18 confirms that there is no contamination of cadmium in the melt, which could lead to
underpotential deposition of thorium.
Figure 3.18 Cyclic voltammograms of LiCl-KCl-ThCl4 at inert tungsten electrode over period
of 30 h, T=773 K.
In order to show underpotential deposition of thorium cyclic voltammogram of LiCl-KCl-
ThCl4-CdCl2 electrolyte was recorded at inert tungsten working electrode, which is shown in
Figure 3.19. Cathodic peak at -0.616 V with an onset at -0.543 V corresponds to Cd2+
|Cd
couple. Onset at -1.303 V with a cathodic peak at -1.407 V and corresponding anodic peak at
-1.305 V pertains to underpotential deposition of thorium in cadmium due to formation of
Cd11Th. Cathodic peak at -1.612 V with an onset at -1.557 V and a corresponding anodic
peak at -1.422 V is attributed to Th4+
|Th couple.

67
Figure 3.19 Cyclic voltammogram of LiCl-KCl eutectic containing ThCl4 and CdCl2 at inert
tungsten electrode, T =773 K.4
-4 -31.08 10 ThClC mol cm , 2
-5 -31 5.20 0CdClC mol cm .
3.10 Corrosion study of alumina crucible during electrochemical measurement
It is seen from the works of [7, 111] that recrystallized alumina was used as container
material for LiCl-KCl-ThCl4 electrolyte during electrochemical measurements. Similar such
recrystallized alumina crucible shown in Figure 3.20a was used for present measurements as
well, which was initially cleaned with nitric acid and washed with distilled water and acetone
and further vacuum dried at 773 K for 6 h before it was used for electrochemical
measurements. LiCl-KCl-ThCl4 electrolyte used for the present measurements is shown in
Figure 3.20b. Salt was loaded in recrystallized alumina crucible and heated to 773 K under
argon atmosphere for a period of 30 h. Two experiments were carried out; one in which
thorium electrode was immersed into the melt and the other in which, it wasn’t. After 30 h,
the system was cooled and crucible was taken inside the glove box. Th electrode prepared for
experiment is shown in Figure 3.21, first one is before experiment and later figure after
immersion in the melt. It was then re-melted and poured out of the crucible on fused silica
dish.

68
Figure 3.20 (a) Recrystallized alumina crucible before experiments, (b) LiCl-KCl-ThCl4
electrolyte used for the present measurements before experiment.
The inner surface of alumina crucible that was in contact with LiCl-KCl-ThCl4 is shown in
Figure 3.22a and 3.22b, the latter figure corresponding to the experiment carried out when
thorium electrode was immersed into the melt. LiCl-KCl-ThCl4 electrolyte poured out from
the crucible after completion of measurements is shown in Figure 3.23a and 3.23b, the latter
figure corresponding to salt in which measurements were carried out with thorium electrode
immersed into it. As can be seen from the figures, there was no signature of corrosion of
alumina crucible due to ThCl4 or metallic thorium in contact with the salt. Alumina crucible,
after cleaning with distilled water and nitric acid followed by washing it with acetone and
distilled water, could be re-used for further experiments. Corrosion of alumina crucible in
presence of LiCl-KCl-ThCl4 electrolyte was checked by carrying out cyclic voltammetry
experiments of the electrolyte in presence of thorium metal and in absence of thorium metal
in the melt to show that there is no formation of Th2+
ion and no formation of any
oxychlorides of thorium due to corrosion of alumina crucible. Both experiments were carried
out over a period of 30 h at 773 K in order to get reproducible data.

69
Figure 3.21 Th electrode prepared for experiment (a) before immersion in the melt and (b)
after immersion in the melt.
Figure 3.22 Alumina crucible after experiment (a) when Th electrode was not immersed and
(b) when Th electrode was immersed in the melt.
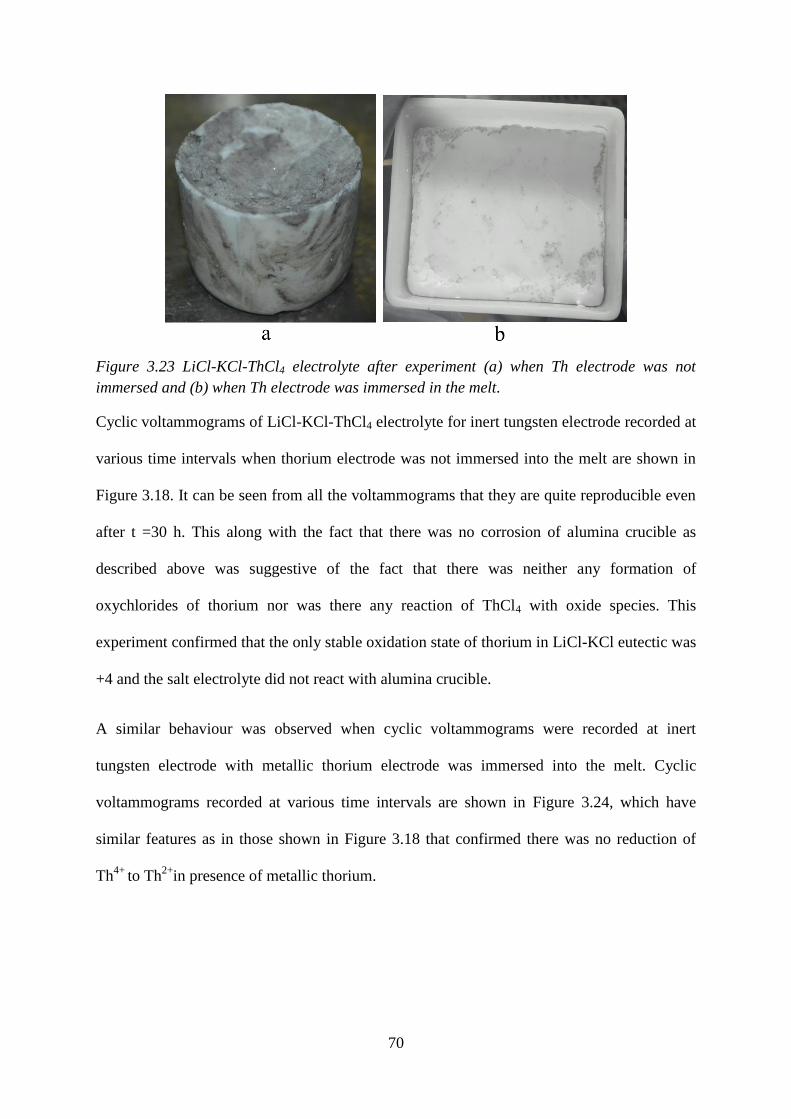
70
Figure 3.23 LiCl-KCl-ThCl4 electrolyte after experiment (a) when Th electrode was not
immersed and (b) when Th electrode was immersed in the melt.
Cyclic voltammograms of LiCl-KCl-ThCl4 electrolyte for inert tungsten electrode recorded at
various time intervals when thorium electrode was not immersed into the melt are shown in
Figure 3.18. It can be seen from all the voltammograms that they are quite reproducible even
after t =30 h. This along with the fact that there was no corrosion of alumina crucible as
described above was suggestive of the fact that there was neither any formation of
oxychlorides of thorium nor was there any reaction of ThCl4 with oxide species. This
experiment confirmed that the only stable oxidation state of thorium in LiCl-KCl eutectic was
+4 and the salt electrolyte did not react with alumina crucible.
A similar behaviour was observed when cyclic voltammograms were recorded at inert
tungsten electrode with metallic thorium electrode was immersed into the melt. Cyclic
voltammograms recorded at various time intervals are shown in Figure 3.24, which have
similar features as in those shown in Figure 3.18 that confirmed there was no reduction of
Th4+
to Th2+
in presence of metallic thorium.

71
Figure 3.24 Cyclic voltammograms of LiCl-KCl-ThCl4 at inert tungsten electrode over period
of 30 h, T=773 K, thorium electrode was kept immersed into the melt during cyclic
voltammetric measurements.
3.11 Conclusions
Electrochemical investigations on Th4+
|Th couple were carried out by different transient
techniques like cyclic voltammetry, chronopotentiometry, squarewave voltammetry and
compared with literature data. Following conclusions are drawn on redox behaviour of
Th4+
|Th couple:
1. Based on the values of n, αn (Table 3.1 and 3.4) and other salient features observed in
transient measurements, Th4+
|Th redox couple was established to be quasi-reversible in
nature at the composition and temperature range studied in the present work.
2. 4+ThD estimated using different transient techniques at different temperatures and
concentrations were fitted to single expression of temperature dependence (Eq. 3.14).
Concentration dependence of 4+ThD although not as prominent as its temperature
dependence, was difficult to quantify as the concentration range of ThCl4 in the present
work was limited. Further experiments are needed to make substantiable conclusions.

72
3. 4+
*
Th |ThE estimated using semi-integral voltammetry and chronopotentiometry was fitted to
single temperature dependence expression and compared with literature data. Eq. 3.16 is
the recommended expression for 4+
*
Th |ThE in this work. This work is further discussed in
Chapter 6.

73
CHAPTER 4
Exchange current density of Th4+
|Th couple in LiCl-KCl eutectic melt
Results and Discussions
This chapter describes estimation of i of Th4+
|Th couple at inert tungsten, liquid cadmium
and thorium electrodes in LiCl-KCl eutectic melt using DC amperometry. Anodic and
cathodic polarization data were subsequently analysed by Tafel and Allen-Hickling methods
for estimation of i . i estimated at inert tungsten electrode using DC amperometry was
compared with that calculated from cyclic voltammograms of LiCl-KCl-ThCl4. The chapter
concludes with discussion on temperature and composition dependence of i .
4.1 Estimation of i at inert tungsten electrode
4.1.1 Estimation of i from polarization curves
Exchange current density of Th4+
|Th couple at inert tungsten electrode was estimated by both
polarization and cyclic voltammetry techniques. In polarization technique inert tungsten
electrode was cathodically polarized at different cathodic overpotential values. Cathodic
polarization runs were carried out at inert tungsten electrode in the temperature range 698-
798 K. .i vs t profile recorded at various cathodic potentials at 773 K is shown in Figure 4.1.
Current was sampled at t=30s for all applied potentials and was plotted against E and
.i vs E profiles for cathodic and anodic polarization of thorium at inert tungsten, liq. Cd and
Th electrodes are shown in Figure 4.2.
i of thorium at inert tungsten electrode in LiCl-KCl eutectic melt was estimated by
analyzing the polarization curve by Tafel and Allen-Hickling methods. In Tafel method,
ln i was plotted against overpotential (η), which is shown in Figure 4.3. The governing
equation for Tafel analysis can be rearranged as Equation 4.1.

74
ln lnn F
i iRT
(4.1)
Figure 4.1 .i vs t profile for cathodic polarization of thorium at inert tungsten electrode at
various potentials, T =773 K.
Figure 4.2 .i vs E profile for cathodic and anodic polarization of thorium at inert tungsten,
liq. Cd and Th electrodes at various potentials, T =773 K.
In Allen-Hickling method, ln
1nF
RT
i
e
was plotted against η, which is shown in Figure 4.4.
Tafel and Allen-Hickling constants were estimated as discussed in Chapter 2. i , Tafela ,
Tafelb and Allen-Hicklingb for cathodic polarization at inert tungsten electrode in the temperature
range of 698-798 K are tabulated in Table 4.1.

75
Figure 4.3 Tafel plots for anodic and cathodic polarization of thorium at inert tungsten and
liquid cadmium cathodes in LiCl-KCl eutectic melt.4
4 3
ThCl 1.08 10 molcmC for inert
(cathodic) and anodic;4
5 3
ThCl 6.91 10 molcmC for liq. Cd (cathodic).
Figure 4.4 Allen-Hickling plots of anodic and cathodic polarization of thorium at inert
tungsten and liquid cadmium cathode in LiCl-KCl eutectic

76
melt.4
4 3
ThCl 1.08 10 molcmC for inert (cathodic) and anodic;
4
5 3
ThCl 6.91 10 molcmC for liq. Cd (cathodic).
Table 4.1 i , Tafela , Tafelb and Allen-Hicklingb of thorium at inert tungsten electrode in LiCl-KCl
eutectic melt.
Tafel method Allen-Hickling method
4
5
ThCl 10C
(mol cm-3
) T/K Tafela
( mV)
Tafelb
(mV)
i
(mA cm-2
)
Allen-Hicklingb
(V-1
)
i
(mA cm-2
)
10.8
698 1040 ± 140 -260 ± 30 19.83 ± 0.97 2.86 ± 0.44 15.97 ± 0.93
723 1200 ±220 -320 ± 60 21.78 ± 0.97 2.71 ± 0.52 19.91 ± 0.93
748 1080± 90 -280 ± 20 23.78 ± 0.98 2.93 ± 0.24 23.57 ± 0.98
773 730 ± 170 -210 ± 80 28.25 ± 0.96 4.24 ± 0.62 28.53 ± 0.95
798 720 ± 80 -210 ± 20 30.72 ± 0.98 3.91 ± 0.44 31.09 ± 0.98
3.55
698 1243 ± 307 -406 ± 96 18.98 ± 0.47 - -
723 996 ± 59 -322 ± 18 21.98 ± 0.83 3.14 ± 0.02 16.57 ± 0.99
748 858 ± 54 -267 ± 15 24.78 ± 0.82 3.38 ± 0.18 21.49 ± 0.98
773 2969 ± 908 -819 ± 245 37.54 ± 0.33 0.02 ± 0.12 40.93 ± 0.99
798 2504 ± 339 -657 ± 87 45.49 0.59 0.79 ± 0.13 51.25 ± 0.98
2.72
698 2508 ± 90 -827 ± 29 20.69 ± 0.89 0.83 ± 0.08 21.24 ± 0.99
723 747 ± 69 -233 ± 20 24.78 ± 0.74 3.69 ± 0.32 24.09 ± 0.97
748 873 ± 75 -247 ± 19 33.78 ± 0.74 3.42 ± 0.26 35.68 ± 0.98
773 2571 ± 330 -666 ± 83 46.99 ± 0.61 0.66 ± 0.10 50.44 ± 0.99
798 4674 ± 346 -1192 ± 869 50.79 ± 0.75 0.56 ± 0.05 51.30 ± 0.94
2.04
698 7568 ± 170 -2523 ± 562 19.49 ± 0.93 - -
723 2939 ± 608 -982 ± 197 20.28 ± 0.54 1.00 ± 0.12 19.10 ± 0.98
748 2296 ± 393 -739 ± 122 22.35 ± 0.59 0.98 ± 0.17 22.96 ± 0.98
773 5206 ± 557 -1549 ± 163 28.79 ± 0.69 0.73 ± 0.14 28.04 ± 0.98
798 1698 ± 285 -498 ± 81 30.26 ± 0.56 1.00 ± 0.09 31.74 ± 0.99
4.1.2 Estimation of i at inert tungsten electrode by cyclic voltammetry
i of Th4+
|Th couple was estimated by cyclic voltammetry using method described by
Cumberland and Yim [112, 113]. They adopted a linear approximation method (Equation

77
4.2) applicable for cyclic voltammograms recorded at higher scan rates. i was estimated
using scan rates of 100 and 200 mV s-1
(Cyclic voltammetric data taken from Chapter 3) and
results are tabulated in Table 4.2.
RT ii
nF
(4.2)
Table 4.2 i of Th4+
|Th couple at inert tungsten electrode from cyclic voltammetric data
(Chapter 3).
4
5
ThCl 10C
(mol cm-3
) T / K
Scan rate
(mV s-1
)
∆i/∆ƞ
(Ω-1
)
i
(mA cm-2
)
2.04
698 100 0.25 ± 0.03 14.82 ± 0.42
200 0.26 ± 0.03 15.41 ±0.42
723 100 0.29 ± 0.03 17.68 ± 0.45
200 0.28 ± 0.02 17.31 ± 0.39
748 100 0.31 ± 0.03 19.60 ±0.49
200 0.30 ± 0.03 18.97 ± 0.42
773 100 0.22 ± 0.02 19.34 ± 0.30
200 0.31 ± 0.03 20.46 ± 0.47
2.72
698 100 0.31 ± 0.04 18.37 ± 0.57
200 0.39 ± 0.05 23.12 ± 0.79
723 100 0.34 ± 0.03 21.10 ± 0.41
200 0.36 ± 0.03 22.34 ± 0.50
748 100 0.44 ± 0.04 27.83 ± 0.70
200 0.44 ± 0.03 27.83 ± 0.45
773 100 0.46 ± 0.02 29.98 ± 0.37
200 0.47 ± 0.04 30.92 ± 0.25
3.55
698 100 0.44 ± 0.08 26.14 ± 1.17
200 0.47 ± 0.06 27.92 ± 0.96
723 100 0.59 ± 0.06 36.42 ± 0.97
200 0.52 ± 0.06 32.21 ± 0.91
748 100 0.58 ± 0.06 36.74 ± 0.94
200 0.57 ± 0.06 35.73 ± 0.99

78
773 100 0.61 ± 0.06 40.41 ± 0.96
200 0.65 ± 0.03 42.84 ± 0.48
4.1.3 Dependence of i on 4ThClC at inert tungsten electrode
Concentration dependence of i is shown in Figure 4.5, where i is plotted against4ThClln C .
4ThClC chosen for the polarization and cyclic voltammetric measurements were not exactly
same, so it might be expected that i may have a small compositional dependence. Before we
investigate this further, it was important to compare the results of i obtained from
polarization (Table 4.1) and cyclic voltammetry data at inert electrode (Table 4.2). Maximum
variation of i was observed to be 10 mA cm−2
at 773 K for each successive variation of
composition from 2.04×10⁻⁵
to 3.55×10⁻⁵
mol cm−3
in voltammetric method, whereas,
i estimated by polarization method varies in the range 28-47 mA cm−2
at 773 K in the same
compositional domain. i value estimated by polarization technique are in good agreement
with values obtained from cyclic voltammetry.
Figure 4.5 i versus 4
-3
ThClln (molcm )C profile for cathodic polarization data at tungsten
electrode in temperature range 698-798 K, i estimated from both polarization and cyclic
voltammetric data are shown.

79
The variation in i estimated from polarization data is in the range of 15-30 mA cm-2
. On the
other hand, the variation in i estimated from voltammetric data is not same at all
concentrations. Considering data from voltammetry alone, it can be said that i increases
with4ThClC . Due to lack of data at higher concentrations of thorium, it is difficult to predict
the behaviour of the concentration dependence of i . In the limited concentration range,
however, i linearly increases with 4+Thln C . At higher concentrations, it is expected that i will
either continue to linearly increase or have weak composition dependence. From Figure 4.5 it
can be seen that variation in i at 10.8×10⁻⁵
mol cm−3
is slightly lower than that seen at
3.55×10⁻⁵
mol cm−3
. Variation in i at 2.04×10⁻⁵
, 2.72×10⁻⁵
and 3.55×10⁻⁵
mol cm−3
is
similar. Therefore, concentration dependence of i is considered to be practically insignificant
in range of concentrations chosen in present work. By and large, i varies from 20-50 mA
cm−2
in temperature range 698-798 K at all concentrations.
4.2 Estimation of i at liquid cadmium cathode
i of Th4+
|Th couple was estimated at liquid cadmium cathode in the temperature range of
723-773 K. Liq. Cd cathode was cathodically polarized from equilibrium potential of -1.25 V
against Ag+|Ag reference. .i vs t profile recorded for cathodic polarization of thorium at liq.
Cd cathode at 773 K is shown in Figure 4.6. Polarization data were analyzed by Tafel and
Allen-Hickling methods. Tafel and Allen-Hickling plots of Th4+
|Th couple at liq. Cd cathode
are shown in Figure 4.3 and 4.4 respectively. i estimated using Tafel and Allen-Hickling
methods were found to be in good agreement with each other, as shown in Table 4.3. Tafel
and Allen-Hickling constants are also given in Table 4.3. i was estimated in the range of 12-
16 mA cm-2
, which is slightly lower than those at the inert electrode. This observation is

80
similar to what is observed in case of cathodic polarization of uranium, gadolinium and
zirconium at liquid cadmium electrode [99].
Figure 4.6 .i vs t profile for cathodic polarization of thorium at liq. Cd electrode at various
potentials, T =773 K.
Table 4.3 i of Th4+
|Th couple at liquid cadmium electrode at various temperatures,
4
5 3
ThCl 6.91 10 molcmC .
T/K
Tafel method Allen-Hickling method
Tafela
( mV)
Tafelb
(mV)
i
(mA cm-2
)
Allen-Hicklingb
(V-1
)
i
(mA cm-2
)
723 2170 ± 120 -480 ± 30 12.23 ± 0.98 2.02 ± 0.12 11.69 ± 0.98
748 3.19 ± 0.08 -750 ± 20 14.26 ± 0.99 1.32 ± 0.05 14.26 ± 0.99
773 2790 ± 220 -670 ± 50 15.91 ± 0.99 1.37 ± 0.11 15.74 ± 0.99
4.3 Estimation of i for anodic polarization of Th electrode
i of Th4+
|Th couple was estimated for anodic polarization of thorium in the temperature range
of 698-798 K. Thorium electrode was anodically polarized from equilibrium potential of
1.50 V against Ag+|Ag reference. .i vs t profile recorded for anodic polarization of thorium
electroe at 773 K is shown in Figure 4.7. Exchange current density of Th4+
|Th couple was
estimated at thorium electrode by Tafel and Allen-Hickling methods in the temperature range

81
of 698-798 K, which are given in Table 4.4. Tafel and Allen-Hickling plots for anodic
polarization are shown in Figure 4.3 and 4.4, respectively. i was estimated in the range of 22-
34 mA cm-2
by both methods.
Figure 4.7 .i vs t profile for anodic polarization of thorium electrode at various potentials, T
=773 K.
Table 4.4 i of thorium in LiCl-KCl eutectic melt in temperature range 698-798 K,
4
4 3
ThCl 1.08 10 molcmC .
T/K
Tafel method Allen-Hickling method
Tafela
( mV)
Tafelb
(mV)
i
(mA cm-2
)
Allen-Hicklingb
(V-1
)
i
(mA cm-2
)
698 -523 ± 12 137 ± 4 22.59 ± 0.96 6.67 ± 0.20 23.78 ± 0.96
723 -529 ± 12 143 ± 5 24.97 ± 0.96 6.68 ± 0.23 26.04 ± 0.96
748 -530 ± 11 148 ± 4 28.15 ± 0.96 6.69 ± 0.21 27.27 ± 0.96
773 -537 ± 10 153 ± 4 29.89 ± 0.97 6.29 ± 0.16 31.27 ± 0.96
798 -547 ± 13 159 ± 5 33.37 ± 0.96 6.02 ± 0.19 33.98 ± 0.97
4.4 Temperature dependence of i
Temperature dependence of i was studied by plotting ln i against reciprocal of temperature
and fitted to the following equation which represents Arrhenius equation for reaction kinetics:
ln lnB
i AT
(4.3)

82
Where, /aB E R . Data from both Tafel and Allen-Hickling plots for each case were fitted
to the same equation. Temperature dependence of i in case of inert tungsten cathode was
fitted to data from both polarization (Table 4.1) and voltammetric measurements (Table 4.2),
which is shown in Figure 4.8 in order to compare fit of only polarization data. Linear fits for
anodic and cathodic (liq. Cd cathode) cases are shown in Figure 4.9. The fit parameters A, B
and aE are summarised in Table 4.5. Increase in i with temperature is attributed to higher
symmetry of activation barrier, as discussed by Rose et al. [114]. A similar trend is observed
in present work as well. aE at tungsten electrode was estimated in the range 32-36 kJ mol-1
from polarization and polarization+voltammetry data, which is considered to be in close
agreement while that at liquid cadmium electrode is 26.1±1.9 kJ mol
−1. This is quite close to
the activation energy of U3+
|U couple in LiCl-KCl eutectic reported at 34.4 kJ mol−1
by Rose
et al [114] by polarization method. On the other hand, aE for anodic dissolution of thorium is
17.2 ± 0.8 kJ mol−1
, which is about 18 kJ mol−1
less than calculated for tungsten electrode.
The difference of 8 kJ mol-1
can be considered marginal.
Figure 4.8 Temperature dependence of ln i at tungsten electrode (cathodic polarization), fits
of only polarization data and polarization+voltammetry data (Chapter 3) are shown.

83
Figure 4.9 Temperature dependence of ln i at liquid cadmium (cathodic polarization) and
for anodic dissolution of thorium in LiCl-KCl eutectic melt.
Table 4.5 Fit parameters of ln i versus 1/T plot for cathodic and anodic polarization data.
Electrode/Type of polarization A B Ea
(kJ mol-1
)
Inert (cathodic)a 8.7 ± 2.1 4315 ± 522 35.9 ± 4.3
Inert (cathodic)b 4.50 ± 1.9 3821 ± 502 31.8 ± 4.2
Liq. Cadmium (Cathodic)a 0.97 3140 ± 273 26.1 ± 1.9
Thorium (Anodic)a 0.44 2066 ± 118 17.2 ± 0.8
Fit using both Tafel and Allen-Hickling data
Fit using both polarization and cyclic voltammetry datab
a
4.5 Conclusions
Electrochemical behaviour of thorium in LiCl-KCl eutectic was investigated in the present
work with special emphasis on the determination of i for both cathodic and anodic
polarization. Following conclusions are made based on investigations carried out in this
chapter:
1. i estimated by both Tafel and Allen-Hickling methods was found to be in excellent
agreement.

84
2. Observed insignificant variation of i with concentration of ThCl4 in the concentration
range chosen for the thesis. i varies in the range of 20-50 mA cm−2
in the temperature range
698-798 K.
3. i estimated by method of Cumberland and Yim was found to be in good agreement with
those estimated by polarization methods. Agreement is expected to be better the data is
normalized with respect to concentration of thorium employed in measurements.
4. Temperature dependence of i was found to follow Arrhenius equation, from which the
activation energy associated with redox couple was determined.

85
CHAPTER 5
Anodic dissolution of Th and cathodic deposition of Th4+
at inert tungsten
and cadmium electrodes by electrochemical impedance spectroscopy
Results and discussions
This chapter describes investigations on electrochemical behaviour of Th4+
|Th couple at inert
tungsten, liquid cadmium and thorium electrodes in LiCl-KCl eutectic melt by
electrochemical impedance spectroscopy. Complex impedance data recorded at different
electrodes were validated by Kramers-Kronig transforms and analysed by equivalent circuit
models. Mechanism of anodic dissolution was proposed based on analysis of complex
impedance data by equivalent circuit fitting. The chapter concludes with estimation of
heterogeneous rate constant from charge transfer resistance of Th4+
|Th couple estimated from
equivalent circuit fitting and reversibility of Th4+
|Th couple in LiCl-KCl eutectic melt is
finally discussed. Equivalent circuit shown in Figure 5.1 (reproduced from Figure 2.13,
Chapter 2) was used for fitting of complex impedance spectra.
Figure 5.1 Equivalent circuit used for fitting complex impedance data for cathodic
polarization of thorium at inert tungsten and cadmium electrodes and anodic polarization of
metallic thorium electrode.
5.1 Cathodic: at inert tungsten electrode
Complex impedance spectra were recorded for cathodic polarization of Th4+
at inert tungsten
electrode in LiCl-KCl eutectic melt at applied potentials in the range of -0.80 V to -1.57 V,

86
which covered the complete potential domain in the cathodic sweep and are shown in Figure
5.2.
The impedance plots are characterized by a flattened semicircle at higher frequencies and a
linear region at lower frequencies. The flattened semicircle suggests a very fast charge
transfer process whereas the linear part is related to the mass transfer of Th4+
ions. In the
potential region -0.80 V -1.20 V, the kinetically controlled region is not well defined and
therefore, the process is always diffusion controlled. The linear parts of the plots extend in a
similar manner at all applied potentials and their slope is 1.20 at -0.80 V, 0.81 at -1.00 V and
0.85 at -1.20 V.
a

87
b
c
Figure 5.2 Nyquist plots of ThCl4 at inert tungsten electrode in LiCl-KCl eutectic melt,
4
-4 -31.02 10 ThClC mol cm , T = 773 K, A = 0.25 cm2, Frequency range of measurement: 10
Hz to 10 kHz.
The semicircle in high frequency range becomes more prominent at higher cathodic applied
potentials whereas the linear region spreads over a limited frequency range as evident from
the impedance plots at -1.40 V and -1.46 V in Figure 5.2b. This is suggestive of the reduction
of thorium under mixed control due to semi-infinite Warburg diffusion (mass transfer
control) and charge transfer (kinetic control). At -1.46 V, predominating feature is charge
transfer and the process is pure kinetic controlled with a linear region having slope of 0.81.

88
Impedance plots recorded at -1.55 V and -1.57 V shown in Figure 5.2c are similar to each
other except that in the latter; semicircle appears less prominent than it is in the former. The
linear region at -1.57 V (slope of 0.81) is also spread in a larger frequency range than it is at -
1.55 V (slope of 0.51). This suggests that the process is diffusion controlled at -1.57 V and is
under mixed control at -1.55 V. Complex impedance spectra recorded at equilibrium potential
of Th4+
|Th couple at various temperatures are shown in Figure 5.3.
Figure 5.3 Nyquist plots of ThCl4 at inert tungsten electrode in LiCl-KCl eutectic
at 4+Th |Th
eqE versus Ag+|Ag reference,
4
-4 -31.02 10 ThClC mol cm , T = 698-773 K, A = 0.25
cm2, Frequency range of measurement: 10 Hz to 10 kHz.
The equivalent circuit fitting of impedance plots are also shown in Figure 5.2 and the values
of sR , ctR , 1Q and 2Q obtained are provided in Table 5.1. The following observations are made
from the equivalent circuit fits:
a. sR varies by 127 mΩ in the potential range -0.8 to -1.57 V and can be considered as
constant.
b. ctR gradually decreases with increase in cathodic applied potential, goes through a
minimum and increases again. The potential at which it is minimum corresponds to the

89
equilibrium potential of thorium. For example, ctR is 991 mΩ at -1.46 V and increases
gradually to 1701 mΩ at -1.57 V.
c. Constant phase element Q1 is characterized to be Warburg impedance (diffusion related
impedance) by m value about 0.5. Beyond the equilibrium potential of -1.46 V, m
increases to 0.56 at -1.47 V and 0.65 at -1.55 V.
d. Constant phase element Q2 is characterized to be double layer capacitance by m value
around 1.0, although it decreases to 0.80 at -1.5 V and 0.75 at -0.57 V.
Variation of ctR was also studied as a function of applied potential at 773 K and is shown in
Figure 5.4. The plot can be divided into three linear regions; first region spans-0.80 V to -
1.40 V, second region spans -1.40 V to -1.50 V and the third region is from -1.50 V to -1.57
V. Each region can be approximated by a straight line spanning the applied potential range.
Figure 5.4 Variation of ctR versus applied potential at tungsten electrode (cathodic),
4
-4 -31.02 10 ThClC mol cm , A=0.25 cm2, T=773 K.
The points of intersection are found at -1.401 V and -1.461 V that can be considered as onset
of thorium deposition and equilibrium potential of thorium at tungsten electrode. This is in
general agreement with that measured from cyclic voltammograms, which is discussed in

90
Chapter 3. This analysis is similar to that carried out by Bachtler et al. [115] for elucidating
the mechanism of tantalum in molten alkali chlorides.
Table 5.1 EIS data of cathodic polarization of thorium in LiCl-KCl-ThCl4 electrolyte at
tungsten electrode, 4
4 -3
ThCl 1.02 10 mol cmC , A = 0.25 cm2.
T / K E / V Rs
(mΩ)
Rct
(mΩ)
Q1 Q2
Y0×102 m Y0×10
3 m
698 -0.7 946 4364 0.33 0.70 0.29 0.89
-0.8 942 4254 0.29 0.72 0.32 0.86
-0.9 948 3661 0.32 0.71 0.27 0.87
-1.0 966 3682 0.294 0.76 0.27 0.88
-1.1 956 3611 0.35 0.75 0.27 0.89
-1.2 948 3534 0.43 0.72 0.33 0.92
-1.3 940 2853 0.61 0.66 0.54 0.95
-1.4 944 2791 0.64 0.68 0.38 0.93
-1.5 949 2322 0.75 0.67 0.37 0.93
-1.55 952 1922 2.77 0.43 0.23 1.00
-1.6 903 1853 7.69 0.44 1.27 0.82
-1.65 912 2234 1.74 0.57 0.88 0.87
723 -0.9 902 3883 0.37 0.70 0.27 0.88
-1.0 905 3801 0.42 0.69 0.25 0.89
-1.1 888 3661 0.48 0.68 0.31 0.88
-1.2 896 3262 0.56 0.66 0.26 0.92
-1.3 891 2223 0.93 0.60 0.31 1.00
-1.4 899 1752 0.87 0.60 0.21 0.98
-1.5 898 1884 1.19 0.55 0.23 0.99
-1.52 874 1781 1.81 051 0.27 0.95
-1.53 796 1593 2.29 0.57 2.34 0.75
-1.55 832 2041 5.33 0.46 2.52 1.00
-1.6 800 2131 2.32 0.56 14.99 1.00
748 -1.0 900 2691 0.84 0.55 0.09 0.97
-1.10 882 2213 0.97 0.56 0.14 0.97
-1.40 864 1384 1.79 0.47 0.16 1.00
-1.50 831 3312 0.60 0.64 9.78 1.00
-1.55 788 815 11.65 0.47 40.93 1.00
773 -0.8 717 2781 0.74 0.59 0.06 0.79
-0.9 844 2234 1.10 0.52 0.08 1.00
-1.0 844 2034 1.71 0.45 0.08 1.00
-1.20 836 1651 1.80 0.47 0.11 1.00
-1.30 831 1632 2.92 0.42 0.28 0.93
-1.40 806 1393 4.34 0.39 0.29 0.94
-1.45 827 1172 4.18 0.46 0.33 0.91
-1.46 819 991 4.68 0.50 0.54 0.91
-1.47 820 1021 5.33 0.56 2.02 0.99
-1.48 682 1183 0.99 0.57 14.06 1.00
-1.50 744 1291 9.93 0.58 5.15 0.80

91
-1.55 762 1316 3.98 0.65 3.38 0.84
-1.57 743 1701 2.91 0.62 6.45 0.75
798 -0.9 749 4501 0.14 0.59 0.16 1.00
-1.0 760 3241 0.15 0.63 0.14 1.00
-1.10 758 2282 0.27 0.61 0.18 1.00
-1.11 748 1513 0.48 0.62 0.26 1.00
-1.20 749 1492 0.49 0.62 0.25 1.00
-1.30 754 911 0.57 0.57 0.30 1.00
-1.40 745 892 0.55 0.48 0.52 0.95
-1.50 730 673 0.56 0.53 0.46 0.99
5.2 Cathodic: at liquid cadmium electrode
Complex impedance plots of cathodic polarization of Th4+
at liquid cadmium electrode in
LiCl-KCl eutectic in the potential range of -0.90 V to -1.47 V are shown in Figure 5.5a and b.
Complex impedance plots at -0.90 V and -1.00 V in Figure 5.5a are similar to that recorded at
inert tungsten electrode (Figure 5.2a) consisting of a flattened semicircle at higher
frequencies, which is characteristic of a very fast charge transfer process at salt|cadmium
interface, and a linear region at lower frequencies, which is associated with semi-infinite
Warburg diffusion. Spread of linear region is more at applied potentials of -0.90 V and -1.00
V than it is at -1.10 V. Therefore, the process is controlled by mass transfer at these applied
potentials. The slope of linear region is 0.69 and 0.65 at -0.90 V and -1.00 V, respectively.
Impedance plots at potential -1.10 V in Figure 5.5a and -1.20 V in Figure 5.5b are very
similar with a limited linear region at lower frequencies and a more prominent semicircle at
higher frequencies and slope of linear region is 0.62 and 0.51 at -1.10 V and -1.20 V,
respectively. The process is kinetically controlled at these applied potentials. At -1.30 V, -
1.40 V and -1.47 V, complex impedance plots show a fairly small kinetically controlled
region at higher frequencies and a prominent linear region at lower frequencies. Although
some scattering in linear region is observed in the plots recorded at -1.30V and -1.40 V, it is
spread over large frequency range with slope 0.76 and 0.92, respectively. The scattering
observed at lower frequencies has been attributed to the movements of the liquid electrode

92
under polarization conditions [116]. At very large cathodic applied potentials, continuous
deposition of thorium may create movements on the surface of liquid cadmium leading to
scattering of data. Impedance plot at -1.47 V is similar to that at -1.40 V with slope of linear
region of 0.83.
a
b
Figure 5.5 Nyquist plots of ThCl4 at liquid cadmium electrode in LiCl-KCl eutectic melt,
4
-4 -31.02 10 ThClC mol cm , T = 773 K, A = 1.48 cm2, Frequency range of measurement: 10
Hz-10 kHz.

93
Complex impedance plots were fitted to an equivalent circuit shown in Figure 5.1 and they
are shown along with measured data in Figure 5.5. The values of sR , ctR , 1Q and 2Q obtained
from the fits are shown in Table 5.2 from which the following observations are made (at 773
K):
1. sR varies within 50 mΩ in the potential range of -0.9 to -1.50 V and can be considered as
constant.
2. Variation of ctR with applied cathodic potential is observed with gradual decrease in
ctR with increase in cathodic applied potential, goes through two minimum and increases
again. For example, at 773 K, onset of thorium deposition in cadmium is at -1.157 V and
formation of Cd11Th appears at -1.225 V. Onset of formation of Cd5Th appears at -1.434 V
whereas the peak potential is estimated at -1.447 V. These points were arrived in a similar
manner as explained above by joining points in a specified potential range by a straight line
and finding the potentials for onset of deposition, formation of Cd11Th and Cd5Th from the
points of intersection in the plot of ctR versus applied potential as shown in Figure 5.6. From
equivalent circuit fitting, minimum in ctR is obtained at -1.17 V (14 mΩ) and -1.42 V (21
mΩ).
3. Q1 is characterized to be Warburg impedance element by m value around 0.38 - 0.54 in the
potential range -0.90 V to -1.42 V.
4. Q2 is characterized to be double layer capacitance by m value of 1.00 in the potential range
-0.90 V to -1.50 V except at -1.37 V and -1.40 V, where it is 0.75 and 0.81, respectively.

94
Figure 5.6 Variation of ctR versus applied potential at liquid cadmium electrode (cathodic),
4
-4 -31.02 10 ThClC mol cm , T = 773 K, A = 1.48 cm2.
Table 5.2 EIS data of cathodic polarization of thorium in liquid cadmium,
4
-4 -31.02 10 ThClC mol cm , A = 1.48 cm2.
T / K E / V sR
(mΩ)
ctR
(mΩ)
1Q 2Q
Y0x102 m Y0x10
3 m
698 -0.90 694 796 6.24 0.40 0.63 0.89
-1.00 710 403 7.48 0.43 0.46 0.94
-1.15 718 195 7.61 0.45 0.73 0.91
-1.17 728 175 12.54 0.44 0.37 1.00
-1.20 721 70 35.49 0.44 1.47 1.00
-1.22 703 38 74.15 0.42 3.22 1.00
-1.25 683 30 109.5 0.37 2.35 1.00
-1.27 683 21 40.04 0.41 2.79 1.00
-1.30 684 23 52.21 0.43 1.95 1.00
-1.32 689 28 44.26 0.44 1.37 1.00
-1.35 696 39 45.90 0.46 0.69 1.00
-1.37 707 57 10.95 0.47 0.91 1.00
-1.39 707 130 10.16 0.51 1.19 1.00
-1.40 703 115 11.20 0.51 1.46 1.00
-1.42 698 107 13.57 0.52 1.92 1.00
-1.45 693 84 17.59 0.52 2.65 1.00
-1.47 691 67 22.18 0.51 3.33 1.00
-1.50 688 45 32.90 0.48 3.59 1.00
-1.55 685 59 63.73 0.46 6.59 0.98
-1.60 665 33 147.5 0.31 2.58 1.00
723 -0.90 628 278 3.08 0.38 0.24 0.94
-1.00 615 176 2.59 0.44 0.08 1.00
-1.10 631 101 3.23 0.39 0.17 0.95
-1.2 693 28 43.64 0.36 0.81 1.00

95
-1.25 660 13 122.4 0.35 4.19 1.00
-1.27 655 14 96.31 0.37 4.07 1.00
-1.29 656 16 55.84 0.41 2.93 1.00
-1.32 667 29 22.00 0.45 0.90 1.00
-1.34 693 86 13.98 0.47 1.33 1.00
-1.35 694 99 12.50 0.47 1.20 1.00
-1.37 690 83 11.40 0.47 1.03 1.00
-1.39 683 110 11.35 0.49 1.16 1.00
-1.40 679 117 11.77 0.51 1.33 1.00
-1.44 658 240 11.54 0.58 27.56 0.72
-1.45 661 210 16.16 0.55 12.85 0.83
-1.47 660 76 23.30 0.52 3.53 1.00
-1.49 638 19 35.83 0.45 1.98 1.00
-1.50 643 21 38.92 0.46 1.92 1.00
748 -0.90 613 566 2.84 0.38 0.36 0.94
-1.00 604 479 2.92 0.38 0.61 0.87
-1.10 679 333 6.25 0.43 0.26 1.00
-1.12 686 228 9.03 0.44 0.30 1.00
-1.14 692 106 15.35 0.43 0.47 1.00
-1.16 685 63 27.82 0.41 1.25 1.00
-1.18 667 37 53.44 0.40 3.05 1.00
-1.20 640 15 101.3 0.35 3.36 1.00
-1.22 630 14 150.5 0.35 4.68 1.00
-1.24 633 30 133.5 0.45 12.83 1.00
-1.26 633 35 98.27 0.47 11.69 1.00
-1.28 640 43 57.21 0.50 8.07 1.00
-1.30 636 53 41.18 0.46 0.71 1.00
-1.32 649 25 26.04 0.45 1.16 1.00
-1.34 672 31 18.44 0.43 0.98 1.00
-1.35 694 34 17.61 0.42 1.15 1.00
-1.36 653 46 17.63 0.44 0.63 1.00
-1.38 642 91 37.73 0.68 25.85 0.89
-1.40 639 95 29.55 0.64 11.97 0.95
-1.42 644 63 40.68 0.55 5.50 1.00
-1.45 633 19 46.68 0.48 2.76 1.00
-1.50 638 17 54.67 0.45 2.86 1.00
773 -0.90 669 446 4.14 0.42 0.22 1.00
-1.00 663 264 4.95 0.39 0.20 1.00
-1.10 666 32 12.01 0.38 0.24 1.00
-1.15 667 18 40.13 0.37 1.40 1.00
-1.17 636 14 71.36 0.34 2.06 1.00
-1.20 617 30 140.6 0.33 4.84 1.00
-1.22 618 12 156.7 0.41 13.08 1.00
-1.25 609 16 141.4 0.36 6.09 1.00
-1.27 613 28 84.84 0.39 3.81 1.00
-1.30 624 60 39.55 0.40 1.43 1.00
-1.35 642 331 26.07 0.42 1.64 1.00
-1.37 628 261 16.97 0.58 20.07 0.75
-1.40 642 80 18.37 0.61 17.01 0.81
-1.42 652 21 30.88 0.54 7.17 1.00

96
-1.45 634 31 48.77 0.45 2.85 1.00
-1.47 634 62 61.18 0.43 4.94 1.00
-1.50 633 446 25.65 0.46 6.87 1.00
798 -0.80 531 316 6.74 0.37 0.097 1.00
-0.90 556 180 6.47 0.37 0.079 1.00
-1.00 645 93 7.84 0.38 0.22 1.00
-1.10 655 53 21.09 0.38 0.40 1.00
-1.15 619 22 72.65 0.33 1.44 1.00
-1.17 619 33 106.8 0.38 5.49 1.00
-1.20 606 23 189.5 0.36 10.45 1.00
-1.22 604 29 183.0 0.40 13.74 1.00
-1.25 604 24 128.0 0.40 10.68 1.00
-1.27 611 36 76.49 0.43 7.05 1.00
-1.30 621 46 45.27 0.42 3.38 1.00
-1.32 626 48 40.06 0.40 2.44 1.00
-1.35 624 61 34.33 0.42 2.38 1.00
-1.37 619 73 31.21 0.46 2.83 1.00
-1.40 598 30 39.99 0.43 1.32 1.00
-1.42 594 24 48.50 0.44 1.78 1.00
-1.45 592 21 64.64 0.43 2.56 1.00
-1.47 591 16 77.94 0.44 3.310 1.00
-1.50 595 34 86.09 0.53 18.10 1.00
-1.55 591 28 122.7 0.57 31.33 1.00
5.3 Anodic dissolution of Th electrode
Complex impedance spectra of anodic dissolution of thorium in LiCl-KCl eutectic melt in the
potential range of -1.43 V to -1.34 V are shown in Figure 5.7. Impedance spectra are
characterized by a very prominent semicircle at higher frequencies and a comparatively
smaller linear region at lower frequencies. As the applied potential is anodically increased the
frequency of onset for linear region gradually decreases, which is evident from Figure 5.7.
For example, impedance spectra recorded at -1.43 V at 773 K (Figure 5.7d) has the onset of
linear region at 1052 Hz whereas at -1.34 V, it appears at 370 Hz leading to lowering of
ctR with increase in the anodic applied potential. The charge transfer process at higher
frequencies is associated with a large capacitive contribution due to continuous accumulation
of Th4+
ions near the Th|melt interface as a result of anodic polarization of thorium. Another
feature in the impedance plots that is distinctly different from that in Figure 5.2 and 5.5 is the

97
slope of the linear region at lower frequencies, which varies from 1.33 to 1.59 in the applied
potential range of -1.34 V to -1.43 V.
a
b

98
c
d

99
e
Figure 5.7 Nyquist plots of thorium electrode (anodic) in LiCl-KCl-ThCl4,
4
-4 -31.02 10 ThClC mol cm , T = 698-798 K, A = 1.5 cm2, Frequency range of measurement:
10Hz-10 kHz.
A diagrammatic representation of the anodic dissolution of thorium is shown in Figure 5.8
that comprises of following three steps:
1. Step 1 (Oxidation of Th to Th4+
and semi-infinite Warburg diffusion of Th4+
): At an
applied potential of -1.430 V, which is 50 mV more anodic than the equilibrium potential, Th
anodically dissolves to form Th4+
in the melt and this process is kinetically controlled at
higher frequencies (5 kHz -1 kHz). At lower frequencies (<1 kHz), semi-infinite Warburg
diffusion prevails and there is no restricted diffusion of Th4+
as the coverage or accumulation
of Th4+
at the Th|melt interface is not uniform (Figure 5.8a).
2. Step 2 (Double layer charging at Th|melt interface): As the applied potential is anodically
increased, accumulation of Th4+
at Th|melt also increases due to contribution of double layer
charging effects. This is reflected in the impedance plots by a large semicircle at higher
frequencies due to high capacitive contribution. The subsequent diffusion of Th4+
is largely
semi-infinite in nature (Figure 5.8b).

100
3. Step 3 (Increased capacitive contribution due to partial accumulation of Th4+
): With
increased anodic polarization of thorium, there is an increase of Th4+
ions at Th|melt interface
leading to partial blocking of ions diffusing in bulk, although the diffusion remains semi-
infinite Warburg type (Figure 5.8c). Due to this phenomenon, which is largely transient in
nature, the slope of the complex impedance plot is greater than 0.5. For example, slope of
linear region of impedance plots recorded at -1.35V, -1.38 V, -1.40 V and -1.43 V are 1.33,
1.54, 1.70 and 1.59, respectively. The accumulation of Th4+
leads to large capacitive
contribution, which is reflected in impedance plots shown in Figure 5.7.
(a) Step 1: Oxidation of Th to Th4+
and semi-infinite Warburg diffusion of Th4+
(b) Step 2: Double layer charging at Th|melt interface and semi-infinite Warburg diffusion of
Th4+
. Capacitive contribution to charge transfer process also increases.

101
(c) Step 3: Partial accumulation of Th4+
leading to large capacitive response. Diffusion of
Th4+
remains semi-infinite.
Figure 5.8 Diagrammatic representation of anodic dissolution of thorium in LiCl-KCl
eutectic melt; distinct features of complex impedance plots include large capacitive response
at higher frequencies and slope of linear region at lower frequencies greater than 1.0; -1.435
V is the equilibrium potential for thorium dissolution.
The complex impedance spectra were fitted to an equivalent circuit shown in Figure 5.1 and
fitted values of sR , ctR , Q1 and Q2 thus obtained are shown in Table 5.3 from which the
following observations are made (at 773 K):
1. sR varies within 2 mΩ in the potential range -1.34 to -1.43 V and can be considered as
constant. It is observed that Rs value is 450 mΩ higher than that obtained in fits for inert
tungsten and liquid cadmium electrodes.
2. ctR gradually decreases with increasing anodic potential and the variation is not more than
10 mΩ in potential range -1.34 to -1.43 V.
3. Q1 is characterized to be Warburg impedance element by fitted m value around 0.70.
4. Q2 is characterized to be double layer capacitance by m value of 1.00 at all applied
potentials.
The variation of Rct with applied potential is shown in Figure 5.9, which shows that there is a
gradual decrease in Rct when potential varied anodically from -1.43 V to -1.40 V after which

102
it decreases more rapidly in the potential range of -1.39 V to -1.34 V even though the overall
change in Rct is small. The onset of thorium dissolution is estimated at -1.401 V from
Figure 5.9.
Figure 5.9 Variation of Rct versus applied potential for Th electrode (anodic),
4
-4 -31.02 10 ThClC mol cm , T=773 K.
Table 5.3 EIS data of anodic polarization of thorium electrode in LiCl-KCl-ThCl4 electrolyte,
4
-4 -31.02 10 ThClC mol cm , A = 1.5 cm2.
T / K E / V Rs
(mΩ)
Rct
(mΩ)
Q1 Q2
Y0x102 m Y0x10
3 m
698 -1.40 1277 109.9 2.26 0.51 3.24 0.99
-1.41 1277 118.7 2.25 0.55 3.09 0.98
-1.42 1277 122.2 2.56 0.51 2.61 0.98
-1.43 1279 125.0 2.74 0.49 2.24 0.97
-1.44 1282 127.3 2.36 0.51 2.26 0.96
-1.45 1285 127.5 2.27 0.51 2.11 0.96
-1.46 1289 128.1 2.03 0.52 1.97 0.96
-1.47 1291 128.7 1.83 0.54 1.99 0.95
-1.48 1294 129.3 1.68 0.55 1.67 0.96
-1.49 1294 129.7 1.67 0.55 1.67 0.96
723
-1.38 1337 57.9 1.36 0.68 8.16 1.00
-1.39 1340 59.4 1.35 0.67 8.30 1.00
-1.40 1341 61.4 1.29 0.67 7.33 1.00
-1.41 1343 63.5 1.22 0.67 6.60 1.00
-1.42 1344 66.3 1.19 0.66 5.74 1.00
-1.43 1345 69.1 1.15 0.66 5.14 1.00

103
-1.44 1347 71.9 1.12 0.66 4.72 1.00
-1.45 1349 74.4 1.10 0.65 4.28 1.00
-1.46 1351 75.2 1.10 0.65 4.09 1.00
-1.47 1354 76.7 1.12 0.64 4.03 1.00
748 -1.36 1199 43.1 1.79 0.64 16.83 1.00
-1.37 1198 45.5 1.64 0.65 15.33 1.00
-1.38 1199 47.8 1.52 0.66 14.16 1.00
-1.39 1199 50.6 1.38 0.67 13.10 1.00
-1.40 1199 53.8 1.31 0.67 12.17 1.00
-1.41 1200 56.8 1.17 0.68 11.28 1.00
-1.42 1200 60.0 1.11 0.69 10.62 1.00
-1.43 1201 62.0 1.01 0.70 10.15 1.00
-1.44 1199 62.0 1.00 0.70 9.81 1.00
-1.45 1200 64.6 1.01 0.70 9.72 1.00
773 -1.34 1128 38.4 1.48 0.70 26.06 1.00
-1.35 1129 40.3 1.35 0.71 24.18 1.00
-1.36 1129 42.6 1.27 0.72 22.37 1.00
-1.37 1129 43.7 1.22 0.72 21.62 1.00
-1.38 1129 47.1 1.16 0.72 19.57 1.00
-1.39 1129 49.1 1.11 0.72 18.64 1.00
-1.40 1129 51.1 1.07 0.72 17.98 1.00
-1.41 1129 51.9 1.06 0.71 16.99 1.00
-1.42 1129 53.6 0.98 0.72 17.37 1.00
-1.43 1130 54.4 0.94 0.73 17.48 1.00
798 -1.32 1036 27.92 2.45 0.59 35.01 1.00
-1.33 1035 31.01 2.26 0.61 33.04 1.00
-1.34 1035 32.2 2.02 0.62 30.74 1.00
-1.35 1035 35.0 1.61 0.67 29.39 1.00
-1.36 1034 36.0 1.67 0.65 27.52 1.00
-1.37 1306 37.8 1.45 0.67 26.63 1.00
-1.38 1033 40.2 1.38 0.68 25.79 1.00
-1.39 1033 41.5 1.29 0.68 25.14 1.00
-1.40 1034 41.8 1.19 0.69 25.06 1.00
-1.41 1035 42.7 1.15 0.70 25.19 1.00
5.4 Validation of complex impedance data by Kramers-Kronig transforms
Validation of complex impedance data recorded at inert tungsten, liquid Cd and thorium
electrodes were carried out using Kramers-Kronig transforms. Figure 5.10 shows the
Kramers-Kronig validation of impedance data recorded at -0.8 to -1.57 V at inert tungsten
electrode and the residual relative errors Re,i and Im,i between the K-K transforms and real

104
and imaginary part of the complex impedance data calculated using Equations 2.8 and 2.9
(discussed in Chapter 2) are shown in Figure 5.10. The relative residual error varies by less
than 2% and is more pronounced at higher log . The compliance of K-K transforms
calculated frequency dispersion and measured data can be considered good with χ2
value of
1.71×10⁻⁴
to 2.7×10⁻⁶
in that potential range.
(a) K-K compliance fit (b) Fit residuals Re, Im,iandi
(c) K-K compliance fit (d) Fit residuals Re, Im,iandi

105
(e) K-K compliance fit (f) Fit residuals Re, Im,iandi
(g) K-K compliance fit (h) Fit residuals Re, Im,iandi
(i) K-K compliance fit (j) Fit residuals Re, Im,iandi

106
(k) K-K compliance fit (l) Fit residuals Re, Im,iandi
(m) K-K compliance fit (n) Fit residuals Re, Im,iandi
Figure 5.10 Validation of complex impedance data recorded at inert tungsten electrode using
Kramers-Kronig transforms. K-K compliance fit, fit residuals Re, Im,iandi are shown for
cathodic potentials of –0.8 to -1.57 V, T = 773 K, A = 0.25 cm2.
Validation of complex impedance data recorded at liquid cadmium electrode was carried out
in a similar manner as described above. K-K compliance fit of impedance data recorded at
0.90 to -1.47 V and the variation of Re,i and Im,i with log are shown in Figure 5.11. A
good K-K compliance fit is obtained for the measured data and the relative residual errors
vary within 2% with χ2 value of 4.8×10
-5 to 8.9×10
-6 in that potential range, but with small
oscillations at lower and higher frequencies.

107
(a) K-K compliance fit (b) Fit residuals Re, Im,iandi
(c) K-K compliance fit (d) Fit residuals Re, Im,iandi
(e) K-K compliance fit (f) Fit residuals Re, Im,iandi

108
(g) K-K compliance fit (h) Fit residuals
Re, Im,iandi
(i) K-K compliance fit (j) Fit residuals
Re, Im,iandi
(k) K-K compliance fit (l) Fit residuals
Re, Im,iandi

109
(m) K-K compliance fit (n) Fit residuals
Re, Im,iandi
Figure 5.11 Validation of complex impedance data recorded at liquid cadmium electrode
using Kramers-Kronig transforms. K-K compliance fit and fit residuals Re, Im,iandi are
shown for cathodic potential of -0.90 to -1.47 V, T = 773 K, A = 1.48 cm2.
Complex impedance data of metallic thorium electrode recorded in the potential range -1.35
to -1.43 V were validated by K-K transforms. K-K compliance fit and plot of relative residual
errors at these potentials are shown in Figure 5.12. A good compliance between measured
data and K-K transforms is seen and Re,i and Im,i vary within 0.5% with χ2value of 6.5×10
-7
to 8.2×10⁻⁷
in that potential range.
(a) K-K compliance fit (b) Fit residuals Re, Im,iandi

110
(c) K-K compliance fit (d) Fit residuals Re, Im,iandi
(e) K-K compliance fit (f) Fit residuals Re, Im,iandi
(g) K-K compliance fit (h) Fit residuals Re, Im,iandi
Figure 5.12 Validation of complex impedance data recorded at metallic thorium electrode
using Kramers-Kronig transforms. K-K compliance fit and fit residuals Re, Im,iandi are
shown for anodic potentials of -1.35 to -1.43 V, T = 773 K, A = 1.5 cm2.

111
5.5 Reversibility of Th4+
|Th couple
Reversibility of Th4+
|Th couple was studied by estimating heterogeneous rate constant ( sk )
which is a measure of electrode kinetics. ctR estimated for applied potentials near equilibrium
potential of thorium at inert tungsten (cathodic) and metallic thorium (anodic) electrodes by
equivalent circuit fitting was used to calculate heterogeneous rate constant sk using the
following expression [65, 117, 118]:
4
2 2 2s
ct Th
RTk
n F AR C
(5.1)
where, 4+
-4 -3
Th1.02×10 molcmC . Values of ctR and sk are tabulated in Table 5.4. Variation of
ln .1/sk vs T for cathodic and anodic polarization cases is shown in Figure 5.13 and expressed
as
Cathodic:
3(6.27 0.88) 10ln (2.491 1.181)
(K)sk
T
(5.2)
Anodic:
3(6.53 0.74) 10ln (3.939 0.992)
(K)sk
T
(5.3)
Table 5.4 sk estimated for cathodic and anodic polarization of thorium in LiCl-KCl eutectic.
System 698 K 723 K 748 K 773 K 798 K
Cathodic
(inert)
Rct
(mΩ) 1853 1593 1384 991 911
Ks×103
(cm s-1
) 1.66 0.01 2.01 0.03 2.39 0.04 3.44 0.11 5.25 0.22
Anodic
Rct
(mΩ) 129.7 76.7 64.6 54.4 42.7
Ks×103
(cm s-1
) 4.03 0.05 7.08 0.10 8.62 0.22 10.58 0.39 14.15 0.70
The activation energy for charge transfer process was estimated at 52.1±7.3 kJ mol-1
(cathodic, inert tungsten) and 54.3±6.2 kJ mol-1
(anodic, thorium electrode). The reversibility
of Th4+
|Th couple was studied by Matsuda-Ayabe criteria given by the following expressions:

112
Reversible (Nernstian):1
2
15sk
Dn F
RT
(5.4)
Quasireversible: 2(1 )
1
2
10 15sk
Dn F
RT
(5.5)
Irreversible: 2(1 )
1
2
10sk
Dn F
RT
(5.6)
α = 0.70, 2(1 ) 410 3.98 10 and 4+ThD of Th
4+ was taken from Table 3.3 (discussed in
Chapter 3). Results are shown in Table 5.5 where, 1
2
sk
Dn F
RT
was estimated at 25 mV s-1
and
100 mV s-1
in the temperature range of 698-798 K. Calculations were also carried out at 10
mV s-1
, 50 mV s-1
and the results shown that they comply with inequality [70], and hence
Th4+
|Th couple is quasireversible in nature in the scan rate range 25-100 mV s-1
and
temperature range 698-798 K.
Figure 5.13 Temperature dependence of ln sk for cathodic (inert tungsten) and anodic
(thorium) polarization cases.

113
Table 5.5 Matsuda-Ayabe criteria applied to Th4+
|Th couple for cathodic and anodic
polarization cases in LiCl-KCl eutectic melt, 10-2(1+α)
= 3.98×10⁻⁴
for all cases.
System Scan rate
(mV s-1
) 1/2
sk
DnF
RT
698 K 723 K 748 K 773 K 798 K
Cathodic
(Inert)
25 0.405 0.459 0.486 0.617 0.851
100 0.203 0.229 0.243 0.308 0.425
Anodic
(Thorium)
25 0.983 1.619 1.752 1.898 2.292
100 0.492 0.809 0.876 0.949 1.146
5.6 Conclusions
The present study involved investigation on Th4+
|Th couple using electrochemical impedance
spectroscopy that was used to elucidate the contribution of kinetic and mass transfer process
during cathodic and anodic polarization of thorium in LiCl-KCl eutectic melt. Based on
experimental observations and analysis of EIS data following conclusions were drawn:
1. Reduction of Th4+
at inert tungsten and liquid cadmium electrodes was mainly charge
transfer controlled process near equilibrium potential and diffusion controlled process at
low and very high cathodic potentials.
2. Scattering of impedance data at low frequency observed at large applied cathodic potential
liquid cadmium electrode could be ascribed to movements of liquid cadmium surface due
to continuous deposition of thorium.
3. Variation of ctR versus applied potential showed one minimum for inert tungsten electrode
corresponding to equilibrium potential of thorium and two minimum at liquid cadmium
electrode corresponding to formation of Cd11Th and Cd5Th. Although this aspect was not
investigated in greater detail.

114
4. EIS study was used to address the reversibility of Th4+
|Th couple, which was found to be
quasireversible in the temperature range of 698-798 K using Matsuda-Ayabe criteria.

115
CHAPTER 6
Thermochemical evaluation of 4+Th h|TE and
4f ThClG in LiCl-KCl eutectic melt
Results and discussions
In this chapter, thermodynamic evaluation of 4+Th h|TE and
4f ThClG is performed based on
apparent standard electrode potential calculated in Chapter 3 and literature data.
Electromotive force measurements were carried out at various compositions of ThCl4 in LiCl-
KCl eutectic melt to estimate 4+Th h|TE and
4f ThClG from the variation of equilibrium
potential against4ThClln x and
4ThClx . The chapter concludes with recommendations
on 4+Th h|TE and
4ThCllnRT obtained from statistical data analysis. A summary of
electrochemical studies carried out in LiCl-KCl eutectic melt containing ThCl4 across various
research groups is presented in Table 6.1.

116
Table 6.1 Literature survey on thermodynamic behaviour of ThCl4 in LiCl-KCl eutectic melt.
Reference(s) AgClx
4ThClx Technique T / K Brief summary of work
Cassayre et al.[7] 3.9×10⁻³
3.51×10⁻³
to
4.79×10⁻³
OCP 693-823 Investigated electrochemical behaviour of Th4+
in
LiCl-KCl eutectic melt and reported 4+Th h|TE and
4ThCl values at various temperatures.
Chiotti et al. [9,
10]
1.31×10⁻²
1.74×10⁻⁴
to
6.65×10⁻⁵
emf 723-923 Carried out electromotive force measurements at
various compositions of ThCl4 in LiCl-KCl eutectic
melt and reported 4+Th h|TE and
4ThCl values at various
temperatures.
Inman et al. [14] 2.20×10⁻³
4.12×10⁻⁴
,
1.40×10⁻³
emf 673-773 Estimated thermodynamic properties such
as4f ThClG and
4ThCl in LiCl-KCl eutectic melt
Yang et al. [15] 8.00×10⁻²
,
8.05×10⁻²
,
7.62×10⁻²
4.8×10⁻⁴
to
3.77×10⁻³
emf 763-828 Carried out electromotive force measurements at
various compositions of ThCl4 in LiCl-KCl eutectic
melt and reported 4+Th h|TE and
4ThCl values at various
temperatures
Martinot et al.
[107]
2.0×10⁻³
2.8×10⁻³
to
12.9×10⁻³
emf 673-773 Carried out electromotive force measurements at
various compositions of ThCl4 in LiCl-KCl eutectic
melt and reported 4+Th h|TE and
4ThCl values at various
temperatures

117
6.1 Analysis of electromotive force data
4+Th |Th
eqE versus Ag+|Ag reference electrode at various
4
3 4
ThCl (3.26 10 to 8.05 10 )x in LiCl-
KCl eutectic melt was measured in the temperature range of 677-798 K for both heating and
cooling cycles. Average of equilibrium potential recorded in heating and cooling cycles is
graphically shown in Figure 6.1 and tabulated in Table 6.2.
The variation of 4+4
-
AgCl A| gCl 2 ThClTh Thln .Cl Cl .ln|eq RT
E E x vs vs xF
(Method of Roy et al.
[70, 71]) and 4+4 4
-
AgCl AgCl ThCl 2 ThClTh Th|ln - ln .Cl Cl .
4|eq RT RT
E E x x vs vs xF F
(Method of
Lantelme et al. [72-74]) at various temperatures with corresponding linear fits are shown in
Figure 6.2 and 6.3, respectively. In the method of Roy et al., 4+Th h|TE at any given temperature
T is obtained by extrapolating the linear fit to 4ThClln 0x or,
4ThCl 1x . Thus
4+Th h|TE obtained by this method can be said to be for ThCl4 at unit thermodynamic activity.
On the other hand, in the method of Lantelme et al., 4+Th h|TE at any given temperature T is
obtained by extrapolating the linear fit to4ThCl 0x . 4+Th h|T
E can thus be said to be for ThCl4
at infinite dilution in LiCl-KCl eutectic melt.

118
Figure 6.1 Equilibrium potential 4 |
eq
Th ThE measured against Ag
+|Ag reference electrode at
various 4ThClx and temperatures in LiCl-KCl eutectic melt.
Table 6.2 Equilibrium potential of Th4+
|Th couple measured against Ag+|Ag reference
electrode ( 3
AgCl 4.6 10x ).
T/K 4ThClx
33.26 10 31.94 10 31.23 10 48.05 10
4+Th |Th
eqE
678 -1.514 -1.525 -1.541 -1.552
689 -1.507 -1.519 -1.534 -1.545
699 -1.499 -1.512 -1.529 -1.538
709 -1.492 -1.506 -1.522 -1.533
719 -1.485 -1.500 -1.514 -1.528
729 -1.476 -1.494 -1.506 -1.519
739 -1.469 -1.487 -1.499 -1.514
749 -1.462 -1.481 -1.492 -1.505
759 -1.455 -1.476 -1.484 -1.499
769 -1.446 -1.467 -1.477 -1.494
779 -1.437 -1.458 -1.467 -1.483
799 -1.427 -1.449 -1.459 -1.477

119
Figure 6.2 Variation of 44|
-
2|ln . .lneq
AgCl AgCl ThClTh Th
RTE E x vs Cl Cl vs x
F
(Method of Roy
et al. [70, 71]) in LiCl-KCl eutectic melt.
Figure 6.3 Variation of 4+4 4
-
AgCl AgCl ThCl 2Th|Thl |n - ln . .
4
eq
ThCl
RT RTE E x x vs Cl Cl vs x
F F
(Method of Lantelme et al. [72, 73]) in LiCl-KCl eutectic melt.

120
4+Th h|TE estimated by these two methods are tabulated in Table 6.3. Temperature dependence
of 4+Th h|TE obtained from methods of Roy et al. and Lantelme et al. are respectively given by
Equations 6.1 and 6.2 respectively.
Table 6.3 Comparison of standard electrode potential of Th4+
|Th couple versus Cl−|Cl2
estimated in the present work with literature data.
Cassayre et al.[7] Yang et al.[15] Martinot et al.[107]
T(K) 4+ |Th Th
/ VE T(K) 4+ |Th Th
/ VE T(K) 4+ |Th Th
/ VE
693 -2.599 763 -2.733 673 -2.592a -2.664
b -2.525
c
733 -2.577 775 -2.728 723 -2.533 -2.650 -2.498
773 -2.559 787 -2.722 773 -2.536 -2.638 -2.472
798 -2.534 804 -2.715
823 -2.530 825 -2.704
Present work
T/K 4+ |Th Th
/ VE T/K 4+ |Th Th
/ VE
678 −2.581±0.007b −2.682±0.002
c 698 -2.695
d -2.698
e -2.718
f
689 −2.578±0.011 −2.676±0.002 723 -2.671 -2.670 -2.713
699 −2.568±0.008 −2.670±0.002 748 -2.651 -2.652 -2.705
709 −2.559±0.005 −2.665±0.001 773 -2.624 -2.619 -2.684
719 −2.550±0.004 −2.659±0.001 803 -2.606 -2.596 -2.669
729 −2.548±0.007 −2.653±0.001
739 −2.539±0.006 −2.647±0.001
749 −2.534±0.009 −2.640±0.001
759 −2.530±0.012 −2.633±0.001
769 −2.521±0.012 −2.628±0.001
779 −2.507±0.012 −2.619±0.001
799 −2.502±0.019 −2.614±0.002
a Method of Roy et al. [70, 71]
d By CP (Chapter 3)
b Method of Lantelme et al. [72, 73]
e By SIV (Chapter 3)
c Method of Knacke et al. [68]
f By CV (Chapter 3)

121
4+
- 4
2Th Th|.Cl Cl V 3.04| ( ) ( ) (2 0.017 6.838 0.241 )0 K) 1 (E vs T (6.1)
4+
- 4
2Th Th|.Cl Cl V 3.12| ( ) ( ) (0 0.010 6.435 0.136 )0 K) 1 (E vs T (6.2)
6.2 Data analysis and recommendations
Figure 6.4 shows graphical comparison of temperature dependence of 4+Th h|TE reported in
literature (presented in Table 6.3), and we make the following observations:
a. 4+Th h|TE reported by Yang et al. [15] falls in the potential region -2.733 to -2.704 V in
temperature range 763-825 K. These values are more cathodic compared to data of
Martinot et al. [107] estimated using the method of Knacke et al. [68] that lie in the
potential region -2.525 to -2.572 V in temperature range 673-773 K.
b. However, if Martinot et al. data are analysed by the methods of Roy et al.[70, 71] and
Lantelme et al. [72, 73], 4+Th h|TE lies in the range -2.592 to -2.539 V and -2.664 to -2.638
V in the same temperature range.
c. 4+Th h|TE estimated from the semi-integral voltammetry (SIV) and logarithmic analysis of
chronopotentiometry (CP) in the present work falls in the potential range -2.698 to -2.596
V in temperature range 698-803 K. On the other hand, 4+Th h|TE estimated from anodic
voltammograms (CV) of thorium electrode in the present work lies in more cathodic
potential region (from -2.718 to -2.669 V). Average variation in data is 21 to 68 mV in
the same temperature range.
d. Variation in 4+Th h|TE estimated from electromotive force data measured in thesis (Table
6.2) by the methods of Roy et al. and Lantelme et al. is only 10 mV, and that estimated
by the former method lies closer to data reported by Cassayre et al. [7].

122
e. Using method of Roy et al., 4+Th h|TE estimated from Martinot et al. data (-2.592 to -2.536
V) and that in present work (-2.581 to -2.502 V) agree well with each other.
f. Method of Lantelme et al. leads to more cathodic estimation of 4+Th h|TE has seen from
Martinot et al. data ( -2.664 to -2.638 V) as well as that measured in present work (-2.682
to -2.614 V), and both estimations agree well with each other.
Figure 6.4 Temperature dependence of 4+Th h|TE in LiCl-KCl eutectic melt reported by various
authors and in the present work. 4+Th h|TE of Martinot et al. [107] re-calculated using the
method of Roy et al. and Lantelme et al. are also shown. Individual linear fitting of
electromotive force and transient data along with the overall fit are also shown.
Based on above discussions, 4+Th h|TE versus T obtained from electromotive force and transient
measurements were independently least squares fitted to Equations 6.3 and 6.4. In case of
former, all data except that from Yang et al. [15] were included in least squares fitting. In

123
case of latter, both Cassayre et al. [7] and that from transient technique in present work
(discussed in Chapter 3) were included. Expressions for temperature dependence of
4+Th h|TE are, respectively given by,
4+
- 4
2Th Th|EMF: . Cl Cl V 2.| ( ) ( ) (998 0.189 5.594 2.57 1)1 0E vs T (6.3)
4+
- 4
2Th Th|| ( )Transient : .Cl Cl V 3.305 0.204 8.857 2.713 10( ) ( )E vs T (6.4)
Linear least squares fits are shown in Figure 6.4. As seen from figure, emf data fit lies closer
to Martinot et al. data (method of Roy et al.) and that estimated in present work (method of
Roy et al.). Transient data fit lies close to that estimated using SIV and CP (discussed in
Chapter 3). It is also seen that emf data fit also lies close to Cassayre et al. data [7], and
transient data fit lies close to the present work (method of Lanteleme et al.), and it also
intersects Martinot et al. data (using method of Lantelme et al.).
In order to obtain final expression for temperature dependence of 4+Th h|TE , we decided to give
higher weightage to emf data fit than to transient data fit that is based on the fact that
estimation of 4+Th h|TE by electromotive force method is considered more reliable and accurate
than that estimated using transient techniques. The overall fit expression of temperature
dependence of 4+Th h|TE combining Equations 6.3 and 6.4 is given by,
4+
- 4
2Th h|T.Cl Cl V 3.12| ( ) ( ) (1 0.195 6.900 2.628) 10E vs T (6.5)
Equation 6.5 is also represented in Figure 6.4. It lies close to data of Cassayre et al. [7] and
that estimated in thesis work (method of Lantelme et al.). Corresponding temperature
dependence of 4f ThClG is given by,
4
-1
f ThCl kJ mol 120( ) ( ) (4.7 75.3 0.266 0.101)G T (6.6)

124
6.3 Estimation of 4
.
ThCl
liq
For estimating 4ThCl in LiCl-KCl eutectic melt, Equation 2.22 was used, which is discussed
in Chapter 2. Thermochemical data of pure ThCl4 liquid for 4f ThCl , .liqG were taken from
Glassner [106], Martinot [107], Fuger [108], FactSage 6.4 database based on Barin and
Kubaschewski [110] and Fuger and Brown [119]. In studies on Th4+
|Th couple in LiCl-KCl
eutectic melt by Yang et al. [15], 4ThCl was reported in the range 0.59×10
−3 to 3.34×10
−3 in
the temperature range 768-823 K, and was based on Glassner’s expression on pure solid
ThCl4 valid in the temperature range 298-1043 K. Glassner had also obtained expression for
pure ThCl4 liquid valid in temperature range 1043-1195 K. The latter data was extrapolated
to the present temperature measurement range 678-798 K, and is compared in Figure 6.5
with4f ThCl , .liqG from Martinot [107], Fuger [108], FactSage 6.4 [109, 110] and Fuger and
Brown [119] and 4f ThCl ,sG from Glassner [106].
4f ThCl , .liqG of pure ThCl4 liquid in
temperature range 1043-1195 K obtained by Glassner is also shown.
We now refer to 4ThCl estimated using the hypothetical supercooled liquid reference data
(Figure 6.5) as 4
.
ThCl
liq , and the temperature dependence of 4
.
ThClln liqRT (or partial excess Gibbs
energy4ThCl
ex
G ) is shown in Figure 6.6. For sake of comparison, we have also
used4f ThCl ,sG data to estimate
4ThCl although we refer to it as 4
.
ThCl
liq in Figure 6.6.

125
Figure 6.5 Variation of 4f ThCl , .liqG of pure ThCl4 liquid (hypothetically supercooled) as
reference state versus T taken from different thermochemical data compilations [106-108,
110, 119], 4f ThCl , sG of pure solid ThCl4 from Glassner [106] is also shown.
There are two bands of data that are clearly seen. The first band is seen in the range -70 to -50
kJ mol-1
in which 4
.
ThClln liqRT estimated from 4f ThCl , .liqG data of Martinot [107], Fuger [108]
and FactSage [109, 110] are observed whereas the second band appears in the range -45 to -
35 kJ mol-1
in which 4
.
ThClln liqRT estimated from thermochemical data of Glassner [106] and
Fuger and Brown [119] are observed. Data of both pure solid and liquid ThCl4 from
Glassner’s compilation were used for the estimation, and 4
.
ThClln liqRT is seen to be closely
matching with each other although it has a positive temperature dependence. Data estimated
from Fuger and Brown shows that 4
.
ThClln liqRT is temperature independent and is constant at
around -45 kJ mol-1
.
For establishing average temperature dependence of4
.
ThClln liqRT , we find that values
estimated using Fuger and Brown [119] and Glassner [106] data are unlikely based on the
current understanding of complexation of Th4+
in LiCl-KCl eutectic melt. Calculated 4
.
ThCl
liq in

126
the temperature range 678-800 K varied from 3.7×10⁻⁴
to 1.2×10⁻³
and 4.5×10⁻³
to 1.43×10⁻²
,
respectively, and that calculated using Martinot [107], Fuger [108] and FactSage [110] is in
order of 10-5
.
Figure 6.6 Variation of 4
.
ThCl
liq in LiCl-KCl eutectic melt versus T estimated from various
thermochemical compilations. The recommended linear least square fit is also shown.
It is recommend that 4
.
ThClln liqRT estimated from Martinot [107], Fuger et al. [108] and
FactSage [110] only should be used to calculate the average temperature dependence, and is
given by the following expression obtained by linear least squares fitting:
4
.
l
-1
ThC (kJ mol ) = -(90428.5 12857.5) + (40.975 17.438)Tln liqRT (6.7)
Least squares fit is shown in Figure 6.6, and lies very close to values estimated by Fuger’s
data [108]. Comparison of calculated 4
.
ThCl
liq can be made with that reported by Dock [10]. In
this work, electromotive force measurements in LiCl-KCl eutectic melt were carried out at

127
various 4ThClx ranging from 1.74×10
-4 to 6.65×10
-2 in the temperature range 723-929 K using
2
AgCl 1.319 10x as reference. Temperature dependence of 4+Th |ThE was reported as
4+
-4
Th |Th= -3.009 + 6.776 10E T (6.8)
Dock’s electromotive force data were analyzed using methods of Roy et al. [70, 71] and
Lantelme et al. [72, 73]. However, it was seen that data at 773 K only could be used for the
analysis. 4+Th |ThE at 773 K was found to be -2.591 and -2.612 V, respectively using the two
methods. These values are quite close to that reported by Cassayre et al. [7] (-2.559 V) and
that reported in our earlier works using semi-integral voltammetry and chronopotentiometry
(-2.619 and -2.624 V) at 773K.
Dock estimated 4ThCl
s using pure solid ThCl4 as reference state, and also calculated4
.
ThCl
liq from
4ThCl
s using the following relation:
4
4 4
fus ThCl. fusThCl ThCl
fus
liq sH T T
RT T
(6.9)
Dock reported temperature and composition dependent expressions for4ThCl
s , and it ranged
from 0.569×10⁻³
to 3.298×10⁻³
in the above temperature range 753-929 K. These values were
similar to that reported by Yang et al. [15] suggesting that thermochemical data of pure solid
ThCl4 (used as reference state for calculating ThCl4) were taken from Glassner [106].
Glassner’s data estimates higher4ThCl
s in order of 10-3
. Therefore, Fuger’s and Barin and
Kubaschewski’s data (on which FactSage 6.4 databases are based) on4f ThCl , .liqG are more
reliable in estimating4ThCl , and consistent with currently accepted view of existence of high
degree of complexation of Th4+
in chloride melts.

128
6.4 Conclusions
In the present work, we have presented thermochemical evaluation of thermodynamic
properties of dilute solutions of ThCl4 in LiCl-KCl eutectic melt. As part of this work,
1. From the variation of 4+ AgCl AgClTh |Thlneq RT
E E xF
versus 4ThClln x and
4+4AgCl AgCl ThClTh |Th
ln ln4
eq RT RTE E x x
F F
versus4ThClx , 4+Th |Th
E was estimated in the
temperature range 698-798 K. The former method for estimation of 4+Th |ThE is
recommended as it is estimated from the approximation4ThCl 1x or,
4ThClln 0x . The
later method gives 4+Th |ThE is essentially standard electrode potential at infinite dilution i.e.
4ThCl 0x that tends to give more negative values of 4+Th |ThE .
2. 4+Th |ThE estimated from equilibrium (Chapter 6) and transient measurements (Chapter 3)
was fitted to single temperature dependence expression (Eq. 6.5) by giving a higher
weightage to data estimated by former method.
3. Temperature dependence of 4
.
ThClln liqRT was established by choosing pure ThCl4 in
hypothetically supercooled liquid as reference state (Equation 2.21, discussed in chapter
2). Various thermochemical compilations were used to estimate 4
.
ThCl
liq and the
recommended expression for temperature dependence of 4
.
ThClln liqRT is given by Equation
6.10, which suggests that4
.
ThCl
liq lies in the range 1.5×10⁻⁵
to 1.7×10⁻⁴
in the temperature
range 678-799 K. In order to obtain the recommended fit, 4
.
ThClln liqRT estimated using
thermochemical data of Glassner was not used as the data predicts more negative
4ThCl
ex
G at higher temperatures that cannot be substantiated. 4
.
ThClln liqRT is more or less
constant at all temperatures when Fuger and Brown data was used. These variations are
not in agreement with the current understanding of ideality in molten salts at higher
temperatures. The recommended fit for temperature dependence of 4
.
ThClln liqRT closely
matches with that estimated using thermochemical data of Fuger, which was also used by

129
Cassayre et al. for estimating4
.
ThCl
liq . Based on the current work, thermochemical data for
liquid ThCl4 by Fuger seems to be the most reliable data for estimation of4
.
ThClln liqRT .

130
CHAPTER 7
Electromotive force measurements on Cd-Th alloys in LiCl-KCl eutectic
melt
Results and discussions
This chapter discusses electromotive force measurements on Cd-Th alloys for determining
m nf Cd ThG of Cd11Th, Cd5Th, Cd23Th6 and Cd3Th intermetallics. m nf Cd ThH was estimated
from linear least squares fitting of m nf Cd Th .G vs T and was compared with that from
Miedema’s model. Partial molar enthalpy and entropy of Th and Cd were estimated at 723 K
and compared. The chapter concludes with discussion on the stability of these intermediates.
7.1 Electromotive force measurements of Cd-Th intermetallics
Cell configuration for all emf runs for various composition of Cd-Th alloys have been
described in Chapter 2. Reproducibility of emf at each temperature was checked by
temperature cycling in both heating and cooling modes. Time taken for stabilization of emf in
all the cell configuration depended on whether the two-phase alloys was solid or liquid. On
an average initial stabilization of emf at low temperature was about 10h and subsequent
attainment of equilibrium at higher temperature took about 2-3 h. This procedure was
repeated at each temperature in heating and cooling cycles.
Overall cell reaction of cells I-IV are given by,
11Cell I Th ( ) 11Cd ( .) Cd Th ( .)s liq liq
11 5
5 11Cell II Th ( ) + Cd Th ( .) Cd Th ( )
6 6s liq s
5 23 6
23 5Cell III Th ( ) + Cd Th ( ) Cd Th ( )
7 7s s s
23 6 3
3 23Cell IV Th ( ) + Cd Th ( ) Cd Th ( )
5 5s s s
Corresponding emf at cells I-IV measured in the temperature range of 673-799 K are
tabulated in Table 7.1 and graphically shown in Figure 7.1. Linear least squares fitting of

131
temperature dependence of emf ( IE , IIE , IIIE and IVE ) of Cells I-IV are given by Equations
7.1-7.4, respectively .
I (mV) (423.9 8.1) (0.283 0.011) (K)E T (7.1)
II (mV) (570.6 3.9) (0.495 0.005) (K)E T (7.2)
III (mV) (545.1 3.7) (0.491 0.005) (K)E T (7.3)
IV (mV) (270.3 1.9) (0.138 0.003) (K)E T (7.4)
Table 7.1 Electromotive force data of cells I, II, III and IV, superscription h and c refer to
measurements in heating and cooling cycles, respectively.
Cell I Cell II Cell III Cell IV
T/K emf (mV) T/K emf (mV) T/K emf (mV) T/K emf (mV)
673 236.51h 682 231.26
h 673 214.11
h 684 176.09
c
673 236.91c 684 231.67
c 682 208.92
c 686 175.18
h
698 226.37h 697 226.71
c 688 206.55
h 698 173.99
h
698 227.41c 698 225.28
h 693 204.42
c 702 173.35
c
703 223.16h 703 222.35
h 698 201.84
h 709 172.65
h
703 223.94c 713 218.44
h 709 196.67
h 712 171.38
c
713 221.68h 723 211.49
h 718 192.84
h 713 172.26
h
713 221.74c 727 210.77
c 722 192.26
c 723 171.02
h
723 218.32h 733 206.44
h 723 190.14
h 723 170.44
c
723 218.25c 744 202.13
h 732 186.96
c 733 169.21
h
748 211.91h 748 200.54
c 734 185.15
h 734 168.85
c
748 212.12c 754 196.58
h 744 180.21
h 748 166.96
c
763 207.76h 763 192.59
h 748 178.63
c 754 166.21
h
763 209.97c 773 187.47
c 754 175.63
h 763 165.96
c
773 205.49h 784 183.26
h 763 170.96
h 773 164.44
c
773 205.85c 788 180.65
c 763 170.19
c 764 165.33
h
799 173.87h 773 164.87
c 776 163.57
h
789 156.54c 789 160.53
c
790 157.23h 790 161.49
h
799 152.15h 800 159.64
h
: Heating, : Cooling
hc

132
Figure 7.1 emf data for cells I-IV, respective linear least square fits are also shown.
7.2 Estimation of m nf Cd ThG of Cd-Th intermetallics
11f Cd ThG using α-thorium and liquid cadmium as reference states was calculated using
Equation 2.29 (discussed in Chapter 2). m nf Cd ThG of Cd5Th, Cd23Th6 and Cd3Th intermetallic
compounds were calculated using Equations 2.30, 2.31 and 2.32, respectively (discussed in
Chapter 2). Temperature dependence of estimatedm nf Cd ThG of four Cd-Th intermetallics are
shown in Figure 7.2 and linear least squares fitting are given by following expressions:
11
-1
f Cd Th / Jmol-atom ( 13885.35 269.87) (9.44 0.37) (K)G T (7.5)
5Th
-1f Cd (K)/ Jmol-atom ( 32638.69 145.98) (25.94 0.19)G T (7.6)
23 6
° -1
f Cd Th / Jmol-atom ( 41219.89 68.27) (33.83 0.09) (K)G T (7.7)
3
° -1
f Cd Th / Jmol-atom ( 44636.91 44.92) (34.87 0.06) (K)G T (7.8)
In Figure 7.3 variation of m nf Cd ThG with Th composition (atom fraction of Th) in Cd-Th
intermetallics is shown and compared with f G of intermetallics of Fe-Th, Co-Th, Ni-Fe,

133
Cu-Th and Th-Zn systems. Variation of f G with composition was observed to be in similar
pattern for all systems.
Figure 7.2 Temperature dependence of m nf Cd ThG of Cd-Th intermetallics.
Figure 7.3 Comparison of f G as a function of Th composition for intermetallics of Cd-Th,
Fe-Th, Co-Th, Ni-Th, Cu-Th and Zn-Th systems [32, 35-37, 39].

134
m nf Cd ThH andm nf Cd ThS of Cd-Th intermetallics were estimated from intercept and slope of
the linear least squares fittings of m nf Cd Th .G vs T , respectively and tabulated in Table 7.2.
Percentage of volume contractions ( %V ) which were computed from the lattice parameter
data of Palenzona [52] for Cd-Th intermetallics are given in Table 7.2.
Table 7.2 Thermodynamic functions for the formation of Cd-Th intermetallics at 773 K.
Intermetallics m nf Cd Th
-1(kJ mol-atom )
G m nf Cd Th
-1(kJ mol-atom )
H m nf Cd Th
-1 -1(J mol-atom K )
S %V
Cd11Th -6.61±0.55 -13.88 ± 0.27 -9.43 ± 0.37 -1.68
Cd5Th -12.57±0.29 -32.64 ± 0.15 -25.94 ± 0.19 -13.72
Cd23Th6 -15.06±0.14 -41.22 ± 0.07 -33.83 ± 0.09 1.85
Cd3Th -17.73±0.09 -44.64 ± 0.45 -34.87 ± 0.06 0.24
ThH and ThS of Th in Cd-Th intermetallics were calculated in the thesis. From linear fits
of the data presented in Figure 7.1, ThS was calculated from the thermodynamic relation
given by Equation 7.9 [120].
ThTh
pp
G ES zF
T T
(7.9)
ThH was calculated from the Gibbs–Helmholtz relation given by Equation 7.10 [120].
Th
Th
2 2 ( / )
p
p
G
T E TH T zFT
T T
(7.10)
Partial thermodynamic quantities for Cd-Th intermetallics at 723 K which is near the mean of
temperature range of measurement are summarized in Table 7.3. The activity of thorium in
cadmium in Cd-Th two phase alloys was calculated from the emf data at each composition

135
according to the relationship given in Equation 2.21 (discussed in Chapter 2). Activity values
are given in Table 7.3.
Table 7.3 Partial molar quantities for Cd-Th intermetallics relative to α-Th (fcc) and liquid
cadmium (hcp) at 723 K.
Two phase region
-1
Th
J mol
H
-1
Th
-1J mol K
S
-1
Cd
J mol
H
-1
Cd
-1J mol K
S
6
Th 10a
Cd + Cd11Th -161797.11 -109.105 -402.30 -0.34 1.02
Cd11Th + Cd5Th -209811.71 -191.15 2335.61 5.92 6.70
Cd5Th + Cd23Th6 -203154.22 -189.47 812.61 5.37 16.5
Cd23Th6 + Cd3Th -100467.53 -53.25 -19523.12 -21.55 33.3
7.3 Comparison of m nf Cd ThH data with estimation using Miedema’s model
m nf Cd ThH of Cd-Th intermetallics was calculated using Miedema’s Model which is a semi-
empirical approach based on electronegativity ( * ), electron density at the boundary of the
Wigner-Seitz atomic cell ( wsn ) of the alloying elements [121-124]. According to the rule for
the metallurgical behaviour of transition metals in terms of the parameters * and wsn ,
if * 0.48 wsn , the two metals form intermetallic compound readily. For Cd-Th
system */ 0.48wsn , so Miedema’s Model is suitable for this system.
Experimental f H values were compared with theoretically calculated values by Miedema’s
Model. Good agreement was observed between experimental and Miedema’s estimation.
m nf Cd ThH values of Cd-Th intermetallics have also been compared with that of Fe-Th, Co-Th,
Ni-Th, Cu-Th and Th-Zn systems reported by Bailey et al. [32], Skelton et al. [35-37] and
Chiotti et al. [125]. Variation of enthalpy of formation of Cd-Th intermetallics with Th
composition follows the same trend as observed in Fe-Th, Co-Th, Ni-Th, Cu-Th and Th-Zn
systems, which is shown in Figure 7.4.

136
Figure 7.4 Comparison of experimental values ofm nf Cd ThH with that of Miedema estimation
and with experimental values of Cu-Th system [32], Ni-Th, Co-Th, Fe-Th systems, reported
by Skelton et al. [35-37] and Th-Zn system [39].
7.4 Conclusions
This study provides thermodynamic functions of Cd-Th intermetallics at various
temperatures. Following conclusions can be drawn based on experimental observations:
1. Estimated m nf Cd ThG of Cd-Th intermetallics was found to be in increasing order from
cadmium rich side (Cd11Th) to thorium rich side (Cd3Th) which is a clear indicative of
increasing stability when shifting from Cd rich side to Th rich side. Due to lack of
experimental data of 2f Cd ThG and f CdThG it was difficult to conclude about the
intermetallic with maximum stability in Cd-Th system.
2. Small negative values of standard entropy of formation of Cd-Th intermetallics infer an
absence of significant contribution of configurational entropy to the entropy of formation.
Therefore it can be inferred that entropy of formation of Cd-Th intermetallics arise mainly
from the difference between vibrational entropy of the intermetallics and vibrational
entropy of Th and Cd metals.

137
3. Negative value of entropy of formation implies more ordered structure of the Cd-Th
intermetallics compare to the constituent thorium, cadmium elements. An increasing order
of negative values of entropy from Cd11Th to Cd3Th infers the most ordered structure of
Cd3Th and least ordered structure of Cd11Th.
4. Variation of standard enthalpy of formation of Cd-Th intermetallics were found to be in
similar trend with that of Th-Ni, Th-Fe and Th-Co systems.

138
Chapter 8
Conclusions and future outlook
8.1 Conclusions
The present thesis described in Chapters 2-7 was devoted to five major investigations in LiCl-
KCl eutectic melt:
1) Redox behaviour of Th4+
|Th couple in LiCl-KCl eutectic melts using various
electrochemical transient techniques.
2) Determination of i of thorium under cathodic and anodic polarization conditions.
3) Elucidation of mechanism of cathodic deposition and anodic dissolution of thorium using
electrochemical impedance spectroscopy.
4) Determination of 4f ThClG of ThCl4 in LiCl-KCl eutectic melt using electromotive force
measurements, comparison with literature data and making suitable recommendations.
5) Determination of m nf Cd ThG of Cd-Th intermetallics using electromotive force
measurements
In 1), different electrochemical transient techniques were employed to study the reduction
mechanism of Th4+
|Th couple in LiCl-KCl eutectic melt, and it was extended to estimate
4+
*
Th |ThE of Th
4+|Th couple. In 2), i of thorium was determined at inert tungsten (cathodic),
liquid cadmium (cathodic) and thorium (anodic) electrodes in the temperature range 698-798
K, and its temperature and composition dependence was studied. In 3), studies on Th4+
|Th
couple already carried out in 1) was extended to investigations using electrochemical
impedance spectroscopy that included validation of complex impedance data by K-K
transforms and equivalent circuit fitting of data. In this work, theoretical equilibrium potential

139
of Th4+
|Th couple was also determined and compared with anodic dissolution data. This was
further extended to 4) electromotive force measurements on Th4+
|Th couple in the eutectic
melt to determine 4+Th |ThE ,
4f ThClG and 4ThCl of ThCl4 in LiCl-KCl eutectic melt.
Recommendations based on statistical analysis of data were also made. Finally, in 5),
electromotive force measurements for determining m nf Cd ThG of Cd-Th intermetallics were
carried out.
8.2 Challenges during experimentation
Several challenges were encountered during the course of measurements. They are briefly
described below,
i. Preparation of moisture and hydroxide free LiCl-KCl eutectic melt:
Presence of moisture and hydroxide (most probably LiOH formed due to high temperature
hydrolysis of LiCl) in the eutectic melt either during cyclic voltammetric or emf
measurements lead to distortions and observation of non-reproducible peaks of redox couple
under study. Preparation of melts before actual experiments with ThCl4 was tested for its
purity by running a cyclic voltammograms and estimating the residual current density in the
potential range 0 to -1.6 V.
One of the major challenges in the present work was preparation of ThCl4 in chlorinated
LiCl-KCl eutectic salt. ThCl4 was prepared by equilibration of Th metal with CdCl2 in LiCl-
KCl eutectic inside argon atmosphere glove box. Purity level of glove box was maintained as
low as possible during equilibration (oxygen impurity ˂ 10 ppm, moisture ˂ 10 ppm) to avoid
oxidation of thorium metal and formation of thorium oxychlorides. In some of the
experiments appearance of additional peaks were observed in cyclic voltammograms of LiCl-
KCl-ThCl4 recorded at inert tungsten electrode and shown in Figure 8.1. In Figure 8.1 A|A'
couple was identified as Th4+
|Th (characterized in Chapter 3) and D|D' was identified as

140
Cd2+
|Cd due to residual Cd2+
in the electrolyte, but B|B' couple and oxidation peak C could
not be identified. Appearance of additional peaks may be due to moisture ingress in the
electrolyte during preparation of LiCl-KCl-ThCl4 electrolyte or during measurements. Few
lots of LiCl-KCl-ThCl4 electrolyte prepared earlier were not of very high purity and presence
of moisture of possibly hydroxides was detected. Generation of reproducible electrochemical
and thermodynamic data of thorium was very challenging due to vaporization of ThCl4 at 773
K. Breaking of alumina crucible containing LiCl-KCl-ThCl4 electrolyte, liq. Cd basket,
Ag+|Ag reference electrode while assembling electrochemical cell before measurements or
during the course of measurements in some of the experiments were some the difficulties
faced during the course of this study.
Figure 8.1 Cyclic voltammogram of LiCl-KCl-ThCl4 at inert tungsten electrode, T = 773 K,
A = 0.25 cm2.
ii. Preparation, characterization and emf measurement on Cd-Th alloys:
Few difficulties were encountered during preparation, characterization and emf
measurements on Cd-Th alloys due to oxidation of thorium, vaporization of cadmium during

141
preparation of Cd-Th alloys. During initial stages, few Cd-Th alloys were found oxidized
during the equilibration of thorium and cadmium at 773 K. Emf measurements on
CdTh3+ThCd2 two-phase alloy was not successful due to non-reproducible emf tabulated in
Table 8.1.
Table 8.1 Electromotive force data of the cell 4+
4 3 2Th|Th || LiCl-KCl-T || Cd ThC hh l + Cd T
s s
T / K emf (mV)
Run 1 Run 2 Run 3
673 - - 305.22
683 175.57 145.35 286.41
698 161.31 133.42 -
703 - - 261.41
718 148.44 157.11 249.74
723 - - 232.79
733 159.29 161.53 232.92
753 179.39 175.58 -
773 203.60 174.61 -
793 187.36 179.25 -
8.3 Impact of present work
In this thesis work, a better understanding of electrochemistry of Th4+
in LiCl-KCl was
attempted with a combination of equilibrium potential and transient measurements. The
present work has provided recommendations on 4+
*
Th |ThE of ThCl4 in LiCl-KCl eutectic melts
(Chapter 3 and 6) and 4ThCl of ThCl4 (Chapter 6). These recommendations can be used by
future researchers to benchmark their experimental data sets. In this work, thermodynamic
data on Cd-Th intermetallics have also been generated. These data are not currently available
in literature and can help in thermodynamic modelling of Cd-Th binary system using
CALPHAD methodology.

142
8.4 Future outlook
The following studies can be taken up in future to further understand the redox and
thermodynamic behaviour of Th4+
in LiCl-KCl eutectic melt
1) Electrochemical studies of thorium at other inert and reactive electrodes such as Bi can be
carried out to generate basic electrochemical and thermodynamic data base on
thermodynamic properties of thorium with liquid electrodes.
2) Estimation of exchange current density of Th4+
|Th couple can be estimated at higher
concentrations of ThCl4 in molten LiCl-KCl eutectic to investigate its composition
dependence.
3) Estimation of activity coefficient of ThCl4 in LiCl-KCl eutectic at higher concentrations of
Th4+
.
4) Estimation of enthalpy of mixing of ThCl4 in LiCl-KCl melts using calorimetric methods.
5) Emf measurements on CdTh2 and CdTh intermetallics after addressing the problems as
described above.

143
List of errata in journal publications
“Electrochemical studies on the reduction behaviour of Th4+
in molten LiCl-KCl eutectic”,
Gurudas Pakhui, Manish Chandra, Suddhasattwa Ghosh, B. Prabhakara Reddy, K. Nagarajan,
Electrochim. Acta. 2015, 155, 372-382.
1. Page no. 376, Eq. 10: τ in denominator should be replaced by t.
2. Page no. 377, Eq. 12 and 13: Ag|AgCl should be replaced by Ag+|Ag.
3. Page no. 379, Eq. 20: Eh should be replaced by E1/2 and m(t) in the denominator should be
replaced by mc(∞)/2.
4. Page no. 379: In expression of
1 / 2( ) ( ) 1 exp
( )
ln .c
RTm m t E E
nF
i t
vs E t
, RT/nF should
be replaced by nF/RT.
5. Page no. 380, Eq. 21: 4+
1
ThC should be replaced by 4+Th
C and α2 term should be added in
denominator.
“Th4+
|Th couple in LiCl-KCl eutectic: Anodic polarization of thorium and electrochemical
impedance spectroscopy study at tungsten, cadmium and thorium electrodes”, Gurudas
Pakhui, Suddhasattwa Ghosh, B. Prabhakara Reddy, Electrochim. Acta. 2019, 295, 354-366.
1. Page 363: In the line “Rs varies within 3Ω and…….”, 3Ω should be replaced by 3mΩ.

144
REFERENCES
[1] M.V. Smirnov, L.D. Yushina, ''Cathode processes occuring in the electrodeposition of
thorium from fused electrolytes'', Bull. Acad. Sci. USSR, Div. Chem. Sci. (Engl. Transl.), 5
(1956) 1321-1328.
[2] M.V. Smirnov, L.D. Yushina, ''Cathode processes during deposition of thorium from
molten electrolytes'', Izv.Akad. Nauk, SSSR, Otd. Khim. Nauk, 11 (1956) 1285-1293.
[3] M.V. Smirnov, L.E. Ivanovski, "The reduction of Th4+
ions in chloride melts by metallic
thorium", Zh. Fiz. Khim, 31 (1957) 802.
[4] M.V. Smirnov, L.D. Yushina, Izv. Akad. Nauk, SSSR, Otd. Khim. Nauk, 2 (1959) 251-258.
[5] L. Martinot, ''Electrochemical behaviour of tetravalent thorium in molten (Li-K)Cl
eutectic'', J. Radioanal. Nucl. Chem. Lett., 103 (1986) 357-363.
[6] K. Liu, L.-Y. Yuan, Y.-L. Liu, X.-L. Zhao, H. He, G.-A. Ye, Z.-F. Chai, W.-Q. Shi,
''Electrochemical reactions of the Th4+
|Th couple on the tungsten, aluminum and bismuth
electrodes in chloride molten salt'', Electrochim. Acta., 130 (2014) 650-659.
[7] L. Cassayre, J. Serp, P. Soucek, R. Malmbeck, J. Rebizant, J.P. Glatz, ''Electrochemistry
of thorium in LiCl-KCl eutectic melts'', Electrochim. Acta., 52 (2007) 7432-7437.
[8] P. Chiotti, S.J.S. Parry, ''Separation of various components from uranium by oxidation-
reduction reactions in a liquid potassium chloride-lithium chloride/zinc system'', J. Less
Common Met., 4 (1962) 315-337.
[9] P. Chiotti, C.H. Dock, ''On lower valent thorium chlorides in fused chloride salts'', J. Less
Common Met., 41 (1975) 225-239.
[10] C.H. Dock, ''Oxidation states of thorium in fused LiCl-KCl eutectic'', Ph.D. Thesis,
Library, Iowa State University, Ames, Iowa, (1965).
[11] P. Chiotti, J.E. Fuller, C.H. Dock, M.C. Jha, ''The binary systems ThCl4-Th and ThCl4
-
ThOCl2'', J. Less Common Met., 31 (1973) 365-376.
[12] J.E. Fuller, ''The thorium-thorium tetra chloride system'', M. S. Thesis, Library, Iowa
State University, Ames, Iowa, United States, 1968.
[13] P. Chiotti, M.C. Jha, M.J. Tschetter, ''Reaction of thorium and ThCl4 with UO2 and (Th,
U)O2 in fused chloride salts'', J. Less Common Met., 42 (1975) 141-161.
[14] D. Inman, G.J. Hills, L. Young, J.O.M. Bockris, ''Some thermodynamic aspects of
molten salts: halides of uranium, zirconium, thorium, and cerium in alkali halide eutectics'',
Ann. N. Y. Acad. Sci., 79 (1960) 803-829.
[15] L. Yang, R.G. Hudson, C.-Y. Chien, ''A study of equilibrium between metals and their
polyvalent chlorides in LiCl-KCl eutectic melt'', in: G. R. S. Pierre (Ed.), Physical Chemistry
of Process Metallurgy, Vol. 8 of Volumes 7-8 of Metallurgical Society Conferences,
Interscience Publishers, New York, 1961, pp. 925-943.

145
[16] D. M. Gruen, R. L. McBeth, J. Kooi, W.T. Carnall, "Oxidation states of the elements and
their potentials in fused-salt solutions : the actinide elements", Ann. N. Y. Acad. Sci., 79 (1960)
941-949.
[17] M.V. Smirnov, V.Y. Kudyakov, ''Thorium valency in molten alkali halides in
equilibrium with metallic thorium'', Electrochim. Acta., 28 (1983) 1339-1348.
[18] V.Y. Kudyakov, M.V. Smirnov, N.Y. Chukreev, Y.V. Posokhin, ''Formation of divalent
thorium in a medium of fused potassium chloride'', At. Energ., 24 (1968) 551-556.
[19] M.V. Smirnov, V.Y. Kudyakov, ''Complexing in molten mixtures of thorium and alkali
halides'', Electrochim. Acta., 28 (1983) 1349-1359.
[20] M.V. Smirnov, L.D. Yushina, ''Reversible potentials of metals in fused electrolytes,
communication 1. reversible potentials of thorium in fused chlorides'', Bull. Acad. Sci. USSR,
Div. Chem. Sci. (Engl. Transl), 8 (1959) 231-238.
[21] M.V. Smirnov, V.Y. Kudyakov, Y.V. Nosokhin, Y.N. Krasnov, ''Electrochemical
behavior of thorium in molten sodium chloride and equimolar mixture of potassium chloride
and sodium chloride'', At. Energ., 28 (1970) 419-420.
[22] E. Hayek, T. Rehner, A. Frank, ''Halogenide des zwei-und dreiwertigen thoriums'',
Monatsh. Chem., 82 (1951) 575-587.
[23] Y. Kanashin, V. Butorov, E. Novikov, I. Nichkov, S. Raspopin, Elektrokhimiya., 8 (1972)
73.
[24] R. Srinivasan, S.N. Flengas, "Electrode potentials of thorium tetrachloride in alkali
chloride melts", Can. J. Chem., 42 (1964) 1315-1322.
[25] P.J. Tumidajski, S.N. Flengas, ''Potential measurements of thorium tetrachloride in alkali
halide solutions'', Can. J. Chem., 69 (1991) 462-467.
[26] F.R. Clayton, G. Mamantov, D.L. Manning, ''Electrochemical studies of uranium and
thorium in molten LiF-NaF-KF at 500o C'', J. Electrochem. Soc. , 121 (1974) 86-90.
[27] P. Chamelot, L. Massot, L. Cassayre, P. Taxil, ''Electrochemical behaviour of
thorium(IV) in molten LiF–CaF2 medium on inert and reactive electrodes'', Electrochim.
Acta., 55 (2010) 4758-4764.
[28] P. Chamelot, L. Massot, C. Hamel, C. Nourry, P. Taxil, ''Feasibility of the
electrochemical way in molten fluorides for separating thorium and lanthanides and
extracting lanthanides from the solvent'', J. Nucl. Mater., 360 (2007) 64-74.
[29] S. Delpech, S. Jaskierowicz, D. Rodrigues, "Electrochemistry of thorium fluoride in
LiCl-KCl eutectic melts and methodology for speciation studies with fluorides ions",
Electrochim. Acta., 144 (2014) 383-390.
[30] C.B. Alcock, ''Thermodynamic data for uranium and thorium intermetallic compounds:
A historical perspective'', J. Nucl. Mater., 167 (1989) 7-13.

146
[31] C.B. Alcock, J.B. Cornish, P. Grieveson, ''Knudsen effusion studies of compounds of
uranium and thorium with elements of groups IIIb and IVb'', IAEA, International Atomic
Energy Agency (IAEA), 1966.
[32] D.M. Bailey, J.F. Smith, "Thermodynamics of formation of Th-Cu alloys",
Thermodynamics of nuclear materials: Proceedings of a symposium on the thermodynamics
of nuclear materials, International Atomic Energy Agency, Vienna, 1974, pp. 355-365.
[33] N. J. Magnani, W. H. Skelton, J.F. Smith, “Thermodynamics of formation of Th2Fe17,
Th2Co17, Th2Ni17, ThCo5, ThNi5, ThCu4, and ThNi2 from electromotive force measurements”,
Nuclear Metallurgy, P. Chiotti, Ed., U.S. Atomic Energy Commision Report, CONF-690801,
1969, pp. 727–742.
[34] B. Prabhakara Reddy, R. Kandan, R. Babu, K. Nagarajan, P.R. Vasudeva Rao,
''Thermodynamic studies on ThGa2'', J. Nucl. Mater., 294 (2001) 112-118.
[35] W.H. Skelton, N.J. Magnani, J.F. Smith, ''Thermodynamics of formation of Th-Ni
alloys'', Metall. Mater. Trans., 1 (1970) 1833-1837.
[36] W.H. Skelton, N.J. Magnani, J.F. Smith, ''Thermodynamics of formation of Th-Co
alloys'', Metall. Mater. Trans., 2 (1971) 473-476.
[37] W.H. Skelton, N.J. Magnani, J.F. Smith, ''Thermodynamics of formation of Th-Fe
alloys'', Metall. Mater. Trans., 4 (1973) 917-920.
[38] J.F. Smith, ''Thermodynamic properties of binary thorium systems'', J. Nucl. Mater., 51
(1974) 136-148.
[39] P. Chiotti, K.J. Gill, "Phase diagram and thermodynamic properties of the thorium-zinc
system", Trans. Met. Soc. AIME, 221 (1961) 573.
[40] V. A. Kadochnikov, A. M. Poyarkov, V. A. Lebedev, I. F. Nichkov, S. P. Raspopin,
"Thermodynamic properties of thorium-antimony alloys", Soviet Atomic Energy, 1974, pp.
1174-1175.
[41] A. M. Poyarkov, V. A. Lebedev, I. F. Nichkov, S. P. Raspopin, "Thermodynamic
properties of thorium melts containing bismuth", Soviet Atomic Energy, 1974.
[42] A.M. Poyarkov, V.A. Lebedev, I.F. Nichkov, S.P. Raspopin, "Thermodynamic
properties of liquid alloys of thorium with aluminum", Soviet Atomic Energy, 1973, pp.
1138-1140.
[43] N.J. Magnani, "A thermodynamic study of phase stability in the transition-metal rich
phases of the thorium-iron, thorium-cobalt and thorium-nickel systems and the copper rich
phases of the thorium-copper systems", Ames Laboratory, Iowa State University, Ames, Iowa,
1968.
[44] J. Bates, M. Ader, J. Meisenhelder, W. Shinn, B.S. Tani, M. Krumpelt, ''Phase relations
in the thorium-cadmium system'', J. Less Common Met., 77 (1981) 205-213.
[45] I. Johnson, K.D. Anderson, ''Solubility of thorium in cadmium'', U.S. Atomic Energy
Commission Rep, 1960.

147
[46] A. Brown, "MX2 compounds of thorium and the polymorphism of thorium disilicide ",
Acta. Cryst., 14 (1961) 860-865.
[47] G. Bruzzone, M.L. Fornasini, F. Merlo, ''Rare earth intermediate phases with cadmium'',
J. Less Common Met., 30 (1973) 361-375.
[48] J. Dutkiewicz, ''Cd-Th (Cadmium-Thorium)'', Binary Alloy Phase Diagrams, II Ed., T.B.
Massalski, 2 (1990) 1032-1035.
[49] J. Dutkiewicz, ''The Cd-Th (Cadmium-Thorium) System '', J. Phase Equilib., 14 (1993)
86-89.
[50] M.L. Fornasini, ''Crystal structure of (Ho-, Er-, Tm-, Lu-, Y-)Zn5 and ThCd5
intermetallic compounds'', J. Less Common Met., 25 (1971) 329-332.
[51] M.L. Fornasini, A. Palenzona, P. Manfrinetti, ''Crystal structure of the new thorium
intermetallics ThIn and Th6Cd7'', J. Solid State Chem., 51 (1984) 135-140.
[52] A. Palenzona, S. Cirafici, ''The thorium-cadmium phase diagram'', J. Less Common Met.,
77 (1981) 215-220.
[53] Krishan Kumar, Suddhasattwa Ghosh, B. P. Reddy, K. Nagarajan, "Evaluation of
exchange current density of U and Zr in molten LiCl-KCl eutectic", IGC-325, 2014.
[54] D.L. Maricle, D.N. Hume, ''A new method for preparing hydroxide-free alkali chloride
melts'', J. Electrochem. Soc., 107 (1960) 354-356.
[55] W.P. Davey, "Precision measurements of crystals of the alkali halides", Phys. Rev., 21
(1923) 143-161.
[56] J. T. Mason, M. C. Jha, P. Chiotti, "Crystal structures of ThCl4 polymorphs", J. Less
Common Met., 34 (1974) 143-151.
[57] A. Datta, N. Sivaraman, T.G. Srinivasan, P.R.V. Rao, ''Liquid chromatographic
behaviour of lanthadies and actinides on monolith supports'', Radiochim. Acta., 99 (2011)
275-283.
[58] S. Vijayalakshmi, S. Annapoorani, R.U. Maheswari, Theme Meeting on Recent Trends
in Analytical Chemistry (TRAC) Chennai, India, 2012.
[59] K. Suriya Kumari, R. Umamaheswari, S. Annaporni, G. Pakhui, S. Ghosh, P. Venkatesh,
B.P. Reddy, "Chemical analysis of impurities in cadmium with emphasis on pyroprocessing
applications", IGC Report-346, 2018.
[60] A.J. Bard, L.R. Faulkner, ''Electrochemical Methods-Fundamentals and Applications'',
2nd ed., John Wiley and Sons, New York, 1980.
[61] J.R. Taylor, ''An Introduction to Error Analysis : The study of uncertainties in physical
measurements'', 2nd ed., University Science Books, Sausalito, California, 1997.

148
[62] B.A. Boukamp, ''Kramers-Kronig test for Windows'',
https://www.utwente.nl/en/tnw/ims/publications/downloads/KK-windows.zip, 2018.
[63] B. Boukamp, ''A linear Kronig-Kramers transform test for immittance data validation'' J.
Electrochem. Soc., 142 (1995) 1885-1894.
[64] B.A. Boukamp, ''Electrochemical impedance spectroscopy in solid state ionics: recent
advances'', Solid State Ionics, 169 (2004) 65-73.
[65] E. Barsoukov, J.R. Macdonald, "Impedance Spectroscopy : Theory, Experiment, and
Applications", 2nd ed., John Wiley & Sons, New York, 2005.
[66] A.C. Gruner, W.T. Thompson, ''The activity of AgCl in AgCl-LiCl-KCl melts'', Can. J.
Chem., 53 (1975) 1084-1092.
[67] S.N. Flengas, T.R. Ingraham, ''Electromotive force series of metals in fused salts and
activities of metal chlorides in 1:1 molar KCI-NaCI solutions'', J. Electrochem. Soc., 106
(1959) 714-721.
[68] O. Knacke, J. Krahe, F. Muller, "Aktivitat von UCl3 in der eutektischen Schmelze LiCl-
KCl", Z. Physik Chemic, Neue Folge, 50 (1966) 91.
[69] L. Yang, R.G. Hudson, ''Equilibrium electrode potentials of some metal-chlorine
galvanic cells and activities of some metal chlorides in LiCl-KCl eutectic melt'', Trans. Am.
Inst. Min. Metall. Eng., 215 (1959) 589-601.
[70] J.J. Roy, L.F. Grantham, D.L. Grimmett, S.P. Fusselman, C.L. Kruger, T.S. Storvick,
"Thermodynamic properties of U, Np, Pu, and Am in molten LiCl-KCl eutectic and liquid
cadmium", J. Electrochem. Soc., 143 (1996) 2487-2492.
[71] S.P. Fusselman, J.J. Roy, D.L. Grimmett, L.F. Grantham, C.L. Krueger, C.R. Nabelek,
T.S. Storvick, ''Thermodynamic properties for rare earths and americium in pyropartitioning
process solvents'', J. Electrochem. Soc., 146 (1999) 2573-2580.
[72] F. Lantelme, Y. Berghoute, ''Electrochemical studies of LaCl3 and GdCl3 dissolved in
fused LiCl-KCl'', J. Electrochem. Soc., 146 (1999) 4137-4144.
[73] F. Lantelme, J.F. Equey, S. Mueller, M. Chemla, ''Thermodynamic properties of iron and
nickel chloride solutions in molten lithium chloride-potassium chloride'', J. Phys. Chem., 95
(1991) 905-908.
[74] F. Lantelme, H. Alexopoulos, M. Chemla, O. Haas, "Thermodynamic properties of
aluminum chloride solutions in the molten LiCl-KCl system", Electrochim. Acta., 33 (1988)
761-767.
[75] L. Yang, R.G. Hudson, "Some investigations of the Ag/AgCI in LiCI-KCI eutectic
reference electrode", J. Electrochem. Soc., 106 (1959) 986-990.

149
[76] S. Vandarkuzhali, N. Gogoi, S. Ghosh, B. Prabhakara Reddy, K. Nagarajan,
''Electrochemical behaviour of LaCl3 at tungsten and aluminium cathodes in LiCl-KCl
eutectic melt'', Electrochim. Acta., 59 (2012) 245-255.
[77] G. Mamantov, D.L. Manning, J.M. Dale, "Reversible deposition of metals on solid
electrodes by voltammetry with linearly varying potential", J. Electroanal. Chem., 9 (1965)
253-259.
[78] H. Matsuda, Y. Ayabe, ''Zur Theorie der Randles-Sevcikschen Kathodenstrahl-
Polarographie'', Z. Elektrochem., 59 (1955) 494-503.
[79] S.A. Kuznetsov, H. Hayashi, K. Minato, M. Gaune-Escard, "Electrochemical behavior
and some thermodynamic properties of UCl4 and UCl3 dissolved in a LiCl-KCl eutectic melt",
J. Electrochem. Soc., 152 (2005) C203-C212.
[80] S.A. Kuznetsov, H. Hayashi, K. Minato, M. Gaune-Escard, ''Electrochemical transient
techniques for determination of uranium and rare-earth metal separation coefficients in
molten salts'', Electrochim. Acta., 51 (2006) 2463-2470.
[81] J.G. Osteryoung, R.A. Osteryoung, ''Square wave voltammetry'', Anal. Chem., 57 (1985)
101-110.
[82] P. Chamelot, B. Lafage, P. Taxil, ''Using square-wave voltammetry to monitor molten
alkaline fluoride baths for electrodeposition of niobium'', Electrochim. Acta., 43 (1998) 607-
616.
[83] P. Chamelot, P. Palau, L. Massot, A. Savall, P. Taxil, ''Electrodeposition processes of
tantalum(V) species in molten fluorides containing oxide ions'', Electrochim. Acta., 47 (2002)
3423-3429.
[84] M.S. Krause, L. Ramaley, ''Analytical application of square wave voltammetry'', Anal.
Chem., 41 (1969) 1365-1369.
[85] J. Osteryoung, J.J. O’Dea, ''Electroanalytical chemistry'', (A. J. Bard Ed.) Marcel Dekker,
New York, 1986.
[86] L. Ramaley, M.S. Krause, ''Theory of square wave voltammetry'', Anal. Chem., 41 (1969)
1362-1365.
[87] R.A. Osteryoung, A. J. Osteryoung, ''Pulse voltammetric methods of analysis'', Phil.
Trans. Roy. Soc. London, Ser., 302 (1981) 315-326.
[88] L. Nadjo, J.M. Saveant, D. Tessier, ''Convolution potential sweep voltammetry", J.
Electroanal. Chem., 52 (1974) 403-412.
[89] K.B. Oldham, G.D. Zoski, ''Effect of semioperators on reversible cyclic
voltammograms'', Anal. Chem., 52 (1980) 2116-2123.
[90] M. Goto, K.B. Oldham, ''Semiintegral electroanalysis: Shapes of neopolarograms'', Anal.
Chem., 45 (1973) 2043-2050.

150
[91] M. Goto, K.B. Oldham, "Semiintegral electroanalysis: Studies on the neopolarographic
plateau", Anal. Chem., 46 (1974) 1522-1530.
[92] M. Goto, K.B. Oldham, ''Semiintegral electroanalysis: The shape of irreversible
neopolarograms'', Anal. Chem., 48 (1976) 1671-1676.
[93] M. Grenness, K.B. Oldham, ''Semiintegral electroanalysis: Theory and verification'',
Anal. Chem., 44 (1972) 1121-1129.
[94] P. Delahay, ''New Instrumental Methods in Electrochemistry'', Interscience Publishers,
New York, 1954.
[95] T. Berzins, P. Delahay, ''Oscillographic polarographic waves for the reversible
deposition of metals on solid electrodes '', J. Am. Chem. Soc., 75 (1953) 555-559.
[96] J.E.B. Randles, ''A cathode ray polarography: part 11-the current-voltage curves'', Trans.
Faraday Soc., 44 (1948) 327-338.
[97] A. Sevcik, ''Oscillographic polarography with periodical triangular voltage'', Collect.
Czech. Chem. Commun., 13 (1948) 349-377.
[98] M. Mohamedi, S. Martinet, J. Bouteillon, J.C. Poignet, "Comprehensive examination of
the electrochemistry of indium in the molten LiCl-KCl eutectic", Electrochim. Acta., 44
(1998) 797-803.
[99] S. Ghosh, K. Kumar, A. Venkatesh, P. Venkatesh, B.P. Reddy, ''Exchange current
density and diffusion layer thickness in molten LiCl-KCl eutectic: a modeling perspective for
pyroprocessing of metal fuels'', Nucl. Technol., 195 (2016) 253-272.
[100] S. Ghosh, S. Vandarkuzhali, N. Gogoi, P. Venkatesh, G. Seenivasan, B.P. Reddy, K.
Nagarajan, ''Anodic dissolution of U, Zr and U-Zr alloy and convolution voltammetry of
Zr4+
|Zr2+
couple in molten LiCl-KCl eutectic'', Electrochim. Acta., 56 (2011) 8204-8218.
[101] A. Venkatesh, S. Ghosh, S. Vandarkuzhali, B.P. Reddy, K. Nagarajan, P.R.V. Rao,
''Modeling the anodic behavior of U, Zr and U-Zr alloy in molten LiCl-KCl eutectic'', Nucl.
Technol., 182 (2013) 98-110.
[102] F. Kobayashi, T. Ogawa, M. Akabori, Y. Kato, ''Anodic dissolution of uranium
mononitride in lithium chloride-potassium chloride eutectic melt'', J. Am. Ceram. Soc., 78
(1995) 2279-2281.
[103] O. Shirai, M. Iizuka, T. Iwai, Y. Suzuki, Y. Arai, ''Recovery of neptunium by
electrolysis of NpN in LiCl-KCl eutectic melts'', J. Nucl. Sci. Technol., 37 (2000) 676-681.
[104] O. Shirai, T. Kato, T. Iwai, Y. Arai, T. Yamashita, ''Electrochemical behaviors of PuN
and (U, Pu)N in LiCl-KCl eutectic melts'', J. Phys. Chem. Solid., 66 (2005) 456-460.
[105] O. Shirai, K. Uozumi, T.I. Arai, ''Recovery of U by electrolysis of UN in LiCl-KCl
eutectic melts'', J. Nucl. Sci. Technol., 3 (2002) 745-748.

151
[106] A. Glassner, ''The thermochemical properties of the oxides, fluorides and chlorides to
2500 K'', Argonne National Laboratory, Lemont, 1957, pp. 201-274.
[107] L. Martinot, J. Bohet, G. Duyckaerts, ''Thermodynamic properties of dilute solutions of
ThCl4 in (Li-K)Cl and (Ka-K)Cl eutectics'', Inorg. Nucl. Chem. Lett., 13 (1977) 315-319.
[108] J. Fuger, V.B. Parker, W.N. Hubbard, F.L. Oetting, "The Chemical Thermodynamics of
Actinide Elements and Compounds, Part 8", "The Actinide Halides", IAEA, Vienna, 1983.
[109] C. Bale, E. Belisle, P. Chartrand, S. Decterov, G. Eriksson, A. Gheribi, K. Hack, I.H.
Jung, Y.B. Kang, J. Melanon, A. Pelton, S. Petersen, C. Robelin, J. Sangster, P. Spencer,
M.A.V. Ende, Factsage thermochemical software and databases 2010-2016, Calphad, 54
(2016) 35-53.
[110] I. Barin, O. Knacke, O. Kubaschewski, "Thermochemical properties of inorganic
substances", Springer-Verlag Berlin Heidelberg, 1977.
[111] X. Wang, W. Huang, Y. Gong, F. Jiang, H. Zheng, T. Zhu, D. Long, Q. Li,
''Electrochemical behavior of Th(IV) and its electrodeposition from ThF4-LiCl-KCl melt'',
Electrochim. Acta., 196 (2016) 286-293.
[112] R. Cumberland, M.S. Yim, "Estimation of Uranium and Plutonium exchange current
densities on solid elctrodes", in: Proceedings of the International Pyroprocessing Research
Conference (IPRC)The Abbey Resort on Lake Geneva in Fontana, Wisconsin, hosted by
Argonne National Laboratory, Chemical Sciences and Engineering Division, 2012.
[113] R.M. Cumberland, M.-S. Yim, "Development of a 1D transient electrorefiner model for
pyroprocess simulation", Ann. of Nucl. Energy, 71 (2014) 52-59.
[114] M.A. Rose, M.A. Williamson, J. Willit, ''Determining the exchange current density and
Tafel constant for Uranium in LiCl-KCl eutectic'', ECS Electrochem. Lett., 4 (2015) C5-C7.
[115] M. Bachtler, W. Freyland, G.A. Voyiatzis, G.N. Papatheodorou, ''Electrochemical and
simultaneous spectroscopic study of reduction mechanism and electronic conduction during
electrodeposition of tantalum in molten alkali chlorides'', Ber. Bunsenges. Phys. Chem., 99
(1995) 21-31.
[116] M. Matsumiya, R. Takagi, "Electrochemical impedance spectroscopic study on Eu2+
and Sr2+
using liquid metal cathodes in molten chlorides", Electrochim. Acta., 55 (2000) 673-
681.
[117] J.E.B. Randles, "Kinetics of rapid electrode reactions", Discuss. Faraday Soc., 1 (1947)
11-19.
[118] J.R. Macdonald, ''Impedance spectroscopy: emphasizing solid materials and systems'',
John Wiley and Sons Inc., New York, 1980.
[119] J. Fuger, D. Brown, "Thermodynamics of the actinide elements", J. Chem. Soc., Dalton
Trans., 0 (1973) 428-434.

152
[120] D.R. Gaskell, "Introduction to the Thermodynamics of Materials", 4th ed., Taylor &
Francis, New York, 2003.
[121] A. Dębski, R. Dębski, W. Gasior, ''New features of Entall database: Comparison of
experimental and model formation enthalpies'', Arch. Metall. Mater., 59 (2015) 1337-1343.
[122] A.R. Miedema, "The electronegativity parameter for transition metals: Heat of
formation and charge transfer in alloys", J. Less Common Met., 32 (1973) 117-136.
[123] A.R. Miedema, F.R.d. Boer, P.F.d. Chatel, "Empirical description of the role of
electronegativity in alloy formation", J. Phys. F: Met. Phys., 3 (1973) 1558-1576.
[124] A.R. Miedema, F.R. de Boer, R. Boom, "Model predictions for the enthalpy of
formation of transition metal alloys", Calphad, 1 (1977) 341-359.
[125] P. Chiotti, M. Koizumi, Annual summary research report in metallurgy, Ames
Laboratory, Iowa State University, 1960, pp. 28-30.