Indian Institute Of Technology, Bombay2009.igem.org/files/presentation/IIT_Bombay_India.pdf ·...
34
Indian Institute Of Technology, Bombay
Transcript of Indian Institute Of Technology, Bombay2009.igem.org/files/presentation/IIT_Bombay_India.pdf ·...

Indian Institute Of Technology, Bombay

Engineered Versus Natural System
11/1/2009 Team IIT Bombay, Jamboree 2009 2
Design Operation Optimization Control
ENGINEERED SYSTEM
Engineered system: bottom-up design with known functionality of components
Natural system: top down design with unknown inherent property of various motifs

Engineered Systems : Room Heater
11/1/2009 Team IIT Bombay, Jamboree 2009 3
TemperatureController Process
Measuring Temperature
Thermostat
Set point for a
Temperature
Decides to switch on/off
electric supply to bring
temperature to set point
Negative feedback
SINGLE INPUT SINGLE OUTPUT (SISO)

Multiple Input Multiple Output: a
motif observed in Biological System
11/1/2009 Team IIT Bombay, Jamboree 2009 4
Process 1
Measurement
Set pointControlled
Variable
Single output is regulating the multiple upstream processes
Process 2
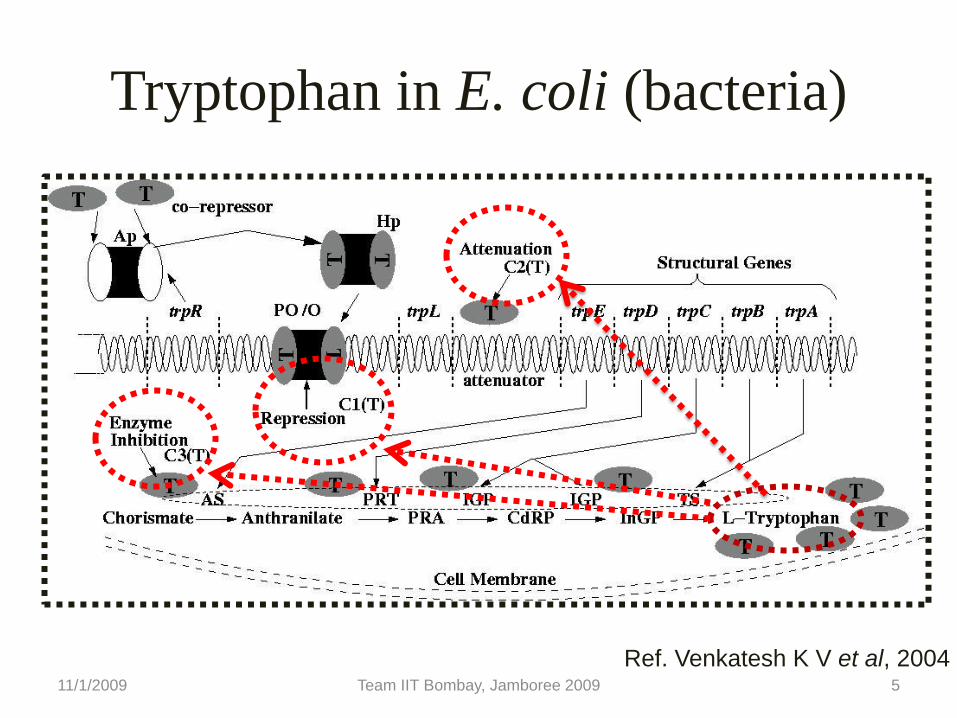
Tryptophan in E. coli (bacteria)
11/1/2009 Team IIT Bombay, Jamboree 2009 5
Ref. Venkatesh K V et al, 2004

Osmotic Stress Pathway in Yeast
11/1/2009 6Team IIT Bombay, Jamboree 2009
Ref. Parmar et al, 2009

Insulin Signaling Pathway in Mammals
11/1/20097
Team IIT Bombay, Jamboree 2009
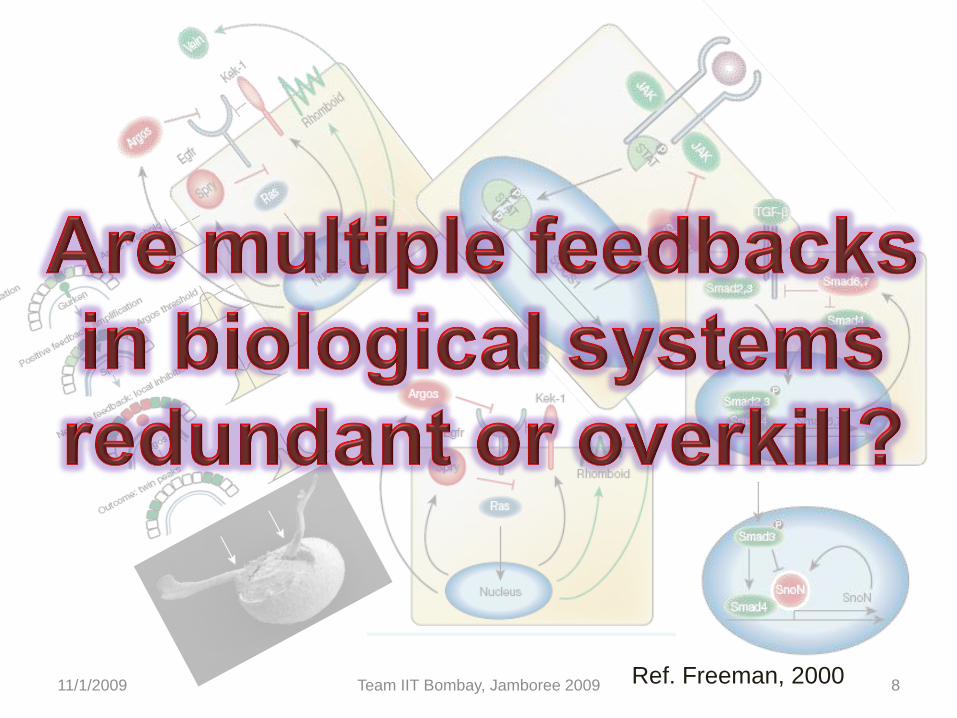
11/1/2009 Team IIT Bombay, Jamboree 2009 8Ref. Freeman, 2000

11/1/2009 Team IIT Bombay, Jamboree 2009 9
Designed and Implemented a
synthetic genetic network
with multiple feedbacks
Linking protein expression
to growth
Modeling and Experiments for characterization of the network
Approach Modeling –
• Detailed molecular
mechanisms based
model
• Stochastic modeling
• Control analysis
Experiments
• Protein expression by FACS
• Characterization of
phenotype in the synthetic
constructs

Components of Synthetic Constructs
• Use of existing bio-bricks
• Four promoter sites used for the
constructs: pTet, pLac, pMB1 and
pLacOP .
• pMB1 and pLacOP : promoters for
plasmid replication.
• To characterize amount of LacI: LacI-CFP fusion protein.
• To characterize plasmid copy number:
YFP expression.
11/1/2009
10Team IIT Bombay, Jamboree 2009
Promoter site

On addition of IPTG
Plasmid copy number
does not change
Plasmid copy number
increases
Characteristics of promoters used for
Plasmid Replication
On addition of IPTG
pMB1
pLacOP
11/1/2009 11Team IIT Bombay, Jamboree 2009

LacI regulation in pTet and pLac
pTet
pLac
LacI RNA/DNA Polymerase11/1/2009 12Team IIT Bombay, Jamboree 2009
lacI
lacI
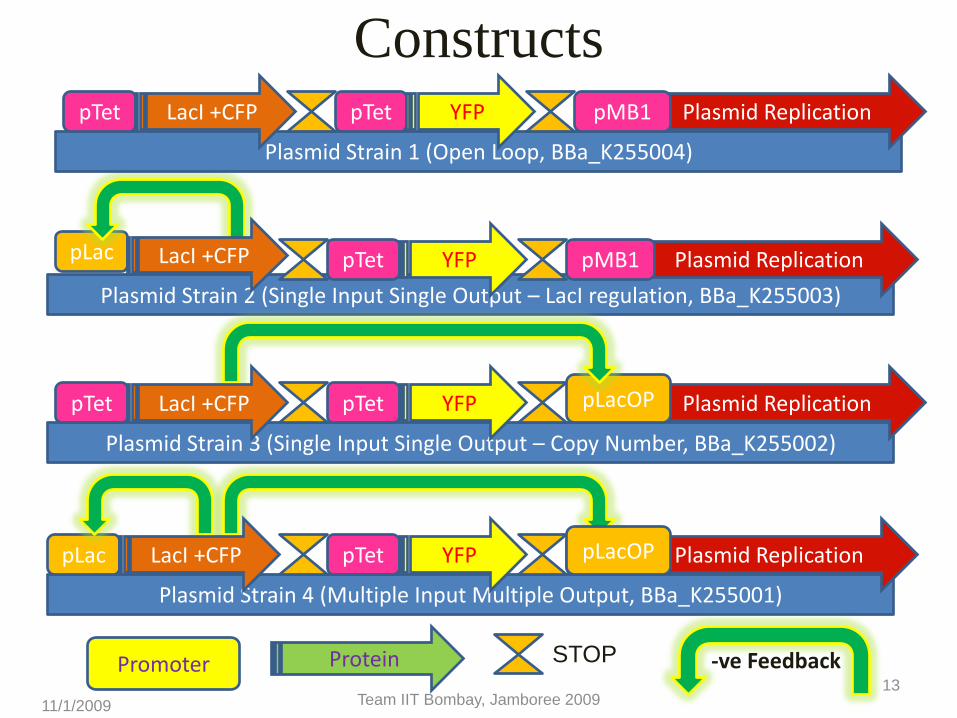
Plasmid Strain 2 (Single Input Single Output – LacI regulation, BBa_K255003)
Plasmid Replication
Constructs
11/1/2009 Team IIT Bombay, Jamboree 200913
Plasmid Strain 3 (Single Input Single Output – Copy Number, BBa_K255002)
pTet YFP Plasmid Replication
Plasmid Strain 4 (Multiple Input Multiple Output, BBa_K255001)
pLac pTet YFP Plasmid Replication
pLac pTet YFP pMB1
pTet
Plac
pLacOP
pLacOP
Plasmid Strain 1 (Open Loop, BBa_K255004)
pTet LacI +CFP pTet YFP Plasmid ReplicationpMB1
Promoter -ve FeedbackProtein
LacI +CFP
LacI +CFP
LacI +CFP
STOP

SYNTHETIC CONSTRUCTS
NO CONTROL
OPEN LOOP
(STRAIN 1)
SINGLE INPUT
SINGLE OUTPUT
SISO_LacI : Regulation of
LacI (STRAIN 2)
SISO_CN : Regulation of Plasmid Copy
Number (STRAIN 3)
MULTIPLE INPUT MULTIPLE OUTPUT
MIMO: Regulation of Plasmid Copy
Number and LacI (STRAIN 4)
11/1/2009 Team IIT Bombay, Jamboree 2009 14

Molecular Map of the Construct
11/1/2009 Team IIT Bombay, Jamboree 2009 15
LacI-IPTG
complex
Replicated Plasmids

Modeling Methodologies
• Detailed Dynamic Modeling using all known molecular interactions
• Stochastic Analysis on a simplified model using Langevin approach
• Frequency response analysis on the linearisedmodel
11/1/2009 Team IIT Bombay, Jamboree 2009 16

Prediction of Steady State Expression
of YFP (Plasmid Copy Number)
11/1/2009 Team IIT Bombay, Jamboree 2009 17

11/1/2009 Team IIT Bombay, Jamboree 2009 18
++-Set-point
+LacI levelError
Control Analysis to Characterize System Behavior
Block diagram for the Linearised LacI system
Block diagram for the LacI system
C1(s) F(Cs)/(s+µ+β1-F’(Cs) C1s) k3C2s/(s+µ+β3)
k3Css/(s+µ+β3)C2(s)
Controllers
Controllers
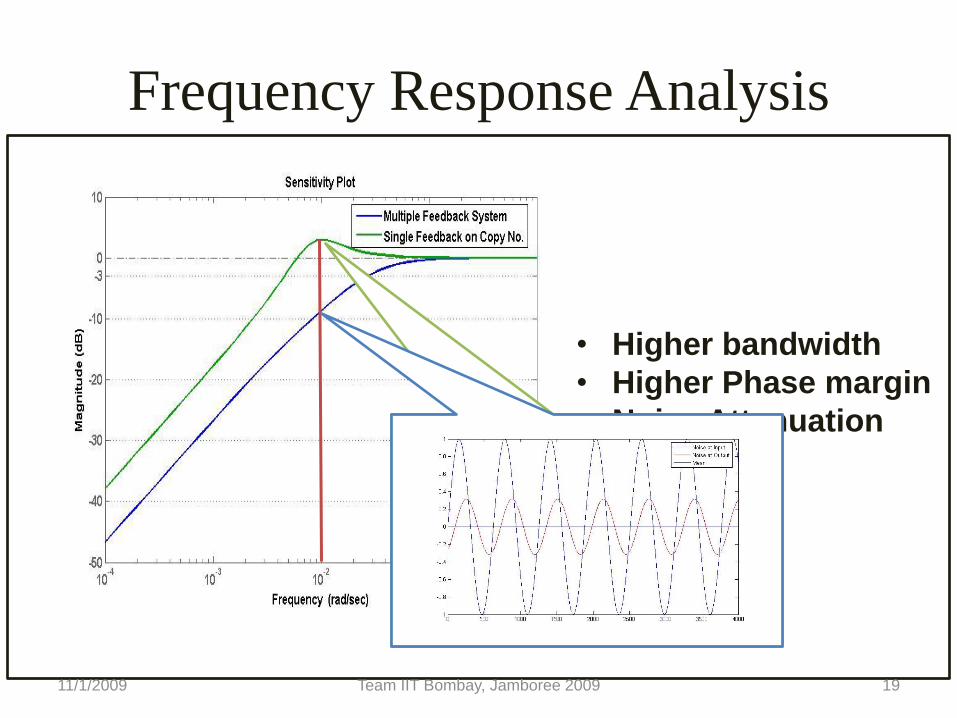
Frequency Response Analysis
• Higher bandwidth
• Higher Phase margin
• Noise Attenuation
11/1/2009 19Team IIT Bombay, Jamboree 2009

Experimental Validation
• Experiments with various IPTG concentrations
were conducted.
• Protein expression measured as YFP using
FACS to quantify plasmid copy number.
• Mean and Variance obtained from the
distribution.
11/1/2009 20Team IIT Bombay, Jamboree 2009
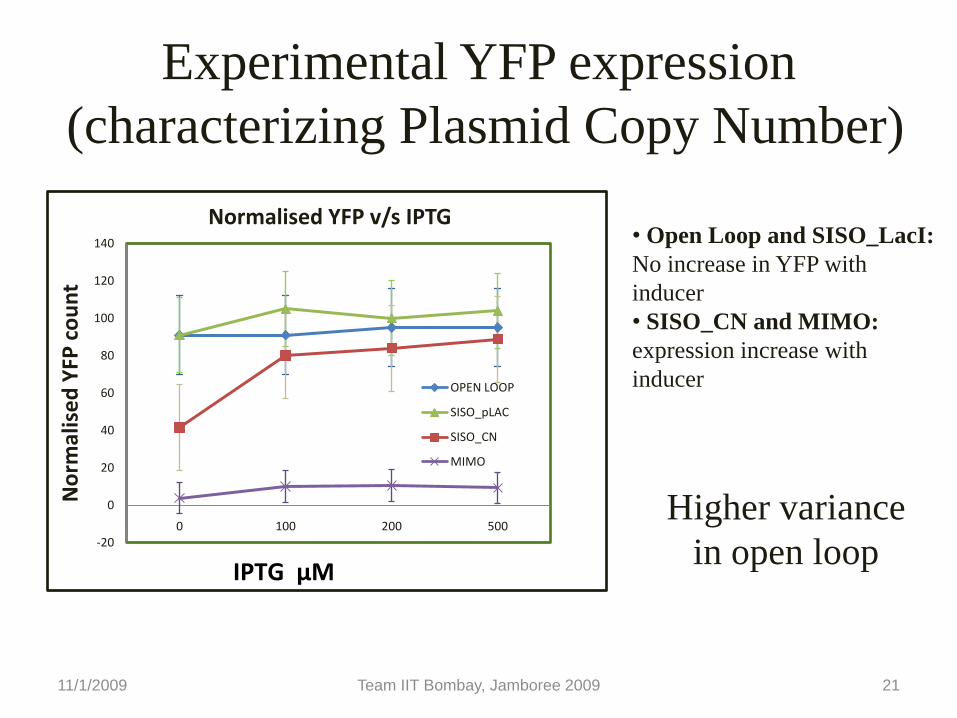
Experimental YFP expression
(characterizing Plasmid Copy Number)
11/1/2009 Team IIT Bombay, Jamboree 2009 21
Higher variance
in open loop-20
0
20
40
60
80
100
120
140
0 100 200 500
No
rmal
ise
d Y
FP c
ou
nt
Normalised YFP v/s IPTG
OPEN LOOP
SISO_pLAC
SISO_CN
MIMO
IPTG µM
• Open Loop and SISO_LacI:
No increase in YFP with
inducer
• SISO_CN and MIMO:
expression increase with
inducer

Characterization of LacI expression
• The detection of LacI-CFP fusion protein was
not possible due to technical problems.
• An indirect measure of LacI was obtained by
measuring β-galactosidase from the lacZ of the
host.
• Further the growth rate of the four
transformants were also enumerated.
11/1/2009 Team IIT Bombay, Jamboree 2009 22

Schematic representation of the
network in presence of lactose
11/1/2009 Team IIT Bombay, Jamboree 2009 23
lacZ
LacI-IPTG
Replicated Plasmids
LacI-Lactose

Growth Response from Modeling
11/1/2009 Team IIT Bombay, Jamboree 2009 24
dual feedback system: high β-gal expression with low variance
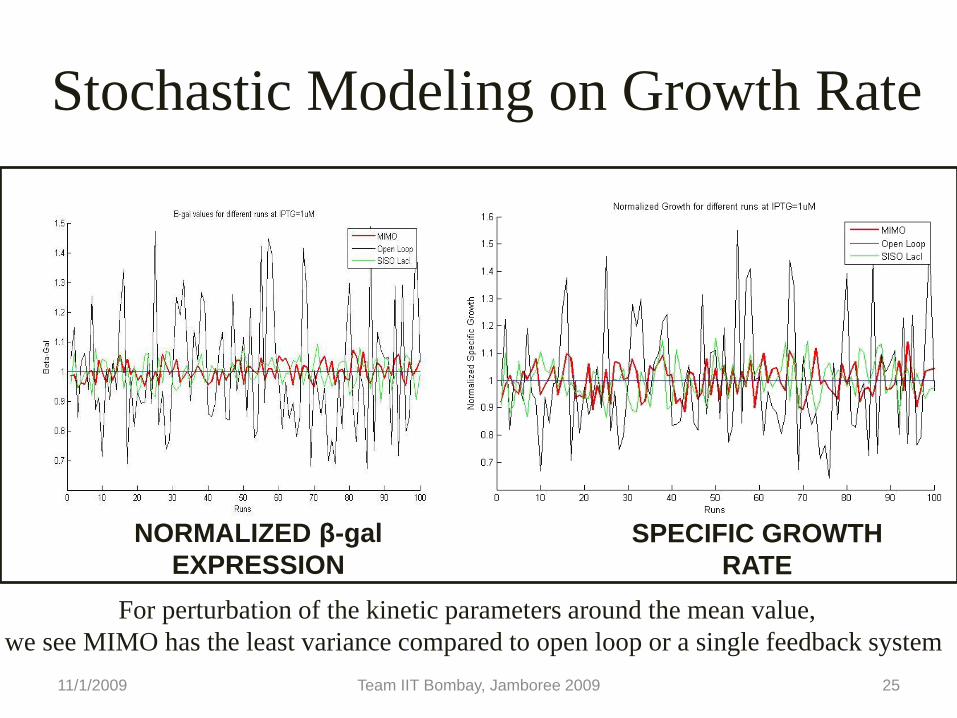
Stochastic Modeling on Growth Rate
SPECIFIC GROWTH
RATE
NORMALIZED β-gal
EXPRESSION
For perturbation of the kinetic parameters around the mean value,
we see MIMO has the least variance compared to open loop or a single feedback system
11/1/2009 25Team IIT Bombay, Jamboree 2009

Experimental Results
11/1/2009 Team IIT Bombay, Jamboree 2009 26
-0.02
0
0.02
0.04
0.06
0.08
0.1
0.12
0.14
0.16
0.18
0 1 2 3 4 5 6
Sp
ec
ific
Gro
wth
Rate
(in
hr-1
)
Lactose (g/L)
Specific Growth Rate v/s Lactose
OPEN LOOP
MIMO
-0.2
0
0.2
0.4
0.6
0.8
1
1.2
0 1 2 3 4 5 6
β-g
al/β
a-g
al m
ax
Lactose (g/L)
Normalized β-gal expression v/s Lactose
MIMO
OPEN LOOP
Noise in protein expression propagates to growth
The variance in specific growth rate is less compared to that
observed in protein expression.
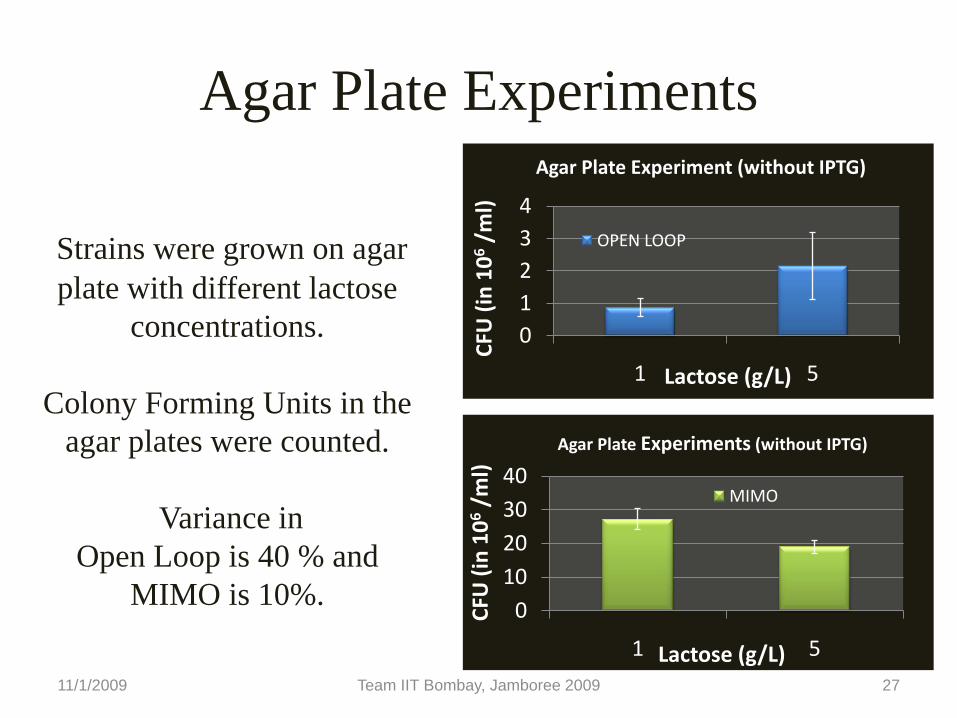
Agar Plate Experiments
11/1/2009 Team IIT Bombay, Jamboree 2009 27
0
1
2
3
4
1 5
CFU
(in
10
6/m
l)
Lactose (g/L)
Agar Plate Experiment (without IPTG)
OPEN LOOP
0
10
20
30
40
1 5
CFU
(in
10
6/m
l)
Lactose (g/L)
Agar Plate Experiments (without IPTG)
MIMO
Strains were grown on agar
plate with different lactose
concentrations.
Colony Forming Units in the
agar plates were counted.
Variance in
Open Loop is 40 % and
MIMO is 10%.

Recapitulating…
• Robustness in protein expression which leads to low variance in specific growth rate.
• The noise in protein expression is filtered leading to a decrease in the variance in growth rate. This may be due to metabolism and division process.
• The transformants with the synthetic network yields distinct phenotypic response.
11/1/2009 Team IIT Bombay, Jamboree 2009 28

Optimality
11/1/2009 Team IIT Bombay, Jamboree 2009 29
Optimal production of enzyme : growth rate for MIMO.
MIMO has optimized its burden for optimal Normalized Growth Rate.
MIMO NGR
OPEN LOOP NGR
11/1/2009 Team IIT Bombay, Jamboree 2009 30
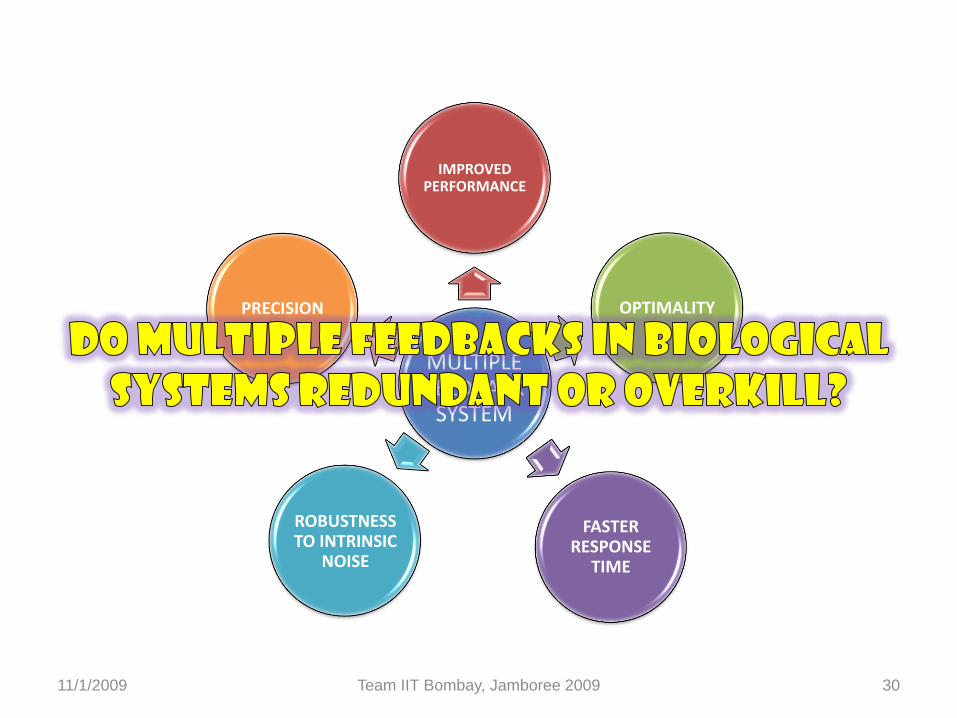
MULTIPLE FEEDBACK
SYSTEM
IMPROVED PERFORMANCE
OPTIMALITY
FASTER RESPONSE
TIME
ROBUSTNESS TO INTRINSIC
NOISE
PRECISION

Phd mentors:
• Pushkar Malakar,
• Navneet Rai ,
• Vinay Bavdekar,
Acknowledgements
11/1/2009 Team IIT Bombay, Jamboree 2009 31
Mentors:
• Prof. K V Venkatesh
• Prof. Sharad Bhartiya
• Prof. Vishwesh Kulkarni
Sponsors:
IIT Bombay
Contributors:
• Mukund Thattai, NCBS, Bangalore
• Dr. Manjula Reddy, CCMB, Hyderabad

Thank you!!
11/1/2009 Team IIT Bombay, Jamboree 2009 32

Q&A
• Bode plot analysis
11/1/2009 Team IIT Bombay, Jamboree 2009 33

11/1/2009 Team IIT Bombay, Jamboree 2009 34
Magnitude and Phase Bode plots
ZERO IPTG HIGH IPTG
BACK