Increasing Global Competition and Labor Productivity ...
21
Increasing Global Competition and Labor Productivity: Lessons from the US Automotive Industry McKinsey Global Institute November 2005
Transcript of Increasing Global Competition and Labor Productivity ...
Increasing Global Competition andLabor Productivity: Lessons from theUS Automotive Industry
McKinsey Global Institute
November 2005

The McKinsey Global Institute (MGI) was established in 1990 as an independent
think tank within McKinsey & Company, Inc., to conduct original research and
reach a better understanding of the workings of the global economy. From time
to time, MGI issues public reports. These reports are issued at the discretion
of MGI’s director, Diana Farrell, and its McKinsey Advisory Board when they
conclude that MGI's international perspective and its ability to access
McKinsey’s knowledge of industry economics enable it to provide a valuable fact
base to policy debates. The McKinsey Advisory Board is made up of McKinsey
partners from Europe, Asia-Pacific, and the Americas.
MGI's staff members are drawn primarily from McKinsey’s consultants. They
serve 6- to 12-month assignments and then return to client work. MGI also
commissions leading academics to participate in its research.
The McKinsey Global Institute is based in San Francisco and has a presence in
Washington, DC, New York and Shanghai. MGI research fellows are based
around the world as needed for individual research projects.

Increasing Global Competition andLabor Productivity: Lessons from theUS Automotive Industry
Martin Neil BailyDiana FarrellEzra GreenbergJan-Dirk HenrichNaoko JinjoMaya JollesJaana Remes
"Increased Global Competition and Productivity Growth in the US Auto Industry" is
the result of ongoing research by the McKinsey Global Institute aimed at
understanding the process of global economic integration and its implications. It
examines in depth the response of US auto manufacturers to increased
competition from overseas-based competitors in the fifteen years from 1987 to
2002. Building on MGI's many country and sector productivity studies, this
research examines in detail how company-level actions translate increasing
competitive intensity resulting from global market integration into accelerated
growth in sector productivity.
Martin Baily, Senior Advisor to MGI and Senior Fellow at the Institute for
International Economics, MGI Fellows Jaana Remes from McKinsey's San
Francisco Office and Ezra Greenberg, from McKinsey's Washington DC Office,
worked closely with me to provide leadership to this project. The project team also
included MGI Fellows Jan-Dirk Henrich from McKinsey's Cologne Office, Naoko
Jinjo from McKinsey's Tokyo Office, and Maya Jolles from McKinsey's Benelux
Knowledge Center.
We have benefited enormously from the extensive input received from McKinsey's
global network of industry and functional experts. We would like to extend a
special thanks to Glenn Mercer, a Senior Expert with McKinsey's Global
Automotive and Assembly Practice, who provided invaluable and active guidance
throughout the project. We also benefited from conversations with McKinsey
practitioners Tom Dohrmann, Matt Jauchius, Hiroshi Hayakawa, David Henderson,
Hans-Werner Kaas, Stefan Knupfer, Stephan Kriesel, Guntram Nöth, Aurobind
Preface
4
Satpathy, Lothar Stein, and Andreas Zielke. In addition to our internal experts,
we benefited from conversations with many external experts including Chris
Benko, Lance Ealey, James Kondo, Sean McAlinden, and Michael Robinet.
Tim Beacom, MGI's dedicated Senior Analyst, Abhishek of McKinsey’s North
American Knowledge Center, and Julie Cook, Lutz Gläser, Tomoko Hibino, Tom
Pepin, and Karen Victory of the Global Automotive and Assembly practice
provided essential research support, and numerous helpful conversations.
Susan Lund and Gina Campbell provided thoughtful input and editorial support.
Moreover, Deadra Henderson, MGI's Practice Administrator, Terry Gatto, our
Executive Assistant and Rebeca Robboy, MGI's External Relations Manager,
supported the effort throughout.
As always, the findings and conclusions draw from the unique perspectives that
our colleagues bring to bear on the sectors and countries researched here.
These perspectives are a product of intensive client work with the world's
leading firms. They are supplemented by in-depth analytical work and extensive
interviews and dialogues with executives, government officials, and other
leading thinkers.
Our aspiration is to provide a fact base to the public debate on the impact of
global competition and productivity growth to enable policy makers and business
leaders to make more informed and better decisions.
As with all MGI projects, this work is independent and has not been
commissioned or sponsored in any way by any business, government, or other
institution.
Diana Farrell
Director, McKinsey Global Institute
November, 2005
5

6
Numerous studies by the McKinsey Global Institute (MGI) and others have shown
that when new, more productive players enter a sector previously sheltered from
global competition, the sector's overall level of productivity rises. Less well
understood, however, is what companies actually do to link this cause and effect.
In increasingly global markets, it is important to understand how firms and
policymakers can best respond to increasing competitive threats. To that end, we
have studied the US automotive manufacturing sector between 1987 and 2002
as representative of an industry exposed to significant pressure from global
competition. In particular, we have looked at the effects on company and sector
productivity of decisions taken by the "Big Three"—Ford, Chrysler and GM—in
response to competition from Japan-based Original Equipment Manufacturers
(OEMs) and also competitors based in Germany and Korea.
The Big Three's responses to these competitive threats were largely responsible
for increases in sector labor productivity over this period. Rising by 3.3 percent
a year, productivity performance in the US production of new vehicles was
substantially faster than the 2.1 percent growth rate achieved by the non-farm
business sector.1 However, the three companies responded to the new
competition at different rates and in different ways, depending on their perception
of the seriousness of the threat, their understanding of the new players' sources
of advantage, and the scale and speed at which they could introduce and emulate
innovations.
Executive Summary
7
1 Our sector definition includes the assembly and production of parts for new vehicles.Productivity is defined as real value added per hour.
8
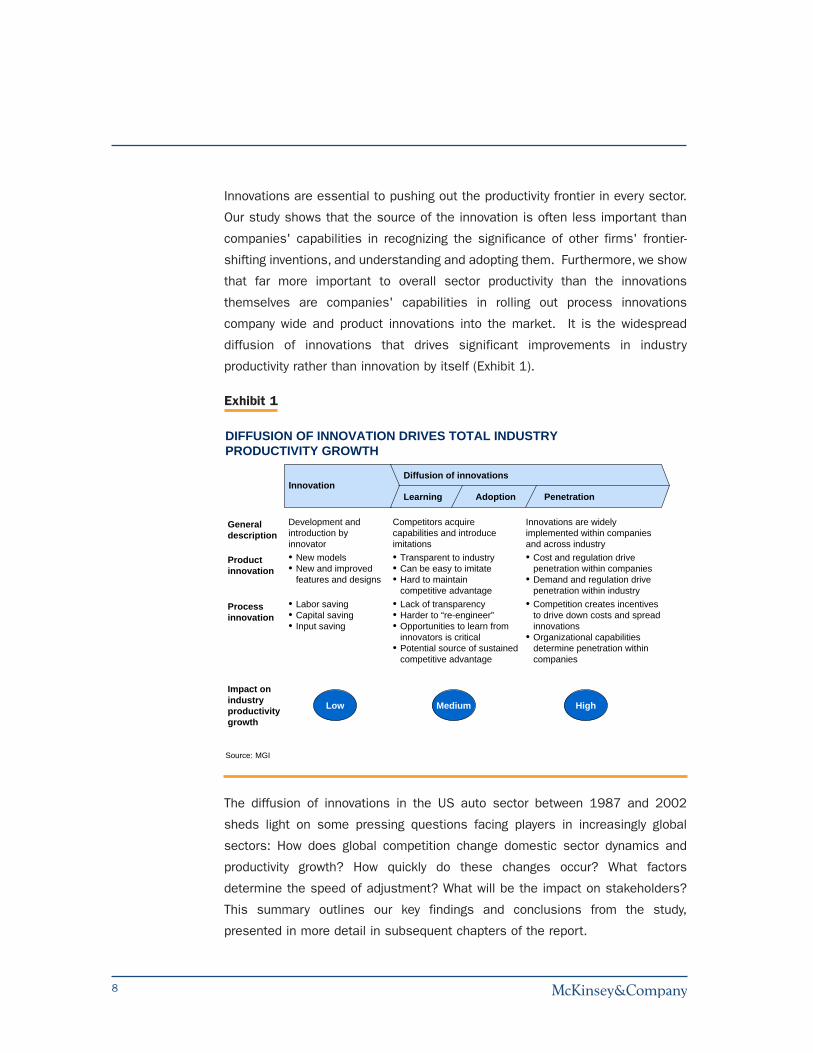
Innovations are essential to pushing out the productivity frontier in every sector.
Our study shows that the source of the innovation is often less important than
companies' capabilities in recognizing the significance of other firms' frontier-
shifting inventions, and understanding and adopting them. Furthermore, we show
that far more important to overall sector productivity than the innovations
themselves are companies' capabilities in rolling out process innovations
company wide and product innovations into the market. It is the widespread
diffusion of innovations that drives significant improvements in industry
productivity rather than innovation by itself (Exhibit 1).
The diffusion of innovations in the US auto sector between 1987 and 2002
sheds light on some pressing questions facing players in increasingly global
sectors: How does global competition change domestic sector dynamics and
productivity growth? How quickly do these changes occur? What factors
determine the speed of adjustment? What will be the impact on stakeholders?
This summary outlines our key findings and conclusions from the study,
presented in more detail in subsequent chapters of the report.
DIFFUSION OF INNOVATION DRIVES TOTAL INDUSTRY PRODUCTIVITY GROWTH
Source: MGI
Generaldescription
Development and introduction by innovator
Competitors acquire capabilities and introduce imitations
Innovations are widely implemented within companies and across industry
Productinnovation
• New models• New and improved
features and designs
• Transparent to industry• Can be easy to imitate• Hard to maintain
competitive advantage
• Cost and regulation drive penetration within companies
• Demand and regulation drive penetration within industry
Process innovation
• Labor saving• Capital saving• Input saving
• Lack of transparency• Harder to “re-engineer”• Opportunities to learn from
innovators is critical• Potential source of sustained
competitive advantage
• Competition creates incentives to drive down costs and spread innovations
• Organizational capabilities determine penetration within companies
Impact on industry productivity growth
InnovationDiffusion of innovations
Learning Penetration Adoption
Medium HighLow
Exhibit 1
9
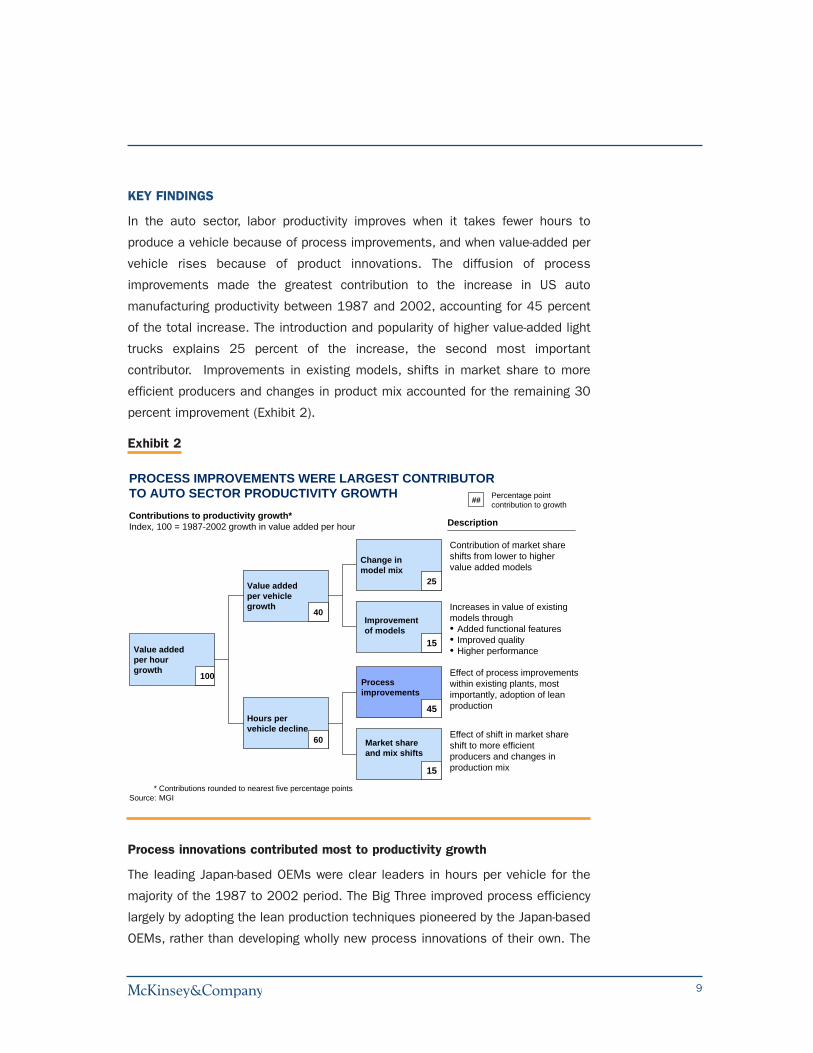
KEY FINDINGS
In the auto sector, labor productivity improves when it takes fewer hours to
produce a vehicle because of process improvements, and when value-added per
vehicle rises because of product innovations. The diffusion of process
improvements made the greatest contribution to the increase in US auto
manufacturing productivity between 1987 and 2002, accounting for 45 percent
of the total increase. The introduction and popularity of higher value-added light
trucks explains 25 percent of the increase, the second most important
contributor. Improvements in existing models, shifts in market share to more
efficient producers and changes in product mix accounted for the remaining 30
percent improvement (Exhibit 2).
Process innovations contributed most to productivity growth
The leading Japan-based OEMs were clear leaders in hours per vehicle for the
majority of the 1987 to 2002 period. The Big Three improved process efficiency
largely by adopting the lean production techniques pioneered by the Japan-based
OEMs, rather than developing wholly new process innovations of their own. The
PROCESS IMPROVEMENTS WERE LARGEST CONTRIBUTOR TO AUTO SECTOR PRODUCTIVITY GROWTH
Value added per hour growth
100
Value added per vehicle growth
40
Hours per vehicle decline
60
Description
Change in model mix
25
Contribution of market share shifts from lower to higher value added models
15
Increases in value of existing models through• Added functional features• Improved quality• Higher performance
15
Effect of shift in market share shift to more efficient producers and changes in production mix
45
Effect of process improvements within existing plants, most importantly, adoption of lean production
Contributions to productivity growth*Index, 100 = 1987-2002 growth in value added per hour
Percentage point contribution to growth##
* Contributions rounded to nearest five percentage pointsSource: MGI
Improvement of models
Processimprovements
Market share and mix shifts
Exhibit 2
10
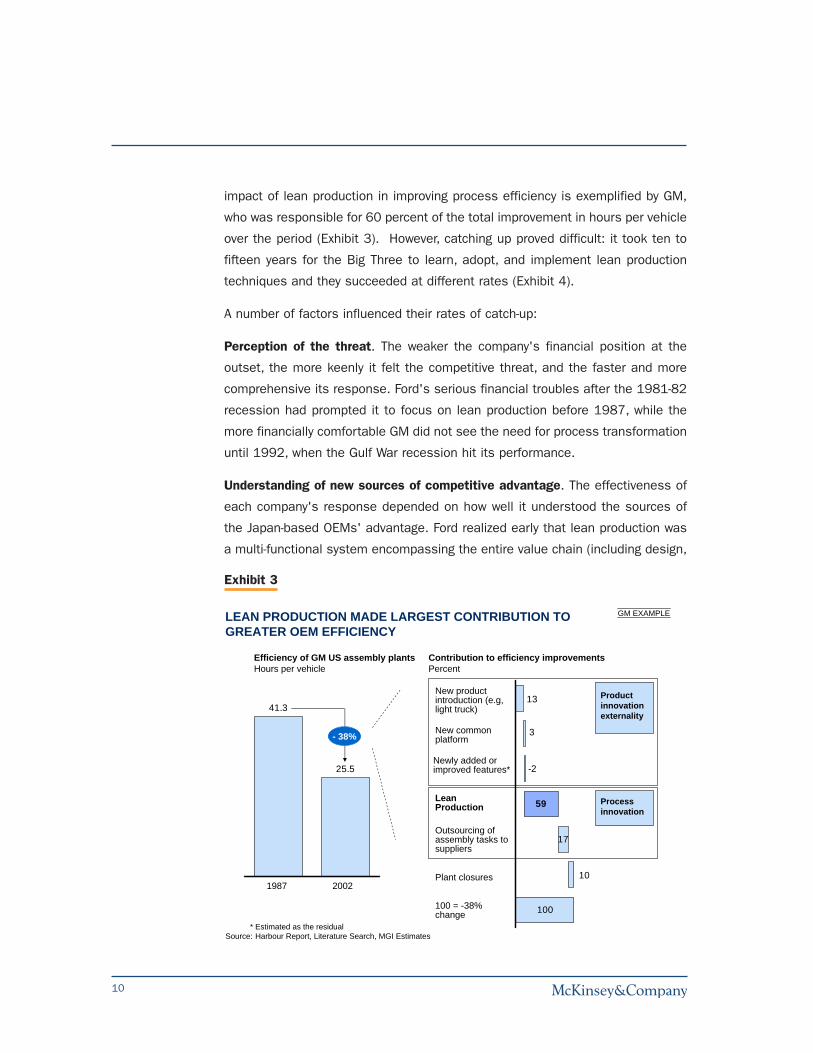
impact of lean production in improving process efficiency is exemplified by GM,
who was responsible for 60 percent of the total improvement in hours per vehicle
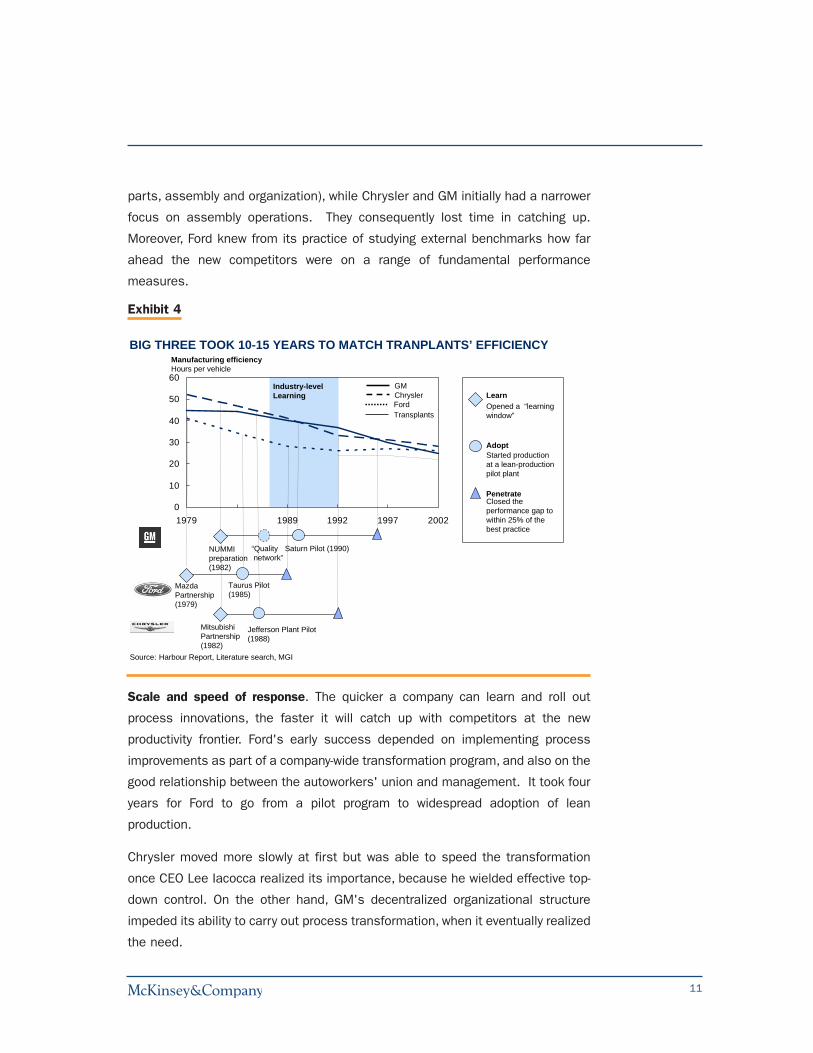
over the period (Exhibit 3). However, catching up proved difficult: it took ten to
fifteen years for the Big Three to learn, adopt, and implement lean production
techniques and they succeeded at different rates (Exhibit 4).
A number of factors influenced their rates of catch-up:
Perception of the threat. The weaker the company's financial position at the
outset, the more keenly it felt the competitive threat, and the faster and more
comprehensive its response. Ford's serious financial troubles after the 1981-82
recession had prompted it to focus on lean production before 1987, while the
more financially comfortable GM did not see the need for process transformation
until 1992, when the Gulf War recession hit its performance.
Understanding of new sources of competitive advantage. The effectiveness of
each company's response depended on how well it understood the sources of
the Japan-based OEMs' advantage. Ford realized early that lean production was
a multi-functional system encompassing the entire value chain (including design,
LEAN PRODUCTION MADE LARGEST CONTRIBUTION TO GREATER OEM EFFICIENCY
41.3
25.5
20021987
Efficiency of GM US assembly plantsHours per vehicle
- 38%
Contribution to efficiency improvementsPercent
New product introduction (e.g, light truck)
New common platform
Newly added or improved features*
Outsourcing of assembly tasks to suppliers
Lean Production
Plant closures
100 = -38% change
17
100
59
3
-2
13
10
Product innovationexternality
Processinnovation
* Estimated as the residualSource: Harbour Report, Literature Search, MGI Estimates
GM EXAMPLE
Exhibit 3
11
parts, assembly and organization), while Chrysler and GM initially had a narrower
focus on assembly operations. They consequently lost time in catching up.
Moreover, Ford knew from its practice of studying external benchmarks how far
ahead the new competitors were on a range of fundamental performance
measures.
Scale and speed of response. The quicker a company can learn and roll out
process innovations, the faster it will catch up with competitors at the new
productivity frontier. Ford's early success depended on implementing process
improvements as part of a company-wide transformation program, and also on the
good relationship between the autoworkers' union and management. It took four
years for Ford to go from a pilot program to widespread adoption of lean
production.
Chrysler moved more slowly at first but was able to speed the transformation
once CEO Lee Iacocca realized its importance, because he wielded effective top-
down control. On the other hand, GM's decentralized organizational structure
impeded its ability to carry out process transformation, when it eventually realized
the need.
0
10
20
30
40
50
60
1979 1989 1992 1997 2002
BIG THREE TOOK 10-15 YEARS TO MATCH TRANPLANTS’ EFFICIENCY
NUMMIpreparation(1982)
Saturn Pilot (1990)
Taurus Pilot(1985)
MazdaPartnership(1979)
Source: Harbour Report, Literature search, MGI
MitsubishiPartnership(1982)
Learn
Adopt
Penetrate
Opened a “learning window”
Started production at a lean-production pilot plant
Closed the performance gap to within 25% of the best practice
Jefferson Plant Pilot(1988)
“Qualitynetwork”
Industry-levelLearning
GMChryslerFordTransplants
Manufacturing efficiencyHours per vehicle
Exhibit 4
12
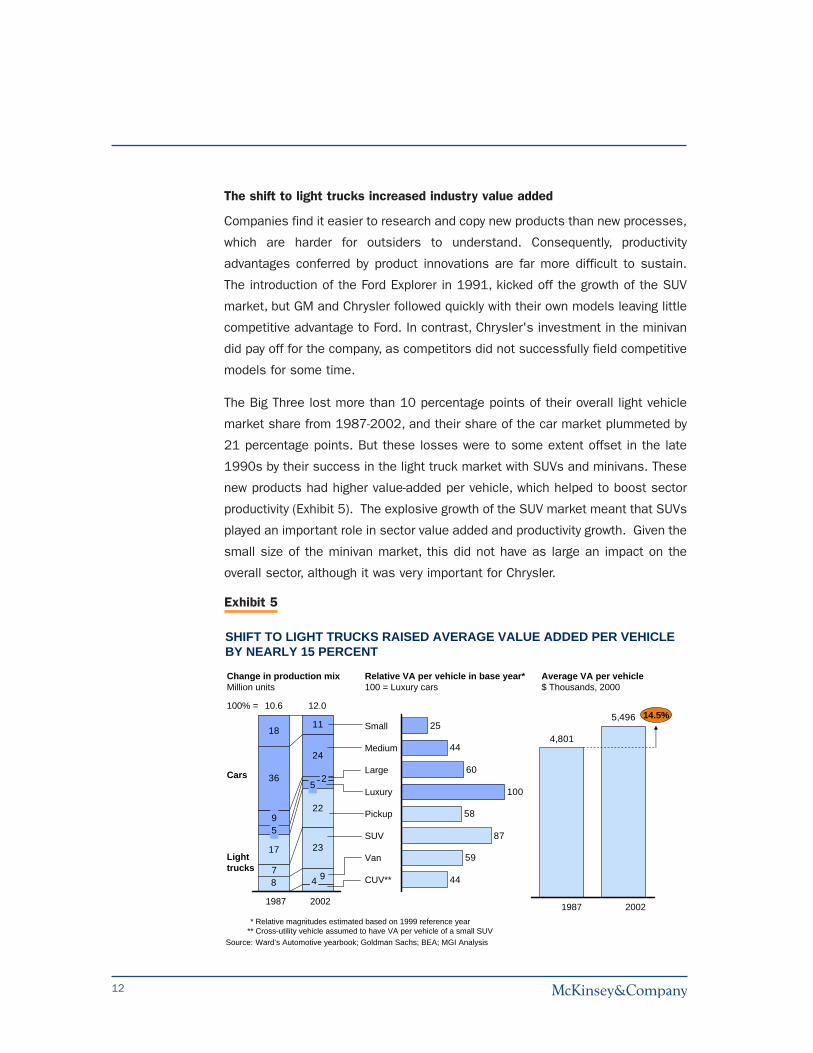
The shift to light trucks increased industry value added
Companies find it easier to research and copy new products than new processes,
which are harder for outsiders to understand. Consequently, productivity
advantages conferred by product innovations are far more difficult to sustain.
The introduction of the Ford Explorer in 1991, kicked off the growth of the SUV
market, but GM and Chrysler followed quickly with their own models leaving little
competitive advantage to Ford. In contrast, Chrysler's investment in the minivan
did pay off for the company, as competitors did not successfully field competitive
models for some time.
The Big Three lost more than 10 percentage points of their overall light vehicle
market share from 1987-2002, and their share of the car market plummeted by
21 percentage points. But these losses were to some extent offset in the late
1990s by their success in the light truck market with SUVs and minivans. These
new products had higher value-added per vehicle, which helped to boost sector
productivity (Exhibit 5). The explosive growth of the SUV market meant that SUVs
played an important role in sector value added and productivity growth. Given the
small size of the minivan market, this did not have as large an impact on the
overall sector, although it was very important for Chrysler.
59
44
25
44
60
100
58
87
4,801
5,496
SHIFT TO LIGHT TRUCKS RAISED AVERAGE VALUE ADDED PER VEHICLE BY NEARLY 15 PERCENT
* Relative magnitudes estimated based on 1999 reference year** Cross-utility vehicle assumed to have VA per vehicle of a small SUV
Source: Ward’s Automotive yearbook; Goldman Sachs; BEA; MGI Analysis
Change in production mixMillion units
Relative VA per vehicle in base year*100 = Luxury cars
Average VA per vehicle$ Thousands, 2000
7
2317
22
59
36
24
1811
489
52
10.6 12.0100% =
1987 2002
Small
Medium
Large
Luxury
Pickup
SUV
Van
CUV**
20021987
14.5%
Cars
Lighttrucks
Exhibit 5
13
Combined with their gains in manufacturing efficiency, the Big Three's leadership
in the SUV and minivan markets enabled them to reap substantial profits in the
second half of the 1990s. But by 2000, the Japan and Germany-based OEMs
were challenging their dominance in light trucks, materially eroding their profit
margins.
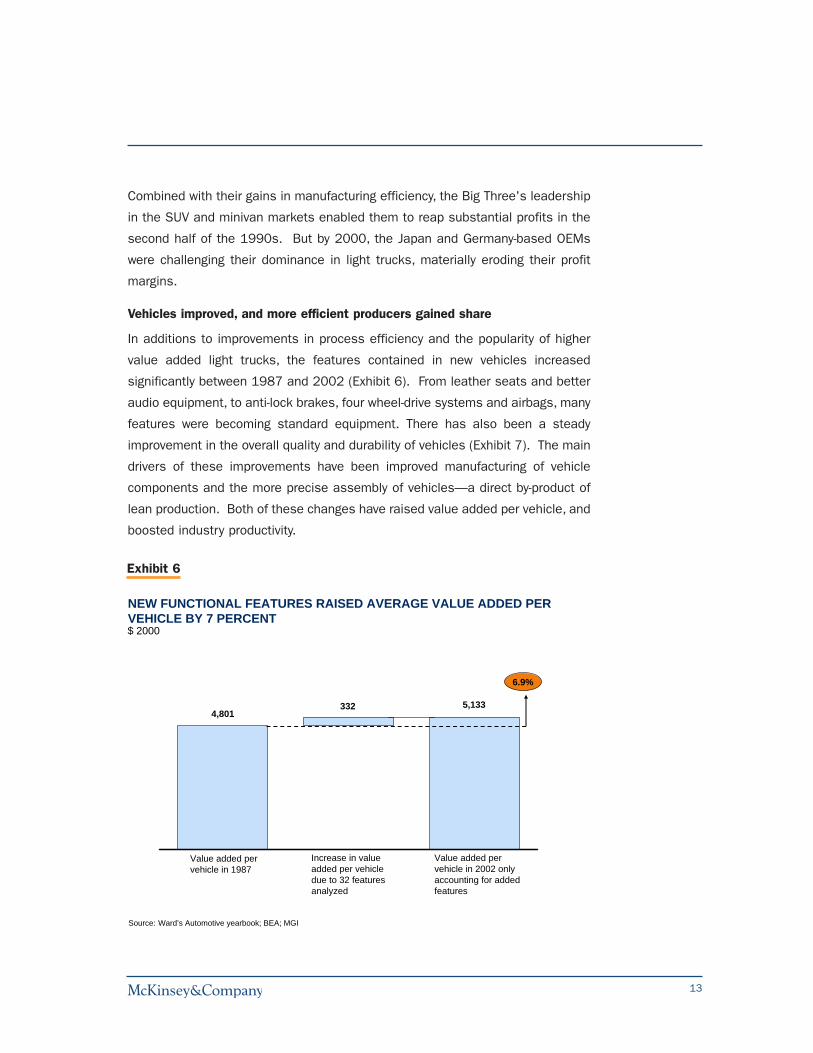
Vehicles improved, and more efficient producers gained share
In additions to improvements in process efficiency and the popularity of higher
value added light trucks, the features contained in new vehicles increased
significantly between 1987 and 2002 (Exhibit 6). From leather seats and better
audio equipment, to anti-lock brakes, four wheel-drive systems and airbags, many
features were becoming standard equipment. There has also been a steady
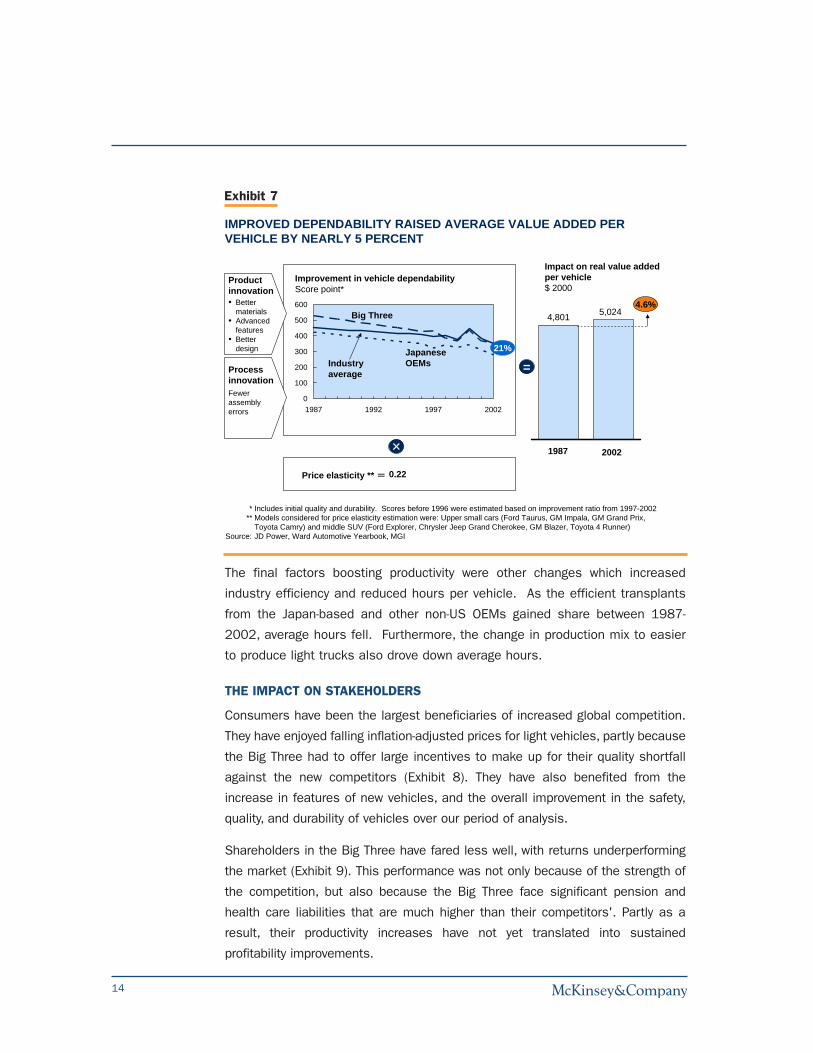
improvement in the overall quality and durability of vehicles (Exhibit 7). The main
drivers of these improvements have been improved manufacturing of vehicle
components and the more precise assembly of vehicles—a direct by-product of
lean production. Both of these changes have raised value added per vehicle, and
boosted industry productivity.
NEW FUNCTIONAL FEATURES RAISED AVERAGE VALUE ADDED PER VEHICLE BY 7 PERCENT
Value added per vehicle in 1987
Source: Ward’s Automotive yearbook; BEA; MGI
Increase in value added per vehicle due to 32 features analyzed
Value added per vehicle in 2002 only accounting for added features
$ 2000
4,801332 5,133
6.9%
Exhibit 6
14
The final factors boosting productivity were other changes which increased
industry efficiency and reduced hours per vehicle. As the efficient transplants
from the Japan-based and other non-US OEMs gained share between 1987-
2002, average hours fell. Furthermore, the change in production mix to easier
to produce light trucks also drove down average hours.
THE IMPACT ON STAKEHOLDERS
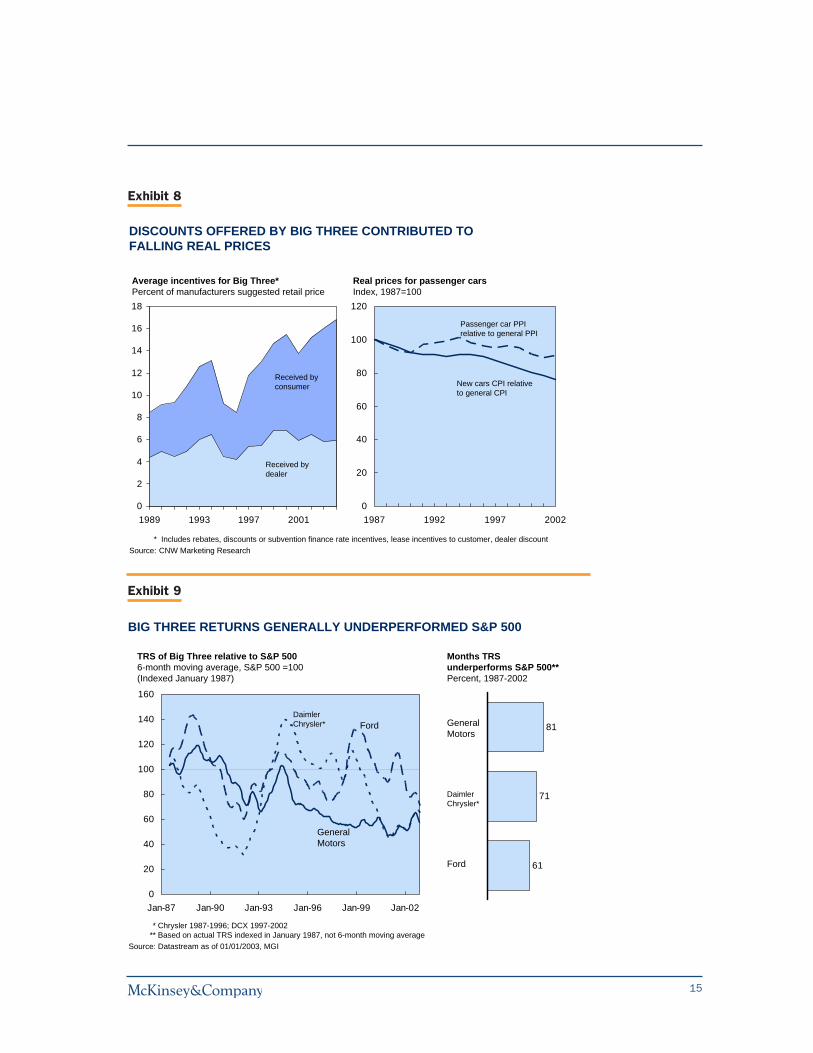
Consumers have been the largest beneficiaries of increased global competition.
They have enjoyed falling inflation-adjusted prices for light vehicles, partly because
the Big Three had to offer large incentives to make up for their quality shortfall
against the new competitors (Exhibit 8). They have also benefited from the
increase in features of new vehicles, and the overall improvement in the safety,
quality, and durability of vehicles over our period of analysis.
Shareholders in the Big Three have fared less well, with returns underperforming
the market (Exhibit 9). This performance was not only because of the strength of
the competition, but also because the Big Three face significant pension and
health care liabilities that are much higher than their competitors'. Partly as a
result, their productivity increases have not yet translated into sustained
profitability improvements.
IMPROVED DEPENDABILITY RAISED AVERAGE VALUE ADDED PER VEHICLE BY NEARLY 5 PERCENT
0
100
200
300
400
500
600
1987 1992 1997 2002
Big Three
Improvement in vehicle dependabilityScore point*
Industry average
JapaneseOEMs
20021987
4,801 5,0244.6%
Impact on real value added per vehicle$ 2000
Price elasticity ** 0.22
21%
Productinnovation• Better
materials• Advanced
features• Better
design
* Includes initial quality and durability. Scores before 1996 were estimated based on improvement ratio from 1997-2002** Models considered for price elasticity estimation were: Upper small cars (Ford Taurus, GM Impala, GM Grand Prix,
Toyota Camry) and middle SUV (Ford Explorer, Chrysler Jeep Grand Cherokee, GM Blazer, Toyota 4 Runner)Source: JD Power, Ward Automotive Yearbook, MGI
=
Fewerassemblyerrors
Process innovation
Exhibit 7
15
0
20
40
60
80
100
120
1987 1992 1997 2002
Real prices for passenger carsIndex, 1987=100
New cars CPI relative to general CPI
Passenger car PPI relative to general PPI
DISCOUNTS OFFERED BY BIG THREE CONTRIBUTED TO FALLING REAL PRICES
* Includes rebates, discounts or subvention finance rate incentives, lease incentives to customer, dealer discount Source: CNW Marketing Research
0
2
4
6
8
10
12
14
16
18
1989 1993 1997 2001
Average incentives for Big Three*Percent of manufacturers suggested retail price
Received byconsumer
Received bydealer
Exhibit 8
BIG THREE RETURNS GENERALLY UNDERPERFORMED S&P 500
0
20
40
60
80
100
120
140
160
Jan-87 Jan-90 Jan-93 Jan-96 Jan-99 Jan-02
TRS of Big Three relative to S&P 5006-month moving average, S&P 500 =100 (Indexed January 1987)
Ford
GeneralMotors
Daimler Chrysler*
* Chrysler 1987-1996; DCX 1997-2002** Based on actual TRS indexed in January 1987, not 6-month moving average
Source: Datastream as of 01/01/2003, MGI
61
71
81
Months TRS underperforms S&P 500**Percent, 1987-2002
Ford
GeneralMotors
Daimler Chrysler*
Exhibit 9
16
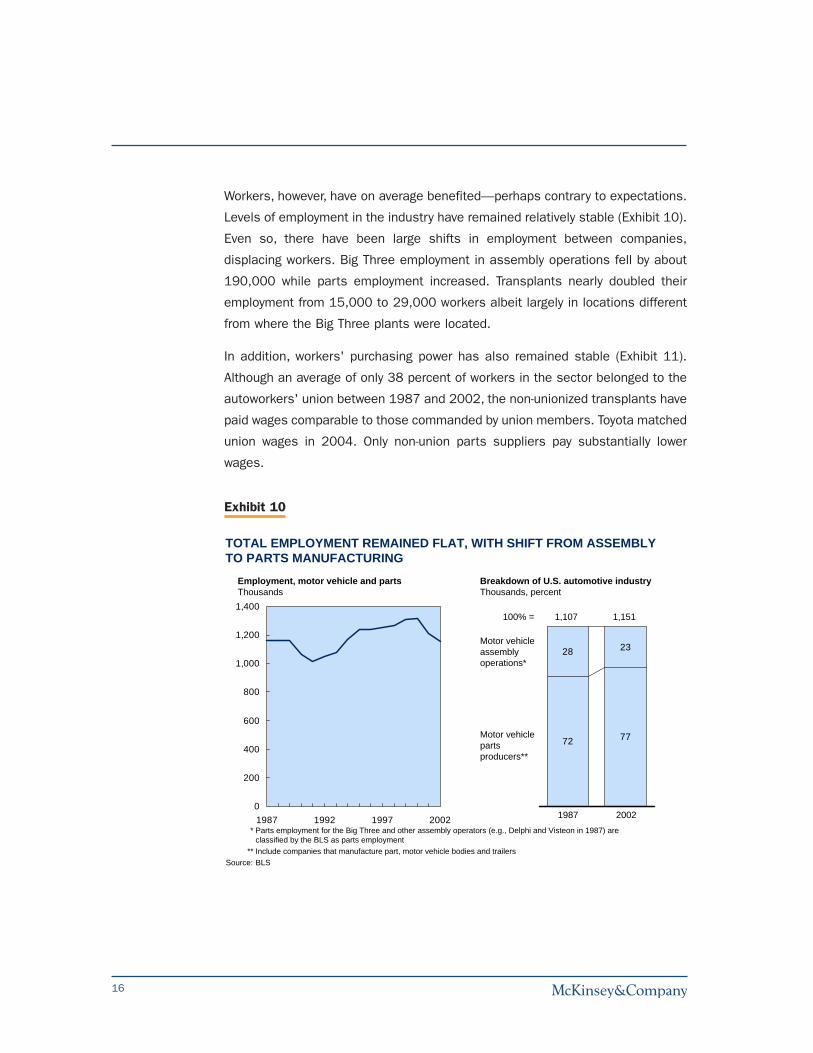
Workers, however, have on average benefited—perhaps contrary to expectations.
Levels of employment in the industry have remained relatively stable (Exhibit 10).
Even so, there have been large shifts in employment between companies,
displacing workers. Big Three employment in assembly operations fell by about
190,000 while parts employment increased. Transplants nearly doubled their
employment from 15,000 to 29,000 workers albeit largely in locations different
from where the Big Three plants were located.
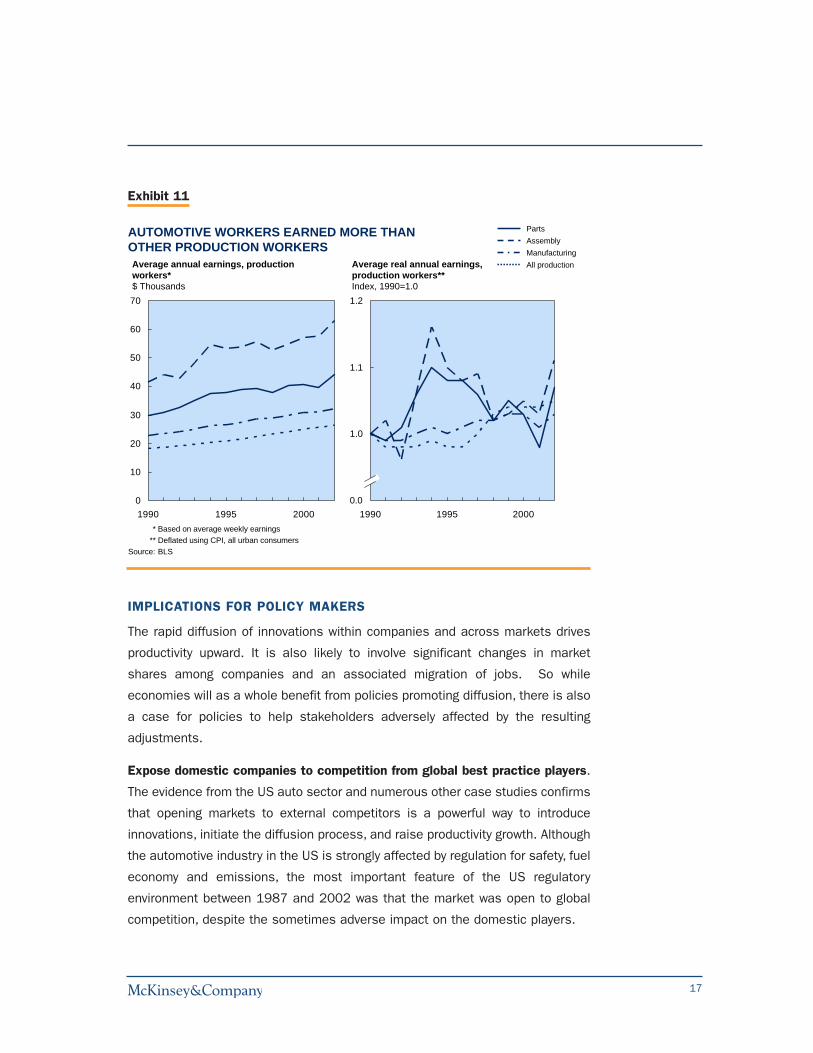
In addition, workers' purchasing power has also remained stable (Exhibit 11).
Although an average of only 38 percent of workers in the sector belonged to the
autoworkers' union between 1987 and 2002, the non-unionized transplants have
paid wages comparable to those commanded by union members. Toyota matched
union wages in 2004. Only non-union parts suppliers pay substantially lower
wages.
TOTAL EMPLOYMENT REMAINED FLAT, WITH SHIFT FROM ASSEMBLY TO PARTS MANUFACTURING
0
200
400
600
800
1,000
1,200
1,400
1987 1992 1997 2002
Employment, motor vehicle and partsThousands
Breakdown of U.S. automotive industryThousands, percent
72 77
28 23
1,107 1,151
Motor vehicle assemblyoperations*
Motor vehicle partsproducers**
100% =
1987 2002* Parts employment for the Big Three and other assembly operators (e.g., Delphi and Visteon in 1987) are
classified by the BLS as parts employment** Include companies that manufacture part, motor vehicle bodies and trailers
Source: BLS
Exhibit 10
17
IMPLICATIONS FOR POLICY MAKERS
The rapid diffusion of innovations within companies and across markets drives
productivity upward. It is also likely to involve significant changes in market
shares among companies and an associated migration of jobs. So while
economies will as a whole benefit from policies promoting diffusion, there is also
a case for policies to help stakeholders adversely affected by the resulting
adjustments.
Expose domestic companies to competition from global best practice players.
The evidence from the US auto sector and numerous other case studies confirms
that opening markets to external competitors is a powerful way to introduce
innovations, initiate the diffusion process, and raise productivity growth. Although
the automotive industry in the US is strongly affected by regulation for safety, fuel
economy and emissions, the most important feature of the US regulatory
environment between 1987 and 2002 was that the market was open to global
competition, despite the sometimes adverse impact on the domestic players.
0
10
20
30
40
50
60
70
1990 1995 2000
AUTOMOTIVE WORKERS EARNED MORE THAN OTHER PRODUCTION WORKERS
* Based on average weekly earnings** Deflated using CPI, all urban consumers
Source: BLS
Average annual earnings, production workers*$ Thousands
0.9
1.0
1.1
1.2
1990 1995 2000
Average real annual earnings, production workers**Index, 1990=1.0
0.0
PartsAssemblyManufacturingAll production
Exhibit 11
18
Support stakeholders who lose out. Policymakers should consider measures to
help dislocated stakeholders manage the transition. For example, they could offer
job-retraining credits to employers, giving them an incentive to hire displaced
workers, or provide continuing education grants for workers, giving them a chance
to build skills in demand particularly from growing areas of the economy, such as
healthcare, education, and social services. Severance packages can help, while
portable medical insurance plans and pension benefits are essential to a
workforce changing jobs more frequently.
Use regulation to promote rather than hamper diffusion. Governments should
remove barriers to the spread of new products or processes, such as regulations
imposing domestic content quotas on producers, and preventing them from
buying higher quality parts if foreign companies make them. Regulations can also
directly promote the diffusion of innovations: in the auto case, we found that
federal environmental and safety standards led to the rapid spread of vehicle
features that would otherwise have diffused more slowly.
Promote the sharing of key information. Governments can do a lot to help
companies identify and emulate the most important innovations in their sector.
In the auto sector, for instance, government research grants helped companies
to study lean production techniques and understand that higher productivity was
the root cause of Toyota and Honda's competitive advantage. The government
can also encourage private sector players to help break down information
barriers. The introduction of OEM and car model quality rankings, enabled both
OEMs and consumers to make objective comparisons of their performance. Once
consumers were able to compare the quality of different OEMs they could make
more informed choices, so that market shares better reflected the underlying
performance of manufacturers.
IMPLICATIONS FOR COMPANIES
Companies should not focus exclusively on developing their own innovations, but
learn as well how to recognize, understand and adopt the significant innovations
of other companies. To that end, the primary source of long-term, sustainable
competitive advantage lies in achieving higher productivity than competitors.
Understand the drivers of relative strengths. Traditional financial benchmarks
may not reveal the real source of competitors' productivity advantages.
19
Companies should also use a productivity-based diagnostic tool that can provide
insight into the differences in company operations and capabilities that drive
productivity, such as superior products or processes.
Recognize the importance of process innovations to productivity. Since product
innovations are relatively easy to copy, isolated innovations cannot offer a long-
term response to a new competitive challenge. Toyota's enduring strong
performance in the US market demonstrates that competitive advantage derived
from process innovation lasts longer: its roots are harder to understand and take
longer to copy. Companies that want to differentiate themselves through product
innovations need to excel in the process of product development—an
organizational skill that is harder for competitors to emulate than copying a
specific product.
Be flexible and ready to change. Responding to new global competition will often
involve radical upheaval, including reworking of product development, process
technology, supply chain management, marketing and distribution. Successful
companies with a strong position in their domestic market will find it particularly
difficult to recognize the seriousness of a new competitive threat. Why should
they bother to make such profound operational changes in response? But in
globally competitive markets, there is no room for complacency, even for market
leaders.
From an organizational standpoint, strict rules-based relationships with
employees and suppliers can be a significant barrier to implementing changes,
because buy-in from all stakeholders is required to reap the advantages of rapid
diffusion. Getting top management to focus on change makes organisations
evolve faster. Companies need to ensure that their incentive structure recognizes
and rewards the adoption and diffusion of best practices at every level, whether
these originate from within or beyond the organization.


McKinsey Global Institute05/11/11Copyright © McKinsey & Companywww.mckinsey.com/knowledge/mgiDesign by New Media, McKinsey & Company, Sydney