The OEE Challenge - Increasing Productivity
24
The OEE Challenge How productive are you? “It takes a German worker four days to produce what we make in five” Philip Hammond, Chancellor of the Exchequer
-
Upload
claire-healey -
Category
Software
-
view
313 -
download
2
Transcript of The OEE Challenge - Increasing Productivity

The OEE
ChallengeHow productive are you?
“It takes a German worker
four days to produce what
we make in five”
Philip Hammond, Chancellor of the Exchequer

The OEE ChallengeHow productive are you?
There are generally two ways
to improve productivity. One
is the purchase of better
machinery. The second involves a new process,
which allows a worker to
increase the speed or quality
of what they are doing.

The OEE ChallengeHow productive are you?
Many companies routinely hit
capacity constraints and immediately consider adding
overtime for existing workers,
hiring workers for a new shift,
or buying a new line.
Relatively few companies
have made the more modest
investment that is required to
optimise the performance of
their existing lines.

Team GB cyclists, under the leadership of Sir
David Brailsford, knew the end goal of
training and competition was to win races on
the national and international stage.

Instead of looking at the race as a whole, the team broke it down into its
component parts ranging from the aerodynamics of the equipment, to
dust that gathered on the bike, adversely effecting maintenance, and
set about making marginal gains…
…they measured everything
The small cumulative improvements across a
host of areas added up to a significant
improvement overall, and you can’t argue with
their medal tally over the years.
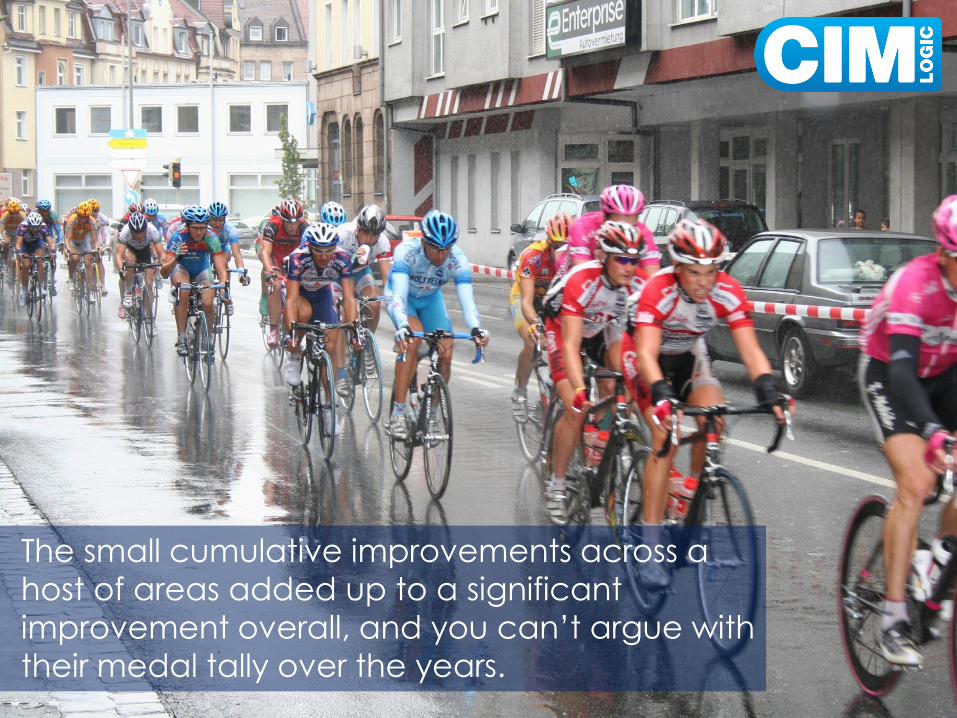
If you want to improve productivity, then you need to know what your
current performance level is, and
where improvements in the production
cycle can be made.

OEE (Overall Equipment Effectiveness), is a measurement that can help you
determine, how effective your manufacturing operations are, and where
improvements can be made. It is a calculation involving the components of
Availability, Performance and Quality, each measured
separately, so losses can be identified and
bottlenecks minimised.
Availability x Performance x Quality=OEE
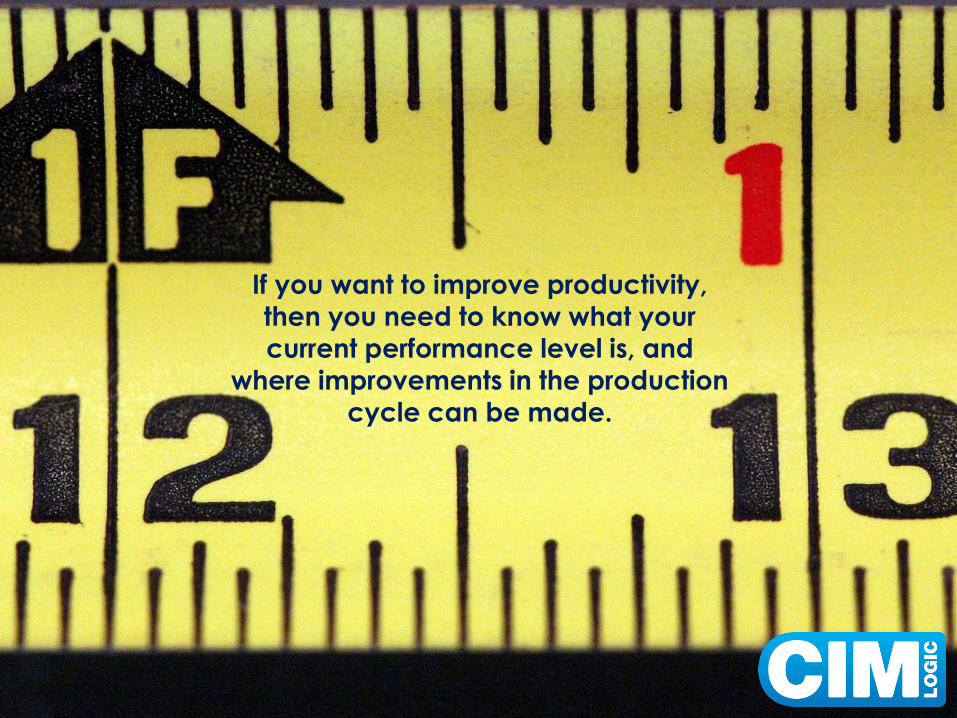
In order to have a good
understanding of OEE as a
concept, it is helpful to look at an
example. Consider a beverage
plant with the following
production schedule for the
bottling area. They have chosen
fifteen shifts to measure.
This data gives you all of the
information you need to
calculate OEE, which you can see
on the following page.
Item Data
Days of Operation Planned 5
Number of Shifts Planned 15
Total Available Time (minutes) 7,200
Total Planned Shutdown (minutes) 2,400
Downtime (minutes) 1,250
Theoretical (Ideal) Rate (e.g.
bottles per minute)
600
Total Bottles Produced 1,656,502
Rejected Bottles 1,207
Example
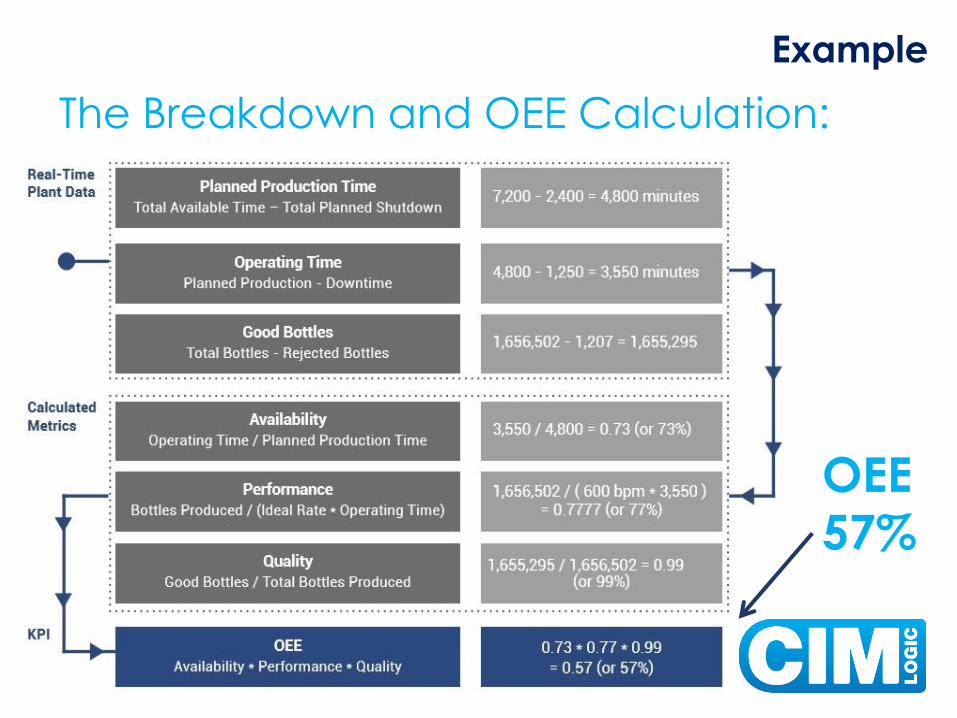
The Breakdown and OEE Calculation:
OEE
57%
Example
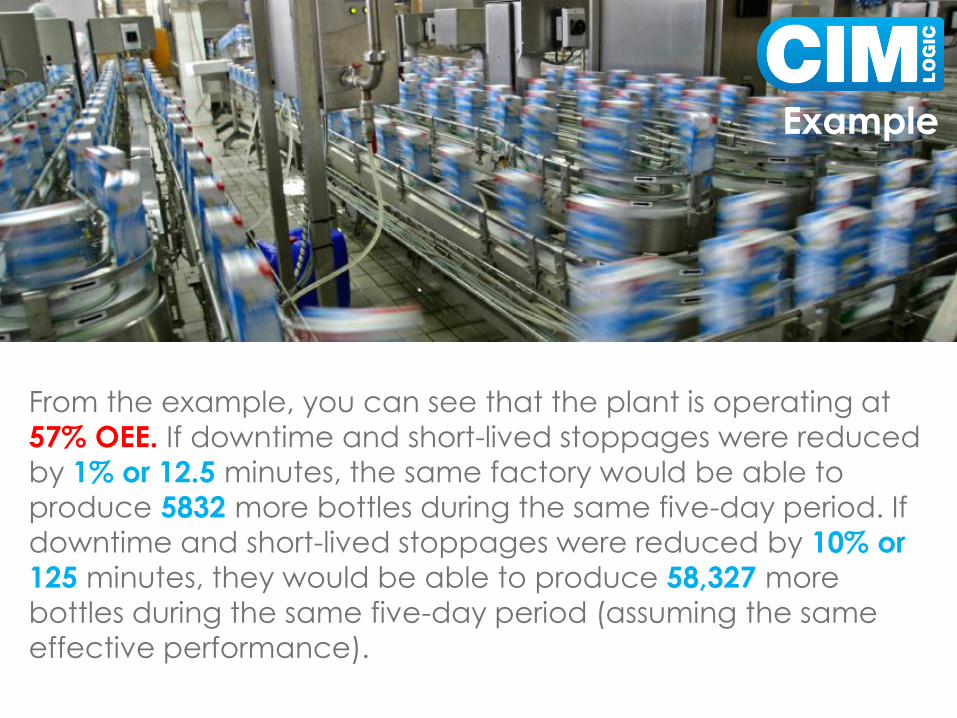
From the example, you can see that the plant is operating at
57% OEE. If downtime and short-lived stoppages were reduced
by 1% or 12.5 minutes, the same factory would be able to
produce 5832 more bottles during the same five-day period. If
downtime and short-lived stoppages were reduced by 10% or
125 minutes, they would be able to produce 58,327 more
bottles during the same five-day period (assuming the same
effective performance).
Example
If the factory was to reduce downtime and short-lived
stoppages by 10%, and the wholesale price of each
bottle was £0.56, during
each five-day period,
the bottling area
could produce
£32,669.66 more saleable product
per week. If the bottling area
is operating 260 days during the
year, the extra production would
be worth £1,698,822.12 without
extra shifts or overtime.
Example
By drilling down into the data you have gathered, you can spot
opportunities and begin to make
small incremental improvements.
For example, maybe the same machine
broke down several times and accounted
for 25% of the unplanned downtime, or
maybe labels were not available for 5% of the unplanned downtime.
If the example has inspired you, start measuring OEE and implementing
improvements. If you are new to OEE as a KPI and don’t have a systemwhich measures productivity in real-time, you can still calculate your
OEE in a few easy steps.
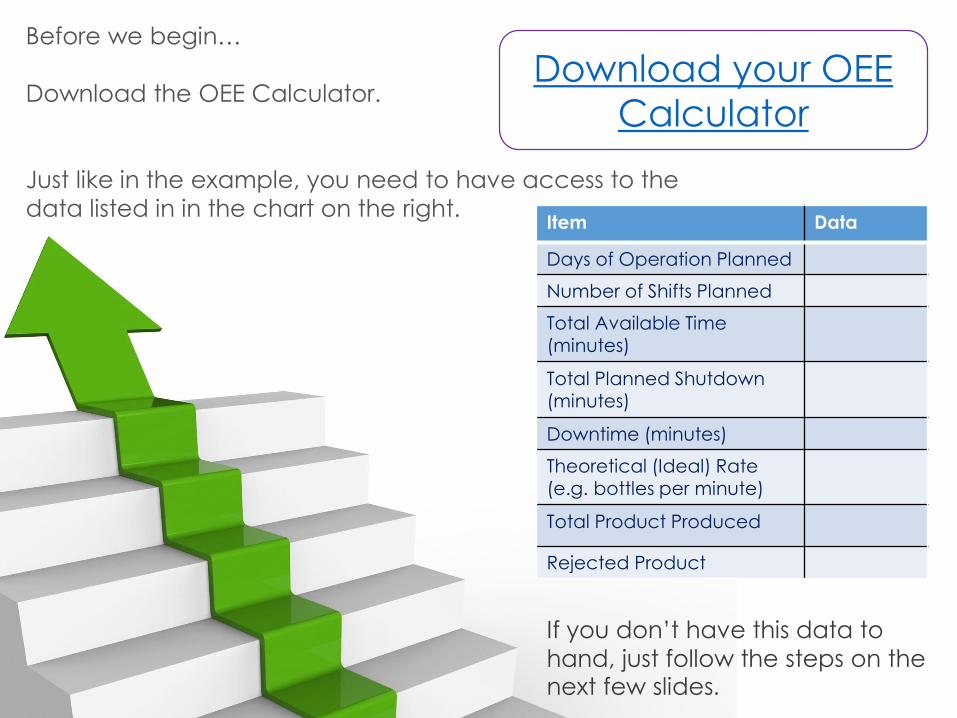
Before we begin…
Download the OEE Calculator.
Just like in the example, you need to have access to the
data listed in in the chart on the right.
Download your OEE
Calculator
Item Data
Days of Operation Planned
Number of Shifts Planned
Total Available Time (minutes)
Total Planned Shutdown (minutes)
Downtime (minutes)
Theoretical (Ideal) Rate (e.g. bottles per minute)
Total Product Produced
Rejected Product
If you don’t have this data to
hand, just follow the steps on the next few slides.
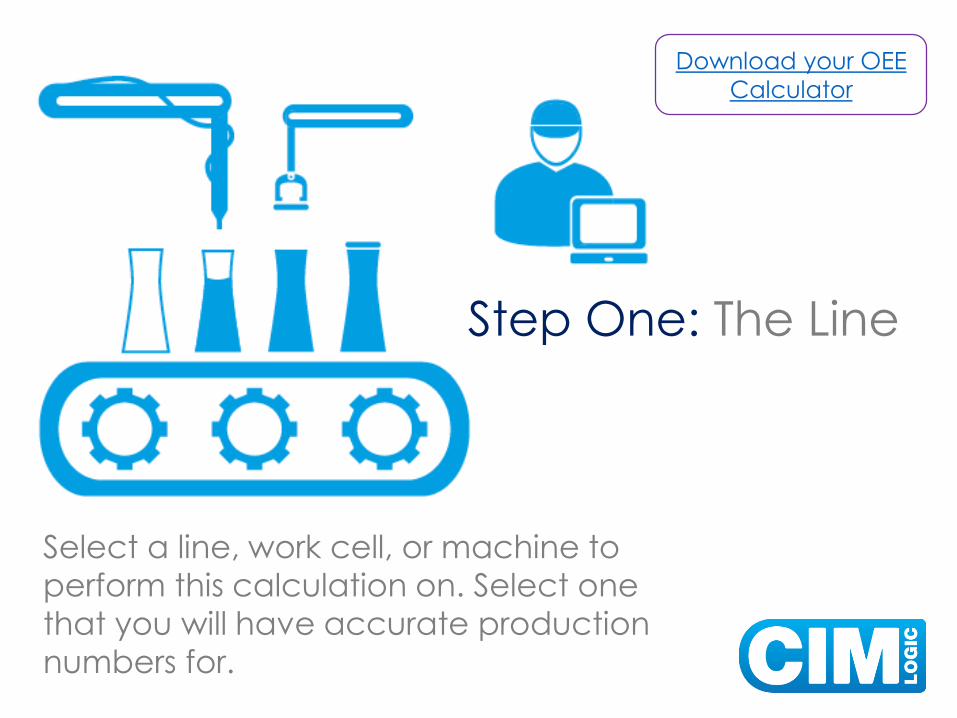
Select a line, work cell, or machine to
perform this calculation on. Select one
that you will have accurate production
numbers for.
Step One: The Line
Download your OEE
Calculator
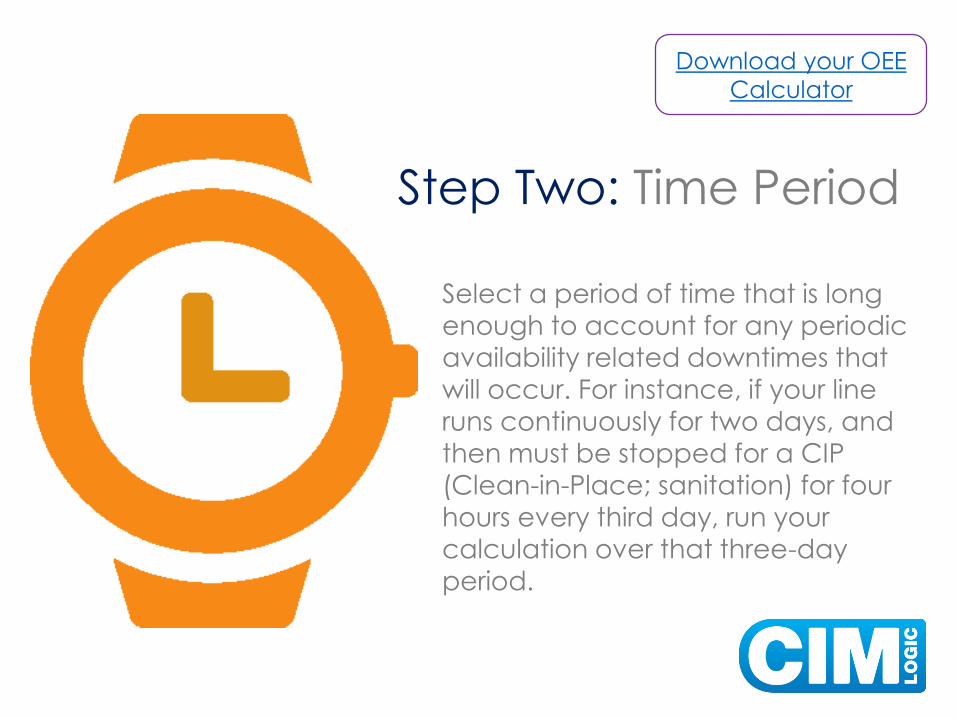
Step Two: Time Period
Select a period of time that is long
enough to account for any periodic
availability related downtimes that will occur. For instance, if your line
runs continuously for two days, and
then must be stopped for a CIP
(Clean-in-Place; sanitation) for four
hours every third day, run your
calculation over that three-day
period.
Download your OEE
Calculator
Step Three: Operating Time
For the time period that you are measuring (total available time),
you need to subtract the number of minutes that were planned
shutdown (e.g. if the line was not scheduled to run), this gives you
your planned production time.
Then you need to record all other downtime (short stoppages,
changeovers, cleaning, maintenance) and stoppages from within
the planned production time, this gives you your operating time.
Download your OEE
Calculator
Step Four: Theoretical Rate
You will need to know the real theoretical rate of the line based on the
equipment specifications on the line being measured.
This is the rate the equipment was to run at when purchased, NOT the rate that operators may currently be running the equipment at. This information is
gathered from equipment manuals, not calculated or gathered from how your
line is performing on its best day. If you are measuring a line that has several
machines operating on it with differing theoretical rates, the number you should
use is the lowest theoretical rate.
This can be in any units such as bottles per minute, units per minute, feet per
minute etc.
Download your OEE
Calculator

Step Five: Good Product
Produced
You will need to know the quantity of
good product produced vs total
product produced for the whole
time period that you are measuring.
Be consistent with the units you have
used for your theoretical rate, for
example bottles per minute, units per
minute, feet per minute etc.
Download your OEE
Calculator
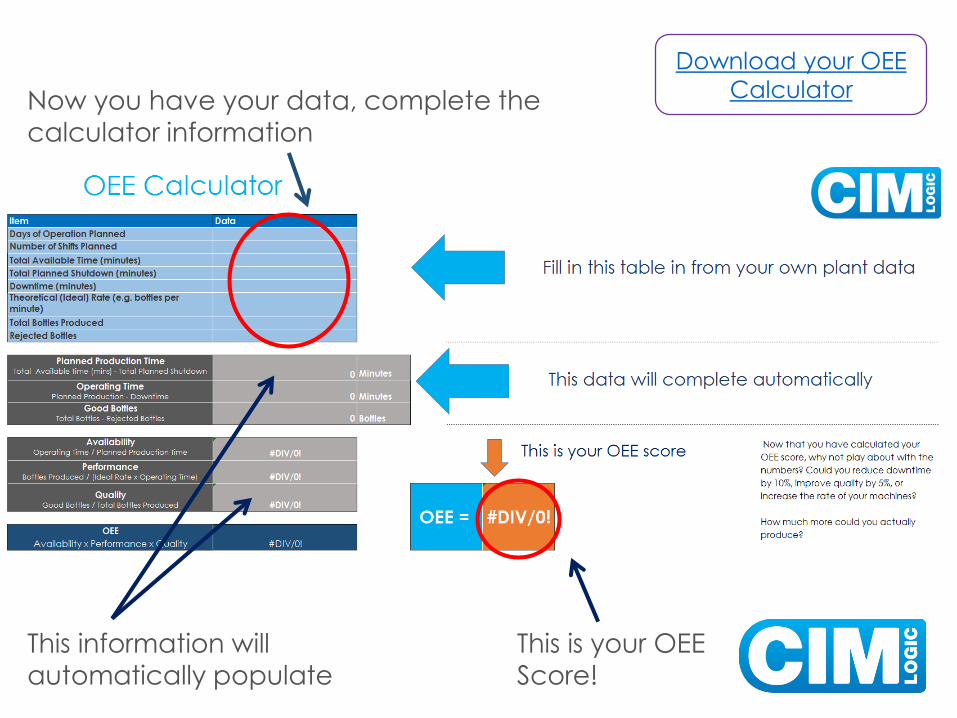
Download your OEE
CalculatorNow you have your data, complete the
calculator information
This information will
automatically populate
This is your OEE
Score!

Now that you have calculated your OEE score, why not play
about with the numbers?
Could you reduce downtime by 10%, improve quality by 5%, or
are your machines set to run lower than their theoretical rate?
How much more could you produce
AND SELL?

If you had this information, in real-
time and at your fingertips, you could
continually approve your operations.
The Return on Investment for TrakSYS Performance
Management is within six months. Find out more by
downloading the brochure
Download the
Brochure
Although it is a start measuring OEE manually, it is time consuming, and by
the time you have your data for calculation, the opportunity for
improvement has passed.
What Opportunities for improvement are you missing?

Manufacturing Improvement Solutions
01274 599 955
@Cimlogic Cimlogic Cimlogic
If like us, you would prefer to avoid unnecessary pitfalls and follow a path
which leads to measurable and sustainable improvement, then please contact us. We are here to help you.