Productivity in Korea - Brookings · ... Manufacture Service Construction Labor CapitalTFP Labor...
24
Productivity in Korea 2017.01.13 Jungwook Kim KDI-Brookings Workshop
-
Upload
nguyenliem -
Category
Documents
-
view
218 -
download
0
Transcript of Productivity in Korea - Brookings · ... Manufacture Service Construction Labor CapitalTFP Labor...

Productivity in Korea
2017.01.13 Jungwook Kim
KDI-Brookings Workshop

1. Current Status
2. Various Aspects of Productivity
3. Discussion

1 Current Status
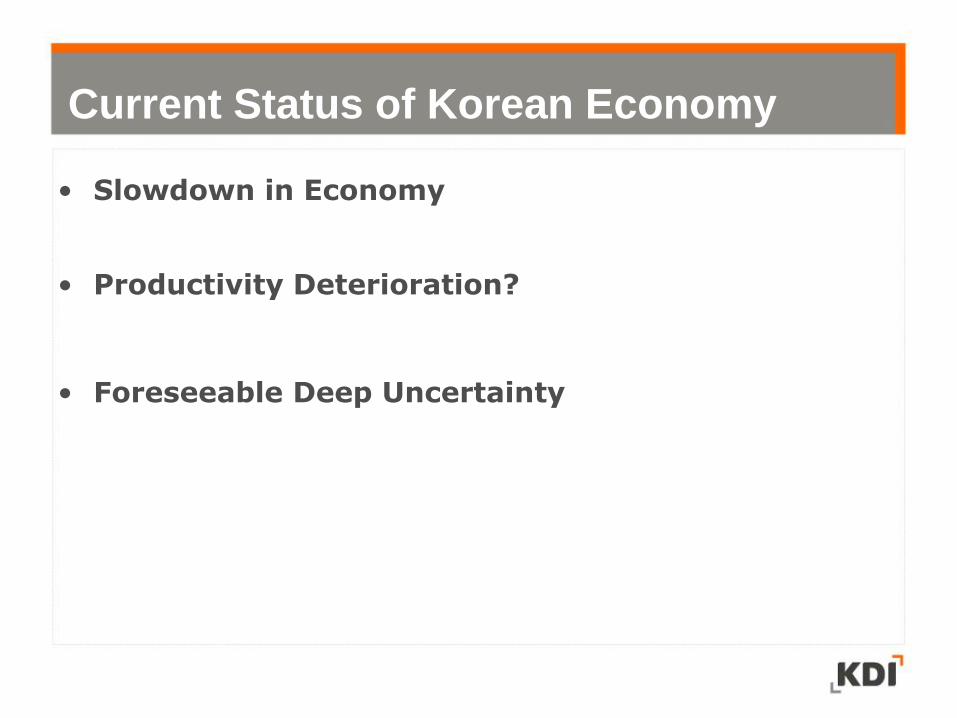
Current Status of Korean Economy
• Slowdown in Economy
• Productivity Deterioration?
• Foreseeable Deep Uncertainty

• Slowdown in Economy
<GDP growth rate of Korea>
Source: Bank of Korea (2007-2015)
* 2016-2017 estimates: KDI Economic Forecast
0
1
2
3
4
5
6
7
2007 2008 2009 2010 2011 2012 2013 2014 2015 2016* 2017*
Current Status of Korean Economy
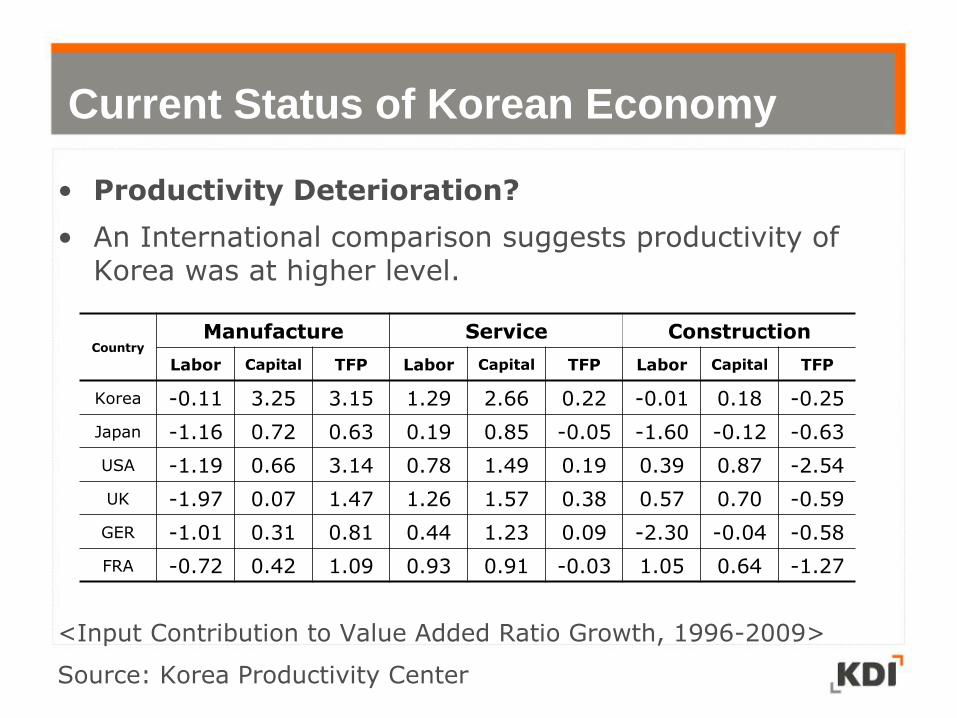
• Productivity Deterioration?
• An International comparison suggests productivity of Korea was at higher level.
<Input Contribution to Value Added Ratio Growth, 1996-2009>
Source: Korea Productivity Center
Country Manufacture Service Construction
Labor Capital TFP Labor Capital TFP Labor Capital TFP
Korea -0.11 3.25 3.15 1.29 2.66 0.22 -0.01 0.18 -0.25
Japan -1.16 0.72 0.63 0.19 0.85 -0.05 -1.60 -0.12 -0.63
USA -1.19 0.66 3.14 0.78 1.49 0.19 0.39 0.87 -2.54
UK -1.97 0.07 1.47 1.26 1.57 0.38 0.57 0.70 -0.59
GER -1.01 0.31 0.81 0.44 1.23 0.09 -2.30 -0.04 -0.58
FRA -0.72 0.42 1.09 0.93 0.91 -0.03 1.05 0.64 -1.27
Current Status of Korean Economy
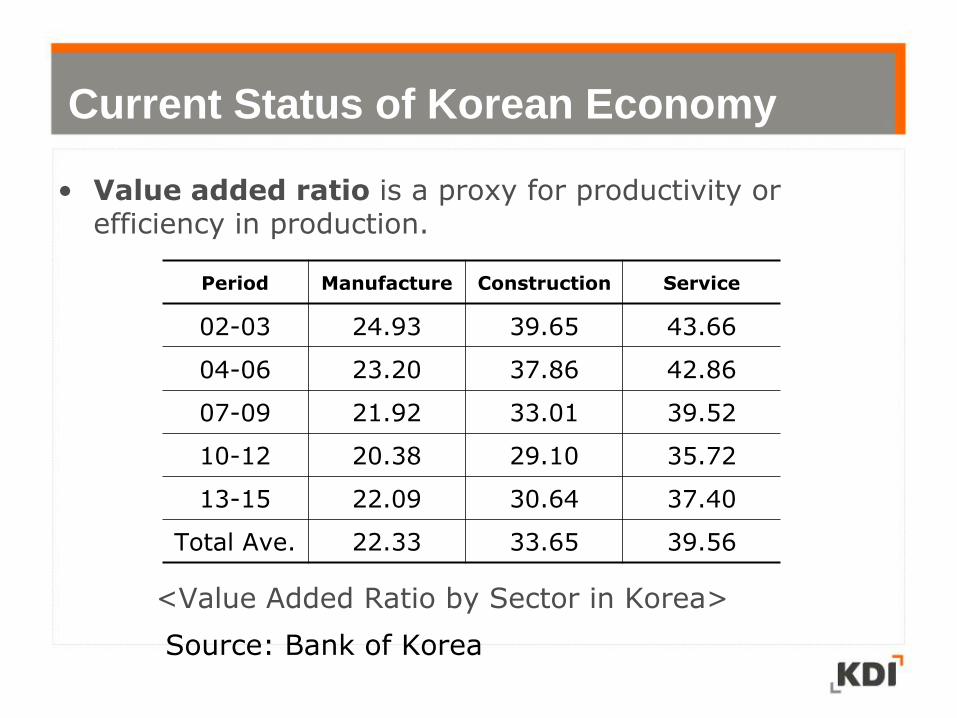
• Value added ratio is a proxy for productivity or efficiency in production.
<Value Added Ratio by Sector in Korea>
Source: Bank of Korea
Period Manufacture Construction Service
02-03 24.93 39.65 43.66
04-06 23.20 37.86 42.86
07-09 21.92 33.01 39.52
10-12 20.38 29.10 35.72
13-15 22.09 30.64 37.40
Total Ave. 22.33 33.65 39.56
Current Status of Korean Economy
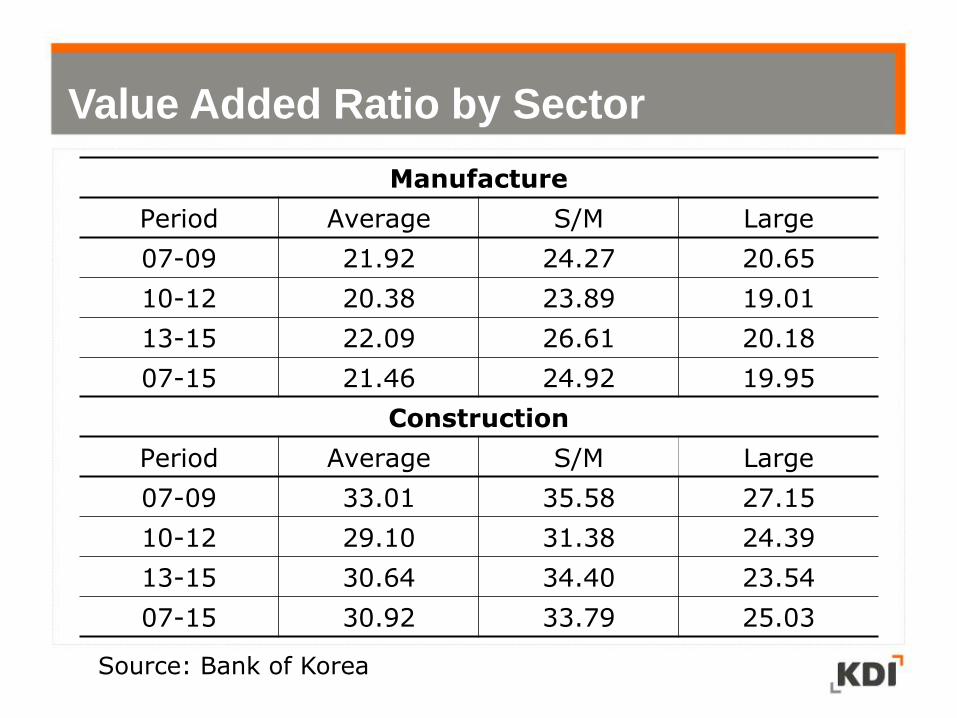
Value Added Ratio by Sector
Manufacture
Period Average S/M Large
07-09 21.92 24.27 20.65
10-12 20.38 23.89 19.01
13-15 22.09 26.61 20.18
07-15 21.46 24.92 19.95
Construction
Period Average S/M Large
07-09 33.01 35.58 27.15
10-12 29.10 31.38 24.39
13-15 30.64 34.40 23.54
07-15 30.92 33.79 25.03
Source: Bank of Korea

Concentrated or Dominated Economy
• Large companies in Manufacture sector takes 72% of sales volume and 61% of value added in 2014.
• Large companies in Construction sector takes 47% of sales volume but 28% of value added in 2014.
<Average Sales Volume and Value Added> Unit: 10 Billion KRW (approx. 10 Million USD)
Average Large (A) S/M (B) B/A
MF Sales 33.63 0.43 1.28%
VA 4.23 0.09 2.13%
Con Sales 7.44 0.22 2.96%
VA 0.93 0.06 6.45%
Source: Bank of Korea, Author’s calculation

Issues around Productivity in Korea
• Economic Slowdown
• Productivity Deterioration?
• Foreseeable Deep Uncertainty
Population Aging
Climate Change
Fourth Industrial Revolution

2 Various Aspects of Productivity
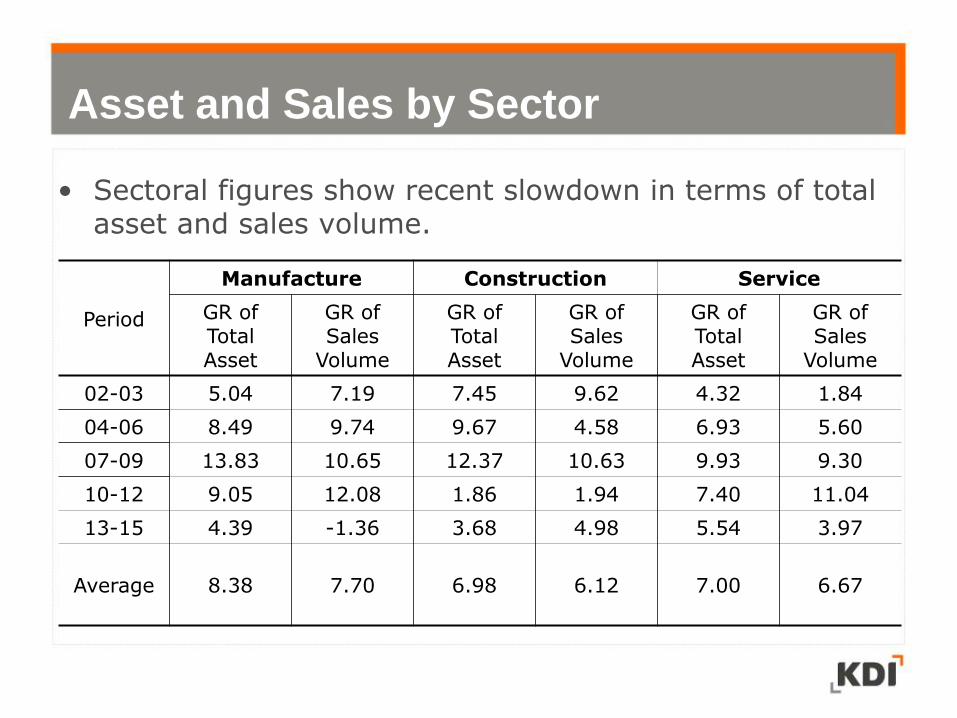
Asset and Sales by Sector
• Sectoral figures show recent slowdown in terms of total asset and sales volume.
Period
Manufacture Construction Service
GR of Total Asset
GR of Sales
Volume
GR of Total Asset
GR of Sales
Volume
GR of Total Asset
GR of Sales
Volume
02-03 5.04 7.19 7.45 9.62 4.32 1.84
04-06 8.49 9.74 9.67 4.58 6.93 5.60
07-09 13.83 10.65 12.37 10.63 9.93 9.30
10-12 9.05 12.08 1.86 1.94 7.40 11.04
13-15 4.39 -1.36 3.68 4.98 5.54 3.97
Average
8.38 7.70 6.98 6.12 7.00 6.67
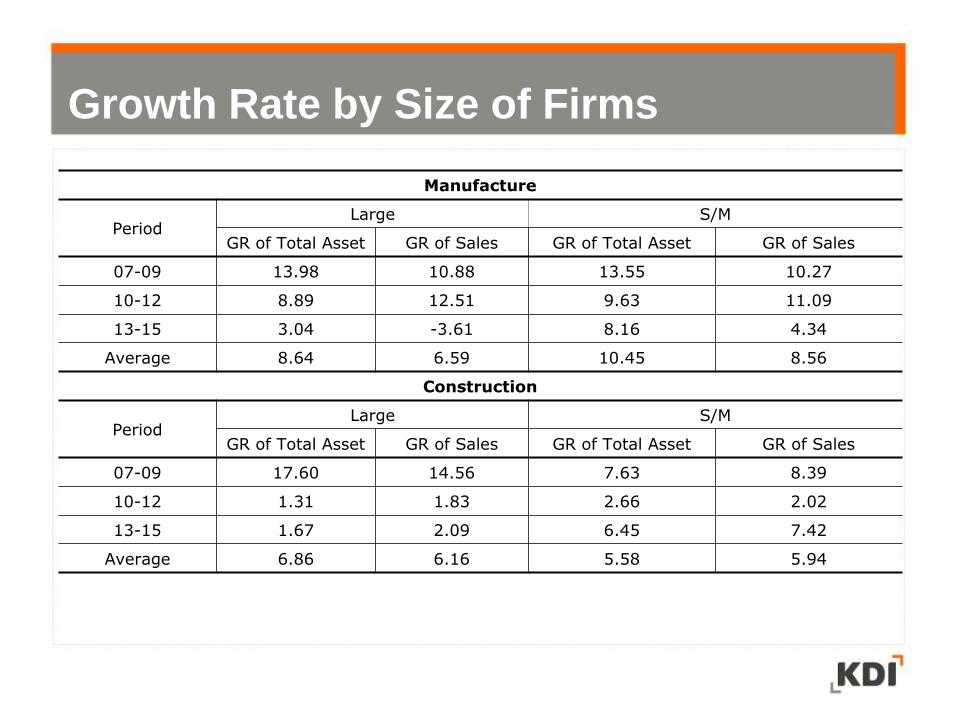
Growth Rate by Size of Firms
Manufacture
Period Large S/M
GR of Total Asset GR of Sales GR of Total Asset GR of Sales
07-09 13.98 10.88 13.55 10.27
10-12 8.89 12.51 9.63 11.09
13-15 3.04 -3.61 8.16 4.34
Average 8.64 6.59 10.45 8.56
Construction
Period Large S/M
GR of Total Asset GR of Sales GR of Total Asset GR of Sales
07-09 17.60 14.56 7.63 8.39
10-12 1.31 1.83 2.66 2.02
13-15 1.67 2.09 6.45 7.42
Average 6.86 6.16 5.58 5.94
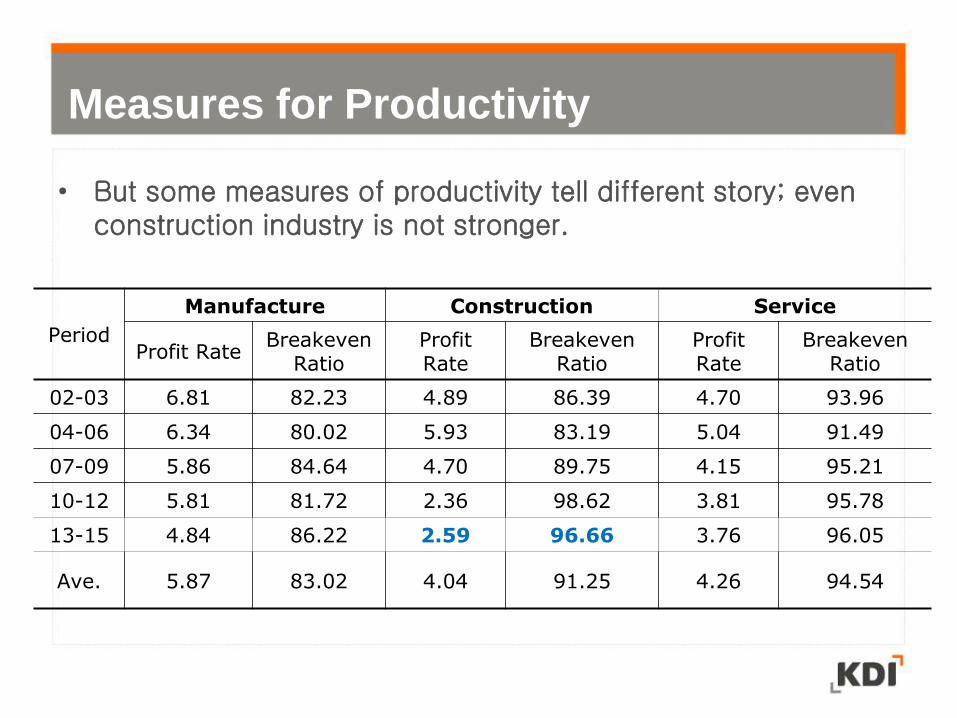
Measures for Productivity
• But some measures of productivity tell different story; even construction industry is not stronger.
Period
Manufacture Construction Service
Profit Rate Breakeven
Ratio Profit Rate
Breakeven Ratio
Profit Rate
Breakeven Ratio
02-03 6.81 82.23 4.89 86.39 4.70 93.96
04-06 6.34 80.02 5.93 83.19 5.04 91.49
07-09 5.86 84.64 4.70 89.75 4.15 95.21
10-12 5.81 81.72 2.36 98.62 3.81 95.78
13-15 4.84 86.22 2.59 96.66 3.76 96.05
Ave. 5.87 83.02 4.04 91.25 4.26 94.54
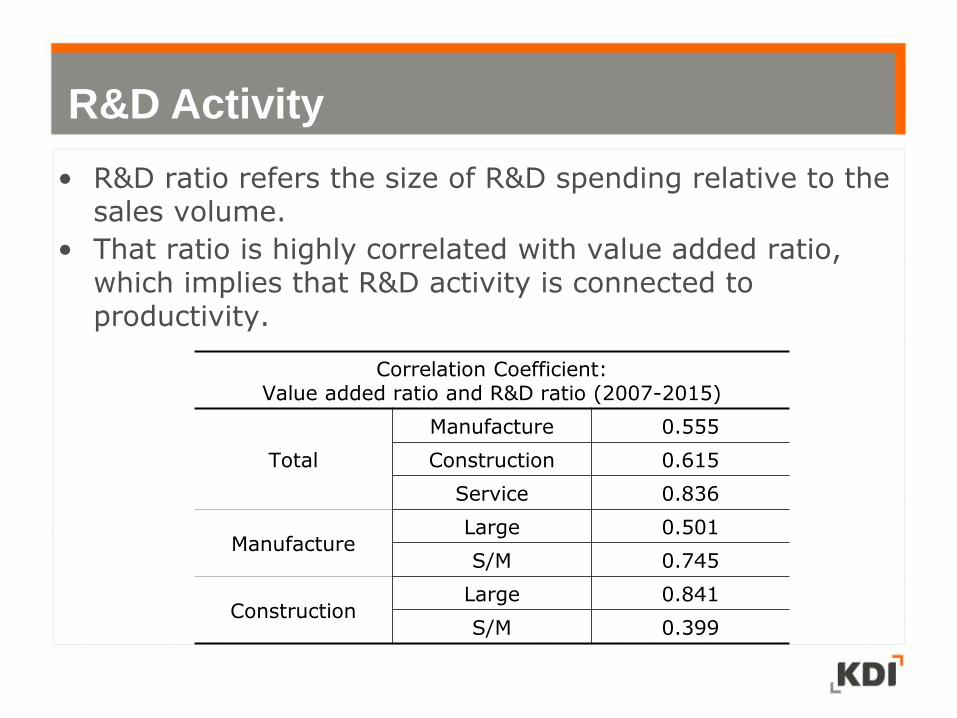
R&D Activity
• R&D ratio refers the size of R&D spending relative to the sales volume.
• That ratio is highly correlated with value added ratio, which implies that R&D activity is connected to productivity.
Correlation Coefficient:
Value added ratio and R&D ratio (2007-2015)
Total
Manufacture 0.555
Construction 0.615
Service 0.836
Manufacture Large 0.501
S/M 0.745
Construction Large 0.841
S/M 0.399

Possible scenario
• Impact of R&D activity?
Manufacture
Period Large S/M
VA ratio R&D ratio VA ratio R&D ratio
07-09 20.65 2.02 24.27 1.14
10-12 19.01 1.84 23.89 1.10
13-15 20.18 2.35 26.61 1.24
Average 19.95 2.07 24.92 1.16
Construction
Period Large S/M
VA ratio R&D ratio VA ratio R&D ratio
07-09 27.15 0.50 35.58 0.37
10-12 24.39 0.37 31.38 0.32
13-15 23.54 0.36 34.40 0.38
Average 25.03 0.41 33.79 0.36

Labor Productivity
• Labor productivity can be measured by product increment by one unit of labor.
2010 2011 2012 2013 2014 2015
Manufacture 100 101.4 98.9 97 94.5 92.5
Construction 100 87.1 81.4 92.8 88.4 87.3
Service 100 99.5 97.3 97 95.6 96.4

3 Discussion
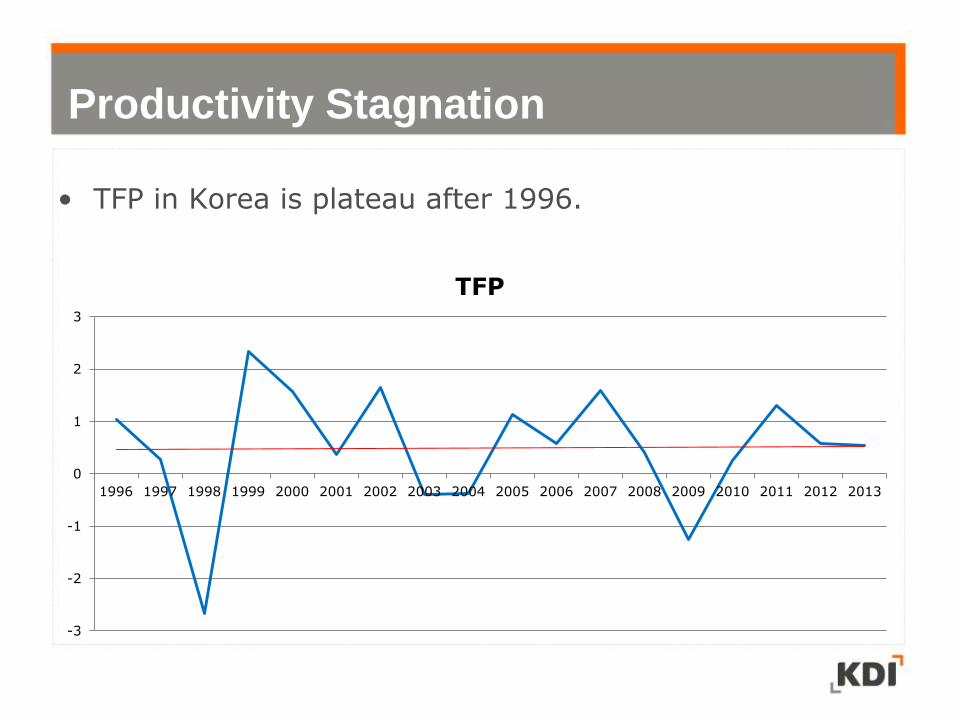
Productivity Stagnation
• TFP in Korea is plateau after 1996.
-3
-2
-1
0
1
2
3
1996 1997 1998 1999 2000 2001 2002 2003 2004 2005 2006 2007 2008 2009 2010 2011 2012 2013
TFP
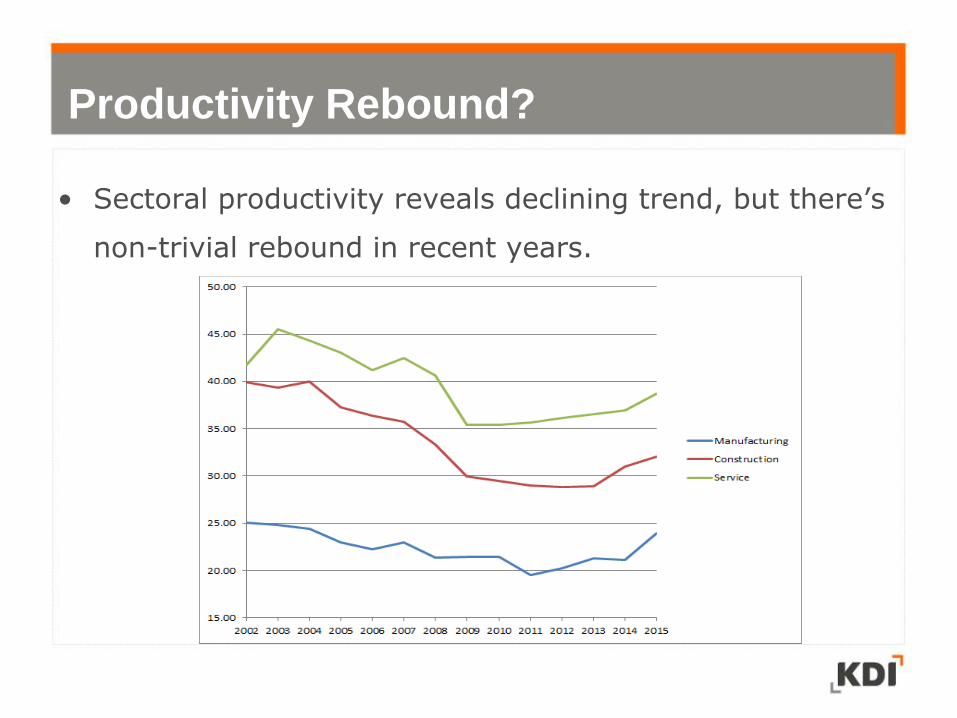
Productivity Rebound?
• Sectoral productivity reveals declining trend, but there’s
non-trivial rebound in recent years.
Enhancing Productivity : Construction
• Construction industry in Korea contributed employment
and GDP growth in significant way.
• However, expected downturn in housing supply along
with low labor productivity suggests need for change,
such as investment and restructuring.

• Equipment investment in Construction industry is in low level;
the equipment investment to GDP is lower than other
countries.
• More investment can make industry less labor-intensive, and
more productive.
Korea USA GER FRA ITA OECD
Equipment Investment in Construction
0.10 0.21 0.17 0.20 0.21 0.25
Enhancing Productivity : Construction
• TFP can be enhanced via resource redistribution.
(“Misallocation and Manufacturing TFP in Korea,
Oh, KDI, 2015)
• “The distribution of firm productivity within the same
industry is known to be highly dispersed; thus, resource
redistribution toward more productive cases generates
higher TFP growth throughout the economy, even if the
productivity level of each firm does not change.”
Enhancing Productivity : Manufacture

• Overall allocative efficiency in Korea declined from 1990 to
2012.
– Allocative efficiency in Korea is lower than that in USA.
• The potential loss from worsening allocative efficiency was
estimated about 0.6% points in TFP annually.
• The result shows that the larger the firm, the less the firm
produces compared to its efficient level.
• Many small-sized establishments are uncompetitive in Korean
manufacture sector; subsidies to unproductive small-sized
firms are heavily implemented.
Enhancing Productivity (Oh, 2015)