(252623346) Understanding Bubble Hydrodynamics in Bubble Columns
Upload
truongquynhCategory
view
219download
0
4TH ASME_JSME Joint Fluids Engineering Conference
INCEPTION AND DYNAMICS OF TRAVELING-BUBBLE-TYPE CAVITATION IN A VENTURI
Keiichi Sato, Kouji Hachino and Yasuhiro Saito
Department of Mechanical Engineering Kanazawa Institute of Technology
Ishikawa, Japan
Proceedings of ASME FEDSM’03 4th ASME_JSME Joint Fluids Engineering Conference
Honolulu, Hawaii, USA, July 6-10, 2003
F E DSM200 3-4 5322
ABSTRACT The inception of cavitation is basically caused by a bubble
nucleus which flows into the low pressure region in the liquid flow. Therefore the phenomenon is dependent on the tensile strength or the nuclei concentration of tested water. The cavitation susceptibility of water which controls the cavitation inception point has been made clear though various methods were proposed to measure the nuclei concentration. Cavitation susceptibility meter using a small venturi tube is also one of the methods to measure the nuclei concentration. It is pointed out that this method can be directly related to active nuclei for cavitation inception and gives a useful and simple device to estimate the tensile strength of water. In the present paper, to establish a measurement method of cavitation susceptibility using a venturi tube, the following points are investigated, such as; the relation between the occurrence, count rate of cavitation bubbles and cavitation number, the measurement of positions and local pressure of bubble occurrence and the high-speed video observation of bubble aspects from inception to collapse. As the result, the main points obtained are as follows. A traveling-bubble cavitation appears dominantly in a nozzle-type venturi tube with little possibility of flow separation. Cavitation aspects and the bubble occurrence count rate change with cavitation number and water quality (dissolved gas content). Unstable sheet cavitation can be also observed near the venturi diffuser and at relatively low cavitation number. The various behaviors of traveling bubble cavitation in a venturi are observed from inception to collapse using a high-speed video camera system.
Keywords: Cavitation Inception, Cavitation Susceptibility, Bubble Dynamics, High-Speed-Video, Venturi Flow
INTRODUCTION It is widely recognized that cavitation inception is strongly
subject to the water quality, especially nuclei concentration in
water. Occurrence of cavitation bubbles initiates from weak points in water, namely bubble nuclei. Large tensile strength can be measured in water with a small number of nuclei [e.g. 1-3]. The reliable method to measure cavitation nuclei, however, is still in the development stage though some methods have been proposed from optical and acoustic viewpoints [4,5]. For instance, the holography method is intricate, expensive and limited to the measurement for relatively large nuclei though it is known as a reliable method. In addition, unfortunately, it should be noted that it is quite difficult and inventive at the present stage of knowledge to give a direct relationship between the nuclei distribution of water and the inception of cavitation even if the nuclei were measured.
Under these situations, on the other hand, there is a cavitation susceptibility meter (CSM) [6-9] using a venturi tube with small diameter as one of useful and simple methods to measure active nuclei in water. The CSM method is very attractive because of its simplicity and usefulness though the measurement range is limited to low concentration in bubble nuclei distribution. It is, moreover, pointed out that a venturi device without flow separation can give a useful way to measure the general characteristics on the tensile strength of water because it has clear relation with active nuclei which are directly connected with cavitation inception.
In the present study, the following matters are investigated to establish a measurement method of water strength [10] of tested water by using a venturi tube and a high-speed video camera; (1) the relation between bubble occurrence count rate and cavitation number, (2) the variation of cavitation bubble type with cavitation number, (3) the specification of bubble occurrence point and measurement of local pressure at the occurrence point, and (4) the observation of bubble aspects from inception to collapse.
NOMENCLATURE D:Pipe diameter upstream of venturi
1 Copyright © 2003 by ASME

d:Diameter of venturi throat Fs:Framing rate of high-speed video camera Nc:Occurrence count rate of cavitation bubbles P:Static pressure upstream of venturi Pt:Average static pressure of venturi throat Pv:Saturated vapor pressure of water Px:Local fluid pressure Q:Flow rate of water Re:Reynolds number Tw:Temperature of water U:Average velocity upstream of venturi Ut:Average velocity of venturi throat β:Dissolved oxygen content of water ν:Kinetic viscosity of water ρ:Density of water σ:Cavitation number σL:Limited cavitation number σx:Local cavitation number
EXPERIMENTAL APPARATUS AND PROCEDURE The experiment was conducted using a closed-type
cavitation tunnel [11] with a nozzle-type venturi tube (upstream diameter 40mm, throat diameter 10mm) as shown in Fig. 1. Pressure taps of diameter 0.5 mm were placed upstream and downstream of the venturi to measure the reference pressure by manometers.
Observation of bubble behaviors was made using a measurement and observation system as shown in Fig.2. In the present experiment, two high-speed-video camera systems were used as follows.
1) Video camera A; KODAK EKTAPRO HS Motion Analyzer
Model-4540, the maximum framing rate: 40,500 fps 2) Video camera B; Super-high-speed video camera developed
by Kinki Univ. and Shimadzu Corp. [12], the maximum framing rate: 1,000,000 fps
Video camera A was used for the whole aspect from the
inception to the collapse of cavitation bubbles and the specification of the bubble occurrence position. In the latter case, simultaneous measurements were done by using two video cameras connected by optical fiber system in order to observe at the same time from two directions, so that an occurrence position of cavitation inception was decided. Video camera B was used for the observation of the collapsing aspect of cavitation bubble because of its high-speed performance. In either case, an accelerometer of piezo-electric-type (TEAC 501FS/FB) was installed on an outer wall of the test section to measure the impact generated by cavitation collapse. The installation position was 5 mm downstream of venturi throat. The impact measured during the experiment was used for the operation of the high-speed-video camera system as a trigger signal. Using the memory function of this high-speed-video system we could observe the cavitation bubble aspect from the inception to the collapse period.
The impulsive pulses generated from the bubble collapse were recorded with a high-speed data collecting system
(KEYENCE NR-350) and wave-data-analysis software (KEYENCE MEGA VIEW). In addition, the number of cavitation events was counted by a microphone placed near the test section and the experimenters through the collapsing sound of cavitation bubbles (within an audible frequency range).
Cavitation experiments were made by increasing the pump speed under an atmospheric pressure condition or by reducing the static pressure in the cavitation tunnel. The atmospheric pressure condition was used for cavitation inception experiments. The tunnel, at first, was released to the atmospheric condition and the flow rate Q was set up to be from 1.18×10⁻³ to 1.86×10⁻³ m3/s. Next, the flow was re-circulated in the tunnel to make stable for a sufficiently long period. After that, the static pressures upstream and downstream of the test section were measured to start the cavitation measurement. In the case of the pressure reduction test, on the other hand, the flow rate Q was kept constant in the value of 1.00×10⁻³ m3/s (U=0.796 m/s) using the electro-magnetic flow meter installed upstream of the test section. The flow was re-circulated in the tunnel to make stable. The measurement was started after the static pressure of the tunnel was set up by reducing the static pressure in fully slow speed. Dissolved oxygen content of water β, an important factor in cavitation phenomena was measured before and after an experiment by an oxygen content meter (HORIBA OM-14).
The Reynolds number, cavitation number and local cavitation number are defined respectively as follows,
Re = U・d/ν ----------------- (1) σ = 2(P - Pv)/ ρ Ut
2 ----------------- (2) σx = 2(Px - Pv)/ ρ Ut
2 ----------------- (3)
Flow direction
Fig. 1 Test section
Fig. 2 Measurement and observation system
Unit:mm
2 Copyright © 2003 by ASME
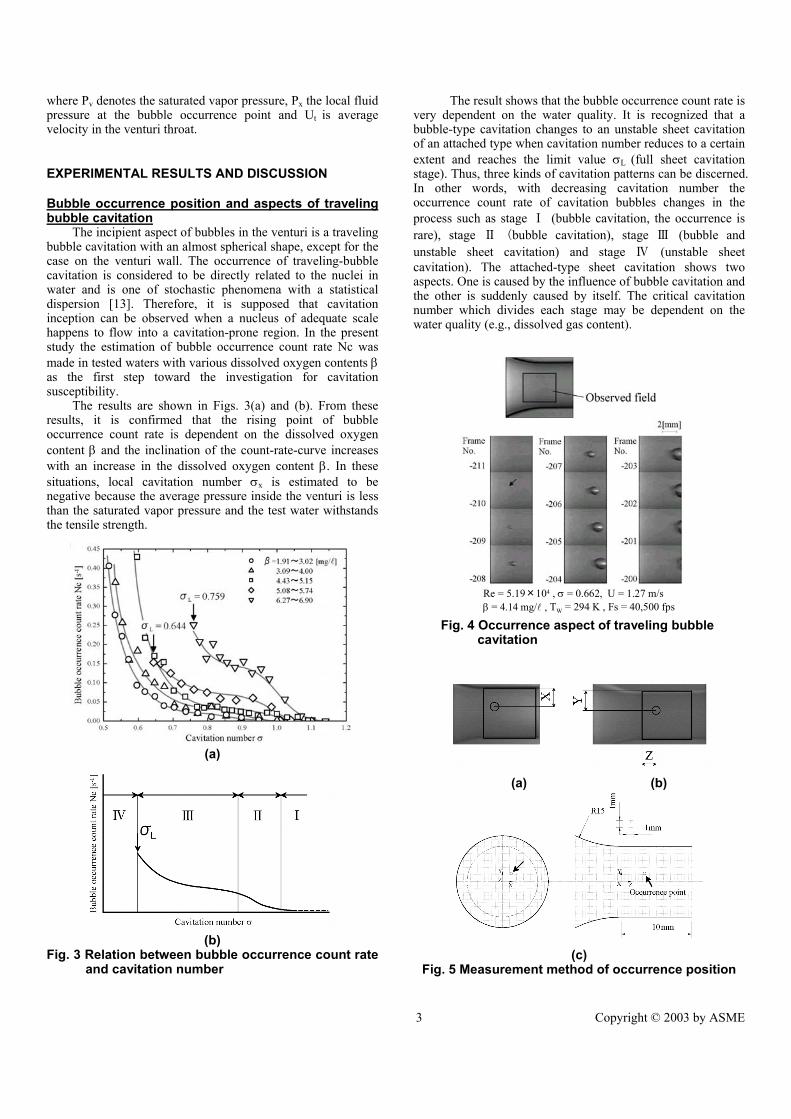
where Pv denotes the saturated vapor pressure, Px the local fluid pressure at the bubble occurrence point and Ut is average velocity in the venturi throat.
EXPERIMENTAL RESULTS AND DISCUSSION
Bubble occurrence position and aspects of traveling bubble cavitation
The incipient aspect of bubbles in the venturi is a traveling bubble cavitation with an almost spherical shape, except for the case on the venturi wall. The occurrence of traveling-bubble cavitation is considered to be directly related to the nuclei in water and is one of stochastic phenomena with a statistical dispersion [13]. Therefore, it is supposed that cavitation inception can be observed when a nucleus of adequate scale happens to flow into a cavitation-prone region. In the present study the estimation of bubble occurrence count rate Nc was made in tested waters with various dissolved oxygen contents β as the first step toward the investigation for cavitation susceptibility.
The results are shown in Figs. 3(a) and (b). From these results, it is confirmed that the rising point of bubble occurrence count rate is dependent on the dissolved oxygen content β and the inclination of the count-rate-curve increases with an increase in the dissolved oxygen content β. In these situations, local cavitation number σx is estimated to be negative because the average pressure inside the venturi is less than the saturated vapor pressure and the test water withstands the tensile strength.
(a)
(b) Fig. 3 Relation between bubble occurrence count rate
and cavitation number
Re = 5.19×10⁴ , σ = 0.662, U = 1.27 m/s β = 4.14 mg/l , TW = 294 K , Fs = 40,500 fps
The result shows that the bubble occurrence count rate is very dependent on the water quality. It is recognized that a bubble-type cavitation changes to an unstable sheet cavitation of an attached type when cavitation number reduces to a certain extent and reaches the limit value σL (full sheet cavitation stage). Thus, three kinds of cavitation patterns can be discerned. In other words, with decreasing cavitation number the occurrence count rate of cavitation bubbles changes in the process such as stage Ⅰ (bubble cavitation, the occurrence is rare), stage Ⅱ (bubble cavitation), stage Ⅲ (bubble and unstable sheet cavitation) and stage Ⅳ (unstable sheet cavitation). The attached-type sheet cavitation shows two aspects. One is caused by the influence of bubble cavitation and the other is suddenly caused by itself. The critical cavitation number which divides each stage may be dependent on the water quality (e.g., dissolved gas content).
Fig. 4 Occurrence aspect of traveling bubble
cavitation
(a) (b)
(c) Fig. 5 Measurement method of occurrence position
3 Copyright © 2003 by ASME

○ Re = 4.00×10⁴ , σ = 0.978, TW = 292 K△ 4.00×10⁴ , 0.984, 293 □ 4.45×10⁴ , 0.973, 297 Q = 0.00128 [m3/s] ( U = 1.02 [m/s] )
○ Re = 5.77×10⁴ , σ = 0.597, TW = 296 K△ 5.64×10⁴ , 0.598, 295□ 5.51×10⁴ , 0.596, 294 Q = 0.00170 [m3/s] ( U = 1.35 [m/s] )
Figure 4 shows the incipient aspect of typical cavitation bubble. It is found that the bubble appears to be spherical though the picture on the left end of the bubble is out of focus because the growth speed of the bubble is very fast. The inception, in this case, is judged around Frame No.-210. Here, from these pictures, the average growth speed of bubble can be estimated to be about 9 m/s. The bubble moving around the middle section of venturi throat shows a spherical shape, but near the venturi wall it shows a non-spherical and cap-like shape because of the wall effect.
Occurrence position and pressure for traveling bubble cavitation
The occurrence position of traveling-bubble cavitation must be examined to evaluate the tensile strength in cavitation occurrence point. Therefore two-video-cameras system with optical fibers was used to specify the occurrence position.
As shown in Fig. 5, the horizontal coordinate X was determined by the video image from the lateral side (Fig. 5a). The vertical and stream-wise coordinates Y and Z were from the down-side image (Fig. 5b). The occurrence position is shown like Fig. 5(c) by each measured coordinate. The origin of the coordinate axes was chosen at the center of the leading
(a)
(b) Fig. 6 Bubble occurrence position
○ incipient point ( from stageⅠtoⅡ) △ sheet and bubble cavitation ( fromⅡtoⅢ)□ sheet cavitation ( fromⅢto Ⅳ)
part of the venturi throat. In this research, the incipient video frame was chosen at the time when a bubble occurrence was confirmed in both images from the lateral side and the down side. The occurrence position on video images was modified through the consideration of optical refraction effects of the test section material and geometry.
A measurement result about the occurrence positions in two different cavitation numbers is shown in Figs. 6(a) and (b). Figure 6(a) shows the case at higher cavitation number and Fig. 6(b) shows the case at lower cavitation number. For higher cavitation number, the occurrence positions tend to be around the wall surface. For lower cavitation number, on the other hand, the positions tend to be distributed throughout the radial direction of the venturi throat. These results correspond to the simple fact that the static pressure becomes lower in wider flow field by reducing cavitation number. The variation of the occurrence positions with dissolved gas content was not clearly recognized within the scope of the experimental range though further examination will be necessary. Some bubbles appear on the venturi wall though many bubbles occur in the flow. In Fig.6, it should be noted that the plot of wall-attached bubble is separated from the wall by the bubble radius because the center of bubble is positioned. Fig. 7 Relation between local cavitation number and
bubble occurrence count rate around β = 6 mg/l
Fig. 8 Local cavitation number against dissolved
oxygen content of water
4 Copyright © 2003 by ASME

Re = 3.15×10⁴ , σ = 0.980, U = 0.796 m/s , β = 3.08 mg/l, TW = 293 K , Fs = 27,000 fps
Re = 3.17×10⁴ , σ = 1.04, U = 0.796 m/s , β = 3.34 mg/l, TW = 293 K , Fs = 27,000 fps
The local pressure at the bubble occurrence point was calculated by numerical simulation, based on the occurrence position measured by the video observation. The computation was made using the commercial code (Cybernet Systems Co. Ltd., ANSYS/FLOTRAN 5.7), where k-εmodel was used as turbulent model and the number of computational meshes is 31,200. The pressure coefficient at typical upstream flow velocity (U=0.971m/s) was approximately used in order to estimate the local pressure. Figure 7 shows, as an example, the relation of local cavitation number σx with bubble occurrence count rate Nc near dissolved oxygen content β = 6 mg/l. The error bar shows the limits between the maximum value and the minimum value of local cavitation number σx. From the result it is found that the limits of the local cavitation number are wider with an increase in bubble occurrence count rate. This tendency means that the local pressure at the bubble occurrence has wider values with decreasing cavitation number because the occurrence points of cavitation bubble spread over the throat section. In Fig. 7, the approximate value obtained from Bernoulli's equation is also plotted as a dotted line under the assumption of the potential-core flow in the flow of the venturi. This result shows that the value from Bernoulli�s equation gives a little higher pressure than the computed value in which local pressure is considered.
The count-rate-curve Nc-σ is classified in four stages by occurrence pattern of cavitation as shown in Fig. 3. Figure 8 shows critical local cavitation number σx against dissolved oxygen content β. Εach critical local cavitation number corresponds to the transition point such as the incipient point of bubble cavitation, the intermittent occurrence point of attached cavitation and the steady occurrence point of attached cavitation. In the present study, the incipient point was defined
(a) Near center of venturi
(b) Near wall of venturi Fig. 9 Life history of traveling bubble cavitation
-30
-25
FrameNo.
-50
-45
-35
-40
1
6
FrameNo.
-20
-15
-5
-10
Re = 5.33×10⁴ , σ = 0.611, U = 1.34 m/s β = 2.91 mg/l , TW = 293 K , Fs = 18,000 fps
10[mm]
Re = 5.33×10⁴ , σ = 0.611, U = 1.34 m/s β = 3.23 mg/l, TW = 293 K , Fs = 18,000 fps
FrameNo.
-75
-70
-60
-50
-30
-65
-40
FrameNo.
-20
-10
11
21
41
1
31
10[mm]
FrameNo.
-45
-40
-30
-35
-20
-25
FrameNo.
-15
-10
1
-5
11
6
Re = 5.33×10⁴ , σ= 0.611, U = 1.34 m/sβ = 3.13 mg/l, TW = 293 K , Fs = 18,000 fps
10[mm]
as the bubble occurrence count rate Nc more than 0.01 s-1. From Fig. 8, it is found that the critical local cavitation number of each stage decreases with lower dissolved oxygen content though it keeps almost constant for higher content (in this case,
(a) Traveling bubble cavitation
(b) Transition-type cavitation
(c) Sheet cavitation Fig. 10 Various types of cavitation in venturi
5 Copyright © 2003 by ASME
Re = 3.05×10⁴ , σ = 0.975, U = 0.796 m/s , β = 2.27 mg/l, TW = 292 K , Fs = 100,000 fps
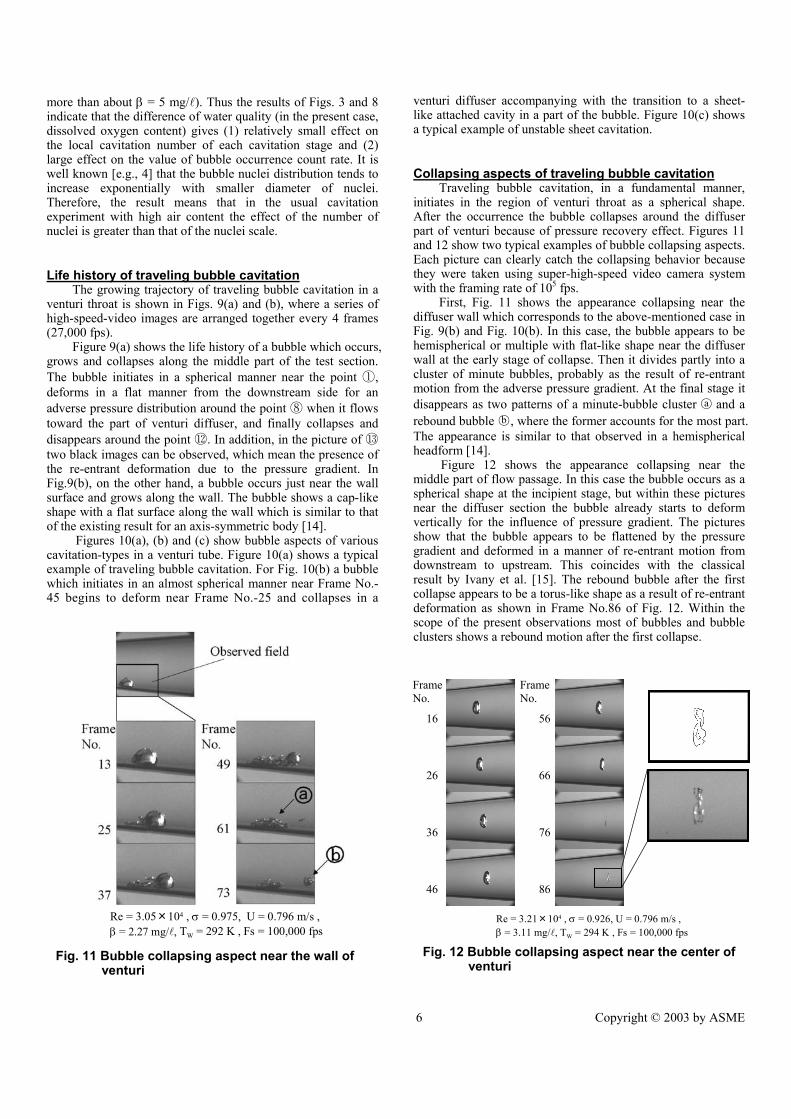
more than about β = 5 mg/l). Thus the results of Figs. 3 and 8 indicate that the difference of water quality (in the present case, dissolved oxygen content) gives (1) relatively small effect on the local cavitation number of each cavitation stage and (2) large effect on the value of bubble occurrence count rate. It is well known [e.g., 4] that the bubble nuclei distribution tends to increase exponentially with smaller diameter of nuclei. Therefore, the result means that in the usual cavitation experiment with high air content the effect of the number of nuclei is greater than that of the nuclei scale.
Life history of traveling bubble cavitation The growing trajectory of traveling bubble cavitation in a
venturi throat is shown in Figs. 9(a) and (b), where a series of high-speed-video images are arranged together every 4 frames (27,000 fps).
Figure 9(a) shows the life history of a bubble which occurs, grows and collapses along the middle part of the test section. The bubble initiates in a spherical manner near the point ①, deforms in a flat manner from the downstream side for an adverse pressure distribution around the point ⑧ when it flows toward the part of venturi diffuser, and finally collapses and disappears around the point ⑫. In addition, in the picture of ⑬ two black images can be observed, which mean the presence of the re-entrant deformation due to the pressure gradient. In Fig.9(b), on the other hand, a bubble occurs just near the wall surface and grows along the wall. The bubble shows a cap-like shape with a flat surface along the wall which is similar to that of the existing result for an axis-symmetric body [14].
Figures 10(a), (b) and (c) show bubble aspects of various cavitation-types in a venturi tube. Figure 10(a) shows a typical example of traveling bubble cavitation. For Fig. 10(b) a bubble which initiates in an almost spherical manner near Frame No.-45 begins to deform near Frame No.-25 and collapses in a
Fig. 11 Bubble collapsing aspect near the wall of venturi
Re = 3.21×10⁴ , σ = 0.926, U = 0.796 m/s ,β = 3.11 mg/l, TW = 294 K , Fs = 100,000 fps
16
26
36
FrameNo.
46
56
66
FrameNo.
76
86
venturi diffuser accompanying with the transition to a sheet-like attached cavity in a part of the bubble. Figure 10(c) shows a typical example of unstable sheet cavitation.
Collapsing aspects of traveling bubble cavitation Traveling bubble cavitation, in a fundamental manner,
initiates in the region of venturi throat as a spherical shape. After the occurrence the bubble collapses around the diffuser part of venturi because of pressure recovery effect. Figures 11 and 12 show two typical examples of bubble collapsing aspects. Each picture can clearly catch the collapsing behavior because they were taken using super-high-speed video camera system with the framing rate of 105 fps.
First, Fig. 11 shows the appearance collapsing near the diffuser wall which corresponds to the above-mentioned case in Fig. 9(b) and Fig. 10(b). In this case, the bubble appears to be hemispherical or multiple with flat-like shape near the diffuser wall at the early stage of collapse. Then it divides partly into a cluster of minute bubbles, probably as the result of re-entrant motion from the adverse pressure gradient. At the final stage it disappears as two patterns of a minute-bubble cluster ○a and a rebound bubble ○b , where the former accounts for the most part. The appearance is similar to that observed in a hemispherical headform [14].
Figure 12 shows the appearance collapsing near the middle part of flow passage. In this case the bubble occurs as a spherical shape at the incipient stage, but within these pictures near the diffuser section the bubble already starts to deform vertically for the influence of pressure gradient. The pictures show that the bubble appears to be flattened by the pressure gradient and deformed in a manner of re-entrant motion from downstream to upstream. This coincides with the classical result by Ivany et al. [15]. The rebound bubble after the first collapse appears to be a torus-like shape as a result of re-entrant deformation as shown in Frame No.86 of Fig. 12. Within the scope of the present observations most of bubbles and bubble clusters shows a rebound motion after the first collapse.
Fig. 12 Bubble collapsing aspect near the center of venturi
6 Copyright © 2003 by ASME
CONCLUDING REMARKS Experimental investigation was conducted using a nozzle-
type venturi and a high-speed video camera system to make clear the relation of water tensile strength with cavitation susceptibility as well as the mechanism from inception to collapse for a traveling bubble cavitation. Main results are as follows.
(1) A traveling-bubble cavitation which can be directly related to cavitation nuclei appears dominantly in a nozzle-type venturi tube with little possibility of flow separation. In this kind of venturi tube, unstable sheet cavitation also occurs in the stage of relatively low cavitation number.
(2) The incipient characteristics of traveling bubble are much dependent on the water quality such as dissolved gas (oxygen) content and are connected with the tensile strength in water. The dissolved gas content has large effect on the bubble occurrence count rate.
(3) For higher cavitation number, the occurrence positions tend to be around the wall surface. For lower cavitation number, on the other hand, the positions tend to be distributed throughout the cross section of venturi throat.
(4) With decreasing cavitation number the occurrence count rate of cavitation bubbles changes in the process such as stage Ⅰ (rare bubble cavitation), stage Ⅱ (bubble cavitation), stage Ⅲ (bubble and unstable sheet cavitation) and stage Ⅳ (unstable sheet cavitation). The traveling bubble cavitation occurs mainly in the region of relatively high cavitation number, namely in the stages Ⅰ and Ⅱ.
(5) The detailed process of a traveling-bubble cavitation from occurrence to collapse was videographically shown in a venturi with a super-high-speed video camera. Especially, the rapid deformation at bubble collapse was clearly captured.
ACKNOWLEDGMENTS The authors would like to thank Messrs. H. Nakao, K.
Nagata, D. Murata and T. Yasuda in Department of Mechanical Engineering, Kanazawa Institute of Technology for their earnest assistant on the experimental work. This study was supported by Grant-in-Aid for the Scientific Research of the Ministry of Education, Science and Culture of Japan.
REFERENCES [1] Berthelot, M., 1850, Sur Quelques Phenomemes de Dilation
Force de Liquids, Ann de Chimie et de Physique, 30, pp. 232-237; from Trevena [2].
[2] Trevena, D. H., 1987, Cavitation & Tension in Liquids, Adam Hilger.
[3] Knapp, R. T., 1958, Cavitation and Nuclei, Trans. ASME, 80, pp. 1315-1324.
[4] Billet, M.L., 1986, Cavitation Nuclei Measurements With an Optical System, Trans. ASME, J. Fluids Eng., 108, pp. 366-372.
[5] Takagawa, S., 1989, A New Acoustic Attenuation Method for Profiling of Cavitation Nuclei Distribution, Proc. Int. Symp. on Cavitation Inception, ASME, FED-89, pp. 73-78.
[6] Oldenziel, D. M., 1982, A New Instrument in Cavitation Research: The Cavitation Susceptibility, Trans. ASME, J. Fluid Eng., 104, pp. 136-142.
[7] Chahine, G. L. and Shen, Y. T., 1986, Bubble Dynamics and Cavitation Inception in Cavitation Susceptibility Meters, J. Fluid Eng., 108, pp. 444-452.
[8] d'Agostino, L. and Acosta, A. J., 1991b, A Cavitation Susceptibility Meter With Optical Cavitation Monitoring � Part Two: Experimental Apparatus and Results, Trans. ASME, J. Fluids Eng., 113, pp. 270-277.
[9] Pham, T. M., Michel, J. M. and Lecoffre, Y., 1993, A new design of the cavitation susceptibility meter: The venturix, Proc. IUTAM Symp., Bubble Dynamics and Interface Phenomena, Birmingham, pp. 277-286.
[10] Arndt, R. E. A. and Keller, A. P., 1992, Water Quality Effects on Cavitation Inception in a Trailing Vortex, Trans. ASME, J. Fluid Eng., 114, pp. 430-438.
[11] Sato, K. and Kakutani, K., 1994, Measurement of Cavitation Inception, JSME Int. J., 37, pp. 306-312.
[12] Etoh, T.G. et al., 2002, A CCD Image Sensor of 1Mframes/s for Continuous Image Capturing of 103 Frames, ISSCC Digest of Technical Paper, pp. 46-47.
[13] Oba, R., Ikohagi, T., Ito, Y., Miyakura, H. and Sato, K., 1986, Stochastic Behavior (Randomness) of Desinent Cavitation, Trans. ASME, J. Fluid Eng., 108, pp. 438-443.
[14] Cessio, S. L. and Brennen, C. E., 1991, Observations of the Dynamics and Acoustics of Traveling Bubble Cavitation, Trans. ASME, J. Fluid Mech., 233, pp. 633-660.
[15] Ivany, R. D., Hammitt, F. G. and Mitchell, T. M., 1966, Cavitation Bubble Collapse Observations in a Venturi, Trans. ASME, J. Basic Eng., 88, pp. 649-657.
7 Copyright © 2003 by ASME